an assessment of san francisco’s vulnerability to … and health understanding the risk: an...
TRANSCRIPT
Climate and HealthUnderstanding the Risk:An Assessment of San Francisco’s Vulnerability to Flooding & Extreme Storms
San Francisco Department of Public HealthCity and County of San FranciscoPopulation Health Division
Draft Report for Public Review November 2015
Prepared by
Matt WolffHealth Systems and Geospatial AnalystEnvironmental Health Branch, Population Health DivisionSan Francisco Department of Public Health Cynthia ComerfordManager of Planning and Fiscal Policy/ Climate and Health Program DirectorEnvironmental Health Branch, Population Health DivisionSan Francisco Department of Public Health Acknowledgments This report was in part made possible through funding from cooperative agreementfrom the Centers for Disease Control and Prevention (CDC). For more information
San Francisco Department of Public HealthPopulation Health Division1390 Market Street, Suite 810San Francisco, CA 94102Program Director: Cynthia [email protected]://www.sfhealthequity.org/elements/climate
Table of Contents
Introduction 5 San Francisco Current Conditions 6 Geography: San Francisco’s Waterfront Sea-Level Precipitation El Niño Built EnvironmentHealth Impacts 14Vulnerable Populations 16Vulnerability Assessment 16 Data Standardization Data AnalysisDiscussion 19Interventions 20 Public Health and Emergency Preparedness Infrastructure ImprovementsConclusion 23
Appendix A i Health Impacts Literature Review Appendix B ix Vulnerable Populations Literature Review
Figure 1. San Francisco’s Planning Neighborhoods 6Figure 2. San Francisco’s Waterfront 7Figure 3. San Francisco’s Natural Watershed 7Figure 4. Co2 Emission Projections 8Figure 5. Sea-Level Rise Projections 8Figure 6. San Francisco Annual Precipitation 9Figure 7. Pineapple Express Circulation 10Figure 8. Flooding During Pineapple Express Circulation 10Figure 9. Flood Inundation Comparison 11Figure 10. Sewer Overflows During Extreme Precipitation Events, 2009-2014 12Figure 11. Sewer Overflows and the Natural Watershed 12Figure 12. Flood Inundation and Extreme Storm Health Pathways 14Figure 13. Flood Vulnerability by Block Group 19Figure 14. Flood Vulnerability by Neighborhood 19Figure 15. Flood Vulnerability and Primary Care Centers 21
Table 1. Extreme Tide Projections 11Table 2. Vulnerable Populations 17Table 3. Vulnerability Indicator Correlation Matrix 18
Table of Figures and Tables
Climate and Health Understanding the Risk: An Assessment of San Francisco’s Vulnerability to Flooding & Extreme Storms 5
San Francisco Department of Public Health
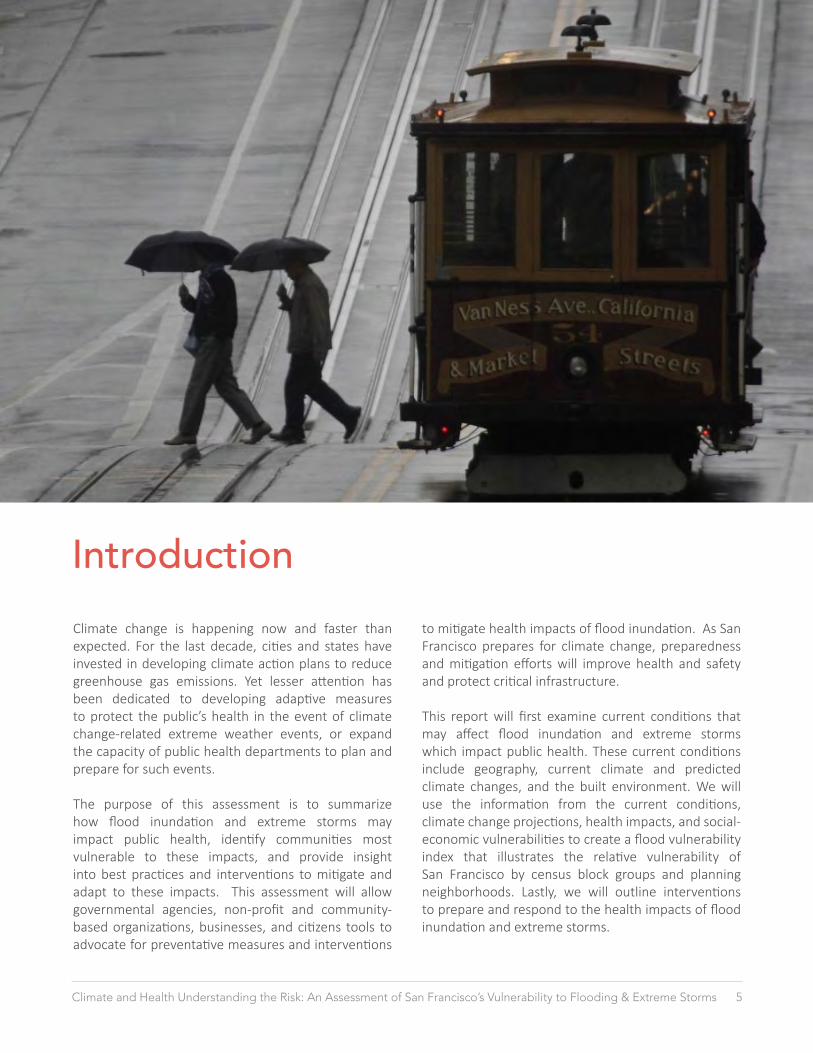
Climate change is happening now and faster than expected. For the last decade, cities and states have invested in developing climate action plans to reduce greenhouse gas emissions. Yet lesser attention has been dedicated to developing adaptive measures to protect the public’s health in the event of climate change-related extreme weather events, or expand the capacity of public health departments to plan and prepare for such events.
The purpose of this assessment is to summarize how flood inundation and extreme storms may impact public health, identify communities most vulnerable to these impacts, and provide insight into best practices and interventions to mitigate and adapt to these impacts. This assessment will allow governmental agencies, non-profit and community-based organizations, businesses, and citizens tools to advocate for preventative measures and interventions
to mitigate health impacts of flood inundation. As San Francisco prepares for climate change, preparedness and mitigation efforts will improve health and safety and protect critical infrastructure.
This report will first examine current conditions that may affect flood inundation and extreme storms which impact public health. These current conditions include geography, current climate and predicted climate changes, and the built environment. We will use the information from the current conditions, climate change projections, health impacts, and social-economic vulnerabilities to create a flood vulnerability index that illustrates the relative vulnerability of San Francisco by census block groups and planning neighborhoods. Lastly, we will outline interventions to prepare and respond to the health impacts of flood inundation and extreme storms.
Introduction
Climate and Health Understanding the Risk: An Assessment of San Francisco’s Vulnerability to Flooding & Extreme Storms 6
San Francisco Department of Public Health
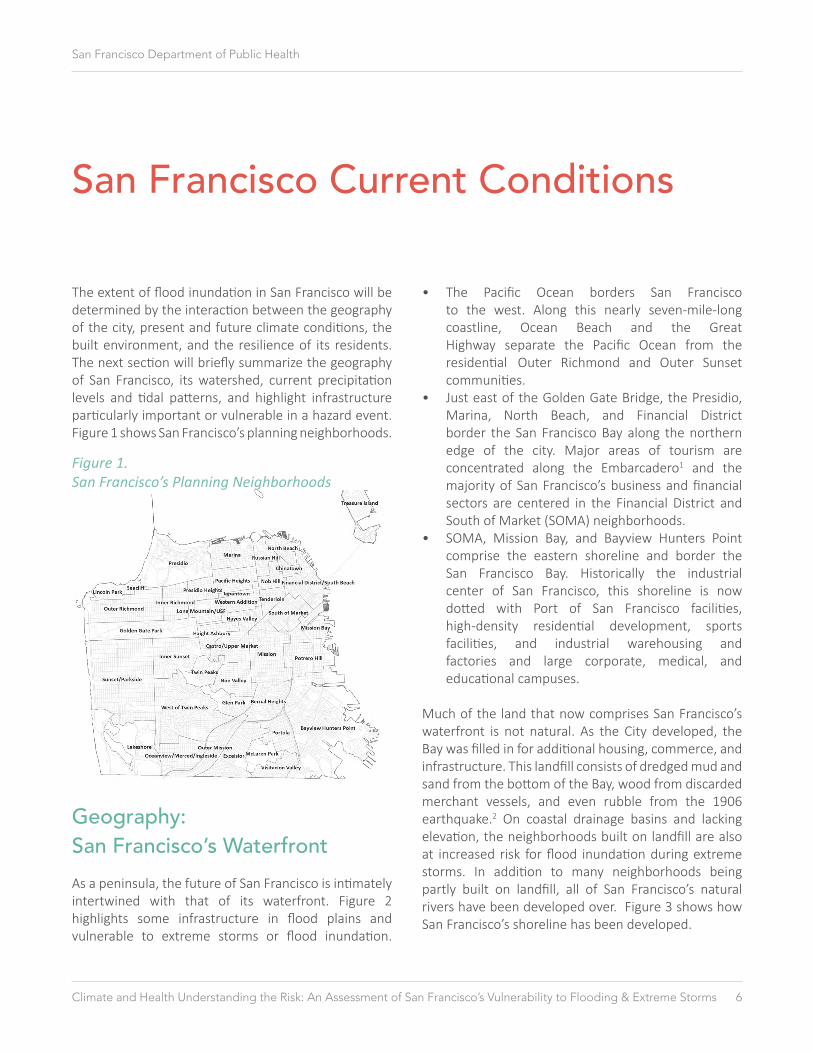
The extent of flood inundation in San Francisco will be determined by the interaction between the geography of the city, present and future climate conditions, the built environment, and the resilience of its residents. The next section will briefly summarize the geography of San Francisco, its watershed, current precipitation levels and tidal patterns, and highlight infrastructure particularly important or vulnerable in a hazard event. Figure 1 shows San Francisco’s planning neighborhoods.
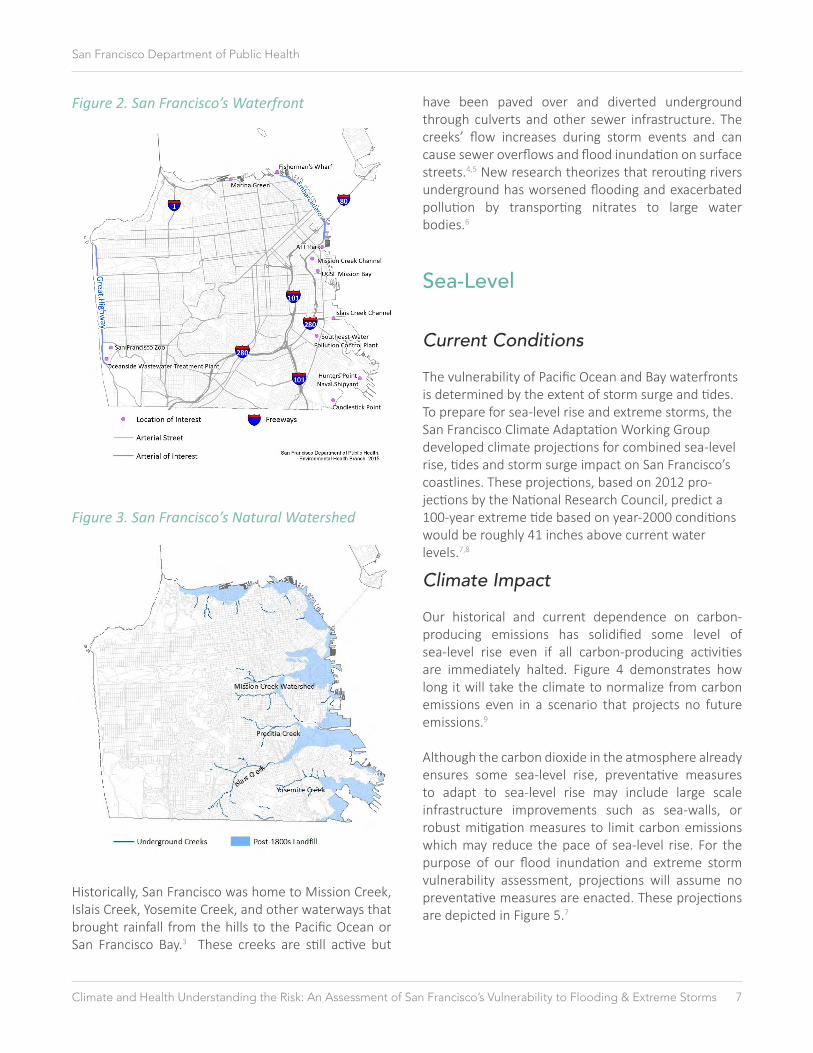
Geography: San Francisco’s WaterfrontAs a peninsula, the future of San Francisco is intimately intertwined with that of its waterfront. Figure 2 highlights some infrastructure in flood plains and vulnerable to extreme storms or flood inundation.
• The Pacific Ocean borders San Francisco to the west. Along this nearly seven-mile-long coastline, Ocean Beach and the Great Highway separate the Pacific Ocean from the residential Outer Richmond and Outer Sunset communities. • Just east of the Golden Gate Bridge, the Presidio, Marina, North Beach, and Financial District border the San Francisco Bay along the northern edge of the city. Major areas of tourism are concentrated along the Embarcadero1 and the majority of San Francisco’s business and financial sectors are centered in the Financial District and South of Market (SOMA) neighborhoods.• SOMA, Mission Bay, and Bayview Hunters Point comprise the eastern shoreline and border the San Francisco Bay. Historically the industrial center of San Francisco, this shoreline is now dotted with Port of San Francisco facilities, high-density residential development, sports facilities, and industrial warehousing and factories and large corporate, medical, and educational campuses.
Much of the land that now comprises San Francisco’s waterfront is not natural. As the City developed, the Bay was filled in for additional housing, commerce, and infrastructure. This landfill consists of dredged mud and sand from the bottom of the Bay, wood from discarded merchant vessels, and even rubble from the 1906 earthquake.2 On coastal drainage basins and lacking elevation, the neighborhoods built on landfill are also at increased risk for flood inundation during extreme storms. In addition to many neighborhoods being partly built on landfill, all of San Francisco’s natural rivers have been developed over. Figure 3 shows how San Francisco’s shoreline has been developed.
San Francisco Current Conditions
Figure 1. San Francisco’s Planning Neighborhoods
Climate and Health Understanding the Risk: An Assessment of San Francisco’s Vulnerability to Flooding & Extreme Storms 7
San Francisco Department of Public Health
Historically, San Francisco was home to Mission Creek, Islais Creek, Yosemite Creek, and other waterways that brought rainfall from the hills to the Pacific Ocean or San Francisco Bay.3 These creeks are still active but
have been paved over and diverted underground through culverts and other sewer infrastructure. The creeks’ flow increases during storm events and can cause sewer overflows and flood inundation on surface streets.4,5 New research theorizes that rerouting rivers underground has worsened flooding and exacerbated pollution by transporting nitrates to large water bodies.6
Sea-Level
Current Conditions
The vulnerability of Pacific Ocean and Bay waterfronts is determined by the extent of storm surge and tides. To prepare for sea-level rise and extreme storms, the San Francisco Climate Adaptation Working Group developed climate projections for combined sea-level rise, tides and storm surge impact on San Francisco’s coastlines. These projections, based on 2012 pro-jections by the National Research Council, predict a 100-year extreme tide based on year-2000 conditions would be roughly 41 inches above current water levels.7,8
Climate Impact
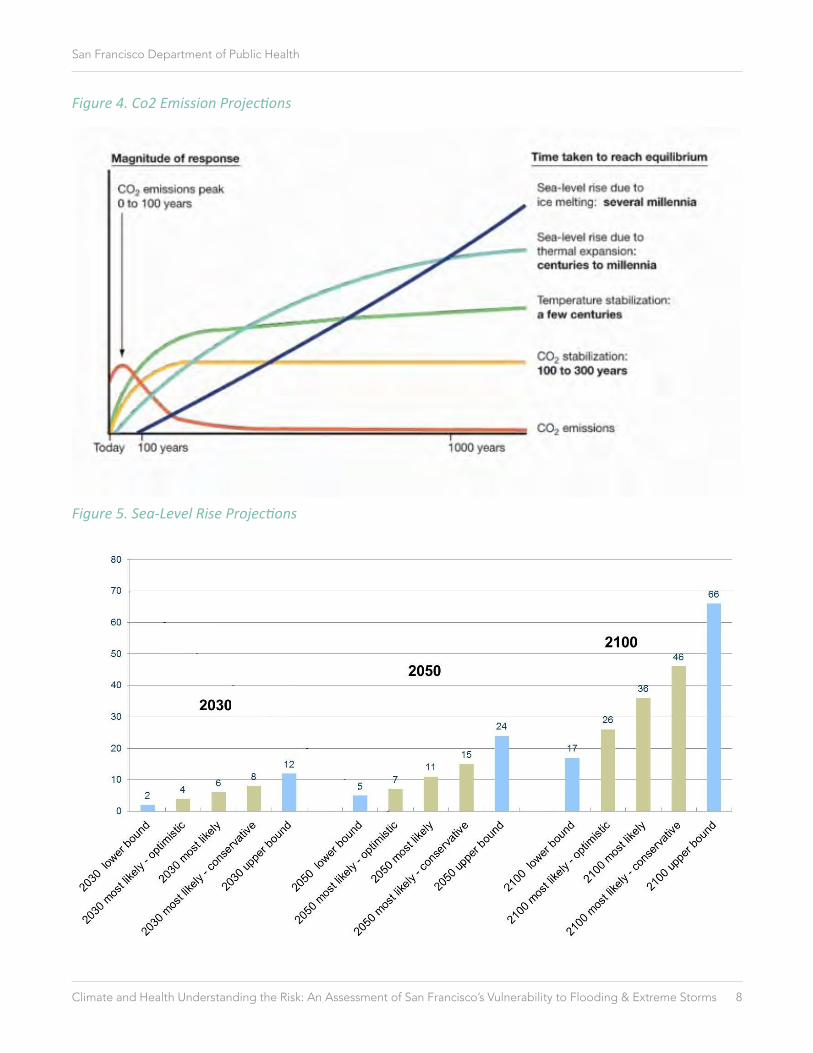
Our historical and current dependence on carbon-producing emissions has solidified some level of sea-level rise even if all carbon-producing activities are immediately halted. Figure 4 demonstrates how long it will take the climate to normalize from carbon emissions even in a scenario that projects no future emissions.9
Although the carbon dioxide in the atmosphere already ensures some sea-level rise, preventative measures to adapt to sea-level rise may include large scale infrastructure improvements such as sea-walls, or robust mitigation measures to limit carbon emissions which may reduce the pace of sea-level rise. For the purpose of our flood inundation and extreme storm vulnerability assessment, projections will assume no preventative measures are enacted. These projections are depicted in Figure 5.7
Figure 2. San Francisco’s Waterfront
Figure 3. San Francisco’s Natural Watershed
Climate and Health Understanding the Risk: An Assessment of San Francisco’s Vulnerability to Flooding & Extreme Storms 8
San Francisco Department of Public Health
Figure 4. Co2 Emission Projections
Figure 5. Sea-Level Rise Projections
Climate and Health Understanding the Risk: An Assessment of San Francisco’s Vulnerability to Flooding & Extreme Storms 9
San Francisco Department of Public Health
As the atmosphere warms, both the melting of the ice caps and the thermal expansion of the oceans will cause global sea-levels to rise. If no preventative measures are taken, based on 2010 conditions, the sea-level on the bay side is projected to rise between 7 and 15 inches by 2050, and between 26 and 46 inches by 2100.8
Precipitation
Current Conditions
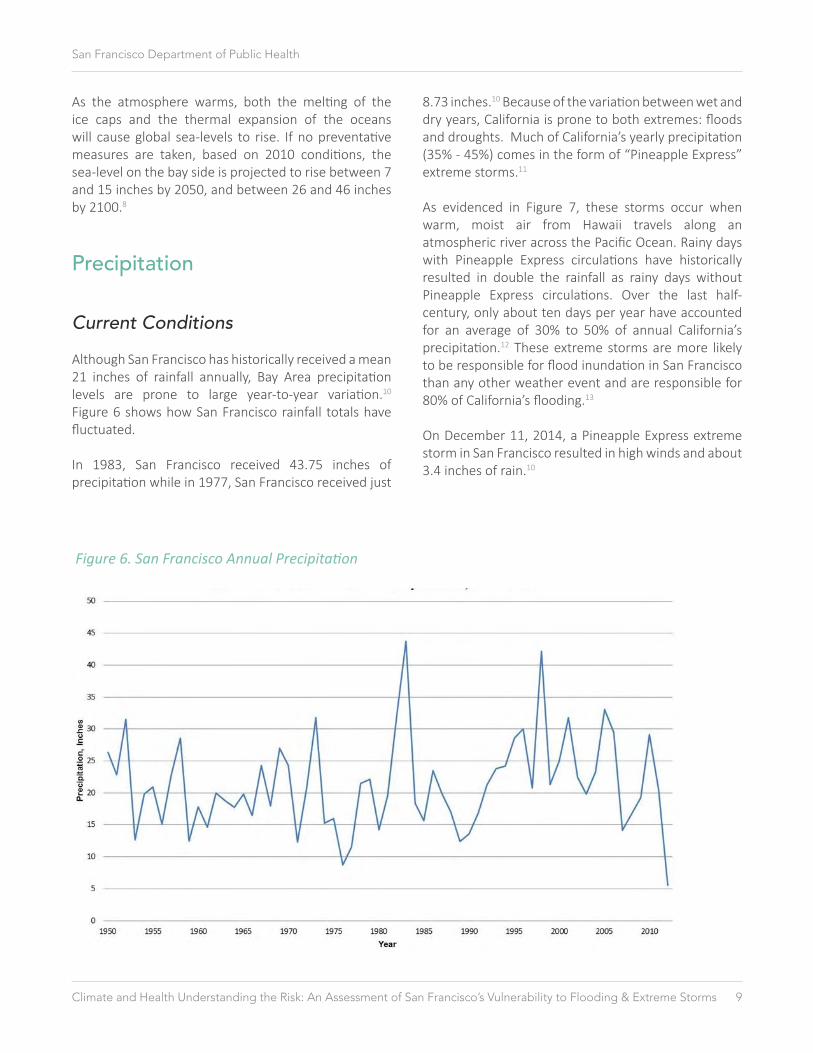
Although San Francisco has historically received a mean 21 inches of rainfall annually, Bay Area precipitation levels are prone to large year-to-year variation.10 Figure 6 shows how San Francisco rainfall totals have fluctuated.
In 1983, San Francisco received 43.75 inches of precipitation while in 1977, San Francisco received just
8.73 inches.10 Because of the variation between wet and dry years, California is prone to both extremes: floods and droughts. Much of California’s yearly precipitation (35% - 45%) comes in the form of “Pineapple Express” extreme storms.11
As evidenced in Figure 7, these storms occur when warm, moist air from Hawaii travels along an atmospheric river across the Pacific Ocean. Rainy days with Pineapple Express circulations have historically resulted in double the rainfall as rainy days without Pineapple Express circulations. Over the last half-century, only about ten days per year have accounted for an average of 30% to 50% of annual California’s precipitation.12 These extreme storms are more likely to be responsible for flood inundation in San Francisco than any other weather event and are responsible for 80% of California’s flooding.13
On December 11, 2014, a Pineapple Express extreme storm in San Francisco resulted in high winds and about 3.4 inches of rain.10
Figure 6. San Francisco Annual Precipitation
Climate and Health Understanding the Risk: An Assessment of San Francisco’s Vulnerability to Flooding & Extreme Storms 10
San Francisco Department of Public Health
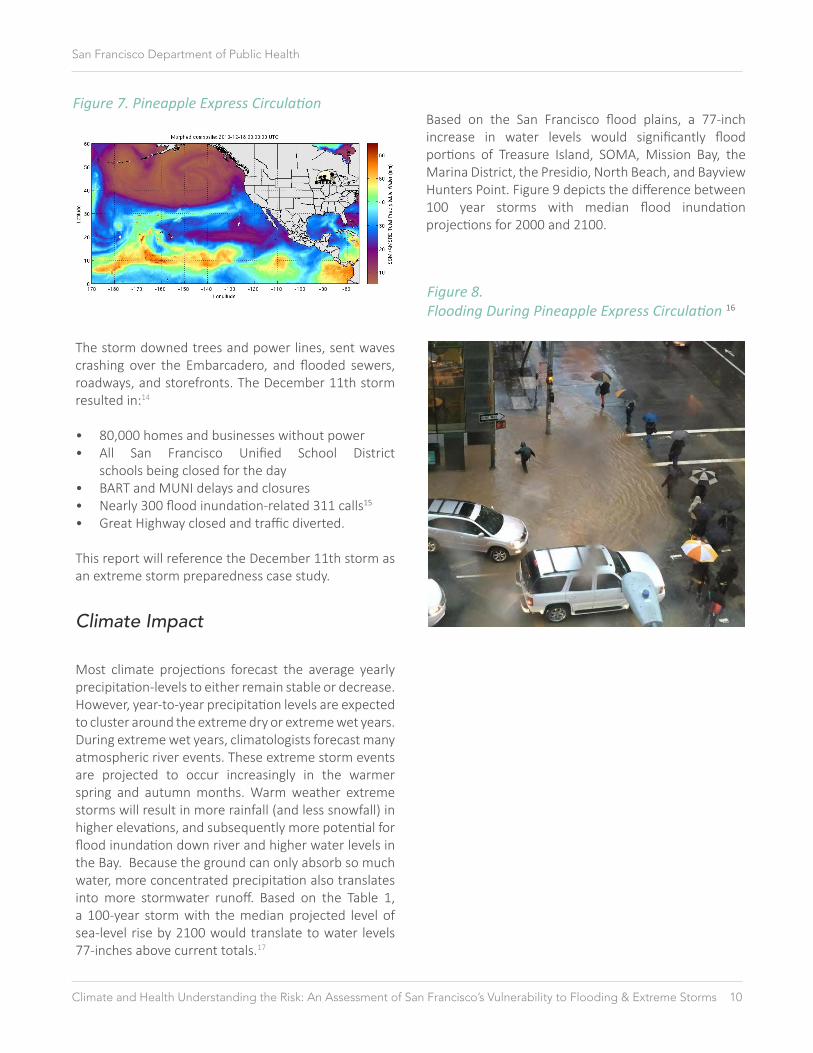
The storm downed trees and power lines, sent waves crashing over the Embarcadero, and flooded sewers, roadways, and storefronts. The December 11th storm resulted in:14
• 80,000 homes and businesses without power• All San Francisco Unified School District schools being closed for the day • BART and MUNI delays and closures• Nearly 300 flood inundation-related 311 calls15 • Great Highway closed and traffic diverted.
This report will reference the December 11th storm as an extreme storm preparedness case study.
Climate Impact
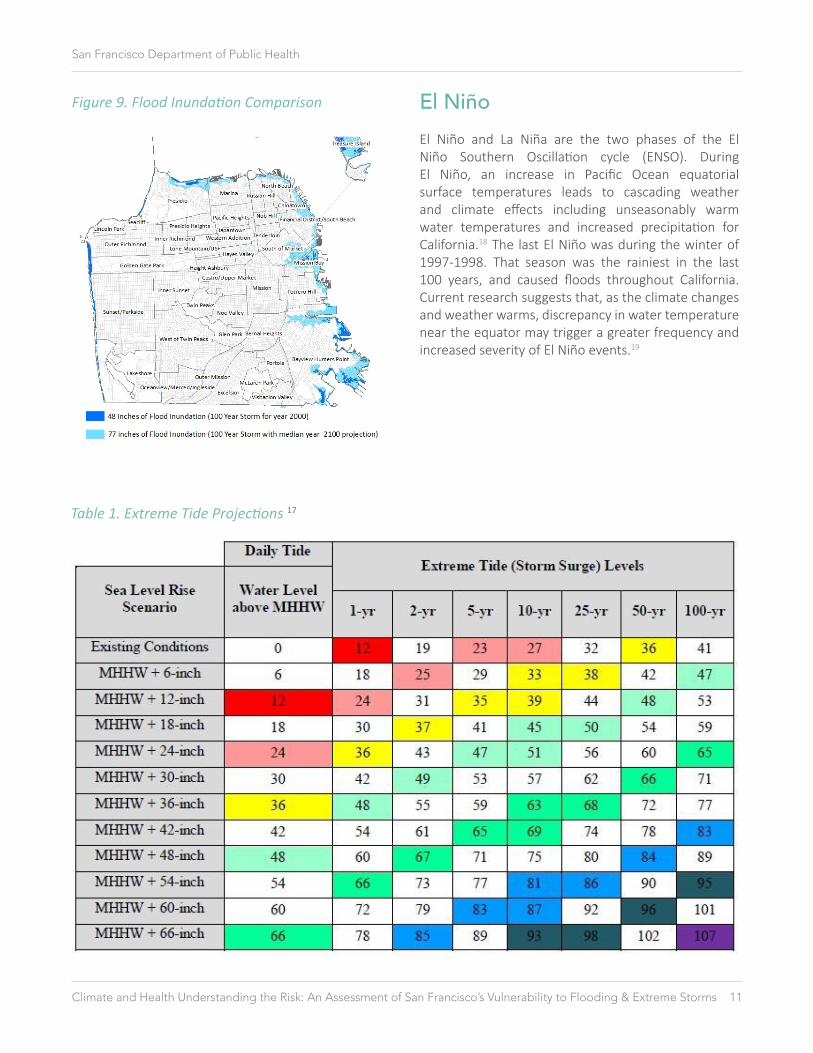
Most climate projections forecast the average yearly precipitation-levels to either remain stable or decrease. However, year-to-year precipitation levels are expected to cluster around the extreme dry or extreme wet years. During extreme wet years, climatologists forecast many atmospheric river events. These extreme storm events are projected to occur increasingly in the warmer spring and autumn months. Warm weather extreme storms will result in more rainfall (and less snowfall) in higher elevations, and subsequently more potential for flood inundation down river and higher water levels in the Bay. Because the ground can only absorb so much water, more concentrated precipitation also translates into more stormwater runoff. Based on the Table 1, a 100-year storm with the median projected level of sea-level rise by 2100 would translate to water levels 77-inches above current totals.17
Based on the San Francisco flood plains, a 77-inch increase in water levels would significantly flood portions of Treasure Island, SOMA, Mission Bay, the Marina District, the Presidio, North Beach, and Bayview Hunters Point. Figure 9 depicts the difference between 100 year storms with median flood inundation projections for 2000 and 2100.
Figure 7. Pineapple Express Circulation
Figure 8. Flooding During Pineapple Express Circulation 16
Climate and Health Understanding the Risk: An Assessment of San Francisco’s Vulnerability to Flooding & Extreme Storms 11
San Francisco Department of Public Health
Table 1. Extreme Tide Projections 17
Figure 9. Flood Inundation Comparison El NiñoEl Niño and La Niña are the two phases of the El Niño Southern Oscillation cycle (ENSO). During El Niño, an increase in Pacific Ocean equatorial surface temperatures leads to cascading weather and climate effects including unseasonably warm water temperatures and increased precipitation for California.18 The last El Niño was during the winter of 1997-1998. That season was the rainiest in the last 100 years, and caused floods throughout California. Current research suggests that, as the climate changes and weather warms, discrepancy in water temperature near the equator may trigger a greater frequency and increased severity of El Niño events.19
Climate and Health Understanding the Risk: An Assessment of San Francisco’s Vulnerability to Flooding & Extreme Storms 12
San Francisco Department of Public Health
Built Environment
The third variable that affects the severity of flood inundation is the built environment. For the purpose of this report, we will focus on aspects of San Francisco’s built environment that directly impact flood inundation including the sewer and wastewater transport system, vulnerable streets and highways, development in flood plains, and concentration of impervious surface.
Stormwater and Wastewater
Management
A functional stormwater management system is the first line of defense against flood inundation during extreme storm events. With portions built in the mid-1800s, the San Francisco sewer system struggles to handle the capacity of a modern metropolis.20 San Francisco is one of the few West Coast cities with a combined stormwater-wastewater sewer system.21 This system treats both stormwater and wastewater at the same time instead of separating their transport and disposal into two different piping systems. The stormwater and wastewater are transported to one of four treatment facilities to be cleaned before being released into the Ocean or Bay.22 During heavy storm events, when stormwater runoff is high and the system is beyond capacity, excess stormwater and wastewater is stored in transportation/storage structures around the city perimeter. However, during the heaviest rainfall, these facilities can fill beyond capacity and untreated wastewater and stormwater will be discharged into the San Francisco Bay. Any storm drain clogged with debris has the potential to overflow untreated wastewater onto San Francisco streets. Currently, the San Francisco Public Utilities Commission has committed $6.9 billion to the Sewer System Improvement Plan to overhaul the infrastructure for treating and releasing stormwater and wastewater.19 The three-phase overhaul will include grey infrastructure improvements to water treatment facilities and collection systems, and green infrastructure development such as daylighting creeks, and green corridors to aid stormwater bio-filtration.
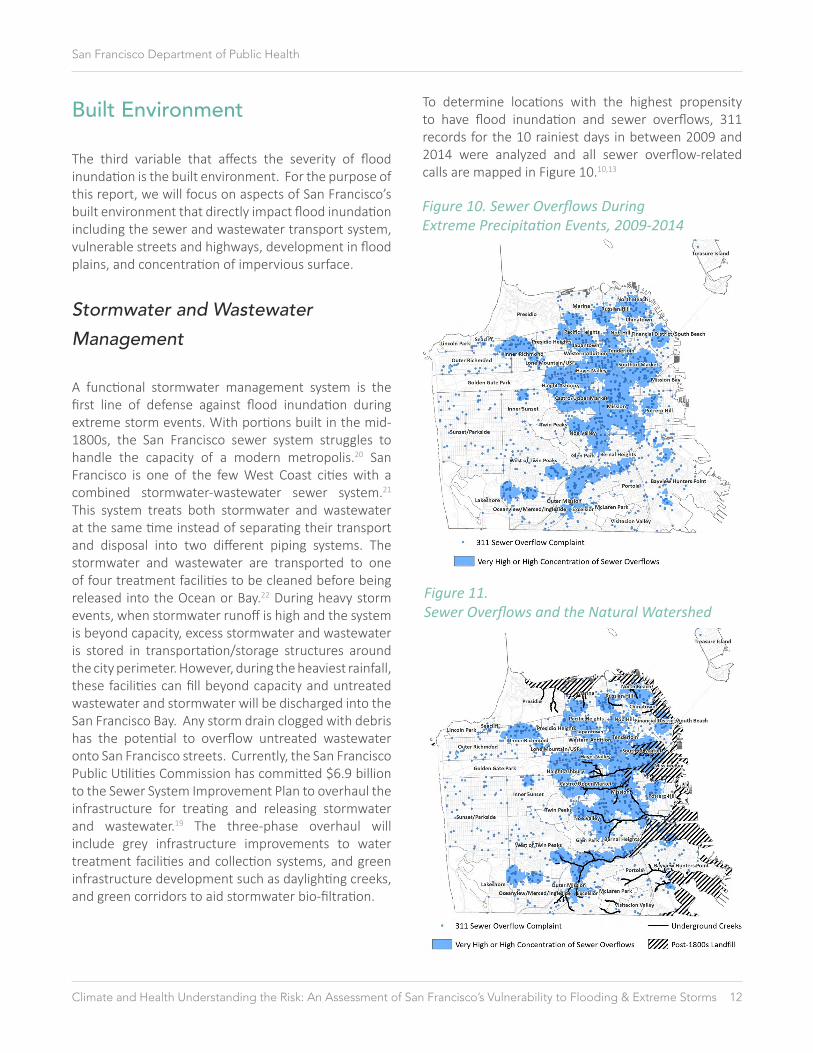
To determine locations with the highest propensity to have flood inundation and sewer overflows, 311 records for the 10 rainiest days in between 2009 and 2014 were analyzed and all sewer overflow-related calls are mapped in Figure 10.10,13
Figure 10. Sewer Overflows During Extreme Precipitation Events, 2009-2014
Figure 11. Sewer Overflows and the Natural Watershed
Climate and Health Understanding the Risk: An Assessment of San Francisco’s Vulnerability to Flooding & Extreme Storms 13
San Francisco Department of Public Health
According to the 311 sewer-overflows map, the neighborhoods with the highest concentration of flood-inundation include SOMA, Hayes Valley, Haight Ashbury, the Mission, and the Outer Mission.
Figure 11 shows that 311 calls, especially in the east and southeast sections of San Francisco, tend to occur in close proximity to underground creeks.
Transportation
San Francisco is serviced by various transportation networks. These networks combine to form a complicated transportation system tasked with not only moving San Francisco’s nearly 850,000 residents throughout the city but facilitating the commute of countless more employees and visitors. This transportation network is vulnerable to flood inundation and extreme storms. The December 11th extreme storm shut down Bay Area Rapid Transit (BART) service to the financial district, impacted San Francisco Municipal Railway (MUNI), and flooded portions of the 280 freeway in the eastern and southern San Francisco.23 Active transportation is also impacted by extreme storm events. Slick pavement, large puddles and reduced visibility may make conditions difficult for bicyclists and pedestrians.
Development
Much of the proposed development in San Francisco is planned for San Francisco’s eastern shoreline which is vulnerable to flooding and sea-level rise.24
Because many developments are planned for current or future flood inundation risk areas, the City must prepare for future sea-level rise and extreme storm scenarios to ensure the longevity of the developments by developing building codes to protect the public in advance of future extreme storm and storm surge scenarios. Additionally, development in neighborhoods with high exposure to sea-level rise and flood inundation will inevitably result in more San Franciscans living in flood plains. San Francisco’s public health and emergency management infrastructure must add capacity and identify vulnerable public health infrastructure in order to prepare for flood events that impact a large population of San Franciscans.
Climate and Health Understanding the Risk: An Assessment of San Francisco’s Vulnerability to Flooding & Extreme Storms 14
San Francisco Department of Public Health
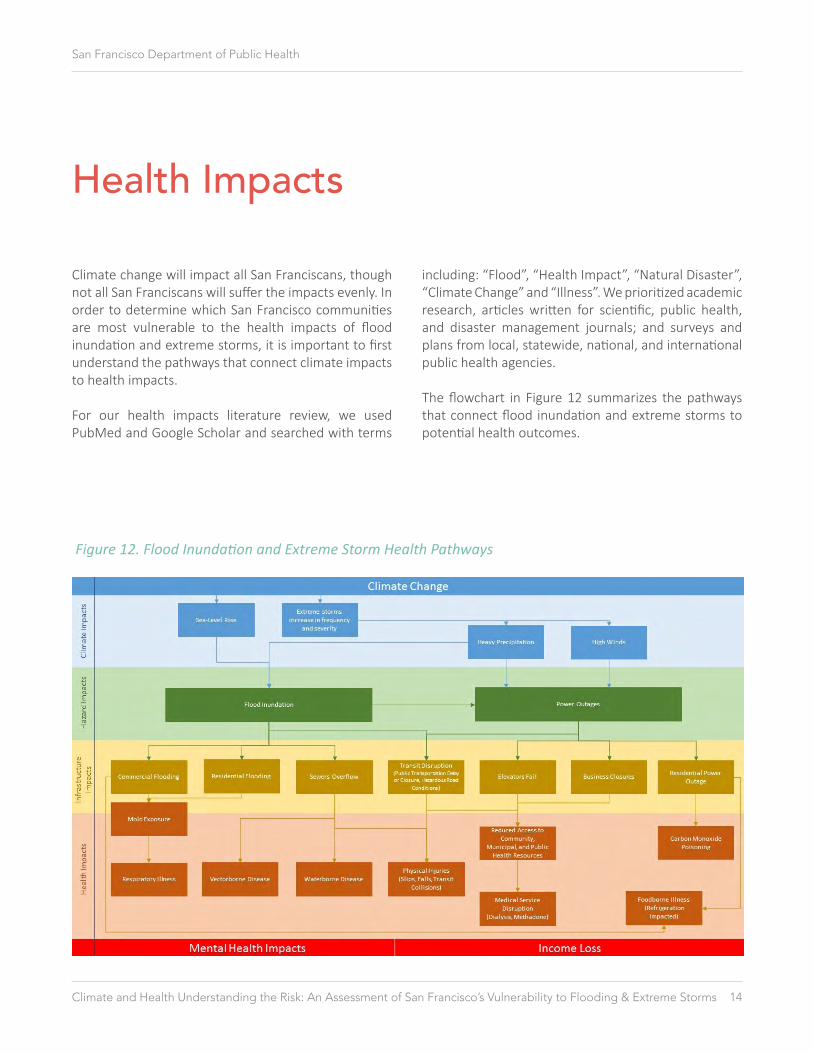
Climate change will impact all San Franciscans, though not all San Franciscans will suffer the impacts evenly. In order to determine which San Francisco communities are most vulnerable to the health impacts of flood inundation and extreme storms, it is important to first understand the pathways that connect climate impacts to health impacts.
For our health impacts literature review, we used PubMed and Google Scholar and searched with terms
including: “Flood”, “Health Impact”, “Natural Disaster”, “Climate Change” and “Illness”. We prioritized academic research, articles written for scientific, public health, and disaster management journals; and surveys and plans from local, statewide, national, and international public health agencies.
The flowchart in Figure 12 summarizes the pathways that connect flood inundation and extreme storms to potential health outcomes.
Health Impacts
Figure 12. Flood Inundation and Extreme Storm Health Pathways
Climate and Health Understanding the Risk: An Assessment of San Francisco’s Vulnerability to Flooding & Extreme Storms 15
San Francisco Department of Public Health
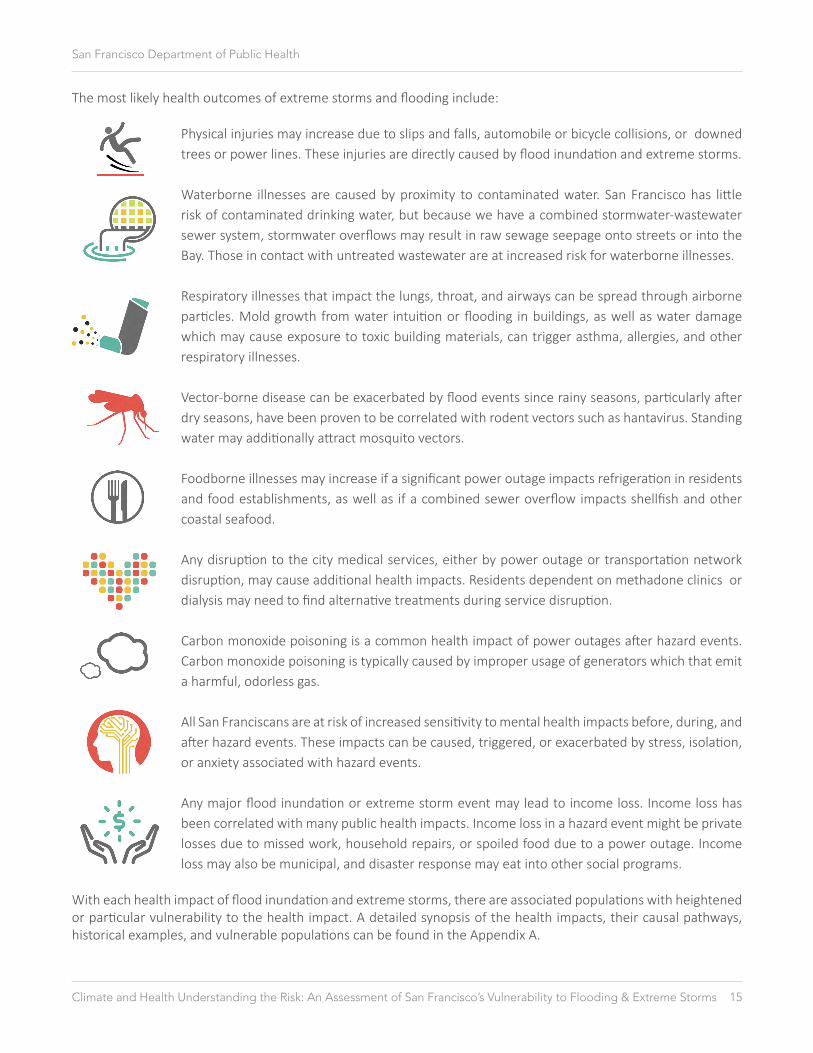
Physical injuries may increase due to slips and falls, automobile or bicycle collisions, or downed trees or power lines. These injuries are directly caused by flood inundation and extreme storms.
Waterborne illnesses are caused by proximity to contaminated water. San Francisco has little risk of contaminated drinking water, but because we have a combined stormwater-wastewater sewer system, stormwater overflows may result in raw sewage seepage onto streets or into the Bay. Those in contact with untreated wastewater are at increased risk for waterborne illnesses.
Respiratory illnesses that impact the lungs, throat, and airways can be spread through airborne particles. Mold growth from water intuition or flooding in buildings, as well as water damage which may cause exposure to toxic building materials, can trigger asthma, allergies, and other respiratory illnesses.
Vector-borne disease can be exacerbated by flood events since rainy seasons, particularly after dry seasons, have been proven to be correlated with rodent vectors such as hantavirus. Standing water may additionally attract mosquito vectors.
Foodborne illnesses may increase if a significant power outage impacts refrigeration in residents and food establishments, as well as if a combined sewer overflow impacts shellfish and other coastal seafood.
Any disruption to the city medical services, either by power outage or transportation network disruption, may cause additional health impacts. Residents dependent on methadone clinics or dialysis may need to find alternative treatments during service disruption.
Carbon monoxide poisoning is a common health impact of power outages after hazard events. Carbon monoxide poisoning is typically caused by improper usage of generators which that emit a harmful, odorless gas.
All San Franciscans are at risk of increased sensitivity to mental health impacts before, during, and after hazard events. These impacts can be caused, triggered, or exacerbated by stress, isolation, or anxiety associated with hazard events.
Any major flood inundation or extreme storm event may lead to income loss. Income loss has been correlated with many public health impacts. Income loss in a hazard event might be private losses due to missed work, household repairs, or spoiled food due to a power outage. Income loss may also be municipal, and disaster response may eat into other social programs.
With each health impact of flood inundation and extreme storms, there are associated populations with heightened or particular vulnerability to the health impact. A detailed synopsis of the health impacts, their causal pathways, historical examples, and vulnerable populations can be found in the Appendix A.
The most likely health outcomes of extreme storms and flooding include:
Climate and Health Understanding the Risk: An Assessment of San Francisco’s Vulnerability to Flooding & Extreme Storms 16
San Francisco Department of Public Health
The vulnerable populations literature review builds upon the health impacts literature review. The objective of the vulnerable populations literature review was to identify populations particularly vulnerable to the health impacts of flood inundation and extreme storms. The identification of these populations will help the City of San Francisco be able to design and target interventions for the populations most in need. The vulnerable populations from the health impacts literature review provided a starting point.
We used PubMed and Google Scholar and searched with terms including “Vulnerable Populations”, “Health Impacts”, “Flood”, “Hazard” and terms associated with
flood health impacts including “Asthma”, “Respiratory Disease”, “Waterborne”, “Vector-borne”, and “Mental Health”.
We prioritized academic research and established vulnerability indexes, articles written for scientific, public health, and disaster management journals, and surveys and plans from local, statewide, national, and international public health agencies. We also prioritized articles written after 2000.
A final list of vulnerable populations can be found in Table 2.
Because vulnerable populations are often concentrated in particular neighborhoods, to most effectively focus resources and design interventions, it is important to determine which San Francisco neighborhoods and populations are most vulnerable to health impacts associated with extreme precipitation weather events. A comparative analysis of flood vulnerability by both block group and neighborhood will give city agencies and community organizations a sophisticated tool to advocate for programs and policies to better prepare for, respond to, and recover from, the health impacts of flood inundation and extreme storms, and to evaluate the effectiveness of these interventions.
The final indicators used in the flood vulnerability assessment fall into four general categories: 1) socioeconomic and demographic indicators, often based on historic or current systemic inequalities, that, that impact a persons ability to prepare for or recover from hazard events, 2) climate projections to approximate exposure risk and identify areas most likely to experience flood inundation, 3) pre-existing health conditions that may be especially impacted by a hazard events and any interruption in government or community services, and 4) the quality and characteristics of housing and the built environment.
Table 2 shows all indicators, its shorthand identifier, and data source.
Vulnerable Populations
Vulnerability Assessment

Climate and Health Understanding the Risk: An Assessment of San Francisco’s Vulnerability to Flooding & Extreme Storms 17
San Francisco Department of Public Health
Flood Vulnerability Variable Symbol Data SourcePercentage of residents aged 18 and under zChildren American Community Survey
2010-2012Percentage of residents aged 65 and over zElderly American Community Survey
2010-2012Percentage of non-white residents zRace American Community Survey
2010-2012Percentage of households at or below 200% of the federal poverty rate
zPoverty American Community Survey 2010-2012
Percentage of residents over 18 years old without a high school degree
zEducation American Community Survey 2010-2012
Percentage of residents living in households without English spoken “very well:
zEnglish American Community Survey 2010-2012
Percent of the land area in the 100-year flood plain with 36-inches of sea-level rise (projected 77 inches flood inundation)
zFloodEmph San Francisco Sea-Level Rise Committee, AECOM 77inch flood inundation layer, 2014
Areas with the highest concentration of sewage overflows according to 311 sewage overflow data
zSewage Density of Sewage Overflows, 311 Service Complaints July 2009 - June 2014
Percent of land area comprised of impervious surfaces
zImpSurface USGS, 2011
Age adjusted diabetes hospitalization rate zDiabetes San Francisco Community Health Assessment, 2016
Age adjusted asthma hospitalization rate zAsthma San Francisco Community Health Assessment, 2016
Age adjusted schizophrenia and other psychotic disorders hospitalization rate
zMental San Francisco Community Health Assessment, 2016
Percentage of residents reporting a physical disability
zDisabled American Community Survey 2010-2012
Percentage of residents living in a state-licensed residential care facility
zResCare California Department of Social Services Community Care Licensing Facility Search
Homeless population, per 1000 residents zHomeless 2013 San Francisco Homeless Count
Annual housing violations, per 1000 residents zViolations San Francisco Police Department, San Francisco Public Health Department, San Francisco Fire Department violations 2010-2012
Percentage of residents living alone zLivAlone American Community Survey 2010-2012
Table 2. Vulnerable Populations

Climate and Health Understanding the Risk: An Assessment of San Francisco’s Vulnerability to Flooding & Extreme Storms 18
San Francisco Department of Public Health
Table 3. Vulnerability Indicator Correlation Matrix
Data Standardization
All data was analyzed at the block group level. Raster data was summarized at the block group level using zonal statistics. Data unavailable at the block group level was converted by proportional splits. Data was standardized by calculating z-scores for every indicator. The z-score measures a score relative to the mean and provides a standard for comparison between indicators. The z-score is calculated by (indicator score – indicator mean) / standard deviation).
Data Analysis
For the purpose of emphasizing exposure, we multiplied the flood risk z-score by a factor of two. A Pearson correlation matrix identified correlations between vulnerability indicators (Table 3). According to Table 3, indicators whose R-Squared value is either darker blue or dark red have higher positive and negative correlations. Some strong correlations (over 0.5) include:
• Percentage of residents over 18 years old without a high school degree• Percentage of residents living in households without English spoken “very well”• Percentage of non-white residents• Percentage of households at or below 200 percent of the federal poverty rate• Homeless population, per 1000 residents.• Age Adjusted Diabetes Hospitalization Rate• Age Adjusted Asthma Hospitalization Rate• Age Adjusted Schizophrenia and other Psychotic Disorders Hospitalization Rate
Because the attributes were highly correlated, we performed a principal component analysis and a principal component analysis with a varimax rotation to reduce the dimensionality of the data. For the principal component analysis, the first five components explained the 71 percent of the variability, while the first five components of the rotated matrix explained 74 perecent of the variability.
The first five components from the unrotated matrix were summed to create final block group flood vulnerability scores.
Climate and Health Understanding the Risk: An Assessment of San Francisco’s Vulnerability to Flooding & Extreme Storms 19
San Francisco Department of Public Health
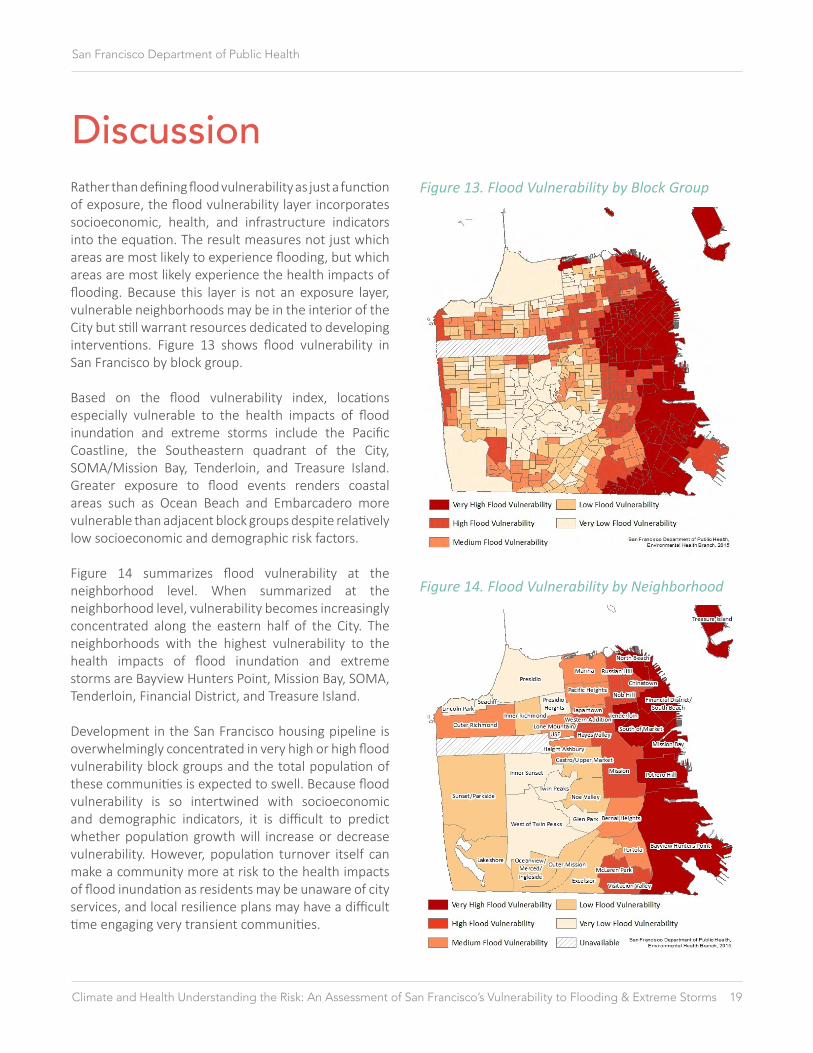
Rather than defining flood vulnerability as just a function of exposure, the flood vulnerability layer incorporates socioeconomic, health, and infrastructure indicators into the equation. The result measures not just which areas are most likely to experience flooding, but which areas are most likely experience the health impacts of flooding. Because this layer is not an exposure layer, vulnerable neighborhoods may be in the interior of the City but still warrant resources dedicated to developing interventions. Figure 13 shows flood vulnerability in San Francisco by block group.
Based on the flood vulnerability index, locations especially vulnerable to the health impacts of flood inundation and extreme storms include the Pacific Coastline, the Southeastern quadrant of the City, SOMA/Mission Bay, Tenderloin, and Treasure Island. Greater exposure to flood events renders coastal areas such as Ocean Beach and Embarcadero more vulnerable than adjacent block groups despite relatively low socioeconomic and demographic risk factors.
Figure 14 summarizes flood vulnerability at the neighborhood level. When summarized at the neighborhood level, vulnerability becomes increasingly concentrated along the eastern half of the City. The neighborhoods with the highest vulnerability to the health impacts of flood inundation and extreme storms are Bayview Hunters Point, Mission Bay, SOMA, Tenderloin, Financial District, and Treasure Island.
Development in the San Francisco housing pipeline is overwhelmingly concentrated in very high or high flood vulnerability block groups and the total population of these communities is expected to swell. Because flood vulnerability is so intertwined with socioeconomic and demographic indicators, it is difficult to predict whether population growth will increase or decrease vulnerability. However, population turnover itself can make a community more at risk to the health impacts of flood inundation as residents may be unaware of city services, and local resilience plans may have a difficult time engaging very transient communities.
DiscussionFigure 13. Flood Vulnerability by Block Group
Figure 14. Flood Vulnerability by Neighborhood

Climate and Health Understanding the Risk: An Assessment of San Francisco’s Vulnerability to Flooding & Extreme Storms 20
San Francisco Department of Public Health
Throughout the report, we examined San Francisco baseline conditions, summarized projected climate impacts, and identified the most common health impacts of flood inundation and extreme storms and which populations were most vulnerable to those health impacts. Lastly, we combined all of this information to create a Flood Vulnerability Index to assess which San Francisco block groups and neighborhoods are particularly vulnerable to the health impacts of flood inundation and extreme storms.
The purpose of this analysis is to provide City agencies, private business, and community organizations a tool to help advocate for and design interventions, and evaluate their strengths and weaknesses. The Flood Vulnerability Index which ranks block groups by vulnerability, will allow for more sophisticated processes to target resources, and help the Department of Public Health expand capacity to prepare for flood and extreme storms.
This section will identify some of the many interventions to protect the public from extreme precipitation events associated with climate change. These interventions can be implemented at the individual, neighborhood, or city level to mitigate the health impacts of flood inundation and extreme storms. These interventions include 1) public health interventions, 2) grey and green infrastructure interventions, and 3) emergency preparedness and response interventions.
Public Health and Emergency Preparedness
For this analysis, Public Health and Emergency Preparedness interventions are non-infrastructure interventions to help the public prepare for or recover
from flood or extreme storm. These interventions depend on continued cross-sector collaboration between Public Health and Emergency Management. These interventions may be policies, programs, plans, or other efforts to expand community capacity in preparation for flood inundation and extreme storms.
Surveillance and Data Analysis
Surveillance and data analysis involves the use of morbidity, mortality, and other demographic and built environment data to track health impacts for the purpose of identifying patterns to more strategically allocate resources, design interventions, and evaluate response. Surveillance and data analysis may mandate coordination between Public Health, Planning, Public Works, Public Utilities and the Health Service Network. Surveillance and data analysis that may mitigate health impacts of flood inundation and extreme storms in San Francisco include:
1. Surveillance of carbon monoxide poisoning.2
Carbon monoxide poisoning is a leading post-disaster morbidity and mortality. A primary cause of carbon monoxide poisoning is the improper placement of nonelectrical generators which colorless odorless carbon monoxide gas. Carbon monoxide poisoning spikes during power outages after hazard events.
Carbon monoxide poisoning data can be collected from emergency room visits, hospitalizations, poison control center calls, and interviews with first responders. Surveillance of carbon monoxide poisoning may result in a better understanding of the populations most impacted by carbon monoxide poisoning and targeted interventions to better reach those populations.
Interventions

Climate and Health Understanding the Risk: An Assessment of San Francisco’s Vulnerability to Flooding & Extreme Storms 21
San Francisco Department of Public Health
2. Create a vulnerable building index.25 Housing quality is a leading indicator of vulnerability to flood inundation and extreme storms. A sophisticated index of buildings most vulnerable to the health impacts of flood inundation and extreme storms would allow City agencies and community organizations a tool to better target pre-disaster education and outreach. Indicators that impact a buildings’ flood vulnerability include: a. Mold violations b. Water-vulnerable building materials c. Building age and upgrades d. Location of backup generators e. Concentration of vulnerable residents
3. Track localized storm drain overflows to target pre-disaster cleanup of especially high-risk drains. Not all storm drains overflow with the same frequency. Historical sewer overflow information can be used to predict drains most likely to overflow in future precipitation events. Storm drain overflow data can be collected from the Public Utilities Commission, Public Works, and 311.
4. Evaluate health care infrastructure for flood vulnerability. In the event of an extreme storm, the public health department and health system must be able to respond to health impacts. In preparation for these events, health care infrastructure, including sufficient staffing, and physical building and power resiliency. Figure 15 shows that twenty-six of eighty San Francisco health centers are in very high flood vulnerability zones.
Education and Outreach
The dispersal of important information before and during a hazard event is important to ensure all residents have the tools to make decisions and protect themselves in case of flood emergency or prolonged interruption of the city power or transportation system. Education and outreach to highlight include:
1. Information about carbon monoxide poisoning.26 This information should be available for non-English speakers, and should be available before or during hazard events at sandbag distribution or food-and-water distribution points.
2. Information about dialysis and methadone options in preparation for power outages or other disruptions to the city power or transportation network.
3. Public health risk communication is important to prepare the public in advance of a hazard event. Collaboration that could increase awareness of climate change and its impact on flood inundation and extreme storms includes using pre-existing public health outreach such as restaurant inspections as a way to distribute information to local businesses. Other risk communication strategies may include the development and communication of text and email alert systems to communication flood warnings, power outages, and sewer overflows.27
Planning
1. Communities, neighborhood centers, and private organizations should develop disaster preparedness and resiliency plans.
Figure 15. Flood Vulnerability and Primary Care Centers
Climate and Health Understanding the Risk: An Assessment of San Francisco’s Vulnerability to Flooding & Extreme Storms 22
San Francisco Department of Public Health
Infrastructure Improvements
The quality of stormwater management infrastructure can dramatically reduce exposure to flood inundation and extreme storms. Infrastructure improvements are often result of collaboration between Public Works and Planning Departments but many can be implemented at the local or individual level. Individual level improvements include rain barrels, rain gardens, and other landscaping that facilitates stormwater biofiltration.
Gray Infrastructure
Gray infrastructure refers to infrastructure that is engineered of man-made materials. Some gray infrastructure that may mitigate exposure to flood inundation and extreme storms include:
1. Continuation of the San Francisco Sewer System Improvement Project (SSIP).28 The SSIP, headed by the San Francisco Public Utilities Commission, is a 3-phase, 6.9 billion dollar plan to revamp San Francisco’s sewer infrastructure. The plan includes improvements to expand the capacity of water treatment facilities and the wastewater collection system, including seismic upgrades and odor controls.
2. Develop a citywide Adopt-A-Drain program. An adopt-a-drain program incentivizes resident involvement in the maintenance of storm drains and catch basins in anticipation of major precipitation and extreme storm events. An adopt-a-drain program, especially targeted to high-vulnerability storm drains, may not only reduce runoff, but increase community capacity and awareness of flood event preparation.
3. Install permeable pavement. Permeable or porous pavement is pavement that helps mitigate runoff caused by impervious surface by allowing stormwater to seep through to the ground below.2
4. Incentivize rain barrels.29 Rain barrels can be installed at the local or community level. Rainwater harvesting can both decrease runoff, and help mitigate impacts of droughts by promoting water reuse.
Green Infrastructure
Green infrastructure describes natural ways to mitigate stormwater runoff. Although largescale green infrastructure networks often necessitate planning at the City or Regional level, smaller improvements, such as rain barrels, green roofs, and rain gardens, can be installed at the personal or community level. City departments are often responsible for regulation and enforcement of green infrastructure and barriers to improv ements often include incomplete regulation standards. Green infrastructure often tries to mimic natural processes, and adapt these processes for an urban environment. Green infrastructure can include:
5. Build green roofs.30 Green roofs or living roofs are vegetation planted on top a building. Green roofs can waterproof a structure, as the vegetation will both diminish and slow runoff. Green roofs can reduce runoff by up to 10%. 31
6. Develop stormwater biofiltration systems. a. Rain gardens can be planted at the individual, community or citywide level. These gardens use native vegetation to absorb stormwater and filter runoff. Many raingardens and other biofiltration systems include urban green space on sidewalks and pocket parks, but can also include personal landscaping including planting trees to reduce impervious surface.32
b. Wetlands restoration helps reestablish natural drainage basins to both collect runoff and protect residents and infrastructure from tidal fluctuations and sea-level rise.33
Climate and Health Understanding the Risk: An Assessment of San Francisco’s Vulnerability to Flooding & Extreme Storms 23
San Francisco Department of Public Health
As the changing climate raises sea-levels along the Pacific Ocean and the San Francisco Bay, and as increasingly intense and more frequent extreme storm events occur, the health impacts of flood inundation and extreme storms will become more severe. Because not all San Franciscans will suffer the health impacts evenly, analysis is necessary to determine both which populations are most likely to be impacted, and where these populations are most likely to live.
Exposure to flood inundation and extreme storms not only depends on proximity to the waterfront or other water bodies, but also the built environment. Poor-quality housing can increase risk of flood inundation, power outages, mold growth, rodent vectors, and other potentially harmful health impacts. The inclusion of socioeconomic, demographic, and health indicators in flood vulnerability analysis allows for greater consideration of health equity. Those with highest exposure rates are not always those who exhibit the greatest health impacts. The literature review confirmed that a person or community may be more vulnerable to the health impacts of hazard events if they are socially, culturally or linguistically isolated, financially stressed, or have pre-existing health conditions.
Data-driven approach coupled with smart community engagement to identifyingn the San Francisco neighborhoods and communities most vulnerable to
the health impacts of flood inundation and extreme storms is a necessary step toward focusing resources and developing interventions to mitigate the impact of hazard events. The flood vulnerability index can be used to discuss climate change impacts on public health and as a starting point for planning interventions, education, and outreach, and evaluating the success of these efforts.
While San Francisco will be increasingly vulnerable to climate change-related hazard events, the degree to which these events impact public health will be determined by how the City prepares. San Francisco has the ability to develop interventions that improve the built environment, target outreach and education to the most vulnerable populations, adapt public health infrastructure, respond to flood inundation and extreme storms, work with community members to increase individual and collective capacity to craft resilience plans, and coordinate among City departments to ensure that resources are streamlined to the most impacted communities before, during, and after a hazard event. This report remains hopeful that as these interventions are established and San Francisco adapts to the reality of sea-level rise and more extreme storms, San Francisco residents will become increasingly resilient.
Conclusion
1 San Francisco Center for Economic Department Volume, Spending, and Characteristics (2013), http://sfced.org/wp-content/uploads/2014/04/Data-Statistics-Toursim-Overview-Apr-2014.pdf “San Francisco’s Changing Shoreline” San Francisco Water Power Sewer, http://sfwater.org/index.aspx?page=625, accessed 08/03/2015.3 Baume, Matt “The Lure of the Creeks Buried Beneath San Francisco’s Streets” SF.Streetsblog, April 14, 2010.4 Olmsted, Nancy “Walking on Water- A History of Mission Bay” UCSF News Center, November 2007. http://www.ucsf.edu/news/2007/11/7374/walking-water-history-mission-bay2.5 Eaton, Joe and Ron Sullivan “S.F. History lesson runs through Islais Creek” San Francisco Chronicle, January 14, 2009. 6 Bliss, Laura “The Hidden Health Dangers of Buried Urban Rivers” The Atlantic CityLab, August 5 2015. http://www.citylab.com/politics/2015/08/the-hidden-health-dangers-of-buried-urban-rivers/400442/.7 Sea Level Rise Committee, “Guidance for Incorporating Sea-Level Rise into Capital Planning in San Francisco: Assessing Vulnerability, Risk, and Adaptation” June, 2014.8 Committee on Sea Level Rise in California, Oregon and Washington, “Sea-Level Rise for the Coasts of California, Oregon and Washington: Past Present and Future” National Research Council, http://ssi.ucsd.edu/scc/images/NRC%20SL%20rise%20W%20coast%20USA%2012.pdf 9 “Living with Sea-Level Rise in the Bay Area” Staff Report for the Bay Conservation Development Corporation. October 2011.10 NOAA National Center for Environmental Information Station ID CHCND:USWOOO23227211 Dettinger, Michael “Climate Change, Extreme Precipitation, and Atmospheric Rivers” Department of Water Resources Workgroup, January 2012.12 Dettinger, Michael “Fifty-Two Years of ‘Pineapple Express’ Storms Across the West Coast of North America” California Energy Commission Public Interest Energy Research Program, December 2004. 13 Dettinger, Michael “Climate Change, Atmospheric Rivers, and Floods in California- A multimodel analysis of storm frequency and magnitude changes.” Journal of the American Water Resources Association, Volume 47 No. 3, June 2011. 14 Barmann, Jay. “Rainpocalypse 2014: Alcatraz Closed, Widespread Power Outages Persist, School’s Back on Tomorrow” SFist.com, December 11, 2014 http://sfist.com/2014/12/11/power-outage-downtown-san-francisco.php15 “311 Explorer” https://data.sfgov.org/City-Infrastructure/311-Explorer/wp99-j4wh16 Hung, Steven. Flooding at Fremont and Howard. 2014. Twitter: @SchwartzTV. Ian Schwartz on Twitter. Web. <://twitter.com/SchwartzTv/status/543079132976803840/photo/1> 17 Behar, David “Incorporating Sea Level Rise into Capital Planning: Overview of Draft Guidance” Capital Planning Committee, City and County of San Francisco. May 2014. 18 NOAA, National Ocean Service “What are El Niño and La Nino” http://oceanservice.noaa.gov/facts/ninonina.html19 Cai, Wenju et. al. “Increasing frequency of extreme El Niño events due to greenhouse warming” Nature Climate Change. January, 2014.20 Rosato, Joe Jr. “San Francisco in Early Stages of $1.2 Billion Plan to Upgrade Aging Sewer System” NBC Bay Area, September 2014. 21 Kessler, Rebecca “Stormwater Strategies: Cities Prepare Aging Infrastructure for Climate Change” Environmental Health Perspectives, December 2011. 22 Wastewater Enterprise Staff “Sewer System Improvement Program Report” SFPUC Commission, July 27 2010. http://sfwater.org/modules/showdocument.aspx?documentid=98423 MTA Daily Ridership Data, 12/1124 San Francisco Planning Department. “Pipeline Report”. 2014, http://www.sf-planning.org/index.aspx?page=169125 Senick, Jennifer “The role of buildings in climate adaptation: climate change preparedness in New Jersey” New Jersey Climate Adaptation Alliance. 2014. 26 Iqbal, Shahed et. al. “A review of disaster-related carbon monoxide poisoning: surveillance, epidemiology, and opportunities for prevention” American Journal of Public Health. 2012. 27 Kjellstrom, Tord “Climate change and health: impacts, vulnerability, adaptation, and mitigation” New South Whales Public Health Bulletin. February, 2009. 28 Wastewater Enterprise Staff “Sewer System Improvement Program Report” Draft Report for SFPUC Commission Review. 29 Ahiamblame, Laurent M. “Effectiveness of low impact development practices in two urbanized watersheds: retrofitting with rain barrel/cistern and porous pavement” Journal of Environmental Management. April, 2013.30 United States Environmental Protection Agency “Water: Best Management Practices—Green Roofs” Accessed 10/27/2015 water.epa.gov31 McPhearson, Timon. “Urban Ecosystem Services for Resilience Planning and Management in New York City” Ambio. April, 2014.32 Zahmatkesh, Zahra et. al. “Low-Impact Development Practices to Mitigate Climate Change Effects on Urban Stormwater Runoff: Case Study of New York City” Journal of Irrigation and Drainage Engineering, June 2014. 33 Shepard, Christine C. et. al “The Protective Role of Coastal Marshes: A Systemic Review and Meta-Analysis” Public Library of Science. November, 2011.
Endnotes
Climate and Health Understanding the Risk: An Assessment of San Francisco’s Vulnerability to Flooding & Extreme Storms i
San Francisco Department of Public Health
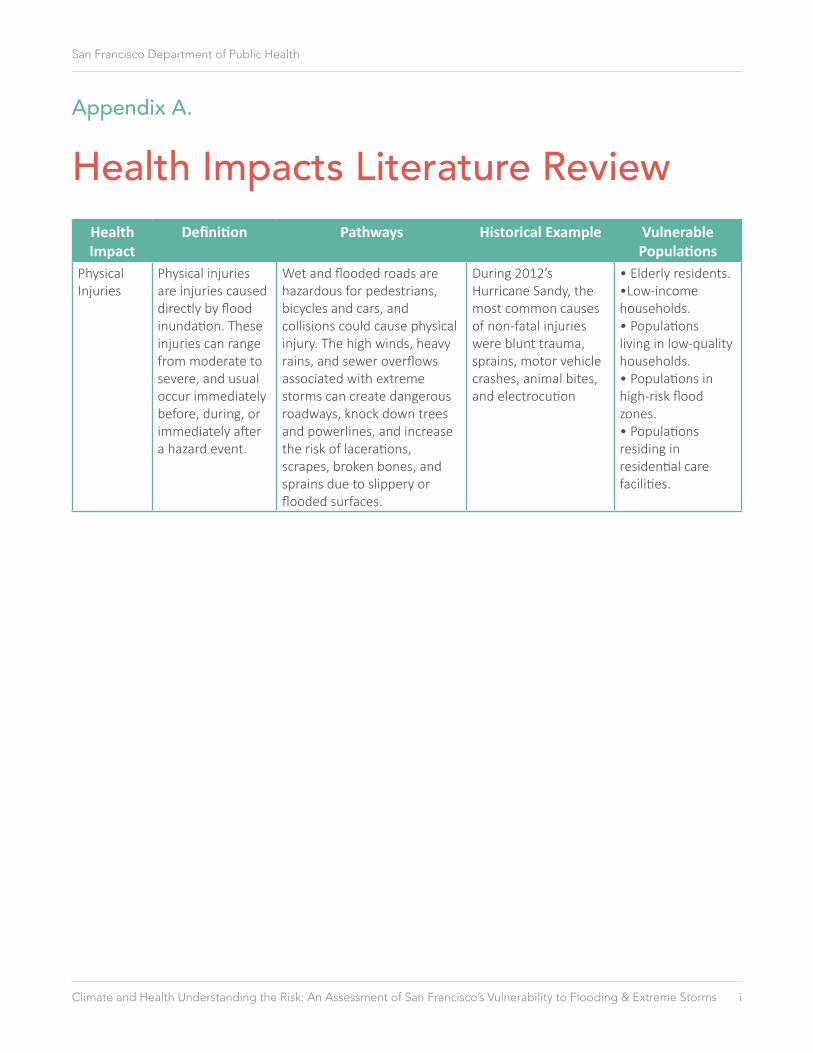
Health Impacts Literature ReviewHealth Impact
Definition Pathways Historical Example Vulnerable Populations
Physical Injuries
Physical injuries are injuries caused directly by flood inundation. These injuries can range from moderate to severe, and usual occur immediately before, during, or immediately after a hazard event.
Wet and flooded roads are hazardous for pedestrians, bicycles and cars, and collisions could cause physical injury. The high winds, heavy rains, and sewer overflows associated with extreme storms can create dangerous roadways, knock down trees and powerlines, and increase the risk of lacerations, scrapes, broken bones, and sprains due to slippery or flooded surfaces.
During 2012’s Hurricane Sandy, the most common causes of non-fatal injuries were blunt trauma, sprains, motor vehicle crashes, animal bites, and electrocution
• Elderly residents.•Low-income households.• Populations living in low-quality households.• Populations in high-risk flood zones.• Populations residing in residential care facilities.
Appendix A.
Climate and Health Understanding the Risk: An Assessment of San Francisco’s Vulnerability to Flooding & Extreme Storms ii
San Francisco Department of Public Health
Health Impact
Definition Pathways Historical Example Vulnerable Populations
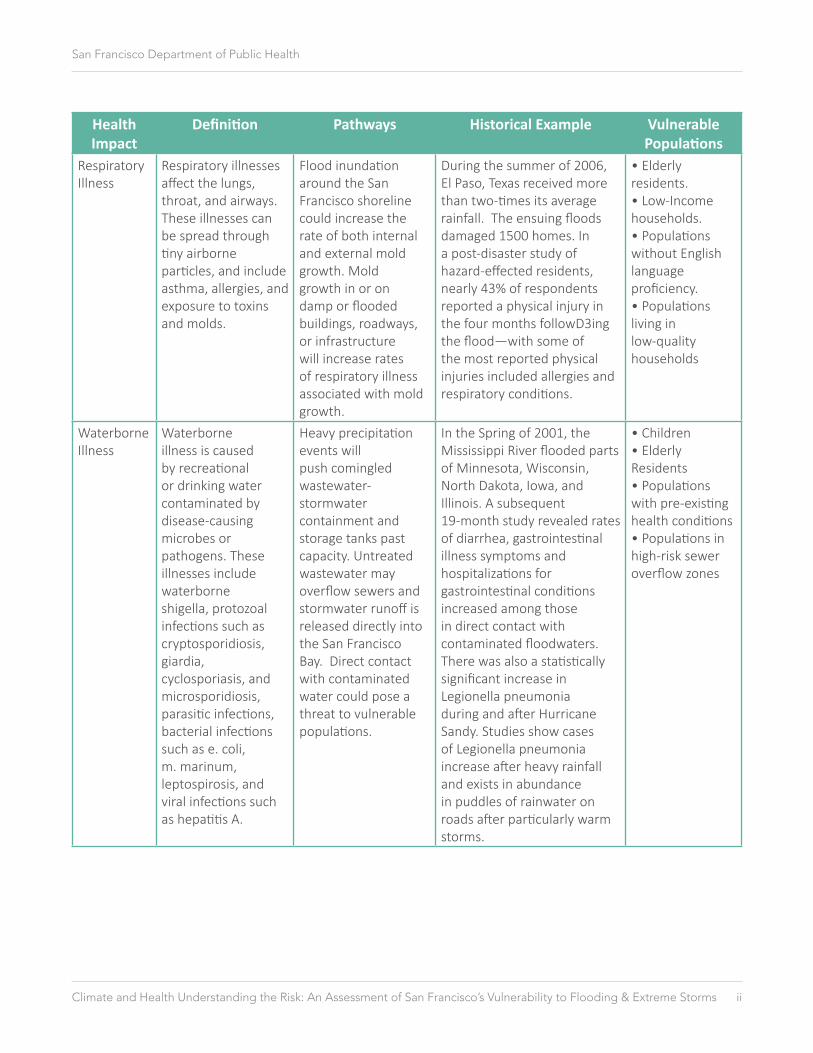
Respiratory Illness
Respiratory illnesses affect the lungs, throat, and airways. These illnesses can be spread through tiny airborne particles, and include asthma, allergies, and exposure to toxins and molds.
Flood inundation around the San Francisco shoreline could increase the rate of both internal and external mold growth. Mold growth in or on damp or flooded buildings, roadways, or infrastructure will increase rates of respiratory illness associated with mold growth.
During the summer of 2006, El Paso, Texas received more than two-times its average rainfall. The ensuing floods damaged 1500 homes. In a post-disaster study of hazard-effected residents, nearly 43% of respondents reported a physical injury in the four months followD3ing the flood—with some of the most reported physical injuries included allergies and respiratory conditions.
• Elderly residents.• Low-Income households.• Populations without English language proficiency.• Populations living in low-quality households
Waterborne Illness
Waterborne illness is caused by recreational or drinking water contaminated by disease-causing microbes or pathogens. These illnesses include waterborne shigella, protozoal infections such as cryptosporidiosis, giardia, cyclosporiasis, and microsporidiosis, parasitic infections, bacterial infections such as e. coli, m. marinum, leptospirosis, and viral infections such as hepatitis A.
Heavy precipitation events will push comingled wastewater-stormwater containment and storage tanks past capacity. Untreated wastewater may overflow sewers and stormwater runoff is released directly into the San Francisco Bay. Direct contact with contaminated water could pose a threat to vulnerable populations.
In the Spring of 2001, the Mississippi River flooded parts of Minnesota, Wisconsin, North Dakota, Iowa, and Illinois. A subsequent 19-month study revealed rates of diarrhea, gastrointestinal illness symptoms and hospitalizations for gastrointestinal conditions increased among those in direct contact with contaminated floodwaters. There was also a statistically significant increase in Legionella pneumonia during and after Hurricane Sandy. Studies show cases of Legionella pneumonia increase after heavy rainfall and exists in abundance in puddles of rainwater on roads after particularly warm storms.
• Children• Elderly Residents• Populations with pre-existing health conditions• Populations in high-risk sewer overflow zones
Climate and Health Understanding the Risk: An Assessment of San Francisco’s Vulnerability to Flooding & Extreme Storms iii
San Francisco Department of Public Health
Health Impact
Definition Pathways Historical Example
Vulnerable Populations
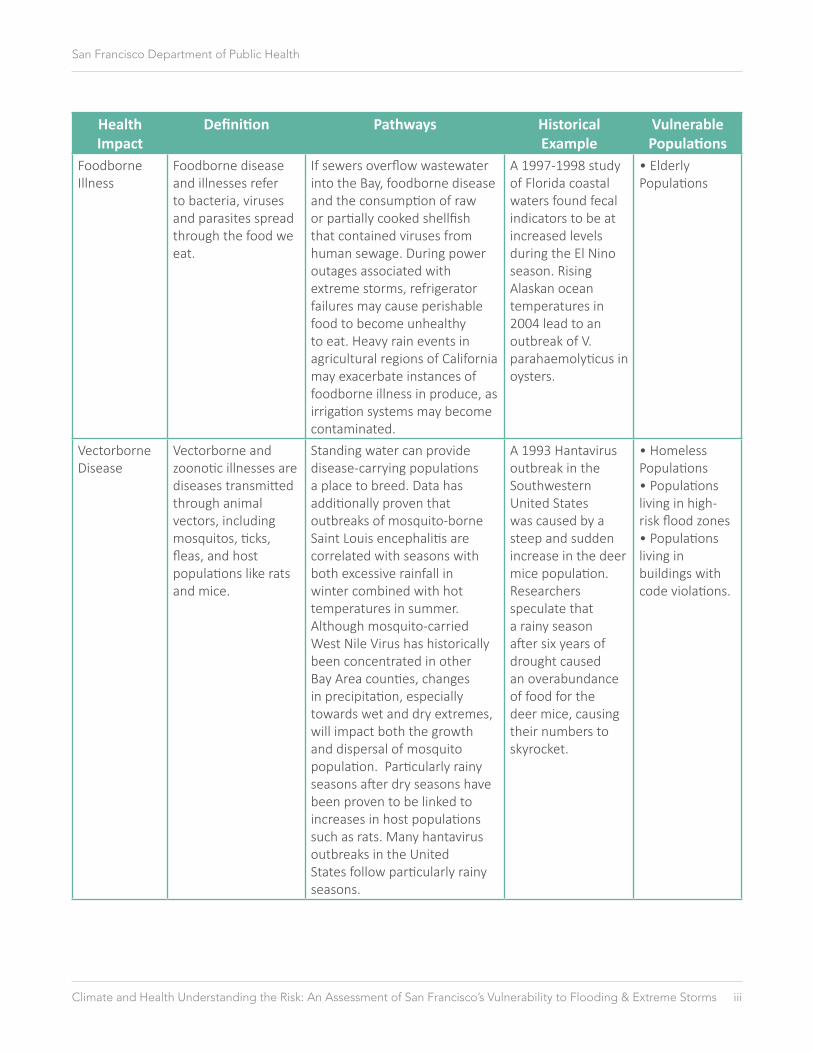
Foodborne Illness
Foodborne disease and illnesses refer to bacteria, viruses and parasites spread through the food we eat.
If sewers overflow wastewater into the Bay, foodborne disease and the consumption of raw or partially cooked shellfish that contained viruses from human sewage. During power outages associated with extreme storms, refrigerator failures may cause perishable food to become unhealthy to eat. Heavy rain events in agricultural regions of California may exacerbate instances of foodborne illness in produce, as irrigation systems may become contaminated.
A 1997-1998 study of Florida coastal waters found fecal indicators to be at increased levels during the El Nino season. Rising Alaskan ocean temperatures in 2004 lead to an outbreak of V. parahaemolyticus in oysters.
• Elderly Populations
Vectorborne Disease
Vectorborne and zoonotic illnesses are diseases transmitted through animal vectors, including mosquitos, ticks, fleas, and host populations like rats and mice.
Standing water can provide disease-carrying populations a place to breed. Data has additionally proven that outbreaks of mosquito-borne Saint Louis encephalitis are correlated with seasons with both excessive rainfall in winter combined with hot temperatures in summer. Although mosquito-carried West Nile Virus has historically been concentrated in other Bay Area counties, changes in precipitation, especially towards wet and dry extremes, will impact both the growth and dispersal of mosquito population. Particularly rainy seasons after dry seasons have been proven to be linked to increases in host populations such as rats. Many hantavirus outbreaks in the United States follow particularly rainy seasons.
A 1993 Hantavirus outbreak in the Southwestern United States was caused by a steep and sudden increase in the deer mice population. Researchers speculate that a rainy season after six years of drought caused an overabundance of food for the deer mice, causing their numbers to skyrocket.
• Homeless Populations• Populations living in high-risk flood zones• Populations living in buildings with code violations.
Climate and Health Understanding the Risk: An Assessment of San Francisco’s Vulnerability to Flooding & Extreme Storms iv
San Francisco Department of Public Health
Health Impact
Definition Pathways Historical Example Vulnerable Populations
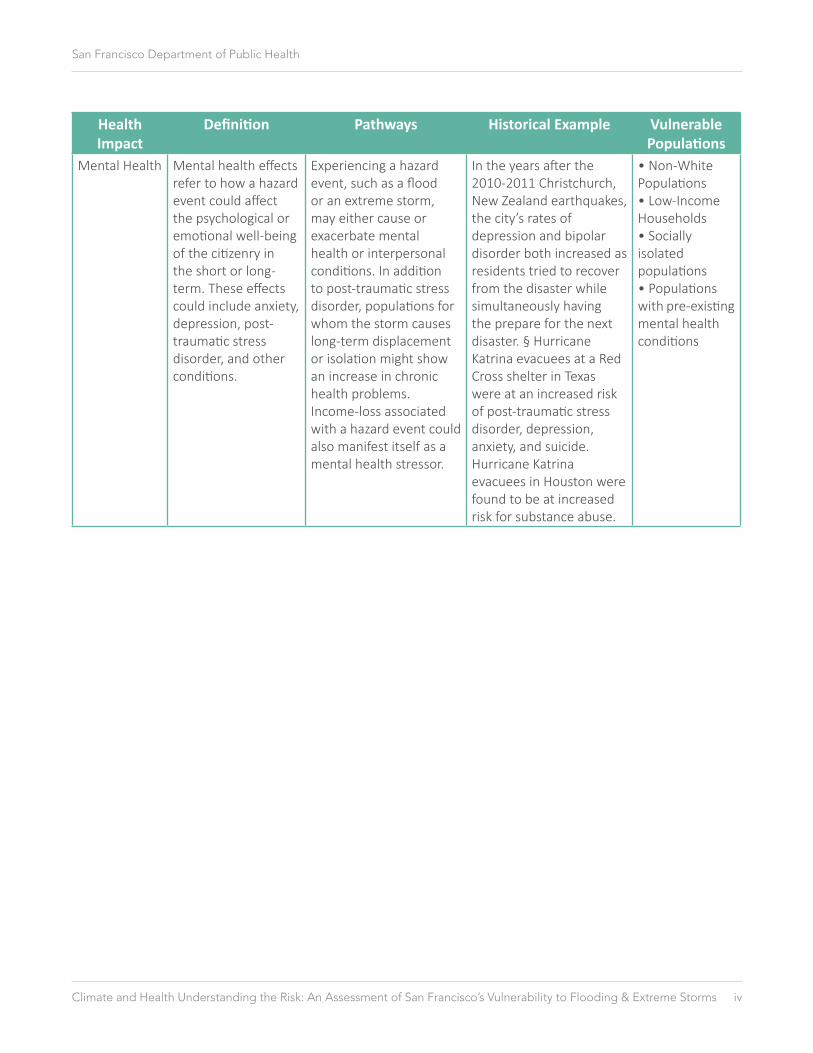
Mental Health Mental health effects refer to how a hazard event could affect the psychological or emotional well-being of the citizenry in the short or long-term. These effects could include anxiety, depression, post-traumatic stress disorder, and other conditions.
Experiencing a hazard event, such as a flood or an extreme storm, may either cause or exacerbate mental health or interpersonal conditions. In addition to post-traumatic stress disorder, populations for whom the storm causes long-term displacement or isolation might show an increase in chronic health problems. Income-loss associated with a hazard event could also manifest itself as a mental health stressor.
In the years after the 2010-2011 Christchurch, New Zealand earthquakes, the city’s rates of depression and bipolar disorder both increased as residents tried to recover from the disaster while simultaneously having the prepare for the next disaster. § Hurricane Katrina evacuees at a Red Cross shelter in Texas were at an increased risk of post-traumatic stress disorder, depression, anxiety, and suicide. Hurricane Katrina evacuees in Houston were found to be at increased risk for substance abuse.
• Non-White Populations• Low-Income Households• Socially isolated populations• Populations with pre-existing mental health conditions
Climate and Health Understanding the Risk: An Assessment of San Francisco’s Vulnerability to Flooding & Extreme Storms v
San Francisco Department of Public Health
Health Impact
Definition Pathways Historical Example
Vulnerable Populations
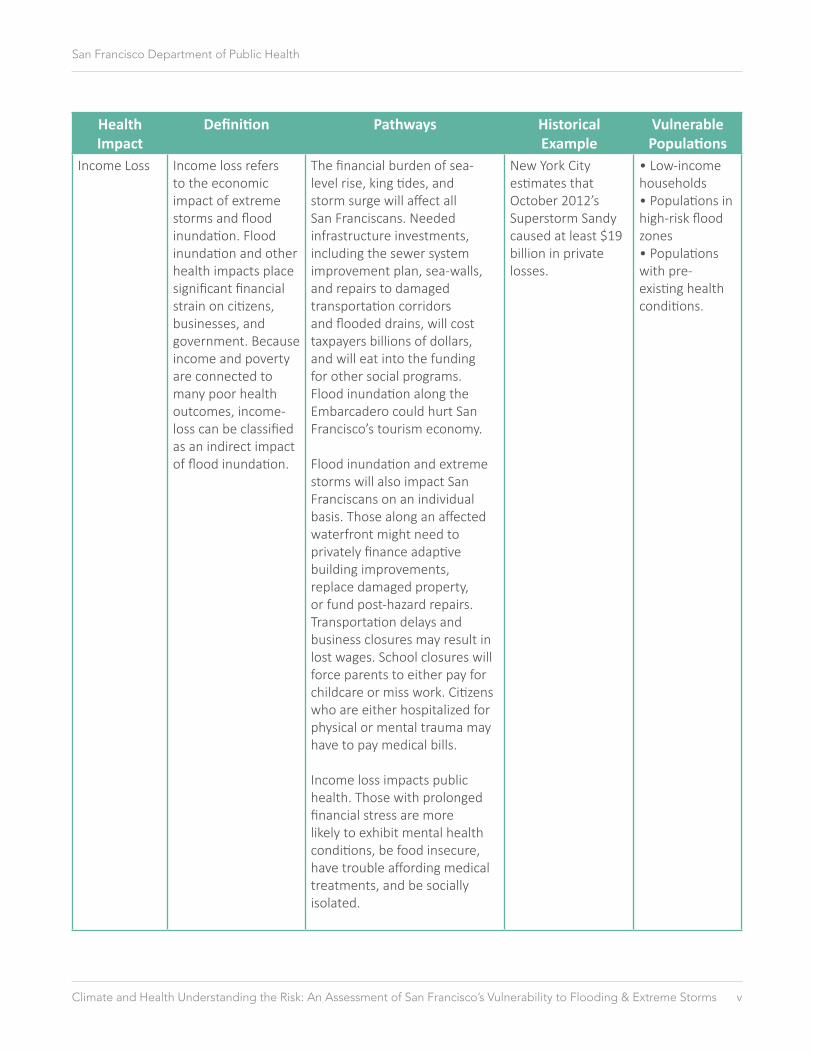
Income Loss Income loss refers to the economic impact of extreme storms and flood inundation. Flood inundation and other health impacts place significant financial strain on citizens, businesses, and government. Because income and poverty are connected to many poor health outcomes, income-loss can be classified as an indirect impact of flood inundation.
The financial burden of sea-level rise, king tides, and storm surge will affect all San Franciscans. Needed infrastructure investments, including the sewer system improvement plan, sea-walls, and repairs to damaged transportation corridors and flooded drains, will cost taxpayers billions of dollars, and will eat into the funding for other social programs. Flood inundation along the Embarcadero could hurt San Francisco’s tourism economy.
Flood inundation and extreme storms will also impact San Franciscans on an individual basis. Those along an affected waterfront might need to privately finance adaptive building improvements, replace damaged property, or fund post-hazard repairs. Transportation delays and business closures may result in lost wages. School closures will force parents to either pay for childcare or miss work. Citizens who are either hospitalized for physical or mental trauma may have to pay medical bills.
Income loss impacts public health. Those with prolonged financial stress are more likely to exhibit mental health conditions, be food insecure, have trouble affording medical treatments, and be socially isolated.
New York City estimates that October 2012’s Superstorm Sandy caused at least $19 billion in private losses.
• Low-income households• Populations in high-risk flood zones• Populations with pre-existing health conditions.
Climate and Health Understanding the Risk: An Assessment of San Francisco’s Vulnerability to Flooding & Extreme Storms vi
San Francisco Department of Public Health
Health Impact
Definition Pathways Historical Example
Vulnerable Populations
Health Impacts of Power Outages
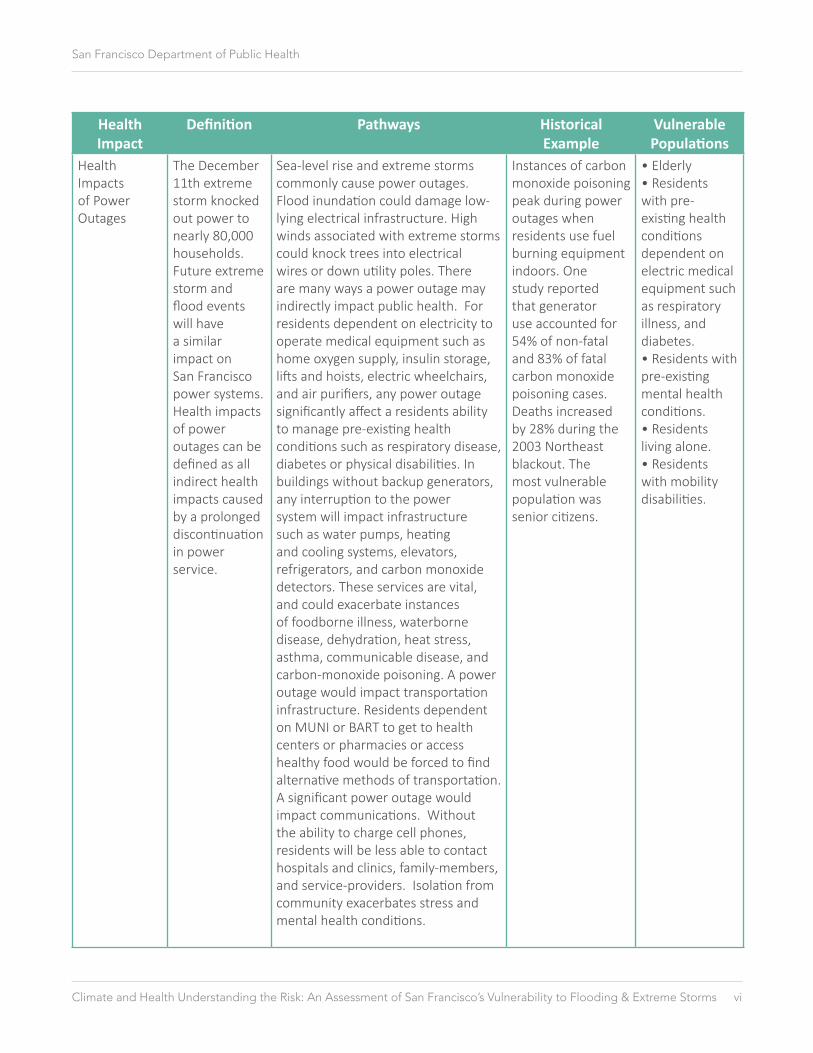
The December 11th extreme storm knocked out power to nearly 80,000 households. Future extreme storm and flood events will have a similar impact on San Francisco power systems. Health impacts of power outages can be defined as all indirect health impacts caused by a prolonged discontinuation in power service.
Sea-level rise and extreme storms commonly cause power outages. Flood inundation could damage low-lying electrical infrastructure. High winds associated with extreme storms could knock trees into electrical wires or down utility poles. There are many ways a power outage may indirectly impact public health. For residents dependent on electricity to operate medical equipment such as home oxygen supply, insulin storage, lifts and hoists, electric wheelchairs, and air purifiers, any power outage significantly affect a residents ability to manage pre-existing health conditions such as respiratory disease, diabetes or physical disabilities. In buildings without backup generators, any interruption to the power system will impact infrastructure such as water pumps, heating and cooling systems, elevators, refrigerators, and carbon monoxide detectors. These services are vital, and could exacerbate instances of foodborne illness, waterborne disease, dehydration, heat stress, asthma, communicable disease, and carbon-monoxide poisoning. A power outage would impact transportation infrastructure. Residents dependent on MUNI or BART to get to health centers or pharmacies or access healthy food would be forced to find alternative methods of transportation. A significant power outage would impact communications. Without the ability to charge cell phones, residents will be less able to contact hospitals and clinics, family-members, and service-providers. Isolation from community exacerbates stress and mental health conditions.
Instances of carbon monoxide poisoning peak during power outages when residents use fuel burning equipment indoors. One study reported that generator use accounted for 54% of non-fatal and 83% of fatal carbon monoxide poisoning cases. Deaths increased by 28% during the 2003 Northeast blackout. The most vulnerable population was senior citizens.
• Elderly • Residents with pre-existing health conditions dependent on electric medical equipment such as respiratory illness, and diabetes.• Residents with pre-existing mental health conditions.• Residents living alone.• Residents with mobility disabilities.

Physical Injuries
Greenough, Gregg et. al. “The Potential Impacts of Climate Variability and Change on Health Impacts of Extreme Weather Events in the United States” Environmental Health Perspectives vol. 109. May 2001.
Jung, Soyoung, Xia Quin and David A. Noyce. “Rainfall effect on single-vehicle crash severities using polychotomous response models.” Accident Analysis and Prevention, April 2009.
Lane, Kathryn et. al “Health Effects of Coastal Storms and Flooding in Urban Areas: A Review and Vulnerability Assessment” New York City Department of Health and Mental Hygiene, April 4 2013.
SWOV Fact Sheet: The Influence of Weather of Road Safety.” Institute for Road Safety Research. Netherlands. February 2012.
Respiratory Illness
Barnes, Charles S. et. al. “Climate Change and Our Environment: The Effect on Respiratory and Allergic Disease.” Journal of Allergy and Clinical Immunology Practice. March 2013.
“Collins, Timothy W. et. al. “Hispanic Health Disparities After a Flood Disaster: Results of a Population-Based Survey of Individuals Experiencing Home Site Damage in El Pase (Texas, USA)” Journal of Immigrant and Minority Health. 2013.
D’Amato, Gennaro et. al. “Climate change, air pollution and extreme events leading to increasing prevalence of allergic respiratory diseases” Multidisciplinary Respiratory Medicine. 2013.
Gunnbjornsddottir, M. et. al “Prevalence and incidence of respiratory symptoms in relation to indoor dampness: the RHINE study.” RHINE Study Group, Department of Medical Sciences: Respiratory Medicine and Allergology, Uppsala Sweden. December 2005.
Rein, Colleen E. and Janet L. Gamble. “Aeroallergens, Allergic Disease, and Climate Change: Impacts and Adaptation” Ecohealth. November 2009.
Respiratory Diseases” Healthy People, Office of Disease Prevention and Promotion. http://www.healthypeople.gov/2020/topics-objectives/topic/respiratory-diseases
Waterborne Illness
Garcia-Vidal, Carolina et. al. “Rainfall is a Risk Factor for Sporadic Cases of Legionella pneumophila Pneumonia” Public Library of Science. April 16, 2013.
Green, Sharon K. et. al. “Assessment of Reportable Disease Incidence After Hurricane Sandy, New York City 2012.” Bureau of Communicable Disease and Bureau of Epidemiology Services, New York City Department of Health and Mental Hygiene. October 2013.
Pond, Kathy. “Water Recreation and Disease: Plausibility of Associated Infections, Acute Effects, Sequelae and Morality” World Health Organization. 2005.
Wade, Timothy J. et. al. “Did a Severe Flood in the Midwest Cause an Increase in the Incidence of Gastrointestinal Symptoms?” American Journal of Epidemiology. 2004.
Foodborne Illness
McLaughlin, Joseph B. et. Al “Outbreak of Vibrio parahaemolyticus Gastroenteritis Associated with Alaskan Oysters” New England Journal of Medicine. 2005.
Works Cited: Health Impacts Literature Review
Rose, Joan B. et. al. “Climate Variability and Change in the United States: Potential Impacts on Waterborne and Foodborne Diseases Caused by Microbial Agents” Environment Health Perspectives, May 2001
Vectorborne Disease
http://westnile.ca.gov/
Center for Disease Control. Tracking a Mystery Disease: The Detailed Story of Hantavirus Pulmonary Syndrome. http://www.cdc.gov/hantavirus/hps/history.html
Elbers, A.R.W. et. al. “Mosquitos and Culicoides biting midges: vector range and the influence of climate change” Department of Epidemiology, Crisis Organisation and Diagnostics, Wageningen University Netherlands. 2015.
Githeko, Andrew K. “Climate change and vectorborne diseases: A regional analysis.” Bulletin of the World Health Organization. 2000.
Mills, James M. et. al. “Potential Influence of Climate Change on Vectorborne and Zoonotic Diseases: A Review and Proposed Research Plan” Environmental Health Perspectives. November 2010.
Reisen, William K. et. al. “Impact of climate variation on mosquito abundance in California” Center for Vectorborne Diseases, University of California at Davis. December 2007.
Reiter, Paul. “Global warming and malaria: knowing the horse before hitching the cart.” Malaria Journal vol. 7. 2008.
Mental Health
Galea, Sando et. al. “The Epidemiology of Post-Traumatic Stress Disorder after Disasters” Oxford Epidemiologic Review. December 2004.
Moyer, Christine S. “Doctors confront burst of mental health problems after disasters.” American Medical News. June 6 2011.
Spittlehouse, JK et al. Ongoing adverse mental health impact of the earthquake sequence in Christchurch, New Zealand. Australia New Zealand Journal of Psychiatry. March 2014.
Income Loss
Phipps, Shelley. “The Impact of Poverty on Health: A Scan of Research Literature”. Canadian Population Health Institute. June 2003.
Wei, Dan and Samrat Chatterjee “Economic Impact of Sea Level Rise to the City of Los Angeles” Price School of Public Policy Center for Risk and Economic Analysis of Terrorism Events. January 2013.
Power Outages
Anderson, Brook G. and Michelle L. Bell. “Lights out: Impact of the August 2003 power outage on mortality in New York, NY” Epidemiology Journal. March 2012.
Klinger, Chaamala et. al. “Power Outages, Extreme Events and Health: a Systematic Review of the Literature from 2011-2012” Public Library of Science. January 2 2014.
Manuel, John. “The Long Road to Recovery: Environmental Health Impacts of Hurricane Sandy” Environmental Health Perspectives. May 2013
Climate and Health Understanding the Risk: An Assessment of San Francisco’s Vulnerability to Flooding & Extreme Storms ix
San Francisco Department of Public Health
Vulnerable Populations Literature ReviewFactor Flood
Vulnerability Variable
Data Collected
Impact on Flood Vulnerability
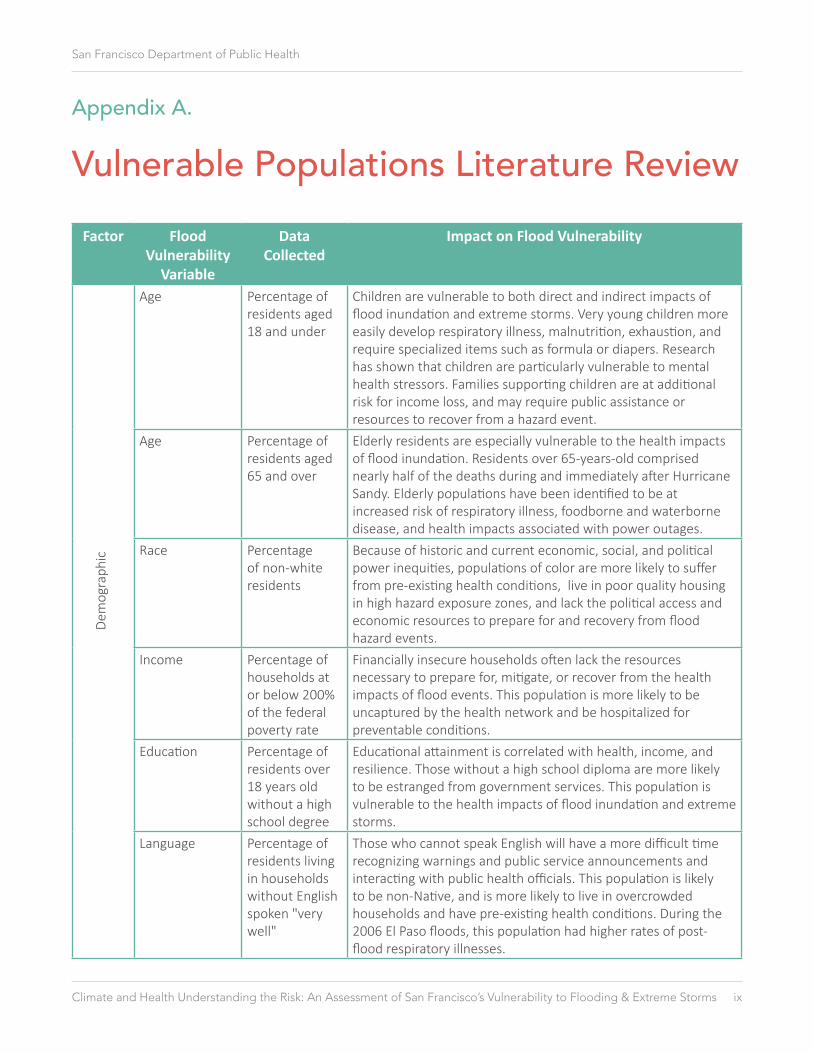
Age Percentage of residents aged 18 and under
Children are vulnerable to both direct and indirect impacts of flood inundation and extreme storms. Very young children more easily develop respiratory illness, malnutrition, exhaustion, and require specialized items such as formula or diapers. Research has shown that children are particularly vulnerable to mental health stressors. Families supporting children are at additional risk for income loss, and may require public assistance or resources to recover from a hazard event.
Age Percentage of residents aged 65 and over
Elderly residents are especially vulnerable to the health impacts of flood inundation. Residents over 65-years-old comprised nearly half of the deaths during and immediately after Hurricane Sandy. Elderly populations have been identified to be at increased risk of respiratory illness, foodborne and waterborne disease, and health impacts associated with power outages.
Race Percentage of non-white residents
Because of historic and current economic, social, and political power inequities, populations of color are more likely to suffer from pre-existing health conditions, live in poor quality housing in high hazard exposure zones, and lack the political access and economic resources to prepare for and recovery from flood hazard events.
Income Percentage of households at or below 200% of the federal poverty rate
Financially insecure households often lack the resources necessary to prepare for, mitigate, or recover from the health impacts of flood events. This population is more likely to be uncaptured by the health network and be hospitalized for preventable conditions.
Education Percentage of residents over 18 years old without a high school degree
Educational attainment is correlated with health, income, and resilience. Those without a high school diploma are more likely to be estranged from government services. This population is vulnerable to the health impacts of flood inundation and extreme storms.
Language Percentage of residents living in households without English spoken "very well"
Those who cannot speak English will have a more difficult time recognizing warnings and public service announcements and interacting with public health officials. This population is likely to be non-Native, and is more likely to live in overcrowded households and have pre-existing health conditions. During the 2006 El Paso floods, this population had higher rates of post-flood respiratory illnesses.
Appendix A.D
emog
raph
ic
Climate and Health Understanding the Risk: An Assessment of San Francisco’s Vulnerability to Flooding & Extreme Storms x
San Francisco Department of Public Health
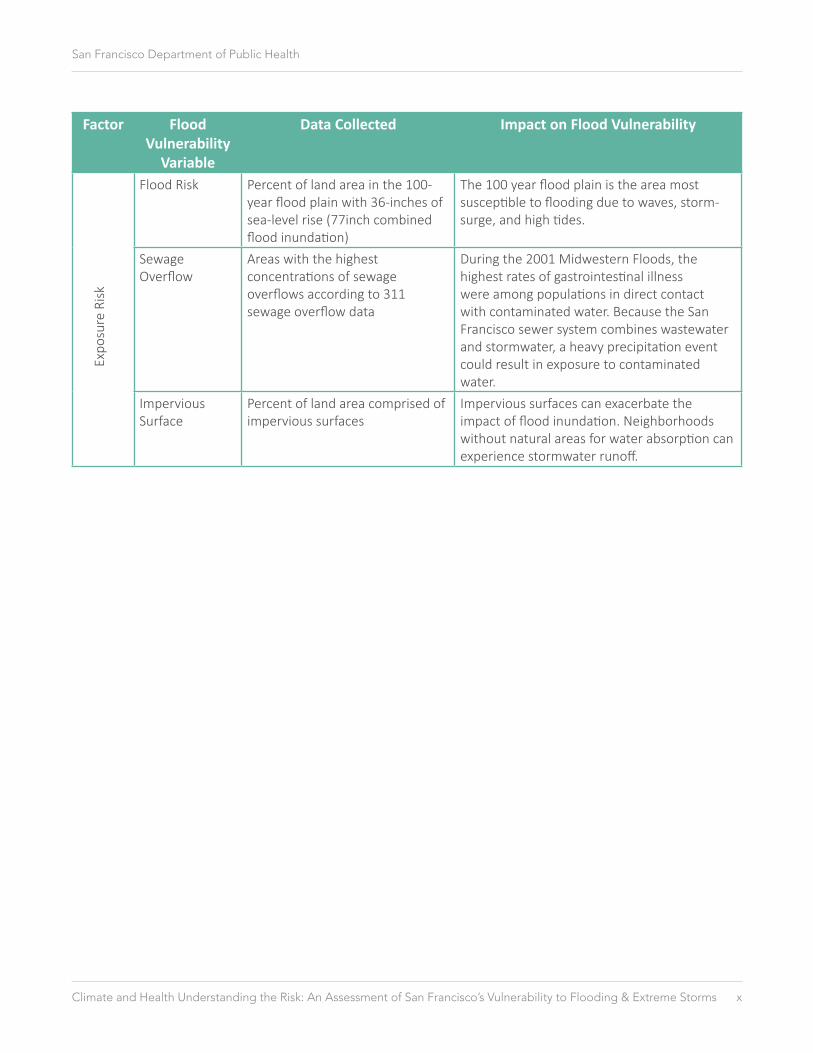
Factor Flood Vulnerability
Variable
Data Collected Impact on Flood Vulnerability
Flood Risk Percent of land area in the 100-year flood plain with 36-inches of sea-level rise (77inch combined flood inundation)
The 100 year flood plain is the area most susceptible to flooding due to waves, storm-surge, and high tides.
Sewage Overflow
Areas with the highest concentrations of sewage overflows according to 311 sewage overflow data
During the 2001 Midwestern Floods, the highest rates of gastrointestinal illness were among populations in direct contact with contaminated water. Because the San Francisco sewer system combines wastewater and stormwater, a heavy precipitation event could result in exposure to contaminated water.
Impervious Surface
Percent of land area comprised of impervious surfaces
Impervious surfaces can exacerbate the impact of flood inundation. Neighborhoods without natural areas for water absorption can experience stormwater runoff.
Expo
sure
Ris
k
Climate and Health Understanding the Risk: An Assessment of San Francisco’s Vulnerability to Flooding & Extreme Storms xi
San Francisco Department of Public Health
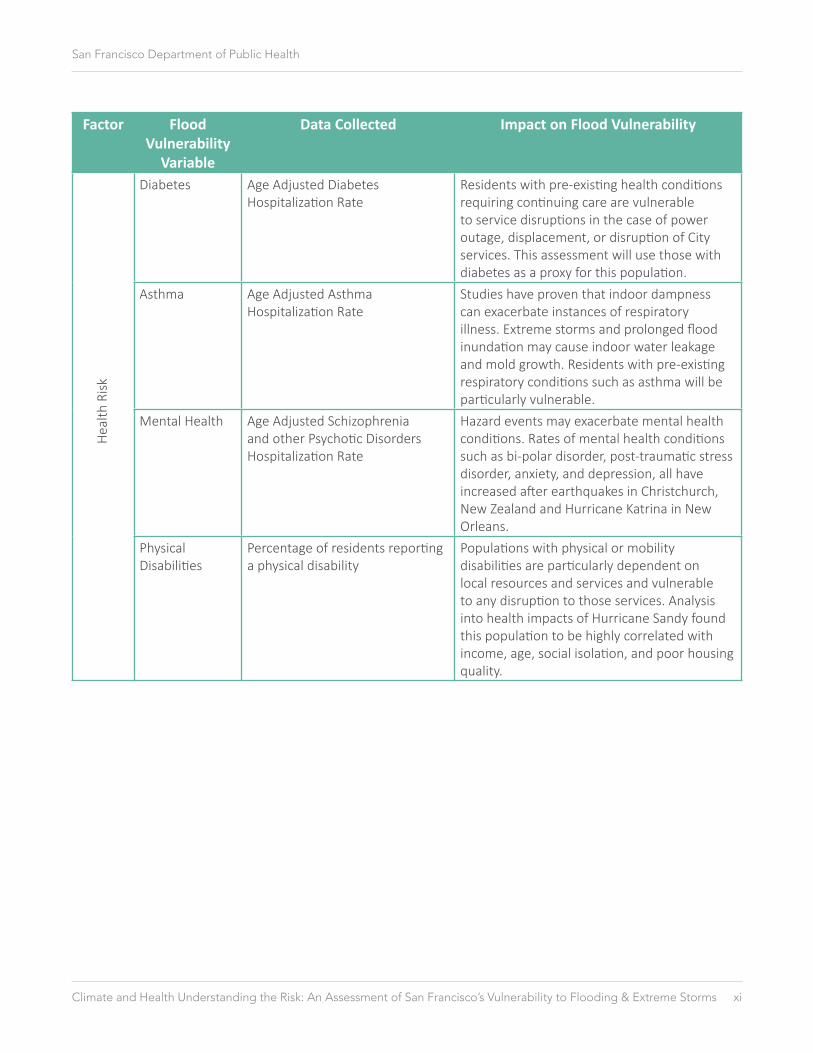
Factor Flood Vulnerability
Variable
Data Collected Impact on Flood Vulnerability
Diabetes Age Adjusted Diabetes Hospitalization Rate
Residents with pre-existing health conditions requiring continuing care are vulnerable to service disruptions in the case of power outage, displacement, or disruption of City services. This assessment will use those with diabetes as a proxy for this population.
Asthma Age Adjusted Asthma Hospitalization Rate
Studies have proven that indoor dampness can exacerbate instances of respiratory illness. Extreme storms and prolonged flood inundation may cause indoor water leakage and mold growth. Residents with pre-existing respiratory conditions such as asthma will be particularly vulnerable.
Mental Health Age Adjusted Schizophrenia and other Psychotic Disorders Hospitalization Rate
Hazard events may exacerbate mental health conditions. Rates of mental health conditions such as bi-polar disorder, post-traumatic stress disorder, anxiety, and depression, all have increased after earthquakes in Christchurch, New Zealand and Hurricane Katrina in New Orleans.
Physical Disabilities
Percentage of residents reporting a physical disability
Populations with physical or mobility disabilities are particularly dependent on local resources and services and vulnerable to any disruption to those services. Analysis into health impacts of Hurricane Sandy found this population to be highly correlated with income, age, social isolation, and poor housing quality.
Hea
lth R
isk
Climate and Health Understanding the Risk: An Assessment of San Francisco’s Vulnerability to Flooding & Extreme Storms xii
San Francisco Department of Public Health
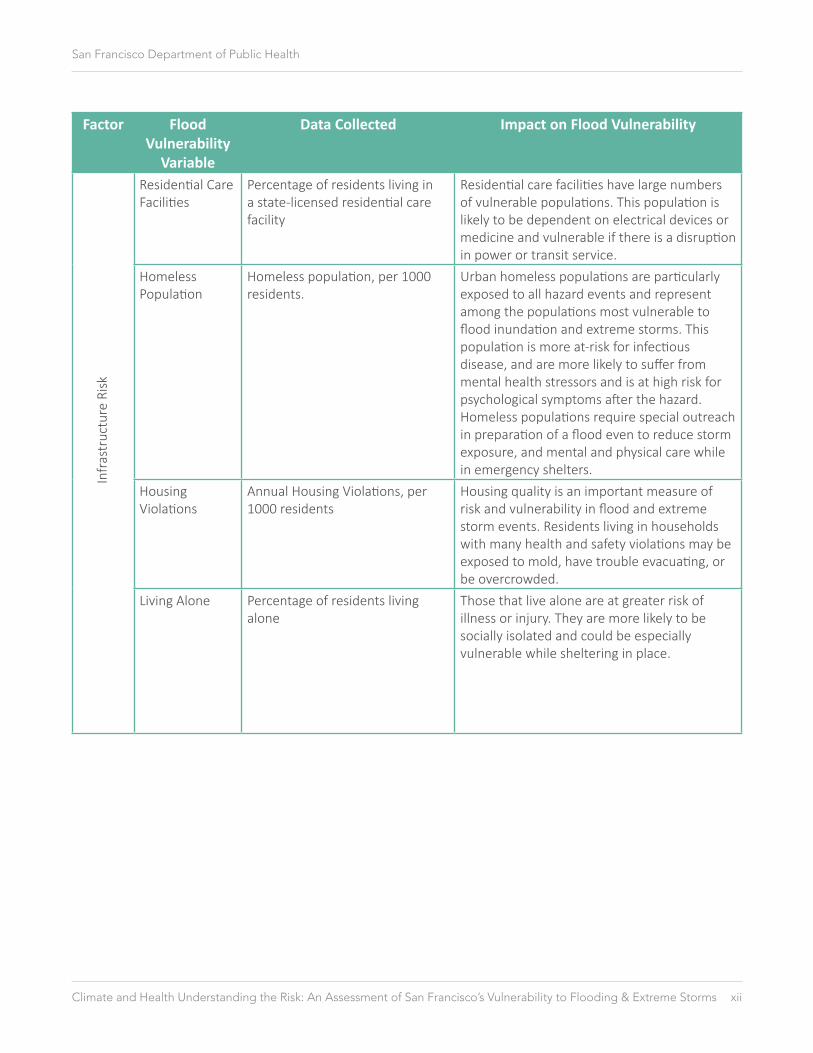
Factor Flood Vulnerability
Variable
Data Collected Impact on Flood Vulnerability
Residential Care Facilities
Percentage of residents living in a state-licensed residential care facility
Residential care facilities have large numbers of vulnerable populations. This population is likely to be dependent on electrical devices or medicine and vulnerable if there is a disruption in power or transit service.
Homeless Population
Homeless population, per 1000 residents.
Urban homeless populations are particularly exposed to all hazard events and represent among the populations most vulnerable to flood inundation and extreme storms. This population is more at-risk for infectious disease, and are more likely to suffer from mental health stressors and is at high risk for psychological symptoms after the hazard. Homeless populations require special outreach in preparation of a flood even to reduce storm exposure, and mental and physical care while in emergency shelters.
Housing Violations
Annual Housing Violations, per 1000 residents
Housing quality is an important measure of risk and vulnerability in flood and extreme storm events. Residents living in households with many health and safety violations may be exposed to mold, have trouble evacuating, or be overcrowded.
Living Alone Percentage of residents living alone
Those that live alone are at greater risk of illness or injury. They are more likely to be socially isolated and could be especially vulnerable while sheltering in place.
Infr
astr
uctu
re R
isk
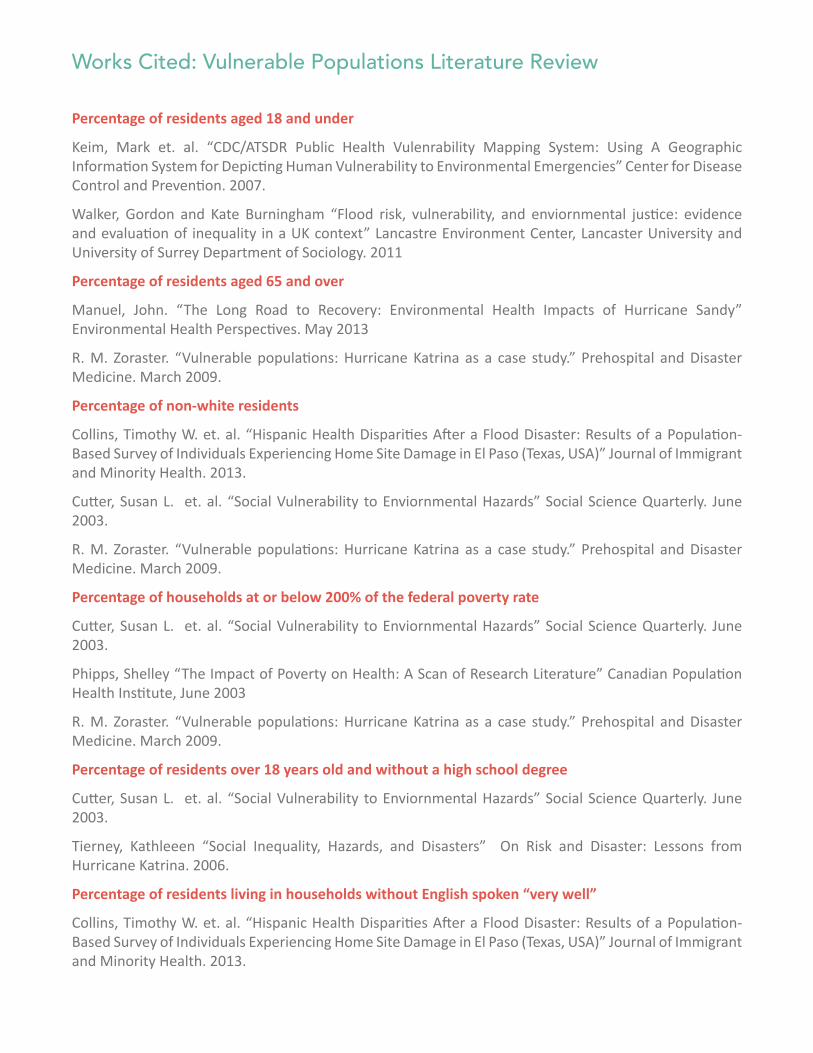
Percentage of residents aged 18 and under
Keim, Mark et. al. “CDC/ATSDR Public Health Vulenrability Mapping System: Using A Geographic Information System for Depicting Human Vulnerability to Environmental Emergencies” Center for Disease Control and Prevention. 2007.
Walker, Gordon and Kate Burningham “Flood risk, vulnerability, and enviornmental justice: evidence and evaluation of inequality in a UK context” Lancastre Environment Center, Lancaster University and University of Surrey Department of Sociology. 2011
Percentage of residents aged 65 and over
Manuel, John. “The Long Road to Recovery: Environmental Health Impacts of Hurricane Sandy” Environmental Health Perspectives. May 2013
R. M. Zoraster. “Vulnerable populations: Hurricane Katrina as a case study.” Prehospital and Disaster Medicine. March 2009.
Percentage of non-white residents
Collins, Timothy W. et. al. “Hispanic Health Disparities After a Flood Disaster: Results of a Population-Based Survey of Individuals Experiencing Home Site Damage in El Paso (Texas, USA)” Journal of Immigrant and Minority Health. 2013.
Cutter, Susan L. et. al. “Social Vulnerability to Enviornmental Hazards” Social Science Quarterly. June 2003.
R. M. Zoraster. “Vulnerable populations: Hurricane Katrina as a case study.” Prehospital and Disaster Medicine. March 2009.
Percentage of households at or below 200% of the federal poverty rate
Cutter, Susan L. et. al. “Social Vulnerability to Enviornmental Hazards” Social Science Quarterly. June 2003.
Phipps, Shelley “The Impact of Poverty on Health: A Scan of Research Literature” Canadian Population Health Institute, June 2003
R. M. Zoraster. “Vulnerable populations: Hurricane Katrina as a case study.” Prehospital and Disaster Medicine. March 2009.
Percentage of residents over 18 years old and without a high school degree
Cutter, Susan L. et. al. “Social Vulnerability to Enviornmental Hazards” Social Science Quarterly. June 2003.
Tierney, Kathleeen “Social Inequality, Hazards, and Disasters” On Risk and Disaster: Lessons from Hurricane Katrina. 2006.
Percentage of residents living in households without English spoken “very well”
Collins, Timothy W. et. al. “Hispanic Health Disparities After a Flood Disaster: Results of a Population-Based Survey of Individuals Experiencing Home Site Damage in El Paso (Texas, USA)” Journal of Immigrant and Minority Health. 2013.
Works Cited: Vulnerable Populations Literature Review
R. M. Zoraster. “Vulnerable populations: Hurricane Katrina as a case study.” Prehospital and Disaster Medicine. March 2009.
Percent of land area in the 100-year flood plain with 36-inches of sea level rise (77 inch flood inundation)
Committee on Sea Level Rise in California, Oregon and Washington, “Sea-Level Rise for the Coasts of California, Oregon and Washington: Past Present and Future” National Research Council, http://ssi.ucsd.edu/scc/images/NRC%20SL%20rise%20W%20coast%20USA%2012.pdf
Areas with the highest concentrations of sewage overflows according to 311 sewage overflow data
Sales-Ortells H and Medema G “Screening-level microbial risk assessment of urban water locations: a tool for prioritizaiton” Environmental Science Technology. August 2014.
Wade, Timothy J. et. al. “Did a Severe Flood in the Midwest Cause an Increase in the Incidence of Gastrointestinal Symptoms?” American Journal of Epidemiology. 2004.
Percent of land area comprised of impervious surfaces
Arnold, Chester L. and C. James Gibbons “Impervious Surface Coverage: The Emergency of a Key Environmental Indicator” APA Journal. 1996.
Brody, S.D. and S. Zahran “Examining the impact of the built enviornment of flood losses in Texas” WIT Transactions on Ecology and the Environment. 2007.
Age-adjusted diabetes hospitalization rate
Manuel, John. “The Long Road to Recovery: Environmental Health Impacts of Hurricane Sandy” Environmental Health Perspectives. May 2013
R. M. Zoraster. “Vulnerable populations: Hurricane Katrina as a case study.” Prehospital and Disaster Medicine. March 2009.
Age-adjusted asthma hospitalization rate
Davidson, A Craig et. Al. “A major outbreak of asthma associated with a thunderstorm: experience of accident and emergency departments and patients’ characteristics” Thames Regions Accident and Emergency Trainees Association. 1996.
Gunnbjornsddottir, M. et. al “Prevalence and incidence of respiratory symptoms in relation to indoor dampness: the RHINE study.” RHINE Study Group, Department of Medical Sciences: Respiratory Medicine and Allergology, Uppsala Sweden. December 2005.
Institute of Medicine. Committee on the Assessment of Asthma and Indoor Air. “Clearing the Air: Asthma and Indoor Air Exposures” National Academy of Sciences; 2000.
Norbäck D et. Al. “Asthmatic symptoms and volatile organic compounds, formaldehyde, and carbon dioxide in dwellings” Occupational and Environmental Medicine. 1995.
Rein, Colleen E. and Janet L. Gamble. “Aeroallergens, Allergic Disease, and Climate Change: Impacts and Adaptation” Ecohealth. November 2009.
Age-adjusted schizophrenia and other psychotic disorders hospitalization rate
Galea, Sando et. al. “The Epidemiology of Post-Traumatic Stress Disorder after Disasters” Oxford Epidemiologic Review. December 2004.
Lane, Kathryn et. al “Health Effects of Coastal Storms and Flooding in Urban Areas: A Review and Vulnerability Assessment” New York City Department of Health and Mental Hygiene, April 4 2013.
Spittlehouse, JK et al. Ongoing adverse mental health impact of the earthquake sequence in Christchurch, New Zealand. Australia New Zealand Journal of Psychiatry. March 2014.
Percentage of residents reporting a physical disability
Cutter, Susan L. et. al. “Social Vulnerability to Enviornmental Hazards” Social Science Quarterly. June 2003.
Lane, Kathryn et. al “Health Effects of Coastal Storms and Flooding in Urban Areas: A Review and Vulnerability Assessment” New York City Department of Health and Mental Hygiene, April 4 2013.
Percentage of residents living in a state-licensed residential care facility
Klinger, Chaamala et. al. “Power Outages, Extreme Events and Health: a Systematic Review of the Literature from 2011-2012” Public Library of Science. January 2 2014.
Homeless population, per 1000 residents
Ramin, Brodie and Tominslav Svoboda “Health of the Homeless and Climate Change” Journal of Urban Health. July, 2009.
Annual housing violations, per 1000 residents
Flanagan, Barry E. et. al. “A Social Vulnerability Index for Disaster Management” Journal of Homeland Security and Management. 2011.
Gunnbjornsddottir, M. et. al “Prevalence and incidence of respiratory symptoms in relation to indoor dampness: the RHINE study.” RHINE Study Group, Department of Medical Sciences: Respiratory Medicine and Allergology, Uppsala Sweden. December 2005.
Institute of Medicine. Committee on the Assessment of Asthma and Indoor Air. “Clearing the Air: Asthma and Indoor Air Exposures” National Academy of Sciences; 2000.
Percentage of residents living alone
Manuel, John. “The Long Road to Recovery: Environmental Health Impacts of Hurricane Sandy” Environmental Health Perspectives. May 2013