an assessment of the agricultural joint sector review … · joint sector review assessment...
TRANSCRIPT
JOINT SECTOR REVIEW ASSESSMENTAdvancing Mutual Accountability through Comprehensive, Inclusive, and Technically Robust Review and Dialogue
MOZAMBIQUE
September 2014
1
ACKNOWLEDGMENTS
We owe gratitude to the African Union Commission for political guidance; to the International Food Policy Research Institute (IFPRI), the International Water Management Institute for Southern Africa (IWMI–SA), and the Strategic Analysis and Knowledge Support System for their intellectual and technical guidance; and to the Ministry of Agriculture (MINAG) in Mozambique and ActionAid, for facilitating the review process.
Acknowledgments are also due to the MINAG staff for its unwavering support while during this report’s preparation. Director of Economy Raymundo Matule, Deputy Director Lucia Luciano, Luis Sitoe, and Angela Faria played pivotal roles in this process. We also want to thank the analytical work by the Regional Strategic Analysis Knowledge Support System for Southern Africa (ReSAKKS–SA), IFPRI, and the Monitoring African Food and Agricultural Policies program of the Food and Agriculture Organization of the United Nations. Without these analytical efforts, this work would not have been possible. Finally, we thank every institution that contributed to the work, and all the people who did so as well.
The following people deserve special recognition for their outstanding contribution to the process: Dr. Greenwell Matchaya (ReSAKSS-SA Coordinator and Economist at IWMI]); Mr. Helder Gêmo (IWMI-SA); Mr. Sibusiso Nhlengethwa (IWMI-SA); Ms. Sofia Manussa (MINAG); Dr. Rafael Uaene (Michigan State University); Mr. Benedicto Murambire and Ms. Marcia Cossa (both of ActionAid); Dr. Calisto Bias (Institute of Agricultural Research of Mozambique); and Dr. Todd Benson and Dr. Tewodaj Mogues (both of IFPRI). We are grateful to everyone who contributed to this work.

2
TABLE OF CONTENTS
Acknowledgments .............................................................................................................................1
Table of Contents ...............................................................................................................................2
List of Tables ......................................................................................................................................3
List of Figures .....................................................................................................................................4
Acronyms ........................................................................................................................................5
Executive Summary ............................................................................................................................7
1. Introduction ...............................................................................................................................9
1.1. Mutual Accountability .................................................................................................................... 9
1.2. Analytical Report for Agricultural Joint Sector Reviews .............................................................. 10
1.3. Mozambique Agricultural JSR Analytical Report ......................................................................... 11
2. Status and quality of the JSR Process in Mozambique ................................................................ 12
3. Policy Review ............................................................................................................................ 16
3.1. Inventory of Existing and Emerging Policies ................................................................................ 16
3.2. Agricultural Policy Framework of the Government of Mozambique .......................................... 17
3.2.1. Strategic Plan for Agricultural Sector Development (PEDSA) ............................................ 18
3.2.2. National Investment Plan for the Agricultural Sector (PNISA) ........................................... 18
3.2.3. New Alliance as a Supporting Tool for the Implementation of PEDSA and PNISA ............ 20
3.3. Consistency of Agricultural Policy ................................................................................................ 21
3.4. Meeting Policy Commitment under the New Alliance Cooperation Framework for Mozambique ................................................................................................................................ 21
3.5. Adequacy of Policy Processes, Policy Coverage, and Implementation ........................................ 24
4. Institutional Review .................................................................................................................. 25
4.1. Institutional Landscape of PNISA ................................................................................................. 25
4.1.1. Ministry of Agriculture and Other State Actors ................................................................ 25
4.1.2. International Development Partners and Their Coordination.......................................... 26
4.1.3. Nonstate Actors in Agricultural Development .................................................................. 26
4.1.4. Policy Research Institutions .............................................................................................. 27
4.2. Strengthening Institutional Implementation Capacity ................................................................ 28
5. Review of Key Financial Commitments ...................................................................................... 29
5.1. Government—Agricultural Public-Sector Financing .................................................................... 29
5.1.1. Budget Trends ................................................................................................................... 31

3
5.2. Commitments of Nonstate Actors ............................................................................................... 33
5.3. Financial Commitments of Mozambique’s Development Partners ............................................. 34
5.4. Conclusions .................................................................................................................................. 36
6. Agricultural Sector Performance ................................................................................................ 37
6.1. Introduction ................................................................................................................................. 37
6.2. Structure of the Mozambique Agricultural Sector....................................................................... 37
6.3. Performance of the Agricultural Sector ....................................................................................... 38
6.4. Assessing Agricultural Development Achievements under PNISA .............................................. 42
6.4.1. SWOT Analysis .................................................................................................................... 42
6.4.2. CAADP targets for Agricultural Development .................................................................... 45
6.4.3. Land and Labor Productivity in Agriculture ....................................................................... 50
6.4.4. Agricultural Trade Performance ......................................................................................... 51
6.4.5. Development Results ......................................................................................................... 53
7. Joint Sector Review Conclusions and Lessons ............................................................................. 57
7.1. Action Steps ................................................................................................................................. 57
References ...................................................................................................................................... 58
Appendix: Agricultural performance baseline indicators ................................................................... 61
LIST OF TABLES
Table 2.1: Timeline of events post-Dakar Agricultural Policy Learning and Exchange event ..................... 15
Table 3.1: Progress on government policy commitments under the New Alliance
Cooperation Framework ............................................................................................................................. 22
Table 3.2: Summary of assessments of the policy environment within which PNISA is being
implemented in Mozambique .................................................................................................................... 24
Table 5.1: Total public expenditure budgeted and executed, nominal and real, 2009–2014
(thousands of meticals) ............................................................................................................................... 32
Table 5.2: Financial commitments of the development partners of Mozambique under
PNISA and the New Alliance Cooperation Framework (thousands of US dollars) ...................................... 34
Table 6.1: Past performance of the agricultural sector in Mozambique’s economy ................................. 38
Table 6.2: Production and value of major crops in Mozambique, 2012 .................................................... 39
Table 6.3: Summary of indicators of performance of Mozambique’s agricultural sector .......................... 56

4
LIST OF FIGURES
Figure 3.1: Organogram of master development framework and current agricultural
and agriculture-related policies of the government of Mozambique ........................................................ 17
Figure 5.1: Total public expenditure in Mozambique, 2009–2014 (thousands of meticals) ...................... 31
Figure 5.2: Sources of funding for total public expenditure in Mozambique, 2009–2014 (percent) ......... 32
Figure 5.3: Letters of intent implementation progress as of 2014 ............................................................. 34
Figure 6.1: Annual growth of the subsectors in Mozambique’s agricultural sector, 2003–2009 ............... 39
Figure 6.2: Comparison of annual growth in national production and planted area by selected
crop, 2008–2012 ......................................................................................................................................... 41
Figure 6.3: Mozambique agricultural budget and expenditure as shares of total national budget and
expenditures, 2010–2014 (percent) ........................................................................................................... 46
Figure 6.4: Mozambique, growth in agricultural GDP, 1990–2013 ............................................................ 47
Figure 6.5: Average fertilizer application rates, 2003–2013 (kg/ha) .......................................................... 47
Figure 6.6: Maize yields in Mozambique, 2003–2012 (kg/ha) .................................................................... 48
Figure 6.7: Rice yields in Mozambique, 2003–2012 (kg/ha) ....................................................................... 48
Figure 6.8: Cassava yields in Mozambique, 2003–2012 (kg/ha) ................................................................. 49
Figure 6.9: Cashew nut yields in Mozambique, 2003–2012 (kg/ha) ........................................................... 49
Figure 6.10: Livestock production in Mozambique, annual growth, 1990–2013 ....................................... 49
Figure 6.11: Proportion of land under irrigation in Mozambique, 2000–2011 .......................................... 50
Figure 6.12: Land productivity in Mozambique, 2000–2013 (US$/ha/yr) .................................................. 51
Figure 6.13: Labor productivity in Mozambique (US$/worker/yr) ............................................................. 51
Figure 6.14: Value of total agricultural exports, 1990–2013 (thousands of US$) ...................................... 52
Figure 6.15: Ratio of agricultural imports to exports in Mozambique, 1990–2013 ................................... 53
Figure 6.16: GDP of each economic sector in Mozambique, 2000–2012 (meticals) .................................. 53
Figure 6.17: GDP per capita in Mozambique, 1990–2013 (constant 2005 US$) ........................................ 54
Figure 6.18: Annual GDP growth rate in Mozambique, 1990–2013 (percent) ........................................... 54
Figure 6.19: Global Hunger Index for Mozambique, 1990–2013 ............................................................... 55
Figure 6.20: Cereal production per capita in Mozambique, 2000–2013 (kg/person) ................................ 55
Figure 6.21: Population below minimum dietary energy consumption, 1990–2013 (percent) ................. 56

5
ACRONYMS
AgRED Donor Working Group for Agriculture and Rural Development
CAADP Comprehensive Africa Agriculture Development Program
CCSA Comité de Coordenação do Sector Agrário (Agricultural Sector Coordinating Committee)
CEPAGRI Centro de Promoção de Agricultura (Center for the Promotion of Commercial Agriculture)
CGIAR Consultative Group on International Agricultural Research
CTA Confederação das Associações Económicas
DUAT land use right
FAO Food and Agriculture Organization of the United Nations
G8 Group of Eight
GDP gross domestic product
GHI Global Hunger Index
ha hectare
IFPRI International Food Policy Research Institute
IWMI-SA International Water Management Institute for Southern Africa
JSR joint sector review
kg kilogram
M&E monitoring and evaluation
MAFAP Monitoring African Food and Agricultural Policies
MINAG Ministério da Agricultura (Ministry of Agriculture)
mt metric ton
MZM Mozambican metical
NAIP National Agricultural Investment Plan
NEPAD New Partnership for Africa's Development
NFB nonfiscal barrier
NGO nongovernmental organization
NPCA NEPAD Planning and Coordinating Agency

6
ORAM Organização Rural de Ajuda Mútua (Rural Organization for Mutual Support)
PAEI Política Agrária e Estratégia de Implementação (Agricultural Policy and Implementation
Strategy)
PAP Programmatic Aid Partners
PARPA Plano de Acção para Redução da Pobreza Absoluta (Action Plan for the Reduction of
Absolute Poverty)
PEDSA Plano Estratégico de Desenvolvimento do Sector Agrário (Strategic Plan for Agricultural
Sector Development)
PNISA Programa Nacional de Investimento do Sector Agrário (National Agricultural Investment
Plan)
PQG Plano Quinquenal do Governo (Five-Year Program of Government)
PROAGRI Programa Nacional de Desenvolvimento Agricola de Moçambique (National Program of
Agricultural Development in Mozambique)
ReSAKKS–SA Regional Strategic Analysis Knowledge Support System for Southern Africa
RISDP Regional Indicative Strategic Development Plan
SADC Southern African Development Community
SAKSS Strategic Analysis and Knowledge Support System
SPEED Support Program for Economic and Enterprise Development
SWOT strengths, weaknesses, opportunities, and threats
TIA Trabalho de Inquérito Agricola (Rural Household Income Surveys)
UEM Universidade Eduardo Mondlane (Eduardo Mondlane University)
UNAC União Nacional dos Camponeses (National Farmers’ Union)
7
EXECUTIVE SUMMARY
This report is part of the overall approach to agricultural development in Mozambique set in motion by the National Agricultural Investment Plan (NAIP) (referred to in Mozambique as the Plano Nacional de Investimento do Sector Agrário, or PNISA). This process takes place within the context of the mutual accountability framework of the Comprehensive Africa Agriculture Development Plan (CAADP). This report is a preliminary step to successfully establish within the country the process of the joint sector review (JSR). The JSR is a mutually accountable dialogue platform to review progress toward agreed-upon goals, assess implementation of stakeholders’ commitments, and help set agricultural sector policy and priorities. The aim of this report is to inform stakeholders of progress in PNISA’s implementation. PNISA was enacted to achieve the objectives set in the framework of CAADP and the Strategic Plan for Agricultural Development 2011–2020 (Plano Estratégico de Desenvolvimento do Sector Agrário, or PEDSA).
Under the coordination of the Directorate of Economics of Mozambique’s Agriculture Ministry (Ministério da Agricultura, or MINAG), the report compiles evidence on progress under PNISA based on the analyses of several actors: the International Food Policy Research Institute (IFPRI), the Regional Strategic Analysis and Knowledge Support System (ReSAKSS), Monitoring African Food and Agriculture Policies (MAFAP), and Mozambican researchers. The report examines the policy framework and the environment in which PNISA operates by looking at policy planning, execution, alignment, and the major actors in agricultural policymaking. The report also considers key financial and nonfinancial commitments made to advance the objectives of PEDSA and CAADP. It emphasizes public finance arrangements for agriculture, including the public financial system; the performance of the public financial management system; and trends in budget allocation, composition, and expenditure. Further, it discusses agricultural sector performance, including achievements under PNISA, and background on the attainment of CAADP targets in Mozambique.
Overall, the report recognizes the efforts that have been made to develop mechanisms for dialogue and structures to improve coordination among state and nonstate stakeholders. The core body for future PNISA coordination is the Agricultural Sector Coordinating Committee (Comité de Coordenação do Sector Agrário, or CCSA). Priority should be given to building momentum that will lead to the establishment of the CCSA. Nevertheless, further efforts are still needed to promote greater engagement in PNISA’s implementation by other sectors and stakeholders beyond MINAG. This is particularly important with regard to the private sector and civil society. Findings of this report indicate that key indicators for monitoring and evaluation (M&E) of PNISA activities are undefined. Well-defined indicators are necessary to assess progress and to allow for mutual accountability among stakeholders.
Agriculture joint sector reviews (JSRs) are a key instrument for supporting mutual accountability and implementing the CAADP Results Framework. JSRs provide a platform to collectively review the effectiveness of policies and institutions in the agricultural sector and to assess the extent to which intended results and outcomes in the sector are being realized. JSRs allow state and nonstate stakeholders to hold each other accountable with respect to fulfilling pledges and commitments stipulated in the CAADP compact; the NAIP; and related cooperation agreements, such as those under the New Alliance for Food Security and Nutrition. ReSAKSS is supporting efforts to improve the quality of the JSR processes in Mozambique.
This report presents three types of findings from the JSR technical assessment process. The first evaluates the policy and institutional environments surrounding the implementation of the PNISA, which is the NAIP for Mozambique. The second type examines the progress made toward achieving key target outcomes to create a baseline understanding of the agricultural sector’s condition for future reviews. The third type assesses the adequacy of existing processes to effectively carry out such a review in the future, and to identify actions to remedy eventual weaknesses.

8
PNISA is being implemented amid a multiplicity of agricultural policies and strategies. It is supported by the government, development partners, civil society, and the private sector. Often, the coordination among these actors is good, although interministerial coordination has yet to improve. While efforts are underway to incorporate civil society organizations and the private sector in the JSR process, the process is dominated by the state. The agricultural sector has enjoyed strong financial and nonfinancial commitments from the government, donors, and the private sector.
Although Mozambique has not consistently achieved the CAADP commitment of allocating 10 percent of the government’s annual budget to agriculture, the level of agricultural investments has improved over time. However, the quality of public expenditure on agriculture remains a concern, as a substantial amount has been going to recurrent expenditures, while the gap between capital spending and recurrent spending has widened over time. In spite of this, the growth rate of the agricultural sector appears to have surpassed CAADP’s 6 percent target. However, this finding deserves further investigation, to clarify the source of such growth. Overall, analysis for this report is limited by the fact that PNISA is still at an early stage of implementation.

9
1. INTRODUCTION
The main objective of the Comprehensive Africa Agriculture Development Program (CAADP) is to promote investments in agriculture that will spur broader and pro-poor economic growth. The principal premise underlying CAADP is that such agriculture-driven economic growth will result in a reduction in hunger, malnutrition, and poverty across Africa. In addition to setting goals for national annual budget commitments to agriculture (10 percent of the budget) and for agricultural sector growth (6 percent per annum), the participating countries in the CAADP process also commit to develop a national agricultural strategy. An investment plan is developed from this strategy to which government, the private sector in agriculture, civil society organizations, donors, and regional organizations commit their support. As such, CAADP combines appropriate technical approaches with both financial and broad political commitments to agricultural development from a wide group of participants (Future Agricultures 2012).
Central to the CAADP process at the national level is national ownership, with this concept of ownership by design extending well beyond the agricultural agencies of government alone to include other sectors within government, civil society organizations, and the private sector. However, commitment to the national CAADP investment plan involves a broader range of participants—both the national CAADP stakeholders and their international partners. This commitment is established within the national CAADP investment plan in an explicit framework of mutual accountability for agricultural performance and necessary policy change among all those involved. Mutual accountability here is defined as a process by which two or more parties hold one another accountable for the commitments they have voluntarily made to one another for the successful implementation of their mutual endeavor (ReSAKSS 2013a). This definition is appropriate in the context of commitments made for country-level CAADP processes.
The Mozambique CAADP country process only began in late 2010, even though CAADP as a continent-wide initiative was launched in Mozambique in 2003 with the signing of the Maputo Declaration on Agriculture and Food Security by African heads of state. This was followed in 2004 by an unsuccessful attempt at CAADP implementation (Gêmo 2011). After a range of background studies and regional consultations, the CAADP compact document for Mozambique was signed in December 2011 by representatives of the government of Mozambique, the private sector, civil society organizations, development partners, and regional organizations. The compact explicitly states that CAADP will be implemented in Mozambique through carrying out the Strategic Plan for Agricultural Sector Development (referred to in Mozambique as the Plano Estratégico de Desenvolvimento do Sector Agrário, or PEDSA). PEDSA will guide agricultural development over the period from 2011 to 2020.
Following the signing of the compact, work then began on developing the National Agricultural Investment Plan INAIP) (Plano Nacional de Investimento do Sector Agrário, or PNISA), the investment plan for agricultural development. Such a plan is stipulated as a key element in all CAADP country processes. The PNISA was officially presented in April 2013 and specifies 21 programs grouped under five components: agricultural production and productivity, access to markets, food and nutritional security, natural resources, and institutional reform and strengthening. PNISA also specifies the investments needed from 2013 to 2017 to successfully complete these programs. The financial requirements for this investment plan total Mozambican metical (MZM) 112 billion, or about US$ 4 billion.
1.1. Mutual Accountability
Both the CAADP compact for Mozambique (paragraph 30) and, in more detail, PNISA (chapter 5), specify that the activities being carried out within the context of CAADP in Mozambique will be closely coordinated and monitored. PNISA provides for the establishment of the Agricultural Sector Coordinating Committee (Comité de Coordenação
10
do Sector Agrário, or CCSA) to monitor PNISA’s implementation and regularly assess progress made. This monitoring and evaluation (M&E) effort will include the generation of joint reviews of PNISA by the government and its partners. It will also include the generation of annual reports on the performance of the agricultural sector. The evaluation is to be based on commitment reports for judging performance from agricultural stakeholders. The implementation of PNISA will also be subject to two evaluations—one in the second year and the other in the program’s last year.
The generic design of CAADP country processes designates the joint sector review (JSR) as the instrument for implementing the mutual accountability principle of CAADP at the country level. Functionally, the JSR is a platform to assess the performance of the agricultural sector and, in turn, help governments set sector policies and priorities. Specifically, the inclusive consultations and discussions that make up the JSR exercise aim to assess how well state and nonstate stakeholders have implemented the pledges and commitments stipulated in the CAADP compacts, NAIPs (such as PNISA), and related cooperation agreements in the sector (ReSAKSS 2013a)—an exercise that objectively considers what actions have been taken, resources have been committed, and progress has been made toward the CAADP objectives within a country. This means that all stakeholders in the national CAADP process are made accountable to each other as they pursue their common goal of transforming a country’s agriculture.
For Mozambique, specific monitoring activities were included within the design of PNISA to provide for mutual accountability in its implementation. Although PNISA has been in place to guide the investment decisions of stakeholders for only about a year, the agricultural JSR process that is to monitor the execution of PNISA and to guide any course corrections is already underway. This report has been written to inform those involved in the agricultural JSR for Mozambique about both the recent performance of the agricultural sector in the country and any progress made toward achieving the objectives of PEDSA through the implementation of PNISA.
1.2. Analytical Report for Agricultural Joint Sector Reviews
National agricultural JSR exercises under CAADP aim to follow an impartial, evidence-based approach—indeed, such an approach is essential if the JSR is to be considered a credible national exercise. The presentation of evidence-based objective analyses undertaken by independent experts can guide debate, and can help policymakers and all other stakeholders reach well-informed decisions as they implement the NAIP. The agricultural JSR process is much more than simply an analytical report to be critiqued and debated. CAADP envisions that the analytical report developed as part of the JSR process will enable the diverse stakeholders to achieve two goals: (1) to gain insight into the overall policies and priorities for development in the agricultural sector, and (2) to come to a consensus on where reprioritization or other changes in strategy and action are required. This report is expected to serve as a management and policy support tool for inclusive stakeholder planning, programming, budget preparation and execution, M&E, and overall development of Mozambique’s agricultural sector (ReSAKSS 2013b).
CAADP recommends that the analytical report for the agricultural JSR exercises in any country comprise the following components:
Public Expenditure Review—government commitments, expenditures, and alignment.
Donor Expenditure Review—commitments, disbursements, and alignment.
Civil Society Scorecard—commitments and alignment.
Private Sector Scorecard—commitments and investments.
Policy Progress Assessment—perspectives of state and nonstate actors.
Agriculture Sector Performance Review.
Impact Scorecard—progress and impact on poverty, hunger reduction, and food and nutrition security. Progress on alleviating poverty is not dealt with at length, even though this report makes use, in one way or another, of public expenditure reviews, donor expenditure reviews, civil society and private-sector commitments, policy
11
progress assessments, and agricultural sector performance reviews. Such an analysis would have required more analytical work and time than was available. However, JSR reviews more comprehensive than this one ought to include impact analyses, to clearly link policies and investments to development results.
1.3. Mozambique Agricultural JSR Analytical Report
In drafting the PNISA investment plan and guiding the launch of its implementation, the government of Mozambique has demonstrated a strong commitment to achieving the objectives of PEDSA. PNISA specifies that the council of ministers is responsible for providing strategic direction and sufficient resources for its implementation. In addition, the CCSA is to be established to ensure regular and effective dialogue among public institutions, donors, the private sector, and civil society organizations, including farmers’ organizations. These are the entities involved in implementing or providing financial support to PNISA activities. In this regard, the CCSA has the role of ensuring that there is mutual accountability among all of these stakeholders as they strive to act effectively and fulfill any commitments. This is necessary to achieve the objectives of PEDSA under the CAADP Mozambique framework.
An important limitation on the scope of this JSR for Mozambique is that there is no set of mutually agreed-upon] milestones and targets against which progress can be assessed. Such indicators are a foundational component of any JSR. So, while PNISA establishes a set of priorities for development in the agricultural sector, there are no measurable targets related to the achievement of those objectives that have been mutually agreed upon. A draft list of indicators for monitoring progress under PNISA has been drawn up (Uaiene 2013), but this primarily consists of agricultural sector growth targets, with specific subsector and commodity-specific targets. These relate only to the agricultural production and productivity component of PNISA. Indicators relating to the other four PNISA components—access to markets, food and nutritional security, natural resources, and institutional reform and strengthening—remain to be developed. Moreover, the same is true of indicators for the CAADP process in Mozambique, such as those that measure resource allocation, policy change, implementation processes, and the enabling environment for increased investments in agriculture. To strengthen the agricultural JSR process for future reviews, a broader set of milestones and targets against which to assess progress must be put in place.
As to what can and cannot be covered in this initial JSR assessment report for Mozambique, it can primarily discuss the baseline conditions of what are likely to be agreed-upon indicators for tracing the progress and achievements of the implementation of PNISA. This is because the set of targets and indicators for mutual accountability has not been established, and also because PNISA’s implementation is only starting now. Nonetheless, there is future value in our work, because the baseline indicators reported on here can serve for future agricultural JSRs as comparators for updated statistics to assess progress under PNISA.
The rest of this assessment report is organized as follows: Chapter 2 presents the status and quality of the JSR process in Mozambique, Chapter 3 describes the policy environment within which PNISA is implemented, Chapter 4 examines institutions, Chapter 5 discusses key financial and nonfinancial commitments in the agricultural sector, Chapter 6 reviews agricultural performance trends, and Chapter 7 closes with a conclusion and action points.

12
2. STATUS AND QUALITY OF THE JSR PROCESS IN MOZAMBIQUE
Recognizing that a coordination framework to promote accelerated agricultural growth and development is needed at the continental, regional, and national levels, Mozambique joined the New Partnership for Africa’s Development (NEPAD) and launched the Comprehensive African Agriculture Development Program (CAADP) in 2010. Established under the auspices of NEPAD as a common strategic and guiding framework for African agricultural development, CAADP aims to promote investments that stimulate agricultural growth, increase food security, and reduce poverty.
Aware of the need for an integrated approach to agricultural growth and development, and with the fully coordinated engagement of all players along agricultural value chains, the government consulted with Mozambique’s agricultural stakeholders—namely, the private sector, civil society, development partners, and research and training institutions. This consultation led to a process that resulted in the development of the government’s Strategic Plan for Agricultural Sector Development (referred to in Mozambique as the Plano Estratégico de Desenvolvimento do Sector Agrário, or PEDSA), which was officially approved in May 2011. Developed for a span of 10 years (2011–2020), PEDSA is a multisector, interministerial approach that relies on the guiding pillars and principles of CAADP, articulates a set of development goals and priorities for agriculture in Mozambique, and emerges as a guiding framework and harmonizing tool for agricultural development within the country. Under this framework, the role of the government is to facilitate agricultural development by providing infrastructure, incentives, and public services, and by creating legal frameworks and policies that are conducive to agricultural investments.
In line with the CAADP guidelines, in 2010 Mozambique formed a National CAADP Team made up of representatives from the government and other public institutions, the private sector, civil society, farmers’ organizations, donors, and international agricultural research institutions. The establishment of this team marked the official launching of the CAADP process in Mozambique. Later, in December 2011, the CAADP Compact for Mozambique was signed, which defines the priority focus areas of intervention for agricultural development. The signatories are the major players in agricultural development—the Ministry of Agriculture (MINAG), a representative of the African Union Commission (AUC), NEPAD, and CAADP; representatives of agricultural development partners—the World Bank, Canada, the European Union, the United States government, and the International Fund for Agricultural Development; a representative of the private sector from the Confederation of Economic Associations (Conferação das Associações Económica, or CTA); a representative of the National Farmers’ Union (União Nacional de Camponese, or UNAC); and representatives from a civil society organization, from the Regional Office for South Africa of the United Nations’ High Commissioner for Human Rights, and from Save the Children.
After the signing of the Mozambique CAADP Country Compact, the National CAADP Team was tasked to lead a participatory process aimed at developing the National Agricultural Investment Plan (NAIP) (Plano Nacional de Investimento do Sector Agrário, or PNISA). This was successfully done when the council of ministers approved the PNISA in December 2012. The process of developing PNISA involved the formation of a technical team and of specific thematic working groups that regularly reported their findings at relevant MINAG meetings. It also involved the work of external consultancies, as well as technical and methodological support from the Food and Agriculture Organization of the United Nations. There were also several consultation meetings with relevant government institutions, the private sector, international and donor agencies, nongovernmental organizations (NGOs), and civil society. Their contributions were incorporated into the PNISA document. PNISA was also submitted to independent technical peer reviewers made up of NEPAD experts, whose comments were also incorporated into the document. After PNISA’s the signing, and consistent with the CAADP compact, a high-level business meeting chaired by
13
President Armando Emilio Guebuza was held in April 2013. The event also served as PNISA’s official launch—when the government and donors agreed to mobilize resources for the achievement of PEDSA’s objectives.
In this context, Mozambique has signed agreements with the Group of Eight (G8) (New Alliance for Food Security and Nutrition, launched in April 2013) and with the World Bank (Agriculture Development Policy Operation. The signatories of these agreements committed to supporting the principles, priorities, and actions established in the CAADP compact and agreed to align their financial and technical support with PNISA. Under these cooperation frameworks, a policy matrix was developed that stipulates key actions and measures that will remove barriers that hinder wider private-sector investments along Mozambique’s agricultural value chains.
The development of the CAADP process in Mozambique, including the implementation of PEDSA and PNISA, involves a growing body of coordination between national and decentralized agencies of the government and a dialogue structure for stakeholders’ participation. There is already an established mechanism for regularly scheduled donor–government meetings chaired by the minister of agriculture (Centro de Promoção da Agricultura), at which ambassadors and heads of mission review progress in the implementation of program activities and policies, particularly those contained in an agreed-upon policy matrix. To enhance their participation and effectiveness and to harmonize efforts in the support of the agriculture sector, since 2011 coordination among development partners has been provided through a Donor Working Group for Agriculture and Rural Development (AgRED), chaired by the European Union and the World Bank, and comprising around 30 agencies. One priority of AgRED for the agricultural sector at this stage is to support the implementation of PNISA and the overall CAADP agenda and to promote efficient policy dialogue with MINAG.
Within the MINAG, the Directorate of Economics leads the overall process of planning, monitoring, and sectoral policy development. (Subsector strategies are designed by respective MINAG national directorates or institutes.) These processes require broad stakeholder participation and coordination among the national, provincial, and district levels. To ensure this participation, the Directorate of Economics has established technical working groups and has invited different government agencies, AgRED, civil society groups, and the private sector. The participation of the private sector and of smallholder farmers’ organizations appears to be inconsistent. However, through the Center for the Promotion of Agriculture (Centro de Promoção da Agricultura) there has been interaction with the private sector, including with the CTA, the umbrella organization for private-sector associations. There are also other sectors or commodity-oriented and cross-cutting platforms where dialogue is promoted. This is the case for commodity organizations, such as those for cotton and cashew nut; the National Land Forum; the Agribusiness Forum; and the Seed Dialogue Platform, which is in the process of being established.
To enhance coordination and effective dialogue, the MINAG Directorate of Economics is now developing terms of reference with a view to establishing platforms for dialogue and to monitor PNISA’s implementation. These platforms involve political and technical levels, as well as some geographic focus as follows: (1) Agriculture Sector Coordination Committee (Comité de Coordenação do Sector Agrário, or CCSA); (2) national political and technical dialogue; and (3) corridor-level dialogue. CCSA has the mandate to monitor implementation, verify compliance of interventions with government policies and programs, assess progress in implementing PNISA, and make recommendations for improving coordination and implementation.
Mechanisms for dialogue have been put in place, and new structures are planned to enhance stakeholder engagement. However there is concern about the existing capacity to coordinate a platform of multiple stakeholders, such as intergovernmental institutions relevant to agricultural sector development; development partners; the private sector; and civil society, including farmers’ organizations. To this end, MINAG’s Directorate of Economics is establishing a CAADP secretariat to ensure the broad engagement of stakeholders. In a

14
multistakeholder platform, the challenge is to continuously improve the quality of dialogue, particularly with regard to the level of participation of each member and the effectiveness of the dialogue process. Evidence-based analysis to inform the dialogue and decisionmaking is an area that deserves attention. In this regard, the Directorate of Economics is developing a results-oriented program and strengthening the capacity of its statistics and management information system units to improve data collection, analysis, knowledge, and information management and sharing. In this effort, the directorate is counting on the support of ReSAKSS (although Mozambique-SAKSS will take this over soon), the International Food Policy Research Institute, Michigan State University, and the Center for Research in Agro-Food Policies and Programs (Centro de Programas e Políticas Agrárias) from Eduardo Mondlane University (Universidade Eduardo Mondlane).
One example of a performance review and accountability mechanism already operative in Mozambique and from which lessons can be learned for the CAADP JSR is the dialogue platform known as Programmatic Aid Partners (PAP), a partnership between the government and its development partners. Chaired by the Minister of Planning and Development and involving other ministries and relevant ambassadors, PAP annually evaluates the effectiveness of donors’ aid and reviews commitments and performance indicators set in the Performance Assessment Framework, which establishes the principles and processes for the programmatic support of the government budget. This platform involves 19 international donor agencies, and provides other mechanisms of dialogue, such as a joint steering committee and sector groups that include government, development partners, and civil society organizations. The sector groups are organized around themes dealing with macroeconomics and poverty, governance, human capital, economic development, and cross-cutting issues. In addition to this platform of dialogue, the government has established a coordination council in each ministry to annually review and debate strategic and priority issues, including sector performance and targets for the next economic year, when applicable. These coordination councils meet once a year, are chaired by their respective ministers, and have the participation of government organizations at the national, provincial, and sometimes district levels. Also participating are representatives of development partners’, the private sector, NGOs, and farmers’ organizations.
In May 2013, a diverse group of policy experts from Mozambique attended an Agricultural Policy Learning and Exchange event in Dakar, Senegal. The event’s purpose was to discuss systemic policy challenges that prevent effective implementation of National Agricultural and Food Security Investment Plans and to identify specific steps that countries can take to overcome these constraints. Emphasis was placed on JSR reviews as a tool for strengthening M&E and dialogue and accountability processes within the agricultural sector. A schedule of planned activities was drawn up following the Dakar meeting. Table 2.1 shows a sequence of activities carried out by MINAG to strengthen the JSR process following those Dakar meetings.
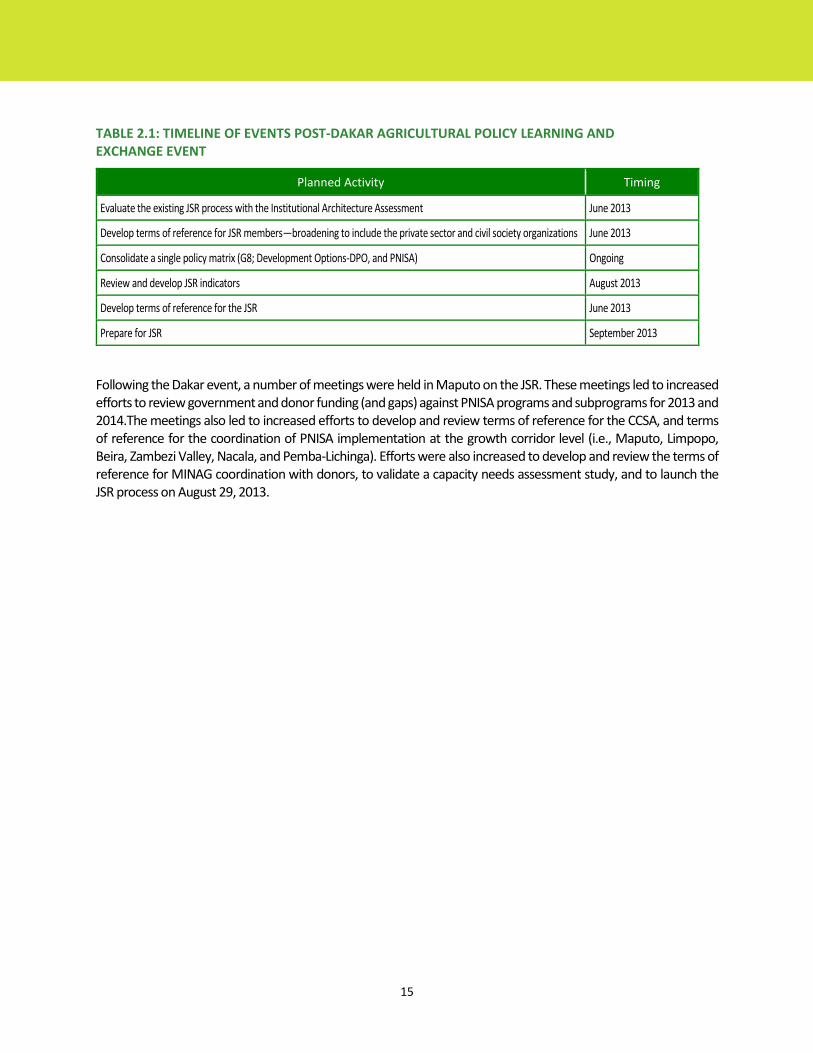
15
TABLE 2.1: TIMELINE OF EVENTS POST-DAKAR AGRICULTURAL POLICY LEARNING AND EXCHANGE EVENT
Planned Activity Timing
Evaluate the existing JSR process with the Institutional Architecture Assessment June 2013
Develop terms of reference for JSR members—broadening to include the private sector and civil society organizations June 2013
Consolidate a single policy matrix (G8; Development Options-DPO, and PNISA) Ongoing
Review and develop JSR indicators August 2013
Develop terms of reference for the JSR June 2013
Prepare for JSR September 2013
Following the Dakar event, a number of meetings were held in Maputo on the JSR. These meetings led to increased efforts to review government and donor funding (and gaps) against PNISA programs and subprograms for 2013 and 2014.The meetings also led to increased efforts to develop and review terms of reference for the CCSA, and terms of reference for the coordination of PNISA implementation at the growth corridor level (i.e., Maputo, Limpopo, Beira, Zambezi Valley, Nacala, and Pemba-Lichinga). Efforts were also increased to develop and review the terms of reference for MINAG coordination with donors, to validate a capacity needs assessment study, and to launch the JSR process on August 29, 2013.

16
3. POLICY REVIEW
This chapter focuses on Mozambique’s agricultural policies and the national agricultural development agenda by considering the current agricultural policy framework, the major actors in Mozambique’s agricultural policymaking processes, and the patterns of public finance for agriculture.
3.1. Inventory of Existing and Emerging Policies
Mozambique’s agricultural sector has a multiplicity of policies documented or alluded to in the National Agricultural Investment Plan (Plano Nacional de Investimento do Sector Agrário, or PNISA); the Strategic Plan for Agricultural Sector Development (Plano Estratégico de Desenvolvimento do Sector Agrário, or PEDSA); and other policy documents. The design of national policies and strategies in Mozambique is principally the work of the national government, with the provincial and district-level governments and their agencies responsible for implementing the national policies and strategies in their areas of jurisdiction. Generally, the policymaking process in Mozambique is very centralized, with reforms driven principally by the president or prime minister’s office and followed up by the council of ministers (Africa Lead and EAT 2013). However, there have been efforts to give provincial governments and public institutions and nonstate actors a voice in designing national policies.
As Mozambique is among the poorest countries in the world, poverty reduction is the government’s main agenda. The Five–Year Program of Government (Plano Quinquenal do Governo, or PQG) and the Action Plan for the Reduction of Absolute Poverty e (Plano de Acção para Redução da Pobreza Absoluta, 2011–2014, or PARPA) are the two major strategic documents that currently guide any policymaking exercise in Mozambique. However, major strategies, policies, and action plans are not only influenced by longstanding development agendas for the country; they are also designed in response to immediate crises and challenges facing the country.1 The PQG has combating poverty and improving the living standard of the people as its principal objectives, while the PARPA is the medium-term strategy designed to operationalize how the PQG’s objectives will be attained (World Bank 2011).
In Mozambique, most of the strategically important sectors, such as agriculture, usually prepare their own medium-term strategies. For the agricultural sector, the past two strategies were the National Program of Agricultural Development in Mozambique (Programa Nacional de Desenvolvimento Agricola de Moçambique, or PROAGRI I [1999–2006] and PROAGRI II [2005–2011]). In addition, the government´s Agricultural Policy and Implementation Strategy (Política Agrária e Estratégia de Implementação, or PAEI), approved in 1995, is still in force. It sets out the following mission statement: “Develop agricultural activity with a view of achieving food security through diversified production of goods for consumption, domestic industry, and export, based on sustainable use of natural resources, while ensuring social equity.” PAEI integrates agriculture into Mozambique´s economic development objectives in four main areas: food security, sustainable economic development, reduction of unemployment, and reduction in the level of absolute poverty (MINAG 2010).
Currently, PEDSA lays out the vision for development in the agricultural sector and for how the government will prioritize its allocation of resources to that end. In principle, PQG and PARPA are the foundations of the agricultural sector strategy, while the policy content of PEDSA is justified by and integrated into PQG and PARPA. PNISA is the investment plan that has been developed to operationalize action to achieve PEDSA’s objectives (Figure 3.1).
1 For instance, the now phased-out Food Production Action Plan of 2008 came into existence in the immediate aftermath of the 2007 and 2008 world food crisis (World Bank 2011).

17
FIGURE 3.1: ORGANOGRAM OF MASTER DEVELOPMENT FRAMEWORK AND CURRENT AGRICULTURAL AND AGRICULTURE-RELATED POLICIES OF THE GOVERNMENT OF MOZAMBIQUE
In addition to PEDSA and PNISA, other strategic documents pertain to agricultural issues. These include the Food and Nutrition Security Strategy and Action Plan 2008–2015 (Estratégia e Plano de Acção de Segurança Alimentar e Nutricional), the Multi-sectoral Action Plan for the Reduction of Chronic Malnutrition in Mozambique 2011–2014 (Plano de Acção Multissectorial para a Redução da Desnutrição Crónica em Moçambique), and the Rural Development Strategy (Estratégia de Desenvolvimento Rural), among others. Moreover, within the framework of PEDSA and PNISA, is a range of plans to address, or statements to define, sectoral and subsectoral priorities within agriculture that constitute part of the agricultural policy framework for Mozambique. These include the Green Revolution Strategy (Estratégia da Revolução Verde), the Agricultural Research Strategy (Estratégia de Investigação), the National Extension Program (Programa Nacional de Extensão), the Reforestation Strategy (Estratégia de Reflorestamento), the National Forestry Plan (Plano Nacional de Florestas), the Irrigation Strategy (Estratégia de Irrigação), the Food Production Action Plan (Plano de Acção para a Produção de Alimentos), and the Strategic Plan for Livestock (Plano Estratégico da Pecuária). Some of these plans have been completed and phased out, others are under active implementation, others have never been more than statements of intent, while others have been quickly superseded.
3.2. Agricultural Policy Framework of the Government of Mozambique
The government of Mozambique has taken important steps to advance the implementation agenda of the Comprehensive Africa Agriculture Development Program (CAADP) in the country. Mozambique explicitly embeds CAADP in PEDSA, its current strategic plan for agricultural development. Moreover, following the CAADP compact signing, Mozambique elaborated PNISA to achieve the goals for the development of Mozambican agriculture laid out in PEDSA. These align with the CAADP–Mozambique process, which required the formulation of such an investment plan. This subsection provides a synopsis of the priorities laid out in PEDSA and PNISA.
Plano Quinquenal do Governo (PQG)
Plano de Acção para Redução da Pobreza Absoluta (PARPA)
Plano Estratégico de Desenvolvimento do Sector Agrário (PEDSA)
Irrigation Strategy
National Extension Program
Reforestation Strategy
Others
Programa Nacional de Investimento do Sector
Agrário (PNISA)
ESAN II EDRPRDC Others
18
3.2.1. Strategic Plan for Agricultural Sector Development (PEDSA)
PEDSA was approved in May 2011 to serve as the government’s strategic plan for developing the agricultural sector from 2011 to 2020 (MINAG 2010). PEDSA replaced the PROAGRI strategies (IFAD 2012b), and is characterized as a multisector, interministerial approach to improving agricultural performance (World Bank 2011). PEDSA says that it provides specific content on agricultural development within the broader context of PQG and PARPA, and that it contributes to the definition of financial programming by government in the agricultural sector under its three-year medium-term expenditure framework, the Medium-term Fiscal Framework (Cenário Fiscal de Médio Prazo).
PEDSA bases its medium- and long-term vision not only on national directives for agriculture, but also on the priorities set out in CAADP. The four pillars of CAADP—sustainable development of natural resources, markets and infrastructures, food production, and agricultural research— serve also as foundations for PEDSA at both strategic and operational levels. PEDSA was developed following a nominally participatory approach that involved all stakeholders, including relevant government institutions and representatives of farmers’ organizations, the private sector, development partners, and civil society.
In line with CAADP’s target of 6 percent annual economic growth in the agricultural sector, PEDSA establishes a higher target of at least 7 percent agricultural growth per year. The sources of this growth are envisioned as a combination of doubled yields and a 25 percent increase in the area under cultivation by 2019, both achieved in a manner that ensures the sustainability of Mozambique’s natural resources.
The general objective of PEDSA is to “contribute towards the food security and income of agricultural producers in a competitive and sustainable way, guaranteeing social and gender equity.” To achieve this objective, PEDSA has the following five specific strategic objectives:
Increase agricultural productivity and competitiveness.
Improve infrastructure and services for markets.
Use land, water, forest, and wildlife resources sustainably.
Create a legal framework and policies that are conducive to agricultural investment.
Strengthen agricultural institutions.
Under each of these strategic objectives, a set of results is defined—30 in total—with specific strategies proposed for achieving each one.
3.2.2. National Investment Plan for the Agricultural Sector (PNISA)
PNISA is the national investment plan for achieving PEDSA’s objectives for the development of Mozambique’s agricultural sector. PNISA also serves as the investment plan that is part of the framework for operationalization of CAADP at the country level. It was developed by a technical team established after the signing of the Mozambique CAADP compact in December 2011. This team consulted with government agencies across multiple sectors, with donors as well as with representatives of the private sector and civil society, to design an investment plan that will align all pre-existing policies and possibly reduce contradictions. It was launched in April 2013 and covers the period from 2013 to 2017.
Three main goals are established for the PNISA:
Increase agricultural sector growth by an average of 7 percent annually over the next ten years;.
19
Reduce the prevalence of chronic malnutrition in children under five years old to below 20 percent by 2020.
Reduce by half the proportion of Mozambicans who suffer from hunger by 2015.
While the first goal is taken from PEDSA, the other two are new to PNISA. The structure of PNISA aligns with the five strategic objectives of PEDSA, but there is not a complete one-to-one correspondence:
1. The “Production and Productivity” component of PNISA will serve to achieve the PEDSA strategic objective of increasing agricultural productivity and competitiveness.
2. The “Market Access” component will serve PEDSA’s strategic objective of improving infrastructure and services for markets.
3. The “Food and Nutritional Security” component of PNISA does not directly match up with PEDSA’s strategic objectives, but provides a cross-cutting emphasis to action under PNISA.
4. The “Natural Resource” component of PNISA corresponds closely to PEDSA’s strategic objective of using land, water, forest, and wildlife resources in a sustainable manner.
5. The “Institutional Reform and Strengthening” component of PNISA corresponds to the PEDSA objective of strengthening agricultural institutions.
The PEDSA objective of creating a legal framework and policies that encourage agricultural investment is not explicitly addressed at the component level of PNISA, but is an element in several of the programs under those components.
Under each of the five PNISA components are detailed sets of programs and subprograms—21 programs and 61 subprograms in total. With such a large number of priorities, PNISA allows for a very broad scope of action. Budgets are established for each of these subprograms to determine the total financial resources required to implement PNSIA from 2013 to 2017. These budgets total MZM 112 billion, or about US$ 4 billion. The “Production and Productivity” component of PNISA is allocated the bulk of the budget—almost 85 percent.
In keeping with the CAADP compact, the government of Mozambique and donors agreed to mobilize funds for the achievement of the PEDSA objectives as laid out in the action plan. When PNISA was launched, there was a sizable financing gap of 78 percent of the total budget. Filling this gap will be an important challenge for the effective implementation of PNISA.
The ministers are responsible for providing strategic direction to the program and ensuring the allocation of the necessary resources. The Minister of Agriculture is responsible for submitting reports on the implementation of PNISA and progress toward attaining PEDSA’s objectives. There is also a second level of coordination, called the Agricultural Sector Coordinating Committee (Comité de Coordenação do Sector Agrário, or CCSA), which is chaired by the Ministry of Agriculture.2 The CCSA is supposed to ensure regular and effective dialogue among public institutions, donors, the private sector, and civil society organizations involved in PNISA’s implementation. A third level of coordination of the program will be at the provincial and district levels and has a greater focus on implementation.
2 Normally, the committee is expected to meet twice a year. It is responsible for monitoring the implementation of program activities, verifying compliance of interventions with the policies and programs of the government, assessing the progress made in implementing the program, making recommendations for improving coordination and implementation, and feeding the information to the council of ministers.
20
Beyond sketching the three levels of coordination, the PNISA document does not specify a detailed institutional framework for its own implementation. Existing agencies with responsibilities relevant to PNISA programs and subprograms are expected to become involved in the action plan’s implementation, with oversight and coordination provided by the CCSA or by regional or district coordination bodies.
The CCSA is to be at the center of the regular agricultural JSR of PNISA. This is to ensure that all participants in PNISA’s implementation are mutually accountable for any progress made or failures encountered. The PNISA document provides an outline of a monitoring and evaluation (M&E) system for the plan, including peer reviews, analytical studies, impact assessments, and information sharing, so that PNISA is implemented at its different levels in a way that ensures accountability and transparency in the use of funds.
However, the informational content of the M&E system is not specified in the plan. As such, beyond the three overall goals noted above —increasing agricultural sector growth and reducing chronic child malnutrition and hunger— no other indicators are proposed for measuring PNISA’s progress in attaining the objectives of PEDSA. Other indicators and targets are left to be identified by the agencies involved at the level of the programs and subprograms.
This lack of definitions for M&E’s key indicators is an important deficiency in PNISA’s design, given the priority assigned to mutual accountability under the CAADP–Mozambique process. Mutual accountability centers on “mutually agreed-upon milestones and targets.” These milestones and targets remain to be defined for PNISA. So long as they remain undefined, the agricultural JSR process under CAADP–Mozambique will be significantly hampered. The private, donor, and civil society (including farmers’ organizations) sectors also need to develop mechanisms for tracking how they advance on their mutually agreed-upon commitments.
3.2.3. New Alliance as a Supporting Tool for the Implementation of
PEDSA and PNISA
The New Alliance is a shared commitment among the government of Mozambique, the private sector, and donors, to achieve sustained and inclusive agricultural growth and raise millions of people out of poverty. Therefore the New Alliance is a:
Support tool for the implementation of PEDSA—It includes the government of Mozambique’s commitments to drive effective policy actions aligned with PEDSA’s objectives, in order to build domestic and international private-sector confidence and thus increase agricultural investment, with the overall goal of reducing poverty and ending hunger.
Support tool for the implementation of PNISA—It outlines (1) the government of Mozambique’s commitments to provide the financial resources required for achieving the tangible and sustainable outcomes of PNISA; (2) the private sector’s commitments to increase investments, where the conditions are right, in support of PNISA; and (3) donor commitments both to expand the country’s potential for rapid and sustainable agricultural growth and to align their agricultural, financial, and technical support with PNISA’s priorities, in such a way as to accelerate the implementation of these strategic tools.
Under the New Alliance Cooperative Framework, the government committed to 15 policy actions meant to:
increase stability and transparency in trade policy;
improve incentives for the private sector, especially in developing and implementing domestic input and seed policies that encourage increased private-sector involvement;
develop and improve the transparency and efficiency of land policy and land administration; and
develop innovative methods for increasing the availability of credit and smallholders’ access to it.
21
3.3. Consistency of Agricultural Policy
The highlighted multiplicity of policies in Mozambique’s agricultural sector does not necessarily mean that there is discord among the policies. Most of the policies reinforce each other. PEDSA, PNISA, and the cooperative framework under the New Alliance are aligned consistently.
Explicit in PEDSA is that government’s proper role is facilitating increased private investment to foster expansion of the agricultural sector. The government is to provide infrastructure, incentives, legal frameworks, and public services that will create a favorable environment for the private sector to invest in agricultural production, processing, and marketing. Boosting the confidence of private agricultural investors is at the center of PEDSA. Notably, PEDSA seeks to expand Mozambique’s commercial agricultural production, with a consequent reduction in the number of smallholder farmers and an increase in farm size and productivity levels.
The existing Investment Law and Regulation (Law 3/93, and Decree 14/93 amended by Decree 36/95) provides an overarching legal framework and incentives for domestic and foreign private investments in the country, including ones in the agricultural sector. However, challenges remain, because the policies and incentives need to be improved. They need to integrate and engage the private sector more fully along agricultural value chains. In this regard, the Ministry of Agriculture has developed a policy matrix to promote an enabling environment for agricultural and agribusiness improvement. Under this policy matrix, several reforms within the ministry are ongoing to align with PEDSA and PNISA and to improve public service provisions. Steps have already been taken to improve land management processes, and tax incentives have been put in place to stimulate national and foreign private investments in different segments of agricultural value chains. In addition, over the past 18 months the government has approved the following:
Updated seed industry regulations—This action was to ensure alignment with the Southern African Development Community (SADC) Seeds Protocol. The new regulation addresses issues related to seed production, processing, packaging, and marketing and is aimed at ensuring a more friendly and confident environment for private-sector investments in the seed industry.
Inorganic fertilizer regulation—This regulation provides a comprehensive regulatory framework for fertilizer that covers import issues; composition (types of fertilizer); marketing; and quality (including quality control—this will require that the country be prepared to provide the necessary laboratory analysis).
A “Breeders Rights” decree for the seed industry (Direito do Melhorador de Plantas)—This decree recognizes the importance of property rights for breeding materials and provides legal protection of those rights. This decree is also viewed as a tool that can encourage more private-sector involvement in the seed industry.
A review of the Tariff Book (Pauta Aduaneira) for issues relevant to the agricultural sector—This review aimed at lowering import taxes for key agricultural inputs and for some equipment, such as irrigation equipment and technology. However, the reviewed changes in import taxes are still to be approved by the national Parliament.
3.4. Meeting Policy Commitment under the New Alliance Cooperation Framework for Mozambique
The progress on the government’s New Alliance policy commitments is mixed. The progress under each commitment is summarized in Table 3.1.
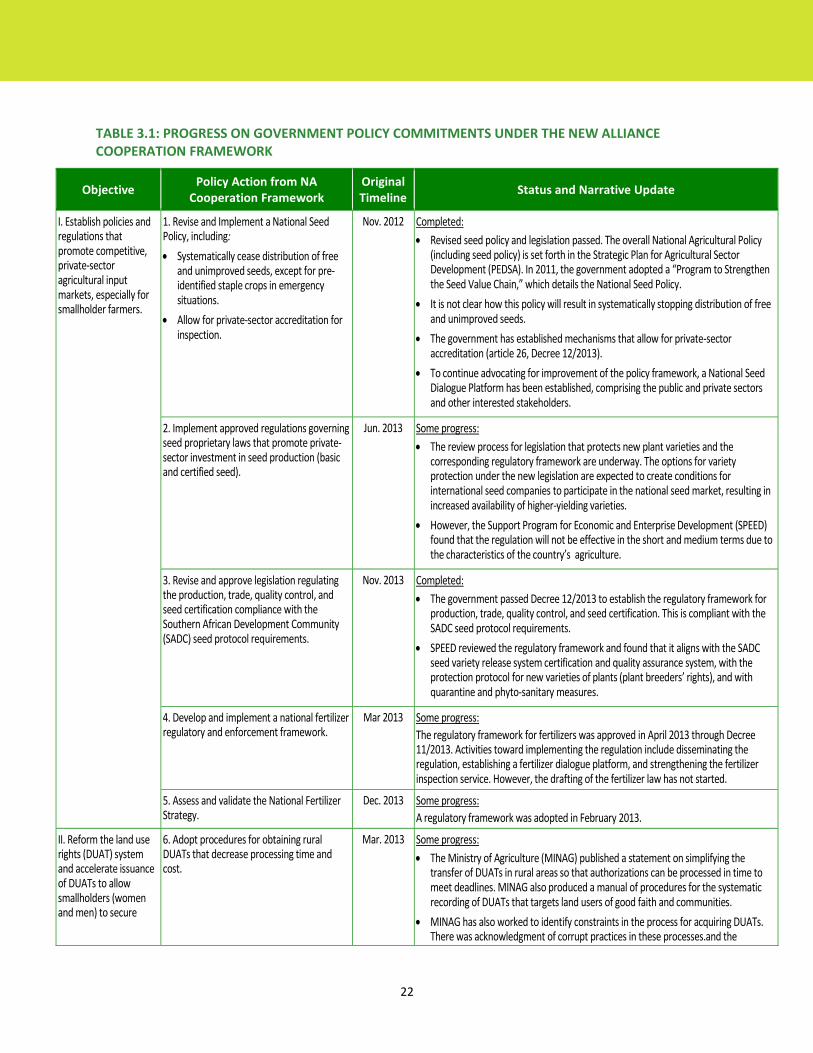
22
TABLE 3.1: PROGRESS ON GOVERNMENT POLICY COMMITMENTS UNDER THE NEW ALLIANCE COOPERATION FRAMEWORK
Objective Policy Action from NA
Cooperation Framework Original Timeline
Status and Narrative Update
I. Establish policies and regulations that promote competitive, private-sector agricultural input markets, especially for smallholder farmers.
1. Revise and Implement a National Seed Policy, including:
Systematically cease distribution of free and unimproved seeds, except for pre-identified staple crops in emergency situations.
Allow for private-sector accreditation for inspection.
Nov. 2012 Completed:
Revised seed policy and legislation passed. The overall National Agricultural Policy (including seed policy) is set forth in the Strategic Plan for Agricultural Sector Development (PEDSA). In 2011, the government adopted a “Program to Strengthen the Seed Value Chain,” which details the National Seed Policy.
It is not clear how this policy will result in systematically stopping distribution of free and unimproved seeds.
The government has established mechanisms that allow for private-sector accreditation (article 26, Decree 12/2013).
To continue advocating for improvement of the policy framework, a National Seed Dialogue Platform has been established, comprising the public and private sectors and other interested stakeholders.
2. Implement approved regulations governing seed proprietary laws that promote private-sector investment in seed production (basic and certified seed).
Jun. 2013 Some progress:
The review process for legislation that protects new plant varieties and the corresponding regulatory framework are underway. The options for variety protection under the new legislation are expected to create conditions for international seed companies to participate in the national seed market, resulting in increased availability of higher-yielding varieties.
However, the Support Program for Economic and Enterprise Development (SPEED) found that the regulation will not be effective in the short and medium terms due to the characteristics of the country’s agriculture.
3. Revise and approve legislation regulating the production, trade, quality control, and seed certification compliance with the Southern African Development Community (SADC) seed protocol requirements.
Nov. 2013 Completed:
The government passed Decree 12/2013 to establish the regulatory framework for production, trade, quality control, and seed certification. This is compliant with the SADC seed protocol requirements.
SPEED reviewed the regulatory framework and found that it aligns with the SADC seed variety release system certification and quality assurance system, with the protection protocol for new varieties of plants (plant breeders’ rights), and with quarantine and phyto-sanitary measures.
4. Develop and implement a national fertilizer regulatory and enforcement framework.
Mar 2013 Some progress:
The regulatory framework for fertilizers was approved in April 2013 through Decree 11/2013. Activities toward implementing the regulation include disseminating the regulation, establishing a fertilizer dialogue platform, and strengthening the fertilizer inspection service. However, the drafting of the fertilizer law has not started.
5. Assess and validate the National Fertilizer Strategy.
Dec. 2013 Some progress:
A regulatory framework was adopted in February 2013.
II. Reform the land use rights (DUAT) system and accelerate issuance of DUATs to allow smallholders (women and men) to secure
6. Adopt procedures for obtaining rural DUATs that decrease processing time and cost.
Mar. 2013 Some progress:
The Ministry of Agriculture (MINAG) published a statement on simplifying the transfer of DUATs in rural areas so that authorizations can be processed in time to meet deadlines. MINAG also produced a manual of procedures for the systematic recording of DUATs that targets land users of good faith and communities.
MINAG has also worked to identify constraints in the process for acquiring DUATs. There was acknowledgment of corrupt practices in these processes.and the

23
Objective Policy Action from NA
Cooperation Framework Original Timeline
Status and Narrative Update
tenure and to promote agribusiness investment.
following constraints: (1) Inadequate knowledge of the land law, its regulations and other related legislation on the part of managers and decision makers; (2) poor institutional coordination; and (3) outdated topographic equipment, with low precision or poor accuracy, resulting in partial overlap of plots.
MINAG is drafting a baseline report to show the current number of DUATs granted and the average time required to issue a DUAT in rural areas.
7. Develop and approve regulations and procedures that authorize communities to engage in partnerships through leases or subleases (cessao de exploração).
Jun 2013 Some progress:
Draft legislation is awaiting stakeholder comments. It is unlikely that consultation and revision will be completed before elections in October. Legislation will likely not be presented to the Cabinet before the end of 2014. The draft is scheduled to be presented to the next National Land Forum.
III. Promote liberalization and facilitation of trade and marketing of agricultural products, especially for smallholder farmers.
8. Eliminate permit (guia) requirements for interdistrict trade in agricultural commodities.
Jun 2013 Some progress:
A SPEED study on Non-Fiscal Barriers (NFB) to Agriculture in Mozambique provides an overview of the NFBs that harm the competitiveness of agriculture in Mozambique. These include incorrect application of customs procedures and duties, a lack of access to diesel subsidies, a proliferation of transit checkpoints, and requirements for commodity transit permits between local markets. Confederação das Associações Económicas (CTA) plans a communications campaign against illegal taxes in agriculture that will target audiences involved with agricultural transport and marketing. The campaign will also target specific geographical areas where these fees have become particularly problematic.
9. Develop and approve invoices that can be issued by purchasing firms on behalf of suppliers who are not registered taxpayers, such as smallholder producers; develop and approve respective monitoring and control procedures; implement a fiscal education program for smallholders that includes tax registration.
Mar 2013 Some progress:
CTA has developed a concept note outlining how this policy objective can be achieved, while taking into account the Mozambique Revenue Authority’s concerns about fiscal control, fiscal income, and tax registration. It is hoped that the proposals made are sufficient to warrant a pilot project to test the assumptions and then to roll out an interim system that satisfies the needs of the Revenue Authority, business, and the development of the agricultural sector.
10. Eliminate the Simplified VAT (value-added tax) scheme and replace it with the existing Simplified Tax for Small Contributors.
Mar 2013 No progress
IV. Increase availability and access to credit in the agricultural sector, especially for smallholder farmers.
11. Approve a decree allowing private credit information bureaus.
Mar 2013 Some progress:
Draft legislation has been developed. The legislation may require parliamentary approval, and it is not yet clear if it will be scheduled for inclusion on the 2014 legislative calendar. The Cabinet has indicated that it does not want a purely private credit bureau system, but would like to see a system with government involvement.
12. Enact mobile finance regulations that are risk based and allow for experimentation and innovation.
Mar 2013 Some progress:
Draft legislation is being developed by the Bank of Mozambique. It is unlikely that the legislation will be presented to the Cabinet before the end of 2014.
V. Support implementation of the Multisectoral Nutrition Action Plan for Reduction of Chronic Undernutrition
13. Enact approved food fortification regulations (including biofortification).
Jun 2013 Some progress:
The Food Fortification Regulation has reportedly been approved. However its sustainability, implementation mechanisms, and economic effect on food distribution and food security are currently the subject of debate.
14. Determine optimal structure for institutional coherence in efforts to improve
Jun 2013 Completed:
24
Objective Policy Action from NA
Cooperation Framework Original Timeline
Status and Narrative Update
(PAMRDC) 2011–2015, which is aligned with the global Scaling Up Nutrition initiative.
nutrition, as per SUN country-level strategic priorities.
The Multisectoral Nutrition Action Plan has been approved by Parliament. A Technical Secretariat for Food Security and Nutrition has been created and is operational.
15. Ensure that the PAMRDC and CAADP/PEDSA implementation plans align.
Dec 2012 Some progress:
SPEED will assess whether these plans align.
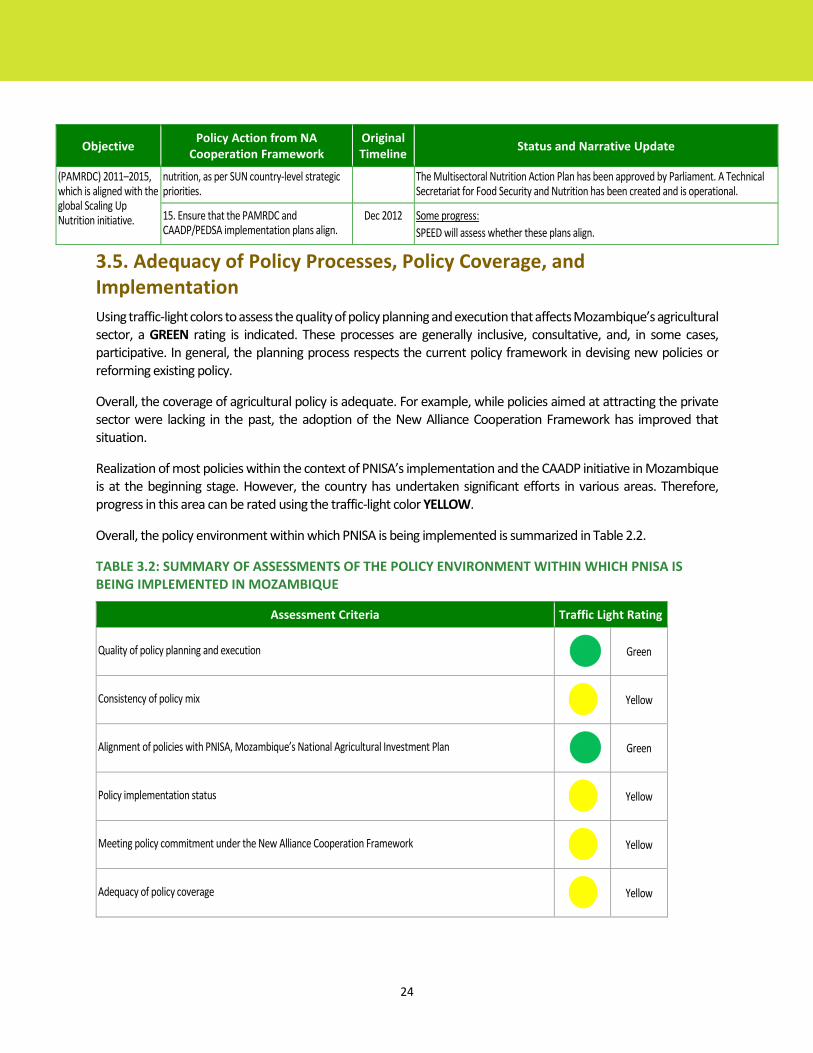
3.5. Adequacy of Policy Processes, Policy Coverage, and Implementation
Using traffic-light colors to assess the quality of policy planning and execution that affects Mozambique’s agricultural sector, a GREEN rating is indicated. These processes are generally inclusive, consultative, and, in some cases, participative. In general, the planning process respects the current policy framework in devising new policies or reforming existing policy.
Overall, the coverage of agricultural policy is adequate. For example, while policies aimed at attracting the private sector were lacking in the past, the adoption of the New Alliance Cooperation Framework has improved that situation.
Realization of most policies within the context of PNISA’s implementation and the CAADP initiative in Mozambique is at the beginning stage. However, the country has undertaken significant efforts in various areas. Therefore, progress in this area can be rated using the traffic-light color YELLOW.
Overall, the policy environment within which PNISA is being implemented is summarized in Table 2.2.
TABLE 3.2: SUMMARY OF ASSESSMENTS OF THE POLICY ENVIRONMENT WITHIN WHICH PNISA IS BEING IMPLEMENTED IN MOZAMBIQUE
Assessment Criteria Traffic Light Rating
Quality of policy planning and execution
Green
Consistency of policy mix
Yellow
Alignment of policies with PNISA, Mozambique’s National Agricultural Investment Plan
Green
Policy implementation status
Yellow
Meeting policy commitment under the New Alliance Cooperation Framework
Yellow
Adequacy of policy coverage
Yellow
25
4. INSTITUTIONAL REVIEW
4.1. Institutional Landscape of PNISA
Having reviewed the three main policy statements regarding agricultural development in Mozambique, we turn to the major actors in Mozambique’s agricultural policymaking. These participants in agricultural policymaking can be placed into four categories based on their roles.
1. At the center of the process are different bodies of government—the president; national Parliament; the provincial governments and assemblies; and the Ministry of Agriculture (MINAG), with its provincial directorates of agriculture and the District Services of Economic Activities (Serviços Distritais de Actividades Económicas), in which the district services of agriculture have been hosted since 2006. These state actors interact with each other to devise new policies or strategies within the agricultural sector that help to guide national programs and strategies and regional and international commitments made by the government of Mozambique.
2. Next are Mozambique’s development partners. As these donors play a significant role in financing many of the programs that emerge from policy redirection and reform, they also closely engage in the discussions about the design of reforms in the sector.
3. Different nongovernmental stakeholders include farmers and farmers’ groups, civil society groups, private-sector firms, and interest groups that try to influence agricultural policymaking through consultation with government bodies at different levels.
4. Finally, some policy research institutions and consultancy enterprises provide information that helps to inform decisions in Mozambique’s policymaking.
4.1.1. Ministry of Agriculture and Other State Actors
In making agricultural policies in Mozambique, the analysis, formulation, and monitoring and evaluation aspects are principally the responsibility of MINAG. In this regard, it is the responsibility of MINAG’s Technical Team and its working groups to produce policy and strategy proposals that are submitted to the consultative council and later to the council of ministers and Parliament for consideration. Most of these efforts are coordinated by the Directorate of Economics (Direcção de Economia), which is MINAG’s principal planning unit. With its provincial and district level organs, MINAG is also responsible for implementing agricultural policies and strategies and co-implementing public investment plans.
The Agricultural Sector Coordinating Committee (Comité de Coordenação do Sector Agrário, or CCSA) is at the center of the regular agricultural joint sector review (JSR) of the National Agricultural Investment Plan (Plano Nacional de Investimento do Sector Agrário, or PNISA). The JSR will ensure that all participants in PNISA’s implementation are mutually accountable for any progress made or failures encountered. The PNISA document provides an outline of a monitoring and evaluation system for the plan, which includes peer reviews, analytical studies, impact assessments, and information sharing, so that PNISA is executed at its different levels in such a way to ensure accountability and transparency in the use of funds.
A few observations can be made with regard to how MINAG is coordinating implementation. In the best case, considerable headway should have been made since PNISA’s launch in moving the plan from being a statement of intent into action. One of the initial steps identified in PNISA in this regard was to develop the coordination system for PNISA implementation centered on the CCSA. However, there is little evidence to show that this has as yet been
26
done effectively. In consequence, if responsibilities have been assigned for designing specific action plans for PNISA’s many programs and subprograms, the action plans that emerge will not be well coordinated, and there will be considerable duplication and gaps that will impede progress toward the objectives of the Strategic Plan for Agricultural Sector Development 2011–2020 (Plano Estratégico de Desenvolvimento do Sector Agrário, or PEDSA). Even without detailed knowledge of what is going on at PNISA’s program and subprogram levels, the fact that MINAG has not put in place a coordination body or other mechanisms to guide implementation tells us that PNISA’s implementation will suffer.
4.1.2. International Development Partners and Their Coordination
In Mozambique, agricultural policies and strategies are not simply local exercises undertaken without consulting development partners. Over the last two decades, Mozambique has been heavily dependent upon foreign aid.3 All of its major agricultural sector strategies have been implemented with significant support from the donor community. In consequence, most of these have been designed in consultation with the donor community. For example, the first phase of the National Program of Agricultural Development in Mozambique (Programa Nacional de Desenvolvimento Agricola de Moçambique, or PROAGRI I) was initiated and implemented as a joint effort by the government of Mozambique and the main donor agencies working in the agricultural sector. Similarly, PROAGRI II was launched through a joint agreement between the government of Mozambique and eight of Mozambique’s development partners (Gêmo 2011). The primary justification given for the donors’ strong engagement in the development of national agricultural policy is their accountability to their home governments regarding how their funds are used. This means that somewhat more problematically, they play a strong role in defining the priorities and designing the programs and other activities to which their funds are applied.
International nongovernmental organizations (NGOs), such as the Cooperative League of the United States, TechnoServe, CARE, Save the Children, World Vision, and the Netherlands Development Organization (Stichting Nederlandse Vrijwilligers) also have played key roles in the implementation of agricultural policy. Typically working in focus provinces, these organizations have provided extension service in parallel with the government’s own agricultural extension service. These organizations have also helped establish and develop smallholder farmer associations, and have helped strengthen agricultural value chains by giving farmers better links with commodity traders and other agribusinesses. Although they are not so prominent in policy processes, these organizations are important participants in the implementation of policy, so they are not totally excluded from the design of those policies.
In assessing how well MINAG coordinates development partners in the implementation of PNISA, this dimension can be marked GREEN.
4.1.3. Nonstate Actors in Agricultural Development
Another potentially important set of actors in agricultural policymaking in Mozambique is civil society organizations. For instance, the National Farmers’ Union (União Nacional dos Camponeses, or UNAC), an umbrella organization of 58 unions and 1,243 farmer associations and cooperatives, was established to be a voice for small farmers in rural development and agricultural policymaking. UNAC has also been involved in activities that include farmers’ training, information dissemination, and advocacy campaigns. Similarly, the Rural Organization for Mutual Support (Organização Rural de Ajuda Mútua, or ORAM) is another agriculturally focused civic organization that has
3 In 2011, official development assistance to Mozambique accounted for 42.3 percent of the national budget and 14.9 percent of the gross domestic product (MINAG 2013).

27
participated in Mozambique’s rural and agricultural policymaking. ORAM has primarily focused on land reform issues, particularly in helping rural communities to understand and protect their land rights.
Although they are few in number and are somewhat underrepresented in consultations and policy discussions, the private agricultural service providers also play a role in agricultural policymaking. The Confederação das Associações Económicas (CTA), the confederation of different associations of small private agricultural service providers, promotes the interests of these groups in agricultural policymaking. Similarly, sector-specific associations for participants in the cashew, cotton, and sugar value chains use the CTA to channel their opinions and concerns to the government as part of these policy processes (MINAG 2010), as does the Nampula Commercial and Industrial Association in Nampula Province. However, most participants in Mozambique’s agricultural policy processes would agree that the country’s own private-sector and civil society organizations rarely, if ever, play a leading role in fostering policy change in the agricultural sector. The government and its development partners, generally in some sort of partnership, lead such efforts at policy formulation. While consultations with the private sector and civil society take place, they are viewed by many somewhat cynically as token, obligatory exercises that do not bring significant new perspectives into the process or affect the policy choices that end up being made (Africa Lead and EAT 2013). There is a need to strengthen their role as effective advocates in determining the priorities for agricultural development in Mozambique, rather than leaving it primarily to the government agencies.
4.1.4. Policy Research Institutions
Although a substantial number of research institutions and consultancy enterprises are involved in agricultural policy research in Mozambique, there is as yet no core body of Mozambican analysts and policy research institutions in place upon which government, donors, civil society, and the private sector can rely for objective analysis and recommendations. The government still relies on international research and education organizations for evidence to guide many policy choices in agriculture. These include development partners, such as the World Bank and that the United States Agency for International Development, which undertake significant research to guide their investments in Mozambique. These organizations also include more dedicated research groups, such as Michigan State University, which has an almost 20-year history of providing policy research and capacity building in the agricultural sector in Mozambique, and the Consultative Group on International Agricultural Research (CGIAR) international agricultural research centers. Among the CGIAR centers, the International Food Policy Research Institute has a particular focus on policy research to advance agricultural development and ensure food and nutrition security in Mozambique. The Regional Strategic Analysis Knowledge Support System for Southern Africa office also has played a key role in supporting the Comprehensive Africa Agriculture Development Program in Mozambique in the design and initial implementation of PNISA. However, because these organizations are international, to a large degree, they are not integral to many of these policy processes
The capacity for agricultural policy research in domestic institutions is found primarily within the government in the Ministry of Finance (Ministério das Finanças), the Ministry of Planning and Development (Ministério da Planificação e Desenvolvimento), and MINAG. Such capacity is also found within the principal university in the country—Eduardo Mondlane University (Universidade Eduardo Mondlane, or UEM)—and within some smaller domestic policy research institutes and consultancy enterprises. While these Mozambican analysts may have a greater ability and wider range of avenues than international researchers to contribute evidence and other information to policy decisions, their technical expertise is only one element of what drives agricultural policy decisions. In Mozambique, as in other countries, technically optimal policy solutions need to align with overriding political considerations before those optimal solutions will advance into policy.
Even with Mozambique’s capacity for agricultural policy research described above, there is a continuing need to build this national capacity to undertake sound technical policy analyses in the agricultural sector. An initiative is
28
now well advanced for establishing a Center for Research in Agro-Food Policies (Centro de Estudos em Políticas e Programas Agro-alimentares). This center is to be hosted within UEM and would operate independently of government, but it would be expected to function in a manner that would build policy research capacity across relevant ministries, including MINAG. The initiative for establishing the center has been under discussion for more than two years, and commitments of political and financial support have been made toward its establishment.
4.2. Strengthening Institutional Implementation Capacity
Beyond sketching three levels of coordination for the plan, the PNISA document does not specify a detailed institutional framework for its implementation. Existing government institutions and others with responsibility for the PNISA programs and subprograms are expected to be involved in the implementation of the action plan, with oversight and coordination provided by the CCSA or regional or district coordination bodies.
Here only a few action steps are highlighted. These flow from the discussion above.
Operationalize the CCSA to coordinate activities under PNISA and to ensure that those activities are adequately monitored.
Assign the CCSA the task of developing a set of mutually agreed-upon milestones and targets for five performance areas:
o Broad development objectives;
o Overall agricultural sector growth targets, with specific subsector and commodity-specific
targets;
o Financial and nonfinancial resources required for implementation;
o Policies, programs, institutions, and implementation processes; and
o Linkages in the agricultural sector that connect investments to sector performance.
MINAG should build stronger links with national stakeholders in PNISA’s implementation to build a stronger sense of accountability on the part of private sector and civil society organizations, including farmers’ organizations.

29
5. REVIEW OF KEY FINANCIAL COMMITMENTS
In 1995, the World Bank initiated a third public expenditure review exercise for Mozambique that was more broad based than previous exercises, entailing institutional and organizational dimensions. This review was also more process-oriented, with a much stronger role for the Ministry of Planning and Finance. After several bank-led missions had taken place, the process was fully taken over by the ministry, which then developed its own public finance management reform program. This program was presented to the donor community at the Consultative Group meeting in 1996. This program has since been the backbone of the ministry’s reform efforts, and strongly emphasizes capacity building, new legislation, reforms in revenue and expenditure structures and management, upgrading of skills, and better reporting and statistical information. The program’s central objectives are to increase the coverage and transparency of public expenditure management, to ensure the efficiency and effectiveness of public expenditure programs that support policy objectives, and to guarantee the long-term fiscal sustainability of public programs.
5.1. Government—Agricultural Public-Sector Financing
The Strategic Plan for Agricultural Sector Development 2011–2020 (Plano Estratégico de Desenvolvimento do Sector Agrário, or PEDSA) establishes a target of a 7 percent agricultural growth rate per year, a percentage point higher than that called for under the Comprehensive Africa Agriculture Development Program (CAADP). One of the major challenges in drafting and effectively implementing the National Agricultural Investment Plan (Plano Nacional de Investimento do Sector Agrário, or PNISA) is determining the amount and types of investments needed to achieve its objectives (Mogues and Benin 2013). To do this, close analysis of past public expenditures in the agricultural sector is required. Close analysis of the outputs that can be attributed to those investments is also required.
In the past four years there have been at least four analyses of public expenditures in Mozambican agriculture to examine how the levels and composition of public investment in the sector have changed over time (Zavala et al. 2011; World Bank 2011; Chilonda et al. 2011; and Mogues and Benin 2013). MINAG, with the support of MAFAP, is currently completing a public expenditures review covering the period 2009–2014. Based on official data retrieved from e-SISTAFE, the review offers a detailed analysis of the level, composition, and coherence of public expenditure in support of food and agriculture in the country. It identifies patterns of support to the agriculture sub-sectors (research, input subsidies, infrastructure etc.) and commodities over time, by type and sources of funding (for MAFAP methodology, refer to Ghins et al. 2013). Although these analyses were not necessarily conducted independently of each other, they did differ in focus, and so provide different insights into how public investment in agriculture could lead to more sustainable growth. The analyses by Zavale et al. (2011) and the World Bank (2011), although comprehensive, only consider the period up until 2007. The analysis conducted by Chilonda et al. (2011), with contributions from the Regional Strategic Analysis Knowledge Support System for Southern Africa Mozambique office, covered the period from 2000 to 2009. MINAG launched the analysis by Chilonda et al. in September 2011 with a public event chaired by the Minister of Agriculture. The analysis addressed pertinent macroeconomic issues, such as year-to-year total and food inflation rates, exchange rates, deposit and lending interest rates, and rates that measure the costs of doing business. Chilonda et al. (2011) also addressed the share of national budget going to agriculture, growth in the agricultural sector, agricultural trade performance, and poverty and hunger outcomes. Despite this, more recent expenditures are not considered.
Among the key findings of these assessments are the following:
30
Although budget allocations for agriculture have hovered around 10 percent, actual spending in the sector has been somewhat less. The average public spending on agriculture between 2001 and 2007 was 6.8 percent of total government spending—considerably below the CAADP target of 10 percent. This mismatch between what is budgeted and what is actually spent is attributed to complex procurement processes, public accounting requirements, and delays in the disbursement of funds from development partners.
Most public agricultural expenditure is on salaries and other transfers, including institutional overheads. Spending on agricultural research and development, support to farmers, and provision of other agricultural services accounts for only about one-quarter of expenditures.
A spatial assessment of where agricultural funds are spent shows that the provinces that are most important in terms of agricultural output and their contributions to total agricultural gross domestic product generally are least favored in the allocation and spending of public funds for agricultural development.
There is a mismatch between the commodities and functions that are given budget priority and what research evidence indicates the priorities should be. For example, wheat is given considerable attention, while cassava is not. Irrigation expenditures are significant, while those for agricultural extension are neglected, even though there is clear evidence that agricultural extension services are far more likely than irrigation schemes to help reduce rural poverty and promote broad growth in Mozambique’s rural economy.
Subsidies are not a prominent part of government expenditure in agriculture, at least over the time period considered. Implicit subsidies are seen in the cashew sector, since the government provides services that arguably the private sector could manage on its own. However, since 2007, there has been some experimentation with subsidized provision of inputs with a voucher-based fertilizer and seed program. The program targets 25,000 smallholder farmers in five provinces of central and northern Mozambique. The Action Plan for Food Production (Plano de Acção para a Produção de Alimentos), which was implemented from the 2008/2009 to the 2010/2011 agricultural seasons, also included subsidies for improved seeds.
MINAG and its agencies obtained just under 50 percent of their expenditures in 2007 from domestic resources, with externally provided funds covering the balance.
Information about private investments in agriculture is not available and may not exist. This is critical in the context of Mozambique’s development ambitions, since the Five–Year Program of Government (Plano Quinquenal do Governo), the master development framework, and PEDSA explicitly conceive the primary role of government as enabling private investment and private-sector development.
All of the agricultural public expenditure review reports stated that the insights for future planning that could be obtained from the analysis of public expenditure were constrained by a lack of sufficiently disaggregated data along functional, geographical, subsectoral, or commodity lines. Moreover, the analysts reported obtaining conflicting information, depending on the source and the accounting system used. Perhaps most important, the quality and structure of the public expenditure data on agriculture was insufficient to allow for strong value-for-money assessments to be made. Thus, in the case of the CAADP–Mozambique process, it would be very difficult using current public accounts data to tell if expenditures made under the PNISA framework were effective at making progress toward the agricultural development goals of PEDSA.
Mogues and Benin (2013) take their agricultural public expenditure analysis a step further by calculating what budget allocations are needed to attain the goals set in PEDSA. These calculations are based on past relationships

31
observed in Mozambique and elsewhere between public expenditures of various sorts in agriculture and the economic growth in that sector that can be attributed in some sense to that public expenditure. They assert that the public expenditures required to achieve 7 percent annual growth in the agricultural sector, the PEDSA target, will need to grow at a rate of 17.5–20.9 percent per year, which is considerably higher than current growth in public expenditures in agriculture. Moreover, there will need to be a reallocation of expenditure toward investments that will bring about technical change and efficiencies in agricultural production—and away from simply investing in the use of current factors of production under existing technology. An implicit assumption in this analysis is that the capacity of those managing these growing public investments in agriculture will expand appropriately to absorb the increase in public investment. As such, capacity development is a key element in achieving the agricultural development goals laid out in PEDSA and supported by the CAADP–Mozambique process.
5.1.1. Budget Trends
The total public expenditure budgeted in Mozambique every year has experienced a steady growth rate in nominal terms, ranging between 25 percent and 14.3 percent, with an average of 18 percent between 2009 and 2014 for budgeted expenditure (Figure 5.1). For actual expenditure, the growth rate has been similar, at an average of 17 percent over the period until 2013. That year, the growth of actual expenditure slowed down, with a 6 percent increase from 2012, 11 points below the average for the period. The execution rate was particularly low for 2013, at 82.7 percent, compared with an average of 87.2 percent for 2009–2012. This is explained in part by the fact that data were collected on March 23, 2014—two months before the definitive closure of the period to update expenditures made in 2013.
FIGURE 5.1: TOTAL PUBLIC EXPENDITURE IN MOZAMBIQUE, 2009–2014 (THOUSANDS OF METICALS)
Source: Bibi F. et al. 2014 (draft version)..
Note: *Information for 2013 up to the March 23, 2014, update. ** Budgeted data.
When adjusted for inflation, budget expenditure for the period between 2009 and 2014 grew by an average of 9.9 percent. Data on executed expenditures between 2009 and 2013 in real values presented a similar average increase of 9 percent (Table 5.1).
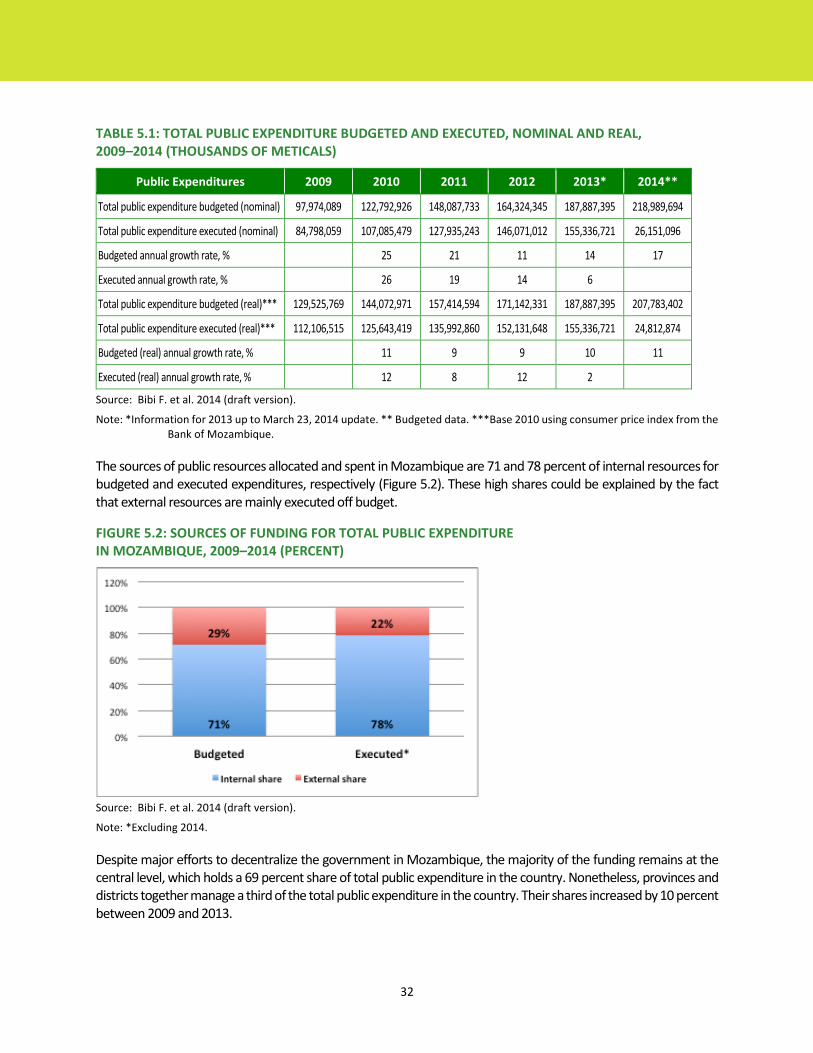
32
TABLE 5.1: TOTAL PUBLIC EXPENDITURE BUDGETED AND EXECUTED, NOMINAL AND REAL, 2009–2014 (THOUSANDS OF METICALS)
Public Expenditures 2009 2010 2011 2012 2013* 2014**
Total public expenditure budgeted (nominal) 97,974,089 122,792,926 148,087,733 164,324,345 187,887,395 218,989,694
Total public expenditure executed (nominal) 84,798,059 107,085,479 127,935,243 146,071,012 155,336,721 26,151,096
Budgeted annual growth rate, % 25 21 11 14 17
Executed annual growth rate, % 26 19 14 6
Total public expenditure budgeted (real)*** 129,525,769 144,072,971 157,414,594 171,142,331 187,887,395 207,783,402
Total public expenditure executed (real)*** 112,106,515 125,643,419 135,992,860 152,131,648 155,336,721 24,812,874
Budgeted (real) annual growth rate, % 11 9 9 10 11
Executed (real) annual growth rate, % 12 8 12 2
Source: Bibi F. et al. 2014 (draft version).
Note: *Information for 2013 up to March 23, 2014 update. ** Budgeted data. ***Base 2010 using consumer price index from the Bank of Mozambique.
The sources of public resources allocated and spent in Mozambique are 71 and 78 percent of internal resources for budgeted and executed expenditures, respectively (Figure 5.2). These high shares could be explained by the fact that external resources are mainly executed off budget.
FIGURE 5.2: SOURCES OF FUNDING FOR TOTAL PUBLIC EXPENDITURE IN MOZAMBIQUE, 2009–2014 (PERCENT)
Source: Bibi F. et al. 2014 (draft version).
Note: *Excluding 2014.
Despite major efforts to decentralize the government in Mozambique, the majority of the funding remains at the central level, which holds a 69 percent share of total public expenditure in the country. Nonetheless, provinces and districts together manage a third of the total public expenditure in the country. Their shares increased by 10 percent between 2009 and 2013.

33
5.2. Commitments of Nonstate Actors
In early 2013, 17 companies signed letters of intent to Mozambique under the Grow Africa initiative that outlined company plans to contribute to sustainable agricultural development through specific investments in various commodities and value chains. During 2013, many of these initiatives advanced, if slowly. Some companies have made significant progress. For example SABMiller sustained 450 percent growth in its locally sourced cassava beer, and Sunshine Nuts’ factory now exports to South Africa and the United States.
The majority of companies reported progress in laying the necessary foundations for future scale-up, especially of smallholder sourcing and production. For example, Corvus is investing in a 600-hectare macadamia farm. Cargill surveyed the country for suitable outgrower farm locations and established the basis for long-term off-take agreements to source maize from 50,000 smallholders by 2018. Nearly all companies that report making progress are working in partnership with donors, nongovernmental organizations, the government, or impact investors to help overcome investment barriers.
However, despite this progress, the private sector remains cautious about investing due to a range of constraints, including poor access to infrastructure, bureaucracy, cost of finance, taxes, policy and regulatory issues, and limited technical capacity. Several planned investments were severely delayed, revised, or canceled for such reasons. The government, along with some of its partners, is working to overcome these barriers by making major upgrades to road and rail networks, keeping central bank interest rates low, providing loan guarantees, and clarifying processes for investors through the creation of manuals for investing in the country.
The Center for the Promotion of Commercial Agriculture (Centro de Promoção da Agricultura, or CEPAGRI) has also established an investor facilitation team to service potential investors in need of assistance or basic agribusiness information. Given growing demand from a wide range of such investors, the government used funding from the United States Agency for International Development to hire a dedicated consultant whose job is to support those companies with letters of intent. To date, the facilitation team has attended to the needs of 71 companies, both national and international, some of which CEPAGRI continues to assist after their initial inquiry. A number of these companies have advanced significantly with registration and expansion of their activities within the country. The facilitation team has also assisted the signing of an investment agreement with the Dutch Agricultural Trade and Development Company, and helped broker a memorandum of understanding between an international firm and the Mozambican Cotton Institute. Nevertheless, increasing demand from new and longstanding partner companies is stretching CEPAGRI’s capacity.
Figure 5.3 provides a detailed progress update on the status of the letters of intent. While only six companies who signed letters provided data, the quantitative outcomes achieved by these six include the following:
The total value of new private-sector investment made in 2013 in the agricultural sector in Mozambique is $91 million, consisting of $90 million of capital expenditure and $1 million of operating expenditure.
The total jobs created were 1,430, with 67 percent of the jobs occupied by women.
The total number of smallholder farmers reached by these companies is 225,000, with 18 percent of these being women.

34
FIGURE 5.3: LETTERS OF INTENT IMPLEMENTATION PROGRESS AS OF 2014
5.3. Financial Commitments of Mozambique’s Development Partners
Group of Eight members and other development partners have made commitments in support of the PNISA investment plan and the goals of the New Alliance for Food Security and Nutrition. Table 5.2 lists the financial commitments made by Mozambique’s development partners based on information they provided.
TABLE 5.2: FINANCIAL COMMITMENTS OF THE DEVELOPMENT PARTNERS OF MOZAMBIQUE UNDER PNISA AND THE NEW ALLIANCE COOPERATION FRAMEWORK (THOUSANDS OF US DOLLARS)
Development Partner
Nondirect Sector
Support
Direct Budget Support
Total Commitment
Estimated Committed
to June 2014
Disbursement to Date
% Disbursed
against Committed
Alliance for a Green Revolution in Africa— AGRA
3,259 – 3,259 1,634 817 50
Swedish International Development Cooperation Agency
33,379 – 33,379 11,320 6,910 61
Austrian Development Cooperation – 7,740 7,740 4,515 1,367 30
Belgium 47,606 41,368 88,974 22,144 4,231 19
Denmark 36,000 – 36,000 21,600 15,225 70
Embassy of Japan 15,000 121 15,121 4,121 2,121 51
European Union – 32,076 32,076 9,876 2,490 25
Food and Agriculture Organization of the United Nations (FAO)
872 – 872 789 369 47
FAO – United Nations Environment Programme
249 – 249 249 42 17
7%
20%
33%
27%
7%
7%
Complete
Performing well
On plan
Minor problems
Major problems
Cancelled

35
Development Partner
Nondirect Sector
Support
Direct Budget Support
Total Commitment
Estimated Committed
to June 2014
Disbursement to Date
% Disbursed
against Committed
FAO – Brazil 500 – 500 500 195 39
FAO – Global Environment Facility 12,600 – 12,600 100 –
FAO - Global Environment Facility 1,950 – 1,950 1,950 117 6
FAO – Government of Mozambique 1,969 – 1,969 1,969 270 14
FAO – Italy 4,122 – 4,122 4,122 3,435 83
FAO – United Nations "One Fund" 970 – 970 970 208 21
Finland 19,442 – 19,442 7,777 3,888 50
International Fund for Agricultural Development (IFAD)
108,700 – 108,700 28,950 11,851 41
IFAD – Belgian Fund for Food Security 916 – 916 305 – 0
IFAD – European Union (EU) 51,600 – 51,600 12,900 6,038 47
IFAD – Spain 45,000 – – 45,000 6,429 14
International Fertilizer Development Center 2,900 – – 2,900 –
– 3,220 50
Ireland 14,900 – 14,900 6,441 3,220 50
Japan International Cooperation Agency 6,653 51,838 58,491 23,339 11,940 51
Spain 12,843 – 12,843 5,481 3,326 61
Swiss Agency for Development and Cooperation
28,722 – 28,722 8,418 2,909 35
United Kingdom Action for Social Integration (DFID)
– 48,524 48,524 13,353 6,676 50
United States Agency for International Development
212,354 – 212,354 66,400 36,200 55
World Food Programme – EU 15,800 – – 7,000 3,500 50
World Bank 144,000 – 144,000 23,731 11,866 50
Total 837,204 181,668 955,172 344,295 148,859 43
Source: Development Partner Tracking Exercise Conducted by SPEED/USAID.
Note: The fiscal year being considered here is from July 1, 2013, to June 30, 2014.

36
5.4. Conclusions
Over the period of analysis, there generally has been an annual increase in the total national budget and in the share of that budget allocated to the agricultural sector in Mozambique. However, growth in resources spent on agriculture has been lower than for the general sector. Despite its constant increase, public expenditure on agriculture only met the Maputo target of 10 percent of the general budget in 2010 and in the budget allocation for 2014. However, if we consider only more narrowly defined agriculture-specific expenditure, the Maputo target is never met, even in the 2014 budget, the highest of the period.
The agriculture budget for 2014 shows a marked increase from 2013, resulting mainly from an increase in external resources. The source of funds for the budget allocation this year differs from the general trend of previous years, which showed an increase in the internal share of agricultural expenditures. However, it is still early to say if this budget will be spent effectively. Results from previous years show that the execution rate for the agricultural sector is low, even relative to the general budget execution rate—74 and 86 percent, respectively. Given that the 2014 budget increase is mainly due to an increase in the share of external resources, budget execution rates will be especially relevant. This is in light of the fact that the external execution rate has been significantly lower than that of the internal component—60 and 92 percent, respectively. This means that efforts should be made to increase the coordination between external partners and the government, as well as with the execution capacity of the government.
The expended budget supporting agricultural development for the period 2009–2013 is composed mainly of agriculture-specific policies, which accounted for 60 percent of the total agricultural budget. The rest is allocated to expenditures that support agricultural development. This trend is reinforced in the 2014 budget, with agriculture-specific expenditures accounting for 70 percent of the budget.
Overall, most agriculture-specific public expenditures between 2009 and 2013 were aimed at the provision of public services and investments (57 percent), with a relatively strong focus on training, extension services, and research, but with an important share in agricultural infrastructure. This general trend is reinforced in the 2014 budget, which increases the share in agricultural infrastructure to 72 percent. However, in 2014 the share allocated to marketing also increased significantly relative to previous years.
The government, development partners, and private sector can all be given a YELLOW grade in terms of meeting their commitments under PNISA and the New Alliance, in that, while none has met all commitments, they are making significant progress.
37
6. AGRICULTURAL SECTOR PERFORMANCE
6.1. Introduction
This chapter maps the performance of the agricultural sector in Mozambique for the past 14 years (with special attention accorded to the last four years, 2010 through 2013). The performance of this sector is charted against the baseline sectoral performance indicators listed in the National Agricultural Investment Plan (Plano Nacional de Investimento do Sector Agrário, or PNISA), the Comprehensive Africa Agriculture Development Program (CAADP) framework, and the Regional Indicative Strategic Development Plan (RISDP) of the Southern African Development Community (SADC). In monitoring the sector’s performance under PNISA, it is vital to gauge the progress made in the sector and further compare that progress against these national and regional targets. Since Mozambique subscribes to the CAADP framework, all the targets set should be met, in order to enhance the growth and development of the country’s economy through agriculture and, at the same time, curtail poverty.
This chapter presents several trends in the performance of the agricultural sector in Mozambique. These include the investment of the public sector in agriculture against the 2003 Maputo Declaration target of 10 percent of the national budget, crop and livestock production performance against CAADP targets, land and labor productivity, total agricultural trade performance (agricultural imports and exports and food imports), and poverty trends (the Global Hunger Index and the proportion of the population below minimum dietary energy consumption).
6.2. Structure of the Mozambique Agricultural Sector
About 70 percent of Mozambique’s population lives in rural areas and obtains its livelihood from agriculture (Chilonda et al. 2011). The contribution of agriculture to Mozambique’s gross domestic product (GDP) was relatively stable between 2001 and 2010, with its share ranging between 24.2 and 25.6 percent annually (Chilonda et al. 2012). Given important investments in mining and natural gas extraction in Mozambique over the past five years, more recent data, once available, will likely show a reduction in agriculture’s contribution to Mozambique’s economic output. Nevertheless, the value of agriculture’s contribution likely will not have declined, and possibly may have increased. This is due to the increased mining-related output in recent years, which is expanding the size of Mozambique’s economy as a whole, which grew by more than 7 percent in both 2011 and 2012.
Crop production makes up 78 percent of the country’s total agricultural GDP, while the livestock subsector contributed 6 percent. The fisheries and forestry subsectors are considered part of the agricultural sector, and contributed 7 percent and 9 percent, respectively.4 The main food crops in Mozambique are cassava, sweet potato, maize, rice, sorghum, millet, and pulses. Food crops account for 90 percent of total crop production. Cash crops include cotton, tobacco, cashew, coconut, and fruit. The principal livestock produced are cattle, goats, and poultry. Most animals are raised under extensive systems making use of local pasture and other feed resources (Rosário 2012). Cotton, tobacco, cashew, and, more recently, sesame are major export crops for Mozambique. Sugar and, to a lesser extent, tea are other industrial agricultural products of significance (Chilonda et al. 2012).
The considerable agro-ecological variation across the country results in notable regional heterogeneity in agricultural production. Northern Mozambique agriculturally is more productive than the southern half of the country. Nampula, Zambezia, Manica, northeastern Tete, and parts of Niassa provinces are generally considered to be the highest-potential agricultural areas of Mozambique. However, subsistence production is common
4 In this report, the agricultural production activities of interest are those related to crops and livestock. Fisheries and forestry are only considered when they are part of the aggregate agricultural sector of Mozambique’s economy for statistical or other purposes.
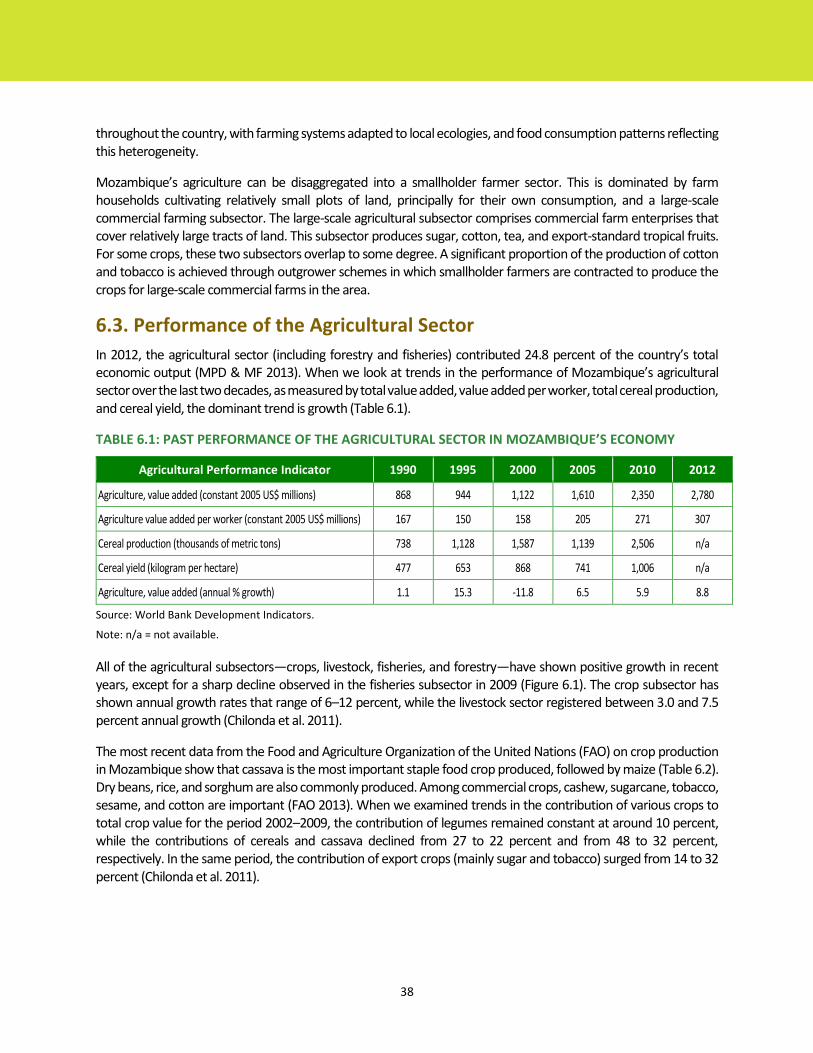
38
throughout the country, with farming systems adapted to local ecologies, and food consumption patterns reflecting this heterogeneity.
Mozambique’s agriculture can be disaggregated into a smallholder farmer sector. This is dominated by farm households cultivating relatively small plots of land, principally for their own consumption, and a large-scale commercial farming subsector. The large-scale agricultural subsector comprises commercial farm enterprises that cover relatively large tracts of land. This subsector produces sugar, cotton, tea, and export-standard tropical fruits. For some crops, these two subsectors overlap to some degree. A significant proportion of the production of cotton and tobacco is achieved through outgrower schemes in which smallholder farmers are contracted to produce the crops for large-scale commercial farms in the area.
6.3. Performance of the Agricultural Sector
In 2012, the agricultural sector (including forestry and fisheries) contributed 24.8 percent of the country’s total economic output (MPD & MF 2013). When we look at trends in the performance of Mozambique’s agricultural sector over the last two decades, as measured by total value added, value added per worker, total cereal production, and cereal yield, the dominant trend is growth (Table 6.1).
TABLE 6.1: PAST PERFORMANCE OF THE AGRICULTURAL SECTOR IN MOZAMBIQUE’S ECONOMY
Agricultural Performance Indicator 1990 1995 2000 2005 2010 2012
Agriculture, value added (constant 2005 US$ millions) 868 944 1,122 1,610 2,350 2,780
Agriculture value added per worker (constant 2005 US$ millions) 167 150 158 205 271 307
Cereal production (thousands of metric tons) 738 1,128 1,587 1,139 2,506 n/a
Cereal yield (kilogram per hectare) 477 653 868 741 1,006 n/a
Agriculture, value added (annual % growth) 1.1 15.3 -11.8 6.5 5.9 8.8
Source: World Bank Development Indicators.
Note: n/a = not available.
All of the agricultural subsectors—crops, livestock, fisheries, and forestry—have shown positive growth in recent years, except for a sharp decline observed in the fisheries subsector in 2009 (Figure 6.1). The crop subsector has shown annual growth rates that range of 6–12 percent, while the livestock sector registered between 3.0 and 7.5 percent annual growth (Chilonda et al. 2011).
The most recent data from the Food and Agriculture Organization of the United Nations (FAO) on crop production in Mozambique show that cassava is the most important staple food crop produced, followed by maize (Table 6.2). Dry beans, rice, and sorghum are also commonly produced. Among commercial crops, cashew, sugarcane, tobacco, sesame, and cotton are important (FAO 2013). When we examined trends in the contribution of various crops to total crop value for the period 2002–2009, the contribution of legumes remained constant at around 10 percent, while the contributions of cereals and cassava declined from 27 to 22 percent and from 48 to 32 percent, respectively. In the same period, the contribution of export crops (mainly sugar and tobacco) surged from 14 to 32 percent (Chilonda et al. 2011).

39
FIGURE 6.1: ANNUAL GROWTH OF THE SUBSECTORS IN MOZAMBIQUE’S AGRICULTURAL SECTOR, 2003–2009
Source: Chilonda et al. 2011.
TABLE 6.2: PRODUCTION AND VALUE OF MAJOR CROPS IN MOZAMBIQUE, 2012
Commodity
Production (‘000s metri
c tons)
Value (USD
millions)
Cassava 10,094 1,054
Sugarcane 3,396 112
Maize 2,179 262
Sweet potato 860 65
Sorghum 410 60
Banana 341 96
Rice 271 70
Pulses 229 120
Beans, dry 200 88
Vegetables, other 200 38
Tomato 195 72
Fruit, other 133 46
-10
-5
0
5
10
15
2003 2004 2005 2006 2007 2008 2009
An
nu
al g
row
th r
ate,
%
Crops
Livestock
Forestry
Fisheries
CAADP target of 6 percent annual growth in agricultural sector

40
Commodity
Production (‘000s metri
c tons)
Value (USD
millions)
Cashew 113 99
Sesame 105 69
Tobacco 70 111
Cotton lint 36 51
Source: FAO 2013.
Considering trends in the production of food crops, the total production of cassava in 2012 was 10.1 million metric tons (mt), about a twofold increase in the production level of 2000. Similarly, the total production of sweet potato in 2012 was 900,000 mt, also double the production level in 2000. However, national production levels for both crops over the period 2000–2012 were erratic, and much of the increase was due to growth since 2005. Maize, the other important staple crop, showed declining production nationally between 2000 and 2005, with growth thereafter. However, this growth has not been consistent, because maize production decline sharply in in 2012. Trends in the production of the other major food crops have generally been an increase in production levels, but the pattern from year to year for many of them has been somewhat erratic.
Unlike the major food crops, the production trend for several of the major commercial crops has been one of steady growth over the past 20 years. Sugarcane production has increased more than tenfold, with the major expansion occurring in the last decade. Similarly, the national annual production of tobacco increased from about 3,000 mt in 1990 to 70,000 mt in 2011. Although not as dramatic, cotton production has also significantly increased, particularly since 2000.
To determine the source of production growth by crop—whether from yield increases on existing cropland or from simply expanding the area planted with a particular crop—Chilonda et al. (2011) computed the annual growth in area planted and in total production for the major staple crops for 2002 to 2008. Among major crops, the land planted with maize, which comprised 38 percent of all the country’s cultivated land in 2008, increased from 1.17 million to 1.96 million hectares between 2002 and 2008—an average growth of 2.3 percent per year. However, maize production increased by only 0.6 percent per year, indicating a slight decline in yields overall. Cassava, planted on 24 percent of Mozambique’s cultivated land, showed a 0.8 percent annual decline in national production, with almost no increase in the area planted with that crop. Beans, planted on 13 percent of the country’s cultivated land in 2008, showed a 4.1 percent per year increase in planted area, while production increased at a slower rate of 1.8 percent per year. This analysis indicates that land productivity declined from 2002 to 2008, at least for the major smallholder crops. The growth in Mozambique’s crop production has been driven mainly by the increase in hectares under cultivation, an expansion of land with very little or no change in output per hectare.
Figure 6.2 is an updated comparison between the growth in production and the expansion of Mozambique’s cultivated land for important crops between 2008 and 2012. This comparison uses more recent data from FAOSTAT, FAO’s Statistics Division. It shows that things have not changed much since the period 2000–2008.
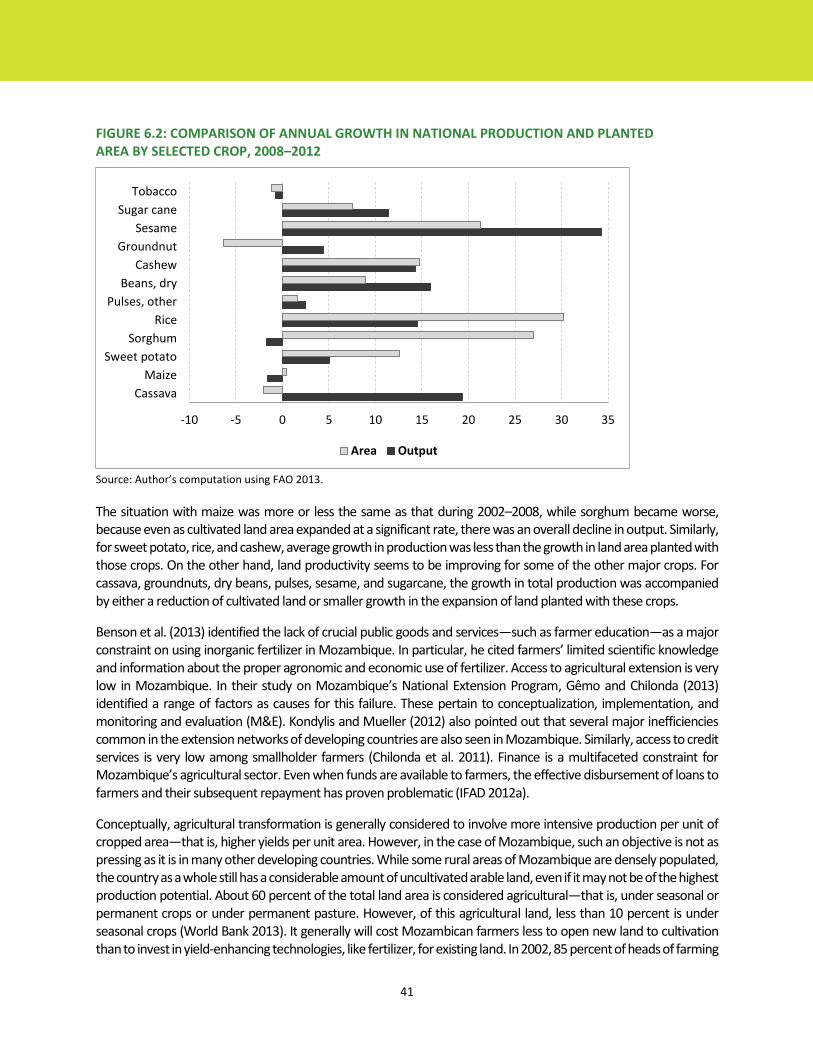
41
FIGURE 6.2: COMPARISON OF ANNUAL GROWTH IN NATIONAL PRODUCTION AND PLANTED AREA BY SELECTED CROP, 2008–2012
Source: Author’s computation using FAO 2013.
The situation with maize was more or less the same as that during 2002–2008, while sorghum became worse, because even as cultivated land area expanded at a significant rate, there was an overall decline in output. Similarly, for sweet potato, rice, and cashew, average growth in production was less than the growth in land area planted with those crops. On the other hand, land productivity seems to be improving for some of the other major crops. For cassava, groundnuts, dry beans, pulses, sesame, and sugarcane, the growth in total production was accompanied by either a reduction of cultivated land or smaller growth in the expansion of land planted with these crops.
Benson et al. (2013) identified the lack of crucial public goods and services—such as farmer education—as a major constraint on using inorganic fertilizer in Mozambique. In particular, he cited farmers’ limited scientific knowledge and information about the proper agronomic and economic use of fertilizer. Access to agricultural extension is very low in Mozambique. In their study on Mozambique’s National Extension Program, Gêmo and Chilonda (2013) identified a range of factors as causes for this failure. These pertain to conceptualization, implementation, and monitoring and evaluation (M&E). Kondylis and Mueller (2012) also pointed out that several major inefficiencies common in the extension networks of developing countries are also seen in Mozambique. Similarly, access to credit services is very low among smallholder farmers (Chilonda et al. 2011). Finance is a multifaceted constraint for Mozambique’s agricultural sector. Even when funds are available to farmers, the effective disbursement of loans to farmers and their subsequent repayment has proven problematic (IFAD 2012a).
Conceptually, agricultural transformation is generally considered to involve more intensive production per unit of cropped area—that is, higher yields per unit area. However, in the case of Mozambique, such an objective is not as pressing as it is in many other developing countries. While some rural areas of Mozambique are densely populated, the country as a whole still has a considerable amount of uncultivated arable land, even if it may not be of the highest production potential. About 60 percent of the total land area is considered agricultural—that is, under seasonal or permanent crops or under permanent pasture. However, of this agricultural land, less than 10 percent is under seasonal crops (World Bank 2013). It generally will cost Mozambican farmers less to open new land to cultivation than to invest in yield-enhancing technologies, like fertilizer, for existing land. In 2002, 85 percent of heads of farming
-10 -5 0 5 10 15 20 25 30 35
Cassava
Maize
Sweet potato
Sorghum
Rice
Pulses, other
Beans, dry
Cashew
Groundnut
Sesame
Sugar cane
Tobacco
Area Output
42
households reported that they could obtain more agricultural land in their communities if needed (Walker et al. 2004).
6.4. Assessing Agricultural Development Achievements under PNISA
An assessment is provided here of what has been achieved in PNISA’s implementation and where actions should be taken to strengthen this process. This is done by undertaking a somewhat subjective SWOT (strengths, weaknesses, opportunities, and threats) analysis of PNISA’s implementation over the past year. Thereafter, several of the key PNISA and CAADP performance indicators are considered in turn.
The aim is to synthesize and categorize the materials presented in the previous sections on how progress to date under the PNISA serves to advance Mozambique towards the objectives it has set for itself for agricultural development under the Strategic Plan for Agricultural Sector Development (Plano Estratégico de Desenvolvimento do Sector Agrário, or PEDSA). Here, independent assessments are provided of the activities under the various programs and subprograms of PNISA. Similarly, at a higher level of coordination, the actions of the various stakeholders in agricultural development in Mozambique within the PEDSA framework need to be considered against the commitments that they made to advance PNISA’s implementation. This information is necessary so that those involved in the joint sector review (JSR) have a relatively clear understanding of where in the action plan successes are being realized and, more important, where more thought is needed, whether it is about implementation methods or a change in course to address failures. These assessments allow for mutual accountability among the stakeholders and should foster a sense of joint responsibility to correct problems as they are identified.
However, PNISA was only made public in April 2013. Most readers of the PNISA document will quickly observe that the 21 programs and 61 subprograms of this law require considerable elaboration before implementation can begin for any of them. More specific to the purpose of this analytical report, the PNISA document provided nothing more than an outline of how PNISA’s implementation should be evaluated and monitored. The Agricultural Sector Coordinating Committee (Comité de Coordenação do Sector Agrário, or CCSA) needed to be constituted, and its mode of operation needed to be determined.
6.4.1. SWOT Analysis
To assess implementation progress to date, we use a brief SWOT analysis. In doing so, we focus on the quality of execution and the quality of the M&E systems that are in place to identify and guide any necessary course corrections in PEDSA’s and PNISA’s implementation modes. First we restate the particular SWOT definitions in the context of this analysis:
Strengths refer to those characteristics of a specific intervention that make it better suited to achieve the desired development objectives than would alternative approaches or interventions—in this case, achieving the objectives and goals of PEDSA.
Weaknesses are features of interventions that put them at a disadvantage relative to other interventions.
Opportunities are contextual elements that could be used to the advantage of the intervention.
Threats are contextual elements that have a potential to impede the intervention’s objectives and goals.
The identification of these characteristics of PNISA’s implementation will necessarily be a subjective exercise. Each individual involved in the JSR process will likely bring to the table for discussion a somewhat different set of issues corresponding to the SWOT categories than will his or her peers. Consequently, using the SWOT analysis to guide adjustments that complementary strategies that build on strengths or mitigate weaknesses, all the issues placed into each category of the SWOT analysis will need to be thoroughly examined. This is an analysis where many

43
different perspectives will likely prove to be profitable for prioritizing issues and drawing lessons that can serve to improve PNISA’s implementation.
As such, it almost goes without saying that the issues raised in this section are by no means definitive, even though they are informed by a close examination of agricultural policymaking, priority setting, and program implementation under PEDSA and CAADP–Mozambique. Issues deemed inappropriate or irrelevant by those participating in the JSR exercise should be discarded. Nonetheless, the SWOT analysis here should help define a more accurate set of strengths, weaknesses, opportunities, and threats that characterize PNISA’s implementation so far.
Strengths
Reasonably broad coalition of stakeholders involved in the CAADP-Mozambique process and the development of PNISA.
Signing the CAADP–Mozambique compact commits stakeholders to work toward the PEDSA objectives in the manner articulated in PNISA.
High-level political support for PNISA has been articulated by the president and council of ministers.
The Cooperation Framework for the G8 New Alliance for Food Security and Nutrition in Mozambique is designed to support and motivate actions that come under the policy and planning framework of PEDSA and PNISA. It provides additional resources and momentum for PNISA’s implementation.
Weaknesses
Indications that the CAADP–Mozambique process and the implementation of PNISA is considered primarily a Ministry of Agriculture (MINAG) activity, with little participation on the part of other sectors, civil society, and the private sector.
PNISA is very broad in scope. Considerably more prioritization and pruning of programs and subprograms could have been done. This has ramifications for raising the resources needed for implementation, as both the Ministry of Finance and donors may second guess the priorities stated in PNISA and seek to pick and choose those that will receive their financial support.
PNISA is ambitious and is at risk of requiring greater human capacity to implement than is available in rural Mozambique.
Opportunities
There is considerable desire on the part of donors to see Mozambique achieve some tangible degree of agricultural transformation through the successful implementation of PNISA.
The significant contributions to the Mozambican economy that are expected to come out of mining and natural gas exploitation will potentially allow an increase in government financing of PNISA. PNISA offers a useful way to transfer some of the revenue from the narrow mining and gas sectors to a wide segment of citizens of Mozambique.
The lead-up to the elections in late 2014 may provide a pro-PNISA political environment, as candidates look for opportunities to demonstrate their commitment to the rural electorate.
Threats
Delays in coordinating the activities under PNISA will result in a loss of coherence and retard progress toward PEDSA’s objectives.

44
The elections in 2014 may mark a high point in political commitment to PNISA that will rapidly erode afterward, especially as campaign promises confront the day-to-day reality of governing the country.
Discussion of SWOT Analysis
In the SWOT analysis presented here, the focus is on the broader political and economic factors that will determine the success of PNISA’s implementation. Over the past year, the focus of activities related to PNISA has been on the broader political and economic factors that will determine the success of its implementation. As PNISA’s programs get underway in the field, it is expected that many more operational and coordination issues will come to the forefront of the minds of those involved in the country’s agricultural JSRs that focus on PNISA. Indeed, some of those issues may already be apparent now to those who are participating closely in the rollout of PNISA’s implementation. A broad set of individual SWOT analyses of PNISA should be aggregated, discussed, and synthesized as part of the JSR process to assess where changes can be made to implementation to ensure better outcomes.
The informational content of the M&E system is not specified in the plan. As such, beyond the three overall goals for increasing agricultural sector growth and decreasing chronic child malnutrition and hunger, noted above, no other measures are proposed for measuring PNISA’s progress in attaining PEDSA’s objectives. Other indicators and targets are left to be identified by the relevant agencies at the level of the programs and subprograms.
This lack of definitions for key M&E indicators is an important deficiency in the design of PNISA, given the emphasis that CAADP–Mozambique places on mutual accountability, which centers on “mutually agreed-upon milestones and targets.” These milestones and targets remain to be defined for PNISA. So long as they are not defined, the agricultural JSR process under CAADP–Mozambique will be significantly hampered.
Independent assessments are provided of the activities carried out under the investment plan’s various programs and subprograms. Similarly, at a higher level of coordination, the actions of the various stakeholders need to be weighed against the commitments that they made to advance PNISA’s implementation. This information is necessary, so that those involved in the JSR have a relatively clear understanding of where in the action plan successes are being realized—and, more important, where they are not—and where further thought is needed about implementation modalities or whether a change in course is required to address failures. These assessments allow for mutual accountability among the stakeholders, and should foster a sense of joint responsibility to correct problems as they are identified.
The development of PNISA and the rollout to implementation have been sufficiently successful to keep stakeholders engaged in the process. PNISA would appear to provide a workable action plan for achieving the objectives of PEDSA, although considerably more work at refining the action plan is needed before many of its stakeholders will make firm commitments to invest in its operationalization.
However, a year into the five-year implementation period—the window of opportunity to organize the effective implementation of the plan—is closing. If action is not taken in the next few months, PNISA initiative will lose momentum. To maintain that momentum, action is needed to coordinate PNISA programs and subprograms more effectively, to address the funding gap, to internally prioritize and make sure that programs are optimally sequenced, and to obtain stronger commitments to PNISA’s implementation across the full set of stakeholders. Much progress has been made over the past three years in defining how Mozambique might achieve the transformation of its agricultural sector. However, it also is clear that any gains that have been made in building commitment to that broad objective could be lost in the coming months without strategic efforts to accelerate coordinated action under PNISA.
An aspect of coordination is monitoring key elements of the implementation process. Although there has been at least one attempt to develop a set of indicators for monitoring PNISA’s implementation (Uaiene 2013), this attempt

45
has not been completed. No mutually agreed-upon milestones and targets have been established. Such indicators are necessary to assess progress under PNISA—indicators that will allow for mutual accountability among participants and stakeholders in the process. The potential for the agricultural JSR exercise to lead to more effective implementation of PNISA will be constrained, so long as the participants in the exercise do not have a mutually agreed-upon set of indicators by which to assess how well the action plan is being implemented. Even without detailed knowledge of how PNISA’s implementation has progressed over the past few months, so long as there is no list of mutually agreed-upon indicators by which the CCSA can assess the quality of implementation, we can assert, unfortunately, that performance of PNISA’s implementation is suffering. More broadly, the mutual accountability that is built into the design of PNISA under commitments made in the CAADP–Mozambique compact likely has not yet been realized.
A point-by-point list of where actions can clearly be taken to address deficiencies in implementation or to attain synergies that otherwise would be missed should be included in the JSR. The actions that might be included in such a list should be evaluated in terms of urgency and in terms of available human capacity and resources to successfully perform them. It also would be beneficial to provide suggestions for which institutions should take responsibility and be held accountable for each action identified.
Although PNISA is ambitious in scope, it faces a significant gap in financing. An internal prioritization and sequencing of programs and subprograms should be conducted that will frame desired results in a better match with available resources. While the focusing exercise is required to address the financing gap, it should be based on technical evidence of what PNISA activities should be done and when, rather than conducted in a more arbitrary manner by the Ministry of Finance or development partners.
6.4.2. CAADP Targets for Agricultural Development
The CAADP target of the 10 percent national budget allocation for agriculture was discussed in considerable detail in Chapter 5 of this report. Figure 6.3 tracks Mozambique’s progress toward meeting the target by presenting the share of the budget and the share of actual expenditure allocated to agriculture. The share of the total budget going to agriculture consistently increased in Mozambique from 2010 to 2012, while the share of total expenditure going to agriculture has been decreasing. Mozambique has failed to reach the Maputo Declaration target.

46
FIGURE 6.3: MOZAMBIQUE AGRICULTURAL BUDGET AND EXPENDITURE AS SHARES OF TOTAL NATIONAL BUDGET AND EXPENDITURES, 2010–2014 (PERCENT)
Source: Bibi F. et al. 2014 (draft version).
Note: *Information for 2013 up to the 23 March 2014 update. ** Budgeted data.
Despite increasing since 2009, public expenditures in support of Mozambican agriculture failed to match the Maputo 10 percent target in 2011, 2012, and 2013, and averaged 9.8 percent. Considering the traditional, “narrow” definition of agricultural public expenditure, where only agricultural-specific expenditures are counted, Mozambique failed to reach the Maputo target for every year from 2009 to 2013, and averaged 5.2 percent. Mozambique also failed to match the Maputo target, with an average of 5 percent over the period, when government (general) expenditures, only, are taken into account (excluding external support),
The generic expectation is that an increase in agricultural investment will result in increases to Mozambique’s agricultural GDP growth. However, the government’s relatively low levels of agricultural investments are likely to have deterred growth in the sector. Progress toward the CAADP target of 10 percent allocation to agriculture can be assessed as YELLOW and in need of continued attention.
Figure 6.4 depicts the progress Mozambique has made toward achieving the CAADP target of 6 percent agricultural GDP growth in comparison with the performance of other member countries of SADC. While the country has not been meeting the 10 percent public investment target on agriculture, its agricultural GDP has surpassed the 6 percent growth target. This deserves to be further investigated, to clarify the sources of the this GDP growth. Progress on this indicator can be considered GREEN.

47
FIGURE 6.4: MOZAMBIQUE, GROWTH IN AGRICULTURAL GDP, 1990–2013
Source: ReSAKSS 2013.
Two main targets for fertilizer application levels can be used to assess Mozambique’s performance in this regard—the Abuja Declaration target of 65 kilograms per hectare (kg/ha) and the SADC target of 50 kg/ha. Mozambican farmers are among the most limited, scant users of fertilizer in Africa. However, the trend in Figure 6.5 shows that Mozambique’s agricultural sector is sluggishly increasing its use of fertilizer. Nevertheless, cereal yields remain low in Mozambique. The increase in fertilizer use over the years can be attributed primarily to use by the sugar industry, which has recently taken off.
Worldwide, the average application of fertilizer is 98 kg/ha, while the PNISA target is 25 kg/ha. Mozambique’s current average level of application of fertilizer is lower than the average for low-income countries in SADC. However, improvements to cash crop value chains in Mozambique should increase fertilizer. Nonetheless, progress on the fertilizer indicator can be considered RED.
FIGURE 6.5: AVERAGE FERTILIZER APPLICATION RATES, 2003–2013 (KG/HA)
Source: ReSAKSS 2013.
-2.0
-1.0
-
1.0
2.0
3.0
4.0
5.0
6.0
7.0
8.0
9.0
Pe
rce
nta
ge (
%)
Average level: 1990-95
Average level: 1995-2003
Average level: 2003-2008
Average level: 2008-2013
CAADP 6% Growth target
0.00
20.00
40.00
60.00
80.00
100.00
120.00
Kg/
ha average 2003
Average level : 2003-2008
Average level : 2009-2013
Abuja Declaration 65kg/ha
SADC RISDP Target 50kg/ha

48
Chilonda et.al (2007) affirmed that cereals are the most important crops in the SADC region, because besides being staple foods, they are also pivotal for trade. Maize is the region’s predominant cereal crop. In the past 15 years, Mozambique has failed to reach the SADC RISDP average maize target yield of 2,000 kg/ha (Figure 6.6). One of the reasons for this is scant use of both fertilizer and improved seeds. Another reason is natural disasters, particularly floods that have plagued the country over the period. Nonetheless, average maize yields in Mozambique have grown during the years between 2000 and 2012. Despite varying average annual yields, the trends depict an overall positive growth in yields, which can be attributed to maize being one of the important crops for food security. Therefore, the government of Mozambique through has embarked on food security programs that enhance maize production.
FIGURE 6.6: MAIZE YIELDS IN MOZAMBIQUE, 2003–2012 (KG/HA)
Source: ReSAKSS 2013.
Rice yields have been increasing (Figure 6.7), but Mozambique still has not met the 2,000 kg/ha target. The country has received significant investment, especially in its central provinces, for the enhancement of rice production. PNISA also emphasizes the increased investment in rice production for food security reasons. Progress on yields for these cereals, both maize and rice, can best be considered YELLOW.
FIGURE 6.7: RICE YIELDS IN MOZAMBIQUE, 2003–2012 (KG/HA)
Source: ReSAKSS 2013.
0.0
500.0
1000.0
1500.0
2000.0
2500.0
Mai
ze Y
ield
Kg/
Ha
Average level: 2000-2004
average level: 2005 2009
Average level: 2010-2012
CAADP Target 2000kg/ha
0
500
1000
1500
2000
2500
Yie
ld K
g/h
a Average level: 2000-2004
average level: 2005-2009
Average level: 2010-2012
CAADP Target(2000kg/ha)

49
Cassava is one of the important crops in Mozambique, with production primarily for home consumption. This is the case, despite the crop’s industrialization in the region. Mozambican cassava also has a poorly developed value chain. Consequently, it is no surprise that production of the crop has not increased to achieve its potential and reach the African and world averages (Figure 6.8). This progress is marked YELLOW.
FIGURE 6.8: CASSAVA YIELDS IN MOZAMBIQUE, 2003–2012 (KG/HA)
Source: FAO 2013.
FIGURE 6.9: CASHEW NUT YIELDS IN MOZAMBIQUE, 2003–2012 (KG/HA)
Source: FAO 2013.
Mozambique’s livestock sector is dominated by cattle, followed by goats, sheep, pigs, and poultry. Despite the importance of this sector, Mozambique has the lowest cattle density in the SADC region because of endemic diseases and because the country’s large tracts of woodland are not conducive to rearing cattle. There is also a lack of good animal husbandry practices. This explains the trends depicted in Figure 6.10. The annual growth rate of the livestock in Mozambique has not met the SADC RISDP target of 4 percent annual growth. A combination of foot and mouth disease, drought, and floods culminated in negative growth between 1995 and 2003.
FIGURE 6.10: LIVESTOCK PRODUCTION IN MOZAMBIQUE, ANNUAL GROWTH, 1990–2013
0
2,000
4,000
6,000
8,000
10,000
12,000
14,000
Average 2000 -2002
Average 2003 -2005
Average 2006 -2008
Average 2009 -2012
Yie
ld K
g/H
a
Mozambique
Africa Average
World Average
680
700
720
740
760
780
800
820
840
Average 2000 -2002
Average 2003 -2005
Average 2006 -2008
Average 2009 -2012
Yie
ld K
g/h
a
Mozambique
Africa Average
World Average

50
Source: ReSAKSS 2013.
Figure 6.11 shows that the proportion of land under irrigation in Mozambique is far lower than the average attained by the SADC low-income countries. It still averages around 2 percent, while the SADC RISDP target is 7 percent. Moreover, what irrigated land there is in Mozambique is mainly used for the type of intensive irrigation undertaken for sugarcane and rice production. The horticulture subsector uses a minute proportion of the irrigated land. The majority of crops, especially major cereals like maize, are rainfed. This has adverse implications for Mozambique’s cereal production.
FIGURE 6.11: PROPORTION OF LAND UNDER IRRIGATION IN MOZAMBIQUE, 2000–2011
Source: ReSAKSS 2013.
6.4.3. Land and Labor Productivity in Agriculture
Land productivity in Mozambique is quite low (averaging US$39/ha/year (yr) from 2010 to 2013). However, the trend depicted in Figure 6.12 shows that it is increasing, albeit minutely. This implies that Mozambique has increased the use of land-saving technologies, such as improved seeds and chemical fertilizers. This may be driven by the
-1.0
0.0
1.0
2.0
3.0
4.0
5.0
6.0
Pe
rce
nt
(%)
Average level: 1990-95
Average level: 1995-2003
Average level: 2003-2008
Average level: 2008-2013
SADC-RISDP 4% annualincrease target
-
2.0
4.0
6.0
8.0
10.0
12.0
Pe
rce
nt
(%) Average level : 2000-2003
Average level : 2003-2008
Average level : 2009-2011
7% increase -SADC RISDPTarget

51
pressure on land resources from population growth. However, Mozambique still has the lowest land productivity among the low-income countries in the SADC region.
FIGURE 6.12: LAND PRODUCTIVITY IN MOZAMBIQUE, 2000–2013 (US$/HA/YR)
Source: ReSAKSS 2013.
Low labor productivity in Mozambique (Figure 6.13), compounded by low land productivity, has a huge bearing on the country’s overall agricultural productivity. Mozambique is among the least land- and labor-productive countries in the region, averaging just US$39/ha/yr and US$219/worker/yr, compared with the SADC low-income countries’ average figures of US$105/ha/yr and US$358/worker/yr. The low fertilizer use epitomizes the lack of aggressive investment in improved farm inputs, implements, and machinery.
FIGURE 6.13: LABOR PRODUCTIVITY IN MOZAMBIQUE (US$/WORKER/YR)
Source: World Bank 2013.
6.4.4. Agricultural Trade Performance
Prawns contribute a major share to Mozambique’s agricultural sector, followed by cotton, cashew, and timber. The level of agricultural exports has been increasing, partly because of the opening of Chinese timber markets; the sugar protocol with the SADC and the European Union; and improvements to the supply chain for banana, pineapple, cotton, and cashew. Increased investment in these supply chains and in those for maritime products has boosted
-
50
100
150
200
250
300
350
400
450
500
Mozambique SADC SADC-excl. SA SADC-LI SADC-MI
Ave
rage
Le
vels
(U
S$/h
a/yr
)
Average level : 2000-2003
Average level : 2003-2008
Average level : 2009-2013
- 200 400 600 800
1,000 1,200 1,400 1,600 1,800 2,000
Ave
rage
Le
vels
(U
S$/w
ork
er/
yr)
Average level : 2000-2003
Average level : 2003-2008
Average level : 2009-2013

52
total agricultural exports. However, Mozambique is still a net importer of agricultural products, because the country exports raw materials and intermediate products, and then reimports them as finished products. Mozambique’s trade within the SADC partnership is dominated by South Africa, which receives 75 percent of all exports from the SADC countries. On average, food exports have been increasing at a higher rate than food imports, hence the continuous decline in the food import-to- export ratio. Figure 6.14 shows that the value of total agricultural exports—on average between 2008 and 2013—was US$422,683,000, which is considerably below the SADC low-income countries’ average in the same period (US$576,000,000). This highlights the country’s need to concentrate its investment on the most commercially viable agricultural activities and, at the same time, continue to lower trade barriers with counterparts in the region.
FIGURE 6.14: VALUE OF TOTAL AGRICULTURAL EXPORTS, 1990–2013 (THOUSANDS OF US$)
Source: ReSAKSS 2013.
Mozambique imports more in value than it earns in foreign currency. This creates a trade deficit that is likely to continue for the foreseeable future, because the value of exported raw materials and other primary products in foreign currency is offset by the prices of imported, finished products. What also constrains agricultural exports is that the bulk of Mozambique food crops—that is, cassava, millet, sorghum, sweet potato, and yam—are essentially nontradable and have no market beyond the country’s borders.
The bulk of primary agricultural imports consists of rice, wheat, and maize, which account for up to 50 percent of the value of imports. Mozambique imports more than 90 percent of its wheat for baking. The capacity to produce wheat locally is still being developed.
Figure 6.15 shows that the ratio of agricultural imports to exports in Mozambique decreased between 1990 and 2013. This can be explained by robust attempts to invigorate the supply chains of crops, hence reducing the quantity of reimported finished products made from exported raw food materials. The ratio has decreased from about 6.0 in the 1990s to below 2.0 between 2008 and 2013.
-
200,000
400,000
600,000
800,000
1,000,000
1,200,000
Val
ue
(U
S$ 1
,00
0s)
Average level: 1990-95
Average level: 1995-2003
Average level: 2003-2008
Average level: 2008-2013

53
FIGURE 6.15: RATIO OF AGRICULTURAL IMPORTS TO EXPORTS IN MOZAMBIQUE, 1990–2013
Source: ReSAKSS 2013.
Maize still features prominently in the agricultural import bill, despite the country being a major exporter of maize in the region. Mozambique’s trade policies allow exports from northern Mozambique into Malawi, and allow imports from South Africa into southern Mozambique. This pattern reflects the challenges of moving agricultural produce from the north to the south of the country. Chicken, sausage, pork, and beef are the major meats imported every year. Beef mainly comes from South Africa and Swaziland, while chicken comes from Brazil.
6.4.5. Development Results
Figure 6.16 shows that agriculture’s contribution to Mozambique’s total GDP has been the lowest among all of the economic sectors over the past decade. This masks the sector’s significance for economic development. This in part explains the spate of continuous food insecurity and poverty scourges in the country.
FIGURE 6.16: GDP OF EACH ECONOMIC SECTOR IN MOZAMBIQUE, 2000–2012 (METICALS)
Source: ReSAKSS 2013.
Mozambique’s per capita GDP has been steadily increasing over the past two decades. However, it is far lower than the SADC average (Figure 6.17). This clearly shows that the standard of living in Mozambique is far lower than that
- 1.0 2.0 3.0 4.0 5.0 6.0 7.0
Rat
io
Agriculture Imports to Exports
Average level: 1990-95
Average level: 1995-2003
Average level: 2003-2008
Average level: 2008-2013
0
50000000
100000000
150000000
200000000
250000000
20
00
20
01
20
02
20
03
20
04
20
05
20
06
20
07
20
08
20
09
20
10
20
11
20
12
Me
tica
ls
Total GDP
Agricultural GDP
Manufacturing GDP
Mining GDP
Services GDP
Rest of the sectors GDP
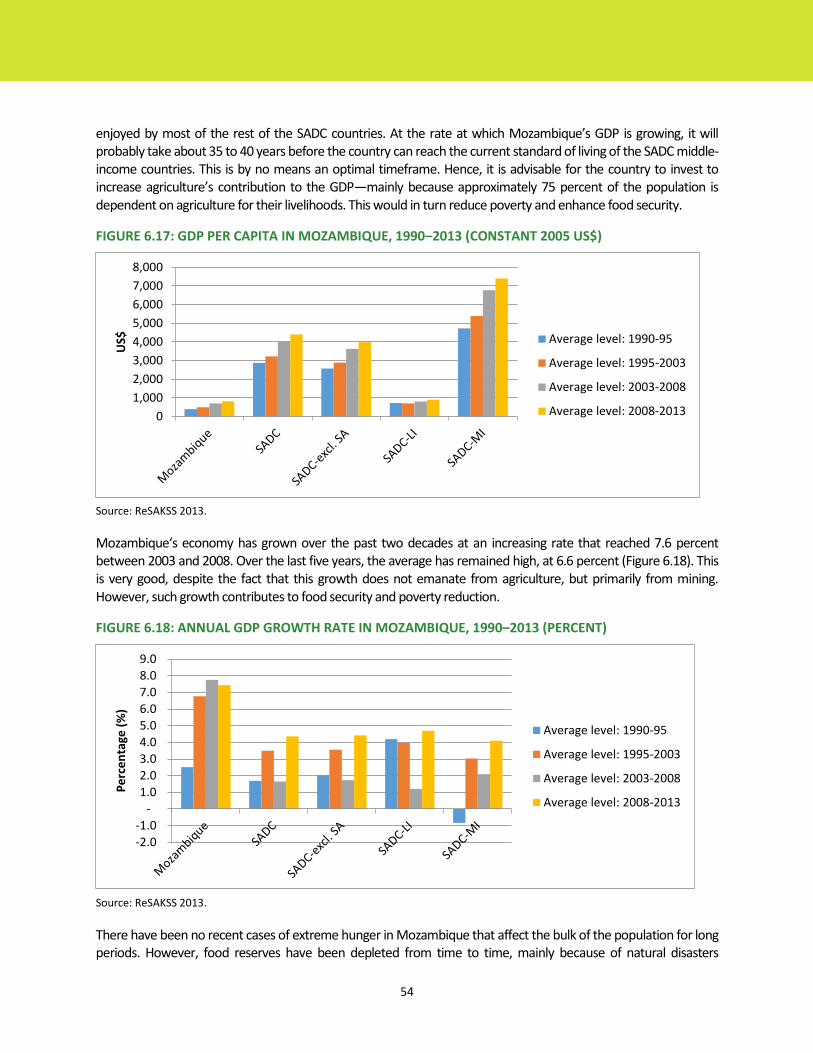
54
enjoyed by most of the rest of the SADC countries. At the rate at which Mozambique’s GDP is growing, it will probably take about 35 to 40 years before the country can reach the current standard of living of the SADC middle-income countries. This is by no means an optimal timeframe. Hence, it is advisable for the country to invest to increase agriculture’s contribution to the GDP—mainly because approximately 75 percent of the population is dependent on agriculture for their livelihoods. This would in turn reduce poverty and enhance food security.
FIGURE 6.17: GDP PER CAPITA IN MOZAMBIQUE, 1990–2013 (CONSTANT 2005 US$)
Source: ReSAKSS 2013.
Mozambique‘s economy has grown over the past two decades at an increasing rate that reached 7.6 percent between 2003 and 2008. Over the last five years, the average has remained high, at 6.6 percent (Figure 6.18). This is very good, despite the fact that this growth does not emanate from agriculture, but primarily from mining. However, such growth contributes to food security and poverty reduction.
FIGURE 6.18: ANNUAL GDP GROWTH RATE IN MOZAMBIQUE, 1990–2013 (PERCENT)
Source: ReSAKSS 2013.
There have been no recent cases of extreme hunger in Mozambique that affect the bulk of the population for long periods. However, food reserves have been depleted from time to time, mainly because of natural disasters
0
1,000
2,000
3,000
4,000
5,000
6,000
7,000
8,000
US$ Average level: 1990-95
Average level: 1995-2003
Average level: 2003-2008
Average level: 2008-2013
-2.0
-1.0
-
1.0
2.0
3.0
4.0
5.0
6.0
7.0
8.0
9.0
Pe
rce
nta
ge (
%)
Average level: 1990-95
Average level: 1995-2003
Average level: 2003-2008
Average level: 2008-2013

55
(droughts and floods). The country has made considerable headway in fortifying food security measures. This has helped reduce child malnutrition and stunted growth in young children.
Nevertheless, the Global Hunger Index (GHI) (Figure 6.19) shows that Mozambique is still ranked between alarming and extremely alarming levels (GHI scores of 20.0–29.9 and 30.0–39.9, respectively) (Von Grebmer et al. 2010). However, the GHI score is decreasing, which implies reduced hunger.
FIGURE 6.19: GLOBAL HUNGER INDEX FOR MOZAMBIQUE, 1990–2013
Source: World Bank 2013.
Cereal production per capita is an indicator of the food available from farming that can help feed Mozambique’s population (Figure 6.20). Mozambique has lower averages than the region (112kg/person in 2009–2013). The country needs to produce more than current levels to be rendered food secure and to meet the population’s nutritional needs.
FIGURE 6.20: CEREAL PRODUCTION PER CAPITA IN MOZAMBIQUE, 2000–2013 (KG/PERSON)
Source: World Bank 2013.
Figure 6.21 shows that the proportion of the population that consumes less than the minimum dietary energy requirements has been steadily decreasing since the 1990s. It currently stands at just below 30 percent of the population. International donor programs (such as the World Food Programme) have helped immensely during
- 5.0
10.0 15.0 20.0 25.0 30.0 35.0 40.0
Ind
ex
Average level 1990-95
Average level (1995-00)
Average level (2000-5)
Average level (2005-2013)
0
50
100
150
200
250
Kg/
Pe
rso
n
Average level : 2000-2003

56
shortages, while the country’s own food security programs have also made a substantial contribution to lowering these figures.
FIGURE 6.21: POPULATION BELOW MINIMUM DIETARY ENERGY CONSUMPTION, 1990–2013 (PERCENT)
Source: World Bank 2013.
There is a need for more in-depth analysis to validate the trends that have been portrayed in this chapter. Our analyses did not establish causal relationships between the indicators, but settled for partial analysis. These partial analyses provide an intuitive understanding of what can be expected. Further studies are required to obtain a more conclusive understanding of how Mozambique’s agricultural sector is performing and how it might contribute broadly to the country’s development. The Appendix summarizes baselines against which the sector could assess its own future performance.
TABLE 6.3: SUMMARY OF INDICATORS OF PERFORMANCE OF MOZAMBIQUE’S AGRICULTURAL SECTOR
Performance Indicator Traffic Light Rating
Mozambique agricultural budget and expenditure as share of total national budget and expenditures Yellow
Mozambique, growth in agricultural gross domestic product (GDP) Green
Fertilizer application rates Red
Maize yields in Mozambique Yellow
Rice yields in Mozambique Yellow
Cassava yields in Mozambique Yellow
Cashew nut yields in Mozambique Green
Livestock production in Mozambique, annual growth Yellow
Proportion of land under irrigation in Mozambique Yellow
Land productivity in Mozambique Yellow
Labor productivity in Mozambique, US$/worker Yellow
Annual GDP growth rate in Mozambique Green
Global Hunger Index for Mozambique Yellow
-
10
20
30
40
50
60
Pe
rce
nta
ge (
%)
Average level: 1990-95
Average level: 1995-2003
2003
Average level : 2003-2011)
MDG1 goal

57
7. JOINT SECTOR REVIEW CONCLUSIONS AND LESSONS
Overall, the development of the National Agricultural Investment Plan (Plano Nacional de Investimento do Sector Agrário, or PNISA) and the rollout to implementation has been just sufficiently successful to keep stakeholders engaged in the process. The PNISA would appear to provide a workable action plan for achieving the objectives of the Strategic Plan for Agricultural Sector Development (Plano Estratégico de Desenvolvimento do Sector Agrário, or PEDSA). However, considerably more work at refining the action plan is needed before many of its stakeholders will make firm commitments to invest in its operationalization.
A year into the five-year implementation period, the window of opportunity to organize the plan’s effective implementation is closing. If action is not taken in the next few months, the PNISA initiative will lose momentum. Action is needed to better coordinate PNISA programs and subprograms, to address the funding gap, to internally prioritize and possibly sequence programs better, and to obtain stronger commitments to PNISA’s implementation across the full set of stakeholders. Much progress has been made over the past three years in defining how Mozambique might achieve the transformation of its agricultural sector. However, it also is clear that any gains that have been made in building commitment to that broad objective could be lost in the coming months without strategic efforts to accelerate coordinated action under PNISA.
7.1. Action Steps
Operationalize the Agricultural Sector Coordinating Committee (Comité de Coordenação do Sector Agrário, or CCSA) to coordinate activities under PNISA and to ensure that those activities are adequately monitored.
Task the CCSA with the development of a set of mutually agreed-upon milestones and targets organized around five performance areas: o Broad development objectives;
o Overall agricultural sector growth targets, with specific subsector and commodity-specific
targets;
o Financial and nonfinancial resources required for implementation;
o Policies, programs, institutions, and implementation processes; and
o Linkages in the agricultural sector that connect investments to sector performance.
Recognize that PNISA is ambitious in scope, but faces a significant gap in financing, and conduct an internal prioritization and sequencing of programs and subprograms that will better match available resources. While such a focusing exercise is necessary to address the financing gap, it should be based on technical evidence of what PNISA activities should be done when. The exercise should not be led in what could prove a more arbitrary manner by the Ministry of Finance or development partners.
Further integrate efforts to realize the commitments made under the New Alliance Cooperation Framework for Mozambique into PNISA’s implementation.
Task the Ministry of Agriculture with building stronger links to national stakeholders in PNISA’s implementation. The aim should be to build engagement and a stronger sense of accountability, especially from the private sector and civil society organizations.
As with the SWOT analysis, here too the conclusions and action steps presented must be debated and tested by those involved in the joint sector review process to determine whether they are valid and useful for guiding efforts to strengthen PNISA’s implementation. We hope that those presented here will start this debate along a productive path.
58
REFERENCES
Africa Lead and EAT (Africa Leadership Training and Capacity-Building Program, and Enabling Agricultural
Trade). 2013. Institutional Architecture for Food Security Policy Change: Mozambique. Washington, DC,
USA: United States Agency for International Development.
Benson T.; Conguara, B.; and Mogues T. 2013. The Supply of Inorganic Fertilizers to Smallholder Farmers
in Mozambique. Washington DC, USA: International Food Policy Research Institute.
Bibi, F.; Helder, Z.; Pernechele, V.; Monroy, L. 2014. Analysis of Public Expenditures in Support of Food and Agriculture in Mozambique, 2006–2013/14 (draft version). Technical Notes Series. Maputo: MAFAP. Chilonda, P.; and Minde, I. 2007. Agriculture Growth Trends in Southern Africa. ReSAKSS Issue Brief No.
1. Pretoria, South Africa: ReSAKSS.
Chilonda, P.; Xavier, V.; Luciano, L.; Gêmo, H.; Chamusso A.; Zikhali, P.; de Sousa, R.; Faria, A.; Govereh,
J.; and others. 2011. Monitoring Agriculture Sector Performance, Growth and Poverty Trends in
Mozambique. Maputo: Mozambique Ministry of Agriculture, Directorate of Economics, and
Mozambique SAKSS.
Chilonda, P.; Musaba E.; Zikhali P.; and Manyamba, C. 2012. 2011 Annual Trends and Outlook Report:
Agricultural Growth Trends and Outlook for Southern Africa. Pretoria, South Africa: ReSAKSS.
Chilonda, P; Matchaya, G.; and Nhlengethwa, S. 2013. Enhancing Regional Food Security through
Increased Agricultural Productivity, ReSAKSS-SA Annual Trends and Outlook Report 2012. Washington,
DC, USA and Colombo; Sri Lanka: International Food Policy Research Institute (IFPRI) and the
International Water Management Institute.
FAO (Food and Agriculture Organization of the United Nations). 2013. FAOSTAT Statistical Database.
http://www.faostat.fao.org. Accessed on 20/02/2013.
Future Agricultures. 2012. Policy into Use: Accelerating Agriculture Growth through CAADP. UK
Department for International Development (DFID). Brighton, United Kingdom.
Gêmo, H. R. 2011. Moving Towards the Implementation of the CAADP Framework in the Agriculture
Sector. The Case of Mozambique. Midrand, South Africa: NEPAD Planning and Coordinating Agency.
Gêmo, H.; and Chilonda P. 2013. Why Did Mozambique’s Public Extension Halt the Implementation of the
National Agrarian Extension Program (PRONEA)? Washington DC, USA: International Food Policy
Research Institute.
Ghins, L.; Ilicic-Komorowska, J.; Mas Aparisi, A. 2013. MAFAP Methodological Implementing Guides:
Volume II. Analysis of Public Expenditure to Food and Agriculture. MAFAP Technical Notes Series, FAO.
Rome, Italy: MAFAP.
59
IFAD. 2012a. The International Fund for Agriculture Development (IFAD) Annual Report. Rome, Italy:
IFAD.
———. 2012b. Pro-Poor Value Chain Development Project in Maputo and Limpopo Corridors (PROSUL).
Rome, Italy: The International Fund for Agricultural Development.
Kondylis, F.; and Mueller, V. 2012. “Seeing Is Believing?” Evidence from Demonstration Plot Experiment
in Mozambique. MSSP Working Paper 1. Washington DC, USA: International Food Policy Research
Institute.
MAFAP (2010) “Monitoring and Analyzing Food and Agricultural Policies Project Methodology: Concept
Paper.” Draft paper. Available at www.fao.org/mafap.
MINAG (Ministry of Agriculture) 2010. Monitoring Agriculture Sector Performance Growth and Poverty
Trends in Mozambique. 2010 Annual Trends and Outlook Report (ATOR). Washington DC, USA:
International Food Policy Research Institute.
Mogues, T.; and Benin S. 2013. Public Expenditure in Agriculture in Mozambique. Working Paper 3.
Washington DC, USA: International Food Policy Research Institute.
MPD & MF 2013
ReSAKSS. 2013a. “How to Work Together to Advance Country SAKSS, Mutual Accountability and
Agriculture Joint Sector Reviews.” Presented by Greenwell Matchaya at the 2013 ReSAKSS Annual
Conference, November 12–13, 2013. Dakar, Senegal.
———. 2013b. Trends in Public Spending in Mozambique. Issue Note No. 21 January 2013. Colombo; Sri
Lanka: International Water Management Institute.
Rosário, C. 2012. Monitoring Mozambique’s Poverty Reduction Strategy PARPA (2006–2013). Bergen,
Norway: Department for International Development–UK (DFID) and Chr. Michelsen Institute.
SPEED study on Non-Fiscal Barriers (NFB) to Agriculture in Mozambique
Uaiene, R. 2013. “Mozambique Policy Analysis and Planning Capacity for Improved Food Security and
Nutritional Outcomes (MozCAPAN).” Presentation at PARTI Annual Meeting, November 14, 2013.
Maputo, Mozambique.
Von Grebmer, K.; Ringler, C.; Rosegrant, M.W.; Olofininbiyi, T.; Wiesmann, D.; and Fritschel, H.B. 2010.
2010 Global Hunger Index Data. Washington, DC, USA: International Food Policy Research Institute.
Walker, B.; Holling, C.; Carpenter, S.; and Kinzig, A. 2004. “Reliance Adaptability and Transformability in
Social-ecological Systems.” Ecology and Society 9 (2): 5.
World Bank. 2010. Mozambique: Rapid Budget Analysis for Annual Review 2010/2011. Agriculture
Sector. Washington, DC, USA: World Bank.
———. 2011. Conflict, Security and Development. World Development Report. Washington, DC, USA.

60
———. 2012. African Development Indicators. Available at http://data.worldbank.org/data-
catalog/africa-development-indicators (accessed in January 2013).
———. 2013. End Extreme Poverty, Promote Shared Prosperity. World Bank Annual Report. Washington
DC, USA.

61
APPENDIX: AGRICULTURAL PERFORMANCE BASELINE INDICATORS
icator (input, output, outcome)
Data
Source
Baseline Source Document
Suggested Baseline Period (2010–2013)
[for cross-country comparison) End Target Current Status Traffic Light
Rating Year Value Unit Year Value Unit Year Value Unit Year Value Unit
Share of government agriculture expenditure in total government expenditure
MINAG - Budget Unit
2010 3.9 % 2010-–2012 3.36 % 10 % 2012 2.9 % Yellow
Ratio of agricultural expenditure to agricultural budget MINAG - Budget Unit
2010 100 % 2010–2012 86.3 % 100 % 2012 74.4 % Red
Area under sustainable irrigation 2010 2.27 % 2009–2011 2.3 %. 2015 7% % 2011 2.27 % Red
Agricultural Labor Productivity World Bank 2010 217 $/worker/yr 2009–2013 219 $/worker/yr $/worker/yr 2013 231.5 $/worker/yr Green
Yield food crop – maize MINAG 2010 1099.2 kg/ha 2010–2013 1016.7 kg/ha 2000 kg/ha 2013 749 kg/ha Yellow
Yield food crop – rice MINAG 2010 1136.6 kg/ha 2010–2013 1149.9 kg/ha 2000 kg/ha 2013 1176.5 kg/ha Yellow
Yield food crop - cassava MINAG 2010 7.76 tons/ha 2009–2012 8.3 tons/ha tons/ha 2012 13.18 tons/ha
Yield export crop - cashew nuts MINAG 2010 877.8 kg/ha 2009–2012 773.5 kg/ha kg/ha 2012 809.1 kg/ha
Population at risk of food insecurity World Bank 2010 5.8 million Number 2010–2013 5.5 million Number Number 2013 5.3 million Number
Real agricultural GDP growth rate 2010 7.1 % 2010–2012 6.8 % 6 % 2012 7.4 % Green
Real GDP per capita World Bank 2010 822.7 US$ (2005) 2009–2011 824.1 US$ (2005) US$ (2005) 861 US$ (2005)
Real GDP per capita growth rate World Bank 2010 6.8 % 2010–2012 6.8 % 6 % 2012 6.8 % Green
Proportion of the population below minimum dietary energy consumption
2010 25 % 2010–2012 25.13 % % 2012 25 %
Prevalence of underweight children under five years of age (H2)
2010 41 % 2010–2012 41.25 % % 2012 41.25 %
Prevalence of stunted children under five years of age (H2) 2010 43 % 2010–2012 43.11 % % 2012 43 %
/AIDS prevalence rate (HIV) 2010 12.2 % 2010–2013 12.2 % % 2013 12.2 %
Poverty gap 2010 25 % 2010–2012 25 % % 2012 25 %

Regional Strategic Analysis and Knowledge Support System
The Mozambique Joint Sector Review Assessment Report was facilitated by the International Food Policy Research Institute (IFPRI) and coordinated by the Regional Strategic Analysis and Knowledge Support System - Southern Africa (www.resakss.org). It was prepared by a national team under the leadership of the Ministry of Agriculture (MINAG), Department of Economics, with the participation of national experts, including Calisto Bias as the lead consultant.