an assessment of the economic and fiscal impacts of the ... report.pdfan assessment of the economic...
TRANSCRIPT

An Assessment of the Economic and Fiscal Impacts
of the Dakota Access Pipeline in
North Dakota, South Dakota, Iowa and Illinois
Prepared for
Dakota Access, LLC
Prepared by
Harvey Siegelman, Mike Lipsman and Dan Otto
Strategic Economics Group West Des Moines, Iowa
November 12, 2014
An Assessment of the Economic Impact of the Dakota Access Pipeline, 2014
Strategic Economics Group 2
0.0 Executive Summary
This report examines the economic and fiscal impacts of the Dakota Access Pipeline on the region and
the four states through which it will be built (North Dakota, South Dakota, Iowa and Illinois). It involves
a more than 1,100 mile1 pipeline that will be built at a cost of more than $3.8 Billion. This pipeline will
have a transportation capacity of over 450,000 barrels per day of crude oil from the Bakken oil fields of
northwest North Dakota to a hub in Patoka, Illinois. The goal in building this pipeline is to move that
crude oil to domestic refineries more safely and at a lower cost than the current alternatives.
This report endeavors to estimate the economic and fiscal impacts of the pipeline project and to address
these issues relating to crude oil transportation in the region.
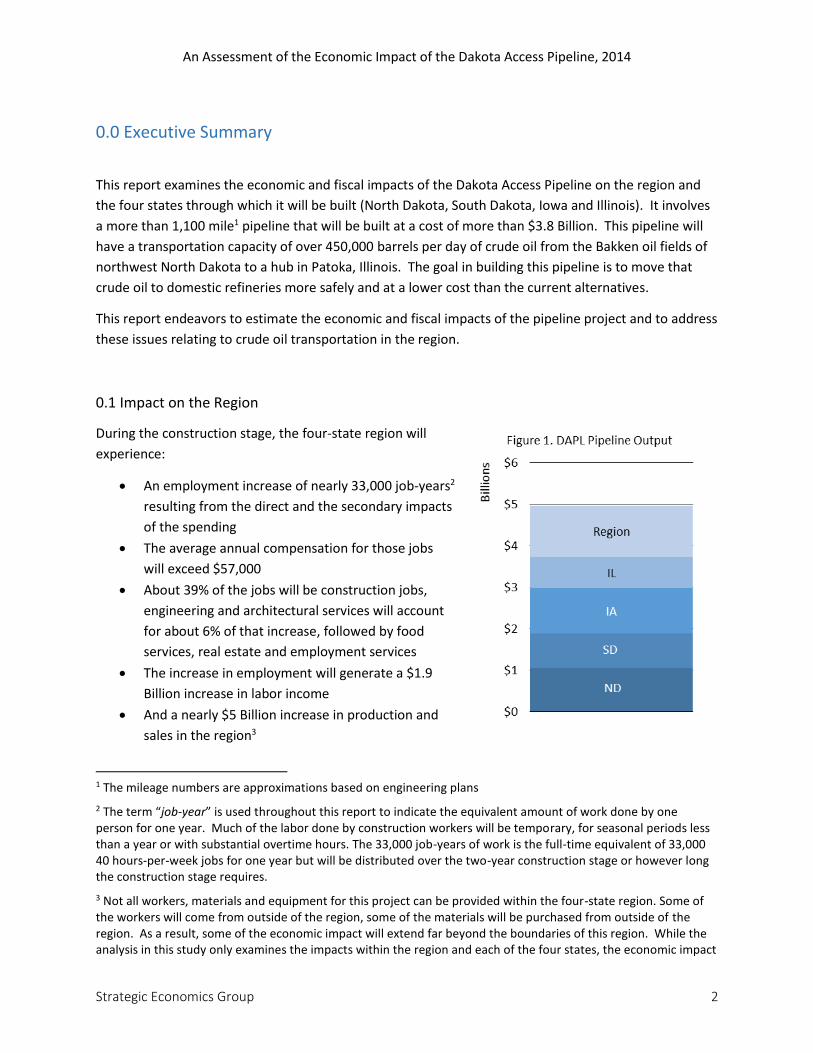
0.1 Impact on the Region
During the construction stage, the four-state region will
experience:
An employment increase of nearly 33,000 job-years2
resulting from the direct and the secondary impacts
of the spending
The average annual compensation for those jobs
will exceed $57,000
About 39% of the jobs will be construction jobs,
engineering and architectural services will account
for about 6% of that increase, followed by food
services, real estate and employment services
The increase in employment will generate a $1.9
Billion increase in labor income
And a nearly $5 Billion increase in production and
sales in the region3
1 The mileage numbers are approximations based on engineering plans
2 The term “job-year” is used throughout this report to indicate the equivalent amount of work done by one person for one year. Much of the labor done by construction workers will be temporary, for seasonal periods less than a year or with substantial overtime hours. The 33,000 job-years of work is the full-time equivalent of 33,000 40 hours-per-week jobs for one year but will be distributed over the two-year construction stage or however long the construction stage requires.
3 Not all workers, materials and equipment for this project can be provided within the four-state region. Some of the workers will come from outside of the region, some of the materials will be purchased from outside of the region. As a result, some of the economic impact will extend far beyond the boundaries of this region. While the analysis in this study only examines the impacts within the region and each of the four states, the economic impact
An Assessment of the Economic Impact of the Dakota Access Pipeline, 2014
Strategic Economics Group 3
It is not possible to estimate the tax impacts for the region as a whole. This is no doubt larger than the
sum of the state fiscal impacts, but the regional model does not provide a way to accurately allocate the
extra taxes among the four states.
After the pipeline is completed, the yearly impact of the
operations and maintenance activities will add 160 ongoing
jobs to the regional economy, generating $11 Million in labor
income and more than $23 Million in new production and sales
per year.
However, the most significant impact will be the felt by the
annual taxes that the pipeline will generate for the state and
local governments.
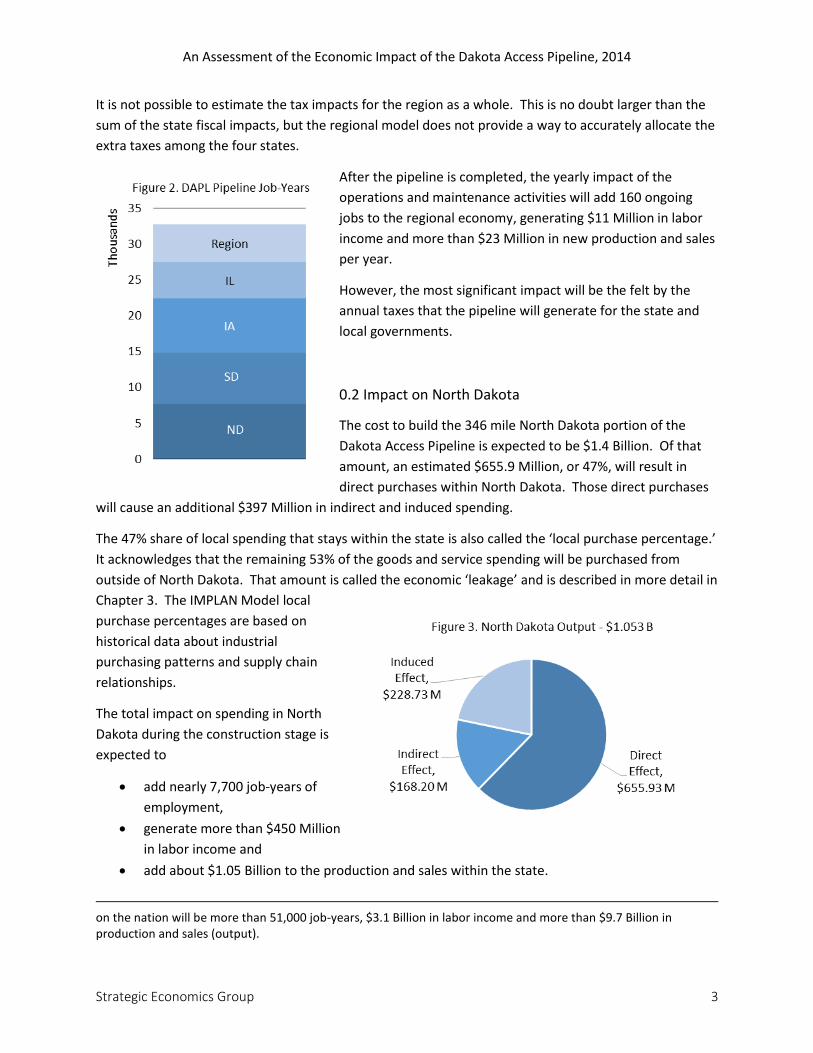
0.2 Impact on North Dakota
The cost to build the 346 mile North Dakota portion of the
Dakota Access Pipeline is expected to be $1.4 Billion. Of that
amount, an estimated $655.9 Million, or 47%, will result in
direct purchases within North Dakota. Those direct purchases
will cause an additional $397 Million in indirect and induced spending.
The 47% share of local spending that stays within the state is also called the ‘local purchase percentage.’
It acknowledges that the remaining 53% of the goods and service spending will be purchased from
outside of North Dakota. That amount is called the economic ‘leakage’ and is described in more detail in
Chapter 3. The IMPLAN Model local
purchase percentages are based on
historical data about industrial
purchasing patterns and supply chain
relationships.
The total impact on spending in North
Dakota during the construction stage is
expected to
add nearly 7,700 job-years of
employment,
generate more than $450 Million
in labor income and
add about $1.05 Billion to the production and sales within the state.
on the nation will be more than 51,000 job-years, $3.1 Billion in labor income and more than $9.7 Billion in production and sales (output).
An Assessment of the Economic Impact of the Dakota Access Pipeline, 2014
Strategic Economics Group 4
The increased economic activity that results during construction of the pipeline will
generate additional sales, use, gross receipts, and lodging taxes of $32.9 Million for state
government, plus
$1.7 Million for local governments.
In addition, the state will realize $5.9 Million more from individual income tax.
Once the pipeline goes into operation North Dakota state and local governments will realize ongoing
annual sales, use, gross receipts, and lodging tax increases of about $158,000 and income tax increases
of about $84,000. Also, during the first full year of operation the pipeline will generate about $13.1
Million in new property taxes for local governments.
One benefit of the pipeline is to relieve existing and anticipated future transportation capacity problems
in the Bakken oil fields area of North Dakota. The production of oil in this area has increased from only
10,295 barrels per day at the beginning of 2007 to almost 1.05 million barrels per day during July 2014.
This exceptional growth has taxed the transportation infrastructure of the area to the limit and has
impacted grain and soybean farmers.
Oil shipments are currently competing with grain and soybean shipments for the limited rail lines,
engines and rail personnel. This has already impacted farm commodity prices and farm income in North
Dakota, South Dakota and Minnesota.
Currently, at least 70% of the oil extracted from the Bakken area moves to refineries by rail4, which is
more expensive than by pipeline. With oil production in the area expected to increase to more than 1.4
million barrels per day by 2017, additional transportation system capacity is needed.
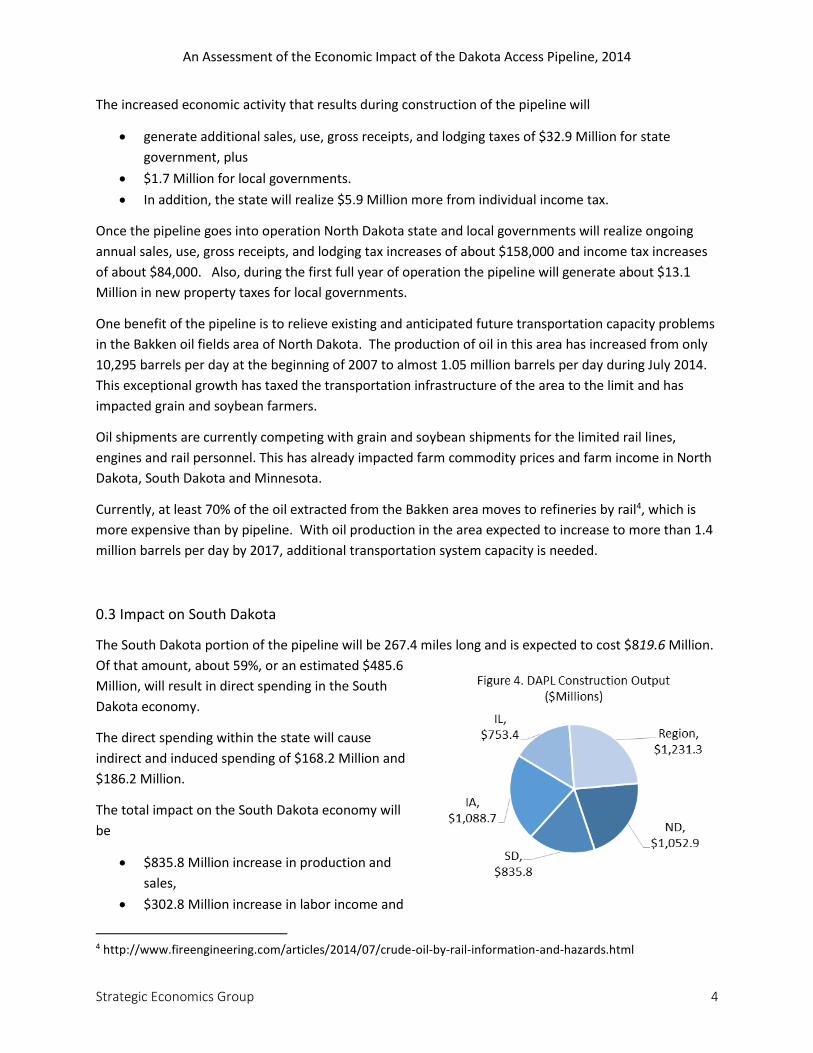
0.3 Impact on South Dakota
The South Dakota portion of the pipeline will be 267.4 miles long and is expected to cost $819.6 Million.
Of that amount, about 59%, or an estimated $485.6
Million, will result in direct spending in the South
Dakota economy.
The direct spending within the state will cause
indirect and induced spending of $168.2 Million and
$186.2 Million.
The total impact on the South Dakota economy will
be
$835.8 Million increase in production and
sales,
$302.8 Million increase in labor income and
4 http://www.fireengineering.com/articles/2014/07/crude-oil-by-rail-information-and-hazards.html
An Assessment of the Economic Impact of the Dakota Access Pipeline, 2014
Strategic Economics Group 5
more than 7,100 additional job-years of employment.
Once the pipeline has been built, the yearly operations and maintenance spending will add 31
permanent jobs, $1.9 Million in labor income and $4.2 Million in additional production and sales to the
South Dakota economy.
The increased economic activity that results during construction of the pipeline will generate additional
sales, use, gross receipts, and lodging taxes of $35.6 Million for state government, plus $2.9 Million for
local governments.
Once the pipeline goes into operation South Dakota state and local governments will realize ongoing
annual sales, use, gross receipts, and lodging tax increases of about $197,000. Also, during the first full
year of operation the pipeline will generate an estimated $13.5 Million in new property taxes for local
governments.
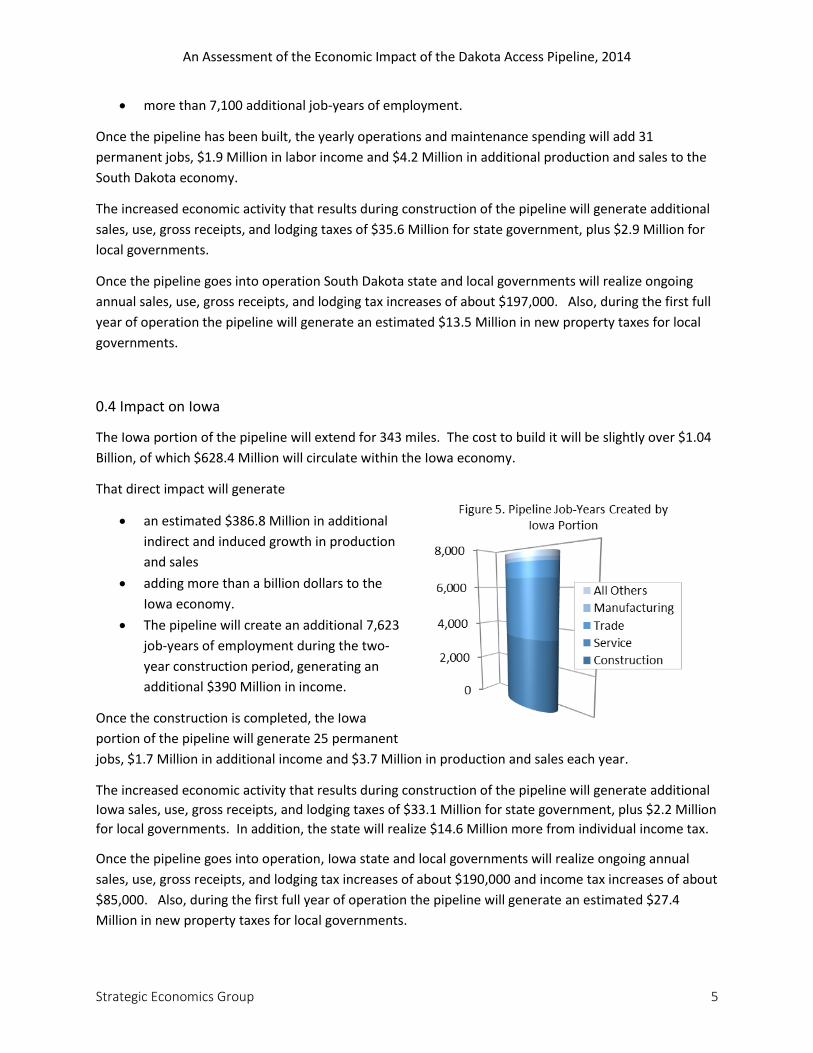
0.4 Impact on Iowa
The Iowa portion of the pipeline will extend for 343 miles. The cost to build it will be slightly over $1.04
Billion, of which $628.4 Million will circulate within the Iowa economy.
That direct impact will generate
an estimated $386.8 Million in additional
indirect and induced growth in production
and sales
adding more than a billion dollars to the
Iowa economy.
The pipeline will create an additional 7,623
job-years of employment during the two-
year construction period, generating an
additional $390 Million in income.
Once the construction is completed, the Iowa
portion of the pipeline will generate 25 permanent
jobs, $1.7 Million in additional income and $3.7 Million in production and sales each year.
The increased economic activity that results during construction of the pipeline will generate additional
Iowa sales, use, gross receipts, and lodging taxes of $33.1 Million for state government, plus $2.2 Million
for local governments. In addition, the state will realize $14.6 Million more from individual income tax.
Once the pipeline goes into operation, Iowa state and local governments will realize ongoing annual
sales, use, gross receipts, and lodging tax increases of about $190,000 and income tax increases of about
$85,000. Also, during the first full year of operation the pipeline will generate an estimated $27.4
Million in new property taxes for local governments.
An Assessment of the Economic Impact of the Dakota Access Pipeline, 2014
Strategic Economics Group 6
0.5 Impact on Illinois
At 177 miles, Illinois has the shortest segment of the pipeline. The cost to build the pipeline and
connect it to the trunkline hub in Patoka is expected to be $515.8 Million. Because Illinois is the most
industrialized state of the four in the region, about 71%, or $366.6 Million, of the construction spending
inputs can be provided by manufacturers, vendors and workers within the state. The 71% is an
aggregate local purchase percentage and the remaining 29% would be an estimate of how much would
be purchased from outside of Illinois.
The construction stage of the pipeline is expected to provide Illinois with
An estimated $753.4 Million in additional output, or production and sales,
$303.4 Million in additional labor income and
more than 5,000 additional job-years of employment.
Each year after the pipeline is placed in service, its operation and maintenance will create
$3 Million in additional output, or production and sales,
$1.5 Million in additional labor income and
20 permanent jobs.
The increased economic activity that results during construction of the pipeline segment in Illinois will
generate additional sales, use, gross receipts, and lodging taxes of $16.4 Million for state government,
plus $3.0 Million for local governments. In addition, the state will realize $7.7 Million more from
individual income tax.
Once the pipeline goes into operation, Illinois state and local governments will realize ongoing annual
sales, use, gross receipts, and lodging tax increases of about $50,000 and income tax increases of about
$45,000. About $747,000 in additional property tax will be generated by the pipeline during its first
year of operation because Illinois does not tax below ground infrastructure.
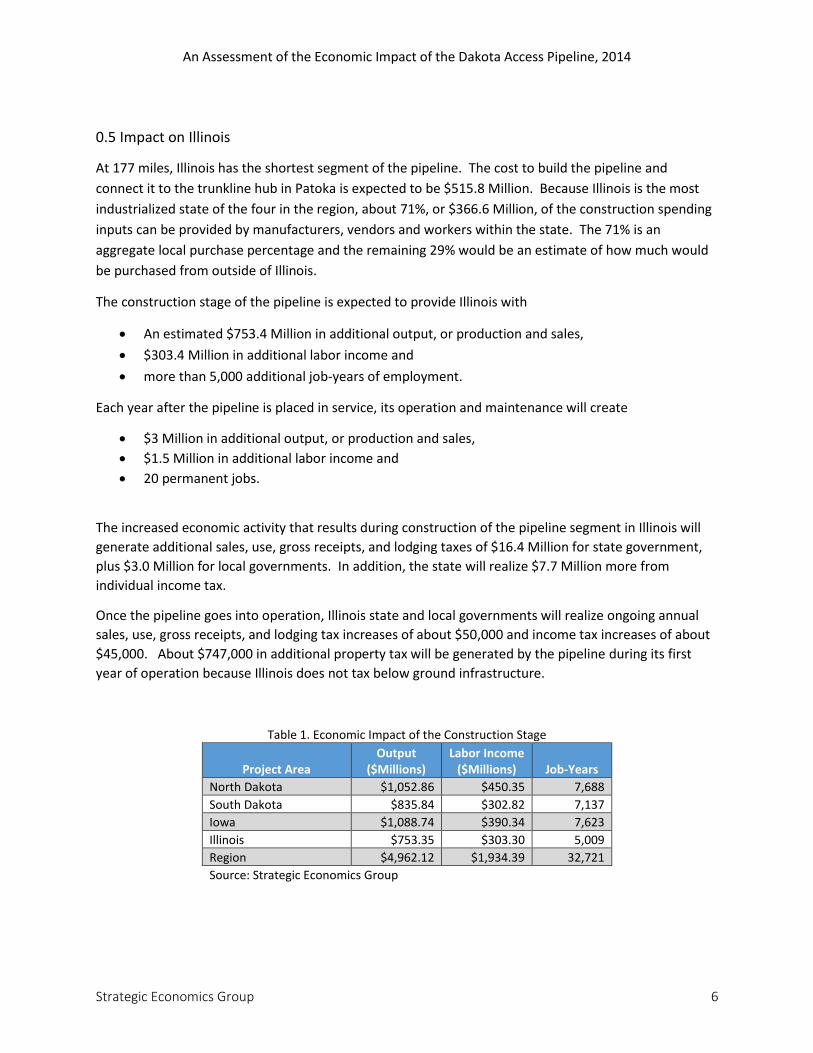
Table 1. Economic Impact of the Construction Stage
Project Area Output
($Millions) Labor Income
($Millions) Job-Years
North Dakota $1,052.86 $450.35 7,688
South Dakota $835.84 $302.82 7,137
Iowa $1,088.74 $390.34 7,623
Illinois $753.35 $303.30 5,009
Region $4,962.12 $1,934.39 32,721
Source: Strategic Economics Group
An Assessment of the Economic Impact of the Dakota Access Pipeline, 2014
Strategic Economics Group 7
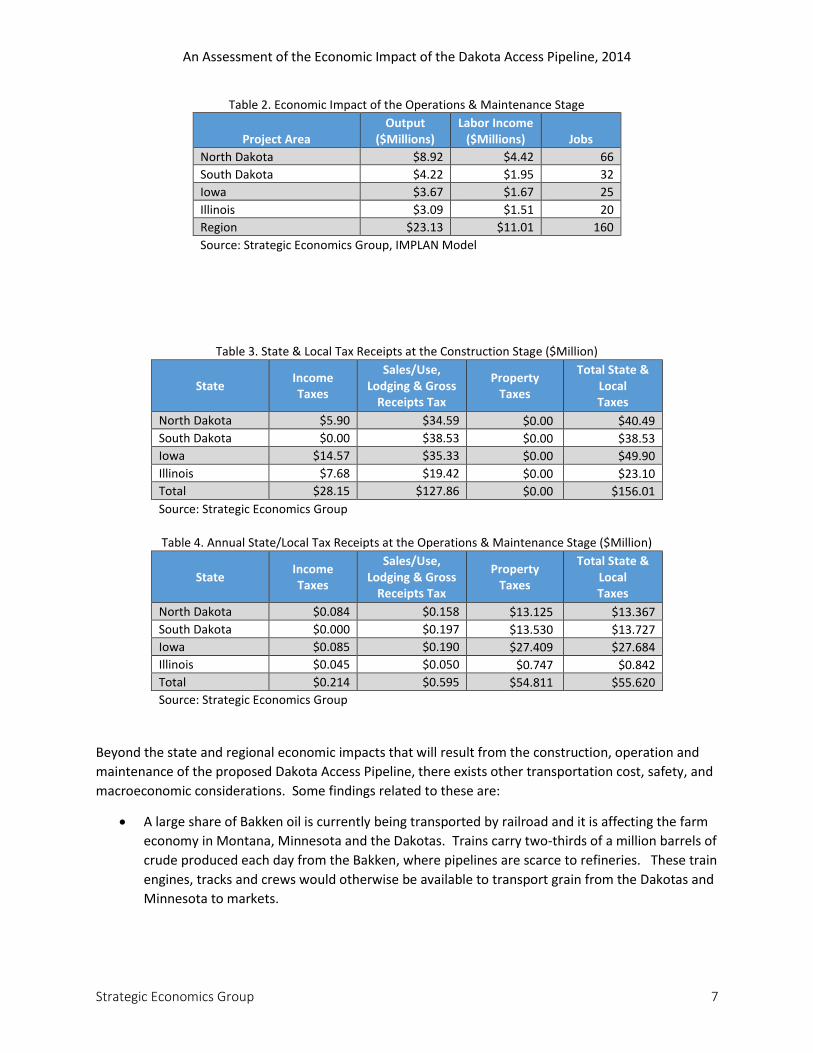
Table 2. Economic Impact of the Operations & Maintenance Stage
Project Area Output
($Millions) Labor Income
($Millions) Jobs
North Dakota $8.92 $4.42 66
South Dakota $4.22 $1.95 32
Iowa $3.67 $1.67 25
Illinois $3.09 $1.51 20
Region $23.13 $11.01 160
Source: Strategic Economics Group, IMPLAN Model
Table 3. State & Local Tax Receipts at the Construction Stage ($Million)
State Income Taxes
Sales/Use, Lodging & Gross
Receipts Tax
Property Taxes
Total State & Local Taxes
North Dakota $5.90 $34.59 $0.00 $40.49
South Dakota $0.00 $38.53 $0.00 $38.53
Iowa $14.57 $35.33 $0.00 $49.90
Illinois $7.68 $19.42 $0.00 $23.10
Total $28.15 $127.86 $0.00 $156.01
Source: Strategic Economics Group
Table 4. Annual State/Local Tax Receipts at the Operations & Maintenance Stage ($Million)
State Income Taxes
Sales/Use, Lodging & Gross
Receipts Tax
Property Taxes
Total State & Local Taxes
North Dakota $0.084 $0.158 $13.125 $13.367
South Dakota $0.000 $0.197 $13.530 $13.727
Iowa $0.085 $0.190 $27.409 $27.684
Illinois $0.045 $0.050 $0.747 $0.842
Total $0.214 $0.595 $54.811 $55.620
Source: Strategic Economics Group
Beyond the state and regional economic impacts that will result from the construction, operation and
maintenance of the proposed Dakota Access Pipeline, there exists other transportation cost, safety, and
macroeconomic considerations. Some findings related to these are:
A large share of Bakken oil is currently being transported by railroad and it is affecting the farm
economy in Montana, Minnesota and the Dakotas. Trains carry two-thirds of a million barrels of
crude produced each day from the Bakken, where pipelines are scarce to refineries. These train
engines, tracks and crews would otherwise be available to transport grain from the Dakotas and
Minnesota to markets.
An Assessment of the Economic Impact of the Dakota Access Pipeline, 2014
Strategic Economics Group 8
The result is that grain transport has been delayed, freight rates have risen and farm revenue
has fallen. Two studies have estimated the current farm revenue losses at between $66 Million
in North Dakota and $99 Million in Minnesota. The rail issue has spread to West Central Iowa
farmers. A North Dakota Daily News story concluded that, “creating a pipeline has arisen
repeatedly by agricultural officials hoping to lessen the severity of the backlog.”5
The transportation of crude oil is generally less expensive by pipeline than by railroad. The cost
of moving oil from the Bakken area of North Dakota to Gulf Coast refineries during 2013 cost
between $1 and $3 per barrel less by pipeline than by railroad.
During 2011 through 2013 price differentials between Brent and West Texas Intermediate (WTI)
crude made it advantageous to ship oil by railroad to East and West Coast refineries rather than
by pipeline to the Gulf Coast. During this period the price differential reached as high as $29.59
per barrel during September 2011. At least partially in response to this differential, railroad
shipments of crude oil jumped by 255.4% during 2011 and by another 74.4% during 2012.
A major reason for the large spread between Brent and WTI crude prices was a shipping
bottleneck that developed in Cushing, OK, which is the largest storage hub for domestically
produced oil. From 2009 to 2013 the amount of oil stored in Cushing rose from 34.5 Million to
51.9 Million barrels. This happened because the United States’ pipeline infrastructure was
developed to move oil north into Cushing rather than away from Cushing. This problem has
now been resolved resulting in Cushing oil inventories dropping to 19.6 Million barrels.
Correspondingly the Brent to WTI price differential has dropped to about $5 per barrel.
Both pipelines and railroads have experienced some spectacular accidents in recent years. But
overall the safety records of both modes of hazardous materials transportation are very good.
Over the past five years pipeline spills have averaged only 82,000 barrels per year while
delivering an average of 13.7 Billion barrels per year of hazardous liquids. Thus, 99.99% of crude
oil transported by pipeline is delivered safely to its destination.
The growth of domestic oil production has exerted significant downward pressure on world oil
prices. As of mid-October both Brent and WTI crude are trading at less than $90 per barrel.
These lower crude oil prices have flowed through to lower motor fuel and diesel fuel prices
resulting in an annual savings of about $33 Billion for households and $11.2 Billion for
businesses at current prices.
Since 2005 U.S. oil imports have dropped by 27.7% and since 2011 U.S. expenditures on oil
imports have dropped by 22.2%. These decreases are benefiting the country through reduced
foreign trade deficits, a stronger dollar, and lower inflation.
5 Speidel, Karen, “Experts suggest a pipeline to relieve rail issues.” Daily News, September 19,2014
An Assessment of the Economic Impact of the Dakota Access Pipeline, 2014
Strategic Economics Group 9
1.0 Introduction
Dakota Access Pipeline, LLC proposes to build a 30-inch diameter crude oil pipeline originating in the
Bakken Shale oil field in northwest North Dakota, passing through the states of North Dakota, South
Dakota, Iowa and Illinois, and terminating at the trunkline hub in Patoka, Illinois.
1.1 Scope and Purpose of the Study
Dakota Access Pipeline retained Strategic Economics Group to estimate the economic and fiscal impacts
associated with the construction of the pipeline on the four-state region and on each individual state.
Strategic Economics Group used version 3.0 of the IMPLAN input/output model to estimate the
economic impacts. This model and information from state revenue departments were used to estimate
the fiscal impacts.
In addition, the analysis addresses the long-term economic and fiscal impacts associated with the
operation and maintenance of the pipeline and other associated facilities.
Other issues investigated as part of the study include:
How crude oil transportation costs differ between railroad and pipeline,
Accident risks for railroads and pipelines, and
Spillover economic impacts arising from transportation delays caused by railroads giving priority
to crude oil shipments.
1.2 Report Content and Organization
Following this introduction the report consist of seven additional chapters.
Chapter 2 provides an overall description of the proposed Dakota Access Pipeline project and
information on the facilities that will be constructed in each of the four states.
Chapter 3 explains the methodologies used to estimate the economic and fiscal impacts likely
to arise from the construction of the pipeline and its operation. Also, this chapter describes the
data sources used for the analysis.
Chapter 4 presents and explains the estimated pipeline construction economic and fiscal
impacts.
Chapter 5 presents and explains the economic and fiscal impacts expected to arise from the
future operation and maintenance of the pipeline.
An Assessment of the Economic Impact of the Dakota Access Pipeline, 2014
Strategic Economics Group 10
Chapter 6 examines issues associated with the transportation of the Bakken oil to refineries and
markets. It discusses the impact that railroad shipments of oil is having on Midwest agriculture
and ultimately on food prices.
Chapter 7 discusses transportation cost, accident risk, and spillover impacts associated with the
construction and operation of the Dakota Access Pipeline.
Chapter 8 summarizes the results of the analysis.
An Assessment of the Economic Impact of the Dakota Access Pipeline, 2014
Strategic Economics Group 11
2.0 Project Background
2.1 Overview Description of the Pipeline Project
The proposed pipeline will consist of about 9916 mile 30-inch diameter crude oil trunkline extending
from Johnson Corner, North Dakota, through South Dakota and Iowa, to Patoka, Illinois. In addition, in
North Dakota a 143 mile in-field pipeline system and six operational storage facilities will be developed.
The total estimated cost for the project equals $3.8 Billion. The following sections describe the pipeline
and supporting facilities proposed for each of the four states. The pipeline will have an estimated initial
capacity of greater than 450,000 barrels per day with the potential to increase its capacity to 570,000
barrels per day.
2.1.1 North Dakota
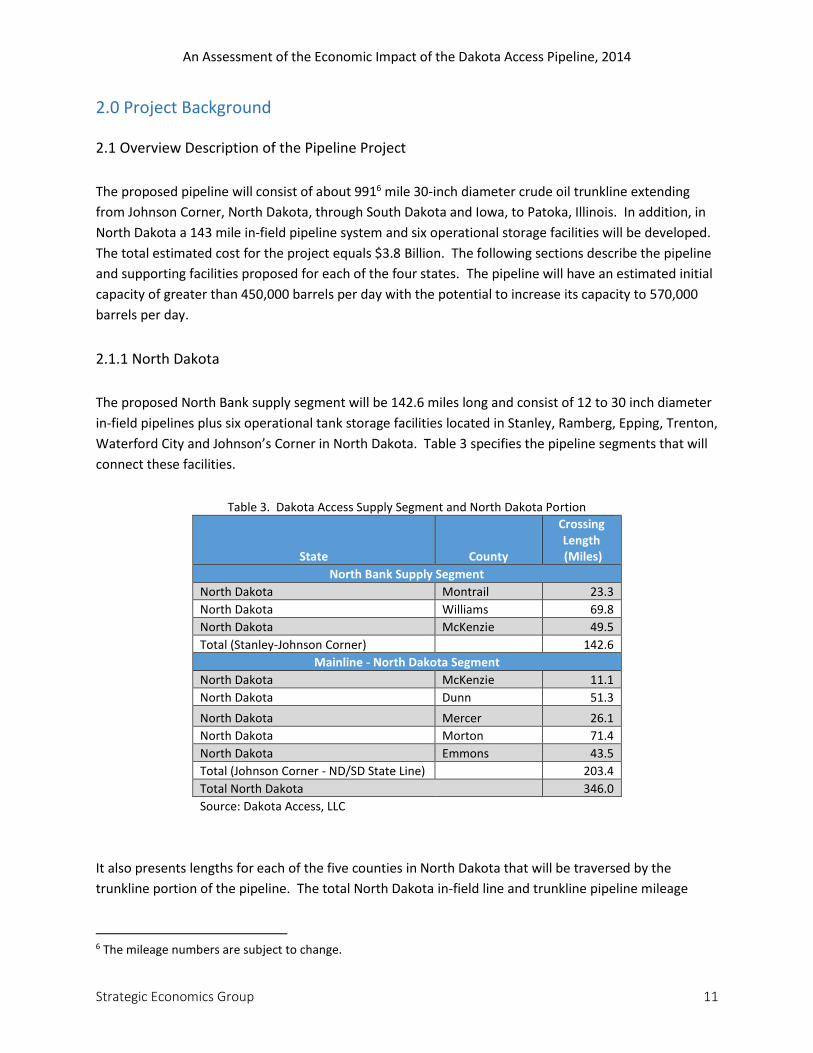
The proposed North Bank supply segment will be 142.6 miles long and consist of 12 to 30 inch diameter
in-field pipelines plus six operational tank storage facilities located in Stanley, Ramberg, Epping, Trenton,
Waterford City and Johnson’s Corner in North Dakota. Table 3 specifies the pipeline segments that will
connect these facilities.
Table 3. Dakota Access Supply Segment and North Dakota Portion
State County
Crossing Length (Miles)
North Bank Supply Segment
North Dakota Montrail 23.3
North Dakota Williams 69.8
North Dakota McKenzie 49.5
Total (Stanley-Johnson Corner) 142.6
Mainline - North Dakota Segment
North Dakota McKenzie 11.1
North Dakota Dunn 51.3
North Dakota Mercer 26.1
North Dakota Morton 71.4
North Dakota Emmons 43.5
Total (Johnson Corner - ND/SD State Line) 203.4
Total North Dakota 346.0
Source: Dakota Access, LLC
It also presents lengths for each of the five counties in North Dakota that will be traversed by the
trunkline portion of the pipeline. The total North Dakota in-field line and trunkline pipeline mileage
6 The mileage numbers are subject to change.
An Assessment of the Economic Impact of the Dakota Access Pipeline, 2014
Strategic Economics Group 12
equals 346 miles. In addition, one pumping station will be constructed in the state. However, the exact
location for the pumping stations has not yet been determined.
The total estimated investment in North Dakota for the crude oil in-field pipelines, operational storage
facilities, and construction of the trunkline pipeline, pumping stations, architectural, engineering and
real estate services, easement payments and other support services will equal $1.4 billion. Excluding
the cost of the pumping stations and tanks, the construction of the pipeline is expected to be $2.73
Million per mile.
2.1.2 South Dakota
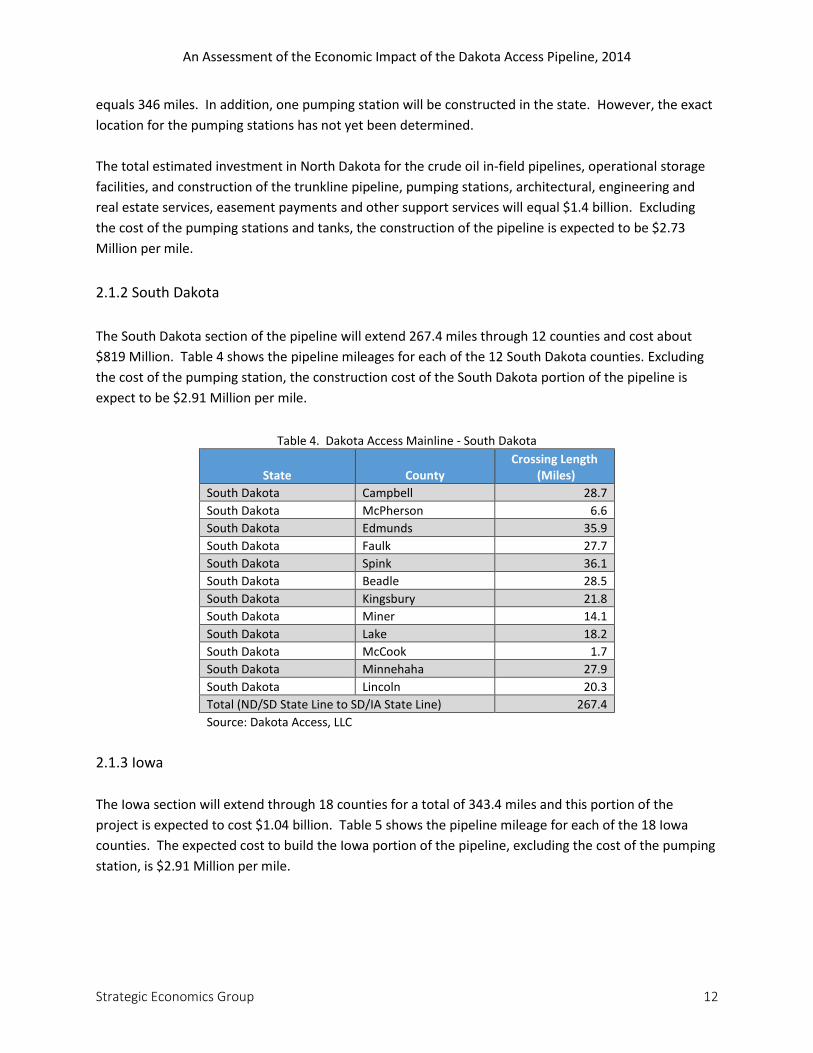
The South Dakota section of the pipeline will extend 267.4 miles through 12 counties and cost about
$819 Million. Table 4 shows the pipeline mileages for each of the 12 South Dakota counties. Excluding
the cost of the pumping station, the construction cost of the South Dakota portion of the pipeline is
expect to be $2.91 Million per mile.
Table 4. Dakota Access Mainline - South Dakota
State County Crossing Length
(Miles)
South Dakota Campbell 28.7
South Dakota McPherson 6.6
South Dakota Edmunds 35.9
South Dakota Faulk 27.7
South Dakota Spink 36.1
South Dakota Beadle 28.5
South Dakota Kingsbury 21.8
South Dakota Miner 14.1
South Dakota Lake 18.2
South Dakota McCook 1.7
South Dakota Minnehaha 27.9
South Dakota Lincoln 20.3
Total (ND/SD State Line to SD/IA State Line) 267.4
Source: Dakota Access, LLC
2.1.3 Iowa
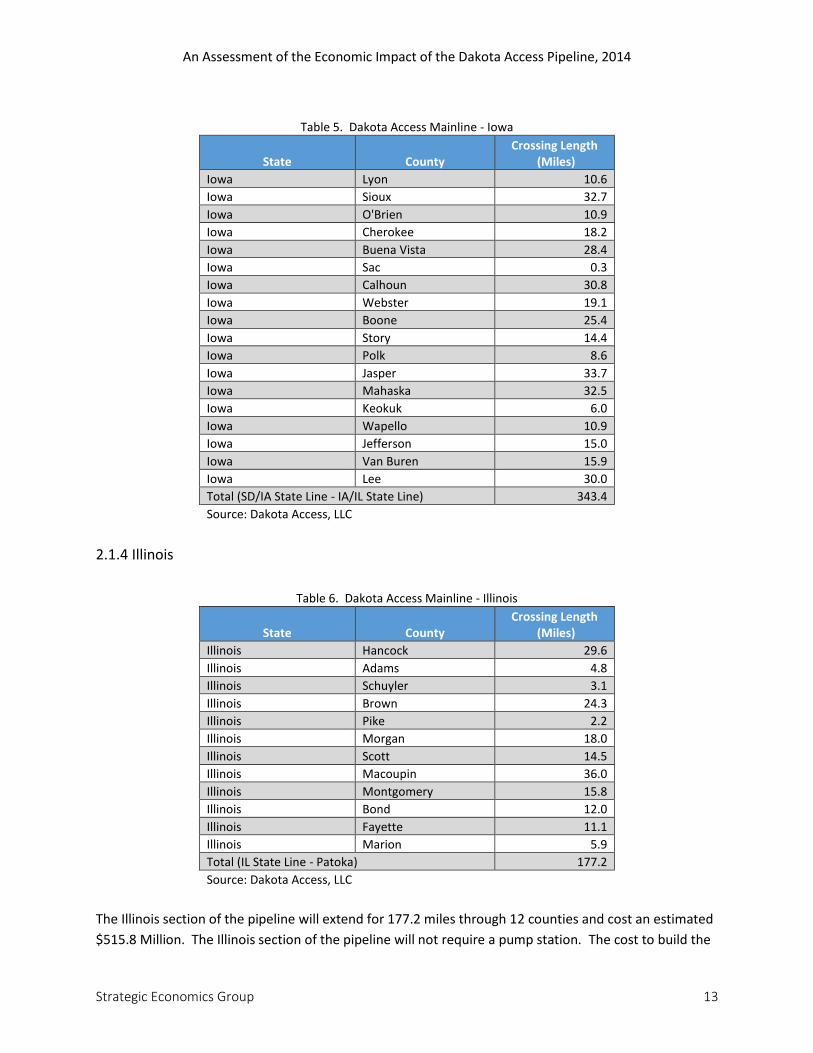
The Iowa section will extend through 18 counties for a total of 343.4 miles and this portion of the
project is expected to cost $1.04 billion. Table 5 shows the pipeline mileage for each of the 18 Iowa
counties. The expected cost to build the Iowa portion of the pipeline, excluding the cost of the pumping
station, is $2.91 Million per mile.
An Assessment of the Economic Impact of the Dakota Access Pipeline, 2014
Strategic Economics Group 13
Table 5. Dakota Access Mainline - Iowa
State County Crossing Length
(Miles)
Iowa Lyon 10.6
Iowa Sioux 32.7
Iowa O'Brien 10.9
Iowa Cherokee 18.2
Iowa Buena Vista 28.4
Iowa Sac 0.3
Iowa Calhoun 30.8
Iowa Webster 19.1
Iowa Boone 25.4
Iowa Story 14.4
Iowa Polk 8.6
Iowa Jasper 33.7
Iowa Mahaska 32.5
Iowa Keokuk 6.0
Iowa Wapello 10.9
Iowa Jefferson 15.0
Iowa Van Buren 15.9
Iowa Lee 30.0
Total (SD/IA State Line - IA/IL State Line) 343.4
Source: Dakota Access, LLC
2.1.4 Illinois
Table 6. Dakota Access Mainline - Illinois
State County Crossing Length
(Miles)
Illinois Hancock 29.6
Illinois Adams 4.8
Illinois Schuyler 3.1
Illinois Brown 24.3
Illinois Pike 2.2
Illinois Morgan 18.0
Illinois Scott 14.5
Illinois Macoupin 36.0
Illinois Montgomery 15.8
Illinois Bond 12.0
Illinois Fayette 11.1
Illinois Marion 5.9
Total (IL State Line - Patoka) 177.2
Source: Dakota Access, LLC
The Illinois section of the pipeline will extend for 177.2 miles through 12 counties and cost an estimated
$515.8 Million. The Illinois section of the pipeline will not require a pump station. The cost to build the
An Assessment of the Economic Impact of the Dakota Access Pipeline, 2014
Strategic Economics Group 14
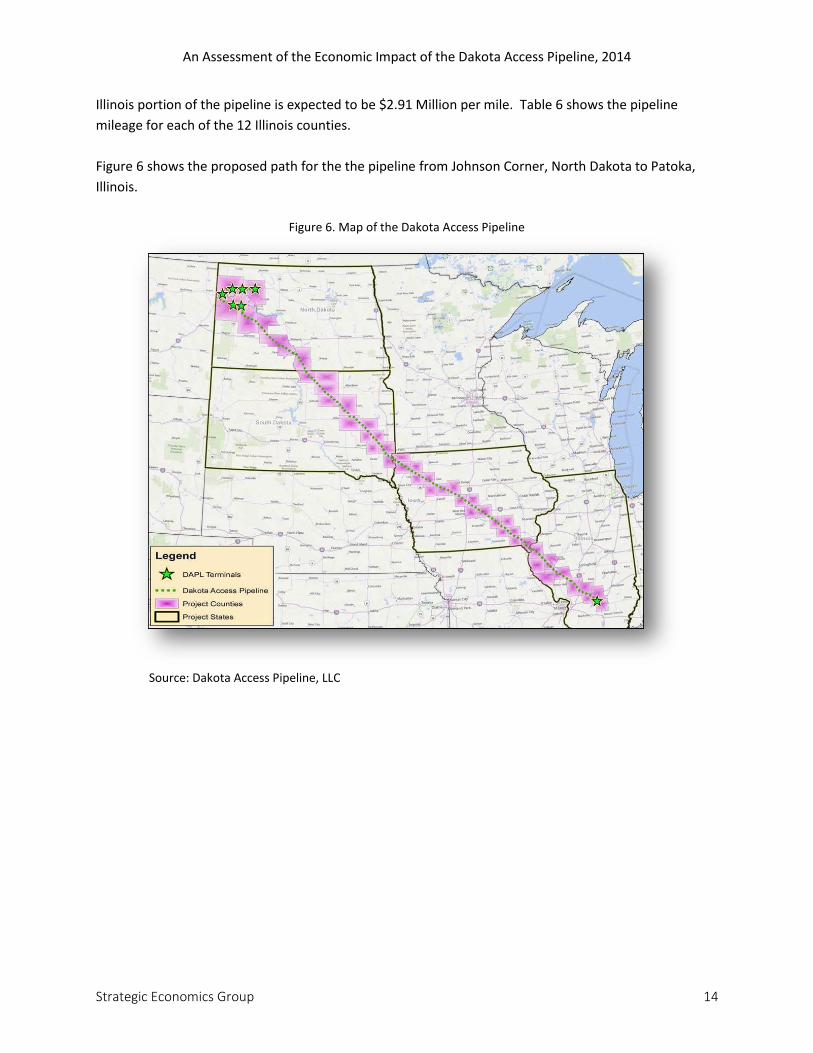
Illinois portion of the pipeline is expected to be $2.91 Million per mile. Table 6 shows the pipeline
mileage for each of the 12 Illinois counties.
Figure 6 shows the proposed path for the the pipeline from Johnson Corner, North Dakota to Patoka,
Illinois.
Figure 6. Map of the Dakota Access Pipeline
Source: Dakota Access Pipeline, LLC
An Assessment of the Economic Impact of the Dakota Access Pipeline, 2014
Strategic Economics Group 15
3.0 Economic and Fiscal Analysis Methodology
3.1 Data Sources
The data employed in this report includes the estimated costs to build, operate, and maintain a crude oil
trunkline pipeline and in-field facilities that will connect the Bakken/Three Forks oil fields of
northwestern North Dakota to the major crude oil terminal hub near Patoka, Illinois. This information
was provided by Dakota Access, LLC and its affiliates. It includes estimates of the cost of materials,
labor, and right-of-way easements and acquisition.
Additional data used in this analysis came from industry publications and from PennEnergy Research.
The PennEnergy data was used to provide a basis for independently confirming the Dakota Access
construction cost estimates. Among the data acquired from PennEnergy Research is a file of crude oil
on-shore pipeline construction cost statistics that cover the years 1980 through 2013.
The analyses done for this report incorporate numerous assumptions. These are stated and explained
in the report. The economic impact estimates are based on financial and other data provided by Dakota
Access, LLC and obtained from other independent sources. It is important to remember that the
analysis results presented in this report are ex-ante or before-the-event estimates. They are dependent
on construction, operating, and maintenance costs estimates provided by Dakota Access, LLC.
3.2 The IMPLAN Input/output Model
The researchers built six economic models for this project:
one model for the four-state region,
one for each of the four individual states in the region and
one model to capture the impact on the entire United States7.
A comparison of the regional impacts to the sum of the four state impacts is intended to identify the
interactivity of the economies within the region.
The models were built using version 3.0 of the IMPLAN system. IMPLAN is a product of MIG, Inc.
(formerly Minnesota IMPLAN Group). The Acronym stands for IMpact analysis for PLANning.
“The IMPLAN System is a general input-output modeling software and data system that tracks every
unique industry group in every level of the regional data, and is designed so almost all the data elements
are available for customization. Sources for creation of the background IMPLAN data include BLS [U.S.
7 The data generated by the IMPLAN Model for the U.S. was not included in this report but could be available from the authors by request.
An Assessment of the Economic Impact of the Dakota Access Pipeline, 2014
Strategic Economics Group 16
Department of Labor, Bureau of Labor Statistics], BEA [U.S. Department of Commerce, Bureau of
Economic Analysis], and Census.
“IMPLAN traces local impacts by looking back through the supply chain. These backward linkages
provide IMPLAN with the information required to examine the iterations of local Indirect and Induced
impacts until the initial spending is completely removed from the Study Area by leakage.”8
3.3 The Mechanics of Linkages and Leakages
Economic impact models like IMPLAN are built on economic relationships that can be described by
linkages and leakages. Linkages refer to the supply chain relationships for the materials and services
employed in a project. The manufacturers and producers of those goods and services purchase their
inputs from other manufacturers and service providers that in turn make purchases from other
companies. This cycle of purchases continues until all of the initial expenditure dollars leak out of the
region’s economy.
The input-output model identifies, for a point in time, all of the relationships between the outputs of all
producers and inputs that they buy from other producers (linkages). The IMPLAN model identifies the
backward supply chain linkages for 528 industries. In a hypothetical closed economy where all of the
suppliers within a region only buy from other suppliers within the same region, the spending loop would
be infinite as the spending of one firm would be the income of another and the dollars would keep
circulating. But, we do not live in a closed loop economy.
As producers purchase from suppliers that are located outside of the region, some of the spending leaks
out of the system (leakages). Profits, savings, and net taxes are also part of the leakage. So, the initial
infusion of spending will continue to generate economic activity within the region only until it is
completely dissipated or leaked from the economy by imports (purchases from outside the region),
profits (monies not spent within the region but paid to owners), savings, and net taxes (taxes minus
government spending in the region).
Even a region as large as the entire United States will still experience leakages to the world economy.
For an economic impact model to be meaningful, it is important to select a region that is small enough
to bring the information to the relevant audience but large enough to minimize the amount of leakages.
In this analysis, the four-state region will undoubtedly have imports of steel and other materials not
manufactured in the four target states. Similarly, many of the project work crews will be from outside of
the four states. The researchers chose to use a region consisting of the four states rather than one
including just the 50 counties through which the pipeline will pass. At the county level the leakages of
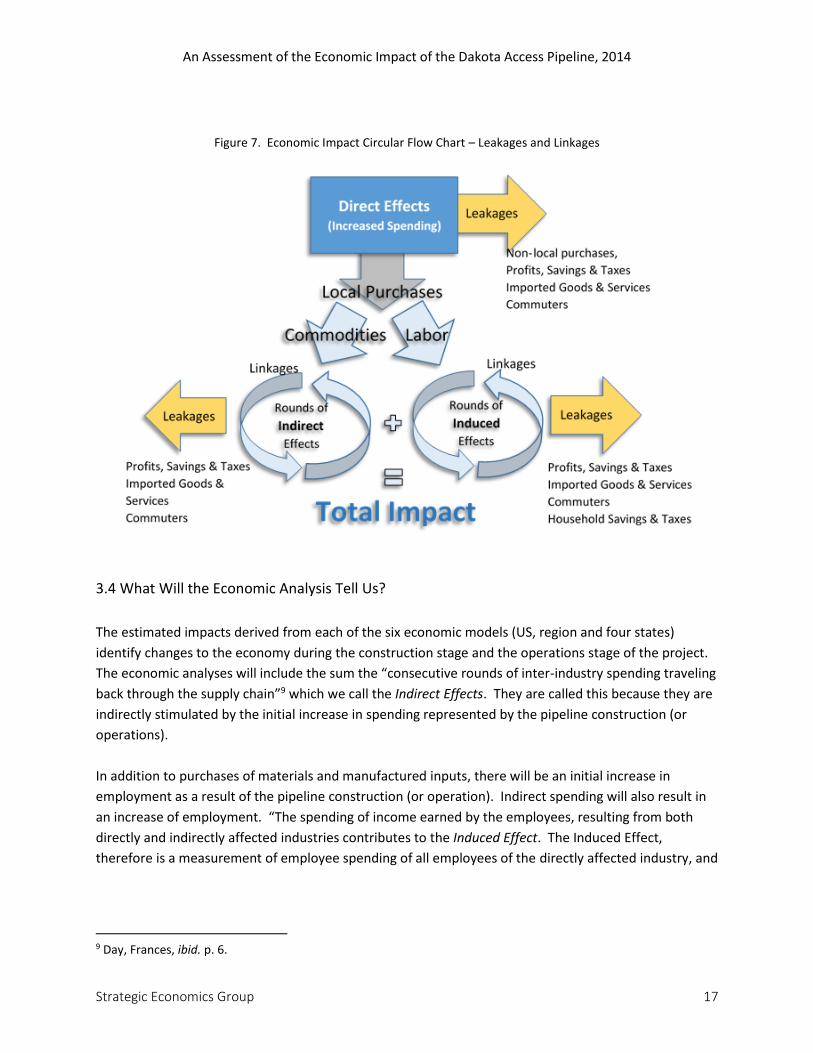
spending would be too great to be of any meaningful value. Figure 2 illustrates the structure of the
IMPLAN Model.
8 Day, Frances, Principles of Impact Analysis and IMPLAN Applications, First Edition, p. 14.
An Assessment of the Economic Impact of the Dakota Access Pipeline, 2014
Strategic Economics Group 17
Figure 7. Economic Impact Circular Flow Chart – Leakages and Linkages
3.4 What Will the Economic Analysis Tell Us?
The estimated impacts derived from each of the six economic models (US, region and four states)
identify changes to the economy during the construction stage and the operations stage of the project.
The economic analyses will include the sum the “consecutive rounds of inter-industry spending traveling
back through the supply chain”9 which we call the Indirect Effects. They are called this because they are
indirectly stimulated by the initial increase in spending represented by the pipeline construction (or
operations).
In addition to purchases of materials and manufactured inputs, there will be an initial increase in
employment as a result of the pipeline construction (or operation). Indirect spending will also result in
an increase of employment. “The spending of income earned by the employees, resulting from both
directly and indirectly affected industries contributes to the Induced Effect. The Induced Effect,
therefore is a measurement of employee spending of all employees of the directly affected industry, and
9 Day, Frances, ibid. p. 6.
An Assessment of the Economic Impact of the Dakota Access Pipeline, 2014
Strategic Economics Group 18
all the employees of subsequent indirectly impacted industries in the supply chain, as long as these
employees live within the defined geography of the study.”10
3.5 Fiscal Analysis Sources
Fiscal analysis involves the identification and estimation of the tax impacts resulting from Direct,
Indirect, and Induced expenditures associated with the pipeline’s construction and operation. The
major types of taxes that will be impacted include:
property taxes,
state and local sales, use, and excise taxes, and
income taxes.
The tax systems of the four states exhibit considerable variation. Therefore, the Revenue Departments
of each state were contacted to obtain information on the taxes most likely to be impacted by the
project. The tax revenue impact estimates are based on the state provided information and output
measures derived from the IMPLAN models. The analysis presents separate tax impact estimates for the
construction and operations stages of the project. The methodologies followed in estimating the
construction stage fiscal impacts are described in Chapter 4 and those used to estimate operations stage
fiscal impacts are described in Chapter 5.
10 Day, Frances, ibid. p. 6.
An Assessment of the Economic Impact of the Dakota Access Pipeline, 2014
Strategic Economics Group 19
4.0 Pipeline Construction Impact Analysis Results
4.1 The Construction Stage Inputs
The Construction stage consists of three parts: the in-field and operational storage facilities in the oil
fields of North Dakota, the building of the pipeline through the four states and the construction of
pumping stations in North Dakota, South Dakota and Iowa. For each of these parts there are required
purchases of materials, equipment and labor. Dakota Access, LLC and its affiliates provided expenditure
estimates by major category (i.e., construction, pipe, valves, fittings, bends, etc.), which Strategic
Economics Group entered into IMPLAN models built to describe the industrial purchasing relationships
of similar pipeline construction projects.
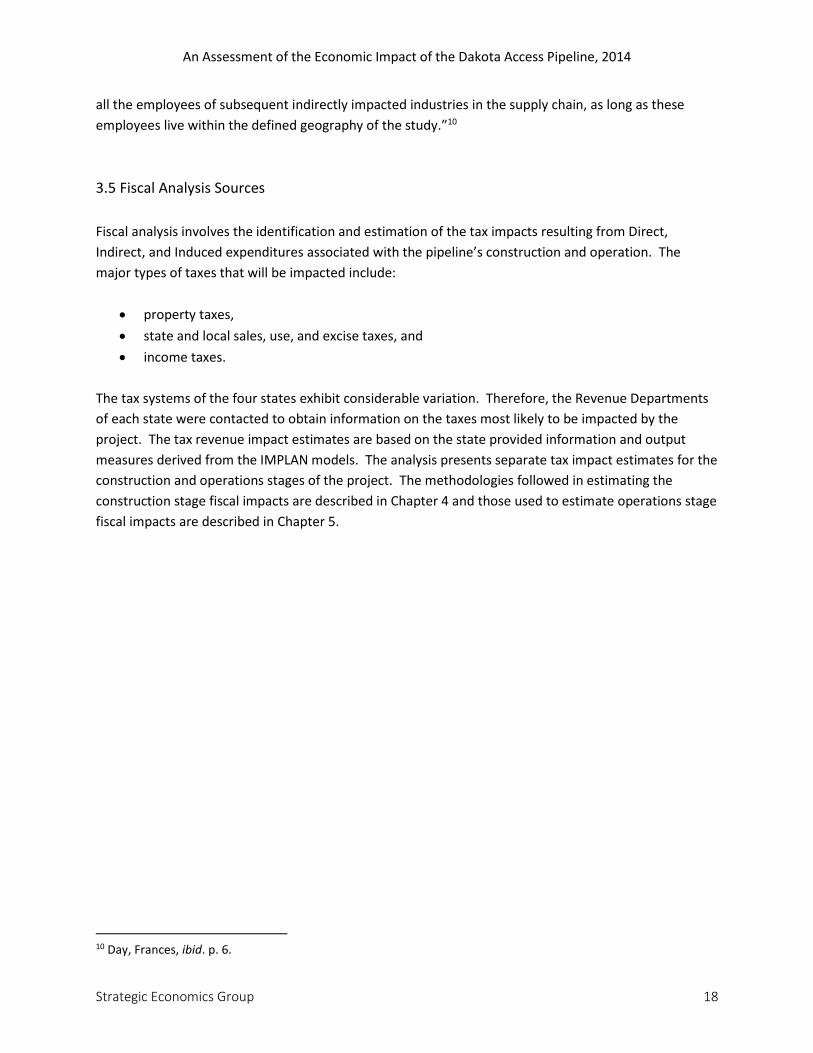
Table 7. IMPLAN Input Spending for the Construction Phase of the Pipeline ($Millions)
Component IMPLAN Sector
North Dakota
South Dakota Iowa Illinois Region
Pipeline
Construction labor and land clearing 29 $30.62 $25.22 $32.39 $16.71 $104.95
Construction 36 $504.67 $415.68 $533.87 $275.46 $1,729.67
Pipe 171 $207.91 $171.25 $219.94 $113.49 $712.60
Valves, Fittings, Bends, etc. 198 $56.70 $46.71 $59.98 $30.95 $194.34
ROW Agents 360 $28.35 $23.35 $29.99 $15.48 $97.17
Engineering & Environmental 369 $34.59 $28.49 $36.59 $18.88 $118.55
Construction and Mill Inspection 380 $25.52 $21.02 $34.80 $13.93 $95.26
Easement & Damages HH $56.70 $46.71 $59.98 $30.95 $194.34
Pumping Stations and Tanks
Construction labor and land clearing 29 $7.46 $7.99 $7.99 $0.00 $23.44
Tankage 189 $422.30 $0.00 $0.00 $0.00 $422.30
Pumping Station Materials & Equip. 247 $14.50 $14.50 $14.50 $0.00 $43.50
Control and monitoring system 251 $4.70 $4.70 $4.70 $0.00 $14.10
Construction equipment 365 $12.92 $13.91 $13.91 $0.00 $40.74
Easement & Damages HH $0.05 $0.05 $0.05 $0.00 $0.15
Total Construction Phase $1,407.00 $819.57 $1,048.70 $515.84 $3,791.11
Source: Dakota Access, LLC
An Assessment of the Economic Impact of the Dakota Access Pipeline, 2014
Strategic Economics Group 20
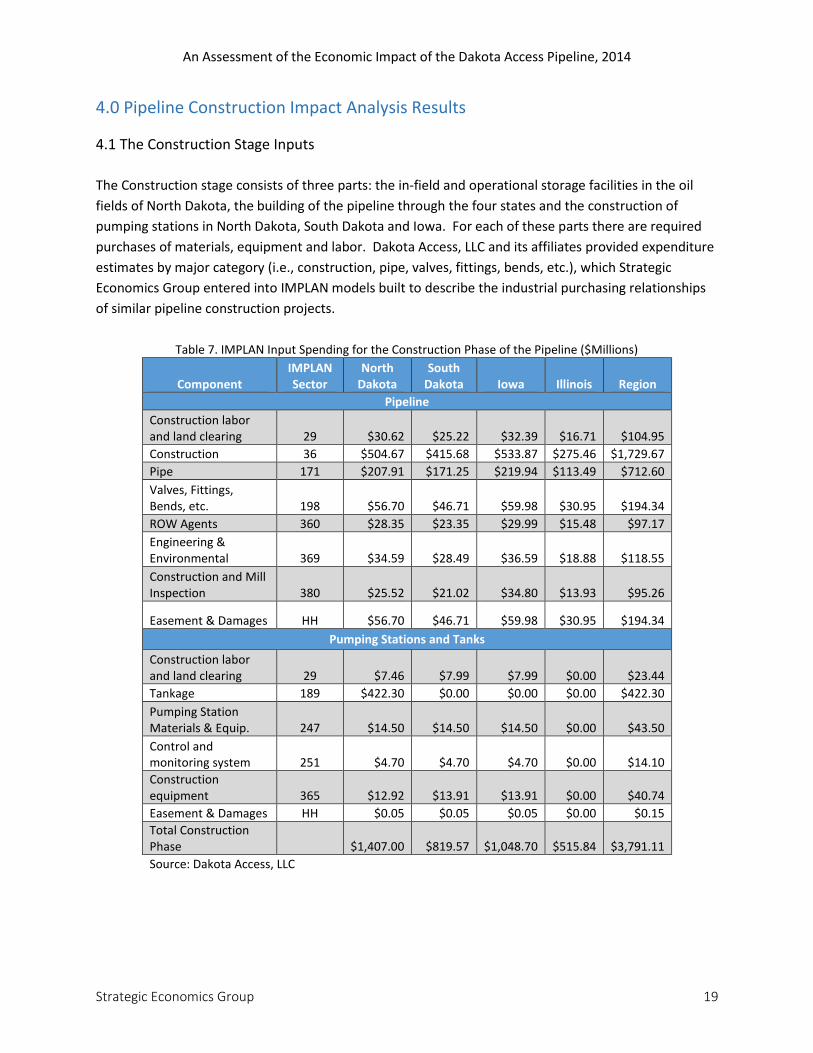
Table 7 shows the values of the spending inputs estimated by Dakota Access, LLC for each state by the
appropriate spending categories. Construction spending inputs amounted to nearly $3.8 Billion for the
region with 37% being spent in North Dakota, 28% in Iowa, 22% in South Dakota and 13% in Illinois
(Shown in Figure 8).
Source: Dakota Access Pipeline, LLC
Estimates of the number of workers necessary to build the pipelines were developed using:
the amount budgeted for construction of the Dakota Access Pipeline,
the imputed employee compensation for each state derived from the IMPLAN models, and
the most recent estimated wage levels for construction and extractive services workers
compiled by the U.S. Labor Department, Bureau of Labor Statistics.
The “Easement and Damages” category in Table 7 is treated in the IMPLAN model as direct household
payments. These payments represent compensation for damage to and the repair of property
associated with construction of the pipeline. In addition, they represent the purchase of a partial
ownership interest in the property that provides the pipeline company with the right of access to the
pipeline for the purposes of future maintenance and repair.
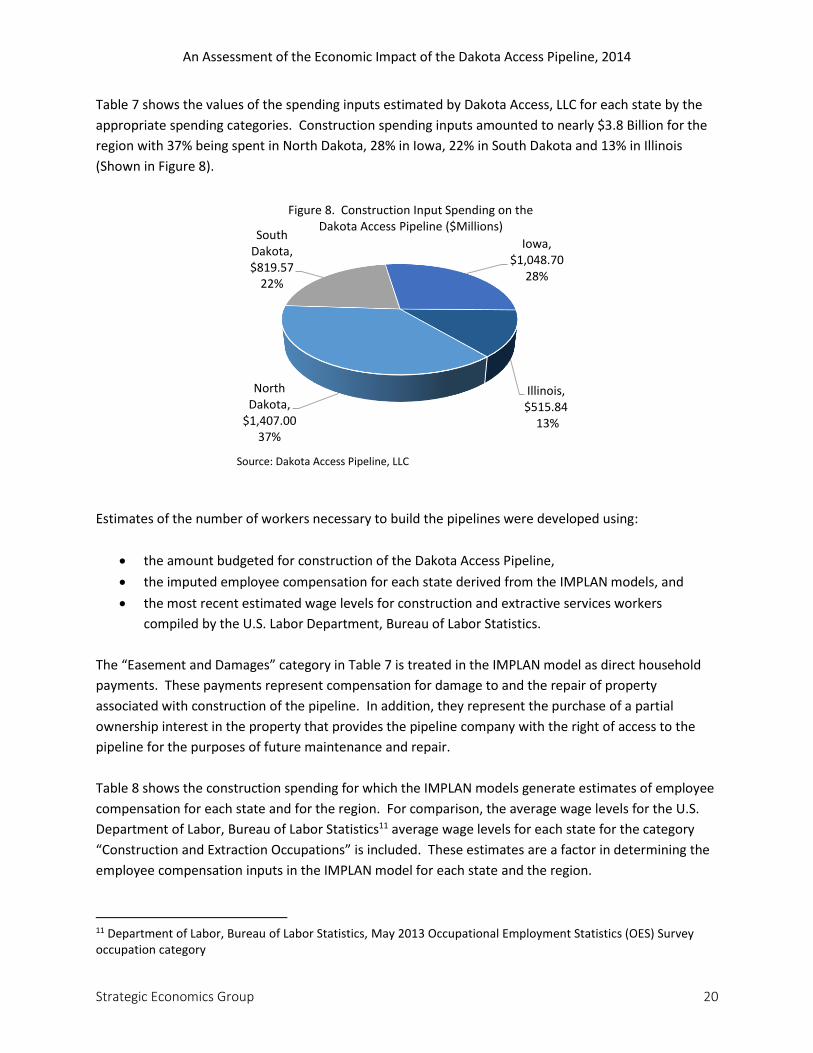
Table 8 shows the construction spending for which the IMPLAN models generate estimates of employee
compensation for each state and for the region. For comparison, the average wage levels for the U.S.
Department of Labor, Bureau of Labor Statistics11 average wage levels for each state for the category
“Construction and Extraction Occupations” is included. These estimates are a factor in determining the
employee compensation inputs in the IMPLAN model for each state and the region.
11 Department of Labor, Bureau of Labor Statistics, May 2013 Occupational Employment Statistics (OES) Survey occupation category
North Dakota,
$1,407.0037%
South Dakota, $819.57
22%
Iowa, $1,048.70
28%
Illinois, $515.84
13%
Figure 8. Construction Input Spending on the Dakota Access Pipeline ($Millions)
An Assessment of the Economic Impact of the Dakota Access Pipeline, 2014
Strategic Economics Group 21
Table 8. Development of the Direct Pipeline Worker Estimates from Construction Spending
Category North
Dakota South
Dakota Iowa Illinois Region
Construction Spending ($M) $504.67 $415.68 $533.87 $275.46 $1,729.67
IMPLAN Employee Compensation ($M) $127.56 $156.76 $196.01 $59.24 $603.65
BLS Survey Wages - Construction & Extractive Services (47-0000) $47,650 $34,420 $41,240 $57,550 $46,387
Estimated number of Workers (FTE) 3,788 3,682 3,528 2,100 12,894
Estimated Worker Avg. Wages $56,660 $33,025 $43,103 $50,364 $48,249
Source: Dakota Access, LLC.
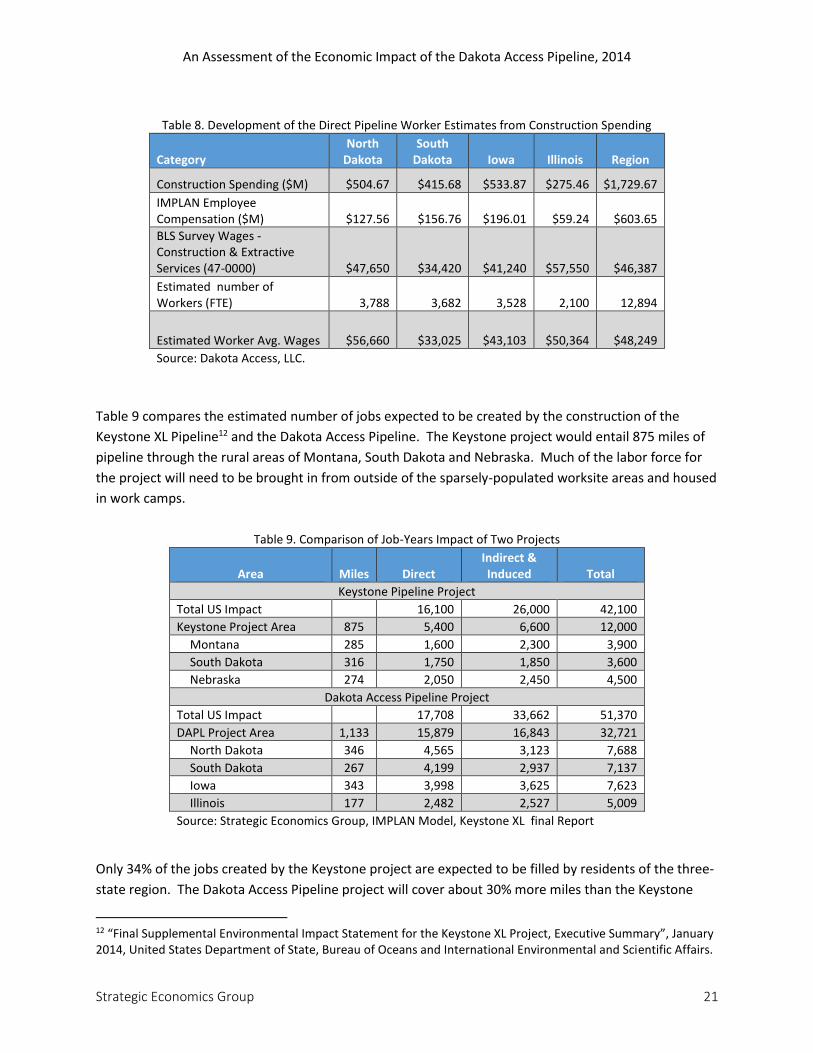
Table 9 compares the estimated number of jobs expected to be created by the construction of the
Keystone XL Pipeline12 and the Dakota Access Pipeline. The Keystone project would entail 875 miles of
pipeline through the rural areas of Montana, South Dakota and Nebraska. Much of the labor force for
the project will need to be brought in from outside of the sparsely-populated worksite areas and housed
in work camps.
Table 9. Comparison of Job-Years Impact of Two Projects
Area Miles Direct Indirect & Induced Total
Keystone Pipeline Project
Total US Impact 16,100 26,000 42,100
Keystone Project Area 875 5,400 6,600 12,000
Montana 285 1,600 2,300 3,900
South Dakota 316 1,750 1,850 3,600
Nebraska 274 2,050 2,450 4,500
Dakota Access Pipeline Project
Total US Impact 17,708 33,662 51,370
DAPL Project Area 1,133 15,879 16,843 32,721
North Dakota 346 4,565 3,123 7,688
South Dakota 267 4,199 2,937 7,137
Iowa 343 3,998 3,625 7,623
Illinois 177 2,482 2,527 5,009
Source: Strategic Economics Group, IMPLAN Model, Keystone XL final Report
Only 34% of the jobs created by the Keystone project are expected to be filled by residents of the three-
state region. The Dakota Access Pipeline project will cover about 30% more miles than the Keystone
12 “Final Supplemental Environmental Impact Statement for the Keystone XL Project, Executive Summary”, January 2014, United States Department of State, Bureau of Oceans and International Environmental and Scientific Affairs.
An Assessment of the Economic Impact of the Dakota Access Pipeline, 2014
Strategic Economics Group 22
project. It will also occur in rural areas, but will be built in more densely-populated states. The IMPLAN
models estimate that the Dakota Access pipeline will result in about 90% of the direct jobs being filled
by residents of the four-state region.13 The indirect and induced impacts will also be greater for the
Dakota Access Pipeline project as more material purchases will occur within the more industrialized and
densely-populated region.
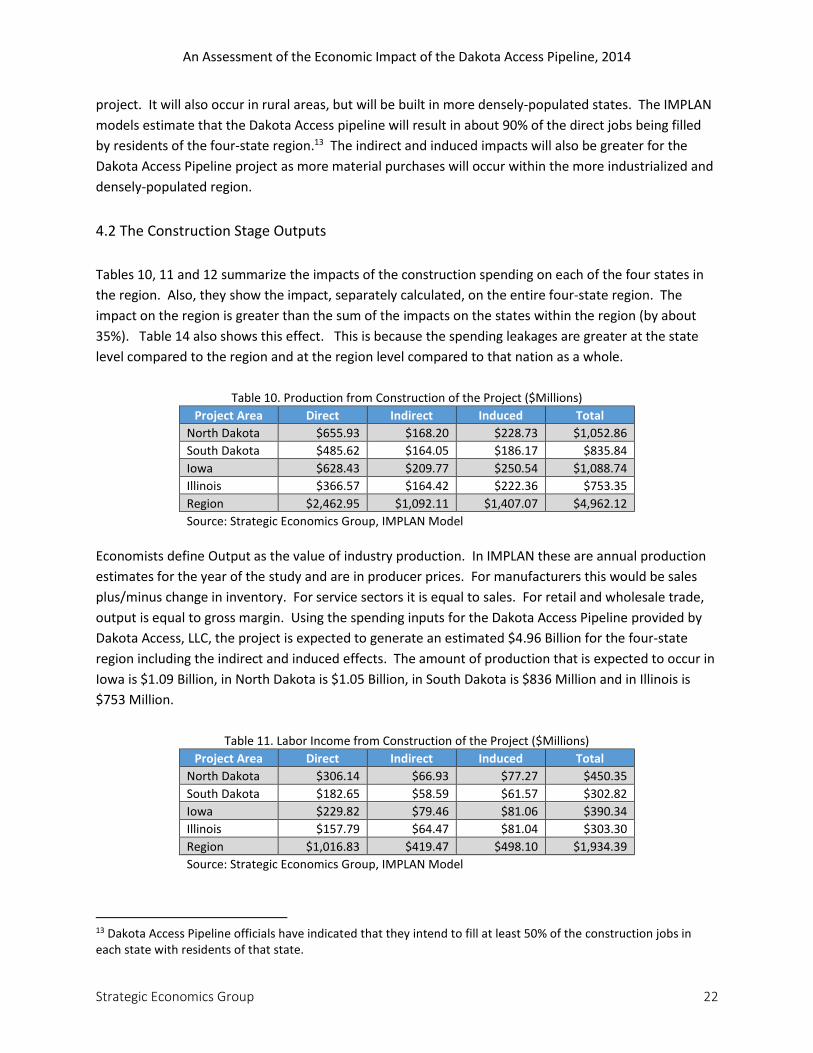
4.2 The Construction Stage Outputs
Tables 10, 11 and 12 summarize the impacts of the construction spending on each of the four states in
the region. Also, they show the impact, separately calculated, on the entire four-state region. The
impact on the region is greater than the sum of the impacts on the states within the region (by about
35%). Table 14 also shows this effect. This is because the spending leakages are greater at the state
level compared to the region and at the region level compared to that nation as a whole.
Table 10. Production from Construction of the Project ($Millions)
Project Area Direct Indirect Induced Total
North Dakota $655.93 $168.20 $228.73 $1,052.86
South Dakota $485.62 $164.05 $186.17 $835.84
Iowa $628.43 $209.77 $250.54 $1,088.74
Illinois $366.57 $164.42 $222.36 $753.35
Region $2,462.95 $1,092.11 $1,407.07 $4,962.12
Source: Strategic Economics Group, IMPLAN Model
Economists define Output as the value of industry production. In IMPLAN these are annual production
estimates for the year of the study and are in producer prices. For manufacturers this would be sales
plus/minus change in inventory. For service sectors it is equal to sales. For retail and wholesale trade,
output is equal to gross margin. Using the spending inputs for the Dakota Access Pipeline provided by
Dakota Access, LLC, the project is expected to generate an estimated $4.96 Billion for the four-state
region including the indirect and induced effects. The amount of production that is expected to occur in
Iowa is $1.09 Billion, in North Dakota is $1.05 Billion, in South Dakota is $836 Million and in Illinois is
$753 Million.
Table 11. Labor Income from Construction of the Project ($Millions)
Project Area Direct Indirect Induced Total
North Dakota $306.14 $66.93 $77.27 $450.35
South Dakota $182.65 $58.59 $61.57 $302.82
Iowa $229.82 $79.46 $81.06 $390.34
Illinois $157.79 $64.47 $81.04 $303.30
Region $1,016.83 $419.47 $498.10 $1,934.39
Source: Strategic Economics Group, IMPLAN Model
13 Dakota Access Pipeline officials have indicated that they intend to fill at least 50% of the construction jobs in each state with residents of that state.
An Assessment of the Economic Impact of the Dakota Access Pipeline, 2014
Strategic Economics Group 23
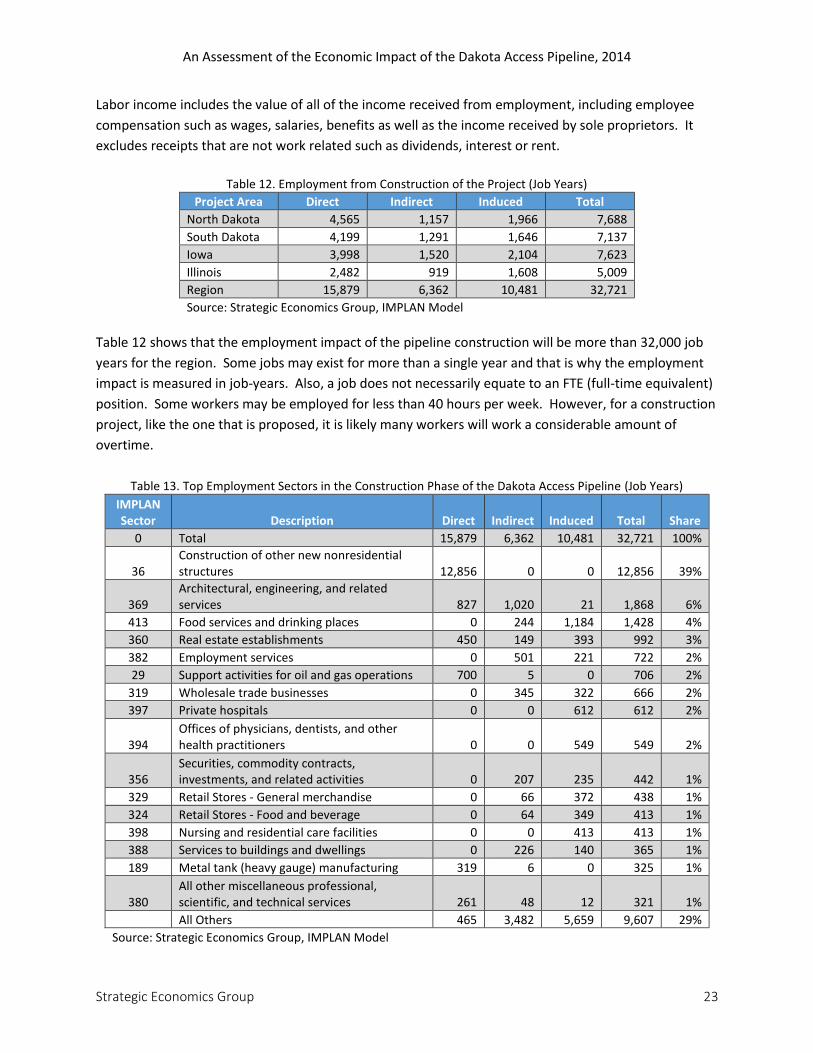
Labor income includes the value of all of the income received from employment, including employee
compensation such as wages, salaries, benefits as well as the income received by sole proprietors. It
excludes receipts that are not work related such as dividends, interest or rent.
Table 12. Employment from Construction of the Project (Job Years)
Project Area Direct Indirect Induced Total
North Dakota 4,565 1,157 1,966 7,688
South Dakota 4,199 1,291 1,646 7,137
Iowa 3,998 1,520 2,104 7,623
Illinois 2,482 919 1,608 5,009
Region 15,879 6,362 10,481 32,721
Source: Strategic Economics Group, IMPLAN Model
Table 12 shows that the employment impact of the pipeline construction will be more than 32,000 job
years for the region. Some jobs may exist for more than a single year and that is why the employment
impact is measured in job-years. Also, a job does not necessarily equate to an FTE (full-time equivalent)
position. Some workers may be employed for less than 40 hours per week. However, for a construction
project, like the one that is proposed, it is likely many workers will work a considerable amount of
overtime.
Table 13. Top Employment Sectors in the Construction Phase of the Dakota Access Pipeline (Job Years)
IMPLAN Sector Description Direct Indirect Induced Total Share
0 Total 15,879 6,362 10,481 32,721 100%
36 Construction of other new nonresidential structures 12,856 0 0 12,856 39%
369 Architectural, engineering, and related services 827 1,020 21 1,868 6%
413 Food services and drinking places 0 244 1,184 1,428 4%
360 Real estate establishments 450 149 393 992 3%
382 Employment services 0 501 221 722 2%
29 Support activities for oil and gas operations 700 5 0 706 2%
319 Wholesale trade businesses 0 345 322 666 2%
397 Private hospitals 0 0 612 612 2%
394 Offices of physicians, dentists, and other health practitioners 0 0 549 549 2%
356 Securities, commodity contracts, investments, and related activities 0 207 235 442 1%
329 Retail Stores - General merchandise 0 66 372 438 1%
324 Retail Stores - Food and beverage 0 64 349 413 1%
398 Nursing and residential care facilities 0 0 413 413 1%
388 Services to buildings and dwellings 0 226 140 365 1%
189 Metal tank (heavy gauge) manufacturing 319 6 0 325 1%
380 All other miscellaneous professional, scientific, and technical services 261 48 12 321 1%
All Others 465 3,482 5,659 9,607 29%
Source: Strategic Economics Group, IMPLAN Model
An Assessment of the Economic Impact of the Dakota Access Pipeline, 2014
Strategic Economics Group 24
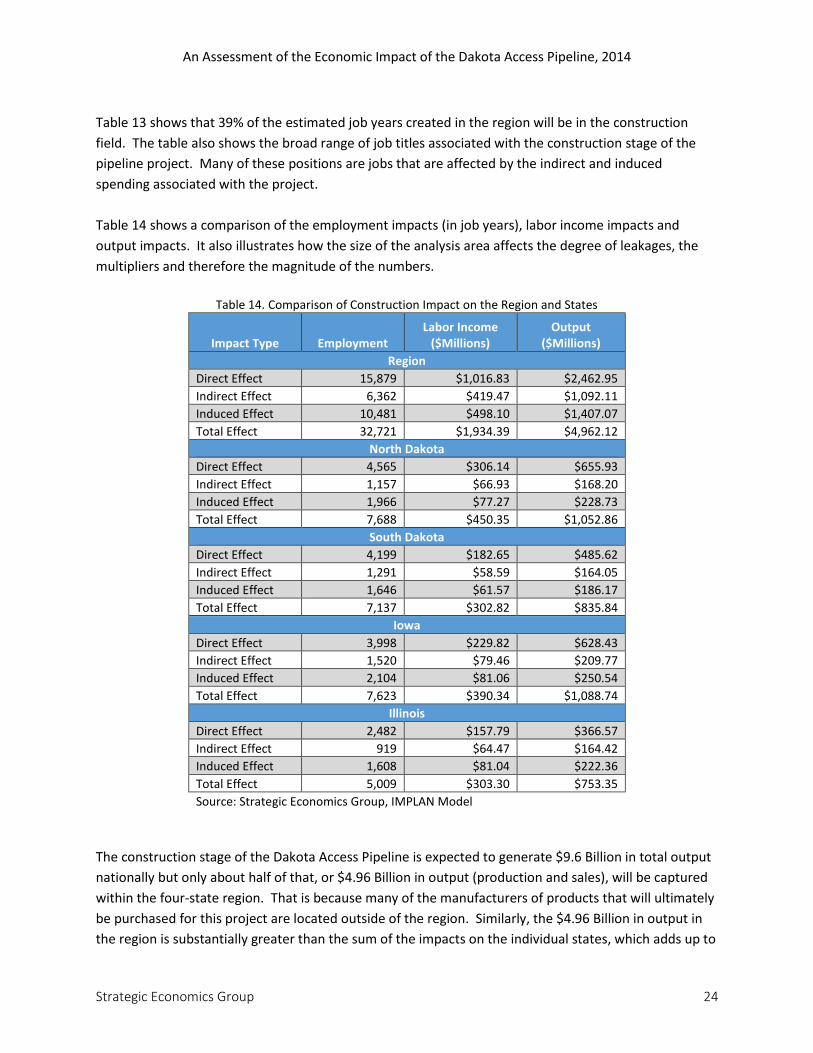
Table 13 shows that 39% of the estimated job years created in the region will be in the construction
field. The table also shows the broad range of job titles associated with the construction stage of the
pipeline project. Many of these positions are jobs that are affected by the indirect and induced
spending associated with the project.
Table 14 shows a comparison of the employment impacts (in job years), labor income impacts and
output impacts. It also illustrates how the size of the analysis area affects the degree of leakages, the
multipliers and therefore the magnitude of the numbers.
Table 14. Comparison of Construction Impact on the Region and States
Impact Type Employment Labor Income
($Millions) Output
($Millions)
Region
Direct Effect 15,879 $1,016.83 $2,462.95
Indirect Effect 6,362 $419.47 $1,092.11
Induced Effect 10,481 $498.10 $1,407.07
Total Effect 32,721 $1,934.39 $4,962.12
North Dakota
Direct Effect 4,565 $306.14 $655.93
Indirect Effect 1,157 $66.93 $168.20
Induced Effect 1,966 $77.27 $228.73
Total Effect 7,688 $450.35 $1,052.86
South Dakota
Direct Effect 4,199 $182.65 $485.62
Indirect Effect 1,291 $58.59 $164.05
Induced Effect 1,646 $61.57 $186.17
Total Effect 7,137 $302.82 $835.84
Iowa
Direct Effect 3,998 $229.82 $628.43
Indirect Effect 1,520 $79.46 $209.77
Induced Effect 2,104 $81.06 $250.54
Total Effect 7,623 $390.34 $1,088.74
Illinois
Direct Effect 2,482 $157.79 $366.57
Indirect Effect 919 $64.47 $164.42
Induced Effect 1,608 $81.04 $222.36
Total Effect 5,009 $303.30 $753.35
Source: Strategic Economics Group, IMPLAN Model
The construction stage of the Dakota Access Pipeline is expected to generate $9.6 Billion in total output
nationally but only about half of that, or $4.96 Billion in output (production and sales), will be captured
within the four-state region. That is because many of the manufacturers of products that will ultimately
be purchased for this project are located outside of the region. Similarly, the $4.96 Billion in output in
the region is substantially greater than the sum of the impacts on the individual states, which adds up to
An Assessment of the Economic Impact of the Dakota Access Pipeline, 2014
Strategic Economics Group 25
$3.73 Billion. This illustrates the leakages of purchasing dollars for materials and services that are
imported from outside of the region and within the region from outside of each individual state. Also,
some of the workers will come from other states to work on this project sending all or a portion of their
paychecks to their home state.
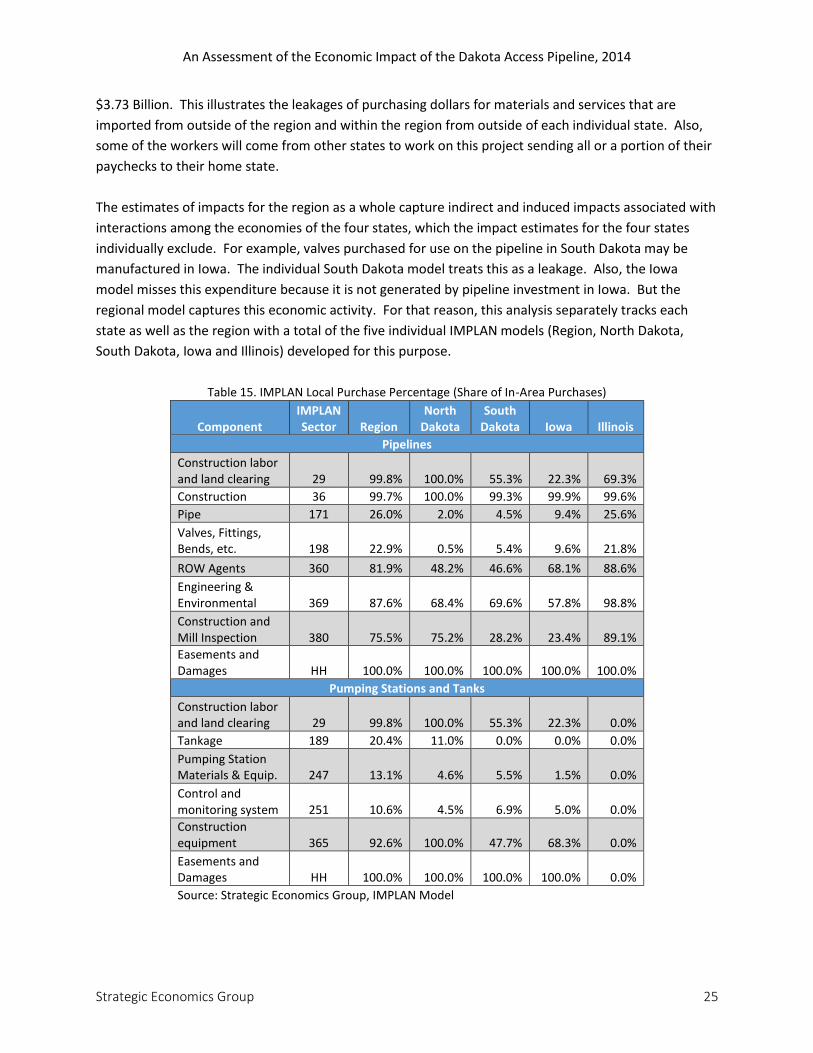
The estimates of impacts for the region as a whole capture indirect and induced impacts associated with
interactions among the economies of the four states, which the impact estimates for the four states
individually exclude. For example, valves purchased for use on the pipeline in South Dakota may be
manufactured in Iowa. The individual South Dakota model treats this as a leakage. Also, the Iowa
model misses this expenditure because it is not generated by pipeline investment in Iowa. But the
regional model captures this economic activity. For that reason, this analysis separately tracks each
state as well as the region with a total of the five individual IMPLAN models (Region, North Dakota,
South Dakota, Iowa and Illinois) developed for this purpose.
Table 15. IMPLAN Local Purchase Percentage (Share of In-Area Purchases)
Component IMPLAN Sector Region
North Dakota
South Dakota Iowa Illinois
Pipelines
Construction labor and land clearing 29 99.8% 100.0% 55.3% 22.3% 69.3%
Construction 36 99.7% 100.0% 99.3% 99.9% 99.6%
Pipe 171 26.0% 2.0% 4.5% 9.4% 25.6%
Valves, Fittings, Bends, etc. 198 22.9% 0.5% 5.4% 9.6% 21.8%
ROW Agents 360 81.9% 48.2% 46.6% 68.1% 88.6%
Engineering & Environmental 369 87.6% 68.4% 69.6% 57.8% 98.8%
Construction and Mill Inspection 380 75.5% 75.2% 28.2% 23.4% 89.1%
Easements and Damages HH 100.0% 100.0% 100.0% 100.0% 100.0%
Pumping Stations and Tanks
Construction labor and land clearing 29 99.8% 100.0% 55.3% 22.3% 0.0%
Tankage 189 20.4% 11.0% 0.0% 0.0% 0.0%
Pumping Station Materials & Equip. 247 13.1% 4.6% 5.5% 1.5% 0.0%
Control and monitoring system 251 10.6% 4.5% 6.9% 5.0% 0.0%
Construction equipment 365 92.6% 100.0% 47.7% 68.3% 0.0%
Easements and Damages HH 100.0% 100.0% 100.0% 100.0% 0.0%
Source: Strategic Economics Group, IMPLAN Model
An Assessment of the Economic Impact of the Dakota Access Pipeline, 2014
Strategic Economics Group 26
Table 15 shows the estimated percentage of each input intended to be purchased for each state (or the
region) that will actually be produced within that state (or region). For instance, while 26% of the pipe
used in the construction of the entire pipeline is expected to be manufactured in the region, only 2%
used in North Dakota will be manufactured in North Dakota, 4.5% of what is used in South Dakota will
be manufactured in South Dakota, etc.. This table shows the Local Purchase Percentage for each
category of construction inputs generated in the IMPLAN models. These factors were based on
historical industry research on supply chain relationships.
4.3 Fiscal Impact of Pipeline Construction The taxes impacted during construction of the Dakota Access Pipeline are sales and use tax, gross
receipts tax, lodging tax, tourism tax, and individual income tax. Taxes impacted once the pipeline is in
operation are sales and use tax, gross receipts tax, individual income tax, and property tax.
Each of the four states in which the pipeline will be constructed was contacted to obtain answers to the
following questions:
Are sales and use taxes owed on just materials used in the construction of the pipeline or on
both materials and labor?
What local option sales and use taxes apply to construction materials and/or labor?
Under what conditions would non-resident workers have a tax liability in the state where the
pipeline construction occurs?
Under what conditions would pipeline owners have a state income tax liability?
Are pipelines subject to property tax and how are pipeline valuations and tax levies determined?
Are there any other taxes that would apply during construction or operation of the pipeline?
Other state tax information, such as tax rates, services subject to sales and use taxes, and withholding
tax payment requirements, were obtained from state departments of revenue Internet sites and from
the Federation of Tax Administrators Internet site.
4.3.1 Sales, Use, Gross Receipts, and Lodging Taxes
All four of the states impose sales and use taxes. In addition, North Dakota, Iowa, and Illinois impose
lodging taxes, while South Dakota imposes a tourism tax. Also, all of the states allow local governments
to impose sales taxes, and all the states allow local governments to impose lodging or tourism taxes.
Table 16 summarizes these taxes.
The sales and use tax bases for construction related expenditures vary among the four states. Illinois,
Iowa, and North Dakota impose these taxes only on materials used in construction projects. South
Dakota taxes materials, labor, and equipment. State sales taxes are imposed on materials and on some
services acquired from suppliers located within the state where the transaction occurs. State use taxes
An Assessment of the Economic Impact of the Dakota Access Pipeline, 2014
Strategic Economics Group 27
generally are imposed on the same types of transactions as sales taxes but apply to purchases from
suppliers located outside the state where the purchaser is located. This distinction means that although
a large share of the materials used in the construction of the pipeline will be acquired from suppliers
located outside the state where they will be used taxes will be owned on these purchases.
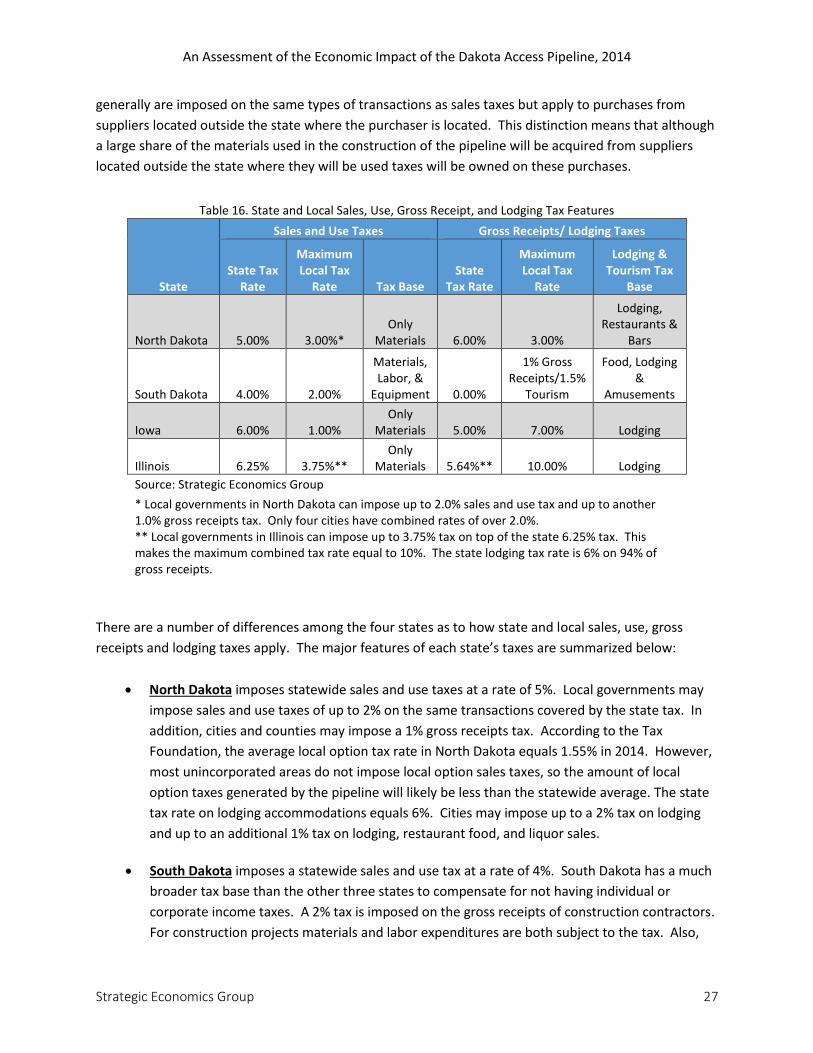
Table 16. State and Local Sales, Use, Gross Receipt, and Lodging Tax Features
State
Sales and Use Taxes Gross Receipts/ Lodging Taxes
State Tax Rate
Maximum Local Tax
Rate Tax Base State
Tax Rate
Maximum Local Tax
Rate
Lodging & Tourism Tax
Base
North Dakota 5.00% 3.00%* Only
Materials 6.00% 3.00%
Lodging, Restaurants &
Bars
South Dakota 4.00% 2.00%
Materials, Labor, &
Equipment 0.00%
1% Gross Receipts/1.5%
Tourism
Food, Lodging &
Amusements
Iowa 6.00% 1.00% Only
Materials 5.00% 7.00% Lodging
Illinois 6.25% 3.75%** Only
Materials 5.64%** 10.00% Lodging
Source: Strategic Economics Group
* Local governments in North Dakota can impose up to 2.0% sales and use tax and up to another 1.0% gross receipts tax. Only four cities have combined rates of over 2.0%. ** Local governments in Illinois can impose up to 3.75% tax on top of the state 6.25% tax. This makes the maximum combined tax rate equal to 10%. The state lodging tax rate is 6% on 94% of gross receipts.
There are a number of differences among the four states as to how state and local sales, use, gross
receipts and lodging taxes apply. The major features of each state’s taxes are summarized below:
North Dakota imposes statewide sales and use taxes at a rate of 5%. Local governments may
impose sales and use taxes of up to 2% on the same transactions covered by the state tax. In
addition, cities and counties may impose a 1% gross receipts tax. According to the Tax
Foundation, the average local option tax rate in North Dakota equals 1.55% in 2014. However,
most unincorporated areas do not impose local option sales taxes, so the amount of local
option taxes generated by the pipeline will likely be less than the statewide average. The state
tax rate on lodging accommodations equals 6%. Cities may impose up to a 2% tax on lodging
and up to an additional 1% tax on lodging, restaurant food, and liquor sales.
South Dakota imposes a statewide sales and use tax at a rate of 4%. South Dakota has a much
broader tax base than the other three states to compensate for not having individual or
corporate income taxes. A 2% tax is imposed on the gross receipts of construction contractors.
For construction projects materials and labor expenditures are both subject to the tax. Also,
An Assessment of the Economic Impact of the Dakota Access Pipeline, 2014
Strategic Economics Group 28
the tax is imposed on equipment used on construction projects even if purchased out-of-state
and no older than seven years. A credit is provided for taxes paid on the equipment to other
states. In addition, the state imposes a 1.5% tourism tax on lodging, amusement,
entertainment, and other tourism related businesses. City governments may impose up to a
2% local option sales tax and up to a 1% gross receipts tax. The Tax Foundation estimates local
option taxes average 1.83% in South Dakota.
Iowa imposes a 6% statewide sales and use tax. Iowa exempts food for home consumption
and prescription medications from sales and use tax. Also, Iowa exempts residential purchases
of electricity, natural gas and other heating fuels. City and county governments may impose up
to a 1% local option sales tax. There is no local option use tax. This means in most cases
construction materials brought into Iowa from other states are not subject to the local option
sales tax. For purchases to which local option sales tax applies the average rate in 2014 equals
0.78% according to the Tax Foundation. In addition the state imposes a 5% lodging tax and
local governments may impose up to a 7% lodging tax.
Illinois imposes a 6.25% statewide sales and use tax. Illinois taxes food for home consumption
and prescription medications at a rate of only 1%. City and county governments may impose
local option retailer’s sales tax on businesses located within the jurisdiction at rates up to
3.75%. The Tax Foundation estimates the average local sales tax rate for Illinois equals 1.91%.
Illinois imposes a statewide 6% lodging tax on 94% of gross room rental receipts. Municipalities
may also impose lodging taxes. The highest local rates appear to be in Chicago at 10% and
Galesburg at 9%. It appears that many of the smaller southern Illinois counties through which
the pipeline will pass do not impose local lodging taxes. For the southern Illinois counties that
have a lodging tax the rate averages about 6%.
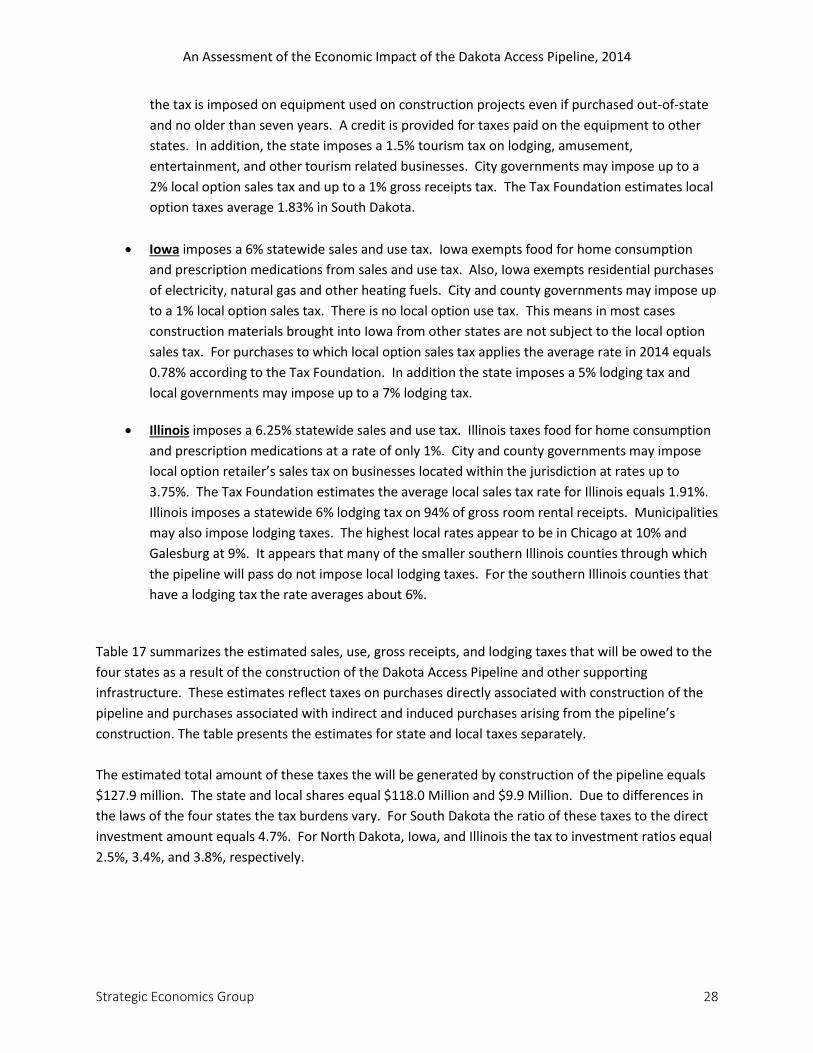
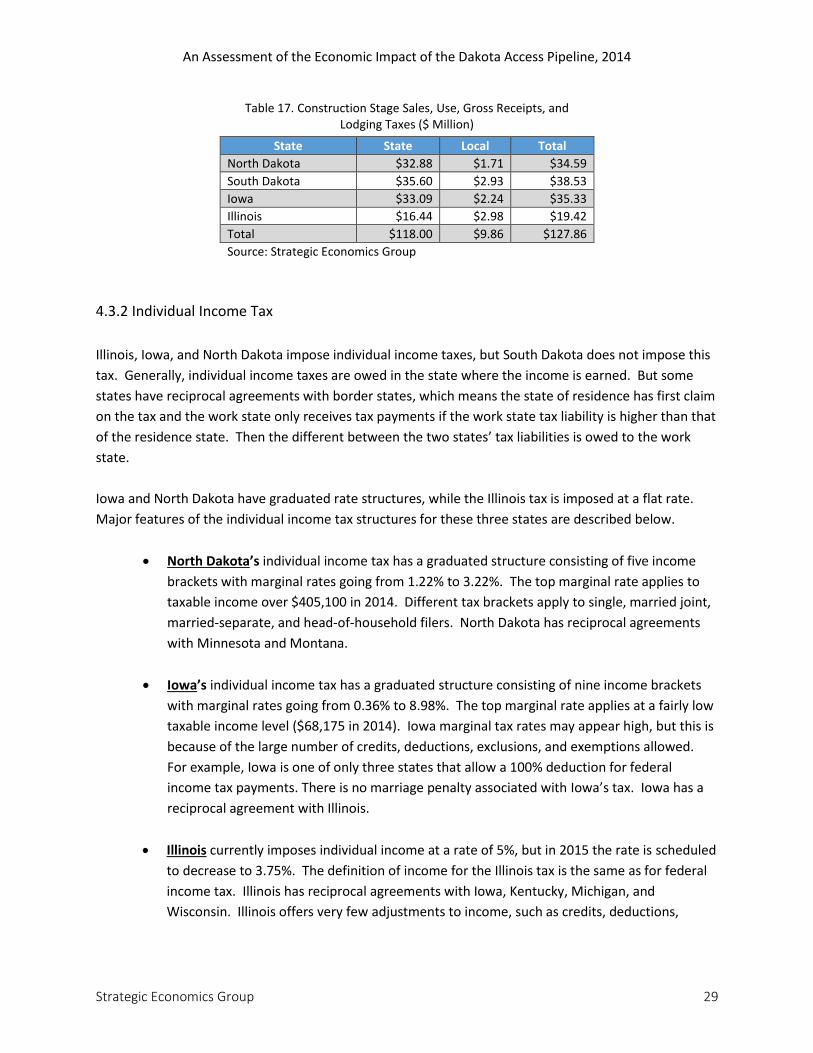
Table 17 summarizes the estimated sales, use, gross receipts, and lodging taxes that will be owed to the
four states as a result of the construction of the Dakota Access Pipeline and other supporting
infrastructure. These estimates reflect taxes on purchases directly associated with construction of the
pipeline and purchases associated with indirect and induced purchases arising from the pipeline’s
construction. The table presents the estimates for state and local taxes separately.
The estimated total amount of these taxes the will be generated by construction of the pipeline equals
$127.9 million. The state and local shares equal $118.0 Million and $9.9 Million. Due to differences in
the laws of the four states the tax burdens vary. For South Dakota the ratio of these taxes to the direct
investment amount equals 4.7%. For North Dakota, Iowa, and Illinois the tax to investment ratios equal
2.5%, 3.4%, and 3.8%, respectively.
An Assessment of the Economic Impact of the Dakota Access Pipeline, 2014
Strategic Economics Group 29
Table 17. Construction Stage Sales, Use, Gross Receipts, and Lodging Taxes ($ Million)
State State Local Total
North Dakota $32.88 $1.71 $34.59
South Dakota $35.60 $2.93 $38.53
Iowa $33.09 $2.24 $35.33
Illinois $16.44 $2.98 $19.42
Total $118.00 $9.86 $127.86
Source: Strategic Economics Group
4.3.2 Individual Income Tax
Illinois, Iowa, and North Dakota impose individual income taxes, but South Dakota does not impose this
tax. Generally, individual income taxes are owed in the state where the income is earned. But some
states have reciprocal agreements with border states, which means the state of residence has first claim
on the tax and the work state only receives tax payments if the work state tax liability is higher than that
of the residence state. Then the different between the two states’ tax liabilities is owed to the work
state.
Iowa and North Dakota have graduated rate structures, while the Illinois tax is imposed at a flat rate.
Major features of the individual income tax structures for these three states are described below.
North Dakota’s individual income tax has a graduated structure consisting of five income
brackets with marginal rates going from 1.22% to 3.22%. The top marginal rate applies to
taxable income over $405,100 in 2014. Different tax brackets apply to single, married joint,
married-separate, and head-of-household filers. North Dakota has reciprocal agreements
with Minnesota and Montana.
Iowa’s individual income tax has a graduated structure consisting of nine income brackets
with marginal rates going from 0.36% to 8.98%. The top marginal rate applies at a fairly low
taxable income level ($68,175 in 2014). Iowa marginal tax rates may appear high, but this is
because of the large number of credits, deductions, exclusions, and exemptions allowed.
For example, Iowa is one of only three states that allow a 100% deduction for federal
income tax payments. There is no marriage penalty associated with Iowa’s tax. Iowa has a
reciprocal agreement with Illinois.
Illinois currently imposes individual income at a rate of 5%, but in 2015 the rate is scheduled
to decrease to 3.75%. The definition of income for the Illinois tax is the same as for federal
income tax. Illinois has reciprocal agreements with Iowa, Kentucky, Michigan, and
Wisconsin. Illinois offers very few adjustments to income, such as credits, deductions,
An Assessment of the Economic Impact of the Dakota Access Pipeline, 2014
Strategic Economics Group 30
exclusions, and exemptions, compared to other states. This mean a high share of gross
income is taxable.
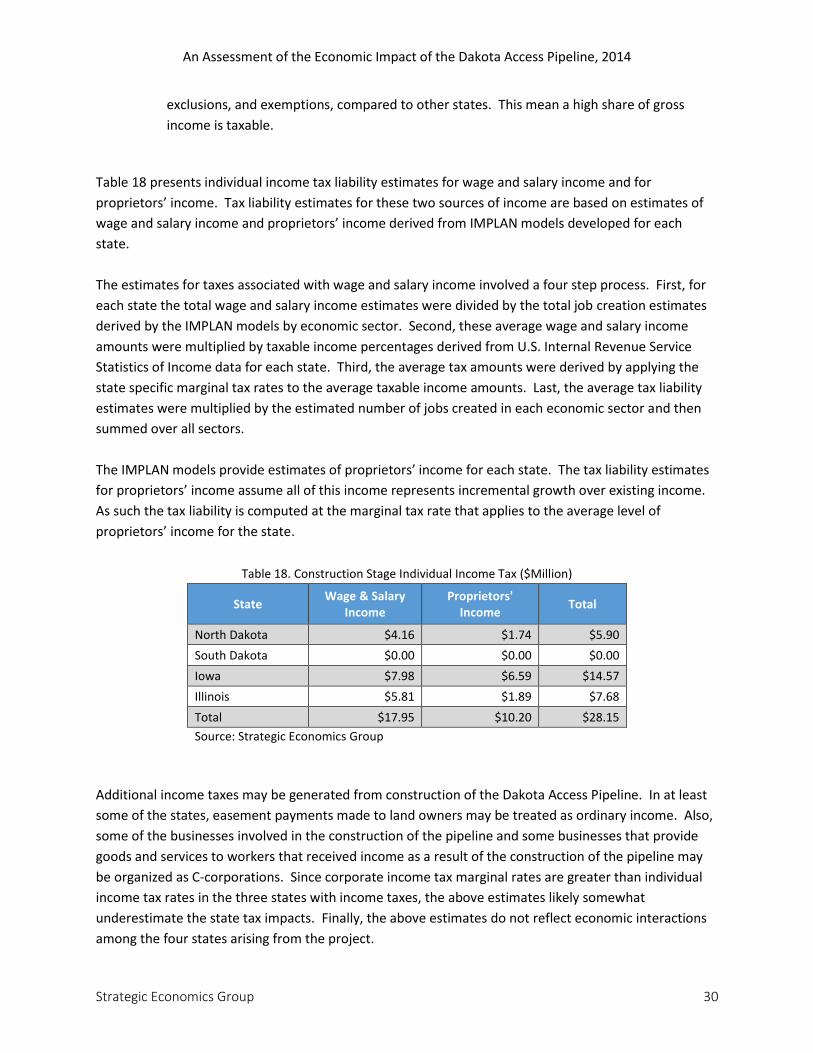
Table 18 presents individual income tax liability estimates for wage and salary income and for
proprietors’ income. Tax liability estimates for these two sources of income are based on estimates of
wage and salary income and proprietors’ income derived from IMPLAN models developed for each
state.
The estimates for taxes associated with wage and salary income involved a four step process. First, for
each state the total wage and salary income estimates were divided by the total job creation estimates
derived by the IMPLAN models by economic sector. Second, these average wage and salary income
amounts were multiplied by taxable income percentages derived from U.S. Internal Revenue Service
Statistics of Income data for each state. Third, the average tax amounts were derived by applying the
state specific marginal tax rates to the average taxable income amounts. Last, the average tax liability
estimates were multiplied by the estimated number of jobs created in each economic sector and then
summed over all sectors.
The IMPLAN models provide estimates of proprietors’ income for each state. The tax liability estimates
for proprietors’ income assume all of this income represents incremental growth over existing income.
As such the tax liability is computed at the marginal tax rate that applies to the average level of
proprietors’ income for the state.
Table 18. Construction Stage Individual Income Tax ($Million)
State Wage & Salary
Income Proprietors'
Income Total
North Dakota $4.16 $1.74 $5.90
South Dakota $0.00 $0.00 $0.00
Iowa $7.98 $6.59 $14.57
Illinois $5.81 $1.89 $7.68
Total $17.95 $10.20 $28.15
Source: Strategic Economics Group
Additional income taxes may be generated from construction of the Dakota Access Pipeline. In at least
some of the states, easement payments made to land owners may be treated as ordinary income. Also,
some of the businesses involved in the construction of the pipeline and some businesses that provide
goods and services to workers that received income as a result of the construction of the pipeline may
be organized as C-corporations. Since corporate income tax marginal rates are greater than individual
income tax rates in the three states with income taxes, the above estimates likely somewhat
underestimate the state tax impacts. Finally, the above estimates do not reflect economic interactions
among the four states arising from the project.
An Assessment of the Economic Impact of the Dakota Access Pipeline, 2014
Strategic Economics Group 31
5.0 Operations and Maintenance Impact Analysis Results
5.1 The Operations and Maintenance Stage Inputs The operations and maintenance stage consists of the on-going activities that will begin near the end of
2016. These activities will require some purchases of materials and equipment and the hiring of a
relatively small pool of labor. Dakota Access, LLC provided expenditure estimates by major category
(i.e., construction, pipe, valves, fittings, bends, etc.), which Strategic Economics Group entered into an
additional set of IMPLAN models built to describe the industrial purchasing relationships similar to the
pipeline construction projects. While the expenditures will be divided between project employees and
contracted work, the impact on the economy will be the same.
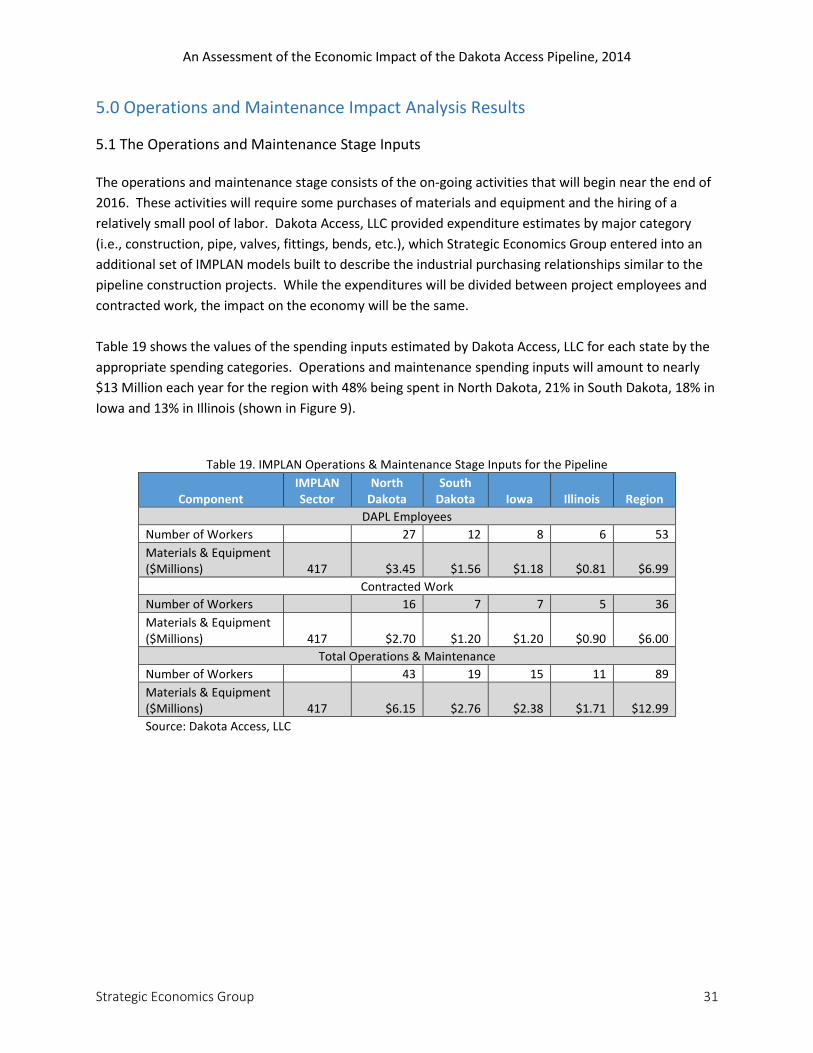
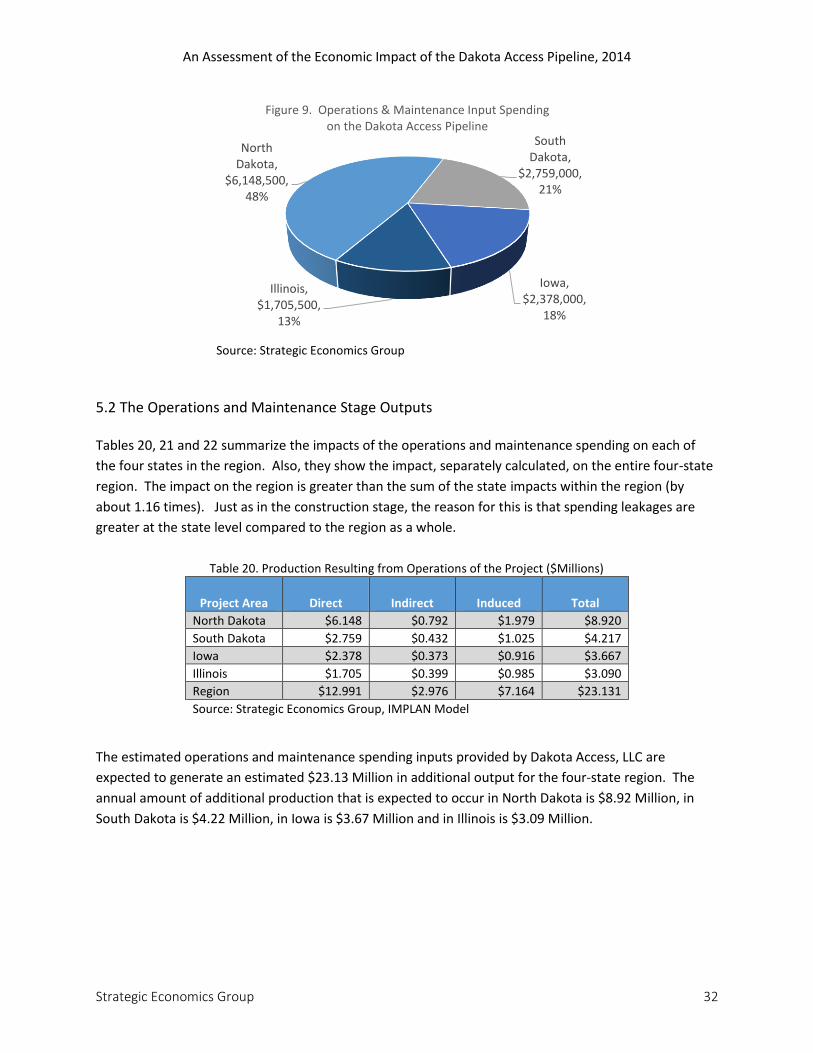
Table 19 shows the values of the spending inputs estimated by Dakota Access, LLC for each state by the
appropriate spending categories. Operations and maintenance spending inputs will amount to nearly
$13 Million each year for the region with 48% being spent in North Dakota, 21% in South Dakota, 18% in
Iowa and 13% in Illinois (shown in Figure 9).
Table 19. IMPLAN Operations & Maintenance Stage Inputs for the Pipeline
Component IMPLAN Sector
North Dakota
South Dakota Iowa Illinois Region
DAPL Employees
Number of Workers 27 12 8 6 53
Materials & Equipment ($Millions) 417 $3.45 $1.56 $1.18 $0.81 $6.99
Contracted Work
Number of Workers 16 7 7 5 36
Materials & Equipment ($Millions) 417 $2.70 $1.20 $1.20 $0.90 $6.00
Total Operations & Maintenance
Number of Workers 43 19 15 11 89
Materials & Equipment ($Millions) 417 $6.15 $2.76 $2.38 $1.71 $12.99
Source: Dakota Access, LLC
An Assessment of the Economic Impact of the Dakota Access Pipeline, 2014
Strategic Economics Group 32
Source: Strategic Economics Group
5.2 The Operations and Maintenance Stage Outputs Tables 20, 21 and 22 summarize the impacts of the operations and maintenance spending on each of
the four states in the region. Also, they show the impact, separately calculated, on the entire four-state
region. The impact on the region is greater than the sum of the state impacts within the region (by
about 1.16 times). Just as in the construction stage, the reason for this is that spending leakages are
greater at the state level compared to the region as a whole.
Table 20. Production Resulting from Operations of the Project ($Millions)
Project Area Direct Indirect Induced Total
North Dakota $6.148 $0.792 $1.979 $8.920
South Dakota $2.759 $0.432 $1.025 $4.217
Iowa $2.378 $0.373 $0.916 $3.667
Illinois $1.705 $0.399 $0.985 $3.090
Region $12.991 $2.976 $7.164 $23.131
Source: Strategic Economics Group, IMPLAN Model
The estimated operations and maintenance spending inputs provided by Dakota Access, LLC are
expected to generate an estimated $23.13 Million in additional output for the four-state region. The
annual amount of additional production that is expected to occur in North Dakota is $8.92 Million, in
South Dakota is $4.22 Million, in Iowa is $3.67 Million and in Illinois is $3.09 Million.
North Dakota,
$6,148,500, 48%
South Dakota,
$2,759,000, 21%
Iowa, $2,378,000,
18%
Illinois, $1,705,500,
13%
Figure 9. Operations & Maintenance Input Spending on the Dakota Access Pipeline
An Assessment of the Economic Impact of the Dakota Access Pipeline, 2014
Strategic Economics Group 33
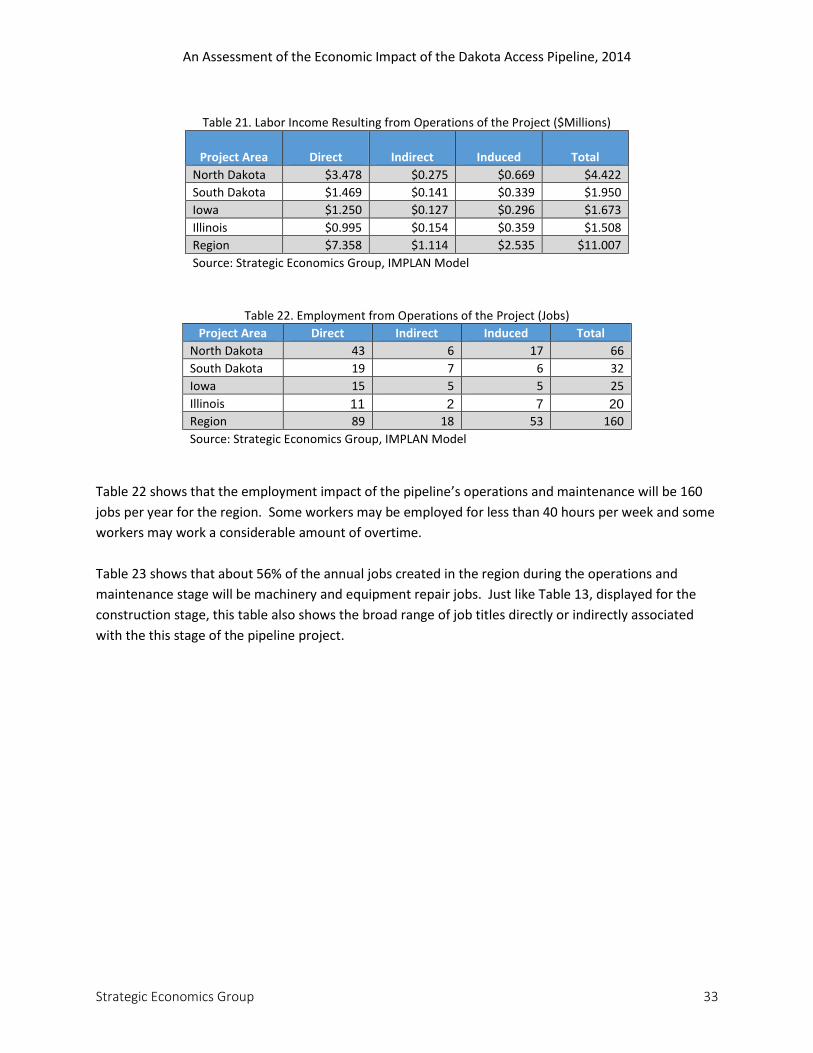
Table 21. Labor Income Resulting from Operations of the Project ($Millions)
Project Area Direct Indirect Induced Total
North Dakota $3.478 $0.275 $0.669 $4.422
South Dakota $1.469 $0.141 $0.339 $1.950
Iowa $1.250 $0.127 $0.296 $1.673
Illinois $0.995 $0.154 $0.359 $1.508
Region $7.358 $1.114 $2.535 $11.007
Source: Strategic Economics Group, IMPLAN Model
Table 22. Employment from Operations of the Project (Jobs)
Project Area Direct Indirect Induced Total
North Dakota 43 6 17 66
South Dakota 19 7 6 32
Iowa 15 5 5 25
Illinois 11 2 7 20
Region 89 18 53 160
Source: Strategic Economics Group, IMPLAN Model
Table 22 shows that the employment impact of the pipeline’s operations and maintenance will be 160
jobs per year for the region. Some workers may be employed for less than 40 hours per week and some
workers may work a considerable amount of overtime.
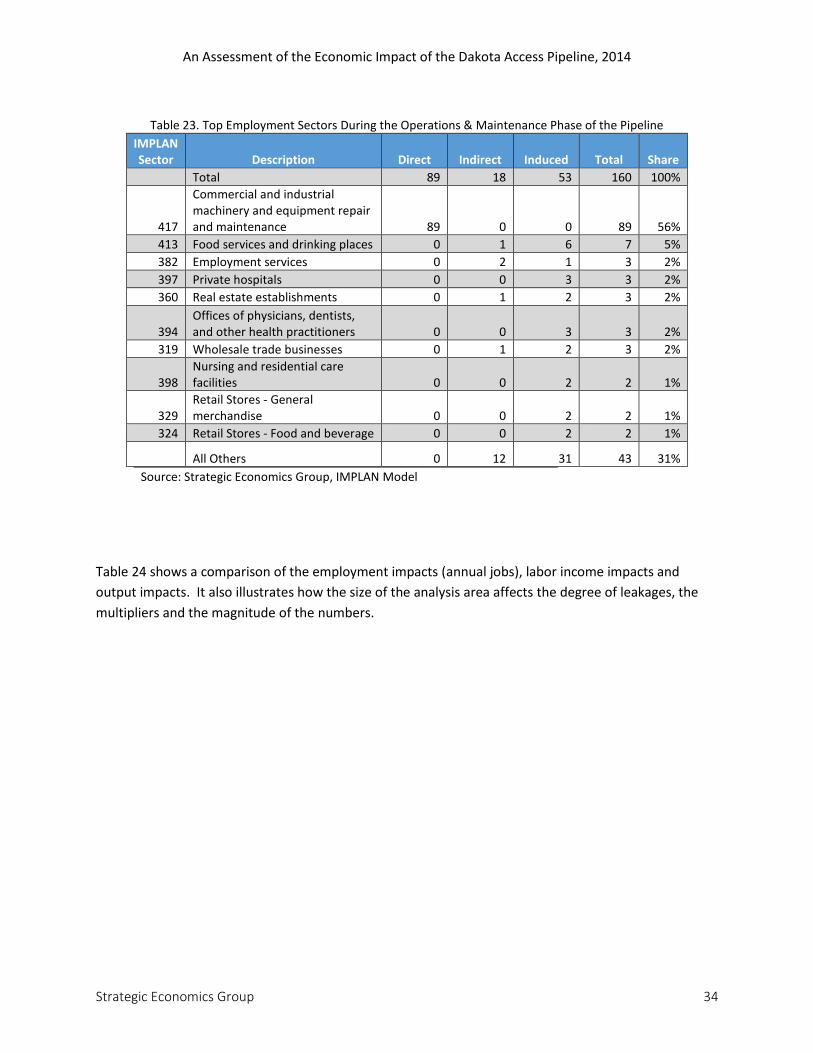
Table 23 shows that about 56% of the annual jobs created in the region during the operations and
maintenance stage will be machinery and equipment repair jobs. Just like Table 13, displayed for the
construction stage, this table also shows the broad range of job titles directly or indirectly associated
with the this stage of the pipeline project.
An Assessment of the Economic Impact of the Dakota Access Pipeline, 2014
Strategic Economics Group 34
Table 23. Top Employment Sectors During the Operations & Maintenance Phase of the Pipeline
IMPLAN Sector Description Direct Indirect Induced Total Share
Total 89 18 53 160 100%
417
Commercial and industrial machinery and equipment repair and maintenance 89 0 0 89 56%
413 Food services and drinking places 0 1 6 7 5%
382 Employment services 0 2 1 3 2%
397 Private hospitals 0 0 3 3 2%
360 Real estate establishments 0 1 2 3 2%
394 Offices of physicians, dentists, and other health practitioners 0 0 3 3 2%
319 Wholesale trade businesses 0 1 2 3 2%
398 Nursing and residential care facilities 0 0 2 2 1%
329 Retail Stores - General merchandise 0 0 2 2 1%
324 Retail Stores - Food and beverage 0 0 2 2 1%
All Others 0 12 31 43 31%
Source: Strategic Economics Group, IMPLAN Model
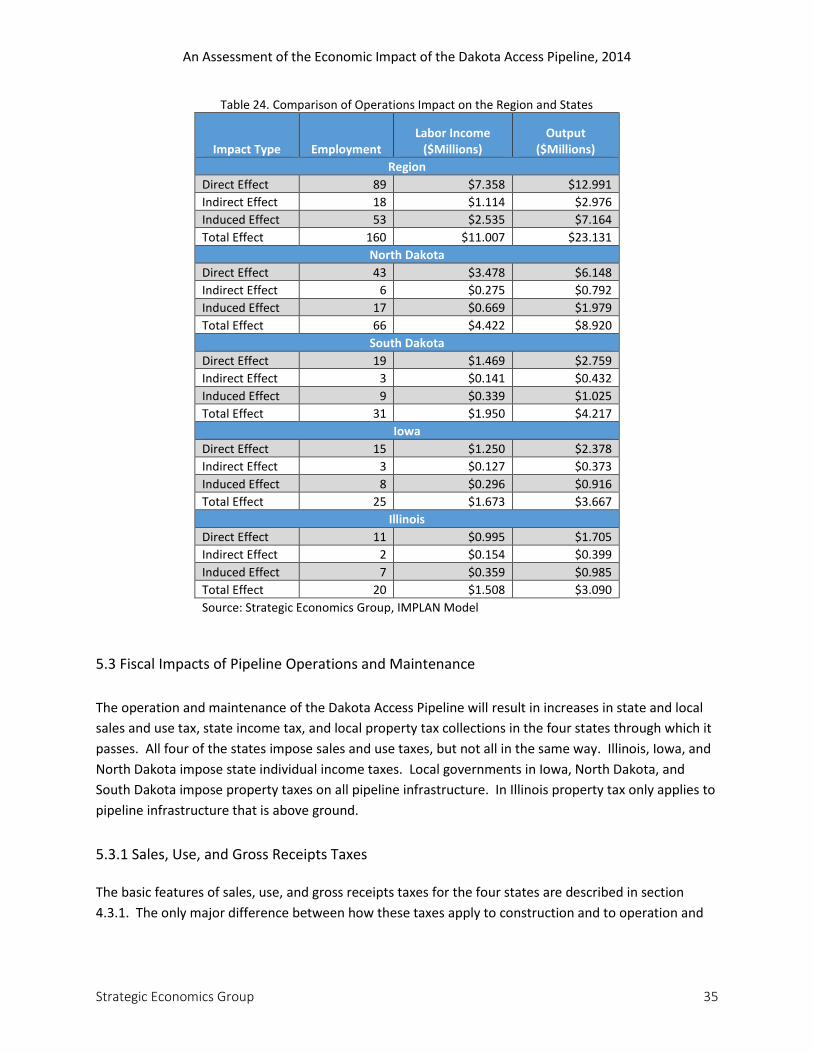
Table 24 shows a comparison of the employment impacts (annual jobs), labor income impacts and
output impacts. It also illustrates how the size of the analysis area affects the degree of leakages, the
multipliers and the magnitude of the numbers.
An Assessment of the Economic Impact of the Dakota Access Pipeline, 2014
Strategic Economics Group 35
Table 24. Comparison of Operations Impact on the Region and States
Impact Type Employment Labor Income
($Millions) Output
($Millions)
Region
Direct Effect 89 $7.358 $12.991
Indirect Effect 18 $1.114 $2.976
Induced Effect 53 $2.535 $7.164
Total Effect 160 $11.007 $23.131
North Dakota
Direct Effect 43 $3.478 $6.148
Indirect Effect 6 $0.275 $0.792
Induced Effect 17 $0.669 $1.979
Total Effect 66 $4.422 $8.920
South Dakota
Direct Effect 19 $1.469 $2.759
Indirect Effect 3 $0.141 $0.432
Induced Effect 9 $0.339 $1.025
Total Effect 31 $1.950 $4.217
Iowa
Direct Effect 15 $1.250 $2.378
Indirect Effect 3 $0.127 $0.373
Induced Effect 8 $0.296 $0.916
Total Effect 25 $1.673 $3.667
Illinois
Direct Effect 11 $0.995 $1.705
Indirect Effect 2 $0.154 $0.399
Induced Effect 7 $0.359 $0.985
Total Effect 20 $1.508 $3.090
Source: Strategic Economics Group, IMPLAN Model
5.3 Fiscal Impacts of Pipeline Operations and Maintenance
The operation and maintenance of the Dakota Access Pipeline will result in increases in state and local
sales and use tax, state income tax, and local property tax collections in the four states through which it
passes. All four of the states impose sales and use taxes, but not all in the same way. Illinois, Iowa, and
North Dakota impose state individual income taxes. Local governments in Iowa, North Dakota, and
South Dakota impose property taxes on all pipeline infrastructure. In Illinois property tax only applies to
pipeline infrastructure that is above ground.
5.3.1 Sales, Use, and Gross Receipts Taxes The basic features of sales, use, and gross receipts taxes for the four states are described in section
4.3.1. The only major difference between how these taxes apply to construction and to operation and
An Assessment of the Economic Impact of the Dakota Access Pipeline, 2014
Strategic Economics Group 36
maintenance activities occurs in Iowa. In Iowa only materials are subject to tax for new construction,
but for maintenance and repair activities both materials and labor are subject to taxation.
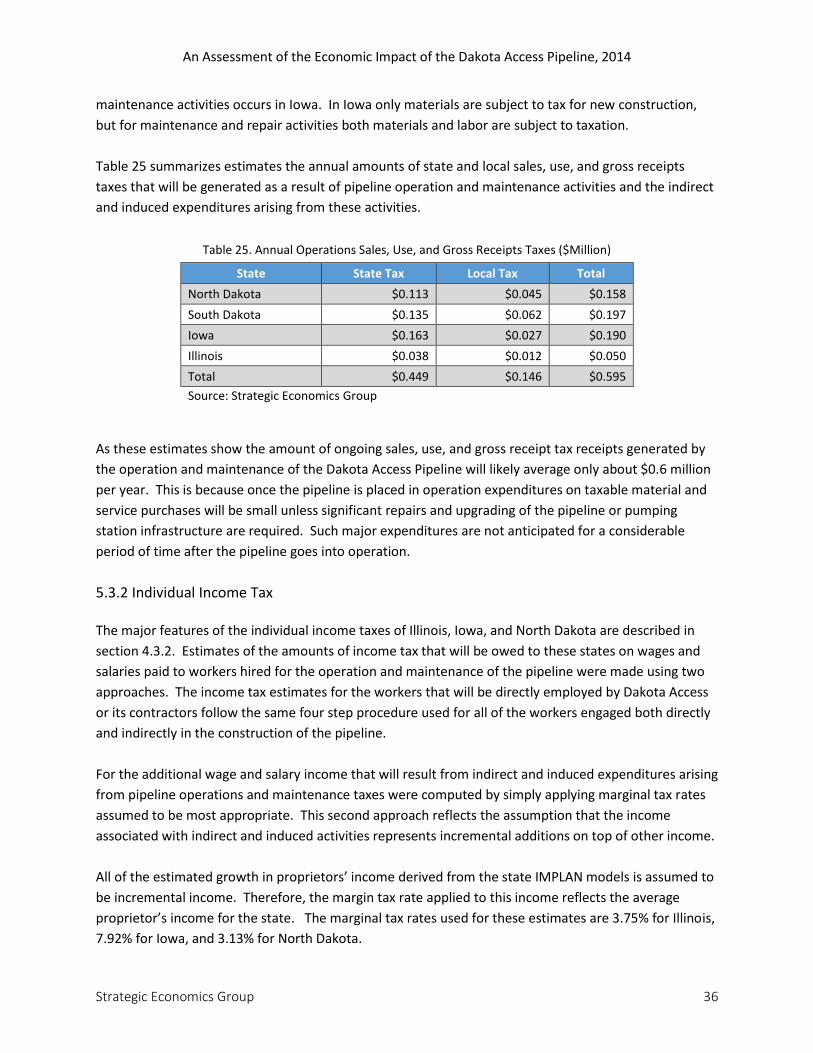
Table 25 summarizes estimates the annual amounts of state and local sales, use, and gross receipts
taxes that will be generated as a result of pipeline operation and maintenance activities and the indirect
and induced expenditures arising from these activities.
Table 25. Annual Operations Sales, Use, and Gross Receipts Taxes ($Million)
State State Tax Local Tax Total
North Dakota $0.113 $0.045 $0.158
South Dakota $0.135 $0.062 $0.197
Iowa $0.163 $0.027 $0.190
Illinois $0.038 $0.012 $0.050
Total $0.449 $0.146 $0.595
Source: Strategic Economics Group
As these estimates show the amount of ongoing sales, use, and gross receipt tax receipts generated by
the operation and maintenance of the Dakota Access Pipeline will likely average only about $0.6 million
per year. This is because once the pipeline is placed in operation expenditures on taxable material and
service purchases will be small unless significant repairs and upgrading of the pipeline or pumping
station infrastructure are required. Such major expenditures are not anticipated for a considerable
period of time after the pipeline goes into operation.
5.3.2 Individual Income Tax The major features of the individual income taxes of Illinois, Iowa, and North Dakota are described in
section 4.3.2. Estimates of the amounts of income tax that will be owed to these states on wages and
salaries paid to workers hired for the operation and maintenance of the pipeline were made using two
approaches. The income tax estimates for the workers that will be directly employed by Dakota Access
or its contractors follow the same four step procedure used for all of the workers engaged both directly
and indirectly in the construction of the pipeline.
For the additional wage and salary income that will result from indirect and induced expenditures arising
from pipeline operations and maintenance taxes were computed by simply applying marginal tax rates
assumed to be most appropriate. This second approach reflects the assumption that the income
associated with indirect and induced activities represents incremental additions on top of other income.
All of the estimated growth in proprietors’ income derived from the state IMPLAN models is assumed to
be incremental income. Therefore, the margin tax rate applied to this income reflects the average
proprietor’s income for the state. The marginal tax rates used for these estimates are 3.75% for Illinois,
7.92% for Iowa, and 3.13% for North Dakota.
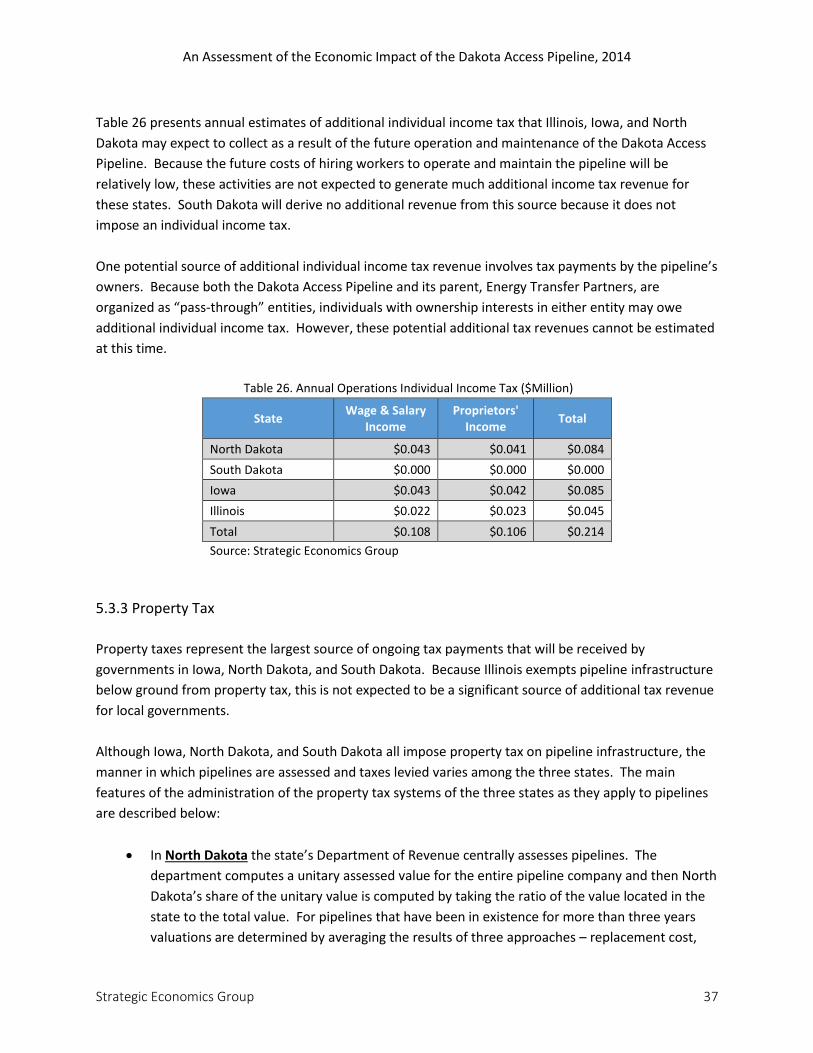
An Assessment of the Economic Impact of the Dakota Access Pipeline, 2014
Strategic Economics Group 37
Table 26 presents annual estimates of additional individual income tax that Illinois, Iowa, and North
Dakota may expect to collect as a result of the future operation and maintenance of the Dakota Access
Pipeline. Because the future costs of hiring workers to operate and maintain the pipeline will be
relatively low, these activities are not expected to generate much additional income tax revenue for
these states. South Dakota will derive no additional revenue from this source because it does not
impose an individual income tax.
One potential source of additional individual income tax revenue involves tax payments by the pipeline’s
owners. Because both the Dakota Access Pipeline and its parent, Energy Transfer Partners, are
organized as “pass-through” entities, individuals with ownership interests in either entity may owe
additional individual income tax. However, these potential additional tax revenues cannot be estimated
at this time.
Table 26. Annual Operations Individual Income Tax ($Million)
State Wage & Salary
Income Proprietors'
Income Total
North Dakota $0.043 $0.041 $0.084
South Dakota $0.000 $0.000 $0.000
Iowa $0.043 $0.042 $0.085
Illinois $0.022 $0.023 $0.045
Total $0.108 $0.106 $0.214
Source: Strategic Economics Group
5.3.3 Property Tax
Property taxes represent the largest source of ongoing tax payments that will be received by
governments in Iowa, North Dakota, and South Dakota. Because Illinois exempts pipeline infrastructure
below ground from property tax, this is not expected to be a significant source of additional tax revenue
for local governments.
Although Iowa, North Dakota, and South Dakota all impose property tax on pipeline infrastructure, the
manner in which pipelines are assessed and taxes levied varies among the three states. The main
features of the administration of the property tax systems of the three states as they apply to pipelines
are described below:
In North Dakota the state’s Department of Revenue centrally assesses pipelines. The
department computes a unitary assessed value for the entire pipeline company and then North
Dakota’s share of the unitary value is computed by taking the ratio of the value located in the
state to the total value. For pipelines that have been in existence for more than three years
valuations are determined by averaging the results of three approaches – replacement cost,
An Assessment of the Economic Impact of the Dakota Access Pipeline, 2014
Strategic Economics Group 38
cost adjusted for economic obsolescence, and income. However, during the first three years of
a new pipeline’s existence the valuation is determined giving precedence to the replacement
cost approach. By statute the assessed value for pipelines equals 50% of the total valuation.
Also, by statute the taxable value for pipelines equals 10% of assessed value. Local
governments set the tax levy rates. For FY 2013 and FY 2014 a 12% credit against taxes was in
place. No decision has been made regarding extension of the credit. For FY 2012 the average
tax levy equaled 19.98% of taxable value or 2.00% of assessed value.
In South Dakota the state Department of Revenue centrally assesses pipeline property. The
department uses three methods to determine the property’s value – cost approach, market
approach, and income approach. However, by necessity the cost approach takes precedence
during the first few years of a new pipeline’s existence. Within the state assessed valuations
for each jurisdiction are based on the value of assets located within the jurisdiction rather than
being determined by pipeline mileage located within each jurisdiction. This means the value of
a pump station will be allocated to the jurisdiction where it is located rather than spread over
all jurisdictions where the pipeline is located. The taxable value of pipeline property equals
85% of the total assessed value. For FY 2012 the average tax levy equaled 2.08% of taxable
value.
In Iowa the state Department of Revenue centrally assesses pipeline property. Pipelines are
valued as a unit using three approaches – original cost less depreciation, income, and stock and
debt. Valuing pipelines as a unit means the entire value of the operating property both inside
and outside Iowa is taken into consideration and then Iowa’s share of the total value of the
property is determined. All assets, including pump stations, are included in the unit value.
Iowa’s share of the unit value is computed as a weighted average of the ratios of Iowa’s share
of gross operating property value to the total value and barrel miles of product transported
through Iowa to the total for the entire pipeline. In Iowa pipelines are subject to tax on 100%
of their assessed value. The levy rates are set by local governments. For assessment year
2013 the average tax levy for pipelines equaled 2.82% of assessed value.
In Illinois most pipeline property is exempt from tax. Only property located above ground is
taxable. The assessed value of taxable property in Illinois is set by statute at 33-1/3% of market
value. The average tax rate for industrial property for 2012 equaled 2.80% of fair market value.
The estimation of the amounts of property tax the proposed pipeline will generate presents a dilemma
due to the different methods used to estimate pipeline valuations. For the three states that impose
property tax on all pipeline assets the preferred valuation method is the income approach. However,
because income can fluctuate from year-to-year and reliable income data will not be available for
several years after the pipeline goes into operation early year valuations by default rely on the cost
method. In order a derive reasonable estimates of property taxes that the proposed pipeline will likely
generate both construction cost based and income based estimates are presented below for the years
2017 through 2021.
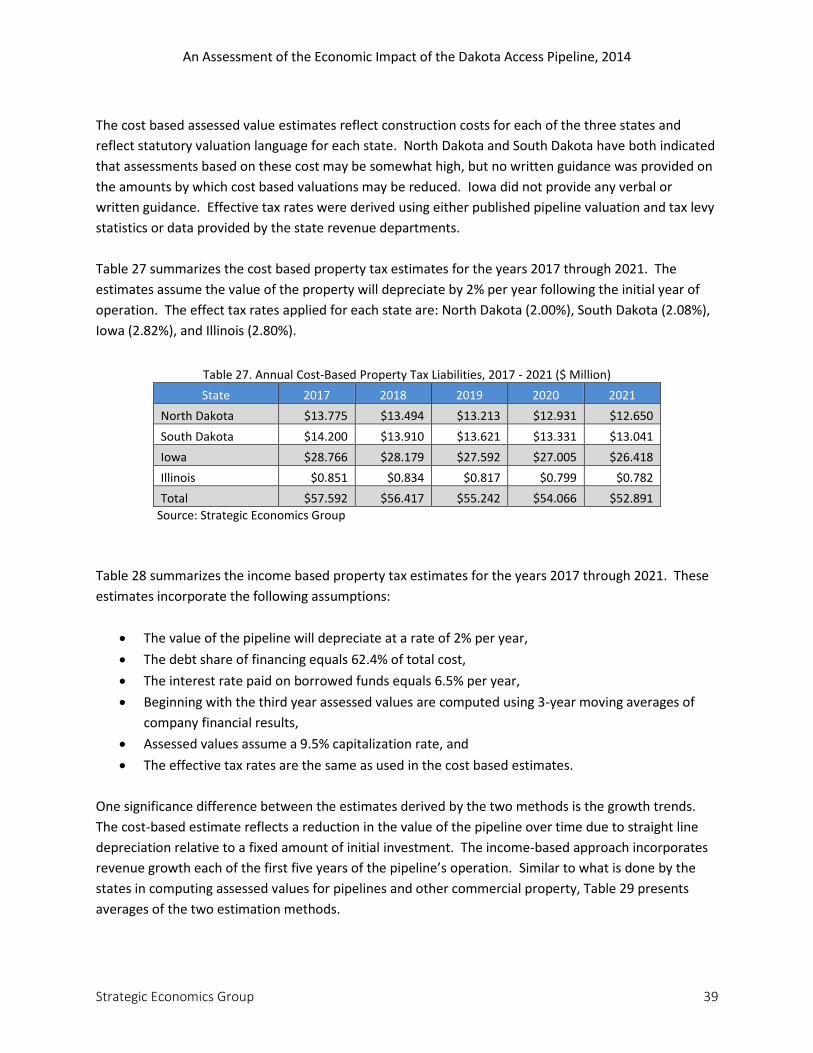
An Assessment of the Economic Impact of the Dakota Access Pipeline, 2014
Strategic Economics Group 39
The cost based assessed value estimates reflect construction costs for each of the three states and
reflect statutory valuation language for each state. North Dakota and South Dakota have both indicated
that assessments based on these cost may be somewhat high, but no written guidance was provided on
the amounts by which cost based valuations may be reduced. Iowa did not provide any verbal or
written guidance. Effective tax rates were derived using either published pipeline valuation and tax levy
statistics or data provided by the state revenue departments.
Table 27 summarizes the cost based property tax estimates for the years 2017 through 2021. The
estimates assume the value of the property will depreciate by 2% per year following the initial year of
operation. The effect tax rates applied for each state are: North Dakota (2.00%), South Dakota (2.08%),
Iowa (2.82%), and Illinois (2.80%).
Table 27. Annual Cost-Based Property Tax Liabilities, 2017 - 2021 ($ Million)
State 2017 2018 2019 2020 2021
North Dakota $13.775 $13.494 $13.213 $12.931 $12.650
South Dakota $14.200 $13.910 $13.621 $13.331 $13.041
Iowa $28.766 $28.179 $27.592 $27.005 $26.418
Illinois $0.851 $0.834 $0.817 $0.799 $0.782
Total $57.592 $56.417 $55.242 $54.066 $52.891
Source: Strategic Economics Group
Table 28 summarizes the income based property tax estimates for the years 2017 through 2021. These
estimates incorporate the following assumptions:
The value of the pipeline will depreciate at a rate of 2% per year,
The debt share of financing equals 62.4% of total cost,
The interest rate paid on borrowed funds equals 6.5% per year,
Beginning with the third year assessed values are computed using 3-year moving averages of
company financial results,
Assessed values assume a 9.5% capitalization rate, and
The effective tax rates are the same as used in the cost based estimates.
One significance difference between the estimates derived by the two methods is the growth trends.
The cost-based estimate reflects a reduction in the value of the pipeline over time due to straight line
depreciation relative to a fixed amount of initial investment. The income-based approach incorporates
revenue growth each of the first five years of the pipeline’s operation. Similar to what is done by the
states in computing assessed values for pipelines and other commercial property, Table 29 presents
averages of the two estimation methods.
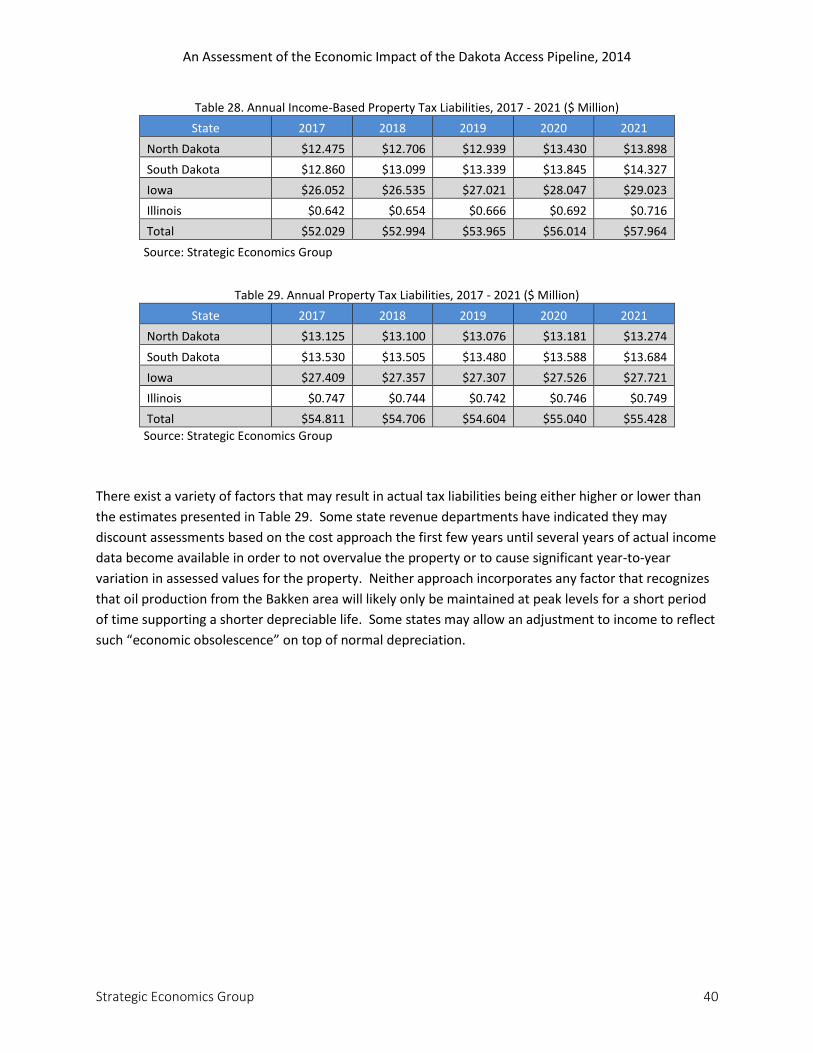
An Assessment of the Economic Impact of the Dakota Access Pipeline, 2014
Strategic Economics Group 40
Table 28. Annual Income-Based Property Tax Liabilities, 2017 - 2021 ($ Million)
State 2017 2018 2019 2020 2021
North Dakota $12.475 $12.706 $12.939 $13.430 $13.898
South Dakota $12.860 $13.099 $13.339 $13.845 $14.327
Iowa $26.052 $26.535 $27.021 $28.047 $29.023
Illinois $0.642 $0.654 $0.666 $0.692 $0.716
Total $52.029 $52.994 $53.965 $56.014 $57.964
Source: Strategic Economics Group
Table 29. Annual Property Tax Liabilities, 2017 - 2021 ($ Million)
State 2017 2018 2019 2020 2021
North Dakota $13.125 $13.100 $13.076 $13.181 $13.274
South Dakota $13.530 $13.505 $13.480 $13.588 $13.684
Iowa $27.409 $27.357 $27.307 $27.526 $27.721
Illinois $0.747 $0.744 $0.742 $0.746 $0.749
Total $54.811 $54.706 $54.604 $55.040 $55.428
Source: Strategic Economics Group
There exist a variety of factors that may result in actual tax liabilities being either higher or lower than
the estimates presented in Table 29. Some state revenue departments have indicated they may
discount assessments based on the cost approach the first few years until several years of actual income
data become available in order to not overvalue the property or to cause significant year-to-year
variation in assessed values for the property. Neither approach incorporates any factor that recognizes
that oil production from the Bakken area will likely only be maintained at peak levels for a short period
of time supporting a shorter depreciable life. Some states may allow an adjustment to income to reflect
such “economic obsolescence” on top of normal depreciation.
An Assessment of the Economic Impact of the Dakota Access Pipeline, 2014
Strategic Economics Group 41
6.0 Transportation Issues that Impact the Regional Economy
A large share of Bakken oil is currently being transported by railroad and it is affecting the farm
economy in Montana, Minnesota and the Dakotas. A Reuters story in May focused on the cause: “U.S.
rail shipments of crude oil have surged 44-fold since 2008, much of them crisscrossing the heart of the
High Plains wheat belt from North Dakota's Bakken oil fields to coastal refiners. Trains carry two-thirds
of 1 million barrels of crude produced each day from the Bakken, where pipelines are scarce.”14
In Tacoma, Washington, the destination for much of that oil, an editorial in the News Tribune reported
that “about three trains of Bakken crude oil move through Pierce County every week. Each train consists
of 90 to 120 tank cars; each car carries about 28,000 gallons. The amount could more than double by
2020.”15
As a result: “the delays have contributed to an accumulation of huge stocks of grain, with North
Dakota's corn stocks hitting a record of more than 192 million bushels on March 1 and wheat stocks at
their largest in three years, government data showed.”16
In early August, Shales Play Media reported that “the price to transport a bushel of wheat to the west
coast ten years ago was about a dollar a bushel. Today that cost has nearly tripled. Market fluctuations
and an increase in oil price over the past few years have driven the price up some, but competition from
oil trains has been the main driver of the increased freight rates.” And “the high wages paid by oil
companies also forces elevator operators to increase their wages so that they can retain employees,
further increasing freight prices.”17
Minnesota Public Radio reported in March that “train delays have been chronic all winter at Agassiz
Valley and across the Midwest. Engines are running five to 10 days late, creating an increasingly costly
backup. Farmers can't haul grain from their farm storage to the elevator because the grain can't move to
market.”18 Not only were farmers and grain elevators impacted, but also producers like General Mills,
whose supply of grains were bottlenecked and whose commodity costs were rising.
In May, North Dakota U.S. Senator Heidi Heitkamp asked North Dakota State University (NDSU) to
examine the impact that rail delays were having on the state’s agricultural industry.19 The assignment
landed on the desk of NDSU crop economist and marketing specialist Frayne Olson. Olson applied an
innovative method for preparing an estimate of the impact using changes in the basis of the three major
commodities: corn, soybeans and hard red spring wheat.
14 Plume, Karl, “Trains for grain scarce on the U.S. Plains”, Reuters New Service, May 14, 2014. 15 Cronin, Mike, “Crops shouldn’t take a back seat to oil shipments”, The News Tribune, August 6, 2014 16 Ibid. 17 Deede, John, “Balancing oil and agriculture”. Bakken.com, Shale Plays Media, August 1, 2014. 18 Gunderson, Dan, “Farmers, elevators fume at costly train delays; oil trains to blame”. March 26, 2014. 19 Olson, Frayne, “Effects of 2013/14 rail transportation problems on North Dakota farm income”,
An Assessment of the Economic Impact of the Dakota Access Pipeline, 2014
Strategic Economics Group 42
Olson compared the basis from terminals to nearby markets for the agricultural commodities and
compared current levels to a reference period to determine the revenue loss to North Dakota farmers.
According to Olson, “there has been an approximately $66.6 million dollar loss in North Dakota farm
level revenue for crops that were sold from January through April, 2014.” He projected “the potential
for an additional $95.4 million dollars in lost farm revenue, from the sale of on-farm grain stocks, if crop
basis levels remain at current levels.”20
Olson compared the historical basis levels to a base year (2009-2010). The basis is the difference
between the cash price at the local terminals and elevators and the future contracts prices at nearby
markets. He then estimated how much of the difference could be due to the inventory buildups that
resulted from rail delays or higher rail costs.21
Olson’s report was cited on September 4, 2014 by North Dakota Governor Jack Dalrymple addressing
the National Surface Transportation Board in Fargo regarding the rail situation. Governor Dalrymple
told the members of the Board that corn, soybeans and wheat acres are at record levels in the Dakotas
and Minnesota, but there’s no place to move it. In North Dakota alone, more than 15 percent of the
2013 grain is still in storage.
The Associated Press coverage of the hearings indicated that “farmers and some politicians believe that
increased crude oil and freight shipments from North Dakota's western oil fields are largely the cause of
shipping delays.”22 A representative of the railroads denied that they favor one sector over another.
On September 12, 2014, the University withdrew the Olson report as an official publication. NDSU
Professor William Wilson was quoted as stating that the conclusions in the Olson study was done too
hastily and was “probably not appropriate or defendable”.23 However, Wilson said, "There was nothing
radically wrong with the study, but this is a study that should have taken six or 12 months. It's a serious
question, it's a serious issue, and it's probably deserving of a serious study."24 Two weeks later,
additional farm price and income data substantiated the Olson conclusions.
On September 25, 2014, Professor Olson indicated that he still stands by the conclusions of his study,
given the assumptions and the timing.25 The issues of rail delays, the buildup of grain inventories at
terminals, erratic farm prices and farm revenue losses are complex. According to Professor Olson, the
issue is driven by the rail infrastructure.
20 Olson, Frayne, “Effects of 2013/14 rail transportation problems on North Dakota farm Income.” 21 Knutson, Jonathan, “NDSU Economist defends withdrawn rail impact study.” Inforum, September 21, 2014. 22 Kolpack, Dave, “Officials ask federal board to help on rail delays.” Associated Press, September 4, 2014. 23 Kolpack, Dave, “NDSU withdraws study cited by public officials in hearings on the impacts of rail delays on ag.” Daily Reporter, September 12, 2014. 24 Ibid. 25 Telephone conversation with Dr. Frayne Olson, September 25, 2014.
An Assessment of the Economic Impact of the Dakota Access Pipeline, 2014
Strategic Economics Group 43
The rail system in Montana and the Dakotas is characterized by four factors:
1. a shortage of grain hopper rail cars
2. the lack of sufficient crews - drawn down during the recession years
3. competition for power units (engines) between the oil shippers and the grain producers
4. the limitation of track time in sparsely-populated states
While Bakken oil does not compete with the grain terminals for rail cars because grain hopper cars
cannot be used to haul oil, they do compete for the limited number of rail crews, power units and track
capacity. Two major rail carriers serve those states, Burlington Northern Santa Fe (BNSF) and Canadian
Pacific (CP). Since the Olson study was released and hearings were held by the federal Surface
Transportation Board, backlogs have been reduced.
“Dakota Mill & Grain, and the other shippers in the state — accustomed to timely arrivals of hopper
cars — saw deliveries last winter fall behind, with rail car backlogs swelling to more than three months
at their peak. The impact was immediate: Purchases were delayed because elevators ran out of room to
store the commodity, leaving farmers to hold onto crops longer than expected. The cost to ship grain by
rail soared, and farmers received less money.”26
In the short run, rail carriers can hire more crews and in the intermediate term can order the purchase
of more power units. However, the available track capacity will continue to be an infrastructure
impediment.
“BNSF has been the most active in trying to relieve the problem, working towards adding railways and
hiring more workers. However, it is unclear if additional rail capacity will be available this year. The huge
backlog of shipments combined with what is expected to be a plentiful harvest in North Dakota makes
another winter with strained rails seem likely.”27
In July, 2014 University of Minnesota economist Edward Usset used the same methodology as Olson to
estimate the impact of railroad service delays on farm income.28 Usset employed the Basis-based
analysis to identify the impact that the recent rail transportation bottleneck had on Minnesota grain
farmers. Table 30 shows the comparable measures for the Olson and Usset studies.
While Olson estimated the loss to North Dakota grain farmers at $66.6 Million for the previous crop and
$95.4 Million for the crop still on the ground, Usset estimated the same measures for Minnesota at
$99.3 Million and $147.7 Million.
26 Doering, Christopher, “Ag bracing for railroad delays as record harvest looms.” www.Argusleader.com, September 15,
2014. 27 Deede, John, “Crop shipments still stranded in North Dakota as oil-by-rail dominates”, Bakken.com, August 26, 2014. 28 Usset, Edward, “Minnesota Basis Analysis”. University of Minnesota Center for Farm Financial Management, July 10, 2014.
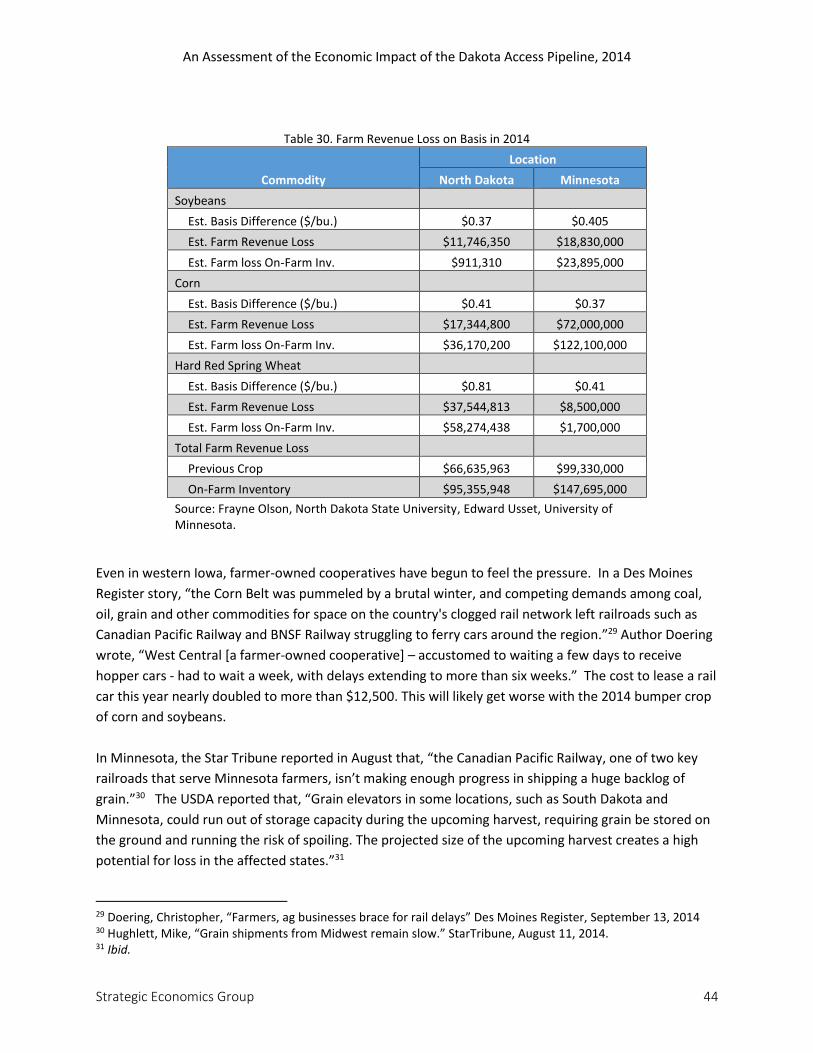
An Assessment of the Economic Impact of the Dakota Access Pipeline, 2014
Strategic Economics Group 44
Table 30. Farm Revenue Loss on Basis in 2014
Commodity
Location
North Dakota Minnesota
Soybeans
Est. Basis Difference ($/bu.) $0.37 $0.405
Est. Farm Revenue Loss $11,746,350 $18,830,000
Est. Farm loss On-Farm Inv. $911,310 $23,895,000
Corn
Est. Basis Difference ($/bu.) $0.41 $0.37
Est. Farm Revenue Loss $17,344,800 $72,000,000
Est. Farm loss On-Farm Inv. $36,170,200 $122,100,000
Hard Red Spring Wheat
Est. Basis Difference ($/bu.) $0.81 $0.41
Est. Farm Revenue Loss $37,544,813 $8,500,000
Est. Farm loss On-Farm Inv. $58,274,438 $1,700,000
Total Farm Revenue Loss
Previous Crop $66,635,963 $99,330,000
On-Farm Inventory $95,355,948 $147,695,000
Source: Frayne Olson, North Dakota State University, Edward Usset, University of Minnesota.
Even in western Iowa, farmer-owned cooperatives have begun to feel the pressure. In a Des Moines
Register story, “the Corn Belt was pummeled by a brutal winter, and competing demands among coal,
oil, grain and other commodities for space on the country's clogged rail network left railroads such as
Canadian Pacific Railway and BNSF Railway struggling to ferry cars around the region.”29 Author Doering
wrote, “West Central [a farmer-owned cooperative] – accustomed to waiting a few days to receive
hopper cars - had to wait a week, with delays extending to more than six weeks.” The cost to lease a rail
car this year nearly doubled to more than $12,500. This will likely get worse with the 2014 bumper crop
of corn and soybeans.
In Minnesota, the Star Tribune reported in August that, “the Canadian Pacific Railway, one of two key
railroads that serve Minnesota farmers, isn’t making enough progress in shipping a huge backlog of
grain.”30 The USDA reported that, “Grain elevators in some locations, such as South Dakota and
Minnesota, could run out of storage capacity during the upcoming harvest, requiring grain be stored on
the ground and running the risk of spoiling. The projected size of the upcoming harvest creates a high
potential for loss in the affected states.”31
29 Doering, Christopher, “Farmers, ag businesses brace for rail delays” Des Moines Register, September 13, 2014 30 Hughlett, Mike, “Grain shipments from Midwest remain slow.” StarTribune, August 11, 2014. 31 Ibid.
An Assessment of the Economic Impact of the Dakota Access Pipeline, 2014
Strategic Economics Group 45
Farmers and grain elevators in Illinois are watching the rail buildup of inventories this year. The Decatur
newspaper reported in early September that, “the 2014 grain crop will exceed U.S. grain storage
capacity by 694 million bushels. That is based on current USDA yield projections.” USDA Deputy
Administrator Arthur Neal said, “South Dakota will not have any storage space for 20 percent of its 2014
corn, soybean and wheat crops.”32
According to the Neal, South Dakota isn't the only state with a storage shortage. Illinois is one of five
other states where grain will be piled on the ground this fall because there is more than can be stored in
grain bins either on the farm or at elevators. In fact, 3 percent of the Illinois crop will be in temporary
storage on the ground, in a state that is a leader in having grain bins. Indiana and Missouri will be short
of storage for 15 percent of their crops. Ohio, Michigan and Kentucky all will be putting 6 percent to 7
percent of their grain on the ground because of insufficient storage space.”
One solution to this growing problem is to build refineries near the oil fields, but that would only change
the need from transporting crude oil to transporting processed oil. Another possible solution would be
to expand the rail infrastructure. A third solution would be to build a pipeline to carry much of the
Bakken oil to the refineries and free up rail system.
The Wahpeton, North Dakota Daily News story on September 9, 2012 pointed out that, “Some within
the ag industry are calling for a pipeline to be built to take the stress off the overburdened rail lines. Last
Thursday the Surface Transportation Board held a public hearing in Fargo to provide the opportunity for
people and businesses to report on service problems within the U.S. rail network. The question of
creating a pipeline has arisen repeatedly by agricultural officials hoping to lessen the severity of the
backlog.”33
32 Ellis, Stu, “Farmers’ loss is foreign market’s gain.” Herald and Review, September 17, 2014. 33 Speidel, Karen, “Experts suggest a pipeline to relieve rail issues.” Daily News, September 19,2014
An Assessment of the Economic Impact of the Dakota Access Pipeline, 2014
Strategic Economics Group 46
7.0 Transportation Cost, Accident Risk, and Other Considerations
7.1 Transportation Cost Differences between Pipeline and Railroad
The rapid pace at which oil production ramped up in North Dakota rising from only 10,297 barrels per
day at the beginning of 2007 to over a million barrels per day by June 2014 has put a great strain on the
state’s transportation infrastructure.34 Existing pipeline capacity equaled only 583,000 barrels per day at
the end of 2013.35 This has forced oil producers to rely on rail to handle over 60% of shipments out of
the state.36
Also, only limited refinery capacity exists in North Dakota at the present time, and this is not likely to
change for the foreseeable future. The Tesoro Mandan refinery located near Bismarck can process up to
60,000 barrels per day. Two new 20,000 barrels per day capacity refineries are planned at Trenton and
Dakota Prairie, but these are intended to produce only diesel and kerosene to satisfy local demands.37
Generally, the transportation of crude oil by pipeline is less expensive than by railroad on a per barrel
mile basis. But market opportunities as well as cost and capacity constraints influence transportation
choices made by oil producers in the Bakken region.
According to transportation cost information included in a February 2014 investors’ presentation by
Kodiak Oil & Gas, it costs $5 per barrel to transport crude oil from North Dakota to Cushing, OK by
pipeline and from Cushing to the Gulf it cost another $4 per barrel via the Seaway pipeline. At the same
time it cost between $10 and $12 per barrel to move oil by railroad from North Dakota to the Gulf. So,
last February pipeline offered a $1 to $3 per barrel savings over railroad for this particular movement of
oil.38
Other information included in this presentation shows that rail transport from North Dakota to
Anacortes, WA costs $9 to $10 per barrel, from North Dakota to the East Coast cost $14 to $17 per
barrel, and North Dakota to California cost between $13 and $15 per barrel. Beyond the shipping costs
oil movements by railroad incur additional costs associated with terminal charges ($2 per barrel), tank
car leases ($2 per barrel), and shrinkage ($1 per barrel).39
34 North Dakota Industrial Commission, Oil and Gas Division, historical monthly oil production statistics (accessed on October 17, 2014 at https://www.dmr.nd.gov/oilgas/stats/statisticsvw.asp) 35 North Dakota Pipeline Authority, US Williston Basin Crude Oil Export Options (accessed on October 17, 2014 at http://northdakotapipelines.com/datastatistics/) 36 Energy Information Administration, “Rail deliveries of U.S. oil to increase in 2014” (August 28, 2014). 37 Energy Information Administration, “Rising North Dakota oil production and demand spur two new refineries” (March 27, 2013). 38 Kodiak Oil & Gas, Investor presentation (February 2014), p. 15; Callum Turcan, “Is a major derailment looming for our nation’s railroads,” The Motley Fool (April 12, 2014) 39 Sandy Fielden, “Crude loves rock’n’rail – Brent, WTI and the impact on Bakken netbacks,” RBN Energy (May 5, 2013).
An Assessment of the Economic Impact of the Dakota Access Pipeline, 2014
Strategic Economics Group 47
Truck transportation plays a limited but important role in moving crude oil from production areas to rail
terminals. During 2013 trucks handled about 64% of this gathering function, while pipelines handled the
remaining 36%. These truck movements cost about $3 per barrel compared to $2 per barrel for
pipeline.40
One reason railroads became an attractive transportation alternative for North Dakota oil producers has
to do with differences in the prices of West Texas Intermediate (WTI) and Brent crude. Due to
transportation bottlenecks at Cushing, OK a large differential existed between the Brent and WTI prices
from the beginning of 2011 through the first quarter of 2013.41 For example, during all of 2012 the
differential equaled $17.61 per barrel and reached as high as $24.87 per barrel during October of that
year. Nationwide railroad carloads of crude oil jumped from 65,751 during 2011 to 233,698 (a 255.4%
increase) during 2012 and to 407,761 (another 74.4% increase) during 2013.42
From December 2009 to January 2013 inventories of crude stored at Cushing, OK rose from 34.5 million
barrels to 51.9 million barrels. Over the same period the differential between Brent and WTI (Brent
minus WTI price) crude went from -$1.48 per barrel to $23.19 per barrel. Since peaking Cushing, OK
crude inventories have dropped to about 21 million barrels at the end of October 2014, and the Brent to
WTI price differential has dropped to around $5 per barrel.43
One major reason for the changes is the completion of the repurposing of the Seaway crude pipeline
from Cushing to Freeport, Texas. Previously this pipeline moved oil into Cushing. Now it moves oil away
from Cushing. This repurposed pipeline went into service in June 2012 with a capacity of 150,000
barrels per day. Following pumping station additions and modifications the capacity increased to
400,000 barrels per day at the beginning of 2013. Further improvements will raise capacity to about
850,000 barrels per day.44 Another pipeline project by TransCanada (Gulf Coast Pipeline) will add up to
an additional 830,000 barrels per day of capacity for moving crude from Cushing, OK to Nederland,
Texas.45 These improvements should reduce the likelihood of future shipping bottlenecks at Cushing
and minimize this as a factor for growth in the Brent – WTI price differential.
When the Brent – WTI price differential falls below $5 per barrel, East and West Coast refineries served
40 Sandy Fielden, “Crude loves rock’n’rail – Brent, WTI and the Impact on Bakken netbacks,” RBN Energy (May 5, 2013) 41 Cushing, OK serves as the pricing location for West Texas Intermediate (WTI) crude. This is because Cushing hosts that largest amount of oil storage facilities in the county totaling 46.3 million barrels. For this reason Cushing is a major transportation hub for oil shipments, particularly for pipelines. 42 Association of American Railroads, “Moving crude oil by rail,” (September 2014), p. 4. 43 Brent and WTI prices are from the Federal Reserve Bank of St. Louis FRED Economic data internet site accessed November 9, 2014 (http://research.stlouisfed.org/fred2/).; Cushing, OK crude oil inventory data are from the Energy Information Administration Internet site accessed November 9, 2014 (http://www.eia.gov/dnav/pet/hist/LeafHandler.ashx?n=PET&s=W_EPC0_SAX_YCUOK_MBBL&f=W). 44 “About Seaway,” accessed on October 18,2014 (http://www.seawaypipeline.com/) 45 TransCanada, “About Gulf Coast Pipeline Project,” accessed November 9, 2014 (http://www.gulf-coast-pipeline.com/about/the-projects/)
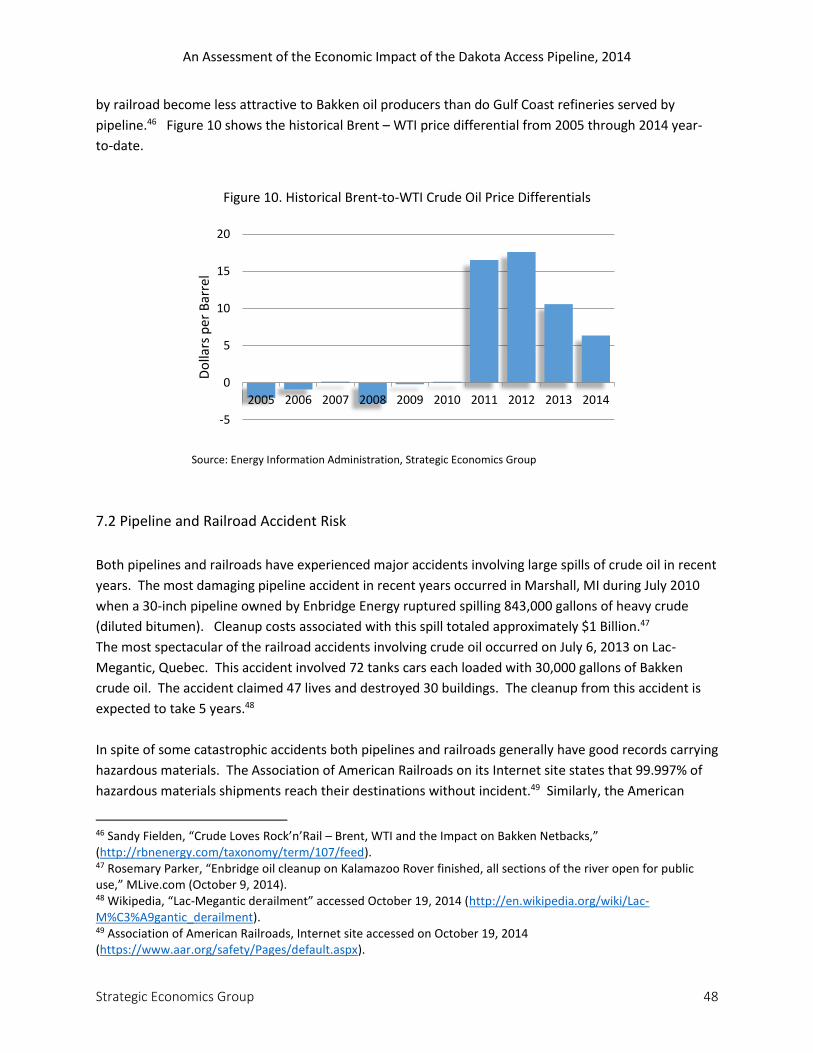
An Assessment of the Economic Impact of the Dakota Access Pipeline, 2014
Strategic Economics Group 48
by railroad become less attractive to Bakken oil producers than do Gulf Coast refineries served by
pipeline.46 Figure 10 shows the historical Brent – WTI price differential from 2005 through 2014 year-
to-date.
Figure 10. Historical Brent-to-WTI Crude Oil Price Differentials
Source: Energy Information Administration, Strategic Economics Group
7.2 Pipeline and Railroad Accident Risk
Both pipelines and railroads have experienced major accidents involving large spills of crude oil in recent
years. The most damaging pipeline accident in recent years occurred in Marshall, MI during July 2010
when a 30-inch pipeline owned by Enbridge Energy ruptured spilling 843,000 gallons of heavy crude
(diluted bitumen). Cleanup costs associated with this spill totaled approximately $1 Billion.47
The most spectacular of the railroad accidents involving crude oil occurred on July 6, 2013 on Lac-
Megantic, Quebec. This accident involved 72 tanks cars each loaded with 30,000 gallons of Bakken
crude oil. The accident claimed 47 lives and destroyed 30 buildings. The cleanup from this accident is
expected to take 5 years.48
In spite of some catastrophic accidents both pipelines and railroads generally have good records carrying
hazardous materials. The Association of American Railroads on its Internet site states that 99.997% of
hazardous materials shipments reach their destinations without incident.49 Similarly, the American
46 Sandy Fielden, “Crude Loves Rock’n’Rail – Brent, WTI and the Impact on Bakken Netbacks,” (http://rbnenergy.com/taxonomy/term/107/feed). 47 Rosemary Parker, “Enbridge oil cleanup on Kalamazoo Rover finished, all sections of the river open for public use,” MLive.com (October 9, 2014). 48 Wikipedia, “Lac-Megantic derailment” accessed October 19, 2014 (http://en.wikipedia.org/wiki/Lac-M%C3%A9gantic_derailment). 49 Association of American Railroads, Internet site accessed on October 19, 2014 (https://www.aar.org/safety/Pages/default.aspx).
-5
0
5
10
15
20
2005 2006 2007 2008 2009 2010 2011 2012 2013 2014
Do
llars
per
Bar
rel
An Assessment of the Economic Impact of the Dakota Access Pipeline, 2014
Strategic Economics Group 49
Pipeline Institute states that during 2013 99.999% of the 14 billion barrels of crude oil and petroleum
products transported reached their destinations safely.50 Accident rates involving crude oil have
increased as domestic oil production has increased in recent years. But relative to the amount of
product being moved, safety has improved.
Comparing the two modes of transportation, pipelines appear to be the safer mode. For example,
statistics revealed by the U.S. Pipeline and Hazardous Materials Safety Administration shows that during
2013 the number of gallons of oil spilled by railroads exceeded the 800,000 gallons spilled during all the
years from 1975 to 2010 in the railroad industry.51 Federal regulators have proposed new standards for
railroad tank cars to make them less likely to rupture in an accident. These regulations would raise
railroad rates for crude oil movements from 2.2% to 3.6%.52
For pipelines the U.S. Pipeline and Hazardous Materials Safety Administration reports that during 2013
there were 401 reported incidents that involved 119,290 barrels of hazardous liquids and caused
property damage totaling $266.7 million and resulted in one fatality and 5 injuries. Based on Federal
Energy Regulatory Commission annual statistical reports hazardous liquid pipelines carried 8.1 Billion
barrels of crude oil and 6.5 Billion barrels of petroleum products during 2013 and collected $15.7 billion
in operating revenues on these shipments. Over the past five years (2009 to 2013) the number of
pipeline incidents involving hazardous liquids equaled 361 resulting in spills averaging 81,971 barrels
and damages of $348.3 Million. So, pipeline accidents involved a very small amount of the product
moved.
Comparing accidents for pipelines and railroads finds that accident rates for both are low. With a few
notable exceptions the average spill amounts for each incident are small. However, when catastrophic
failures occur for pipelines the size of the spill can be large. However, monitoring equipment installed
on newer pipelines makes the detection of leaks sooner than for older facilities. On the other hand,
because railroads pass through cities and catastrophic accidents generally happen due to derailments
while trains are in motion, property damage as well as fatality and injury counts are much greater than
those that occur for pipeline accidents.
7.3 Other Economic Impacts
Beyond the localized impacts in areas where the extraction of oil has dramatically increased, the growth
in domestic oil production is having significant impacts on the nation’s overall economy. Since 2005
average monthly crude oil imports have dropped by 85.4 million barrels (27.7%). During 2005 crude oil
imports averaged 308.0 Million barrel per month. Through the first seven months of 2014 the average
50 American Pipeline Institute, Internet site accessed October 19, 2014 (http://www.pipeline101.com/are-pipelines-safe/what-is-the-safety-record). 51 “US railroad oil spills in 2013 surpassed previous four decades combined,” RT.com (January 23,2014). 52 Tom Bokowy, “DOT impact on crude by rail,” Cost & Capital (July 2014), p. 4.
An Assessment of the Economic Impact of the Dakota Access Pipeline, 2014
Strategic Economics Group 50
was down to 222.6 Million barrels per month.53
As the volume of oil imports has declined so has the flow of dollars out of the United States to pay for
oil. Comparing the first eight months of 2011 and 2014 the cost of imported oil has dropped from
$220.7 Billion to $171.7 Billion, which equals a decrease of $49.0 Billion (22.2%). This decrease has
positive spillover impacts on the value of the dollar, domestic purchases of other goods and services,
and on the rate of inflation.54
Increased pipeline capacity in the Bakken area of North Dakota will provide support for these positive
trends associated with the growth of domestic oil production. For example, over the past year the
average price of a gallon of regular gasoline has dropped from $3.31 to $3.07, and the price is likely to
drop further. This current year-over-year drop in price means households are saving about $33 billion
per year on motor fuel purchases. Similarly, businesses are benefiting from a 29-cent per gallon drop in
the price of diesel fuel, which translates to about an $11.2 billion savings nationwide.
As additional pipeline capacity comes online in North Dakota increased market options and lower
transportation costs will mean about another 10-cents per gallon decrease in motor fuel and diesel
prices. At current levels of motor fuel sales (135.6 Billion gallons/year) and diesel fuel sales (38.5 Billion
gallons/year) the additional savings will equal about $17.4 Billion nationally per year. Drivers in all
states will benefit. These potential annual savings to the four states through which the Dakota Access
Pipeline will pass equal $84.6 Million for North Dakota, $67.1 Million for South Dakota, $230.8 Million
for Iowa, and $613.2 Million for Illinois.
53 Energy Information Administration 54 U.S. Census Bureau
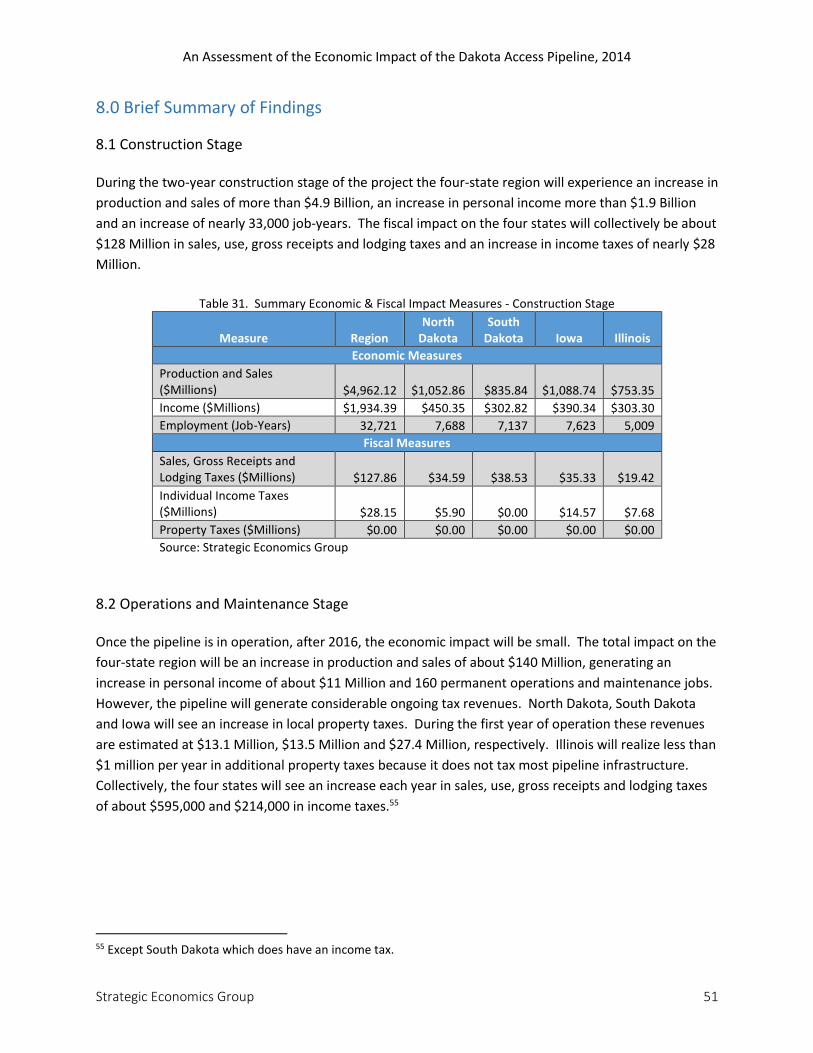
An Assessment of the Economic Impact of the Dakota Access Pipeline, 2014
Strategic Economics Group 51
8.0 Brief Summary of Findings
8.1 Construction Stage During the two-year construction stage of the project the four-state region will experience an increase in
production and sales of more than $4.9 Billion, an increase in personal income more than $1.9 Billion
and an increase of nearly 33,000 job-years. The fiscal impact on the four states will collectively be about
$128 Million in sales, use, gross receipts and lodging taxes and an increase in income taxes of nearly $28
Million.
Table 31. Summary Economic & Fiscal Impact Measures - Construction Stage
Measure Region North
Dakota South
Dakota Iowa Illinois
Economic Measures
Production and Sales ($Millions) $4,962.12 $1,052.86 $835.84 $1,088.74 $753.35
Income ($Millions) $1,934.39 $450.35 $302.82 $390.34 $303.30
Employment (Job-Years) 32,721 7,688 7,137 7,623 5,009
Fiscal Measures
Sales, Gross Receipts and Lodging Taxes ($Millions) $127.86 $34.59 $38.53 $35.33 $19.42
Individual Income Taxes ($Millions) $28.15 $5.90 $0.00 $14.57 $7.68
Property Taxes ($Millions) $0.00 $0.00 $0.00 $0.00 $0.00
Source: Strategic Economics Group
8.2 Operations and Maintenance Stage Once the pipeline is in operation, after 2016, the economic impact will be small. The total impact on the
four-state region will be an increase in production and sales of about $140 Million, generating an
increase in personal income of about $11 Million and 160 permanent operations and maintenance jobs.
However, the pipeline will generate considerable ongoing tax revenues. North Dakota, South Dakota
and Iowa will see an increase in local property taxes. During the first year of operation these revenues
are estimated at $13.1 Million, $13.5 Million and $27.4 Million, respectively. Illinois will realize less than
$1 million per year in additional property taxes because it does not tax most pipeline infrastructure.
Collectively, the four states will see an increase each year in sales, use, gross receipts and lodging taxes
of about $595,000 and $214,000 in income taxes.55
55 Except South Dakota which does have an income tax.
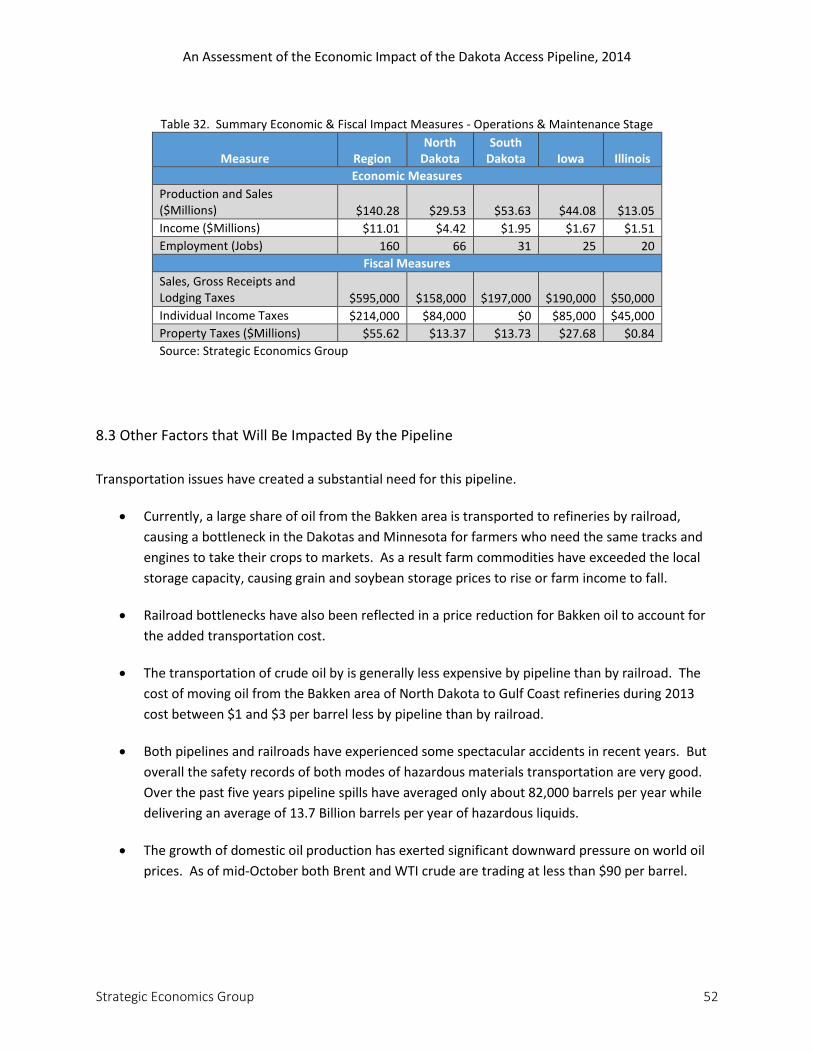
An Assessment of the Economic Impact of the Dakota Access Pipeline, 2014
Strategic Economics Group 52
Table 32. Summary Economic & Fiscal Impact Measures - Operations & Maintenance Stage
Measure Region North
Dakota South
Dakota Iowa Illinois
Economic Measures
Production and Sales ($Millions) $140.28 $29.53 $53.63 $44.08 $13.05
Income ($Millions) $11.01 $4.42 $1.95 $1.67 $1.51
Employment (Jobs) 160 66 31 25 20
Fiscal Measures
Sales, Gross Receipts and Lodging Taxes $595,000 $158,000 $197,000 $190,000 $50,000
Individual Income Taxes $214,000 $84,000 $0 $85,000 $45,000
Property Taxes ($Millions) $55.62 $13.37 $13.73 $27.68 $0.84
Source: Strategic Economics Group
8.3 Other Factors that Will Be Impacted By the Pipeline
Transportation issues have created a substantial need for this pipeline.
Currently, a large share of oil from the Bakken area is transported to refineries by railroad,
causing a bottleneck in the Dakotas and Minnesota for farmers who need the same tracks and
engines to take their crops to markets. As a result farm commodities have exceeded the local
storage capacity, causing grain and soybean storage prices to rise or farm income to fall.
Railroad bottlenecks have also been reflected in a price reduction for Bakken oil to account for
the added transportation cost.
The transportation of crude oil by is generally less expensive by pipeline than by railroad. The
cost of moving oil from the Bakken area of North Dakota to Gulf Coast refineries during 2013
cost between $1 and $3 per barrel less by pipeline than by railroad.
Both pipelines and railroads have experienced some spectacular accidents in recent years. But
overall the safety records of both modes of hazardous materials transportation are very good.
Over the past five years pipeline spills have averaged only about 82,000 barrels per year while
delivering an average of 13.7 Billion barrels per year of hazardous liquids.
The growth of domestic oil production has exerted significant downward pressure on world oil
prices. As of mid-October both Brent and WTI crude are trading at less than $90 per barrel.
An Assessment of the Economic Impact of the Dakota Access Pipeline, 2014
Strategic Economics Group 53
Since 2005 U.S. oil imports of oil have dropped by 27.7% and since 2011 U.S. expenditures on oil
imports have dropped by 22.2%. These decreases are benefiting the country through reduced
foreign trade deficits, a stronger dollar, and lower inflation.
As additional pipeline capacity comes online in North Dakota increased market options and
lower transportation costs will mean additional decreases in motor fuel and diesel prices.
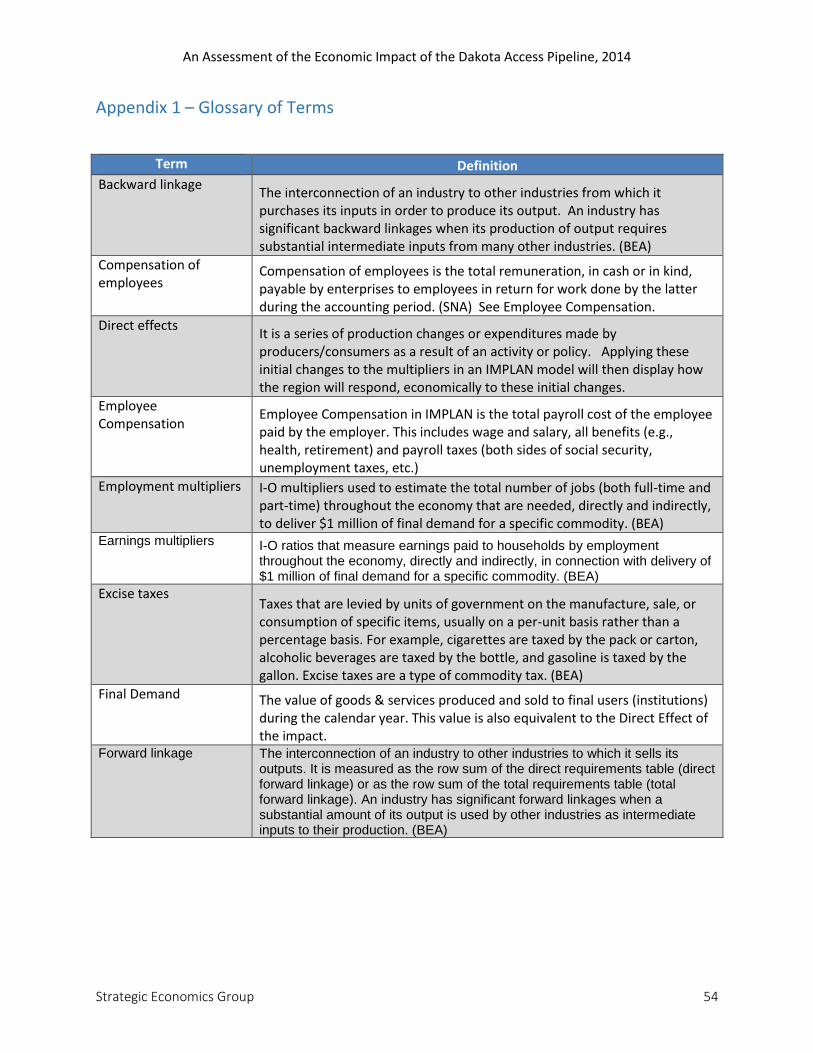
An Assessment of the Economic Impact of the Dakota Access Pipeline, 2014
Strategic Economics Group 54
Appendix 1 – Glossary of Terms
Term Definition
Backward linkage The interconnection of an industry to other industries from which it purchases its inputs in order to produce its output. An industry has significant backward linkages when its production of output requires substantial intermediate inputs from many other industries. (BEA)
Compensation of employees
Compensation of employees is the total remuneration, in cash or in kind, payable by enterprises to employees in return for work done by the latter during the accounting period. (SNA) See Employee Compensation.
Direct effects It is a series of production changes or expenditures made by producers/consumers as a result of an activity or policy. Applying these initial changes to the multipliers in an IMPLAN model will then display how the region will respond, economically to these initial changes.
Employee Compensation
Employee Compensation in IMPLAN is the total payroll cost of the employee paid by the employer. This includes wage and salary, all benefits (e.g., health, retirement) and payroll taxes (both sides of social security, unemployment taxes, etc.)
Employment multipliers I-O multipliers used to estimate the total number of jobs (both full-time and part-time) throughout the economy that are needed, directly and indirectly, to deliver $1 million of final demand for a specific commodity. (BEA)
Earnings multipliers I-O ratios that measure earnings paid to households by employment throughout the economy, directly and indirectly, in connection with delivery of $1 million of final demand for a specific commodity. (BEA)
Excise taxes Taxes that are levied by units of government on the manufacture, sale, or consumption of specific items, usually on a per-unit basis rather than a percentage basis. For example, cigarettes are taxed by the pack or carton, alcoholic beverages are taxed by the bottle, and gasoline is taxed by the gallon. Excise taxes are a type of commodity tax. (BEA)
Final Demand The value of goods & services produced and sold to final users (institutions) during the calendar year. This value is also equivalent to the Direct Effect of the impact.
Forward linkage The interconnection of an industry to other industries to which it sells its outputs. It is measured as the row sum of the direct requirements table (direct forward linkage) or as the row sum of the total requirements table (total forward linkage). An industry has significant forward linkages when a substantial amount of its output is used by other industries as intermediate inputs to their production. (BEA)
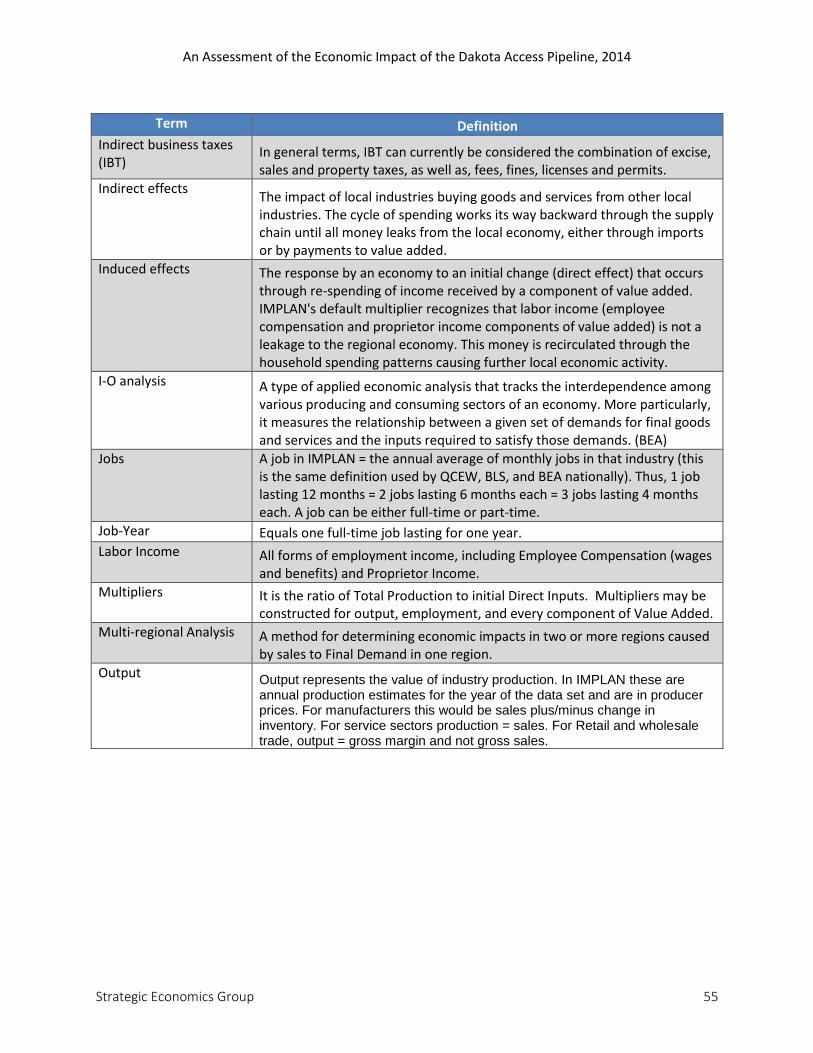
An Assessment of the Economic Impact of the Dakota Access Pipeline, 2014
Strategic Economics Group 55
Term Definition
Indirect business taxes (IBT)
In general terms, IBT can currently be considered the combination of excise, sales and property taxes, as well as, fees, fines, licenses and permits.
Indirect effects The impact of local industries buying goods and services from other local industries. The cycle of spending works its way backward through the supply chain until all money leaks from the local economy, either through imports or by payments to value added.
Induced effects The response by an economy to an initial change (direct effect) that occurs through re-spending of income received by a component of value added. IMPLAN's default multiplier recognizes that labor income (employee compensation and proprietor income components of value added) is not a leakage to the regional economy. This money is recirculated through the household spending patterns causing further local economic activity.
I-O analysis A type of applied economic analysis that tracks the interdependence among various producing and consuming sectors of an economy. More particularly, it measures the relationship between a given set of demands for final goods and services and the inputs required to satisfy those demands. (BEA)
Jobs A job in IMPLAN = the annual average of monthly jobs in that industry (this is the same definition used by QCEW, BLS, and BEA nationally). Thus, 1 job lasting 12 months = 2 jobs lasting 6 months each = 3 jobs lasting 4 months each. A job can be either full-time or part-time.
Job-Year Equals one full-time job lasting for one year.
Labor Income All forms of employment income, including Employee Compensation (wages and benefits) and Proprietor Income.
Multipliers It is the ratio of Total Production to initial Direct Inputs. Multipliers may be constructed for output, employment, and every component of Value Added.
Multi-regional Analysis A method for determining economic impacts in two or more regions caused by sales to Final Demand in one region.
Output Output represents the value of industry production. In IMPLAN these are annual production estimates for the year of the data set and are in producer prices. For manufacturers this would be sales plus/minus change in inventory. For service sectors production = sales. For Retail and wholesale trade, output = gross margin and not gross sales.
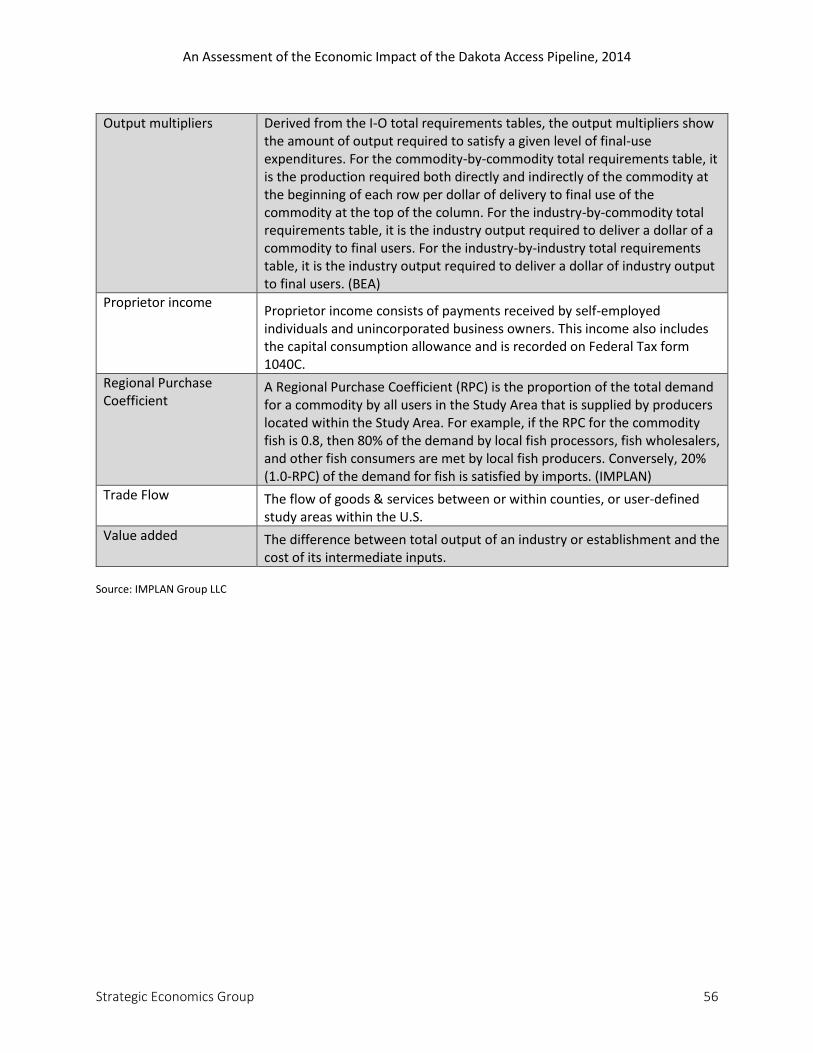
An Assessment of the Economic Impact of the Dakota Access Pipeline, 2014
Strategic Economics Group 56
Output multipliers Derived from the I-O total requirements tables, the output multipliers show the amount of output required to satisfy a given level of final-use expenditures. For the commodity-by-commodity total requirements table, it is the production required both directly and indirectly of the commodity at the beginning of each row per dollar of delivery to final use of the commodity at the top of the column. For the industry-by-commodity total requirements table, it is the industry output required to deliver a dollar of a commodity to final users. For the industry-by-industry total requirements table, it is the industry output required to deliver a dollar of industry output to final users. (BEA)
Proprietor income Proprietor income consists of payments received by self-employed individuals and unincorporated business owners. This income also includes the capital consumption allowance and is recorded on Federal Tax form 1040C.
Regional Purchase Coefficient
A Regional Purchase Coefficient (RPC) is the proportion of the total demand for a commodity by all users in the Study Area that is supplied by producers located within the Study Area. For example, if the RPC for the commodity fish is 0.8, then 80% of the demand by local fish processors, fish wholesalers, and other fish consumers are met by local fish producers. Conversely, 20% (1.0-RPC) of the demand for fish is satisfied by imports. (IMPLAN)
Trade Flow The flow of goods & services between or within counties, or user-defined study areas within the U.S.
Value added The difference between total output of an industry or establishment and the cost of its intermediate inputs.
Source: IMPLAN Group LLC
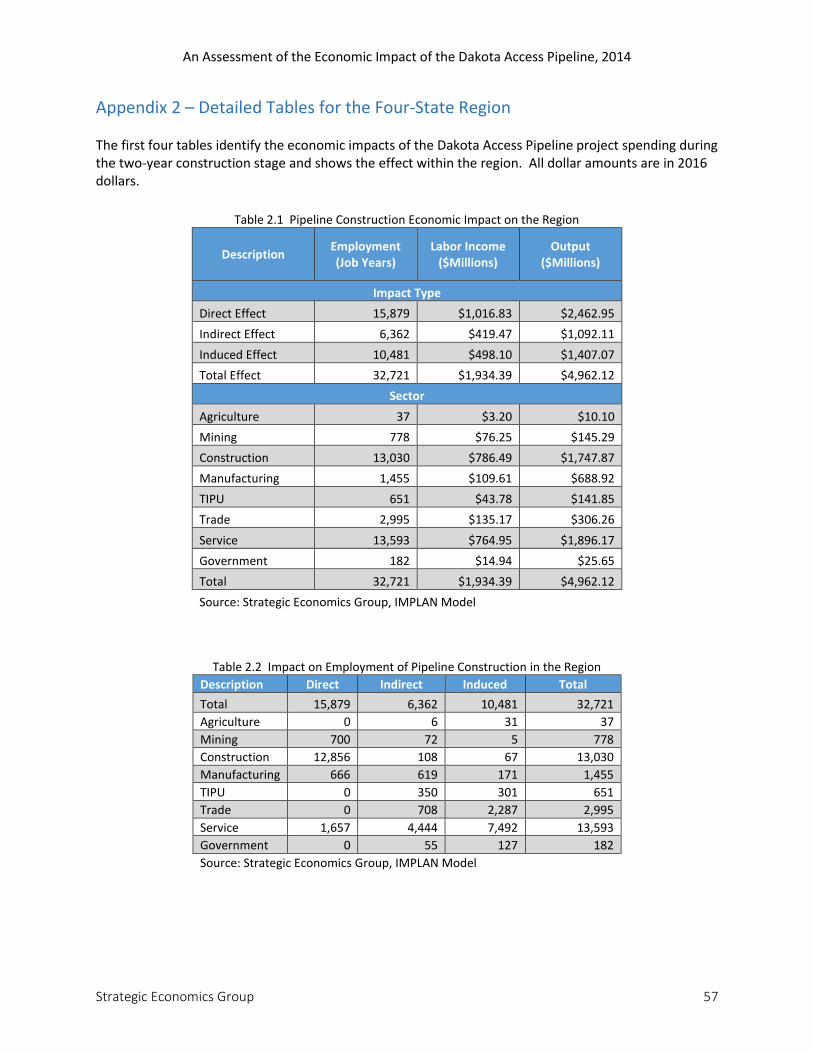
An Assessment of the Economic Impact of the Dakota Access Pipeline, 2014
Strategic Economics Group 57
Appendix 2 – Detailed Tables for the Four-State Region The first four tables identify the economic impacts of the Dakota Access Pipeline project spending during the two-year construction stage and shows the effect within the region. All dollar amounts are in 2016 dollars.
Table 2.1 Pipeline Construction Economic Impact on the Region
Description Employment (Job Years)
Labor Income ($Millions)
Output ($Millions)
Impact Type
Direct Effect 15,879 $1,016.83 $2,462.95
Indirect Effect 6,362 $419.47 $1,092.11
Induced Effect 10,481 $498.10 $1,407.07
Total Effect 32,721 $1,934.39 $4,962.12
Sector
Agriculture 37 $3.20 $10.10
Mining 778 $76.25 $145.29
Construction 13,030 $786.49 $1,747.87
Manufacturing 1,455 $109.61 $688.92
TIPU 651 $43.78 $141.85
Trade 2,995 $135.17 $306.26
Service 13,593 $764.95 $1,896.17
Government 182 $14.94 $25.65
Total 32,721 $1,934.39 $4,962.12
Source: Strategic Economics Group, IMPLAN Model
Table 2.2 Impact on Employment of Pipeline Construction in the Region
Description Direct Indirect Induced Total
Total 15,879 6,362 10,481 32,721
Agriculture 0 6 31 37
Mining 700 72 5 778
Construction 12,856 108 67 13,030
Manufacturing 666 619 171 1,455
TIPU 0 350 301 651
Trade 0 708 2,287 2,995
Service 1,657 4,444 7,492 13,593
Government 0 55 127 182
Source: Strategic Economics Group, IMPLAN Model
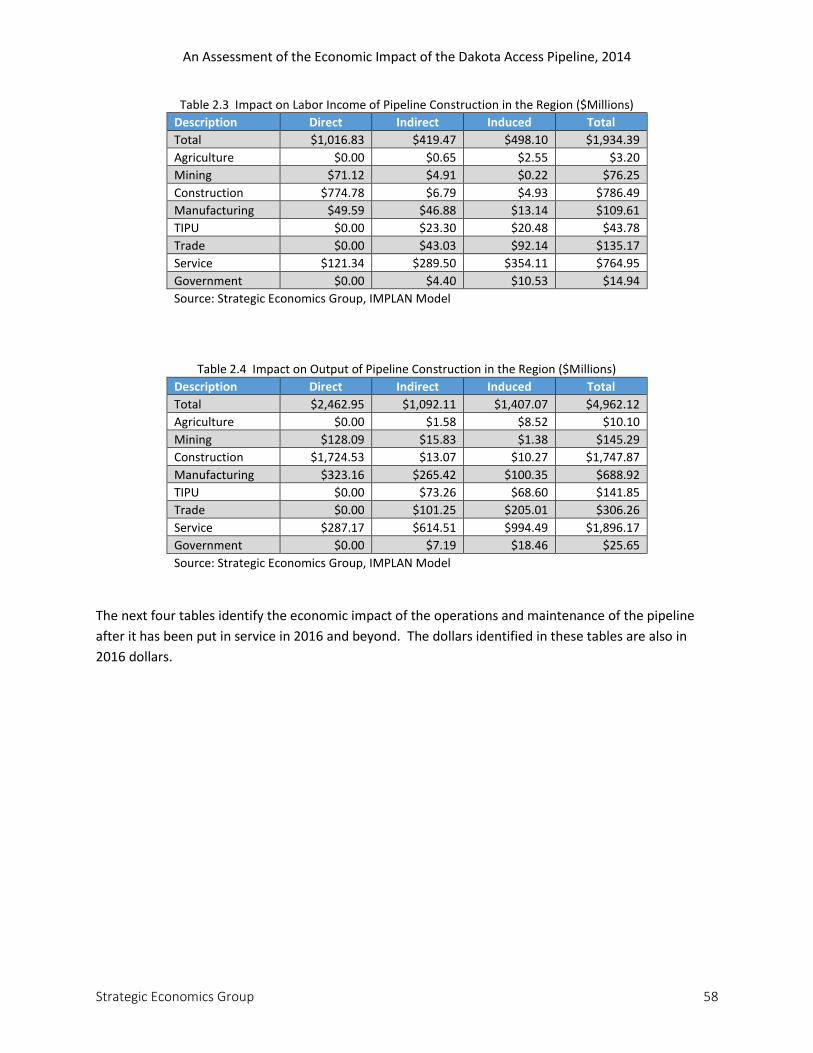
An Assessment of the Economic Impact of the Dakota Access Pipeline, 2014
Strategic Economics Group 58
Table 2.3 Impact on Labor Income of Pipeline Construction in the Region ($Millions)
Description Direct Indirect Induced Total
Total $1,016.83 $419.47 $498.10 $1,934.39
Agriculture $0.00 $0.65 $2.55 $3.20
Mining $71.12 $4.91 $0.22 $76.25
Construction $774.78 $6.79 $4.93 $786.49
Manufacturing $49.59 $46.88 $13.14 $109.61
TIPU $0.00 $23.30 $20.48 $43.78
Trade $0.00 $43.03 $92.14 $135.17
Service $121.34 $289.50 $354.11 $764.95
Government $0.00 $4.40 $10.53 $14.94
Source: Strategic Economics Group, IMPLAN Model
Table 2.4 Impact on Output of Pipeline Construction in the Region ($Millions)
Description Direct Indirect Induced Total
Total $2,462.95 $1,092.11 $1,407.07 $4,962.12
Agriculture $0.00 $1.58 $8.52 $10.10
Mining $128.09 $15.83 $1.38 $145.29
Construction $1,724.53 $13.07 $10.27 $1,747.87
Manufacturing $323.16 $265.42 $100.35 $688.92
TIPU $0.00 $73.26 $68.60 $141.85
Trade $0.00 $101.25 $205.01 $306.26
Service $287.17 $614.51 $994.49 $1,896.17
Government $0.00 $7.19 $18.46 $25.65
Source: Strategic Economics Group, IMPLAN Model
The next four tables identify the economic impact of the operations and maintenance of the pipeline
after it has been put in service in 2016 and beyond. The dollars identified in these tables are also in
2016 dollars.
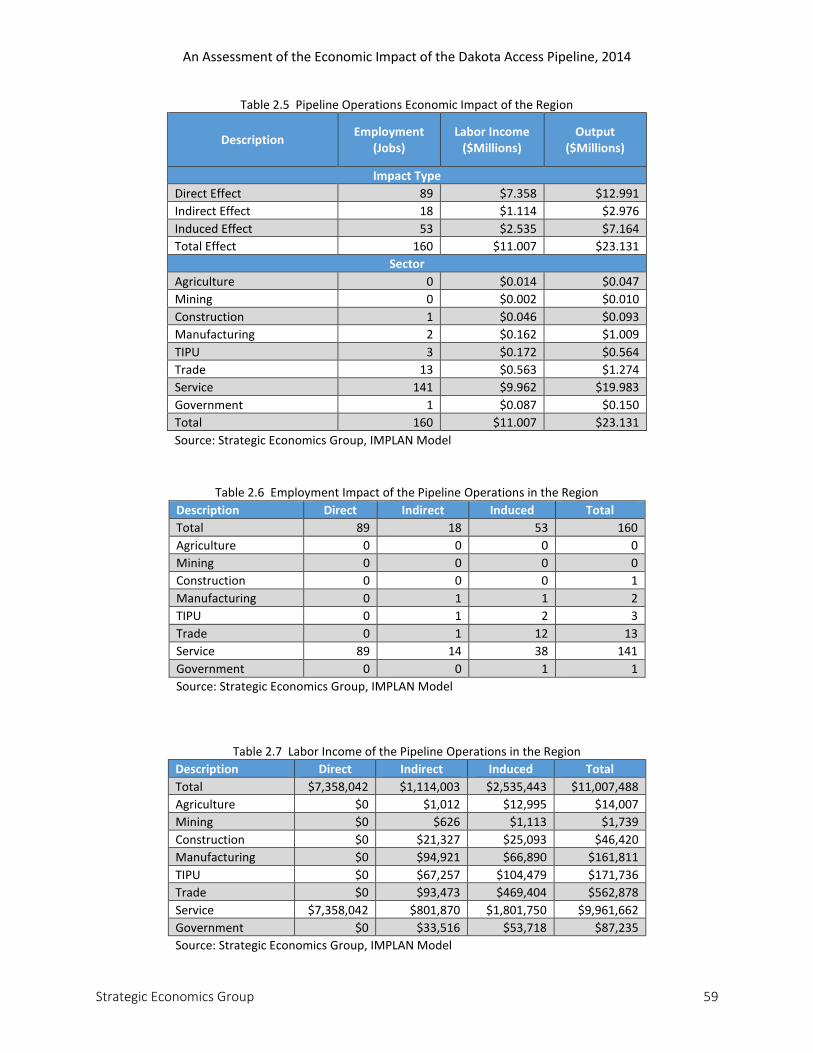
An Assessment of the Economic Impact of the Dakota Access Pipeline, 2014
Strategic Economics Group 59
Table 2.5 Pipeline Operations Economic Impact of the Region
Description Employment
(Jobs) Labor Income
($Millions) Output
($Millions)
Impact Type
Direct Effect 89 $7.358 $12.991
Indirect Effect 18 $1.114 $2.976
Induced Effect 53 $2.535 $7.164
Total Effect 160 $11.007 $23.131
Sector
Agriculture 0 $0.014 $0.047
Mining 0 $0.002 $0.010
Construction 1 $0.046 $0.093
Manufacturing 2 $0.162 $1.009
TIPU 3 $0.172 $0.564
Trade 13 $0.563 $1.274
Service 141 $9.962 $19.983
Government 1 $0.087 $0.150
Total 160 $11.007 $23.131
Source: Strategic Economics Group, IMPLAN Model
Table 2.6 Employment Impact of the Pipeline Operations in the Region
Description Direct Indirect Induced Total
Total 89 18 53 160
Agriculture 0 0 0 0
Mining 0 0 0 0
Construction 0 0 0 1
Manufacturing 0 1 1 2
TIPU 0 1 2 3
Trade 0 1 12 13
Service 89 14 38 141
Government 0 0 1 1
Source: Strategic Economics Group, IMPLAN Model
Table 2.7 Labor Income of the Pipeline Operations in the Region
Description Direct Indirect Induced Total
Total $7,358,042 $1,114,003 $2,535,443 $11,007,488
Agriculture $0 $1,012 $12,995 $14,007
Mining $0 $626 $1,113 $1,739
Construction $0 $21,327 $25,093 $46,420
Manufacturing $0 $94,921 $66,890 $161,811
TIPU $0 $67,257 $104,479 $171,736
Trade $0 $93,473 $469,404 $562,878
Service $7,358,042 $801,870 $1,801,750 $9,961,662
Government $0 $33,516 $53,718 $87,235
Source: Strategic Economics Group, IMPLAN Model
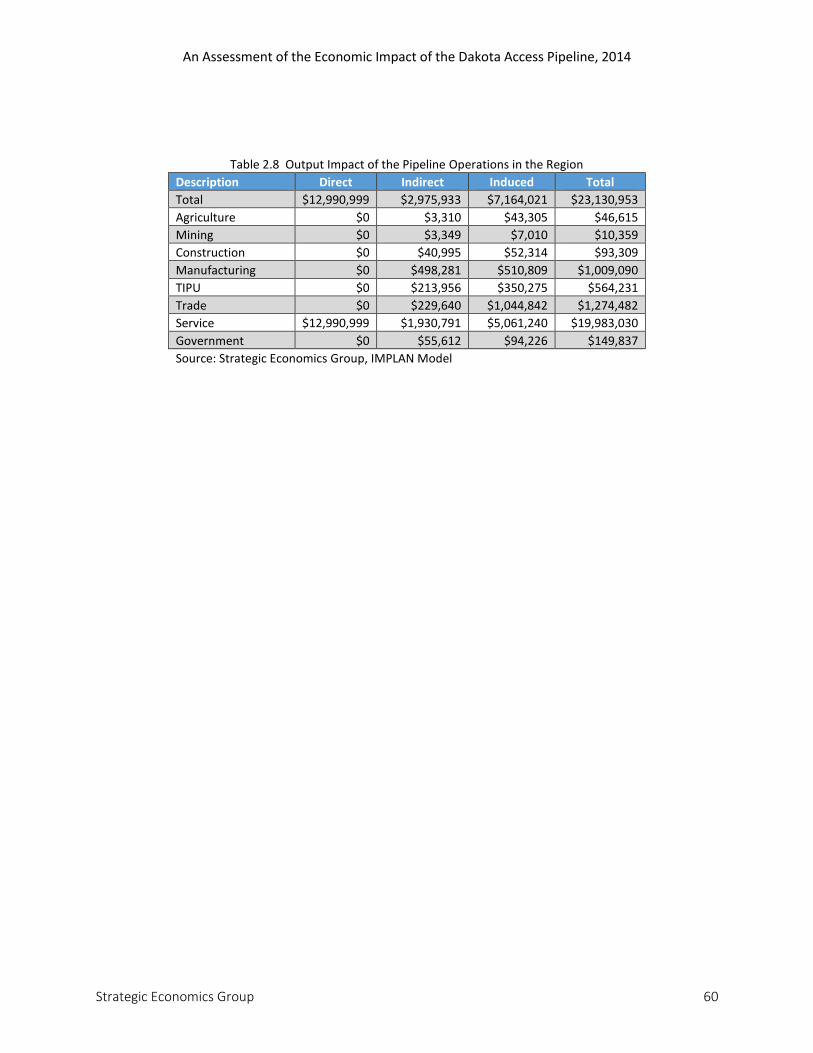
An Assessment of the Economic Impact of the Dakota Access Pipeline, 2014
Strategic Economics Group 60
Table 2.8 Output Impact of the Pipeline Operations in the Region
Description Direct Indirect Induced Total
Total $12,990,999 $2,975,933 $7,164,021 $23,130,953
Agriculture $0 $3,310 $43,305 $46,615
Mining $0 $3,349 $7,010 $10,359
Construction $0 $40,995 $52,314 $93,309
Manufacturing $0 $498,281 $510,809 $1,009,090
TIPU $0 $213,956 $350,275 $564,231
Trade $0 $229,640 $1,044,842 $1,274,482
Service $12,990,999 $1,930,791 $5,061,240 $19,983,030
Government $0 $55,612 $94,226 $149,837
Source: Strategic Economics Group, IMPLAN Model
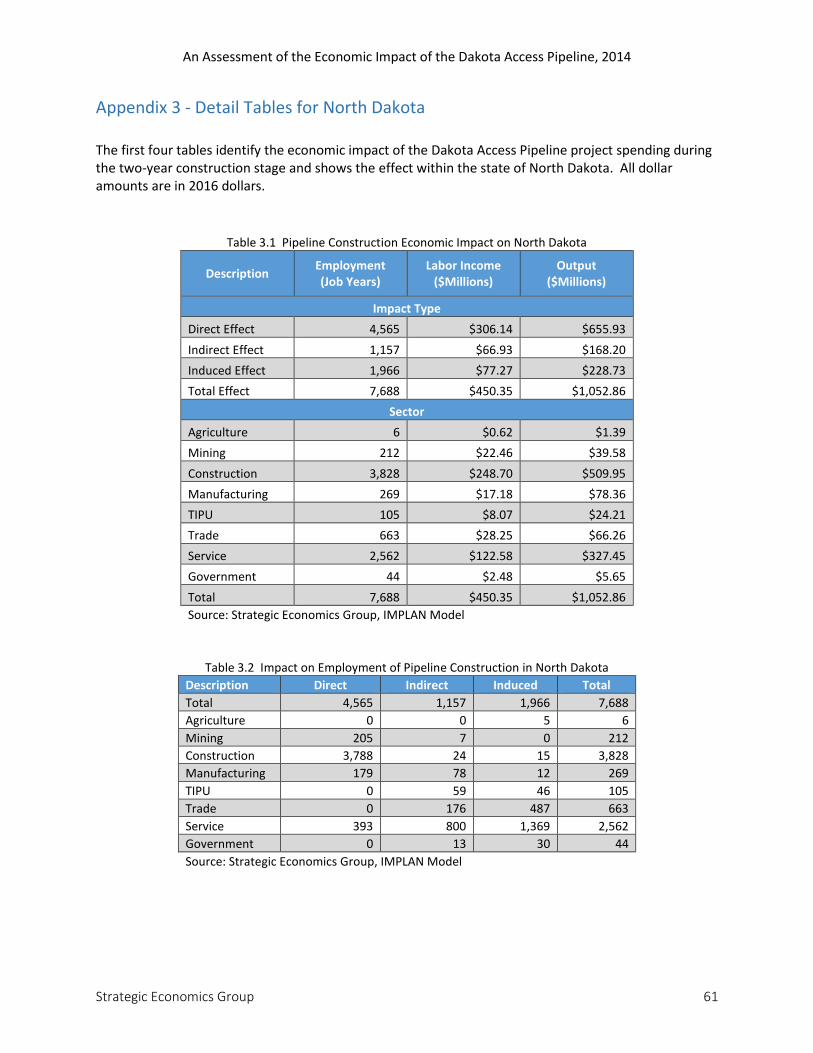
An Assessment of the Economic Impact of the Dakota Access Pipeline, 2014
Strategic Economics Group 61
Appendix 3 - Detail Tables for North Dakota The first four tables identify the economic impact of the Dakota Access Pipeline project spending during the two-year construction stage and shows the effect within the state of North Dakota. All dollar amounts are in 2016 dollars.
Table 3.1 Pipeline Construction Economic Impact on North Dakota
Description Employment (Job Years)
Labor Income ($Millions)
Output ($Millions)
Impact Type
Direct Effect 4,565 $306.14 $655.93
Indirect Effect 1,157 $66.93 $168.20
Induced Effect 1,966 $77.27 $228.73
Total Effect 7,688 $450.35 $1,052.86
Sector
Agriculture 6 $0.62 $1.39
Mining 212 $22.46 $39.58
Construction 3,828 $248.70 $509.95
Manufacturing 269 $17.18 $78.36
TIPU 105 $8.07 $24.21
Trade 663 $28.25 $66.26
Service 2,562 $122.58 $327.45
Government 44 $2.48 $5.65
Total 7,688 $450.35 $1,052.86
Source: Strategic Economics Group, IMPLAN Model
Table 3.2 Impact on Employment of Pipeline Construction in North Dakota
Description Direct Indirect Induced Total
Total 4,565 1,157 1,966 7,688
Agriculture 0 0 5 6
Mining 205 7 0 212
Construction 3,788 24 15 3,828
Manufacturing 179 78 12 269
TIPU 0 59 46 105
Trade 0 176 487 663
Service 393 800 1,369 2,562
Government 0 13 30 44
Source: Strategic Economics Group, IMPLAN Model
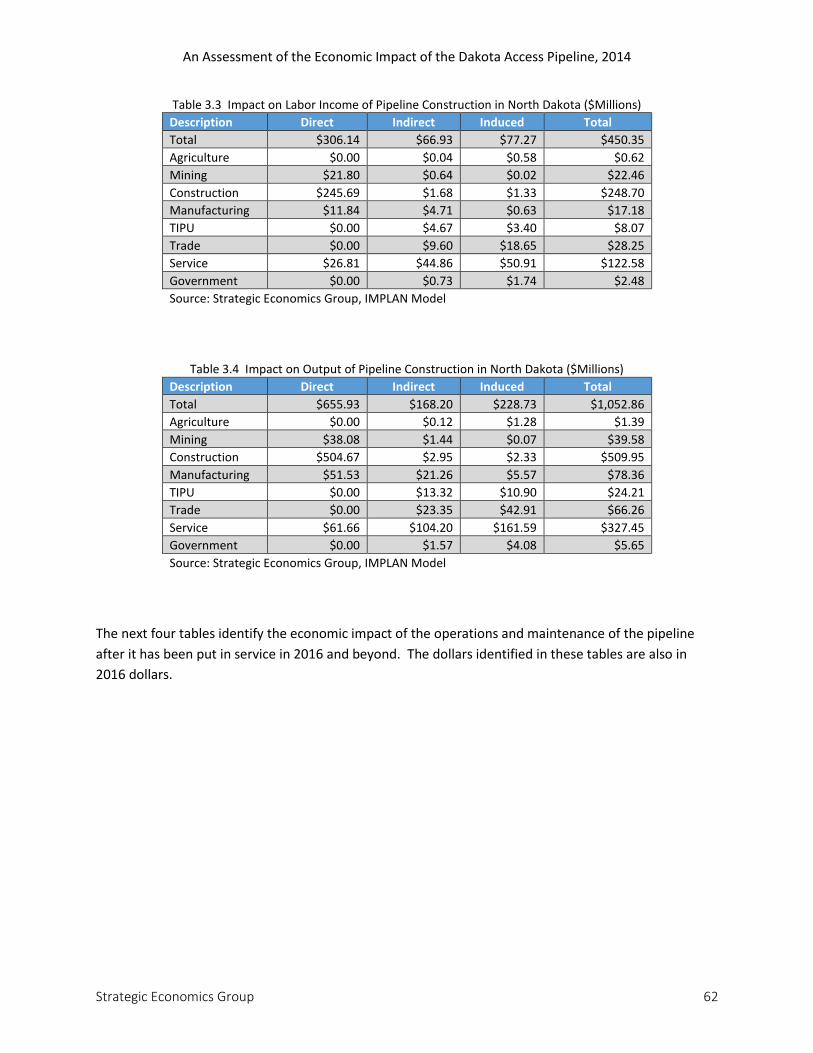
An Assessment of the Economic Impact of the Dakota Access Pipeline, 2014
Strategic Economics Group 62
Table 3.3 Impact on Labor Income of Pipeline Construction in North Dakota ($Millions)
Description Direct Indirect Induced Total
Total $306.14 $66.93 $77.27 $450.35
Agriculture $0.00 $0.04 $0.58 $0.62
Mining $21.80 $0.64 $0.02 $22.46
Construction $245.69 $1.68 $1.33 $248.70
Manufacturing $11.84 $4.71 $0.63 $17.18
TIPU $0.00 $4.67 $3.40 $8.07
Trade $0.00 $9.60 $18.65 $28.25
Service $26.81 $44.86 $50.91 $122.58
Government $0.00 $0.73 $1.74 $2.48
Source: Strategic Economics Group, IMPLAN Model
Table 3.4 Impact on Output of Pipeline Construction in North Dakota ($Millions)
Description Direct Indirect Induced Total
Total $655.93 $168.20 $228.73 $1,052.86
Agriculture $0.00 $0.12 $1.28 $1.39
Mining $38.08 $1.44 $0.07 $39.58
Construction $504.67 $2.95 $2.33 $509.95
Manufacturing $51.53 $21.26 $5.57 $78.36
TIPU $0.00 $13.32 $10.90 $24.21
Trade $0.00 $23.35 $42.91 $66.26
Service $61.66 $104.20 $161.59 $327.45
Government $0.00 $1.57 $4.08 $5.65
Source: Strategic Economics Group, IMPLAN Model
The next four tables identify the economic impact of the operations and maintenance of the pipeline
after it has been put in service in 2016 and beyond. The dollars identified in these tables are also in
2016 dollars.
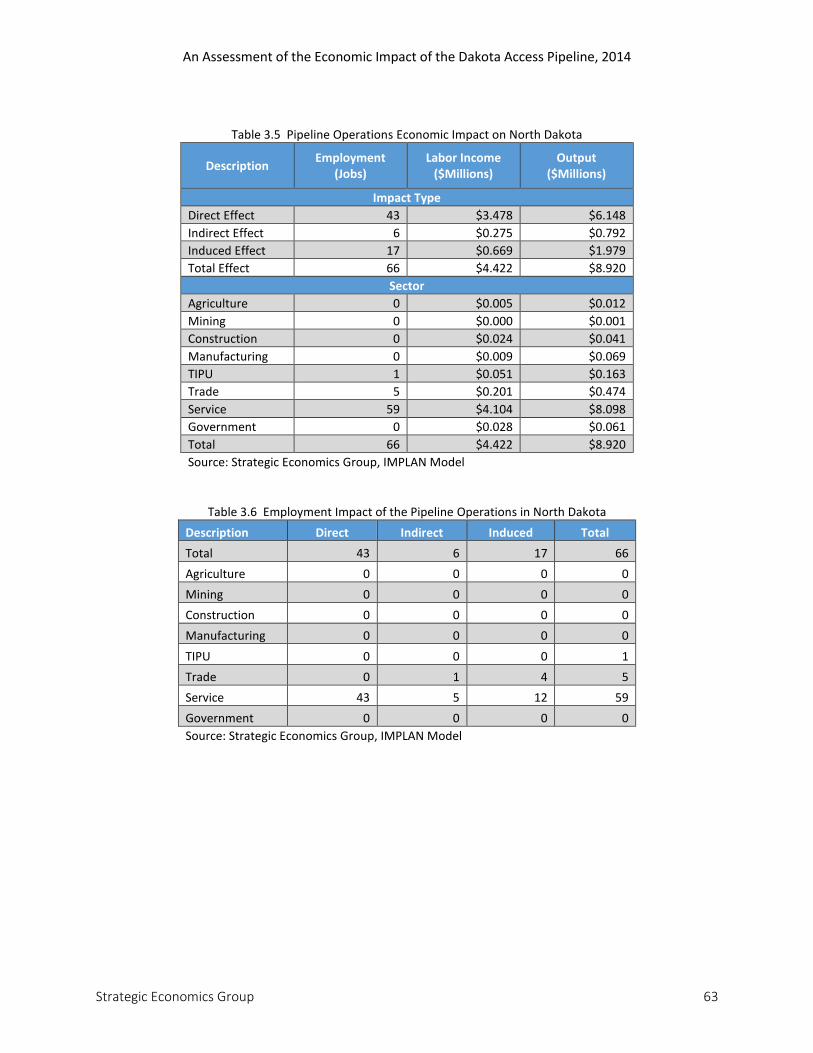
An Assessment of the Economic Impact of the Dakota Access Pipeline, 2014
Strategic Economics Group 63
Table 3.5 Pipeline Operations Economic Impact on North Dakota
Description Employment
(Jobs) Labor Income
($Millions) Output
($Millions)
Impact Type
Direct Effect 43 $3.478 $6.148
Indirect Effect 6 $0.275 $0.792
Induced Effect 17 $0.669 $1.979
Total Effect 66 $4.422 $8.920
Sector
Agriculture 0 $0.005 $0.012
Mining 0 $0.000 $0.001
Construction 0 $0.024 $0.041
Manufacturing 0 $0.009 $0.069
TIPU 1 $0.051 $0.163
Trade 5 $0.201 $0.474
Service 59 $4.104 $8.098
Government 0 $0.028 $0.061
Total 66 $4.422 $8.920
Source: Strategic Economics Group, IMPLAN Model
Table 3.6 Employment Impact of the Pipeline Operations in North Dakota
Description Direct Indirect Induced Total
Total 43 6 17 66
Agriculture 0 0 0 0
Mining 0 0 0 0
Construction 0 0 0 0
Manufacturing 0 0 0 0
TIPU 0 0 0 1
Trade 0 1 4 5
Service 43 5 12 59
Government 0 0 0 0
Source: Strategic Economics Group, IMPLAN Model
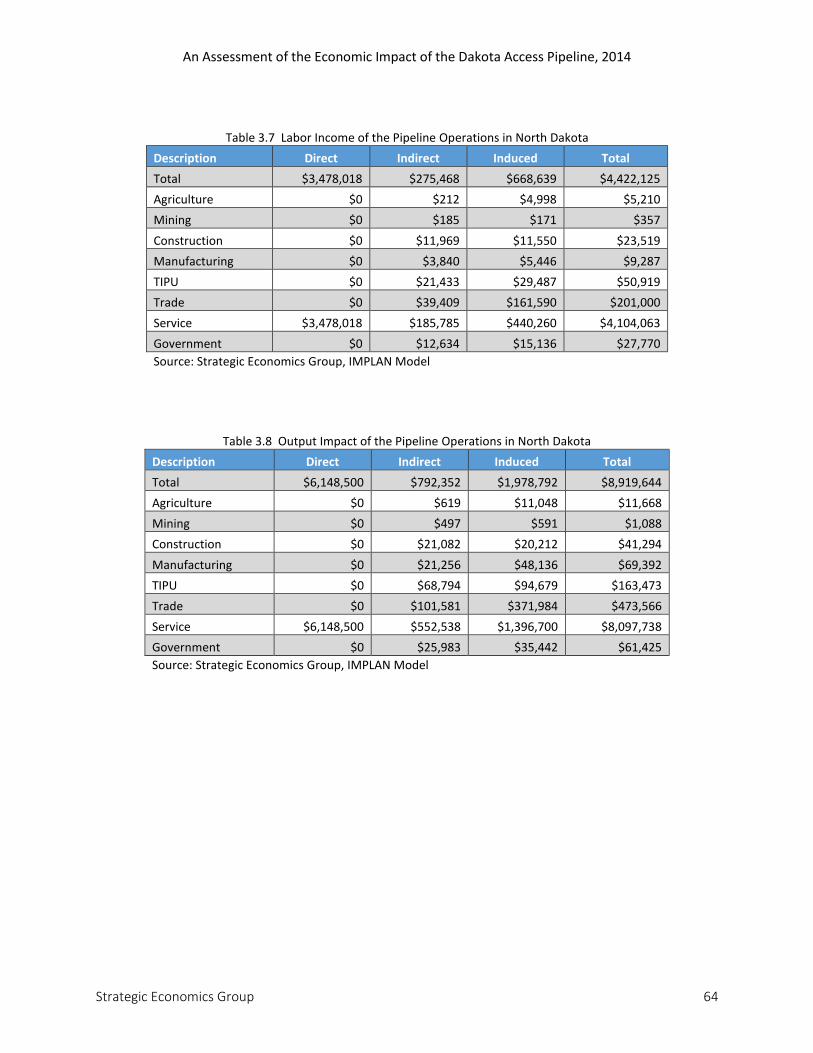
An Assessment of the Economic Impact of the Dakota Access Pipeline, 2014
Strategic Economics Group 64
Table 3.7 Labor Income of the Pipeline Operations in North Dakota
Description Direct Indirect Induced Total
Total $3,478,018 $275,468 $668,639 $4,422,125
Agriculture $0 $212 $4,998 $5,210
Mining $0 $185 $171 $357
Construction $0 $11,969 $11,550 $23,519
Manufacturing $0 $3,840 $5,446 $9,287
TIPU $0 $21,433 $29,487 $50,919
Trade $0 $39,409 $161,590 $201,000
Service $3,478,018 $185,785 $440,260 $4,104,063
Government $0 $12,634 $15,136 $27,770
Source: Strategic Economics Group, IMPLAN Model
Table 3.8 Output Impact of the Pipeline Operations in North Dakota
Description Direct Indirect Induced Total
Total $6,148,500 $792,352 $1,978,792 $8,919,644
Agriculture $0 $619 $11,048 $11,668
Mining $0 $497 $591 $1,088
Construction $0 $21,082 $20,212 $41,294
Manufacturing $0 $21,256 $48,136 $69,392
TIPU $0 $68,794 $94,679 $163,473
Trade $0 $101,581 $371,984 $473,566
Service $6,148,500 $552,538 $1,396,700 $8,097,738
Government $0 $25,983 $35,442 $61,425
Source: Strategic Economics Group, IMPLAN Model
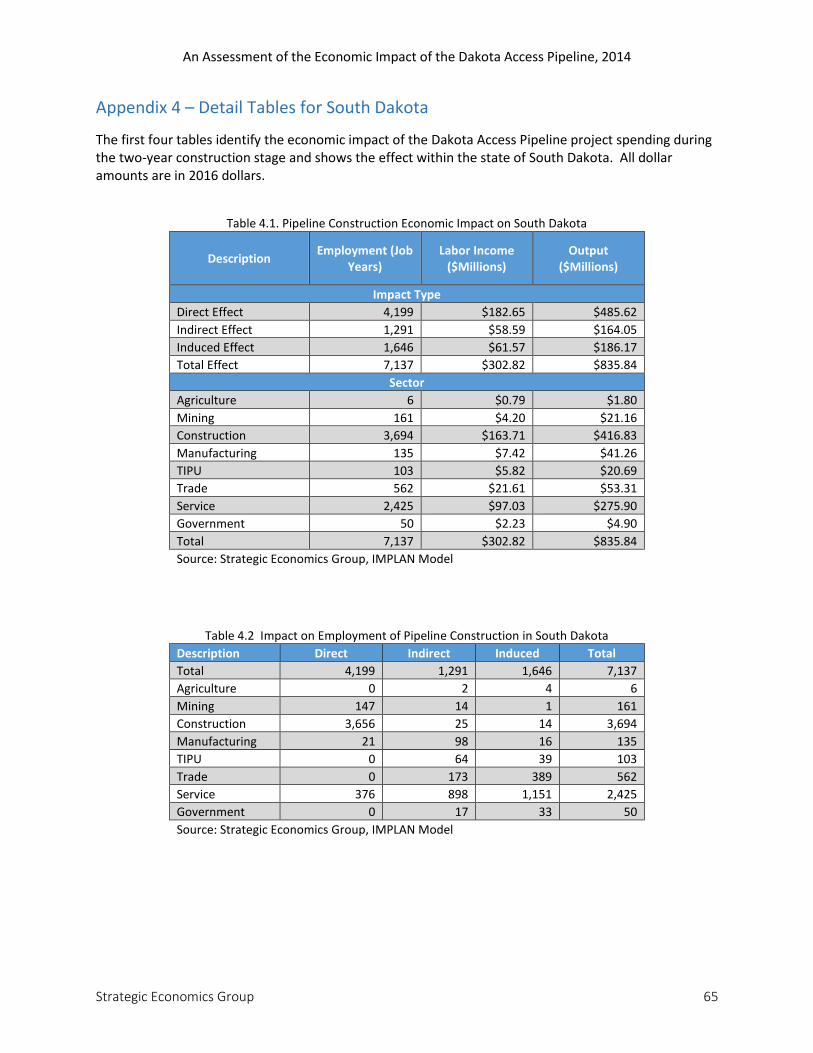
An Assessment of the Economic Impact of the Dakota Access Pipeline, 2014
Strategic Economics Group 65
Appendix 4 – Detail Tables for South Dakota
The first four tables identify the economic impact of the Dakota Access Pipeline project spending during the two-year construction stage and shows the effect within the state of South Dakota. All dollar amounts are in 2016 dollars.
Table 4.1. Pipeline Construction Economic Impact on South Dakota
Description Employment (Job
Years) Labor Income
($Millions) Output
($Millions)
Impact Type
Direct Effect 4,199 $182.65 $485.62
Indirect Effect 1,291 $58.59 $164.05
Induced Effect 1,646 $61.57 $186.17
Total Effect 7,137 $302.82 $835.84
Sector
Agriculture 6 $0.79 $1.80
Mining 161 $4.20 $21.16
Construction 3,694 $163.71 $416.83
Manufacturing 135 $7.42 $41.26
TIPU 103 $5.82 $20.69
Trade 562 $21.61 $53.31
Service 2,425 $97.03 $275.90
Government 50 $2.23 $4.90
Total 7,137 $302.82 $835.84
Source: Strategic Economics Group, IMPLAN Model
Table 4.2 Impact on Employment of Pipeline Construction in South Dakota
Description Direct Indirect Induced Total
Total 4,199 1,291 1,646 7,137
Agriculture 0 2 4 6
Mining 147 14 1 161
Construction 3,656 25 14 3,694
Manufacturing 21 98 16 135
TIPU 0 64 39 103
Trade 0 173 389 562
Service 376 898 1,151 2,425
Government 0 17 33 50
Source: Strategic Economics Group, IMPLAN Model
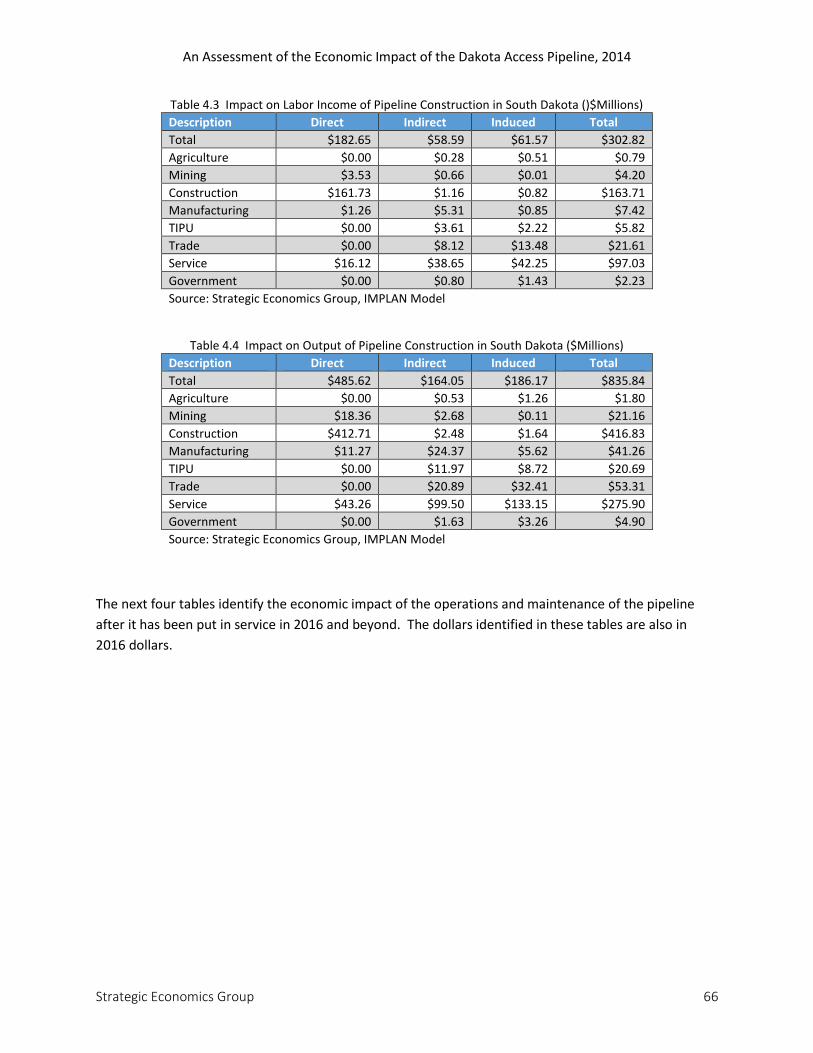
An Assessment of the Economic Impact of the Dakota Access Pipeline, 2014
Strategic Economics Group 66
Table 4.3 Impact on Labor Income of Pipeline Construction in South Dakota ()$Millions)
Description Direct Indirect Induced Total
Total $182.65 $58.59 $61.57 $302.82
Agriculture $0.00 $0.28 $0.51 $0.79
Mining $3.53 $0.66 $0.01 $4.20
Construction $161.73 $1.16 $0.82 $163.71
Manufacturing $1.26 $5.31 $0.85 $7.42
TIPU $0.00 $3.61 $2.22 $5.82
Trade $0.00 $8.12 $13.48 $21.61
Service $16.12 $38.65 $42.25 $97.03
Government $0.00 $0.80 $1.43 $2.23
Source: Strategic Economics Group, IMPLAN Model
Table 4.4 Impact on Output of Pipeline Construction in South Dakota ($Millions)
Description Direct Indirect Induced Total
Total $485.62 $164.05 $186.17 $835.84
Agriculture $0.00 $0.53 $1.26 $1.80
Mining $18.36 $2.68 $0.11 $21.16
Construction $412.71 $2.48 $1.64 $416.83
Manufacturing $11.27 $24.37 $5.62 $41.26
TIPU $0.00 $11.97 $8.72 $20.69
Trade $0.00 $20.89 $32.41 $53.31
Service $43.26 $99.50 $133.15 $275.90
Government $0.00 $1.63 $3.26 $4.90
Source: Strategic Economics Group, IMPLAN Model
The next four tables identify the economic impact of the operations and maintenance of the pipeline
after it has been put in service in 2016 and beyond. The dollars identified in these tables are also in
2016 dollars.
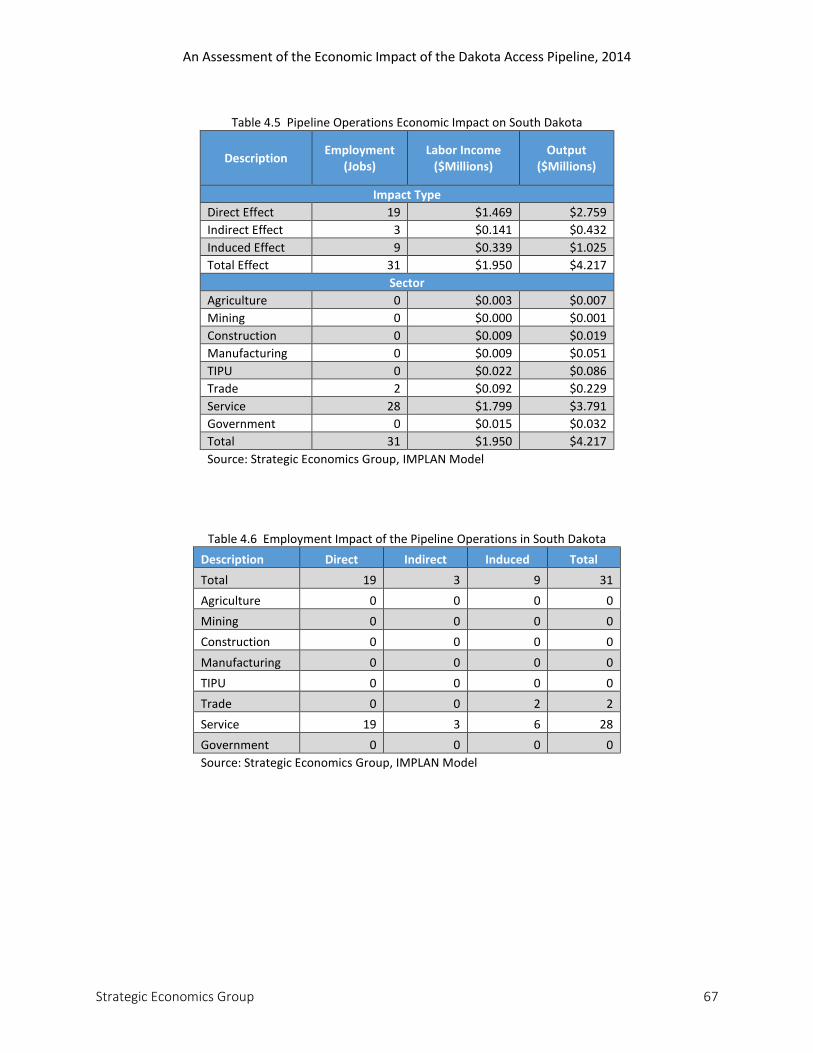
An Assessment of the Economic Impact of the Dakota Access Pipeline, 2014
Strategic Economics Group 67
Table 4.5 Pipeline Operations Economic Impact on South Dakota
Description Employment
(Jobs) Labor Income
($Millions) Output
($Millions)
Impact Type
Direct Effect 19 $1.469 $2.759
Indirect Effect 3 $0.141 $0.432
Induced Effect 9 $0.339 $1.025
Total Effect 31 $1.950 $4.217
Sector
Agriculture 0 $0.003 $0.007
Mining 0 $0.000 $0.001
Construction 0 $0.009 $0.019
Manufacturing 0 $0.009 $0.051
TIPU 0 $0.022 $0.086
Trade 2 $0.092 $0.229
Service 28 $1.799 $3.791
Government 0 $0.015 $0.032
Total 31 $1.950 $4.217
Source: Strategic Economics Group, IMPLAN Model
Table 4.6 Employment Impact of the Pipeline Operations in South Dakota
Description Direct Indirect Induced Total
Total 19 3 9 31
Agriculture 0 0 0 0
Mining 0 0 0 0
Construction 0 0 0 0
Manufacturing 0 0 0 0
TIPU 0 0 0 0
Trade 0 0 2 2
Service 19 3 6 28
Government 0 0 0 0
Source: Strategic Economics Group, IMPLAN Model
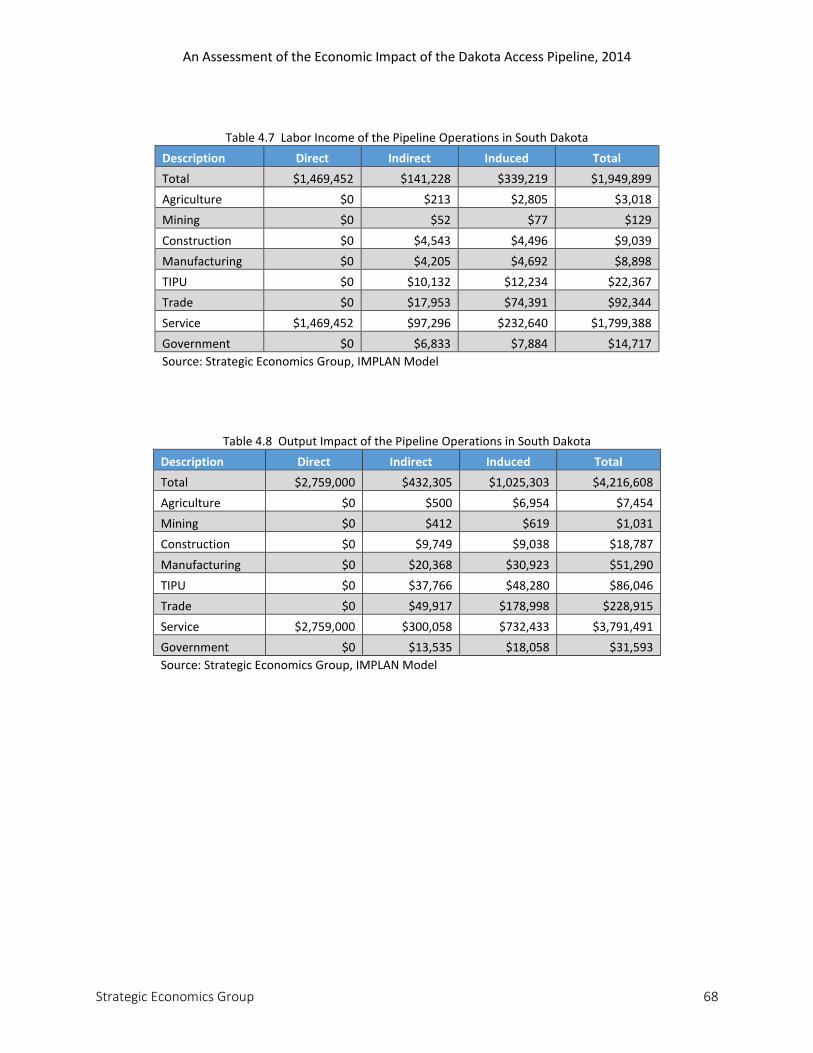
An Assessment of the Economic Impact of the Dakota Access Pipeline, 2014
Strategic Economics Group 68
Table 4.7 Labor Income of the Pipeline Operations in South Dakota
Description Direct Indirect Induced Total
Total $1,469,452 $141,228 $339,219 $1,949,899
Agriculture $0 $213 $2,805 $3,018
Mining $0 $52 $77 $129
Construction $0 $4,543 $4,496 $9,039
Manufacturing $0 $4,205 $4,692 $8,898
TIPU $0 $10,132 $12,234 $22,367
Trade $0 $17,953 $74,391 $92,344
Service $1,469,452 $97,296 $232,640 $1,799,388
Government $0 $6,833 $7,884 $14,717
Source: Strategic Economics Group, IMPLAN Model
Table 4.8 Output Impact of the Pipeline Operations in South Dakota
Description Direct Indirect Induced Total
Total $2,759,000 $432,305 $1,025,303 $4,216,608
Agriculture $0 $500 $6,954 $7,454
Mining $0 $412 $619 $1,031
Construction $0 $9,749 $9,038 $18,787
Manufacturing $0 $20,368 $30,923 $51,290
TIPU $0 $37,766 $48,280 $86,046
Trade $0 $49,917 $178,998 $228,915
Service $2,759,000 $300,058 $732,433 $3,791,491
Government $0 $13,535 $18,058 $31,593
Source: Strategic Economics Group, IMPLAN Model
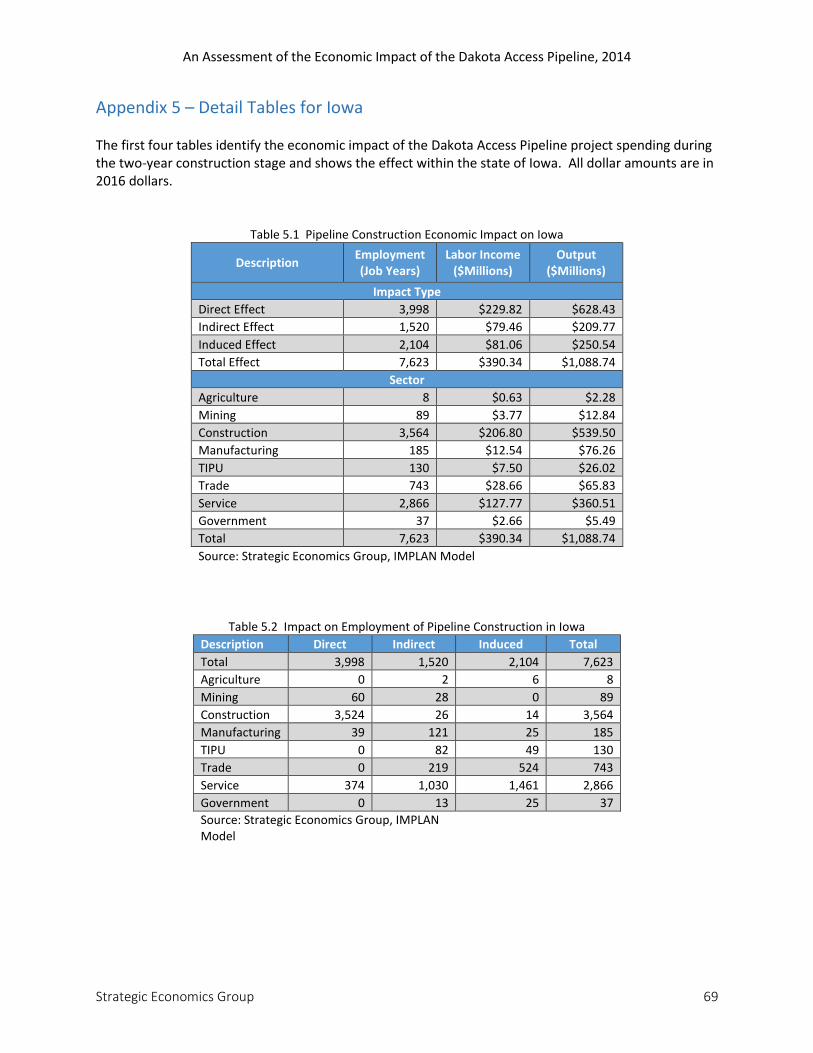
An Assessment of the Economic Impact of the Dakota Access Pipeline, 2014
Strategic Economics Group 69
Appendix 5 – Detail Tables for Iowa The first four tables identify the economic impact of the Dakota Access Pipeline project spending during the two-year construction stage and shows the effect within the state of Iowa. All dollar amounts are in 2016 dollars.
Table 5.1 Pipeline Construction Economic Impact on Iowa
Description Employment (Job Years)
Labor Income ($Millions)
Output ($Millions)
Impact Type
Direct Effect 3,998 $229.82 $628.43
Indirect Effect 1,520 $79.46 $209.77
Induced Effect 2,104 $81.06 $250.54
Total Effect 7,623 $390.34 $1,088.74
Sector
Agriculture 8 $0.63 $2.28
Mining 89 $3.77 $12.84
Construction 3,564 $206.80 $539.50
Manufacturing 185 $12.54 $76.26
TIPU 130 $7.50 $26.02
Trade 743 $28.66 $65.83
Service 2,866 $127.77 $360.51
Government 37 $2.66 $5.49
Total 7,623 $390.34 $1,088.74
Source: Strategic Economics Group, IMPLAN Model
Table 5.2 Impact on Employment of Pipeline Construction in Iowa
Description Direct Indirect Induced Total
Total 3,998 1,520 2,104 7,623
Agriculture 0 2 6 8
Mining 60 28 0 89
Construction 3,524 26 14 3,564
Manufacturing 39 121 25 185
TIPU 0 82 49 130
Trade 0 219 524 743
Service 374 1,030 1,461 2,866
Government 0 13 25 37
Source: Strategic Economics Group, IMPLAN Model
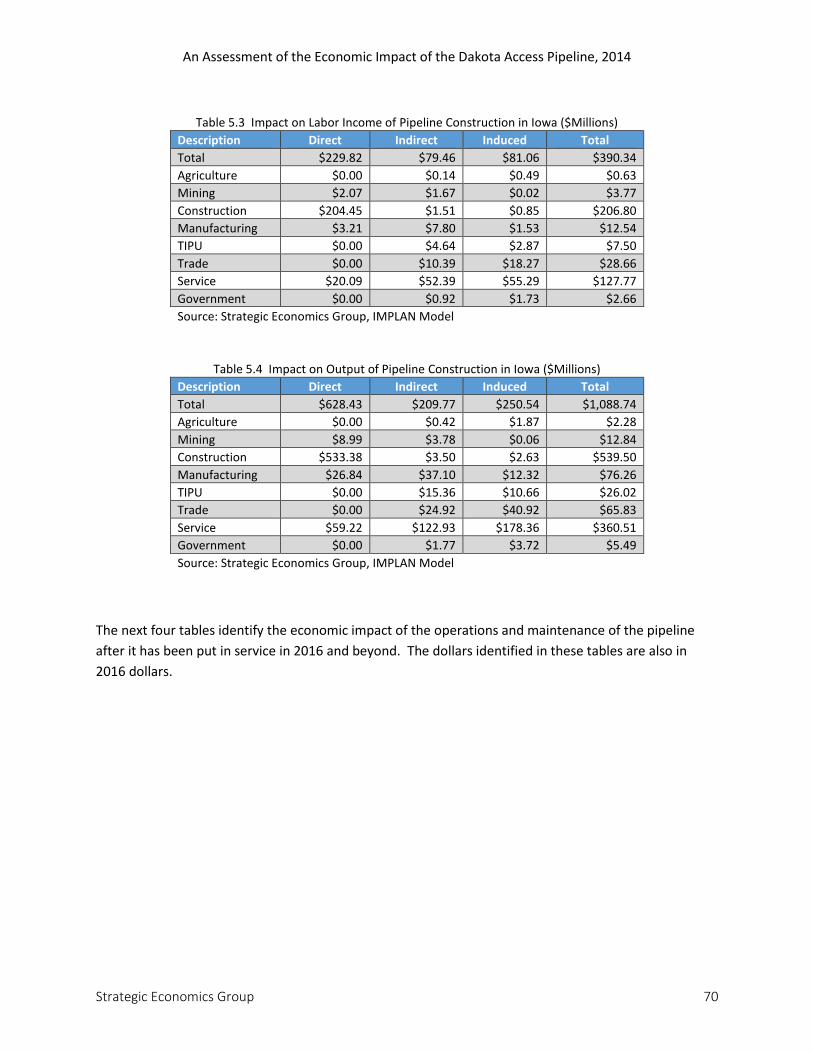
An Assessment of the Economic Impact of the Dakota Access Pipeline, 2014
Strategic Economics Group 70
Table 5.3 Impact on Labor Income of Pipeline Construction in Iowa ($Millions)
Description Direct Indirect Induced Total
Total $229.82 $79.46 $81.06 $390.34
Agriculture $0.00 $0.14 $0.49 $0.63
Mining $2.07 $1.67 $0.02 $3.77
Construction $204.45 $1.51 $0.85 $206.80
Manufacturing $3.21 $7.80 $1.53 $12.54
TIPU $0.00 $4.64 $2.87 $7.50
Trade $0.00 $10.39 $18.27 $28.66
Service $20.09 $52.39 $55.29 $127.77
Government $0.00 $0.92 $1.73 $2.66
Source: Strategic Economics Group, IMPLAN Model
Table 5.4 Impact on Output of Pipeline Construction in Iowa ($Millions)
Description Direct Indirect Induced Total
Total $628.43 $209.77 $250.54 $1,088.74
Agriculture $0.00 $0.42 $1.87 $2.28
Mining $8.99 $3.78 $0.06 $12.84
Construction $533.38 $3.50 $2.63 $539.50
Manufacturing $26.84 $37.10 $12.32 $76.26
TIPU $0.00 $15.36 $10.66 $26.02
Trade $0.00 $24.92 $40.92 $65.83
Service $59.22 $122.93 $178.36 $360.51
Government $0.00 $1.77 $3.72 $5.49
Source: Strategic Economics Group, IMPLAN Model
The next four tables identify the economic impact of the operations and maintenance of the pipeline
after it has been put in service in 2016 and beyond. The dollars identified in these tables are also in
2016 dollars.
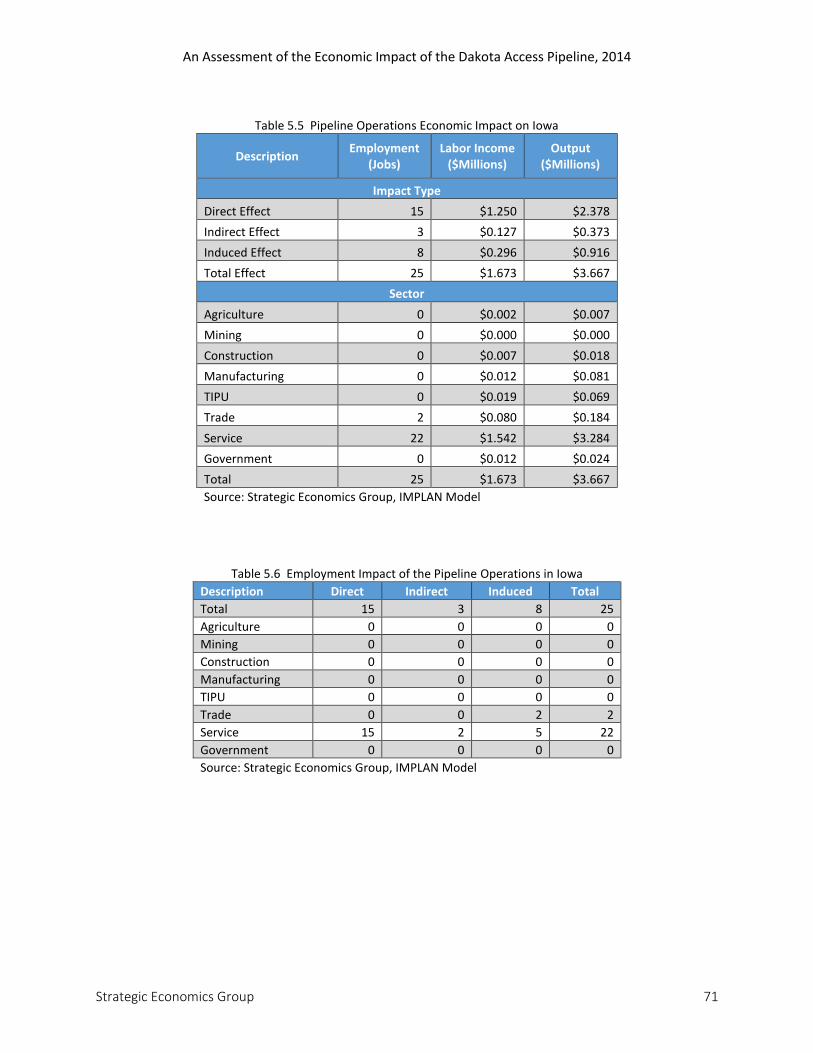
An Assessment of the Economic Impact of the Dakota Access Pipeline, 2014
Strategic Economics Group 71
Table 5.5 Pipeline Operations Economic Impact on Iowa
Description Employment
(Jobs) Labor Income
($Millions) Output
($Millions)
Impact Type
Direct Effect 15 $1.250 $2.378
Indirect Effect 3 $0.127 $0.373
Induced Effect 8 $0.296 $0.916
Total Effect 25 $1.673 $3.667
Sector
Agriculture 0 $0.002 $0.007
Mining 0 $0.000 $0.000
Construction 0 $0.007 $0.018
Manufacturing 0 $0.012 $0.081
TIPU 0 $0.019 $0.069
Trade 2 $0.080 $0.184
Service 22 $1.542 $3.284
Government 0 $0.012 $0.024
Total 25 $1.673 $3.667
Source: Strategic Economics Group, IMPLAN Model
Table 5.6 Employment Impact of the Pipeline Operations in Iowa
Description Direct Indirect Induced Total
Total 15 3 8 25
Agriculture 0 0 0 0
Mining 0 0 0 0
Construction 0 0 0 0
Manufacturing 0 0 0 0
TIPU 0 0 0 0
Trade 0 0 2 2
Service 15 2 5 22
Government 0 0 0 0
Source: Strategic Economics Group, IMPLAN Model
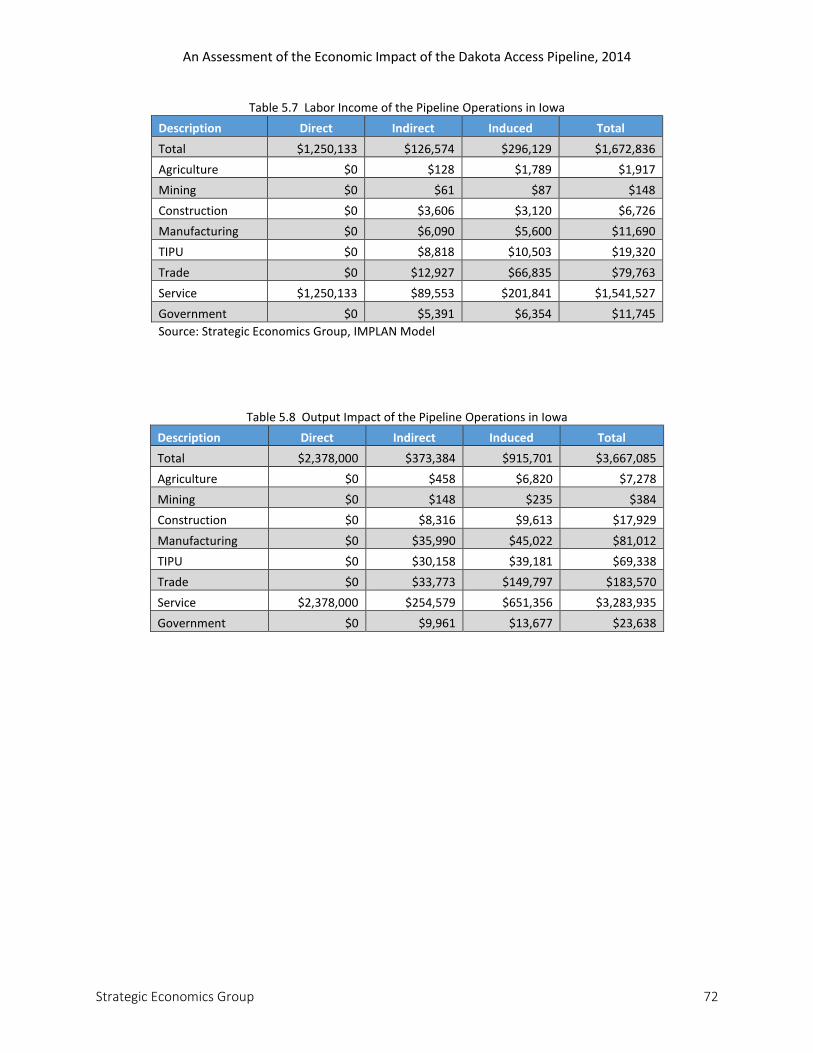
An Assessment of the Economic Impact of the Dakota Access Pipeline, 2014
Strategic Economics Group 72
Table 5.7 Labor Income of the Pipeline Operations in Iowa
Description Direct Indirect Induced Total
Total $1,250,133 $126,574 $296,129 $1,672,836
Agriculture $0 $128 $1,789 $1,917
Mining $0 $61 $87 $148
Construction $0 $3,606 $3,120 $6,726
Manufacturing $0 $6,090 $5,600 $11,690
TIPU $0 $8,818 $10,503 $19,320
Trade $0 $12,927 $66,835 $79,763
Service $1,250,133 $89,553 $201,841 $1,541,527
Government $0 $5,391 $6,354 $11,745
Source: Strategic Economics Group, IMPLAN Model
Table 5.8 Output Impact of the Pipeline Operations in Iowa
Description Direct Indirect Induced Total
Total $2,378,000 $373,384 $915,701 $3,667,085
Agriculture $0 $458 $6,820 $7,278
Mining $0 $148 $235 $384
Construction $0 $8,316 $9,613 $17,929
Manufacturing $0 $35,990 $45,022 $81,012
TIPU $0 $30,158 $39,181 $69,338
Trade $0 $33,773 $149,797 $183,570
Service $2,378,000 $254,579 $651,356 $3,283,935
Government $0 $9,961 $13,677 $23,638
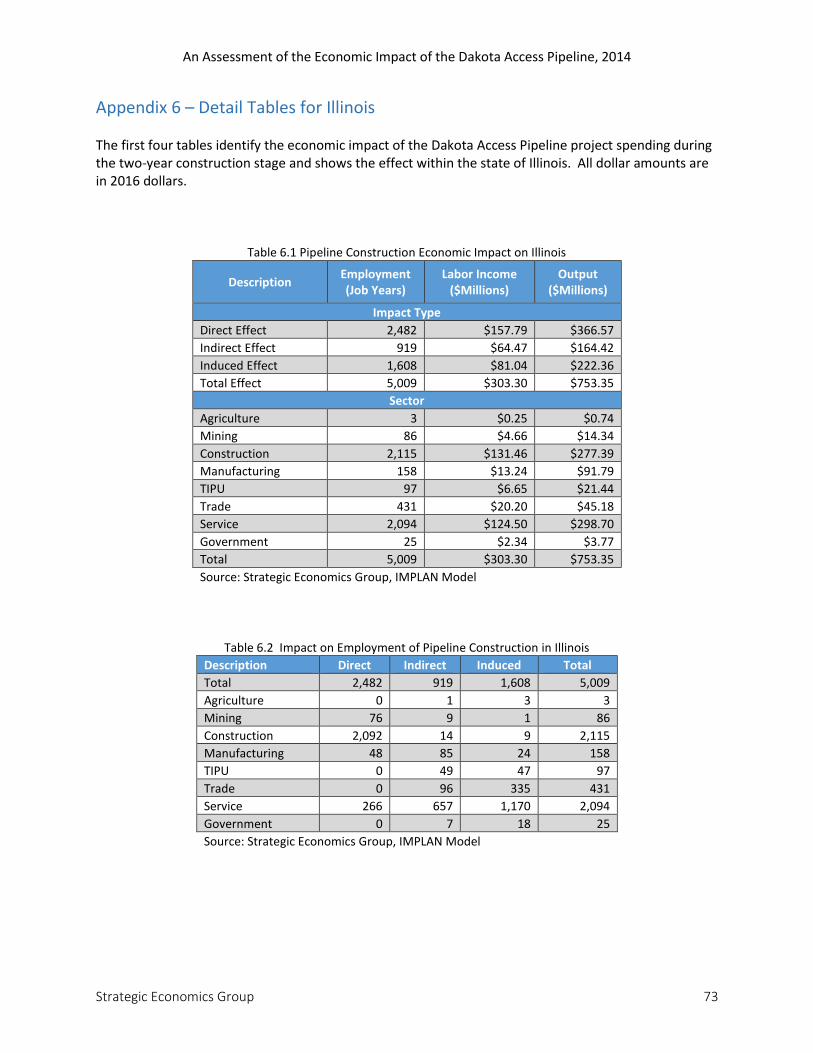
An Assessment of the Economic Impact of the Dakota Access Pipeline, 2014
Strategic Economics Group 73
Appendix 6 – Detail Tables for Illinois The first four tables identify the economic impact of the Dakota Access Pipeline project spending during the two-year construction stage and shows the effect within the state of Illinois. All dollar amounts are in 2016 dollars.
Table 6.1 Pipeline Construction Economic Impact on Illinois
Description Employment (Job Years)
Labor Income ($Millions)
Output ($Millions)
Impact Type
Direct Effect 2,482 $157.79 $366.57
Indirect Effect 919 $64.47 $164.42
Induced Effect 1,608 $81.04 $222.36
Total Effect 5,009 $303.30 $753.35
Sector
Agriculture 3 $0.25 $0.74
Mining 86 $4.66 $14.34
Construction 2,115 $131.46 $277.39
Manufacturing 158 $13.24 $91.79
TIPU 97 $6.65 $21.44
Trade 431 $20.20 $45.18
Service 2,094 $124.50 $298.70
Government 25 $2.34 $3.77
Total 5,009 $303.30 $753.35
Source: Strategic Economics Group, IMPLAN Model
Table 6.2 Impact on Employment of Pipeline Construction in Illinois
Description Direct Indirect Induced Total
Total 2,482 919 1,608 5,009
Agriculture 0 1 3 3
Mining 76 9 1 86
Construction 2,092 14 9 2,115
Manufacturing 48 85 24 158
TIPU 0 49 47 97
Trade 0 96 335 431
Service 266 657 1,170 2,094
Government 0 7 18 25
Source: Strategic Economics Group, IMPLAN Model
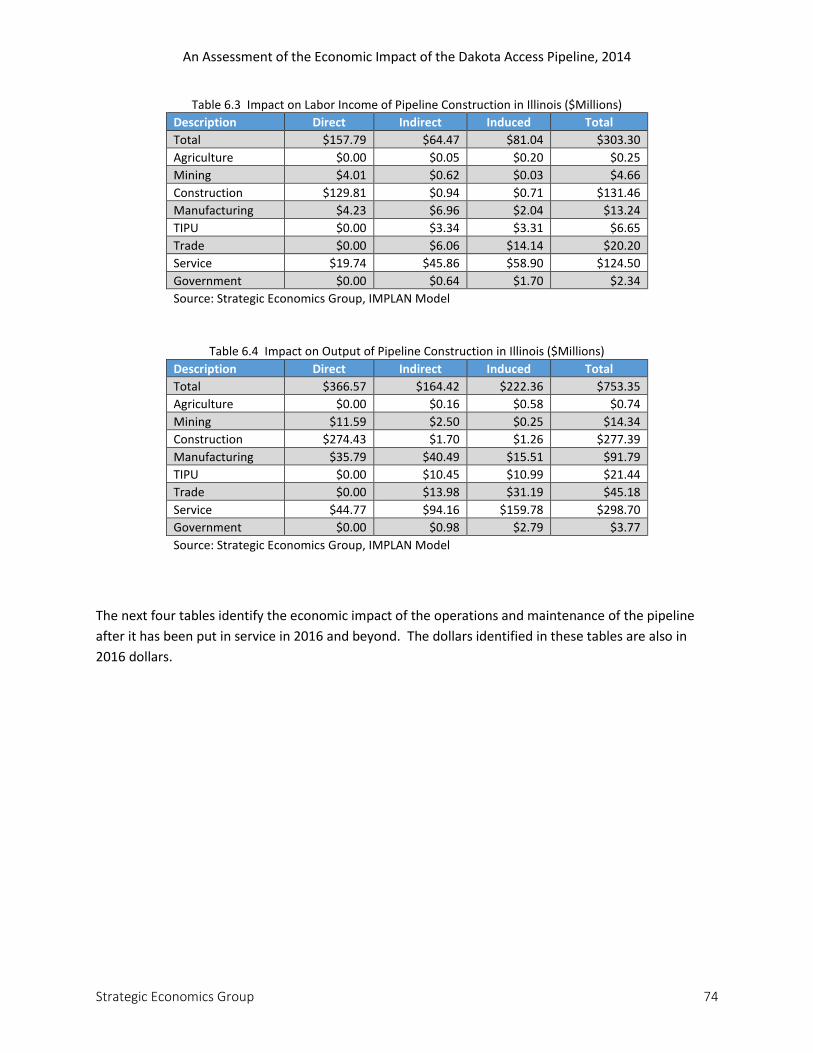
An Assessment of the Economic Impact of the Dakota Access Pipeline, 2014
Strategic Economics Group 74
Table 6.3 Impact on Labor Income of Pipeline Construction in Illinois ($Millions)
Description Direct Indirect Induced Total
Total $157.79 $64.47 $81.04 $303.30
Agriculture $0.00 $0.05 $0.20 $0.25
Mining $4.01 $0.62 $0.03 $4.66
Construction $129.81 $0.94 $0.71 $131.46
Manufacturing $4.23 $6.96 $2.04 $13.24
TIPU $0.00 $3.34 $3.31 $6.65
Trade $0.00 $6.06 $14.14 $20.20
Service $19.74 $45.86 $58.90 $124.50
Government $0.00 $0.64 $1.70 $2.34
Source: Strategic Economics Group, IMPLAN Model
Table 6.4 Impact on Output of Pipeline Construction in Illinois ($Millions)
Description Direct Indirect Induced Total
Total $366.57 $164.42 $222.36 $753.35
Agriculture $0.00 $0.16 $0.58 $0.74
Mining $11.59 $2.50 $0.25 $14.34
Construction $274.43 $1.70 $1.26 $277.39
Manufacturing $35.79 $40.49 $15.51 $91.79
TIPU $0.00 $10.45 $10.99 $21.44
Trade $0.00 $13.98 $31.19 $45.18
Service $44.77 $94.16 $159.78 $298.70
Government $0.00 $0.98 $2.79 $3.77
Source: Strategic Economics Group, IMPLAN Model
The next four tables identify the economic impact of the operations and maintenance of the pipeline
after it has been put in service in 2016 and beyond. The dollars identified in these tables are also in
2016 dollars.
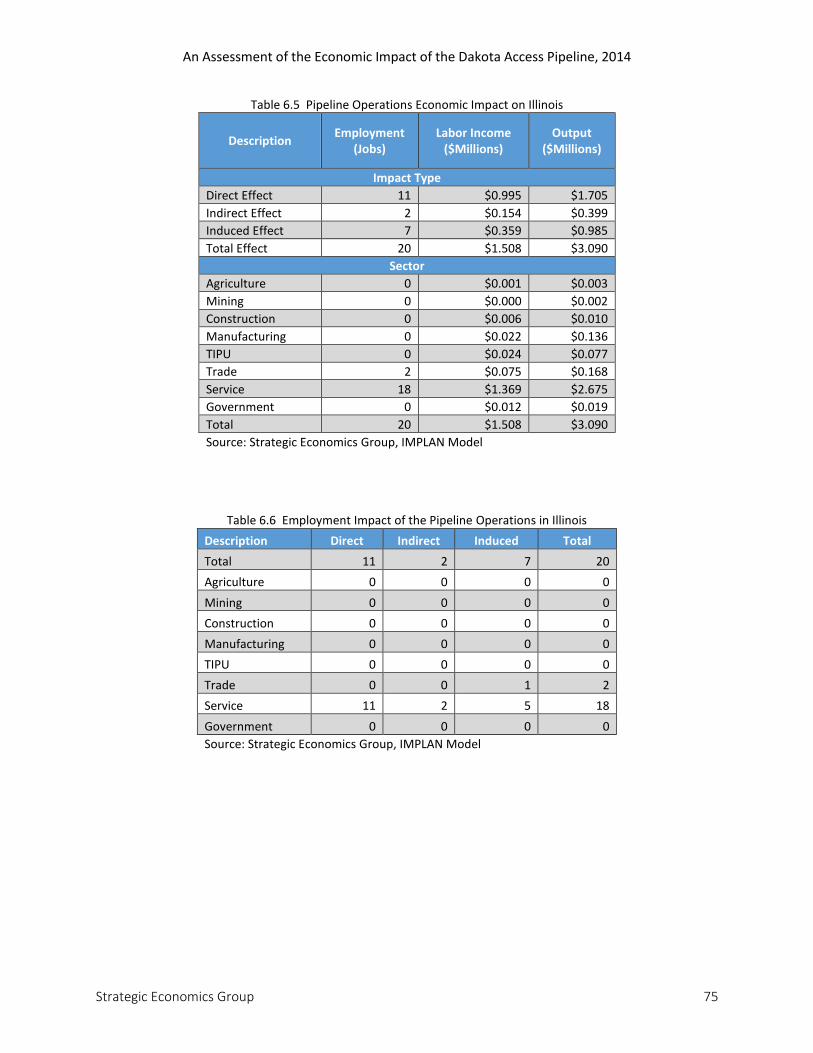
An Assessment of the Economic Impact of the Dakota Access Pipeline, 2014
Strategic Economics Group 75
Table 6.5 Pipeline Operations Economic Impact on Illinois
Description Employment
(Jobs) Labor Income
($Millions) Output
($Millions)
Impact Type
Direct Effect 11 $0.995 $1.705
Indirect Effect 2 $0.154 $0.399
Induced Effect 7 $0.359 $0.985
Total Effect 20 $1.508 $3.090
Sector
Agriculture 0 $0.001 $0.003
Mining 0 $0.000 $0.002
Construction 0 $0.006 $0.010
Manufacturing 0 $0.022 $0.136
TIPU 0 $0.024 $0.077
Trade 2 $0.075 $0.168
Service 18 $1.369 $2.675
Government 0 $0.012 $0.019
Total 20 $1.508 $3.090
Source: Strategic Economics Group, IMPLAN Model
Table 6.6 Employment Impact of the Pipeline Operations in Illinois
Description Direct Indirect Induced Total
Total 11 2 7 20
Agriculture 0 0 0 0
Mining 0 0 0 0
Construction 0 0 0 0
Manufacturing 0 0 0 0
TIPU 0 0 0 0
Trade 0 0 1 2
Service 11 2 5 18
Government 0 0 0 0
Source: Strategic Economics Group, IMPLAN Model
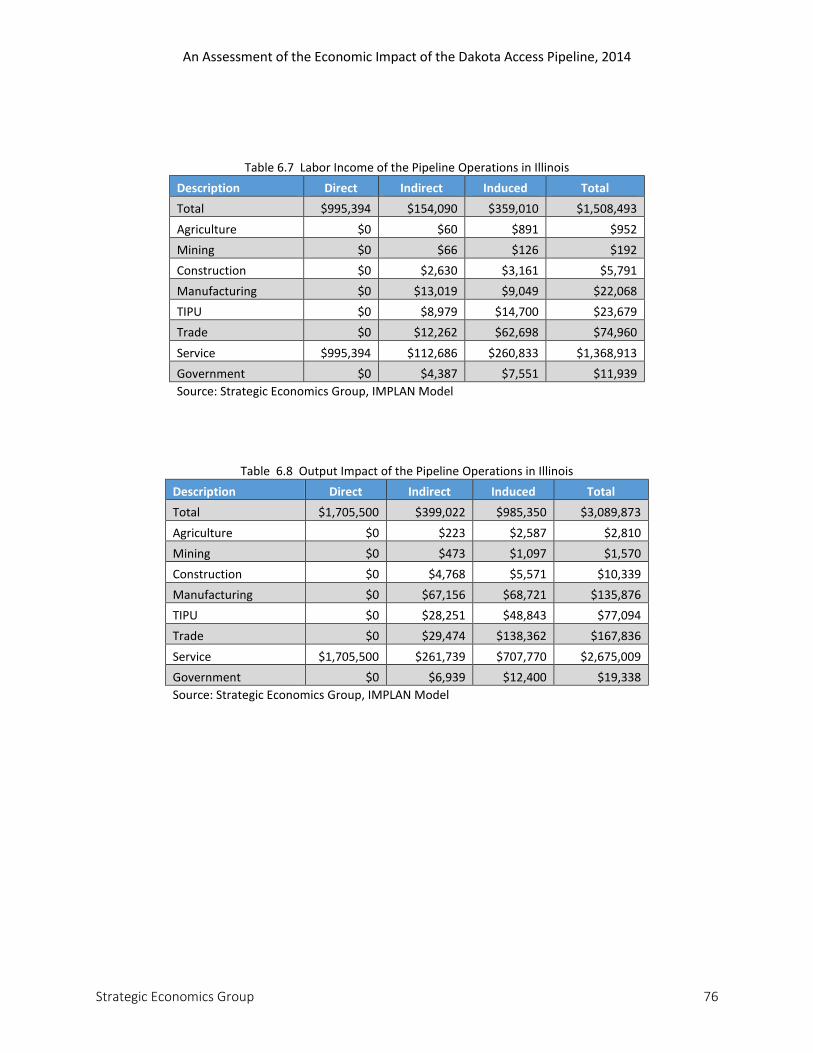
An Assessment of the Economic Impact of the Dakota Access Pipeline, 2014
Strategic Economics Group 76
Table 6.7 Labor Income of the Pipeline Operations in Illinois
Description Direct Indirect Induced Total
Total $995,394 $154,090 $359,010 $1,508,493
Agriculture $0 $60 $891 $952
Mining $0 $66 $126 $192
Construction $0 $2,630 $3,161 $5,791
Manufacturing $0 $13,019 $9,049 $22,068
TIPU $0 $8,979 $14,700 $23,679
Trade $0 $12,262 $62,698 $74,960
Service $995,394 $112,686 $260,833 $1,368,913
Government $0 $4,387 $7,551 $11,939
Source: Strategic Economics Group, IMPLAN Model
Table 6.8 Output Impact of the Pipeline Operations in Illinois
Description Direct Indirect Induced Total
Total $1,705,500 $399,022 $985,350 $3,089,873
Agriculture $0 $223 $2,587 $2,810
Mining $0 $473 $1,097 $1,570
Construction $0 $4,768 $5,571 $10,339
Manufacturing $0 $67,156 $68,721 $135,876
TIPU $0 $28,251 $48,843 $77,094
Trade $0 $29,474 $138,362 $167,836
Service $1,705,500 $261,739 $707,770 $2,675,009
Government $0 $6,939 $12,400 $19,338
Source: Strategic Economics Group, IMPLAN Model
An Assessment of the Economic Impact of the Dakota Access Pipeline, 2014
Strategic Economics Group 77
Appendix 7 - Description of the IMPLAN Model56 IMPLAN is a widely-accepted and utilized software model. At the heart of the model is an input-output
dollar flow table. For a specified region, the input-output table accounts for all dollar flows between
different sectors of the economy. Using this information, IMPLAN models the way a dollar injected into
one sector is spent and re-spent in other sectors of the economy, generating waves of economic activity,
or so-called “economic multiplier” effects.
The model uses national industry data and county-level economic data to generate a series of
multipliers which in turn estimate the total economic implications of economic activity. At the heart of
the model is a national input-output dollar flow table called the Social Accounting Matrix (SAM). Unlike
other static input-output models, which just measure the purchasing relationships between industry and
household sectors, SAM also measures the economic relationships between government, industry, and
household sectors, allowing IMPLAN to model transfer payments such as unemployment insurance.
Thus, for the specified region, the input-output table accounts for all the dollar flows between the
different sectors within the economy.
For this study, Strategic Economics Group used the most recent IMPLAN datasets for North Dakota, South Dakota, Iowa, Illinois and the United States.
56 IMPLAN Pro User’s Guide, 2000

An Assessment of the Economic Impact of the Dakota Access Pipeline, 2014
Strategic Economics Group 78
Appendix 8 - About the Strategic Economics Group Research Team
Strategic Economics Group (SEG) is the region’s only locally-owned economic research consulting firm.
It has served businesses and government clients in Iowa and the Midwest since 2001. The SEG team
develops economic impact studies, fiscal impact estimates, cost-benefit models, management
information systems and forensic projections.
Harvey Siegelman is the President of Strategic Economics Group. In 2001, Mr. Siegelman retired as
Iowa’s longest-serving State Economist (1982-2001). He was also Adjunct Professor of Economics at
Drake University. Siegelman earned his Master of Arts in Economics degree from Wichita State
University. Prior to his appointment as State Economist, he was a professor of economics at University
of Wisconsin-Whitewater Campus, University of Findlay (Ohio) and visiting professor at Wichita State
University.
Michael Lipsman is a Senior Economic Analyst with Strategic Economics Group. Lipsman has earned a
Masters in Community and Regional Planning and a Doctorate in Economics from Iowa State University.
Over the course of a 31 year professional career in Iowa State government he has worked as a
transportation planner, senior legislative analyst, and tax research analyst. From 2000 to 2011 he
managed the Tax Research and Program Analysis Section of the Iowa Department of Revenue.
Daniel Otto is a Senior Economic Analyst with Strategic Economics Group. Otto is Emeritus Professor of
Economics at Iowa State University. He received his doctorate in economics from Virginia Polytechnic
Institute in 1981 and joined Iowa State University that same year as an Associate Professor and
Extension Economist. His research areas include Community and Regional Economic Modeling and
Policy Analysis, Economic and Fiscal Impact Analysis and Project Evaluation.
Additional details and contact information can be found on their website: www.economicsgroup.com.