an atlas of stellar spectra -...
TRANSCRIPT

An Atlas ofStellar Spectra
with an Outline
of Spectral
Classification
?
W. W. Morgan Philip C. Keenan Edith Kellman

Astrophysical Monographs
Sponsored by
The Astrophysical Journal
Edited byPaul W. Merrill Harlow ShapleyMount Wilson Observatory Harvard College Observatoryof the Carnegie Institution of Washington Cambridge, Massachusetts
J. H. Moore Otto StruveLick Observatory Yerkes ObservatoryUniversity of California of the University of Chicago
An Atlas of Stellar Spectrawith an Outline of Spectral Classification
The University of Chicago Press
Chicago, Illinois
?
The Baker & Taylor CompanyNew York
The Cambridge University PressLondon
AN ATLASOF STELLAR SPECTRA
With an Outline of Spectral
Classification
By
W. W. Morgan, Philip C. Keenan
and Edith Kellman
The University of Chicago Press
Chicago · Illinois

Copyright 1943 by the University of Chicago. All rights reserved. Pub-lished January 1943. Composed and printed by the University of ChicagoPress, Chicago, Illinois, USA.
i
Preface to the ULO Version
This version of the MKK Atlas was produced by M. M. Dworetsky and W.R. Reece at the University of London Observatory, University College Lon-don, with permission from the copyright holders, The University of ChicagoPress.
While every effort has been made to ensure that this version of the Atlas isa faithful copy of the original, mistakes may have occurred. Please submitcorrections to [email protected].
This version includes a table of contents, a list of tables and a star nameindex not included in the original version of the Atlas.
High resolution scans of the catalogue plates are available on the WorldWide Web. The home page for these is:
www.ulo.ucl.ac.uk/catalogues/mkkatlas/
We thank Miss Deborah Scammell for performing the plate scanning.
University of London Observatory,Mill Hill Park, London.July 2004.
Typeset using LATEX.
ii
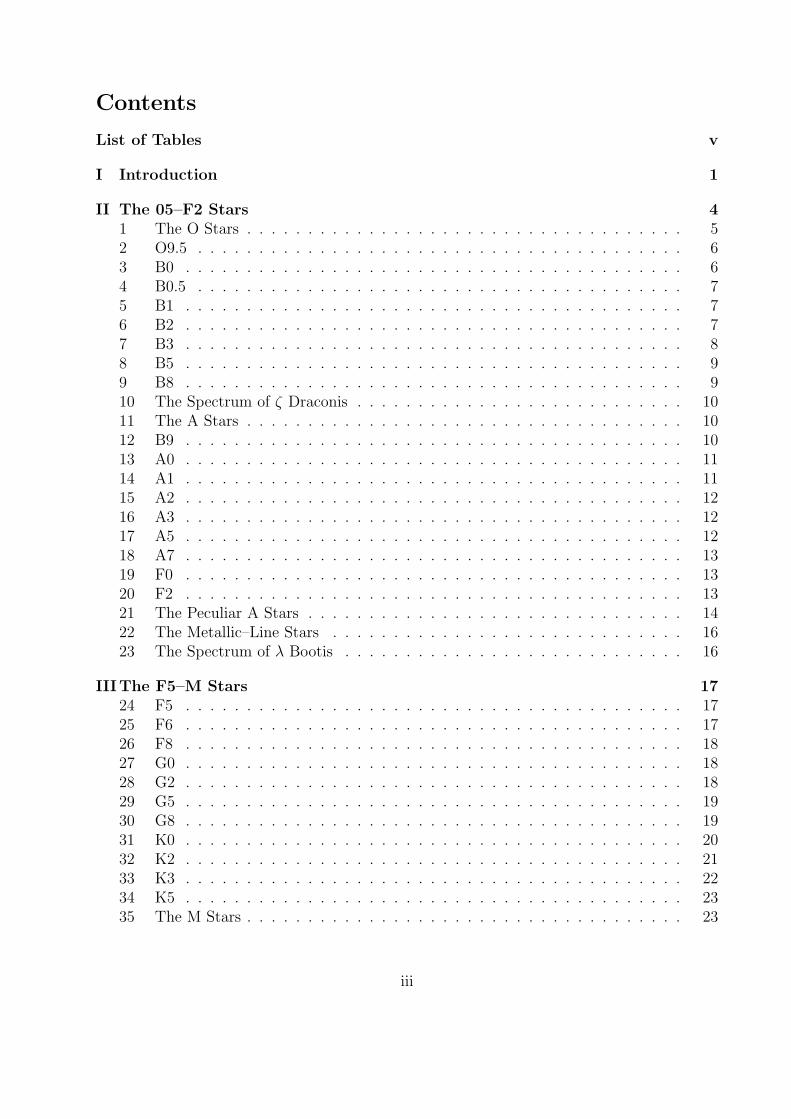
Contents
List of Tables v
I Introduction 1
II The 05–F2 Stars 41 The O Stars . . . . . . . . . . . . . . . . . . . . . . . . . . . . . . . . . . . . 52 O9.5 . . . . . . . . . . . . . . . . . . . . . . . . . . . . . . . . . . . . . . . . 63 B0 . . . . . . . . . . . . . . . . . . . . . . . . . . . . . . . . . . . . . . . . . 64 B0.5 . . . . . . . . . . . . . . . . . . . . . . . . . . . . . . . . . . . . . . . . 75 B1 . . . . . . . . . . . . . . . . . . . . . . . . . . . . . . . . . . . . . . . . . 76 B2 . . . . . . . . . . . . . . . . . . . . . . . . . . . . . . . . . . . . . . . . . 77 B3 . . . . . . . . . . . . . . . . . . . . . . . . . . . . . . . . . . . . . . . . . 88 B5 . . . . . . . . . . . . . . . . . . . . . . . . . . . . . . . . . . . . . . . . . 99 B8 . . . . . . . . . . . . . . . . . . . . . . . . . . . . . . . . . . . . . . . . . 910 The Spectrum of ζ Draconis . . . . . . . . . . . . . . . . . . . . . . . . . . . 1011 The A Stars . . . . . . . . . . . . . . . . . . . . . . . . . . . . . . . . . . . . 1012 B9 . . . . . . . . . . . . . . . . . . . . . . . . . . . . . . . . . . . . . . . . . 1013 A0 . . . . . . . . . . . . . . . . . . . . . . . . . . . . . . . . . . . . . . . . . 1114 A1 . . . . . . . . . . . . . . . . . . . . . . . . . . . . . . . . . . . . . . . . . 1115 A2 . . . . . . . . . . . . . . . . . . . . . . . . . . . . . . . . . . . . . . . . . 1216 A3 . . . . . . . . . . . . . . . . . . . . . . . . . . . . . . . . . . . . . . . . . 1217 A5 . . . . . . . . . . . . . . . . . . . . . . . . . . . . . . . . . . . . . . . . . 1218 A7 . . . . . . . . . . . . . . . . . . . . . . . . . . . . . . . . . . . . . . . . . 1319 F0 . . . . . . . . . . . . . . . . . . . . . . . . . . . . . . . . . . . . . . . . . 1320 F2 . . . . . . . . . . . . . . . . . . . . . . . . . . . . . . . . . . . . . . . . . 1321 The Peculiar A Stars . . . . . . . . . . . . . . . . . . . . . . . . . . . . . . . 1422 The Metallic–Line Stars . . . . . . . . . . . . . . . . . . . . . . . . . . . . . 1623 The Spectrum of λ Bootis . . . . . . . . . . . . . . . . . . . . . . . . . . . . 16
IIIThe F5–M Stars 1724 F5 . . . . . . . . . . . . . . . . . . . . . . . . . . . . . . . . . . . . . . . . . 1725 F6 . . . . . . . . . . . . . . . . . . . . . . . . . . . . . . . . . . . . . . . . . 1726 F8 . . . . . . . . . . . . . . . . . . . . . . . . . . . . . . . . . . . . . . . . . 1827 G0 . . . . . . . . . . . . . . . . . . . . . . . . . . . . . . . . . . . . . . . . . 1828 G2 . . . . . . . . . . . . . . . . . . . . . . . . . . . . . . . . . . . . . . . . . 1829 G5 . . . . . . . . . . . . . . . . . . . . . . . . . . . . . . . . . . . . . . . . . 1930 G8 . . . . . . . . . . . . . . . . . . . . . . . . . . . . . . . . . . . . . . . . . 1931 K0 . . . . . . . . . . . . . . . . . . . . . . . . . . . . . . . . . . . . . . . . . 2032 K2 . . . . . . . . . . . . . . . . . . . . . . . . . . . . . . . . . . . . . . . . . 2133 K3 . . . . . . . . . . . . . . . . . . . . . . . . . . . . . . . . . . . . . . . . . 2234 K5 . . . . . . . . . . . . . . . . . . . . . . . . . . . . . . . . . . . . . . . . . 2335 The M Stars . . . . . . . . . . . . . . . . . . . . . . . . . . . . . . . . . . . . 23
iii
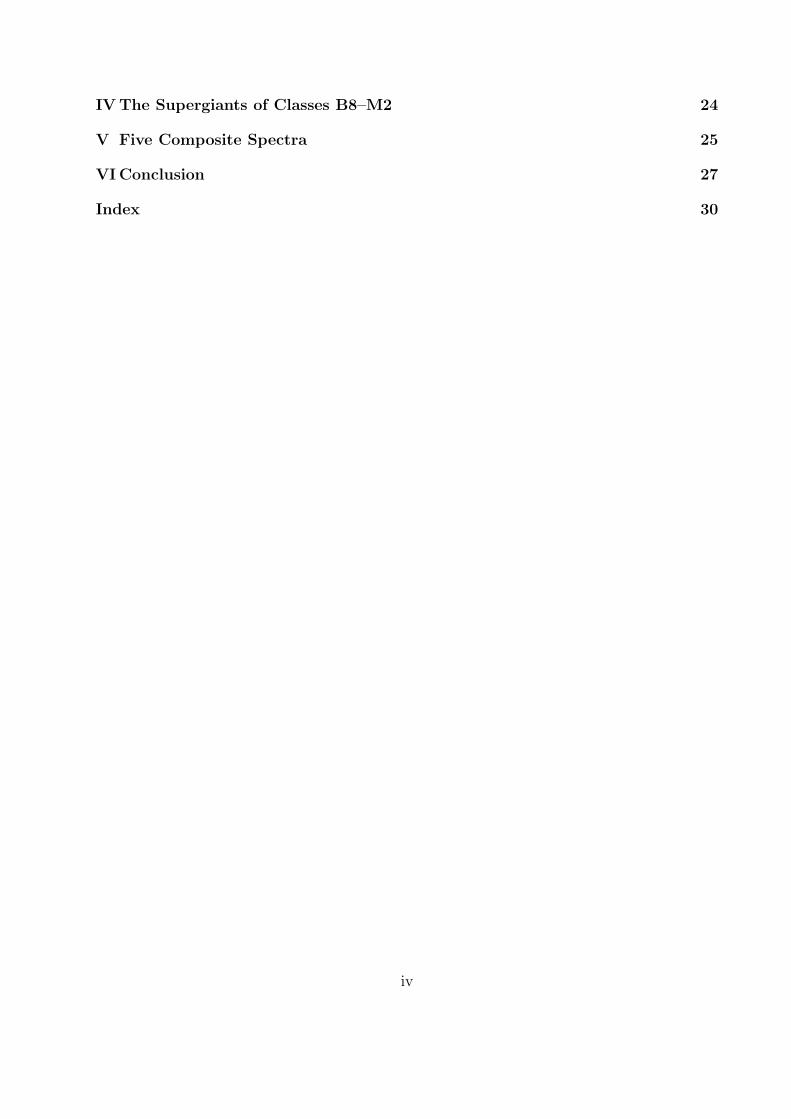
IV The Supergiants of Classes B8–M2 24
V Five Composite Spectra 25
VI Conclusion 27
Index 30
iv
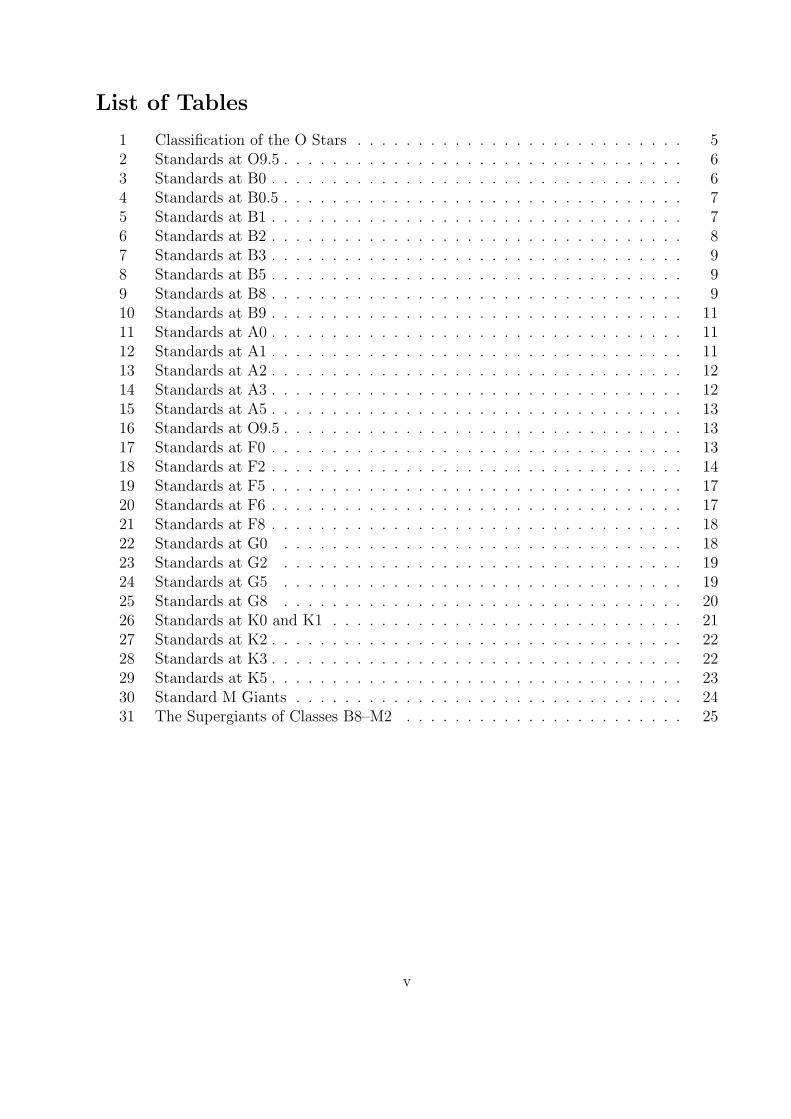
List of Tables
1 Classification of the O Stars . . . . . . . . . . . . . . . . . . . . . . . . . . . 52 Standards at O9.5 . . . . . . . . . . . . . . . . . . . . . . . . . . . . . . . . . 63 Standards at B0 . . . . . . . . . . . . . . . . . . . . . . . . . . . . . . . . . . 64 Standards at B0.5 . . . . . . . . . . . . . . . . . . . . . . . . . . . . . . . . . 75 Standards at B1 . . . . . . . . . . . . . . . . . . . . . . . . . . . . . . . . . . 76 Standards at B2 . . . . . . . . . . . . . . . . . . . . . . . . . . . . . . . . . . 87 Standards at B3 . . . . . . . . . . . . . . . . . . . . . . . . . . . . . . . . . . 98 Standards at B5 . . . . . . . . . . . . . . . . . . . . . . . . . . . . . . . . . . 99 Standards at B8 . . . . . . . . . . . . . . . . . . . . . . . . . . . . . . . . . . 910 Standards at B9 . . . . . . . . . . . . . . . . . . . . . . . . . . . . . . . . . . 1111 Standards at A0 . . . . . . . . . . . . . . . . . . . . . . . . . . . . . . . . . . 1112 Standards at A1 . . . . . . . . . . . . . . . . . . . . . . . . . . . . . . . . . . 1113 Standards at A2 . . . . . . . . . . . . . . . . . . . . . . . . . . . . . . . . . . 1214 Standards at A3 . . . . . . . . . . . . . . . . . . . . . . . . . . . . . . . . . . 1215 Standards at A5 . . . . . . . . . . . . . . . . . . . . . . . . . . . . . . . . . . 1316 Standards at O9.5 . . . . . . . . . . . . . . . . . . . . . . . . . . . . . . . . . 1317 Standards at F0 . . . . . . . . . . . . . . . . . . . . . . . . . . . . . . . . . . 1318 Standards at F2 . . . . . . . . . . . . . . . . . . . . . . . . . . . . . . . . . . 1419 Standards at F5 . . . . . . . . . . . . . . . . . . . . . . . . . . . . . . . . . . 1720 Standards at F6 . . . . . . . . . . . . . . . . . . . . . . . . . . . . . . . . . . 1721 Standards at F8 . . . . . . . . . . . . . . . . . . . . . . . . . . . . . . . . . . 1822 Standards at G0 . . . . . . . . . . . . . . . . . . . . . . . . . . . . . . . . . 1823 Standards at G2 . . . . . . . . . . . . . . . . . . . . . . . . . . . . . . . . . 1924 Standards at G5 . . . . . . . . . . . . . . . . . . . . . . . . . . . . . . . . . 1925 Standards at G8 . . . . . . . . . . . . . . . . . . . . . . . . . . . . . . . . . 2026 Standards at K0 and K1 . . . . . . . . . . . . . . . . . . . . . . . . . . . . . 2127 Standards at K2 . . . . . . . . . . . . . . . . . . . . . . . . . . . . . . . . . . 2228 Standards at K3 . . . . . . . . . . . . . . . . . . . . . . . . . . . . . . . . . . 2229 Standards at K5 . . . . . . . . . . . . . . . . . . . . . . . . . . . . . . . . . . 2330 Standard M Giants . . . . . . . . . . . . . . . . . . . . . . . . . . . . . . . . 2431 The Supergiants of Classes B8–M2 . . . . . . . . . . . . . . . . . . . . . . . 25
v
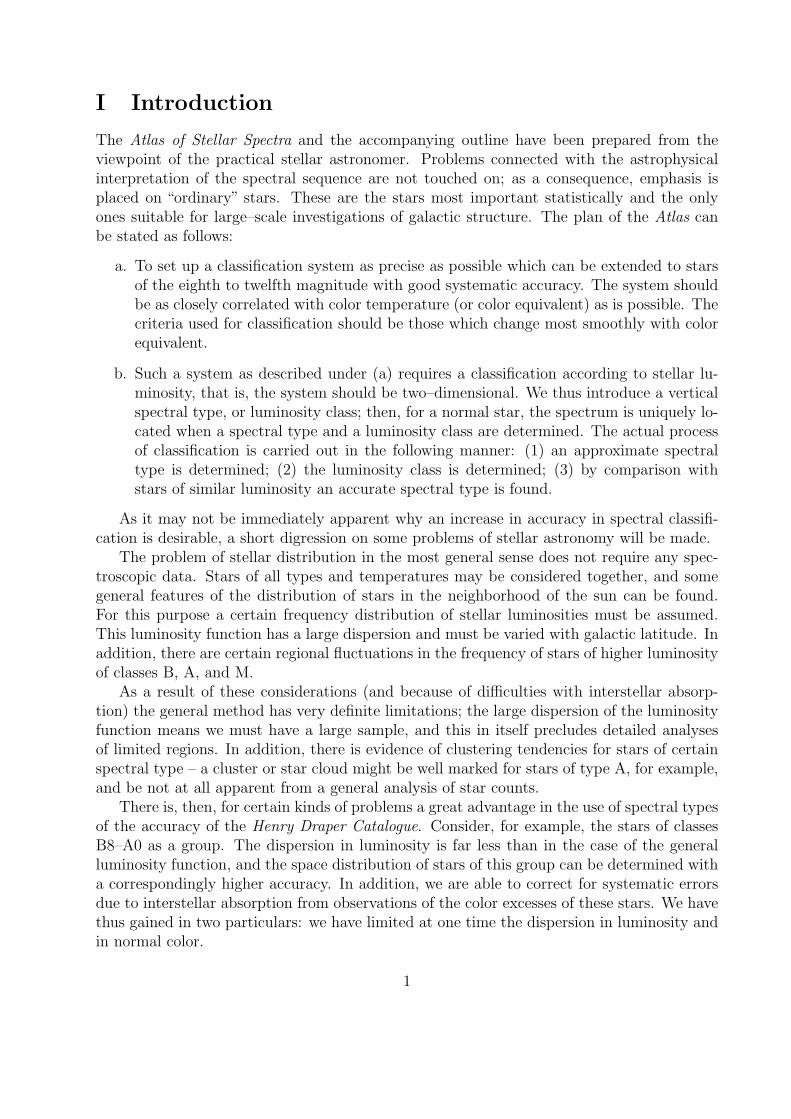
I Introduction
The Atlas of Stellar Spectra and the accompanying outline have been prepared from theviewpoint of the practical stellar astronomer. Problems connected with the astrophysicalinterpretation of the spectral sequence are not touched on; as a consequence, emphasis isplaced on “ordinary” stars. These are the stars most important statistically and the onlyones suitable for large–scale investigations of galactic structure. The plan of the Atlas canbe stated as follows:
a. To set up a classification system as precise as possible which can be extended to starsof the eighth to twelfth magnitude with good systematic accuracy. The system shouldbe as closely correlated with color temperature (or color equivalent) as is possible. Thecriteria used for classification should be those which change most smoothly with colorequivalent.
b. Such a system as described under (a) requires a classification according to stellar lu-minosity, that is, the system should be two–dimensional. We thus introduce a verticalspectral type, or luminosity class; then, for a normal star, the spectrum is uniquely lo-cated when a spectral type and a luminosity class are determined. The actual processof classification is carried out in the following manner: (1) an approximate spectraltype is determined; (2) the luminosity class is determined; (3) by comparison withstars of similar luminosity an accurate spectral type is found.
As it may not be immediately apparent why an increase in accuracy in spectral classifi-cation is desirable, a short digression on some problems of stellar astronomy will be made.
The problem of stellar distribution in the most general sense does not require any spec-troscopic data. Stars of all types and temperatures may be considered together, and somegeneral features of the distribution of stars in the neighborhood of the sun can be found.For this purpose a certain frequency distribution of stellar luminosities must be assumed.This luminosity function has a large dispersion and must be varied with galactic latitude. Inaddition, there are certain regional fluctuations in the frequency of stars of higher luminosityof classes B, A, and M.
As a result of these considerations (and because of difficulties with interstellar absorp-tion) the general method has very definite limitations; the large dispersion of the luminosityfunction means we must have a large sample, and this in itself precludes detailed analysesof limited regions. In addition, there is evidence of clustering tendencies for stars of certainspectral type – a cluster or star cloud might be well marked for stars of type A, for example,and be not at all apparent from a general analysis of star counts.
There is, then, for certain kinds of problems a great advantage in the use of spectral typesof the accuracy of the Henry Draper Catalogue. Consider, for example, the stars of classesB8–A0 as a group. The dispersion in luminosity is far less than in the case of the generalluminosity function, and the space distribution of stars of this group can be determined witha correspondingly higher accuracy. In addition, we are able to correct for systematic errorsdue to interstellar absorption from observations of the color excesses of these stars. We havethus gained in two particulars: we have limited at one time the dispersion in luminosity andin normal color.
1
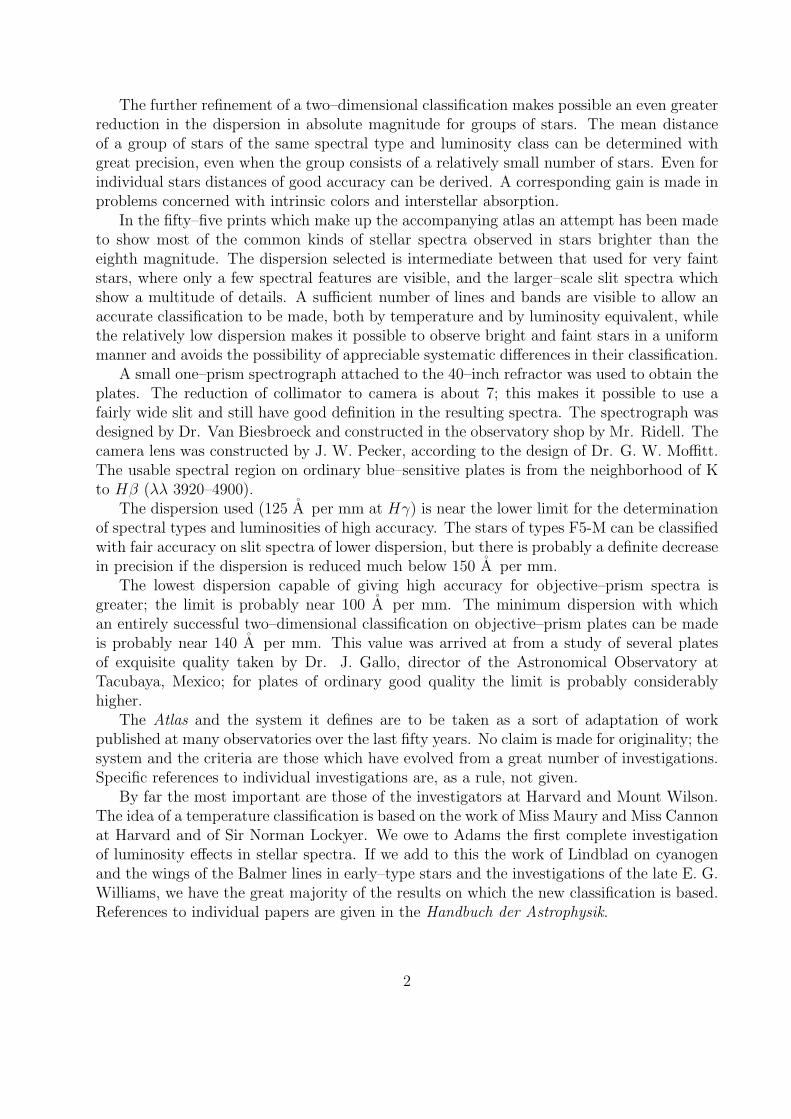
The further refinement of a two–dimensional classification makes possible an even greaterreduction in the dispersion in absolute magnitude for groups of stars. The mean distanceof a group of stars of the same spectral type and luminosity class can be determined withgreat precision, even when the group consists of a relatively small number of stars. Even forindividual stars distances of good accuracy can be derived. A corresponding gain is made inproblems concerned with intrinsic colors and interstellar absorption.
In the fifty–five prints which make up the accompanying atlas an attempt has been madeto show most of the common kinds of stellar spectra observed in stars brighter than theeighth magnitude. The dispersion selected is intermediate between that used for very faintstars, where only a few spectral features are visible, and the larger–scale slit spectra whichshow a multitude of details. A sufficient number of lines and bands are visible to allow anaccurate classification to be made, both by temperature and by luminosity equivalent, whilethe relatively low dispersion makes it possible to observe bright and faint stars in a uniformmanner and avoids the possibility of appreciable systematic differences in their classification.
A small one–prism spectrograph attached to the 40–inch refractor was used to obtain theplates. The reduction of collimator to camera is about 7; this makes it possible to use afairly wide slit and still have good definition in the resulting spectra. The spectrograph wasdesigned by Dr. Van Biesbroeck and constructed in the observatory shop by Mr. Ridell. Thecamera lens was constructed by J. W. Pecker, according to the design of Dr. G. W. Moffitt.The usable spectral region on ordinary blue–sensitive plates is from the neighborhood of Kto Hβ (λλ 3920–4900).
The dispersion used (125 A per mm at Hγ) is near the lower limit for the determinationof spectral types and luminosities of high accuracy. The stars of types F5-M can be classifiedwith fair accuracy on slit spectra of lower dispersion, but there is probably a definite decreasein precision if the dispersion is reduced much below 150 A per mm.
The lowest dispersion capable of giving high accuracy for objective–prism spectra isgreater; the limit is probably near 100 A per mm. The minimum dispersion with whichan entirely successful two–dimensional classification on objective–prism plates can be madeis probably near 140 A per mm. This value was arrived at from a study of several platesof exquisite quality taken by Dr. J. Gallo, director of the Astronomical Observatory atTacubaya, Mexico; for plates of ordinary good quality the limit is probably considerablyhigher.
The Atlas and the system it defines are to be taken as a sort of adaptation of workpublished at many observatories over the last fifty years. No claim is made for originality; thesystem and the criteria are those which have evolved from a great number of investigations.Specific references to individual investigations are, as a rule, not given.
By far the most important are those of the investigators at Harvard and Mount Wilson.The idea of a temperature classification is based on the work of Miss Maury and Miss Cannonat Harvard and of Sir Norman Lockyer. We owe to Adams the first complete investigationof luminosity effects in stellar spectra. If we add to this the work of Lindblad on cyanogenand the wings of the Balmer lines in early–type stars and the investigations of the late E. G.Williams, we have the great majority of the results on which the new classification is based.References to individual papers are given in the Handbuch der Astrophysik.
2

The present system depends, then, to a considerable extent on the work of these inves-tigators, combined with data which were not available until recently. These data are of twokinds: accurate color equivalents for many of the brighter stars and accurate absolute mag-nitudes for a number of the same stars. These results have been used to define the system ofclassification more precisely, both in the temperature equivalents and in the luminosity class.The most important of the determinations of color equivalents for this purpose are the photo-electric colors of Bottlinger and of Stebbins and his collaborators and the spectrophotometricresults of the Greenwich Observatory and those of Hall.
The absolute magnitudes used depend on a variety of investigations. There are theclassical catalogue of trigonometric parallaxes of Schlesinger; the catalogue of dynamicalparallaxes of Russell and Miss Moore; various cluster parallaxes, principally due to Trumpler;and, in the case of the stars of earlier class, parallaxes from interstellar line intensities andfrom the effects of galactic rotation.
Throughout the discussion emphasis will be laid on the “normal” stars. A number ofpeculiar objects are noted; but the main aim of the investigation has been to make theclassification of the more frequent, normal stars as precise as possible for the use of thegeneral stellar astronomer. This investigation is not concerned with the astrophysical aspectsof stellar spectra or with the spectra of the dwarfs of low luminosity. Relatively few of thelatter are met with among stars brighter than the eighth magnitude, and their classificationcan be considered as a separate problem.
There appears to be, in a sense, a sort of indefiniteness connected with the determinationof spectral type and luminosity from a simple inspection of a spectrogram. Nothing is mea-sured; no quantitative value is put on any spectral feature. This indefiniteness is, however,only apparent. The observer makes his classification from a variety of considerations–therelative intensity of certain pairs of lines, the extension of the wings of the hydrogen lines,the intensity of a band–even a characteristic irregularity of a number of blended features ina certain spectral region. To make a quantitative measure of these diverse criteria is a dif-ficult and unnecessary undertaking. In essence the process of classification is in recognizingsimilarities in the spectrogram being classified to certain standard spectra.
It is not necessary to make cephalic measures to identify a human face with certaintyor to establish the race to which it belongs; a careful inspection integrates all features in amanner difficult to analyze by measures. The observer himself is not always conscious of allthe bases for his conclusion. The operation of spectral classification is similar. The observermust use good judgment as to the definiteness with which the identification can be madefrom the features available; but good judgment is necessary in any case, whether the decisionis made from the general appearance or from more objective measures.
The problem of a classification according to luminosity is a difficult one. In the first place,lines or blends which may be useful at one spectral type may be quite insensitive at another.In fact, some lines which show a positive absolute–magnitude effect for some spectral classesmay show a negative one for others. This is true for certain lines of H, Sr ii , and Ba ii .
Besides the variation with spectral type, there is also a very marked change in appearancewith the dispersion of the spectrograms used. Some of the most useful indicators of absolutemagnitude are lines and blends which can be used only with low dispersion. The hydrogenlines, for example, show marked variations with absolute magnitude in spectra as early as
3
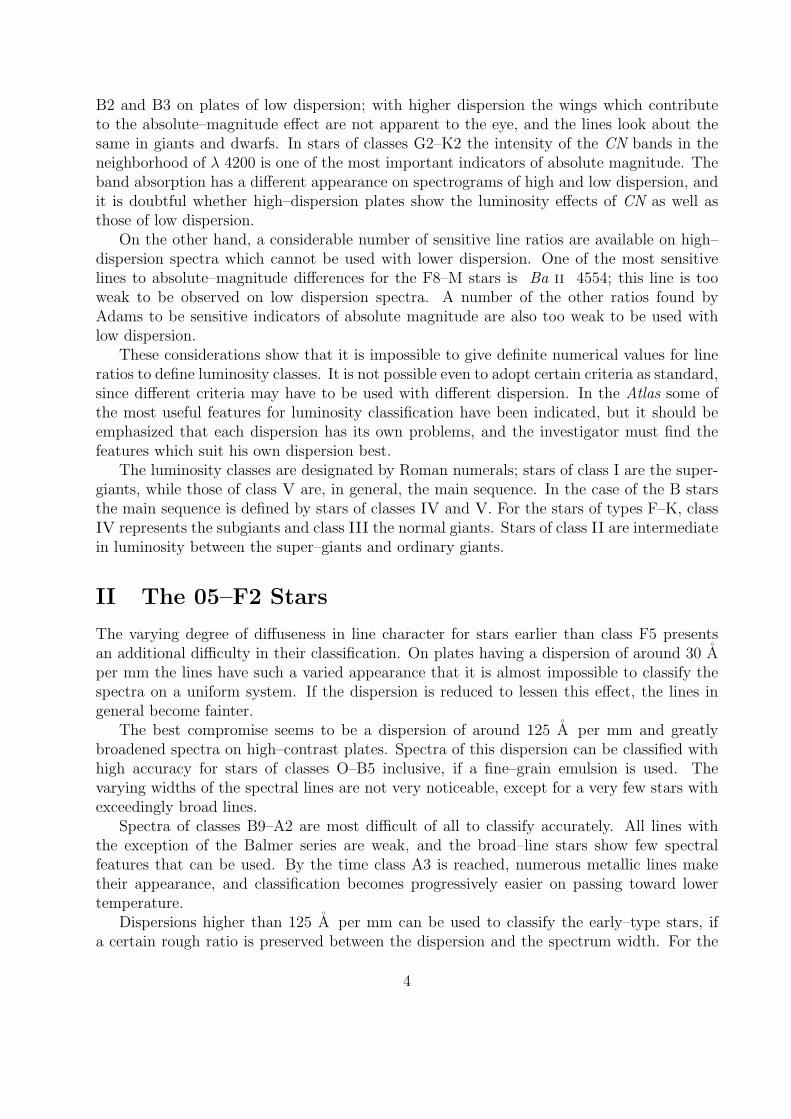
B2 and B3 on plates of low dispersion; with higher dispersion the wings which contributeto the absolute–magnitude effect are not apparent to the eye, and the lines look about thesame in giants and dwarfs. In stars of classes G2–K2 the intensity of the CN bands in theneighborhood of λ 4200 is one of the most important indicators of absolute magnitude. Theband absorption has a different appearance on spectrograms of high and low dispersion, andit is doubtful whether high–dispersion plates show the luminosity effects of CN as well asthose of low dispersion.
On the other hand, a considerable number of sensitive line ratios are available on high–dispersion spectra which cannot be used with lower dispersion. One of the most sensitivelines to absolute–magnitude differences for the F8–M stars is Ba ii 4554; this line is tooweak to be observed on low dispersion spectra. A number of the other ratios found byAdams to be sensitive indicators of absolute magnitude are also too weak to be used withlow dispersion.
These considerations show that it is impossible to give definite numerical values for lineratios to define luminosity classes. It is not possible even to adopt certain criteria as standard,since different criteria may have to be used with different dispersion. In the Atlas some ofthe most useful features for luminosity classification have been indicated, but it should beemphasized that each dispersion has its own problems, and the investigator must find thefeatures which suit his own dispersion best.
The luminosity classes are designated by Roman numerals; stars of class I are the super-giants, while those of class V are, in general, the main sequence. In the case of the B starsthe main sequence is defined by stars of classes IV and V. For the stars of types F–K, classIV represents the subgiants and class III the normal giants. Stars of class II are intermediatein luminosity between the super–giants and ordinary giants.
II The 05–F2 Stars
The varying degree of diffuseness in line character for stars earlier than class F5 presentsan additional difficulty in their classification. On plates having a dispersion of around 30 Aper mm the lines have such a varied appearance that it is almost impossible to classify thespectra on a uniform system. If the dispersion is reduced to lessen this effect, the lines ingeneral become fainter.
The best compromise seems to be a dispersion of around 125 A per mm and greatlybroadened spectra on high–contrast plates. Spectra of this dispersion can be classified withhigh accuracy for stars of classes O–B5 inclusive, if a fine–grain emulsion is used. Thevarying widths of the spectral lines are not very noticeable, except for a very few stars withexceedingly broad lines.
Spectra of classes B9–A2 are most difficult of all to classify accurately. All lines withthe exception of the Balmer series are weak, and the broad–line stars show few spectralfeatures that can be used. By the time class A3 is reached, numerous metallic lines maketheir appearance, and classification becomes progressively easier on passing toward lowertemperature.
Dispersions higher than 125 A per mm can be used to classify the early–type stars, ifa certain rough ratio is preserved between the dispersion and the spectrum width. For the
4

highest accuracy the width of the spectrum should be about one–third the distance betweenHγ and Hδ. With plates of higher dispersion a corresponding reduction in the magnifyingpower of the viewing eyepiece should be made. For spectra later than F0 a width of aboutone–sixth the distance between Hγ and Hδ is sufficient, unless the dispersion is less than125 A per mm. Wide spectra for the late–type stars allow the use of the G band and otherimportant blended features. The advantage of using broad spectra is somewhat similar tothat of extra–focal images in stellar photometry.
1 The O Stars
Star SpMKK SpHHP α δ m HD Notesζ Pup O5 . . . 08:00 −39◦43′ 2.3 Od9 Sgr O5 O5 17:57 −24 22 5.9 Oe5 1
λ Cep O6 O6 22:08 +58 55 5.2 OdHD 5005 O6 . . . 00:47 +56 05 7.7 B2 1
θ1 Ori C O6 O7 05:30 −05 27 5.4 Oe5 2
HD 165052 O7 O6 17:50 −24 24 6.8 Oe5 1
S Mon O7 O7 06:35 +09 59 4.7 Oe5ξ Per O7 . . . 03:52 +35 30 4.1 Oe5λ Ori A O8 O8 05:29 +09 52 3.7 Oe5ι Ori O9 V O9 05:30 −05 59 2.9 Oe5 3
10 Lac O9 V O9 22:34 +38 32 4.9 Oe5 3
HD 188209 O9 I . . . 19:49 +46 47 5.5 B0 4
HD 218915 O9 I . . . 23:06 +52 31 7.1 B0 4
1No emission lines visible on low–dispersion spectrograms. He ii 4686 is much stronger than λ 4650.2The H lines are abnormally broad in comparison to other absorption lines.3Main–sequence star. Luminosity differences at O9 are shown by the following ratios: λ 4068:λ 4089, λ
4387:λ 4541, and λ 4650:λ 4686.4O–type supergiants.
Table 1: Classification of the O Stars
No luminosity classification has been attempted for stars earlier than O9. The spectral typehas been determined from the ratio He i 4471: He ii 4541. The types determined from thisratio appear to be consistent with the appearance of other spectral features in a sequenceof effective excitation. The types obtained in this manner are in very close agreement withthose determined by H. H. Plaskett.1
If the spectral types of the O stars are determined from the single ratio of the absorptionlines He i 4471: He ii 4541, results accurate to a tenth of a class between O5 and O9can be obtained on plates of the dispersion used (125 A per mm at Hγ). This single ratioappears to be the most useful criterion of spectral type for O5–O9 stars on spectra similarto those used. The classification of the Wolf–Rayet stars as a group will not be discussed;
1Pub.Dom.Ap.Obs.,I,365,1922.
5
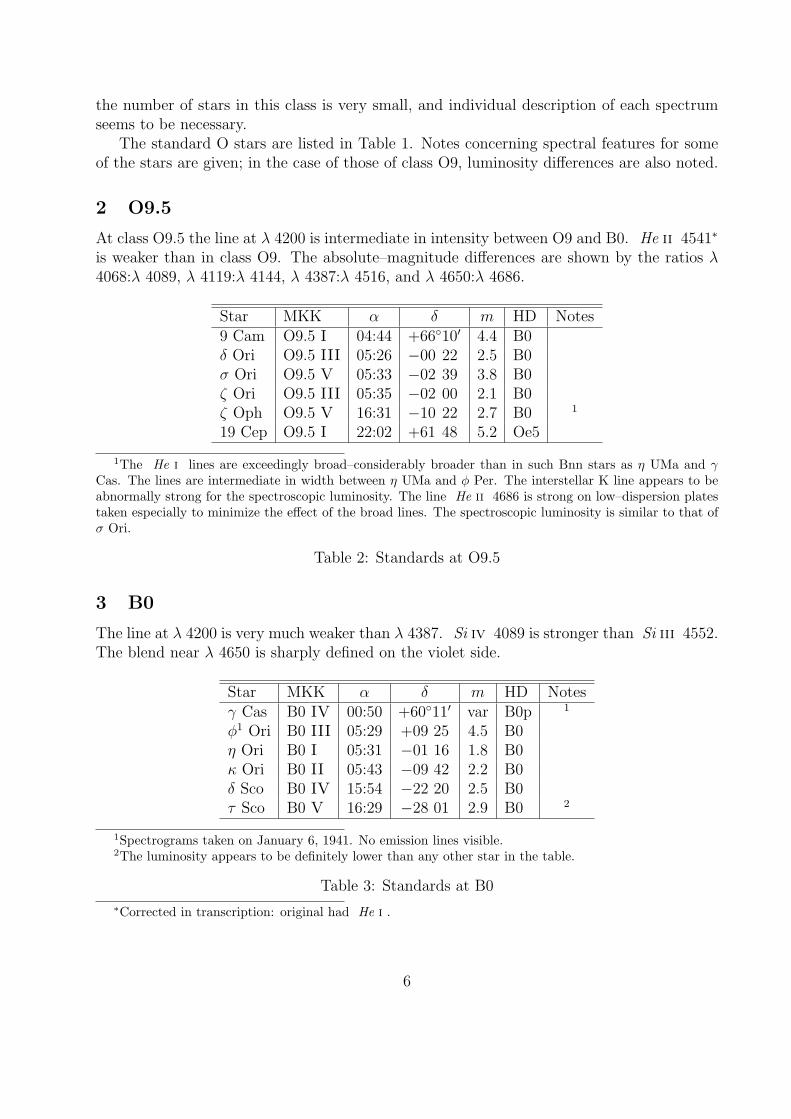
the number of stars in this class is very small, and individual description of each spectrumseems to be necessary.
The standard O stars are listed in Table 1. Notes concerning spectral features for someof the stars are given; in the case of those of class O9, luminosity differences are also noted.
2 O9.5
At class O9.5 the line at λ 4200 is intermediate in intensity between O9 and B0. He ii 4541∗
is weaker than in class O9. The absolute–magnitude differences are shown by the ratios λ4068:λ 4089, λ 4119:λ 4144, λ 4387:λ 4516, and λ 4650:λ 4686.
Star MKK α δ m HD Notes9 Cam O9.5 I 04:44 +66◦10′ 4.4 B0δ Ori O9.5 III 05:26 −00 22 2.5 B0σ Ori O9.5 V 05:33 −02 39 3.8 B0ζ Ori O9.5 III 05:35 −02 00 2.1 B0ζ Oph O9.5 V 16:31 −10 22 2.7 B0 1
19 Cep O9.5 I 22:02 +61 48 5.2 Oe5
1The He i lines are exceedingly broad–considerably broader than in such Bnn stars as η UMa and γCas. The lines are intermediate in width between η UMa and φ Per. The interstellar K line appears to beabnormally strong for the spectroscopic luminosity. The line He ii 4686 is strong on low–dispersion platestaken especially to minimize the effect of the broad lines. The spectroscopic luminosity is similar to that ofσ Ori.
Table 2: Standards at O9.5
3 B0
The line at λ 4200 is very much weaker than λ 4387. Si iv 4089 is stronger than Si iii 4552.The blend near λ 4650 is sharply defined on the violet side.
Star MKK α δ m HD Notesγ Cas B0 IV 00:50 +60◦11′ var B0p 1
φ1 Ori B0 III 05:29 +09 25 4.5 B0η Ori B0 I 05:31 −01 16 1.8 B0κ Ori B0 II 05:43 −09 42 2.2 B0δ Sco B0 IV 15:54 −22 20 2.5 B0τ Sco B0 V 16:29 −28 01 2.9 B0 2
1Spectrograms taken on January 6, 1941. No emission lines visible.2The luminosity appears to be definitely lower than any other star in the table.
Table 3: Standards at B0
∗Corrected in transcription: original had He i .
6
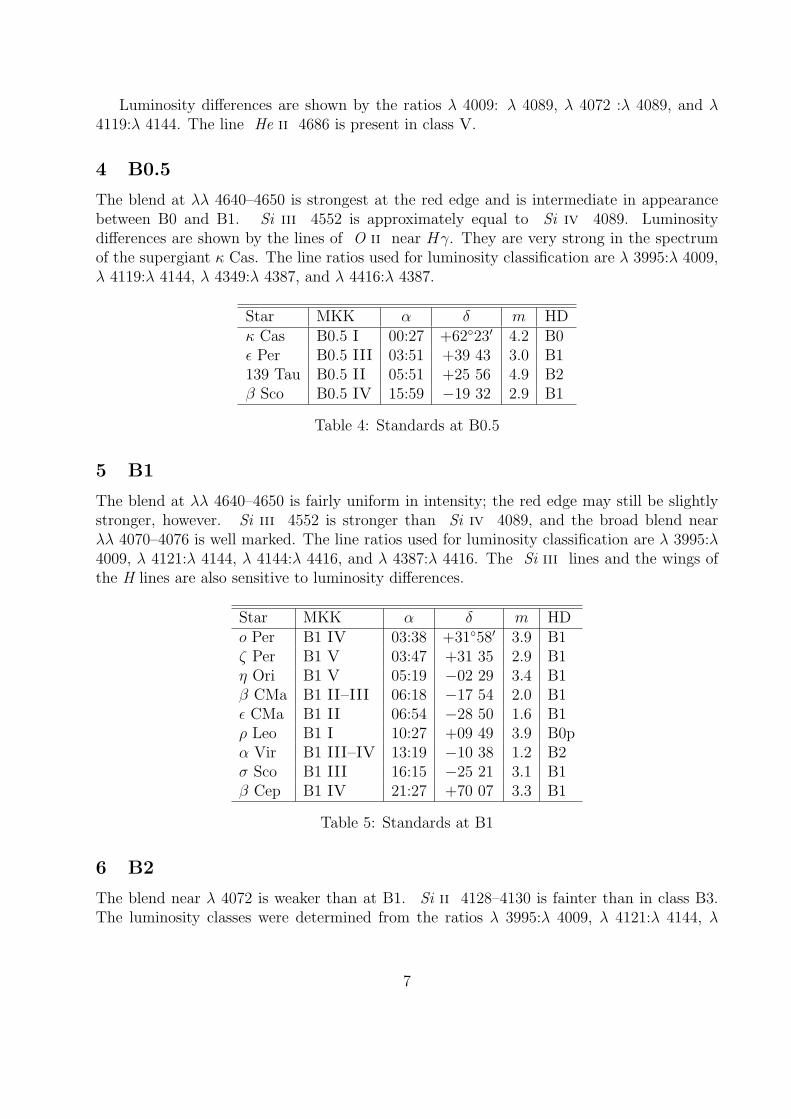
Luminosity differences are shown by the ratios λ 4009: λ 4089, λ 4072 :λ 4089, and λ4119:λ 4144. The line He ii 4686 is present in class V.
4 B0.5
The blend at λλ 4640–4650 is strongest at the red edge and is intermediate in appearancebetween B0 and B1. Si iii 4552 is approximately equal to Si iv 4089. Luminositydifferences are shown by the lines of O ii near Hγ. They are very strong in the spectrumof the supergiant κ Cas. The line ratios used for luminosity classification are λ 3995:λ 4009,λ 4119:λ 4144, λ 4349:λ 4387, and λ 4416:λ 4387.
Star MKK α δ m HDκ Cas B0.5 I 00:27 +62◦23′ 4.2 B0ε Per B0.5 III 03:51 +39 43 3.0 B1139 Tau B0.5 II 05:51 +25 56 4.9 B2β Sco B0.5 IV 15:59 −19 32 2.9 B1
Table 4: Standards at B0.5
5 B1
The blend at λλ 4640–4650 is fairly uniform in intensity; the red edge may still be slightlystronger, however. Si iii 4552 is stronger than Si iv 4089, and the broad blend nearλλ 4070–4076 is well marked. The line ratios used for luminosity classification are λ 3995:λ4009, λ 4121:λ 4144, λ 4144:λ 4416, and λ 4387:λ 4416. The Si iii lines and the wings ofthe H lines are also sensitive to luminosity differences.
Star MKK α δ m HDo Per B1 IV 03:38 +31◦58′ 3.9 B1ζ Per B1 V 03:47 +31 35 2.9 B1η Ori B1 V 05:19 −02 29 3.4 B1β CMa B1 II–III 06:18 −17 54 2.0 B1ε CMa B1 II 06:54 −28 50 1.6 B1ρ Leo B1 I 10:27 +09 49 3.9 B0pα Vir B1 III–IV 13:19 −10 38 1.2 B2σ Sco B1 III 16:15 −25 21 3.1 B1β Cep B1 IV 21:27 +70 07 3.3 B1
Table 5: Standards at B1
6 B2
The blend near λ 4072 is weaker than at B1. Si ii 4128–4130 is fainter than in class B3.The luminosity classes were determined from the ratios λ 3995:λ 4009, λ 4121:λ 4144, λ
7
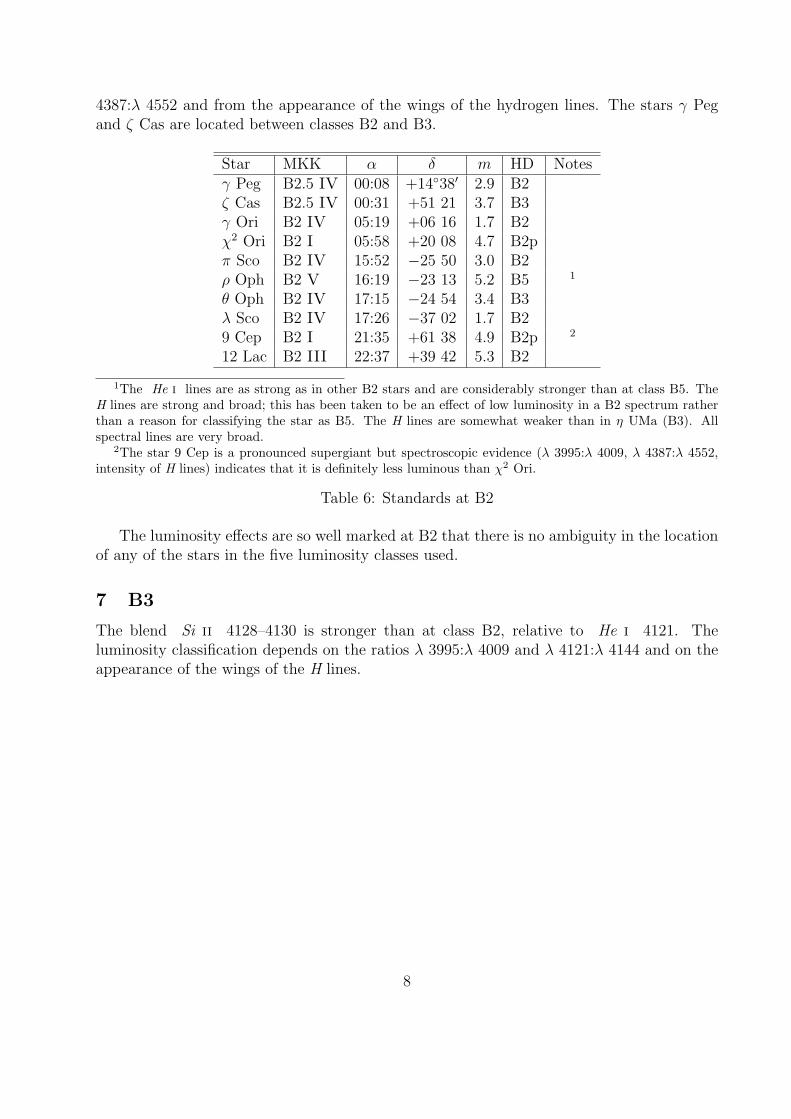
4387:λ 4552 and from the appearance of the wings of the hydrogen lines. The stars γ Pegand ζ Cas are located between classes B2 and B3.
Star MKK α δ m HD Notesγ Peg B2.5 IV 00:08 +14◦38′ 2.9 B2ζ Cas B2.5 IV 00:31 +51 21 3.7 B3γ Ori B2 IV 05:19 +06 16 1.7 B2χ2 Ori B2 I 05:58 +20 08 4.7 B2pπ Sco B2 IV 15:52 −25 50 3.0 B2ρ Oph B2 V 16:19 −23 13 5.2 B5 1
θ Oph B2 IV 17:15 −24 54 3.4 B3λ Sco B2 IV 17:26 −37 02 1.7 B29 Cep B2 I 21:35 +61 38 4.9 B2p 2
12 Lac B2 III 22:37 +39 42 5.3 B2
1The He i lines are as strong as in other B2 stars and are considerably stronger than at class B5. TheH lines are strong and broad; this has been taken to be an effect of low luminosity in a B2 spectrum ratherthan a reason for classifying the star as B5. The H lines are somewhat weaker than in η UMa (B3). Allspectral lines are very broad.
2The star 9 Cep is a pronounced supergiant but spectroscopic evidence (λ 3995:λ 4009, λ 4387:λ 4552,intensity of H lines) indicates that it is definitely less luminous than χ2 Ori.
Table 6: Standards at B2
The luminosity effects are so well marked at B2 that there is no ambiguity in the locationof any of the stars in the five luminosity classes used.
7 B3
The blend Si ii 4128–4130 is stronger than at class B2, relative to He i 4121. Theluminosity classification depends on the ratios λ 3995:λ 4009 and λ 4121:λ 4144 and on theappearance of the wings of the H lines.
8
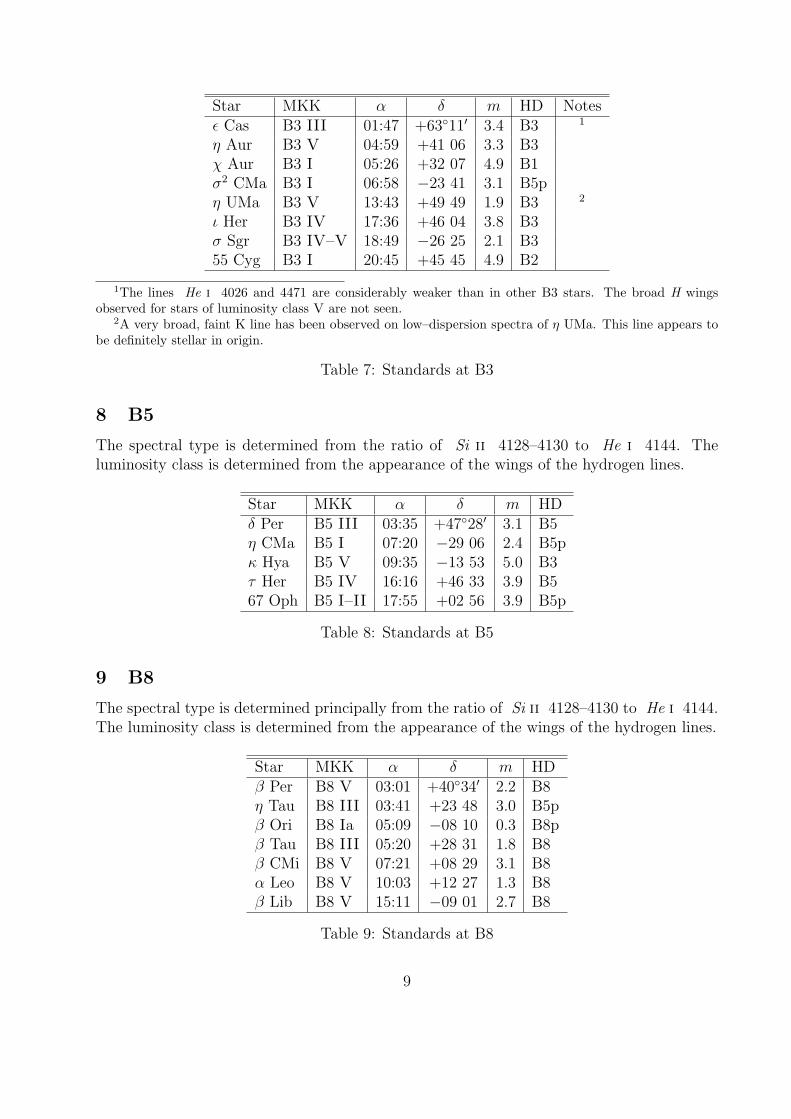
Star MKK α δ m HD Notesε Cas B3 III 01:47 +63◦11′ 3.4 B3 1
η Aur B3 V 04:59 +41 06 3.3 B3χ Aur B3 I 05:26 +32 07 4.9 B1σ2 CMa B3 I 06:58 −23 41 3.1 B5pη UMa B3 V 13:43 +49 49 1.9 B3 2
ι Her B3 IV 17:36 +46 04 3.8 B3σ Sgr B3 IV–V 18:49 −26 25 2.1 B355 Cyg B3 I 20:45 +45 45 4.9 B2
1The lines He i 4026 and 4471 are considerably weaker than in other B3 stars. The broad H wingsobserved for stars of luminosity class V are not seen.
2A very broad, faint K line has been observed on low–dispersion spectra of η UMa. This line appears tobe definitely stellar in origin.
Table 7: Standards at B3
8 B5
The spectral type is determined from the ratio of Si ii 4128–4130 to He i 4144. Theluminosity class is determined from the appearance of the wings of the hydrogen lines.
Star MKK α δ m HDδ Per B5 III 03:35 +47◦28′ 3.1 B5η CMa B5 I 07:20 −29 06 2.4 B5pκ Hya B5 V 09:35 −13 53 5.0 B3τ Her B5 IV 16:16 +46 33 3.9 B567 Oph B5 I–II 17:55 +02 56 3.9 B5p
Table 8: Standards at B5
9 B8
The spectral type is determined principally from the ratio of Si ii 4128–4130 to He i 4144.The luminosity class is determined from the appearance of the wings of the hydrogen lines.
Star MKK α δ m HDβ Per B8 V 03:01 +40◦34′ 2.2 B8η Tau B8 III 03:41 +23 48 3.0 B5pβ Ori B8 Ia 05:09 −08 10 0.3 B8pβ Tau B8 III 05:20 +28 31 1.8 B8β CMi B8 V 07:21 +08 29 3.1 B8α Leo B8 V 10:03 +12 27 1.3 B8β Lib B8 V 15:11 −09 01 2.7 B8
Table 9: Standards at B8
9
10 The Spectrum of ζ Draconis
From the lines of He i , Mg ii , and Si ii the spectral type would be judged to beB8. The Balmer lines are very peculiar; they are weak but do not have the sharp–edgedappearance associated with high luminosity. A superficial examination might indicate thatthe star belongs in luminosity class II at B8. A comparison with the A0 Ib star η Leo shows,however, that the shape of the Balmer lines–in particular Hδ and Hε is not similar to a high–luminosity star; the contours of the H lines are more nearly like those in an early B–typedwarf. The trigonometric parallax of ζ Dra is 0.′′039± 7 (two modern determinations). Theabsolute magnitude is probably fainter than zero, and it is likely that the star lies somewhatbelow the main sequence.
11 The A Stars
Of all spectral types from B to M the stars of class A are the most difficult to classify. Thespectral lines are weak and may be greatly broadened; in addition, the frequency with whichpeculiar spectra are encountered makes any sort of accurate classification a difficult problem.
When spectra of very low dispersion are used, the classification seems to be a rather simplematter. If the c–stars and peculiar objects are omitted from consideration, the growth ofK with respect to the hydrogen lines from B9 to F0 appears to be smooth and rapid and asensitive criterion of spectral type. When spectra of higher dispersion are examined, however,it is seen that the intensity of K is by no means a unique indicator of spectral type. Stars arefrequently encountered whose spectra have many characteristics of class F, while the K lineindicates a class of A2 or A3. To make the problem even more difficult, it appears that thecolors of these stars are in disagreement with the type derived from the K line and probablycorrespond to the later class indicated by certain other spectral features.
From investigations of several galactic clusters by Titus it appears that these pseudocom-posite spectra may have a high space frequency and a corresponding importance in problemsof stellar astronomy. As the problem of their classification is of considerable importance, thespectra of several of the brightest objects of this class will be described in detail later.
In addition to these “metallic–line” A stars, there are several other groups of peculiarspectra. Stars of these classes form only a small fraction of the total, and their peculiaritiescan be recognized in general on low-dispersion spectrograms. It is possible, then, to eliminatethem from problems in which mean absolute magnitudes or color indices are used.
The B9–F0 stars have been reclassified with the particular object of obtaining as purea temperature sequence as is possible. In the early A subdivisions the general increase inintensity of the enhanced lines of iron and titanium appears to be closely correlated withcolor, while for the later subdivisions the Mn i blend near λ 4032 appears to be the mostuseful index of type on spectrograms of the dispersion used. The supergiants are discussedin another place.
12 B9
The line He i 4026 is weaker relative to K than in class B8. He i 4471 is considerablyfainter than Mg ii 4481. The luminosity classification is based on the appearance of the
10
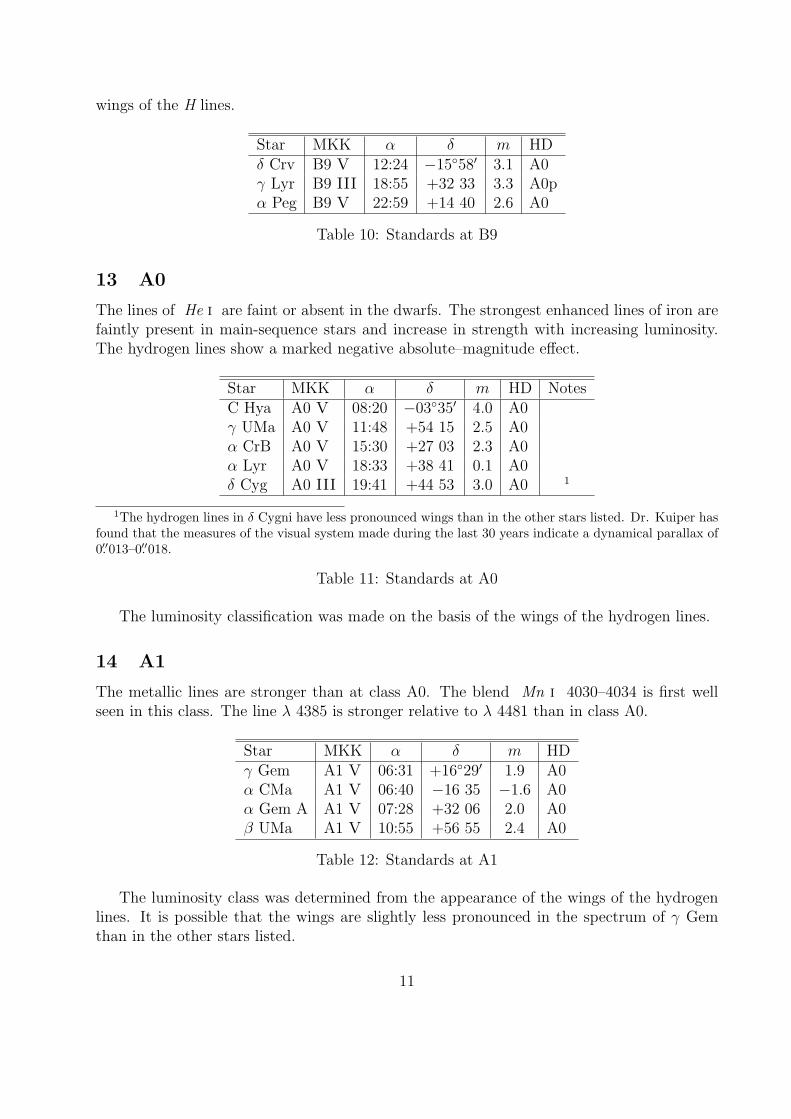
wings of the H lines.
Star MKK α δ m HDδ Crv B9 V 12:24 −15◦58′ 3.1 A0γ Lyr B9 III 18:55 +32 33 3.3 A0pα Peg B9 V 22:59 +14 40 2.6 A0
Table 10: Standards at B9
13 A0
The lines of He i are faint or absent in the dwarfs. The strongest enhanced lines of iron arefaintly present in main-sequence stars and increase in strength with increasing luminosity.The hydrogen lines show a marked negative absolute–magnitude effect.
Star MKK α δ m HD NotesC Hya A0 V 08:20 −03◦35′ 4.0 A0γ UMa A0 V 11:48 +54 15 2.5 A0α CrB A0 V 15:30 +27 03 2.3 A0α Lyr A0 V 18:33 +38 41 0.1 A0δ Cyg A0 III 19:41 +44 53 3.0 A0 1
1The hydrogen lines in δ Cygni have less pronounced wings than in the other stars listed. Dr. Kuiper hasfound that the measures of the visual system made during the last 30 years indicate a dynamical parallax of0.′′013–0.′′018.
Table 11: Standards at A0
The luminosity classification was made on the basis of the wings of the hydrogen lines.
14 A1
The metallic lines are stronger than at class A0. The blend Mn i 4030–4034 is first wellseen in this class. The line λ 4385 is stronger relative to λ 4481 than in class A0.
Star MKK α δ m HDγ Gem A1 V 06:31 +16◦29′ 1.9 A0α CMa A1 V 06:40 −16 35 −1.6 A0α Gem A A1 V 07:28 +32 06 2.0 A0β UMa A1 V 10:55 +56 55 2.4 A0
Table 12: Standards at A1
The luminosity class was determined from the appearance of the wings of the hydrogenlines. It is possible that the wings are slightly less pronounced in the spectrum of γ Gemthan in the other stars listed.
11
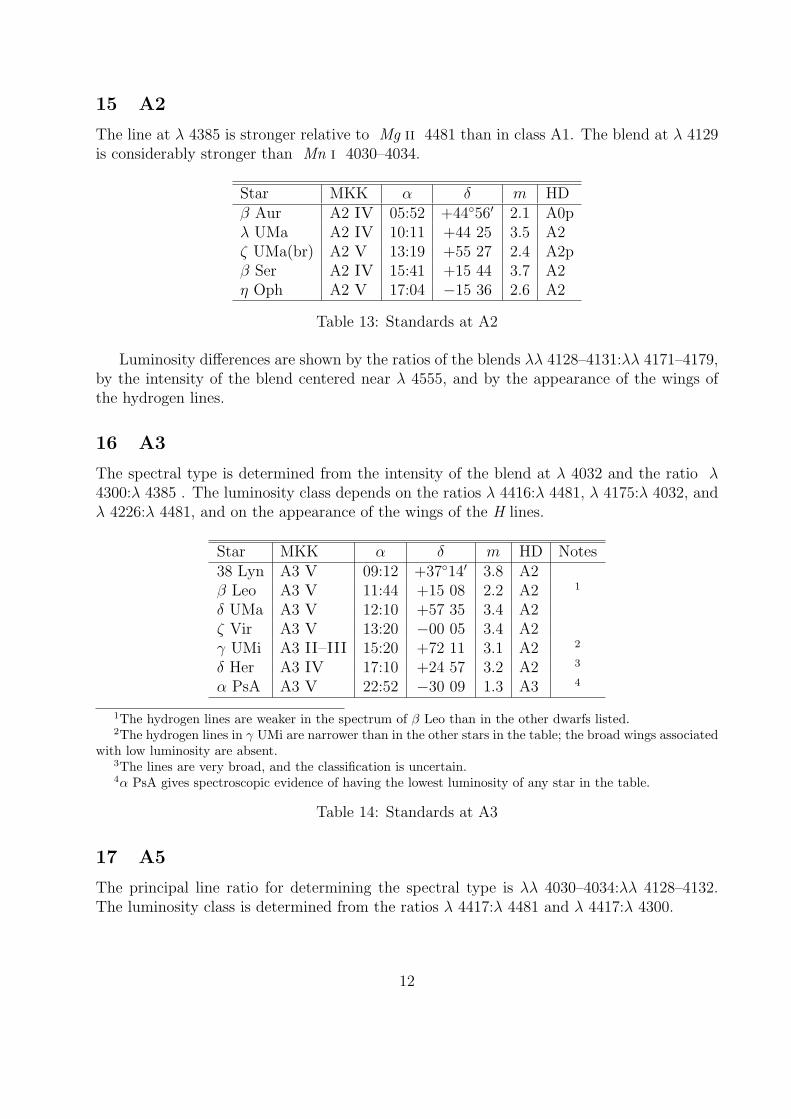
15 A2
The line at λ 4385 is stronger relative to Mg ii 4481 than in class A1. The blend at λ 4129is considerably stronger than Mn i 4030–4034.
Star MKK α δ m HDβ Aur A2 IV 05:52 +44◦56′ 2.1 A0pλ UMa A2 IV 10:11 +44 25 3.5 A2ζ UMa(br) A2 V 13:19 +55 27 2.4 A2pβ Ser A2 IV 15:41 +15 44 3.7 A2η Oph A2 V 17:04 −15 36 2.6 A2
Table 13: Standards at A2
Luminosity differences are shown by the ratios of the blends λλ 4128–4131:λλ 4171–4179,by the intensity of the blend centered near λ 4555, and by the appearance of the wings ofthe hydrogen lines.
16 A3
The spectral type is determined from the intensity of the blend at λ 4032 and the ratio λ4300:λ 4385 . The luminosity class depends on the ratios λ 4416:λ 4481, λ 4175:λ 4032, andλ 4226:λ 4481, and on the appearance of the wings of the H lines.
Star MKK α δ m HD Notes38 Lyn A3 V 09:12 +37◦14′ 3.8 A2β Leo A3 V 11:44 +15 08 2.2 A2 1
δ UMa A3 V 12:10 +57 35 3.4 A2ζ Vir A3 V 13:20 −00 05 3.4 A2γ UMi A3 II–III 15:20 +72 11 3.1 A2 2
δ Her A3 IV 17:10 +24 57 3.2 A2 3
α PsA A3 V 22:52 −30 09 1.3 A3 4
1The hydrogen lines are weaker in the spectrum of β Leo than in the other dwarfs listed.2The hydrogen lines in γ UMi are narrower than in the other stars in the table; the broad wings associated
with low luminosity are absent.3The lines are very broad, and the classification is uncertain.4α PsA gives spectroscopic evidence of having the lowest luminosity of any star in the table.
Table 14: Standards at A3
17 A5
The principal line ratio for determining the spectral type is λλ 4030–4034:λλ 4128–4132.The luminosity class is determined from the ratios λ 4417:λ 4481 and λ 4417:λ 4300.
12
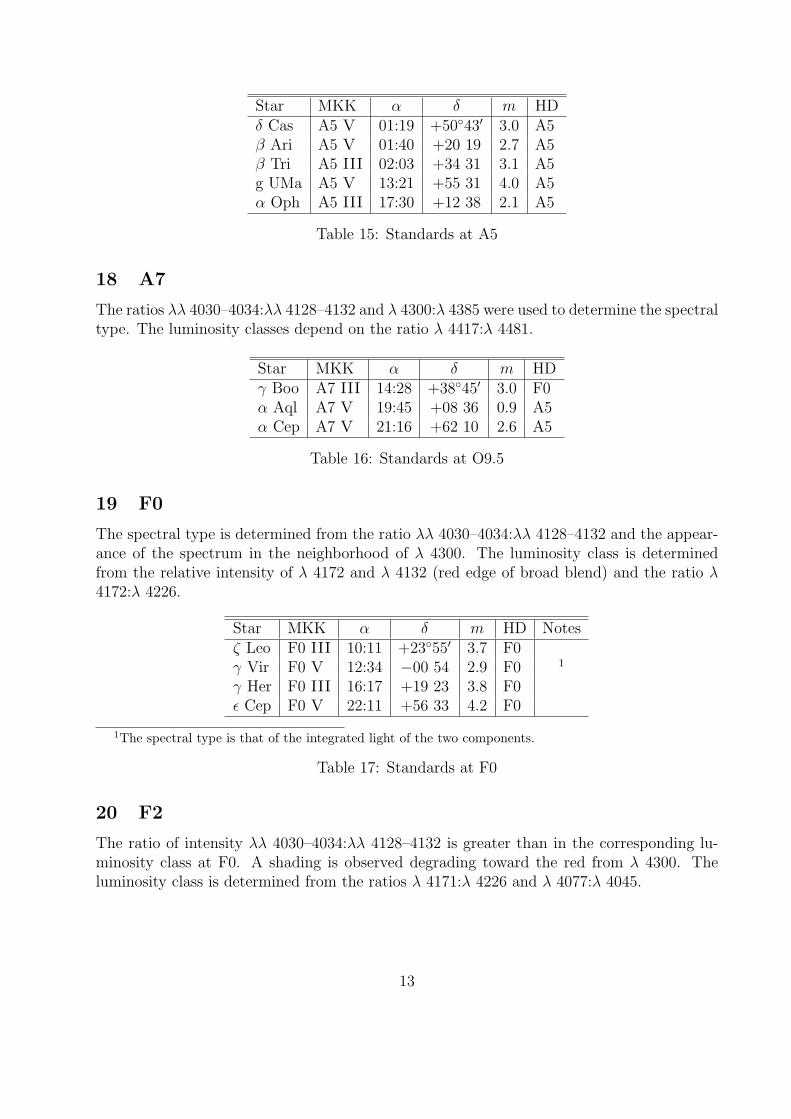
Star MKK α δ m HDδ Cas A5 V 01:19 +50◦43′ 3.0 A5β Ari A5 V 01:40 +20 19 2.7 A5β Tri A5 III 02:03 +34 31 3.1 A5g UMa A5 V 13:21 +55 31 4.0 A5α Oph A5 III 17:30 +12 38 2.1 A5
Table 15: Standards at A5
18 A7
The ratios λλ 4030–4034:λλ 4128–4132 and λ 4300:λ 4385 were used to determine the spectraltype. The luminosity classes depend on the ratio λ 4417:λ 4481.
Star MKK α δ m HDγ Boo A7 III 14:28 +38◦45′ 3.0 F0α Aql A7 V 19:45 +08 36 0.9 A5α Cep A7 V 21:16 +62 10 2.6 A5
Table 16: Standards at O9.5
19 F0
The spectral type is determined from the ratio λλ 4030–4034:λλ 4128–4132 and the appear-ance of the spectrum in the neighborhood of λ 4300. The luminosity class is determinedfrom the relative intensity of λ 4172 and λ 4132 (red edge of broad blend) and the ratio λ4172:λ 4226.
Star MKK α δ m HD Notesζ Leo F0 III 10:11 +23◦55′ 3.7 F0γ Vir F0 V 12:34 −00 54 2.9 F0 1
γ Her F0 III 16:17 +19 23 3.8 F0ε Cep F0 V 22:11 +56 33 4.2 F0
1The spectral type is that of the integrated light of the two components.
Table 17: Standards at F0
20 F2
The ratio of intensity λλ 4030–4034:λλ 4128–4132 is greater than in the corresponding lu-minosity class at F0. A shading is observed degrading toward the red from λ 4300. Theluminosity class is determined from the ratios λ 4171:λ 4226 and λ 4077:λ 4045.
13
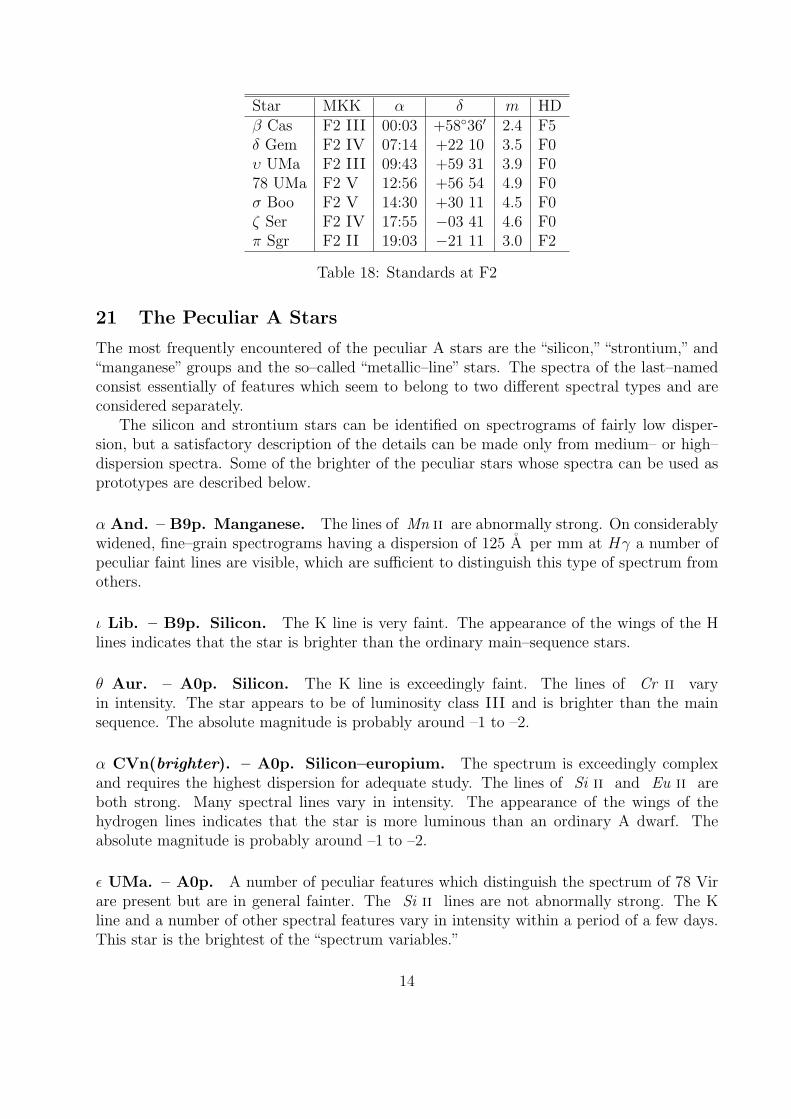
Star MKK α δ m HDβ Cas F2 III 00:03 +58◦36′ 2.4 F5δ Gem F2 IV 07:14 +22 10 3.5 F0υ UMa F2 III 09:43 +59 31 3.9 F078 UMa F2 V 12:56 +56 54 4.9 F0σ Boo F2 V 14:30 +30 11 4.5 F0ζ Ser F2 IV 17:55 −03 41 4.6 F0π Sgr F2 II 19:03 −21 11 3.0 F2
Table 18: Standards at F2
21 The Peculiar A Stars
The most frequently encountered of the peculiar A stars are the “silicon,”“strontium,” and“manganese” groups and the so–called “metallic–line” stars. The spectra of the last–namedconsist essentially of features which seem to belong to two different spectral types and areconsidered separately.
The silicon and strontium stars can be identified on spectrograms of fairly low disper-sion, but a satisfactory description of the details can be made only from medium– or high–dispersion spectra. Some of the brighter of the peculiar stars whose spectra can be used asprototypes are described below.
α And. – B9p. Manganese. The lines of Mn ii are abnormally strong. On considerablywidened, fine–grain spectrograms having a dispersion of 125 A per mm at Hγ a number ofpeculiar faint lines are visible, which are sufficient to distinguish this type of spectrum fromothers.
ι Lib. – B9p. Silicon. The K line is very faint. The appearance of the wings of the Hlines indicates that the star is brighter than the ordinary main–sequence stars.
θ Aur. – A0p. Silicon. The K line is exceedingly faint. The lines of Cr ii varyin intensity. The star appears to be of luminosity class III and is brighter than the mainsequence. The absolute magnitude is probably around –1 to –2.
α CVn(brighter). – A0p. Silicon–europium. The spectrum is exceedingly complexand requires the highest dispersion for adequate study. The lines of Si ii and Eu ii areboth strong. Many spectral lines vary in intensity. The appearance of the wings of thehydrogen lines indicates that the star is more luminous than an ordinary A dwarf. Theabsolute magnitude is probably around –1 to –2.
ε UMa. – A0p. A number of peculiar features which distinguish the spectrum of 78 Virare present but are in general fainter. The Si ii lines are not abnormally strong. The Kline and a number of other spectral features vary in intensity within a period of a few days.This star is the brightest of the “spectrum variables.”
14
17 Com. – A2p. Chromium–europium. The spectrum is similar to 78 Vir. The Kline is weak. The star is a member of the Coma cluster.
78 Vir. – Chromium–europium. The general level of excitation corresponds roughlyto an A2 star. There may be a faint, broad K line superposed over the sharp component.The blended feature at λ 4171, indicative of strong Cr ii , is outstanding on spectrogramsof low dispersion. Si ii is weak; the blend at λ 4I28–λ 4132 is not due principally to Siii but is indicative of a “europium star.” The K line is weak. 78 Vir is a member of the UrsaMajor cluster.
73 Dra. – Ap. Strontium–europium–chromium. A number of the lines, including λ4077 and λ 4215, are variable in intensity. The K line is about as strong as in a normal B8spectrum. The effective excitation is considerably lower than in α CVn and the spectrum iscrowded with metallic lines.
ι Cas. – A5p. Strontium.
γ Cap. – Strontium. The spectrum can be classified as near F0 III. The strontium lineat λ 4077 is abnormally strong but not so strong as in γ Equ. In both spectra the lineis stronger than in any normal luminosity class at F0. There is no well–marked absolute–magnitude effect for λ 4077 at F0; this is near the place at which the effect changes from anegative one (early A–stars) to the strongly positive one observed in the F5–M stars.
γ Equ. – Strontium–europium. The type is near F0, but the spectrum is so peculiarthat a luminosity class cannot be determined. The Sr ii lines λ 4077 and λ 4215 arestronger than in any other F0 star observed at Yerkes. This should not, however, be takenas evidence of high luminosity, since Sr ii is insensitive to luminosity changes near F0 andmore sensitive lines do not indicate that the star is a supergiant. The blend at λλ 4128–4132is strong, but this is not due to Si ii . In stars later than A0 it appears to be indicative ofthe presence of Eu ii .
β CrB. – Chromium–europium. The spectral type is near F0, but the spectrum isso peculiar that no luminosity class can be estimated. The blend at λλ 4128–4132 is verystrong; this appears to be indicative of strong Eu ii and not of abnormal strength of the Siii doublet. The blend at λ 4171 is strong; this is an indication of abnormal strength of Crii . A considerable amount of the intensity of the line near λ 4077 is due to blended lines ofCr ii . The lines of Eu ii may be stronger than in any other bright star, with the possibleexception of the spectrum–variable HR 5355.
Generalities. The manganese stars appear to be present at B8–B9, the silicon stars atB9–A0, the europium stars at A0–F0, and the strontium stars at A0–F0. These groups canall be identified on low-dispersion spectrograms, but any kind of detailed discussion requireshigher dispersion. The bright silicon stars observed at Yerkes appear to be around, 1 or 2
15
mag. above the main sequence at B9 and A0. All the peculiar groups of stars lie near classA, and an association with the maximum intensity of the hydrogen lines is suggested.
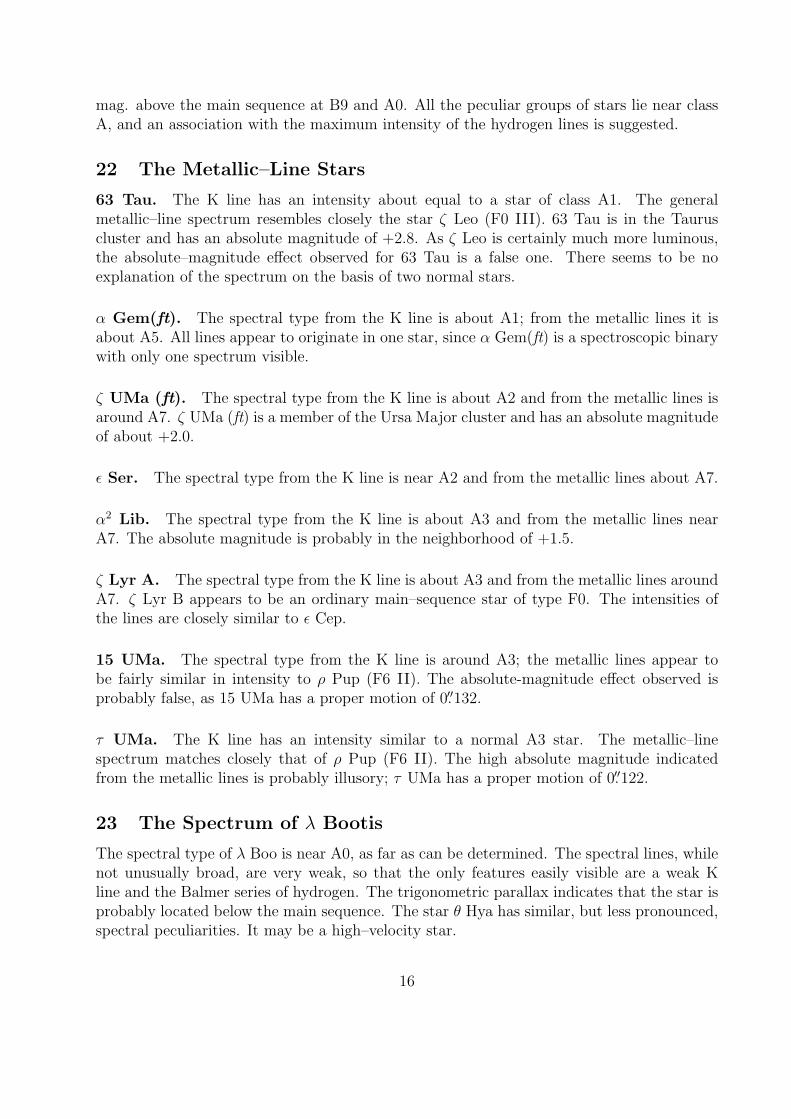
22 The Metallic–Line Stars
63 Tau. The K line has an intensity about equal to a star of class A1. The generalmetallic–line spectrum resembles closely the star ζ Leo (F0 III). 63 Tau is in the Tauruscluster and has an absolute magnitude of +2.8. As ζ Leo is certainly much more luminous,the absolute–magnitude effect observed for 63 Tau is a false one. There seems to be noexplanation of the spectrum on the basis of two normal stars.
α Gem(ft). The spectral type from the K line is about A1; from the metallic lines it isabout A5. All lines appear to originate in one star, since α Gem(ft) is a spectroscopic binarywith only one spectrum visible.
ζ UMa (ft). The spectral type from the K line is about A2 and from the metallic lines isaround A7. ζ UMa (ft) is a member of the Ursa Major cluster and has an absolute magnitudeof about +2.0.
ε Ser. The spectral type from the K line is near A2 and from the metallic lines about A7.
α2 Lib. The spectral type from the K line is about A3 and from the metallic lines nearA7. The absolute magnitude is probably in the neighborhood of +1.5.
ζ Lyr A. The spectral type from the K line is about A3 and from the metallic lines aroundA7. ζ Lyr B appears to be an ordinary main–sequence star of type F0. The intensities ofthe lines are closely similar to ε Cep.
15 UMa. The spectral type from the K line is around A3; the metallic lines appear tobe fairly similar in intensity to ρ Pup (F6 II). The absolute-magnitude effect observed isprobably false, as 15 UMa has a proper motion of 0.′′132.
τ UMa. The K line has an intensity similar to a normal A3 star. The metallic–linespectrum matches closely that of ρ Pup (F6 II). The high absolute magnitude indicatedfrom the metallic lines is probably illusory; τ UMa has a proper motion of 0.′′122.
23 The Spectrum of λ Bootis
The spectral type of λ Boo is near A0, as far as can be determined. The spectral lines, whilenot unusually broad, are very weak, so that the only features easily visible are a weak Kline and the Balmer series of hydrogen. The trigonometric parallax indicates that the star isprobably located below the main sequence. The star θ Hya has similar, but less pronounced,spectral peculiarities. It may be a high–velocity star.
16
III The F5–M Stars
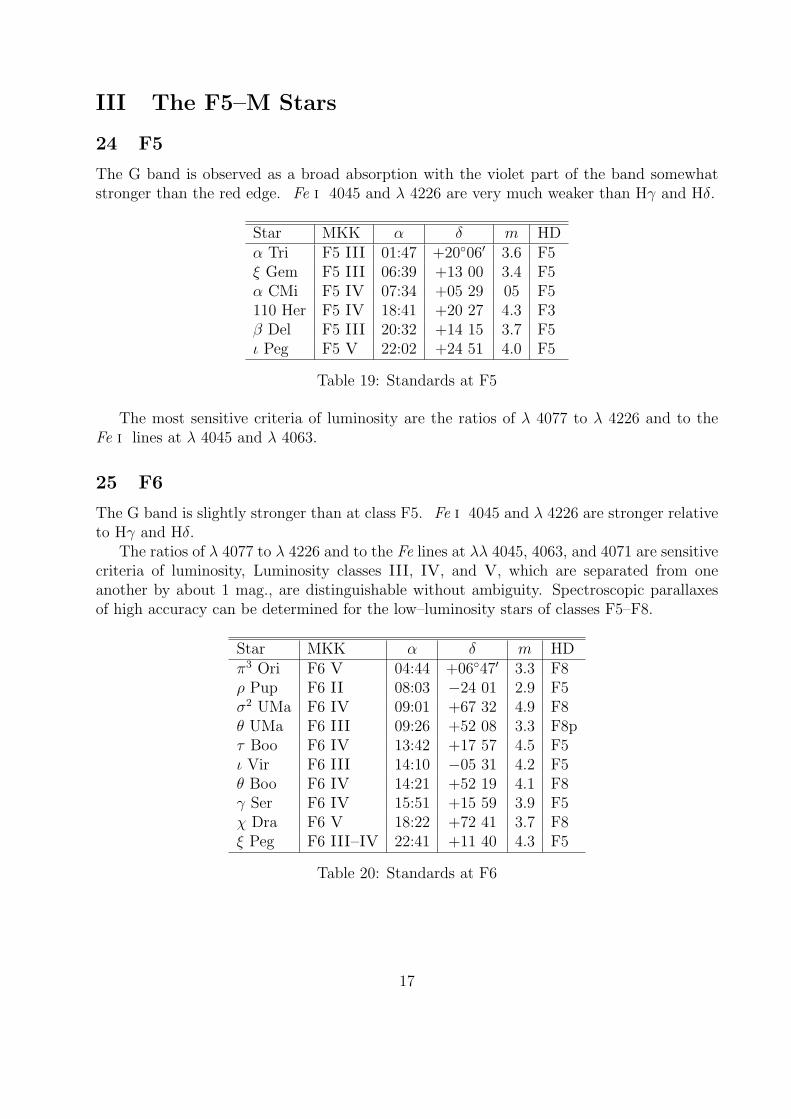
24 F5
The G band is observed as a broad absorption with the violet part of the band somewhatstronger than the red edge. Fe i 4045 and λ 4226 are very much weaker than Hγ and Hδ.
Star MKK α δ m HDα Tri F5 III 01:47 +20◦06′ 3.6 F5ξ Gem F5 III 06:39 +13 00 3.4 F5α CMi F5 IV 07:34 +05 29 05 F5110 Her F5 IV 18:41 +20 27 4.3 F3β Del F5 III 20:32 +14 15 3.7 F5ι Peg F5 V 22:02 +24 51 4.0 F5
Table 19: Standards at F5
The most sensitive criteria of luminosity are the ratios of λ 4077 to λ 4226 and to theFe i lines at λ 4045 and λ 4063.
25 F6
The G band is slightly stronger than at class F5. Fe i 4045 and λ 4226 are stronger relativeto Hγ and Hδ.
The ratios of λ 4077 to λ 4226 and to the Fe lines at λλ 4045, 4063, and 4071 are sensitivecriteria of luminosity, Luminosity classes III, IV, and V, which are separated from oneanother by about 1 mag., are distinguishable without ambiguity. Spectroscopic parallaxesof high accuracy can be determined for the low–luminosity stars of classes F5–F8.
Star MKK α δ m HDπ3 Ori F6 V 04:44 +06◦47′ 3.3 F8ρ Pup F6 II 08:03 −24 01 2.9 F5σ2 UMa F6 IV 09:01 +67 32 4.9 F8θ UMa F6 III 09:26 +52 08 3.3 F8pτ Boo F6 IV 13:42 +17 57 4.5 F5ι Vir F6 III 14:10 −05 31 4.2 F5θ Boo F6 IV 14:21 +52 19 4.1 F8γ Ser F6 IV 15:51 +15 59 3.9 F5χ Dra F6 V 18:22 +72 41 3.7 F8ξ Peg F6 III–IV 22:41 +11 40 4.3 F5
Table 20: Standards at F6
17
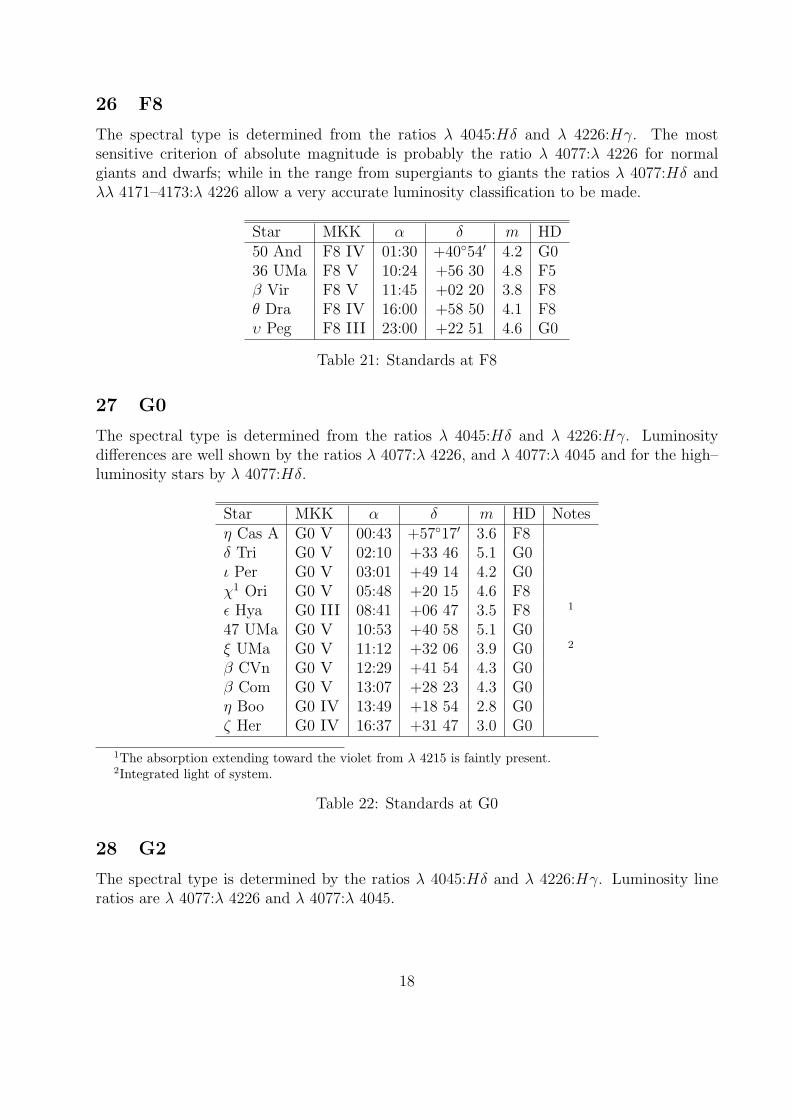
26 F8
The spectral type is determined from the ratios λ 4045:Hδ and λ 4226:Hγ. The mostsensitive criterion of absolute magnitude is probably the ratio λ 4077:λ 4226 for normalgiants and dwarfs; while in the range from supergiants to giants the ratios λ 4077:Hδ andλλ 4171–4173:λ 4226 allow a very accurate luminosity classification to be made.
Star MKK α δ m HD50 And F8 IV 01:30 +40◦54′ 4.2 G036 UMa F8 V 10:24 +56 30 4.8 F5β Vir F8 V 11:45 +02 20 3.8 F8θ Dra F8 IV 16:00 +58 50 4.1 F8υ Peg F8 III 23:00 +22 51 4.6 G0
Table 21: Standards at F8
27 G0
The spectral type is determined from the ratios λ 4045:Hδ and λ 4226:Hγ. Luminositydifferences are well shown by the ratios λ 4077:λ 4226, and λ 4077:λ 4045 and for the high–luminosity stars by λ 4077:Hδ.
Star MKK α δ m HD Notesη Cas A G0 V 00:43 +57◦17′ 3.6 F8δ Tri G0 V 02:10 +33 46 5.1 G0ι Per G0 V 03:01 +49 14 4.2 G0χ1 Ori G0 V 05:48 +20 15 4.6 F8ε Hya G0 III 08:41 +06 47 3.5 F8 1
47 UMa G0 V 10:53 +40 58 5.1 G0ξ UMa G0 V 11:12 +32 06 3.9 G0 2
β CVn G0 V 12:29 +41 54 4.3 G0β Com G0 V 13:07 +28 23 4.3 G0η Boo G0 IV 13:49 +18 54 2.8 G0ζ Her G0 IV 16:37 +31 47 3.0 G0
1The absorption extending toward the violet from λ 4215 is faintly present.2Integrated light of system.
Table 22: Standards at G0
28 G2
The spectral type is determined by the ratios λ 4045:Hδ and λ 4226:Hγ. Luminosity lineratios are λ 4077:λ 4226 and λ 4077:λ 4045.
18
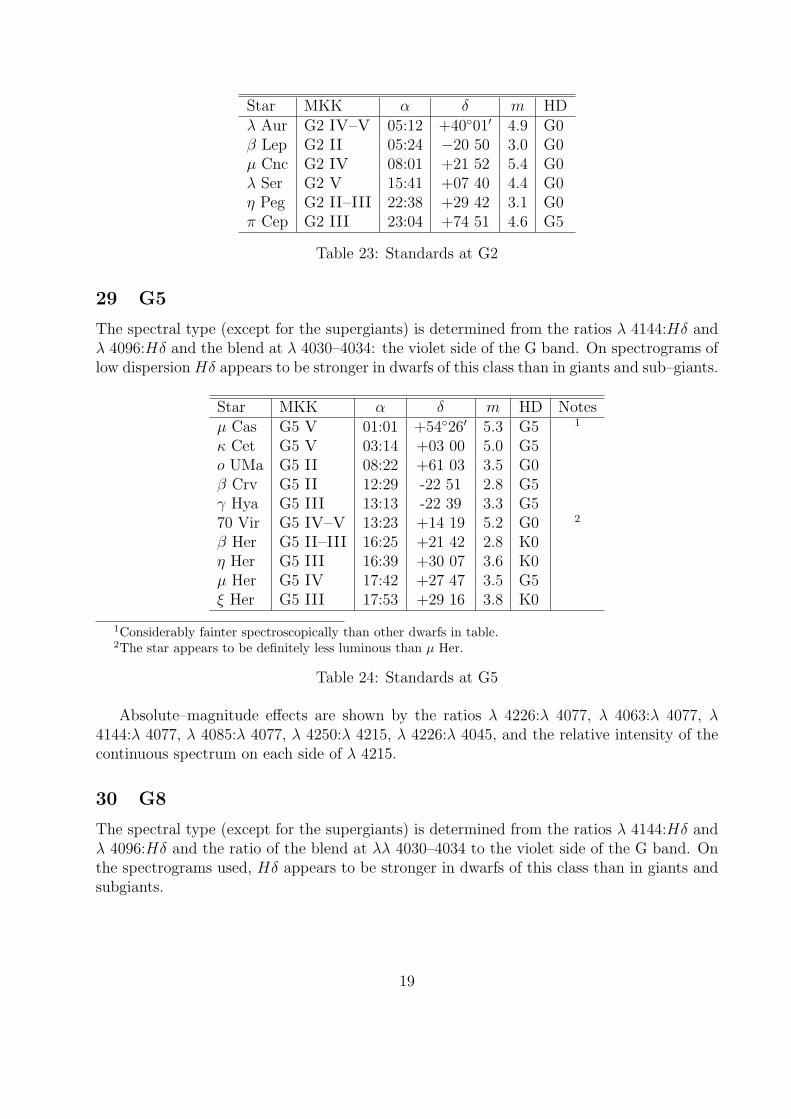
Star MKK α δ m HDλ Aur G2 IV–V 05:12 +40◦01′ 4.9 G0β Lep G2 II 05:24 −20 50 3.0 G0µ Cnc G2 IV 08:01 +21 52 5.4 G0λ Ser G2 V 15:41 +07 40 4.4 G0η Peg G2 II–III 22:38 +29 42 3.1 G0π Cep G2 III 23:04 +74 51 4.6 G5
Table 23: Standards at G2
29 G5
The spectral type (except for the supergiants) is determined from the ratios λ 4144:Hδ andλ 4096:Hδ and the blend at λ 4030–4034: the violet side of the G band. On spectrograms oflow dispersionHδ appears to be stronger in dwarfs of this class than in giants and sub–giants.
Star MKK α δ m HD Notesµ Cas G5 V 01:01 +54◦26′ 5.3 G5 1
κ Cet G5 V 03:14 +03 00 5.0 G5o UMa G5 II 08:22 +61 03 3.5 G0β Crv G5 II 12:29 -22 51 2.8 G5γ Hya G5 III 13:13 -22 39 3.3 G570 Vir G5 IV–V 13:23 +14 19 5.2 G0 2
β Her G5 II–III 16:25 +21 42 2.8 K0η Her G5 III 16:39 +30 07 3.6 K0µ Her G5 IV 17:42 +27 47 3.5 G5ξ Her G5 III 17:53 +29 16 3.8 K0
1Considerably fainter spectroscopically than other dwarfs in table.2The star appears to be definitely less luminous than µ Her.
Table 24: Standards at G5
Absolute–magnitude effects are shown by the ratios λ 4226:λ 4077, λ 4063:λ 4077, λ4144:λ 4077, λ 4085:λ 4077, λ 4250:λ 4215, λ 4226:λ 4045, and the relative intensity of thecontinuous spectrum on each side of λ 4215.
30 G8
The spectral type (except for the supergiants) is determined from the ratios λ 4144:Hδ andλ 4096:Hδ and the ratio of the blend at λλ 4030–4034 to the violet side of the G band. Onthe spectrograms used, Hδ appears to be stronger in dwarfs of this class than in giants andsubgiants.
19
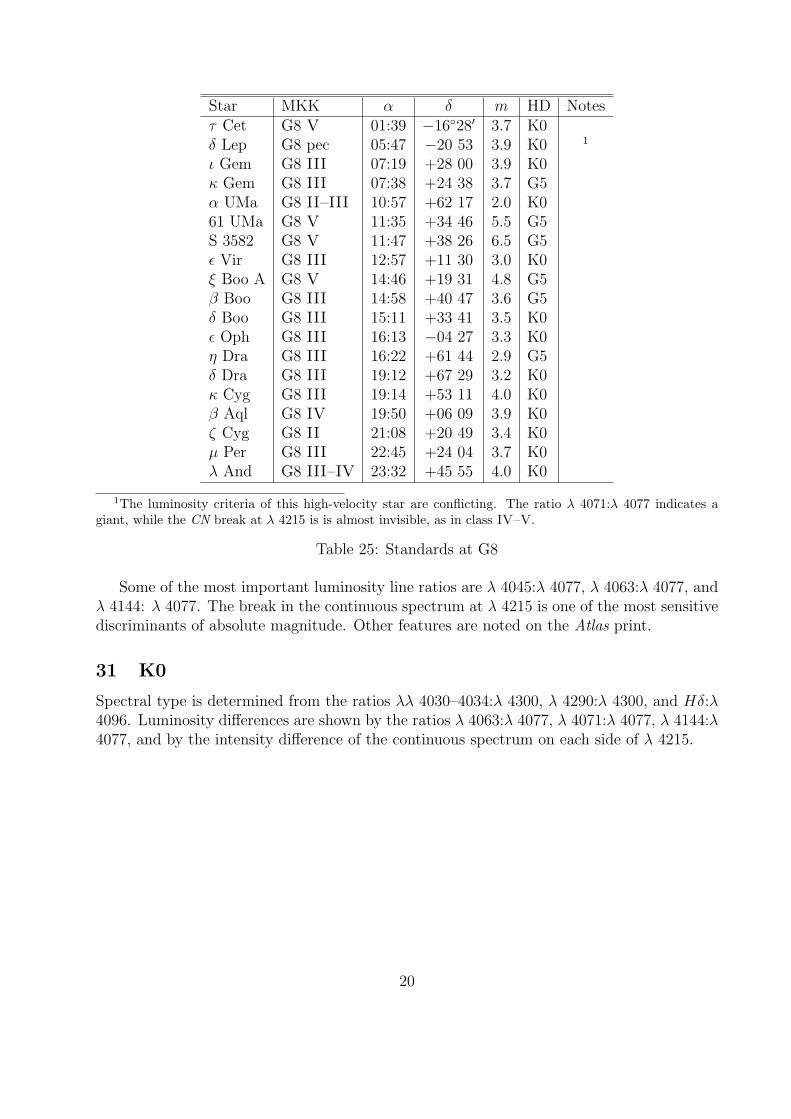
Star MKK α δ m HD Notesτ Cet G8 V 01:39 −16◦28′ 3.7 K0δ Lep G8 pec 05:47 −20 53 3.9 K0 1
ι Gem G8 III 07:19 +28 00 3.9 K0κ Gem G8 III 07:38 +24 38 3.7 G5α UMa G8 II–III 10:57 +62 17 2.0 K061 UMa G8 V 11:35 +34 46 5.5 G5S 3582 G8 V 11:47 +38 26 6.5 G5ε Vir G8 III 12:57 +11 30 3.0 K0ξ Boo A G8 V 14:46 +19 31 4.8 G5β Boo G8 III 14:58 +40 47 3.6 G5δ Boo G8 III 15:11 +33 41 3.5 K0ε Oph G8 III 16:13 −04 27 3.3 K0η Dra G8 III 16:22 +61 44 2.9 G5δ Dra G8 III 19:12 +67 29 3.2 K0κ Cyg G8 III 19:14 +53 11 4.0 K0β Aql G8 IV 19:50 +06 09 3.9 K0ζ Cyg G8 II 21:08 +20 49 3.4 K0µ Per G8 III 22:45 +24 04 3.7 K0λ And G8 III–IV 23:32 +45 55 4.0 K0
1The luminosity criteria of this high-velocity star are conflicting. The ratio λ 4071:λ 4077 indicates agiant, while the CN break at λ 4215 is is almost invisible, as in class IV–V.
Table 25: Standards at G8
Some of the most important luminosity line ratios are λ 4045:λ 4077, λ 4063:λ 4077, andλ 4144: λ 4077. The break in the continuous spectrum at λ 4215 is one of the most sensitivediscriminants of absolute magnitude. Other features are noted on the Atlas print.
31 K0
Spectral type is determined from the ratios λλ 4030–4034:λ 4300, λ 4290:λ 4300, and Hδ:λ4096. Luminosity differences are shown by the ratios λ 4063:λ 4077, λ 4071:λ 4077, λ 4144:λ4077, and by the intensity difference of the continuous spectrum on each side of λ 4215.
20
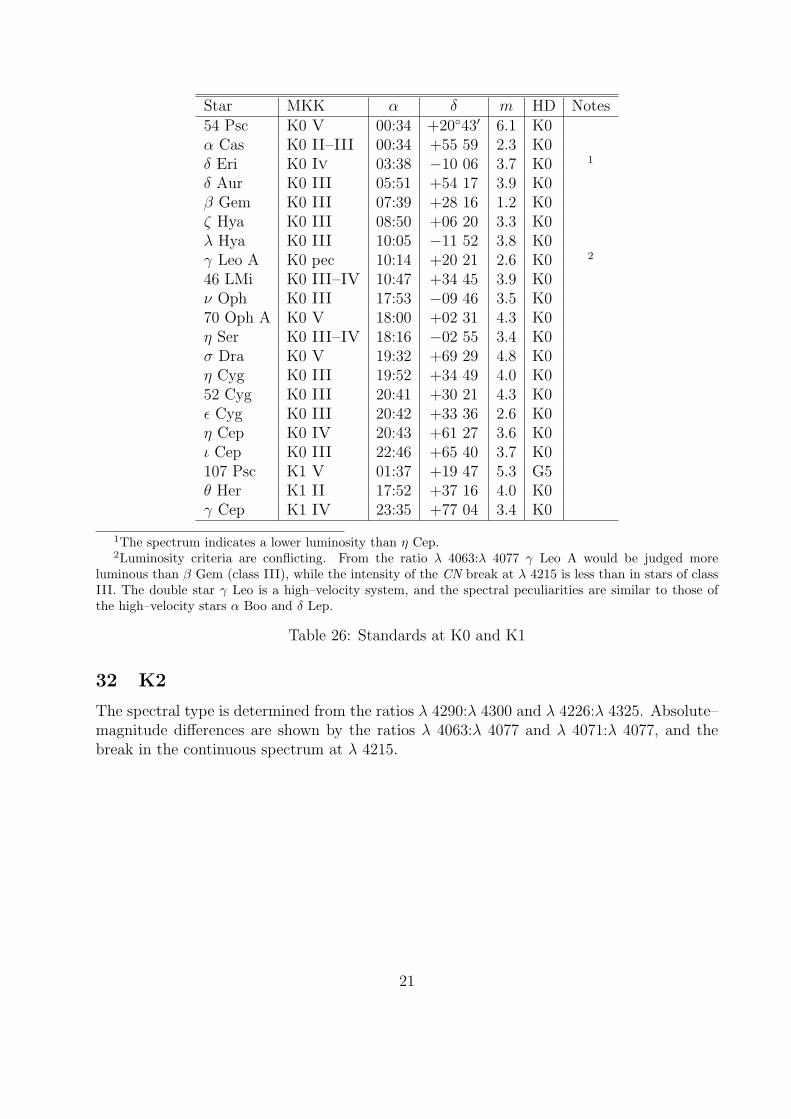
Star MKK α δ m HD Notes54 Psc K0 V 00:34 +20◦43′ 6.1 K0α Cas K0 II–III 00:34 +55 59 2.3 K0δ Eri K0 Iv 03:38 −10 06 3.7 K0 1
δ Aur K0 III 05:51 +54 17 3.9 K0β Gem K0 III 07:39 +28 16 1.2 K0ζ Hya K0 III 08:50 +06 20 3.3 K0λ Hya K0 III 10:05 −11 52 3.8 K0γ Leo A K0 pec 10:14 +20 21 2.6 K0 2
46 LMi K0 III–IV 10:47 +34 45 3.9 K0ν Oph K0 III 17:53 −09 46 3.5 K070 Oph A K0 V 18:00 +02 31 4.3 K0η Ser K0 III–IV 18:16 −02 55 3.4 K0σ Dra K0 V 19:32 +69 29 4.8 K0η Cyg K0 III 19:52 +34 49 4.0 K052 Cyg K0 III 20:41 +30 21 4.3 K0ε Cyg K0 III 20:42 +33 36 2.6 K0η Cep K0 IV 20:43 +61 27 3.6 K0ι Cep K0 III 22:46 +65 40 3.7 K0107 Psc K1 V 01:37 +19 47 5.3 G5θ Her K1 II 17:52 +37 16 4.0 K0γ Cep K1 IV 23:35 +77 04 3.4 K0
1The spectrum indicates a lower luminosity than η Cep.2Luminosity criteria are conflicting. From the ratio λ 4063:λ 4077 γ Leo A would be judged more
luminous than β Gem (class III), while the intensity of the CN break at λ 4215 is less than in stars of classIII. The double star γ Leo is a high–velocity system, and the spectral peculiarities are similar to those ofthe high–velocity stars α Boo and δ Lep.
Table 26: Standards at K0 and K1
32 K2
The spectral type is determined from the ratios λ 4290:λ 4300 and λ 4226:λ 4325. Absolute–magnitude differences are shown by the ratios λ 4063:λ 4077 and λ 4071:λ 4077, and thebreak in the continuous spectrum at λ 4215.
21
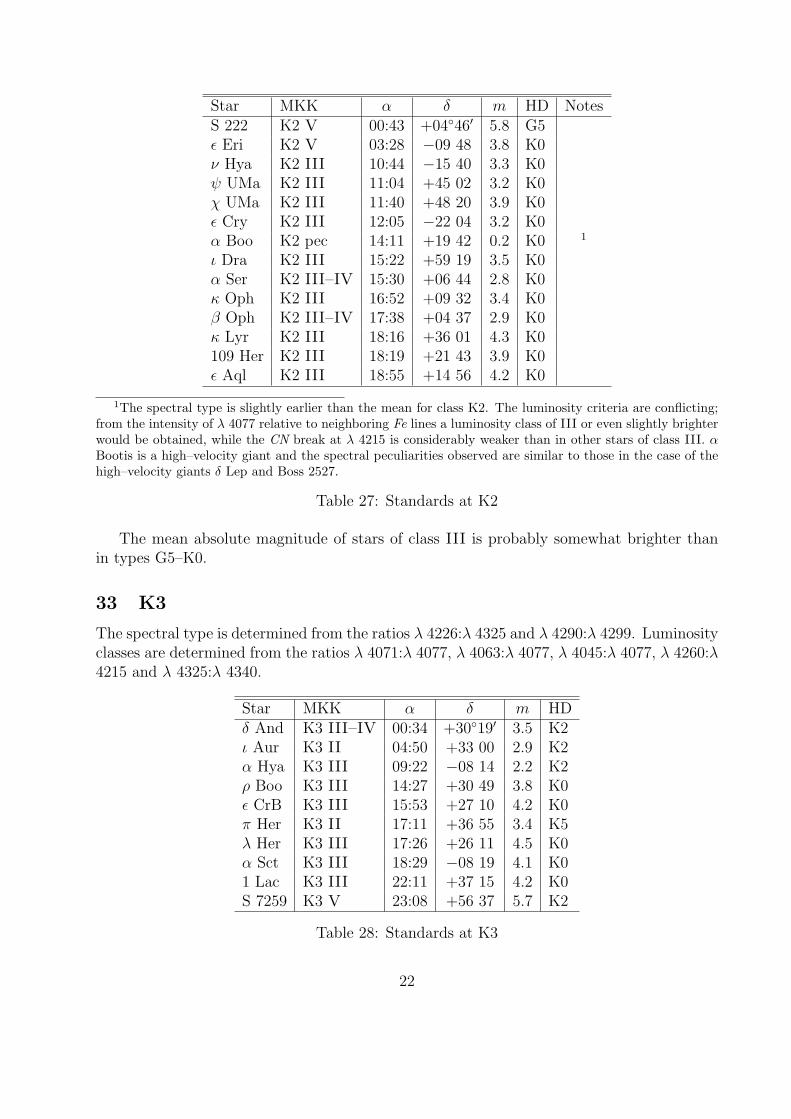
Star MKK α δ m HD NotesS 222 K2 V 00:43 +04◦46′ 5.8 G5ε Eri K2 V 03:28 −09 48 3.8 K0ν Hya K2 III 10:44 −15 40 3.3 K0ψ UMa K2 III 11:04 +45 02 3.2 K0χ UMa K2 III 11:40 +48 20 3.9 K0ε Cry K2 III 12:05 −22 04 3.2 K0α Boo K2 pec 14:11 +19 42 0.2 K0 1
ι Dra K2 III 15:22 +59 19 3.5 K0α Ser K2 III–IV 15:30 +06 44 2.8 K0κ Oph K2 III 16:52 +09 32 3.4 K0β Oph K2 III–IV 17:38 +04 37 2.9 K0κ Lyr K2 III 18:16 +36 01 4.3 K0109 Her K2 III 18:19 +21 43 3.9 K0ε Aql K2 III 18:55 +14 56 4.2 K0
1The spectral type is slightly earlier than the mean for class K2. The luminosity criteria are conflicting;from the intensity of λ 4077 relative to neighboring Fe lines a luminosity class of III or even slightly brighterwould be obtained, while the CN break at λ 4215 is considerably weaker than in other stars of class III. αBootis is a high–velocity giant and the spectral peculiarities observed are similar to those in the case of thehigh–velocity giants δ Lep and Boss 2527.
Table 27: Standards at K2
The mean absolute magnitude of stars of class III is probably somewhat brighter thanin types G5–K0.
33 K3
The spectral type is determined from the ratios λ 4226:λ 4325 and λ 4290:λ 4299. Luminosityclasses are determined from the ratios λ 4071:λ 4077, λ 4063:λ 4077, λ 4045:λ 4077, λ 4260:λ4215 and λ 4325:λ 4340.
Star MKK α δ m HDδ And K3 III–IV 00:34 +30◦19′ 3.5 K2ι Aur K3 II 04:50 +33 00 2.9 K2α Hya K3 III 09:22 −08 14 2.2 K2ρ Boo K3 III 14:27 +30 49 3.8 K0ε CrB K3 III 15:53 +27 10 4.2 K0π Her K3 II 17:11 +36 55 3.4 K5λ Her K3 III 17:26 +26 11 4.5 K0α Sct K3 III 18:29 −08 19 4.1 K01 Lac K3 III 22:11 +37 15 4.2 K0S 7259 K3 V 23:08 +56 37 5.7 K2
Table 28: Standards at K3
22
The mean absolute magnitude of the stars of luminosity class III is probably higher thanat type K0. No subgiants were observed at K3.
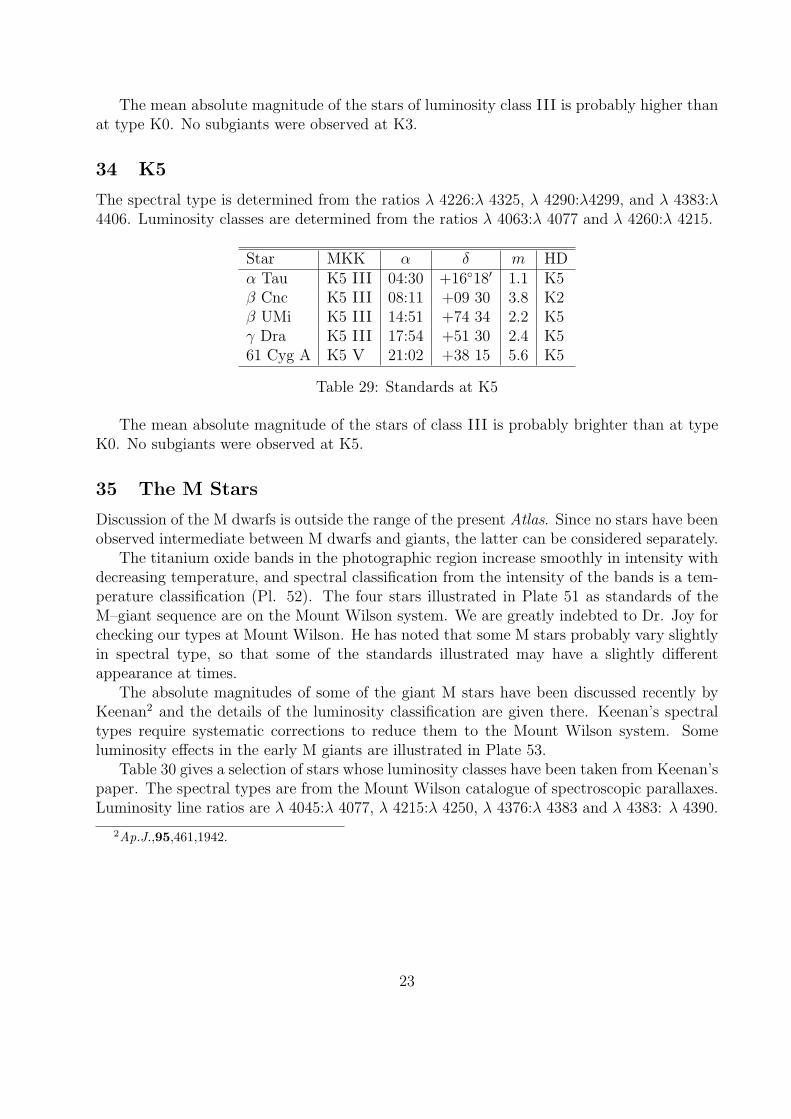
34 K5
The spectral type is determined from the ratios λ 4226:λ 4325, λ 4290:λ4299, and λ 4383:λ4406. Luminosity classes are determined from the ratios λ 4063:λ 4077 and λ 4260:λ 4215.
Star MKK α δ m HDα Tau K5 III 04:30 +16◦18′ 1.1 K5β Cnc K5 III 08:11 +09 30 3.8 K2β UMi K5 III 14:51 +74 34 2.2 K5γ Dra K5 III 17:54 +51 30 2.4 K561 Cyg A K5 V 21:02 +38 15 5.6 K5
Table 29: Standards at K5
The mean absolute magnitude of the stars of class III is probably brighter than at typeK0. No subgiants were observed at K5.
35 The M Stars
Discussion of the M dwarfs is outside the range of the present Atlas. Since no stars have beenobserved intermediate between M dwarfs and giants, the latter can be considered separately.
The titanium oxide bands in the photographic region increase smoothly in intensity withdecreasing temperature, and spectral classification from the intensity of the bands is a tem-perature classification (Pl. 52). The four stars illustrated in Plate 51 as standards of theM–giant sequence are on the Mount Wilson system. We are greatly indebted to Dr. Joy forchecking our types at Mount Wilson. He has noted that some M stars probably vary slightlyin spectral type, so that some of the standards illustrated may have a slightly differentappearance at times.
The absolute magnitudes of some of the giant M stars have been discussed recently byKeenan2 and the details of the luminosity classification are given there. Keenan’s spectraltypes require systematic corrections to reduce them to the Mount Wilson system. Someluminosity effects in the early M giants are illustrated in Plate 53.
Table 30 gives a selection of stars whose luminosity classes have been taken from Keenan’spaper. The spectral types are from the Mount Wilson catalogue of spectroscopic parallaxes.Luminosity line ratios are λ 4045:λ 4077, λ 4215:λ 4250, λ 4376:λ 4383 and λ 4383: λ 4390.
2Ap.J.,95,461,1942.
23
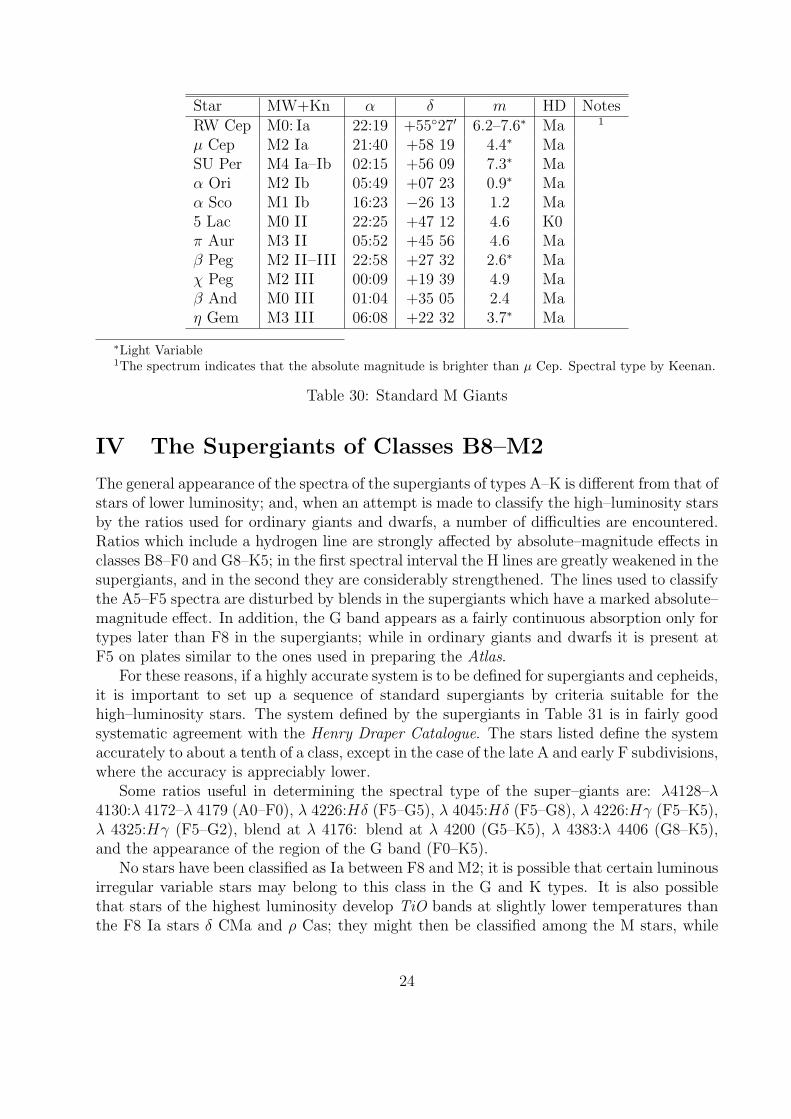
Star MW+Kn α δ m HD NotesRW Cep M0: Ia 22:19 +55◦27′ 6.2–7.6∗ Ma 1
µ Cep M2 Ia 21:40 +58 19 4.4∗ MaSU Per M4 Ia–Ib 02:15 +56 09 7.3∗ Maα Ori M2 Ib 05:49 +07 23 0.9∗ Maα Sco M1 Ib 16:23 −26 13 1.2 Ma5 Lac M0 II 22:25 +47 12 4.6 K0π Aur M3 II 05:52 +45 56 4.6 Maβ Peg M2 II–III 22:58 +27 32 2.6∗ Maχ Peg M2 III 00:09 +19 39 4.9 Maβ And M0 III 01:04 +35 05 2.4 Maη Gem M3 III 06:08 +22 32 3.7∗ Ma
∗Light Variable1The spectrum indicates that the absolute magnitude is brighter than µ Cep. Spectral type by Keenan.
Table 30: Standard M Giants
IV The Supergiants of Classes B8–M2
The general appearance of the spectra of the supergiants of types A–K is different from that ofstars of lower luminosity; and, when an attempt is made to classify the high–luminosity starsby the ratios used for ordinary giants and dwarfs, a number of difficulties are encountered.Ratios which include a hydrogen line are strongly affected by absolute–magnitude effects inclasses B8–F0 and G8–K5; in the first spectral interval the H lines are greatly weakened in thesupergiants, and in the second they are considerably strengthened. The lines used to classifythe A5–F5 spectra are disturbed by blends in the supergiants which have a marked absolute–magnitude effect. In addition, the G band appears as a fairly continuous absorption only fortypes later than F8 in the supergiants; while in ordinary giants and dwarfs it is present atF5 on plates similar to the ones used in preparing the Atlas.
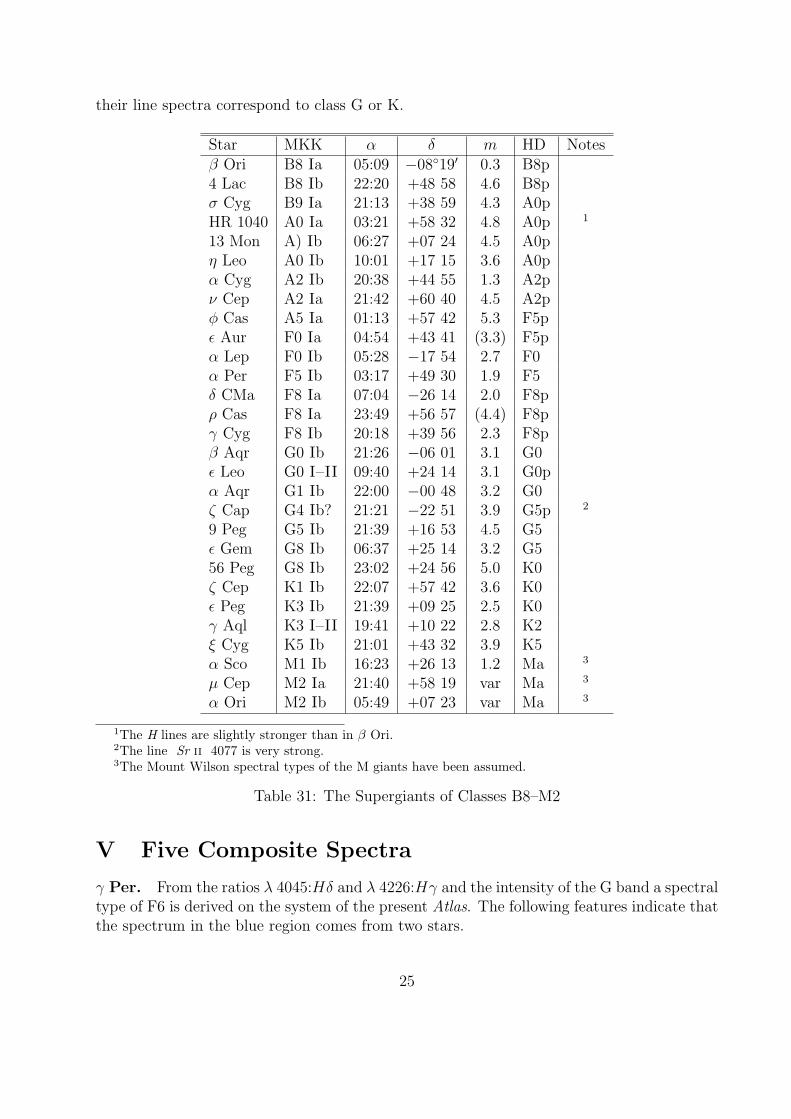
For these reasons, if a highly accurate system is to be defined for supergiants and cepheids,it is important to set up a sequence of standard supergiants by criteria suitable for thehigh–luminosity stars. The system defined by the supergiants in Table 31 is in fairly goodsystematic agreement with the Henry Draper Catalogue. The stars listed define the systemaccurately to about a tenth of a class, except in the case of the late A and early F subdivisions,where the accuracy is appreciably lower.
Some ratios useful in determining the spectral type of the super–giants are: λ4128–λ4130:λ 4172–λ 4179 (A0–F0), λ 4226:Hδ (F5–G5), λ 4045:Hδ (F5–G8), λ 4226:Hγ (F5–K5),λ 4325:Hγ (F5–G2), blend at λ 4176: blend at λ 4200 (G5–K5), λ 4383:λ 4406 (G8–K5),and the appearance of the region of the G band (F0–K5).
No stars have been classified as Ia between F8 and M2; it is possible that certain luminousirregular variable stars may belong to this class in the G and K types. It is also possiblethat stars of the highest luminosity develop TiO bands at slightly lower temperatures thanthe F8 Ia stars δ CMa and ρ Cas; they might then be classified among the M stars, while
24
their line spectra correspond to class G or K.
Star MKK α δ m HD Notesβ Ori B8 Ia 05:09 −08◦19′ 0.3 B8p4 Lac B8 Ib 22:20 +48 58 4.6 B8pσ Cyg B9 Ia 21:13 +38 59 4.3 A0pHR 1040 A0 Ia 03:21 +58 32 4.8 A0p 1
13 Mon A) Ib 06:27 +07 24 4.5 A0pη Leo A0 Ib 10:01 +17 15 3.6 A0pα Cyg A2 Ib 20:38 +44 55 1.3 A2pν Cep A2 Ia 21:42 +60 40 4.5 A2pφ Cas A5 Ia 01:13 +57 42 5.3 F5pε Aur F0 Ia 04:54 +43 41 (3.3) F5pα Lep F0 Ib 05:28 −17 54 2.7 F0α Per F5 Ib 03:17 +49 30 1.9 F5δ CMa F8 Ia 07:04 −26 14 2.0 F8pρ Cas F8 Ia 23:49 +56 57 (4.4) F8pγ Cyg F8 Ib 20:18 +39 56 2.3 F8pβ Aqr G0 Ib 21:26 −06 01 3.1 G0ε Leo G0 I–II 09:40 +24 14 3.1 G0pα Aqr G1 Ib 22:00 −00 48 3.2 G0ζ Cap G4 Ib? 21:21 −22 51 3.9 G5p 2
9 Peg G5 Ib 21:39 +16 53 4.5 G5ε Gem G8 Ib 06:37 +25 14 3.2 G556 Peg G8 Ib 23:02 +24 56 5.0 K0ζ Cep K1 Ib 22:07 +57 42 3.6 K0ε Peg K3 Ib 21:39 +09 25 2.5 K0γ Aql K3 I–II 19:41 +10 22 2.8 K2ξ Cyg K5 Ib 21:01 +43 32 3.9 K5α Sco M1 Ib 16:23 +26 13 1.2 Ma 3
µ Cep M2 Ia 21:40 +58 19 var Ma 3
α Ori M2 Ib 05:49 +07 23 var Ma 3
1The H lines are slightly stronger than in β Ori.2The line Sr ii 4077 is very strong.3The Mount Wilson spectral types of the M giants have been assumed.
Table 31: The Supergiants of Classes B8–M2
V Five Composite Spectra
γ Per. From the ratios λ 4045:Hδ and λ 4226:Hγ and the intensity of the G band a spectraltype of F6 is derived on the system of the present Atlas. The following features indicate thatthe spectrum in the blue region comes from two stars.
25
1. The CN absorption, having a sharp head at λ 4215, is present and is about as strongas in a giant G2 star. This absorption was not seen in any normal star earlier than G0examined while preparing the Atlas.
2. There is a broad, faint absorption at Hδ which makes the appearance of the regiondifferent from that in a normal F6 star. This is probably due to a broad A–typehydrogen line superposed on the narrower one.
3. The strongest absorption at K is narrow and is similar to a star near type A5, andthere is almost certainly present a faint, broad K line superposed on the sharp one.
The spectral type of the component of later type is probably near G5. Its luminosityclass is probably III.
α Equ. The spectrum is similar to γ Per. The CN absorption toward the violet fromλ 4215 is present and indicates that the later–type spectrum is near G5. The integratedspectral type at λλ 4000–4300 is somewhat earlier than γ Per–about F5–owing to the greaterstrength of the H lines. The A star appears to be somewhat brighter relative to the later–typecomponent. The line at λ 4077 is stronger relative to λ 4045 than in γ Per.
o Leo. The CN absorption near λ 4215 is not observed and the later–type spectrum istherefore almost certainly earlier than G0. This spectrum is combined with one of earlytype which, to judge by the narrow K line, is near class A2. The two components forma spectroscopic binary. The spectrograms used were obtained on April 22, 1942; on themthe K line is composite, the sharp A component lying near the red edge of a faint, diffusecomponent. The line λ 4077 is strong, and from its intensity a similarity in luminosity toan F supergiant [α Per (F5) or γ Cyg (F8)] might be assumed. The region of the G band,however, does not have an appearance like that of a supergiant of type F, and other line ratiossuggest a luminosity class of around II–III. This value is uncertain; it could be determinedmore accurately if spectrograms on a high–contrast emulsion were available. The spectraltype of the component of later type is probably near F6.
α Aur. The combined spectral type of the two components is G2 II–III. An unpublisheddetermination made several years ago from high–dispersion plates on which the componentswere resolved gives, on the system of the present Atlas,
Spectral type of primary G5Spectral type of secondary F6Combined spectral type G2 II–III
The separate values for the two components are very uncertain and may be in error by aconsiderable fraction of their separation.
26
β Cyg. The spectral type of the component of late type is probably K3 II. At the positionof K there is a broad, shallow absorption. It is estimated that the spectral type of thecomponent of early type is probably earlier than A0. The features described all belong tothe spectrum of β Cyg A.
VI Conclusion
The relation between the revised types of the B2–G0 dwarfs and color is shown in Figure 1.An approximate calibration of the luminosity classes is given in Figure 2. While any definitivecalibration requires the use of many more stars than are considered here, we do not thinkthat any of the curves should be in error anywhere by much more than a half–magnitude.
Since about a year was needed for the making of the photographic prints for the Atlas,there is a difference in epoch of that time between the classification as illustrated there andas expounded here. It was unavoidable that certain improvements and alterations shouldhave suggested themselves in the interim. These have been incorporated in the text; andthere are therefore several discrepancies between the Atlas plates and the text. In all suchcases the text is to be taken as final, and the data on the Atlas prints should be altered toagree with the outline. The most important of the changes has been the shifting in spectraltype of two standard stars. These are µ Peg (Pls. 36, 41, 44), whose type should be changedfrom G5 to G8, and σ2 UMa (Pl. 37), whose type has been altered from F8 to F6.
The characteristics of the system described here can be summarized as follows: Thetwo–dimensional classification can be used to describe accurately the spectra of the normalstars brighter than the eighth apparent magnitude. Since this includes all but a very smallpercentage of the total number of stars brighter than that limiting magnitude, it is possibleto derive from the extension of the classification to fainter objects certain general informationconcerning the distribution in space of the stars absolutely brighter than the sun.
In the course of the investigation several interesting details have been noted. Among theBe stars very broad absorption lines have been observed, which suggest maximum stellarrotational velocities somewhat higher than those found earlier. The most striking exampleof this is the star φ Per. Other stars having lines suggesting higher rotational velocities thanthe Bnn star, η UMa, are ζ Oph, 25 Ori, and β Mon A.
Also of interest is the discovery of similar spectral peculiarities in several G– and K–typehigh–velocity giants. The high–velocity stars δ Lep, Boss 2527, γ Leo, and probably α Boohave similar peculiar features. The most striking of these on low dispersion is the abnormalweakness of the CN absorption extending toward the violet from λ 4215.
When carefully calibrated, the luminosity classification should allow the determinationof accurate spectroscopic parallaxes on low–dispersion plates of stars of all classes from O9to M2 (with the possible exception of classes B8–A2).
The spectral classification defines with accuracy a system of color standards which canbe used in investigations of interstellar absorption and determinations of systematic errorsin spectral classification of faint stars. It should be emphasized that the actual features usedfor classification are dependent on the dispersion used and that some or most of the criterialisted here might be unsuitable for use on spectra having greatly different dispersion.
27
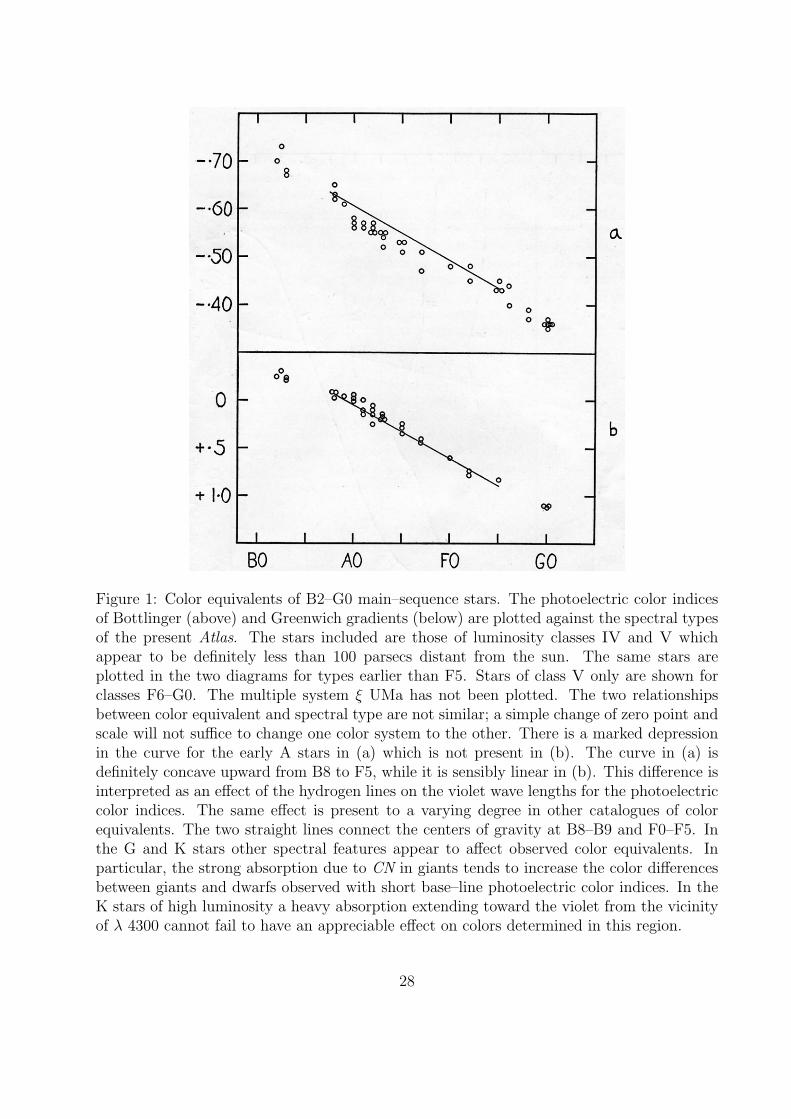
Figure 1: Color equivalents of B2–G0 main–sequence stars. The photoelectric color indicesof Bottlinger (above) and Greenwich gradients (below) are plotted against the spectral typesof the present Atlas. The stars included are those of luminosity classes IV and V whichappear to be definitely less than 100 parsecs distant from the sun. The same stars areplotted in the two diagrams for types earlier than F5. Stars of class V only are shown forclasses F6–G0. The multiple system ξ UMa has not been plotted. The two relationshipsbetween color equivalent and spectral type are not similar; a simple change of zero point andscale will not suffice to change one color system to the other. There is a marked depressionin the curve for the early A stars in (a) which is not present in (b). The curve in (a) isdefinitely concave upward from B8 to F5, while it is sensibly linear in (b). This difference isinterpreted as an effect of the hydrogen lines on the violet wave lengths for the photoelectriccolor indices. The same effect is present to a varying degree in other catalogues of colorequivalents. The two straight lines connect the centers of gravity at B8–B9 and F0–F5. Inthe G and K stars other spectral features appear to affect observed color equivalents. Inparticular, the strong absorption due to CN in giants tends to increase the color differencesbetween giants and dwarfs observed with short base–line photoelectric color indices. In theK stars of high luminosity a heavy absorption extending toward the violet from the vicinityof λ 4300 cannot fail to have an appreciable effect on colors determined in this region.
28
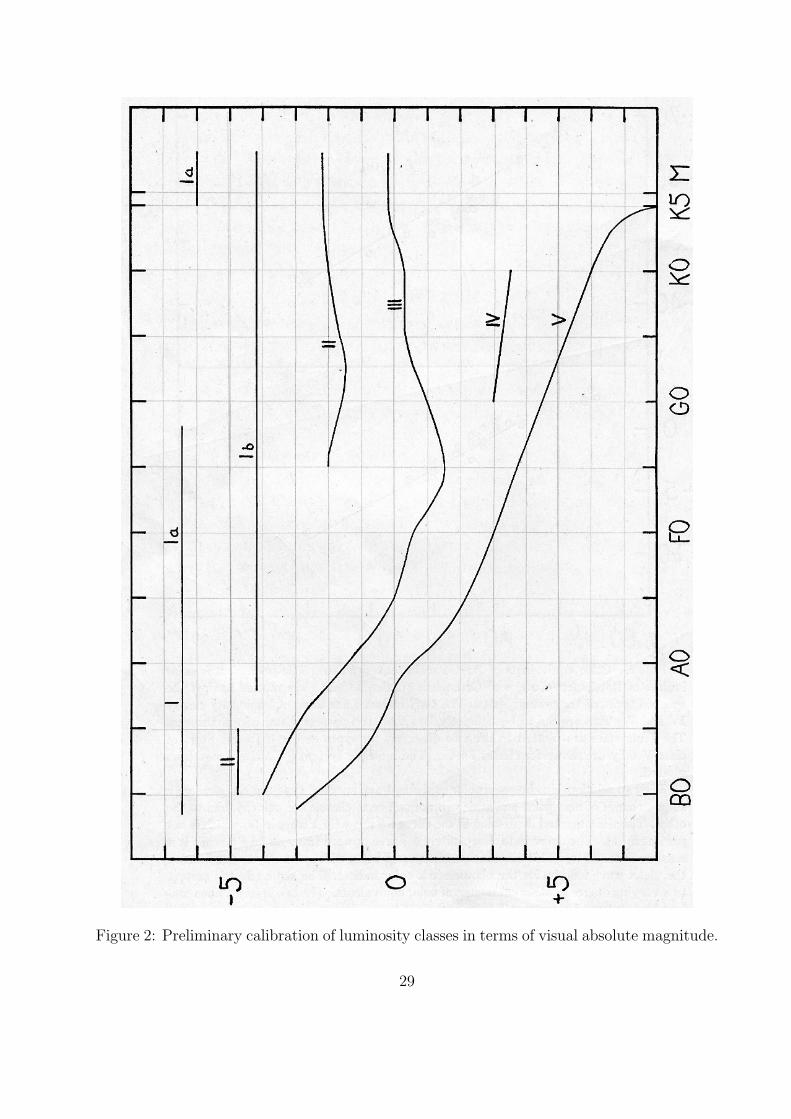
Figure 2: Preliminary calibration of luminosity classes in terms of visual absolute magnitude.
29
We wish to acknowledge our indebtedness to the following persons : to Dr. Struvefor making the publication of the Atlas possible; to Dr. Joaquin Gallo, director of theAstronomical Observatory of Mexico at Tacubaya, for the loan of a number of objective–prism plates; to Dr. A. H. Joy, of Mount Wilson, for determining the spectral types ofseveral M giants which we have used as standards; to Dr. A. N. Vyssotsky, of the LeanderMcCormick Observatory, for several discussions of the problem of spectral classification; andto Dr. G. P. Kuiper for a discussion of the dynamical parallax of δ Cygni. We are alsoindebted to the following persons for taking a considerable number of the spectrograms usedin the investigation: Mrs. Frances Sherman Bailey, Dr. J. A. O’Keefe, Dr. L. R. Henrich,Mr. W. P. Bidelman, and Mr. Frank R. Sullivan. All the photographic prints for the Atlaswere made by Miss Kellman and Miss Phyllis Anderson.
YERKES OBSERVATORYAugust 19, 1942
30
Index
1 Lac, 2210 Lac, 5107 Psc, 21109 Her, 22110 Her, 1712 Lac, 813 Mon, 25139 Tau, 715 UMa, 1617 Com, 1519 Cep, 625 Ori, 2736 UMa, 1838 Lyn, 124 Lac, 2546 LMi, 2147 UMa, 185 Lac, 2450 And, 1852 Cyg, 2154 Psc, 2155 Cyg, 956 Peg, 2561 Cyg A, 2361 UMa, 2063 Tau, 1667 Oph, 970 Oph A, 2170 Vir, 1973 Dra, 1578 UMa, 1478 Vir, 14, 159 Cam, 69 Cep, 89 Peg, 259 Sgr, 5
alpha And, 14alpha Aql, 13alpha Aqr, 25alpha Aur, 26alpha Boo, 21, 22, 27
alpha Cas, 21alpha Cep, 13alpha CMa, 11alpha CMi, 17alpha CrB, 11alpha CVn, 14, 15alpha Cyg, 25alpha Equ, 26alpha Gem, 16alpha Gem A, 11alpha Hya, 22alpha Leo, 9alpha Lep, 25alpha Lyr, 11alpha Oph, 13alpha Ori, 24, 25alpha Peg, 11alpha Per, 25, 26alpha PsA, 12alpha Sco, 24, 25alpha Sct, 22alpha Ser, 22alpha Tau, 23alpha Tri, 17alpha UMa, 20alpha Vir, 7alpha2 Lib, 16
beta And, 24beta Aql, 20, 25beta Ari, 13beta Aur, 12beta Boo, 20beta Cas, 14beta Cep, 7beta CMa, 7beta CMi, 9beta Cnc, 23beta Com, 18beta CrB, 15beta Crv, 19beta CVn, 18
31
beta Cyg, 27beta Cyg A, 27beta Del, 17beta Gem, 21beta Her, 19beta Leo, 12beta Lep, 19beta Lib, 9beta Mon A, 27beta Oph, 22beta Ori, 9, 25beta Peg, 24beta Per, 9beta Sco, 7beta Ser, 12beta Tau, 9beta Tri, 13beta UMa, 11beta UMi, 23beta Vir, 18Boss 2527, 22, 27
C Hya, 11chi Aur, 9chi Dra, 17chi Peg, 24chi UMa, 22chi1 Ori, 18chi2 Ori, 8
delta And, 22delta Aur, 21delta Boo, 20delta Cas, 13delta CMa, 24, 25delta Crv, 11delta Cyg, 11, 30delta Dra, 20delta Eri, 21delta Gem, 14delta Her, 12delta Lep, 20–22, 27delta Ori, 6delta Per, 9delta Sco, 6
delta Tri, 18delta UMa, 12
epsilon Aql, 22epsilon Aur, 25epsilon Cas, 9epsilon Cep, 13, 16epsilon CMa, 7epsilon CrB, 22epsilon Cry, 22epsilon Cyg, 21epsilon Eri, 22epsilon Gem, 25epsilon Hya, 18epsilon Leo, 25epsilon Oph, 20epsilon Peg, 25epsilon Per, 7epsilon Ser, 16epsilon UMa, 14epsilon Vir, 20eta Boo, 18eta Cas, 9eta Cas A, 18eta Cep, 21eta CMa, 9eta Cyg, 21eta Dra, 20eta Gem, 24eta Her, 19eta Leo, 10, 25eta Oph, 12eta Ori, 6, 7eta Peg, 19eta Ser, 21eta Tau, 9eta UMa, 6, 8, 9, 27
g UMa, 13gamma Aql, 25gamma Boo, 13gamma Cap, 15gamma Cas, 6gamma Cep, 21gamma Cyg, 25, 26
32
gamma Dra, 23gamma Equ, 15gamma Gem, 11gamma Her, 13gamma Hya, 19gamma Leo, 21, 27gamma Leo A, 21gamma Lyr, 11gamma Ori, 8gamma Peg, 8gamma Per, 26gamma Ser, 17gamma UMa, 11, 12gamma UMi, 12gamma Vir, 13
HD 165052, 5HD 188209, 5HD 218915, 5HD 5005, 5HR 5355, 15
iota Aur, 22iota Cas, 15iota Cep, 21iota Dra, 22iota Gem, 20iota Her, 9iota Lib, 14iota Ori, 5iota Peg, 17iota Per, 18iota Vir, 17
kappa Cas, 7kappa Cet, 19kappa Cyg, 20kappa Gem, 20kappa Hya, 9kappa Lyr, 22kappa Oph, 22kappa Ori, 6
lambda And, 20lambda Aur, 19lambda Boo, 16
lambda Cep, 5lambda Her, 22lambda Hya, 21lambda Ori A, 5lambda Sco, 8lambda Ser, 19lambda UMa, 12
mu Cas, 19mu Cep, 24, 25mu Cnc, 19mu Her, 19mu Peg, 27mu Per, 20
nu Cep, 25nu Hya, 22nu Oph, 21
omicron Leo, 26omicron Per, 7omicron UMa, 19
phi Cas, 25phi Per, 6, 27phi1 Ori, 6pi Aur, 24pi Cep, 19pi Her, 22pi Sco, 8pi Sgr, 14pi3 Ori, 17psi UMa, 22
rho Boo, 22rho Cas, 24, 25rho Leo, 7rho Oph, 8rho Pup, 16, 17RW Cep, 24
S 222, 22S 3582, 20S 7259, 22S Mon, 5sigma Boo, 14
33
sigma Cyg, 25sigma Dra, 21sigma Ori, 6sigma Sco, 7sigma Sgr, 9sigma2 CMa, 9sigma2 UMa, 17, 27SU Per, 24
tau Boo, 17tau Cet, 20tau Her, 9tau Sco, 6tau UMa, 16theta Aur, 14theta Boo, 17theta Dra, 18theta Her, 21theta Hya, 16theta Oph, 8theta UMa, 17theta1 Ori C, 5
upsilon Peg, 18upsilon UMa, 14
xi Boo A, 20xi Cyg, 25xi Gem, 17xi Her, 19xi Peg, 17xi Per, 5xi UMa, 18, 28
zeta Cap, 25zeta Cas, 8zeta Cyg, 20zeta Dra, 10zeta Her, 18zeta Hya, 21zeta Leo, 13, 16zeta Lyr A, 16zeta Lyr B, 16zeta Oph, 6, 27zeta Ori, 6zeta Per, 7
zeta Pup, 5zeta Ser, 14zeta UMa, 16zeta UMa(br), 12zeta Vir, 12
34