an atr-ftir procedure for quantitative analysis of · pdf filean atr-ftir procedure for...
TRANSCRIPT
Oil Shale, 2012, Vol. 29, No. 4, pp. 344–356 ISSN 0208-189X doi: 10.3176/oil.2012.4.05 © 2012 Estonian Academy Publishers
AN ATR-FTIR PROCEDURE FOR QUANTITATIVE ANALYSIS OF MINERAL CONSTITUENTS AND KEROGEN IN OIL SHALE
SUJEEWA S. PALAYANGODA, QUOC P. NGUYEN* University of Texas at Austin, Center for Petroleum and Geosystems Engineering, 1 University Station C0304, Austin, TX 78712
Abstract. Principal component regression (PCR) was used to develop calibration and prediction models for determination of mineral content of complex mineral mixtures by utilizing attenuated total reflectance Fourier transform infrared (ATR-FTIR) spectra. The typical constituents of oil shale such as dawsonite, nahcolite, quartz, dolomite, illite, albite, analcime, and kerogen were used to prepare samples to record mid-infrared (IR) spectra. The specified values of dawsonite, nahcolite, quartz, dolomite and kerogen were in good agreement with measured data. Keywords: ATR-FTIR, PCR, oil shale, pyrolysis, chemometrics.
1. Introduction
An accurate, fast and simple quantitative analysis of components in complex mineral mixtures has been an area of interest for several decades because true information about minerals and hydrocarbon resources is useful for many industrial applications, including oil shale recovery [1]. Pyrolysis of oil shale is highly affected by the minerals contained, such as dawsonite, dolomite, quartz, and nahcolite [2]. It is believed that the mineral matter present in oil shale has a significant influence on the thermally induced catalytic alteration of kerogen during petroleum formation [3]. Oil shale is a fine-grained sedimentary rock containing organic matter called kerogen, and a relatively large amount of minerals [4]. Kerogen is a macro-molecular heteropolymer which is insoluble in common organic solvents. The mineral constituents and kerogen type of oil shale vary by sediment [2]. Quantitative determination of major mineral components and kerogen in oil shale is still a painstaking process because the diversity and complex composition of mineral mixtures as well as kerogen make the use of conventional analytical
* Corresponding author: e-mail [email protected]

An ATR-FTIR Procedure for Quantitative Analysis of Mineral Constituents and Kerogen in Oil Shale
345
methods difficult. Currently, complex chemical analysis and expensive analytical instruments are typically utilized for the quantitative analysis of mineral mixtures. These methods require special sample preparation skill and considerable analysis time. X-ray powder diffraction (XRD) can also be used to get quantitative data but is limited to minerals having distinct crystal structure [5]. All these techniques are employed only in specified laboratories.
However, infrared spectroscopy can be a promising alternative method to develop new analytical techniques because it requires less time intensive sample preparation, less experimental time and less manual skill. Solomon and Miknis [6] have reported that infrared spectroscopy is an economical and well-established method for the qualitative and quantitative analysis of aliphatic hydrogen. Though in the electromagnetic radiation the IR region spreads from 10 to 13000 cm–1 , only the mid-IR region (400–4000 cm–1) is utilized in conventional IR analysis because fundamental vibrations of functional groups which are subject to analysis belong to this region [7].
Absorption spectra were taken and analyzed according to Beer’s law. It is assumed that this law is an additive for a multicomponent system at a given frequency [7]:
A = –log10 (T) = ε c ℓ,
where A is the absorbance of a single- or multicomponent system, T is the transmittance of a single- or multicomponent system, ε is the molar extinc-tion coefficient (cm2/mol), c is the concentration (mol/l), and ℓ is the path length (cm).
The infrared spectra of minerals can be recorded using different infrared spectroscopic techniques such as transmission infrared (TIR), attenuated total reflectance Fourier transform infrared (ATR-FTIR), and diffuse reflectance infrared Fourier transform (DRIFT) spectroscopies. Transmittance and DRIFT spectroscopic studies clearly identify functional groups associated with mineral components, and have reported good agreement between experimental and theoretical data [1, 6]. Compared to ATR-FTIR spectroscopy these methods still require time-consuming sample preparation. On the other hand, transmittance spectroscopic measurements require very small sample amounts, and the uniformity of the sample with KBr may be questionable to be achieved. However, ATR-FTIR spectroscopy only requires a finely-ground sample to generate a representative spectrum. Combining ATR-FTIRS data with multivariate calibration and generating a model will help us to predict mineral content directly from the mixture of minerals. The ATR-FTIR procedure proposed by the authors has a potential to implement simple analysis and replace traditional and complex laboratory analytical methods.
The vibrational frequencies of functional groups, such as C–C, C–H, C=C, O–H, C=O and N–H, are directly used to get qualitative information, but quantitative analysis requires more assistance from sophisticated mathematical procedures to deal with combinations of thousands of
Sujeewa S. Palayangoda et al.
346
variables. The heterogeneity of a sample results in a spectrum that is quite difficult to interpret. This is another reason why quantitative studies require the help of multivariate data analysis. Multivariate chemometric analysis allows its users to create a mathematical representation or chemometric model of their data [8]. The most important purpose of chemometrics is to quantitatively estimate component concentrations in a mixture. Chemo-metrics can help us to find the solution to a problem once conventional approaches are found to be inadequate or inappropriate, and also enables us to understand the chemical and physical nature of a system of interest which are difficult to understand using raw spectra [9].
The aim of this paper was to investigate the usefulness of ATR-FTIR spectroscopic data combined with the chemometric method to obtain an estimation of the mineral composition of complex mineral mixtures, with or without organic matter like kerogen, in a simple and rapid manner. Calibra-tion models were developed only for dolomite, quartz, dawsonite, nahcolite and kerogen. Dolomite and quartz are the main minerals in oil shale [4]. Minerals such as dawsonite and nahcolite interfere with the pyrolysis process of kerogen [10]. First, only seven major mineral components were utilized to prepare samples and then the chemometric technique was applied for the determination of mineral yields in the mixture. Second, the samples were prepared with added kerogen as the 8th component to the mineral mixtures and the same procedure was followed for quantification. To the best of our knowledge, a study of the potential of ATR-FTIR spectroscopy for quantitative analysis of complex organic and mineral mixtures in natural oil shales has not been previously reported.
2. Experimental 2.1. Materials, instruments and methods
Dawsonite (DAW), nahcolite (NACO), quartz (QTZ), dolomite (DOLO), alabite (ALB), illite (ILL), analcime (ANL), and kerogen (KERO) were used to prepare samples. Synthetic dawsonite and kerogen were supplied by Shell Company. Illite was obtained from Ward’s Natural Science Inc., USA. The other minerals were obtained from Alfa Aesar, USA.
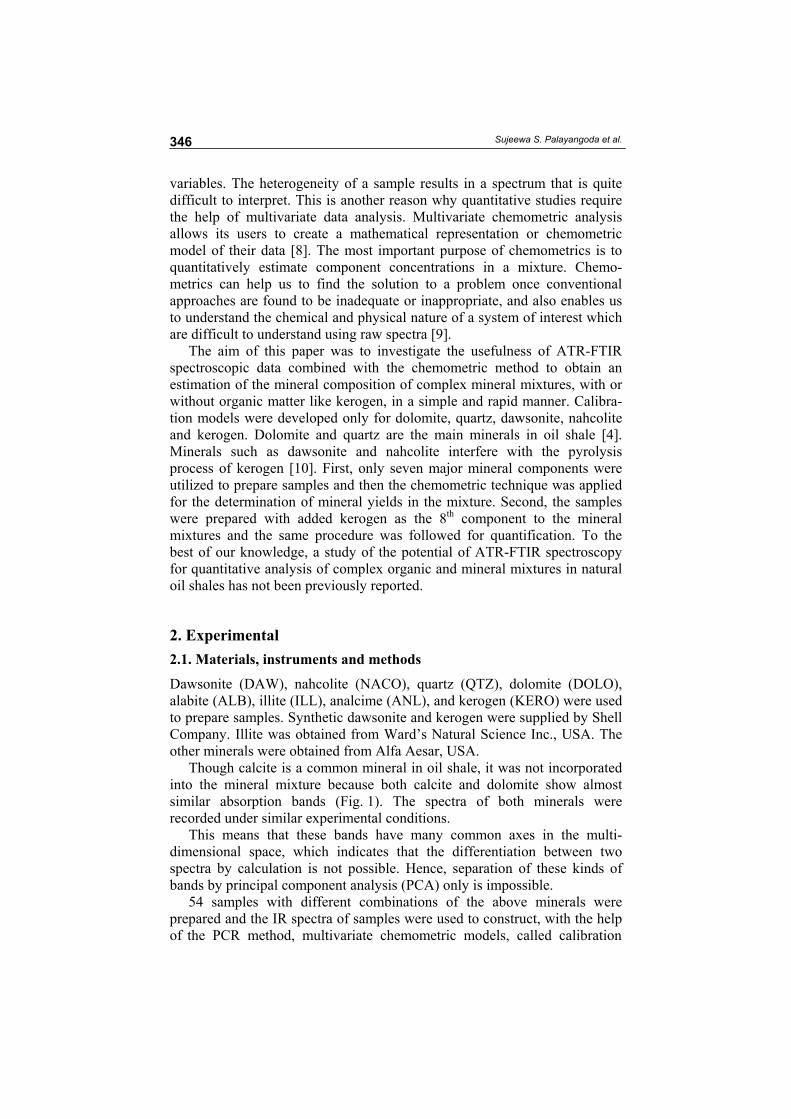
Though calcite is a common mineral in oil shale, it was not incorporated into the mineral mixture because both calcite and dolomite show almost similar absorption bands (Fig. 1). The spectra of both minerals were recorded under similar experimental conditions.
This means that these bands have many common axes in the multi-dimensional space, which indicates that the differentiation between two spectra by calculation is not possible. Hence, separation of these kinds of bands by principal component analysis (PCA) only is impossible.
54 samples with different combinations of the above minerals were prepared and the IR spectra of samples were used to construct, with the help of the PCR method, multivariate chemometric models, called calibration
An ATR-FTIR Procedure for Quantitative Analysis of Mineral Constituents and Kerogen in Oil Shale
347
0
0.05
0.1
0.15
0.2
0.25
4000
3816
3632
3448
3264
3080
2896
2712
2528
2344
2160
1976
1792
1608
1424
1240
1056 872
688
Wavenumber, cm-1
Abs
orba
nce DOLO
CAL
Fig. 1. IR spectra of calcite and dolomite.
models in this work. A detailed description of the PCR method may be found elsewhere [11, 12]. The upper and lower limits of weight percentages of these minerals (Table 1) were selected to represent the average ranges of composition commonly encountered in the oil shale samples examined. Six more samples were prepared with arbitrary combinations of minerals to verify model predictions. The weight percentages of minerals of these six samples lie within the specified ranges as shown in Table 1.
Initially, all the mineral samples were ground using a pestle and a mortar, and sieved employing a US standard test sieve with an ASTM E-11 specifica-tion. The samples were mixed and ground until they were uniform. The uniformity of a sample was confirmed by recording spectra of five aliquots of each sample and checking the reproducibility of each. This procedure was followed for each ground sample under conventional laboratory conditions.
A Perkin-Elmer 100 FTIR spectrometer was used for FTIR analysis. The sampling station was equipped with an overhead ATR accessory. The ATR diamond crystal was carefully cleaned with pure isopropanol between measurements. 10 mg of a powdered sample was carefully placed on the diamond crystal surface and each spectrum was recorded as absorbance under 100 N. The spectra were scanned between 4000 and 650 cm–1 at a resolution of 4 cm–1.
Table 1. Specified weight percentage ranges of minerals and kerogen
Mineral Lower limit, % Upper limit, %
Nahcolite 0 30 Dawsonite 0 15 Quartz 20 35 Alabite 5 15 Dolomite 5 30 Illite 0 25 Analcime 0 15 Kerogen 0 25
Wavenumber, cm–1

Sujeewa S. Palayangoda et al.
348
3. Results and discussion
In the first phase of experiment, a set of 46 samples (the mixture of minerals) was used for analysis and development of calibration models without incorporating kerogen. The most important physical factor to be considered in quantitative solid-state IR spectrometry is particle size. There is a reduction of light loss by reflection and scattering and the intensity of an absorption band increases from an apparent absorption to its true absorption value with decreasing particle size [13]. Another important advantage of small particle size is that it reduces the baseline effect. The particle size of each calibration and prediction sample was approximately 50 µm in our experiment. Particle size consistency is very important in order to achieve accurate prediction [14].
Though mechanical grinding using a Wig-L-Bug with a metal vial is more efficient, we employed hand grinding using a pestle and a mortar because extensive grinding may cause polymorphic transformation or altera-tion of mineral composition. Vibrating a sample in a stainless steel Wig-L-Bug for more than 1 minute will cause dehydration of gypsum [15]. Calcite may transform into aragonite by grinding in a mortar [16]. This scenario could be expected from other minerals too.
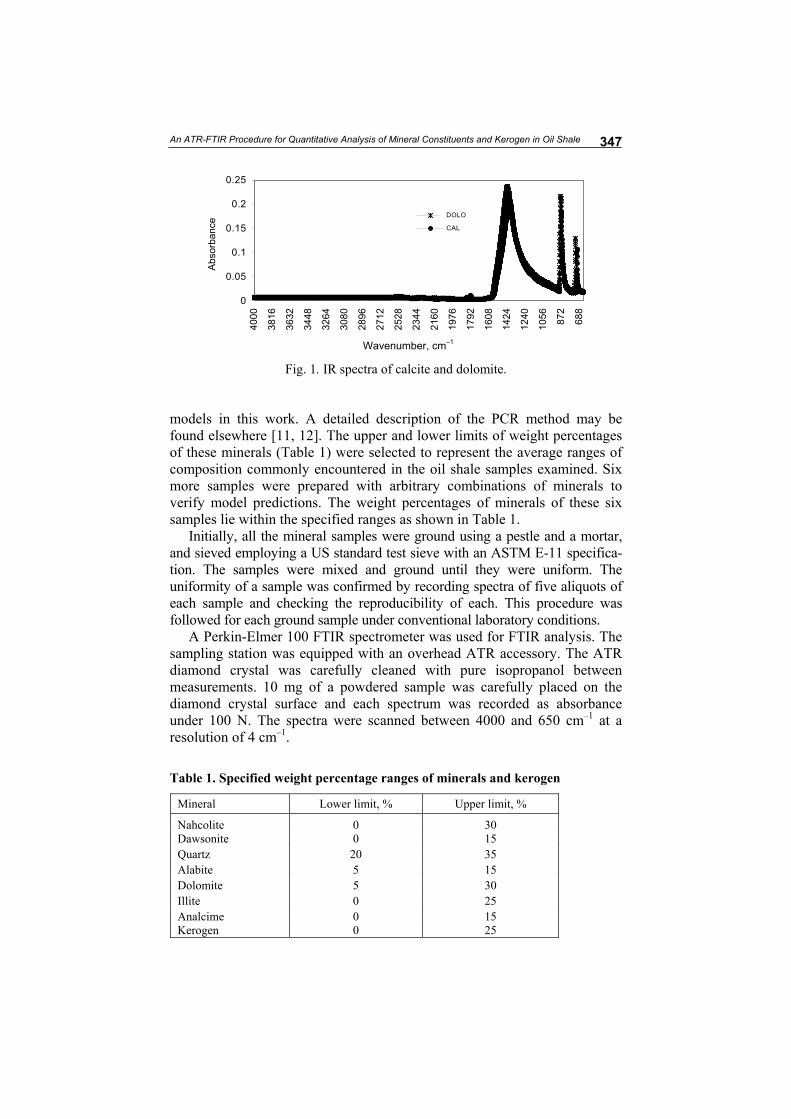
Figure 2 (a) depicts IR spectra of seven minerals. It is clearly seen that the IR spectra of dawsonite, nahcolite, dolomite and quartz significantly mask those of the other minerals. Quartz is common in each calibration and prediction sample and the Si–O peak around 1048 cm–1 covers a significant area in the finger print region in the IR spectrum where illite 980 (m), 794 (w); albite 1094 (w), 981 (w), 742 (w); and analcime 976 (m), 736 (w) give prominent bands (Table 2). The overlapping bands of minerals significantly affect the representation of other spectra in the calibration and prediction processes [1].
The broad band around 3283 cm–1 is attributed to the O–H stretching vibration of dawsonite and this vibration band has covered a similar stretching of quartz and nahcolite (Fig. 2 (b)). Since all calibration and prediction samples contain quartz, its Si–O stretching vibration gives the
Table 2. Infrared absorption bands of minerals and kerogen [17]
Mineral Wavenumber, cm–1 (intensity)
Dawsonite 3266 (s), 1556 (s), 1390 (s), 1096 (m), 950 (s), 845 (s), 679 (s) Nahcolite 2448 (vw), 1907 (vw), 1608 (s), 1261 (s), 985 (s), 829 (s), 684 (s) Quartz 3324 (vw), 1048 (s), 951 (w), 790 (m) Albite 1141 (vw), 1094 (w), 981 (s), 742 (w) Dolomite 1419 (s), 877 (s), 728 (m) Illite 3601 (vw), 1477 (vw), 980 (s), 794 (m) Analcime 1626 (vw), 976 (s), 736 (w) Kerogen 2900–2920 (m), 1420–1450 (w)
very weak = vw, weak = w, medium = m, strong = s, broad = b
An ATR-FTIR Procedure for Quantitative Analysis of Mineral Constituents and Kerogen in Oil Shale
349
Fig. 2. Absorption spectra of minerals: (a) individual, (b) composite.
main contribution to the strong band centered around 1060 cm–1 (Fig. 2 (b)), but there may be several unresolved bands in it. The band centered around 1577 cm–1 is mainly from the –CO3 vibration of dawsonite, but also contains several unresolved bands. In addition, the 1395 cm–1 band is a characteristic –CO3 vibration of dawsonite. Table 2 summarizes the main IR frequencies of minerals and kerogen.
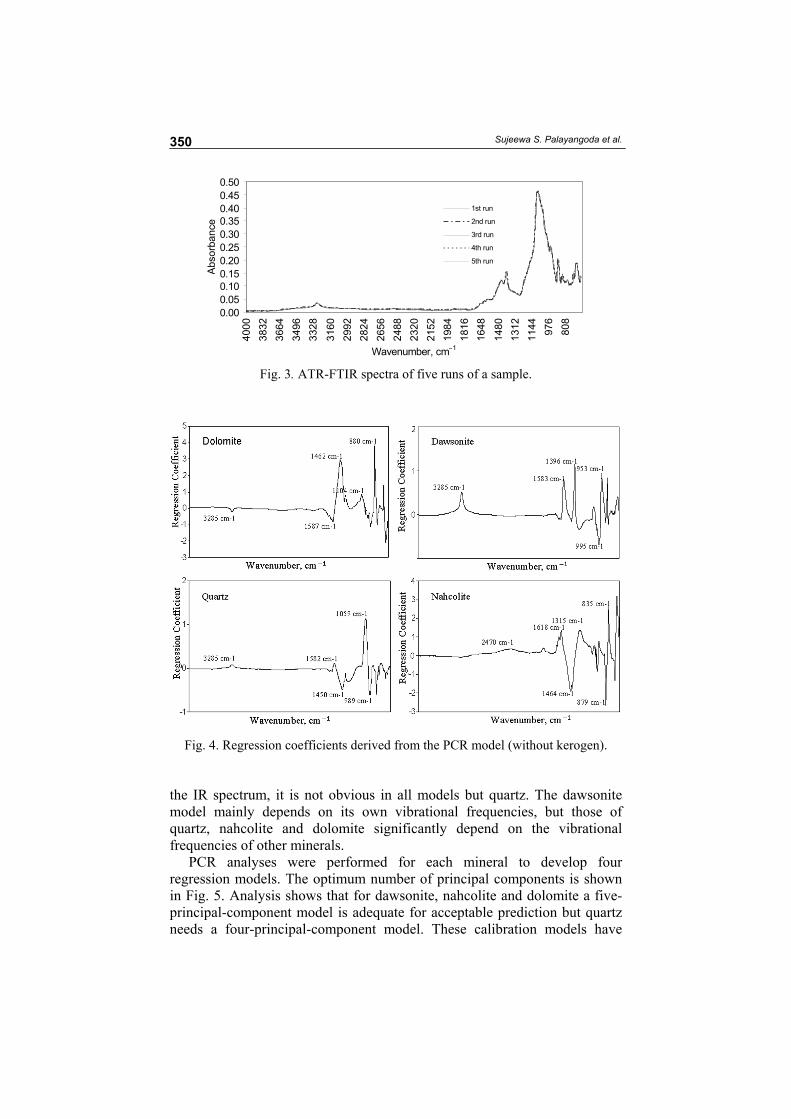
The uniformity of each sample was confirmed by taking five spectra (Fig. 3 ). Preparation of a sample with proper uniformity is a key factor to lead to accurate quantitative estimation.
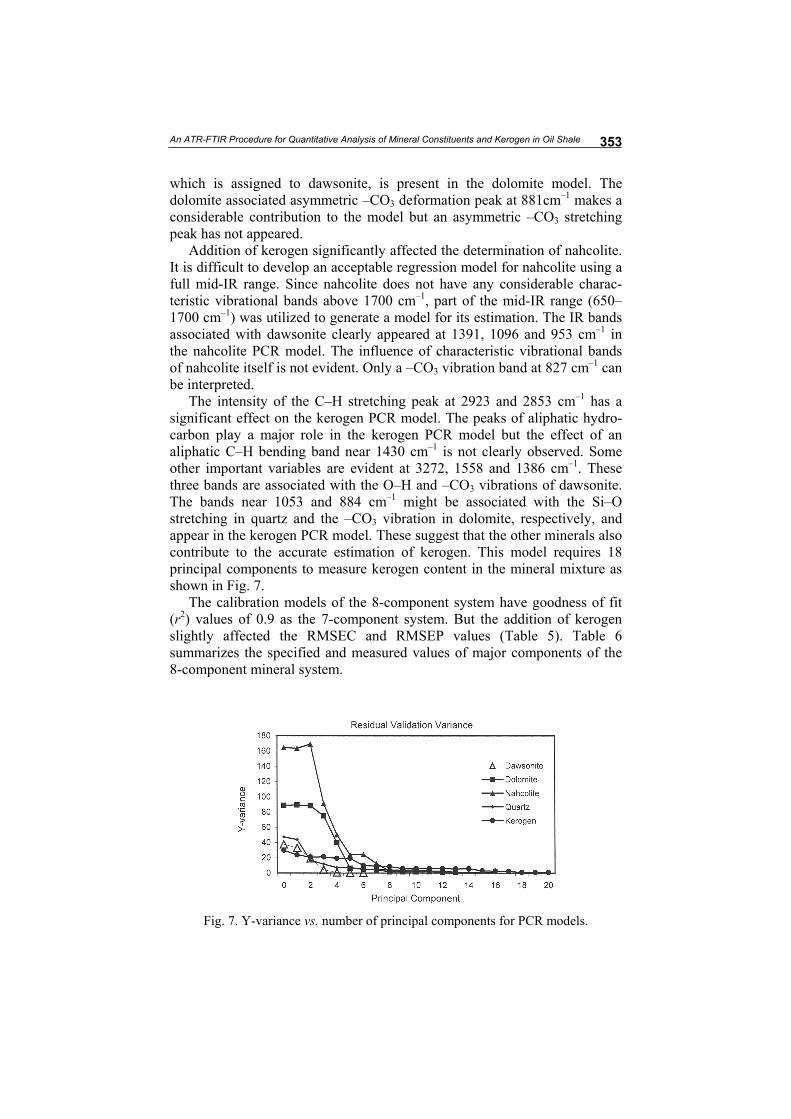
The final regression coefficients in the PCR models across the mid-IR region are shown in Fig. 4. Each spectrum in Fig. 4 is not a pure component spectrum but a convolution of the spectra of constituents in the sample. These spectra are useful for a qualitative interpretation of the contribution of IR frequencies of constituent minerals to the respective calibration model. Therefore, it has been noted that the spectra obtained by PCR are chemically meaningless. The peaks near 3280 and 1580 cm–1, which belong to the –OH vibration of dawsonite, appear in all models except for nahcolite. But the –CO3 vibration of dawsonite around 1390 cm–1 appears in dawsonite and quartz models. Though we expect a strong influence of the Si-O stretching of quartz around 1050 cm–1 on PCR models because of its strong intensity in
Wavenumber, cm–1
Wavenumber, cm–1
Sujeewa S. Palayangoda et al.
350
0.000.050.100.150.200.250.300.350.400.450.50
4000
38
32
3664
34
96
3328
31
60
2992
28
24
2656
24
88
2320
21
52
1984
18
16
1648
14
80
1312
11
44
976
808
Wavenumber, cm–1
Abs
orba
nce
1st run
2nd run
3rd run
4th run
5th run
Fig. 3. ATR-FTIR spectra of five runs of a sample.
Fig. 4. Regression coefficients derived from the PCR model (without kerogen).
the IR spectrum, it is not obvious in all models but quartz. The dawsonite model mainly depends on its own vibrational frequencies, but those of quartz, nahcolite and dolomite significantly depend on the vibrational frequencies of other minerals.
PCR analyses were performed for each mineral to develop four regression models. The optimum number of principal components is shown in Fig. 5. Analysis shows that for dawsonite, nahcolite and dolomite a five-principal-component model is adequate for acceptable prediction but quartz needs a four-principal-component model. These calibration models have

An ATR-FTIR Procedure for Quantitative Analysis of Mineral Constituents and Kerogen in Oil Shale
351
goodness of fit (r2) values of 0.9, and the root mean square error of calibra-tion (RMSEC) and the root mean square error of prediction (RMSEP) of approximately 1 (Table 3). Table 4 shows the specified and measured amounts of minerals with deviations less than 2%. For almost all the minerals there was good agreement between measured and specified values.
Addition of kerogen negligibly affects the dawsonite PCR model (Fig. 6). A small aliphatic C-H stretching peak is noticeable at 2922 cm–1. Both the abstract spectra of dawsonite are almost similar (Figs. 4 and 6). This means that the addition of kerogen practically does not affect, or affects negligibly, the dawsonite PCR model and both models require five principal components.
Fig. 5. Y-variance vs. number of principal components for PCR models.
Table 3. Statistical results for the main components of a 7-component system
PCR model RMSEC RMSEP r2-C r2-P Dawsonite 0.845 0.868 0.982 0.981 Nahcolite 1.151 1.241 0.988 0.987 Dolomite 1.098 1.159 0.986 0.985 Quartz 0.722 0.753 0.988 0.987
Table 4. Analysis of synthetic 7-component mineral mixtures
Sample Mineral Specified, % Measured, % Dawsonite 10.0 10.7
1 Nahcolite 15.0 17.7 Dolomite 20.0 19.3 Quartz 25.0 26.8 Dawsonite 5.0 5.5
2 Nahcolite 20.0 20.6 Dolomite 10.0 7.5 Quartz 20.0 21.2 Dawsonite 15.0 15.3
3 Nahcolite 25.0 23.5 Dolomite 30.0 28.8 Quartz 30.0 29.0

Sujeewa S. Palayangoda et al.
352
Fig. 6. Regression coefficients derived from the PCR model (with kerogen).
However, the models of dolomite and quartz are considerably influenced by kerogen. The optimum number of principal components required to fit a good model considerably increased for quartz and dolomite, to six and eight, respectively. Benoudjit [18] reported that 30 principal components were required for their PCR calibration model to get a good estimation of alcohol in wine samples. Also, McQueen [19] reported that eight and six principal components were required for their PLS2 (partial least squares) regression model to predict respectively fat and moisture in cheese samples.
As could be expected, the Si–O strectching band of quartz at 1049 cm–1 has a significant effect on its PCR model. The model of dolomite has a clear effect on dawsonite. The characteristic O–H stretching peak at 3278 cm–1,
An ATR-FTIR Procedure for Quantitative Analysis of Mineral Constituents and Kerogen in Oil Shale
353
which is assigned to dawsonite, is present in the dolomite model. The dolomite associated asymmetric –CO3 deformation peak at 881cm–1 makes a considerable contribution to the model but an asymmetric –CO3 stretching peak has not appeared.
Addition of kerogen significantly affected the determination of nahcolite. It is difficult to develop an acceptable regression model for nahcolite using a full mid-IR range. Since nahcolite does not have any considerable charac-teristic vibrational bands above 1700 cm–1, part of the mid-IR range (650–1700 cm–1) was utilized to generate a model for its estimation. The IR bands associated with dawsonite clearly appeared at 1391, 1096 and 953 cm–1 in the nahcolite PCR model. The influence of characteristic vibrational bands of nahcolite itself is not evident. Only a –CO3 vibration band at 827 cm–1 can be interpreted.
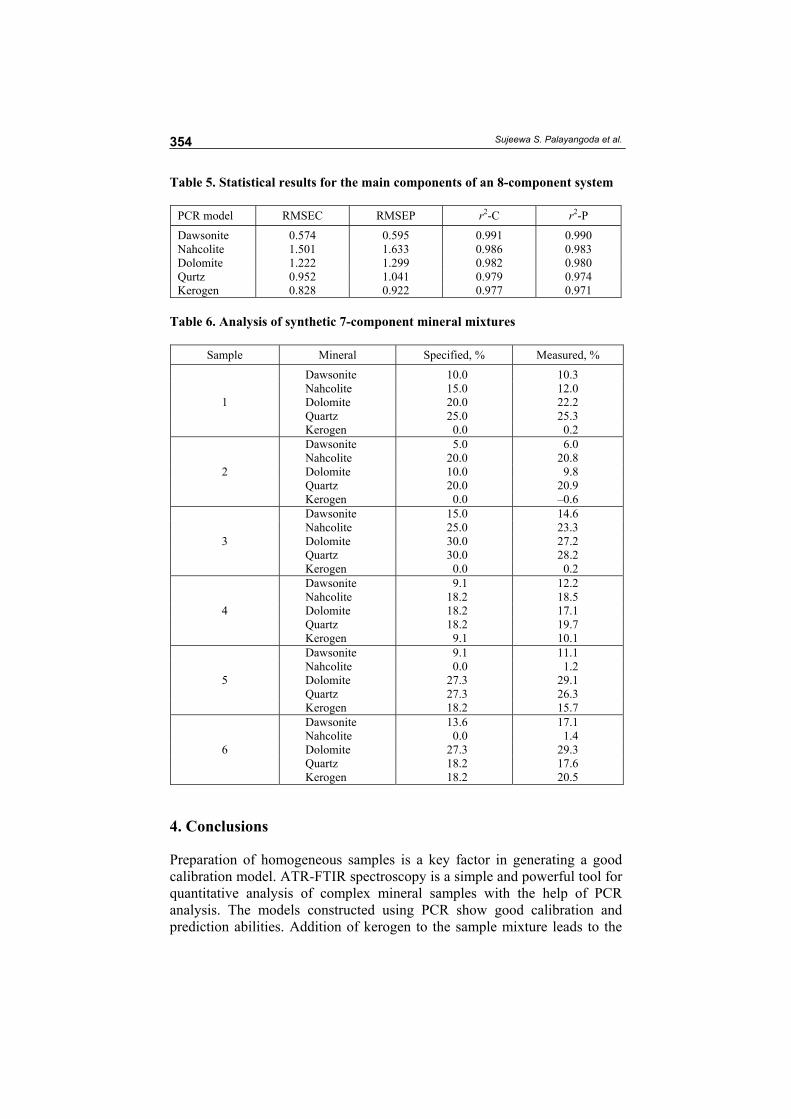
The intensity of the C–H stretching peak at 2923 and 2853 cm–1 has a significant effect on the kerogen PCR model. The peaks of aliphatic hydro-carbon play a major role in the kerogen PCR model but the effect of an aliphatic C–H bending band near 1430 cm–1 is not clearly observed. Some other important variables are evident at 3272, 1558 and 1386 cm–1. These three bands are associated with the O–H and –CO3 vibrations of dawsonite. The bands near 1053 and 884 cm–1 might be associated with the Si–O stretching in quartz and the –CO3 vibration in dolomite, respectively, and appear in the kerogen PCR model. These suggest that the other minerals also contribute to the accurate estimation of kerogen. This model requires 18 principal components to measure kerogen content in the mineral mixture as shown in Fig. 7.
The calibration models of the 8-component system have goodness of fit (r2) values of 0.9 as the 7-component system. But the addition of kerogen slightly affected the RMSEC and RMSEP values (Table 5). Table 6 summarizes the specified and measured values of major components of the 8-component mineral system.
Fig. 7. Y-variance vs. number of principal components for PCR models.
Sujeewa S. Palayangoda et al.
354
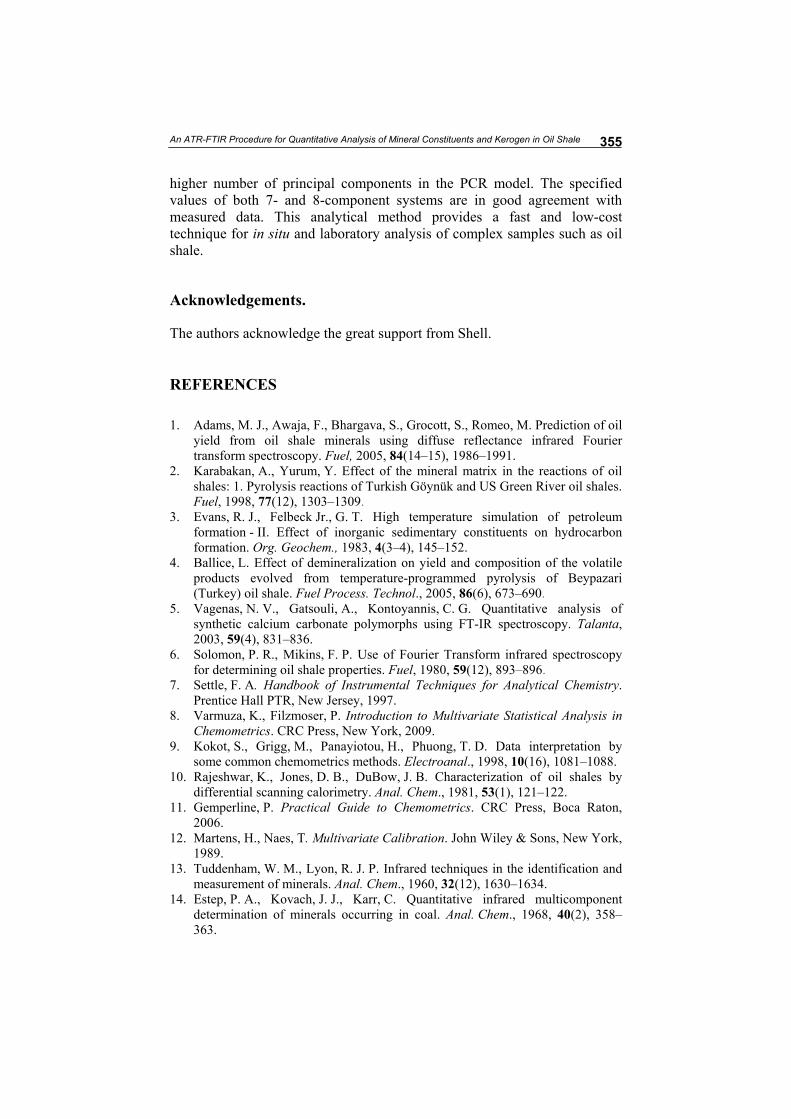
Table 5. Statistical results for the main components of an 8-component system
PCR model RMSEC RMSEP r2-C r2-P
Dawsonite 0.574 0.595 0.991 0.990 Nahcolite 1.501 1.633 0.986 0.983 Dolomite 1.222 1.299 0.982 0.980 Qurtz 0.952 1.041 0.979 0.974 Kerogen 0.828 0.922 0.977 0.971
Table 6. Analysis of synthetic 7-component mineral mixtures
Sample Mineral Specified, % Measured, %
Dawsonite 10.0 10.3 Nahcolite 15.0 12.0
1 Dolomite 20.0 22.2 Quartz 25.0 25.3 Kerogen 0.0 0.2 Dawsonite 5.0 6.0 Nahcolite 20.0 20.8
2 Dolomite 10.0 9.8 Quartz 20.0 20.9 Kerogen 0.0 –0.6 Dawsonite 15.0 14.6 Nahcolite 25.0 23.3
3 Dolomite 30.0 27.2 Quartz 30.0 28.2
Kerogen 0.0 0.2 Dawsonite 9.1 12.2 Nahcolite 18.2 18.5
4 Dolomite 18.2 17.1 Quartz 18.2 19.7 Kerogen 9.1 10.1 Dawsonite 9.1 11.1 Nahcolite 0.0 1.2
5 Dolomite 27.3 29.1 Quartz 27.3 26.3 Kerogen 18.2 15.7 Dawsonite 13.6 17.1 Nahcolite 0.0 1.4
6 Dolomite 27.3 29.3 Quartz 18.2 17.6 Kerogen 18.2 20.5
4. Conclusions
Preparation of homogeneous samples is a key factor in generating a good calibration model. ATR-FTIR spectroscopy is a simple and powerful tool for quantitative analysis of complex mineral samples with the help of PCR analysis. The models constructed using PCR show good calibration and prediction abilities. Addition of kerogen to the sample mixture leads to the
An ATR-FTIR Procedure for Quantitative Analysis of Mineral Constituents and Kerogen in Oil Shale
355
higher number of principal components in the PCR model. The specified values of both 7- and 8-component systems are in good agreement with measured data. This analytical method provides a fast and low-cost technique for in situ and laboratory analysis of complex samples such as oil shale.
Acknowledgements.
The authors acknowledge the great support from Shell. REFERENCES
1. Adams, M. J., Awaja, F., Bhargava, S., Grocott, S., Romeo, M. Prediction of oil yield from oil shale minerals using diffuse reflectance infrared Fourier transform spectroscopy. Fuel, 2005, 84(14–15), 1986–1991.
2. Karabakan, A., Yurum, Y. Effect of the mineral matrix in the reactions of oil shales: 1. Pyrolysis reactions of Turkish Göynük and US Green River oil shales. Fuel, 1998, 77(12), 1303–1309.
3. Evans, R. J., Felbeck Jr., G. T. High temperature simulation of petroleum formation - II. Effect of inorganic sedimentary constituents on hydrocarbon formation. Org. Geochem., 1983, 4(3–4), 145–152.
4. Ballice, L. Effect of demineralization on yield and composition of the volatile products evolved from temperature-programmed pyrolysis of Beypazari (Turkey) oil shale. Fuel Process. Technol., 2005, 86(6), 673–690.
5. Vagenas, N. V., Gatsouli, A., Kontoyannis, C. G. Quantitative analysis of synthetic calcium carbonate polymorphs using FT-IR spectroscopy. Talanta, 2003, 59(4), 831–836.
6. Solomon, P. R., Mikins, F. P. Use of Fourier Transform infrared spectroscopy for determining oil shale properties. Fuel, 1980, 59(12), 893–896.
7. Settle, F. A. Handbook of Instrumental Techniques for Analytical Chemistry. Prentice Hall PTR, New Jersey, 1997.
8. Varmuza, K., Filzmoser, P. Introduction to Multivariate Statistical Analysis in Chemometrics. CRC Press, New York, 2009.
9. Kokot, S., Grigg, M., Panayiotou, H., Phuong, T. D. Data interpretation by some common chemometrics methods. Electroanal., 1998, 10(16), 1081–1088.
10. Rajeshwar, K., Jones, D. B., DuBow, J. B. Characterization of oil shales by differential scanning calorimetry. Anal. Chem., 1981, 53(1), 121–122.
11. Gemperline, P. Practical Guide to Chemometrics. CRC Press, Boca Raton, 2006.
12. Martens, H., Naes, T. Multivariate Calibration. John Wiley & Sons, New York, 1989.
13. Tuddenham, W. M., Lyon, R. J. P. Infrared techniques in the identification and measurement of minerals. Anal. Chem., 1960, 32(12), 1630–1634.
14. Estep, P. A., Kovach, J. J., Karr, C. Quantitative infrared multicomponent determination of minerals occurring in coal. Anal. Chem., 1968, 40(2), 358–363.
Sujeewa S. Palayangoda et al.
356
15. Morris, R. J. Infrared spectrophotometric analysis of calcium sulfate hydrates using internally standardized mineral oil mulls. Anal. Chem., 1963, 35(10), 1489–1492.
16. Dachille, F., Roy, R. High-pressure phase transformations in laboratory mechanical mixers and mortars. Nature, 1960, 186, 34–71.
17. Crews, P., Rodriguez, J., Jaspars, M. Organic Structure Analysis. Oxford University Press, New York, 1998.
18. Benoudjit, N., Cools, E., Meurens, M., Verleysen, M. Chemometric calibration of infrared spectrometers: selection and validation of variables by non-linear models. Chemom. Intell. Lab. Syst., 2004, 70(1), 47–53.
19. McQueen, D. H., Wilson, R., Kinnunen, A. Near and mid-infrared photo-acoustic analysis of principal components of foodstuffs. Trends Anal. Chem., 1995, 14(10), 482–492.
Presented by E. Suuberg Received February 1, 2012