an economic evaluation of the futuredairy complementary...
TRANSCRIPT

An Economic Evaluation of the FutureDair y Complementar y Forage Rotation System – Using Whole Farm Budgeting
M AY 2009
45E CO N O M I C R E S E A R C H R E P O R T N O. 45 ( AU G U S T 2009)
Andrew Alford Livestock Research Officer, Industry & Investment NSW, Armidale
S. C. (Yani) Garcia Associate Professor, Project Leader – FutureDairy, University of Sydney
Santiago Farina PhD Scholar, University of Sydney
Bill Fulkerson Formerly, Chair of Dairy Science, University of Sydney
W W W. I N D U S T R Y. N S W. G O V. A U

An Economic Evaluation of the FutureDairy Complementary Forage Rotation System – Using Whole Farm
Budgeting
Andrew Alford Livestock Research Officer, Industry & Investment NSW, Armidale
S.C. (Yani) Garcia
Associate Professor, Project Leader - FutureDairy, University of Sydney
Santiago Farina
PhD Scholar, University of Sydney
Bill Fulkerson Formerly, Chair of Dairy Science, University of Sydney
Economic Research Report No. 45
August 2009

ii
Industry & Investment 2009 This publication is copyright. Except as permitted under the Copyright Act 1968, no part of the publication may be reproduced by any process, electronic or otherwise, without the specific written permission of the copyright owner. Neither may information be stored electronically in any way whatever without such permission. Abstract A complementary forage rotation (CFR) aims to achieve high levels of home-grown forage to complement high performance dairy pastures. An economic evaluation of the CFR technology is undertaken by combining biophysical modelling with preliminary results from farm trials conducted at the University of Sydney’s Corstorphine Dairy. This data is applied to steady state whole farm budgets to compare four alternate or progressive scenarios that might be considered by farmers looking at the potential to increase farm productivity through their feeding system beyond a base farm scenario. A base scenario of a relatively well managed dairy farm in NSW, with 140 ha of milking area, stocked at 2.4 cows/ha, utilises about 12 t DM/ha/year under irrigation and produces more than 16,000 L/ha/year from 6,900 L/cow, achieves 0.9 per cent return on assets. A system with improved pasture management over the base scenario, utilising 15.6 t DM/ha/year and 1.3 t DM/cow/lactation of concentrates to achieve 6,900 L/cow obtains 3.4 per cent return on assets. A production system where pasture and supplement (concentrates) are emphasised achieves 6 per cent return on assets (3.7 cows/ha, 9,000L/cow and 2.3 t DM/cow/lactation concentrates). In comparison the CFS system obtains a return on total assets of 8 to 12 per cent, based upon actual or targeted (best case) forage yield results, respectively. The CFS-based farm business becomes relatively more profitable when scenarios with increased cost of fertiliser, water and especially grain are examined. A production system incorporating the complementary forage rotation (CFS) has the potential to be profitable. However, these analyses are based upon a steady state situation, after the implementation of the systems on farm, and implementation costs associated with adopting the technology on individual farms should be considered. Keywords: dairy; complementary forage rotation; pasture; Maize silage; legume; Brassica; economic; evaluation; Australia JEL Code: Q160 ISSN 1442-9764 ISBN 978 1 74256 028 1 Senior Author's Contact: Dr Andrew Alford, Industry & Investment NSW, Beef Industry Centre, JSF Barker Building, University of New England, Armidale, NSW, 2351. Telephone:(02) 67 701 813 Facsimile:(02) 67 701 830 Email:[email protected] Citation: Alford, A.R., Garcia, S.C., Farina, S. and Fulkerson, W.J. (2009), An Economic Evaluation of the FutureDairy Complementary Forage Rotation System - Using Whole Farm Budgeting, Economic Research Report No. 45, Industry & Investment NSW, Armidale, August.

iii
Table of Contents List of Tables............................................................................................................................. iv
List of Figures ........................................................................................................................... iv
Acknowledgments...................................................................................................................... v
Acronyms and Abbreviations Used in the Report...................................................................... v
Executive Summary .................................................................................................................. vi
1. Introduction ........................................................................................................................ 1
2. Method and Key Physical and Economic Assumptions..................................................... 2
2.1. Corstorphine farm trials ............................................................................................ 3
2.2. Whole farm scenarios modelled................................................................................ 4
3. Results and Discussion..................................................................................................... 10
3.1. Comparison of scenarios ......................................................................................... 10
3.2. Sensitivity Testing................................................................................................... 12
4. Conclusions ...................................................................................................................... 19
References ................................................................................................................................ 20
Appendix 1: Pasture and CFR Budgets used for Whole Farm Model .................................... 22

iv
List of Tables
Table 2.1 Utilised forage yields (t DM/ha) compared to targeted yields ................................... 4
Table 2.2 Whole farm scenarios tested ..................................................................................... 5
Table 2.3 Feed consumed for the different whole farm production system scenarios.............. 6
Table 2.4 Summary of income and cost assumptions used in the whole farm analyses........... 9
Table 3.1 Paid labour requirements......................................................................................... 11
Table 3.2 Additional capital expenditure for Scenarios 2 to 5................................................ 12
Table 3.3 Comparison of economic measures after investing additional capital.................... 12
Table 3.4 Sensitivity of farm operating profit and corresponding return on assets to changes
in prices of key inputs, land value, irrigation water, concentrate and urea fertiliser
................................................................................................................................ 14
Table 3.5 Relative sensitivity of the various scenario’s operating profit to increases in the unit
cost of three major feed related inputs ................................................................... 16
Table 3.6 Sensitivity of scenario production systems’ net profit ($/ha) to key input costs .... 17
Table 3.7 Sensitivity of scenario production systems’ return on assets (%) to key input costs
................................................................................................................................ 18
List of Figures Figure 2.1 CFR area forage crop annual calendar...................................................................... 3
Figure 2.2 Diet composition (kgDM/cow/day) and milk production (L/cow/day)...................4
Figure 3.1 Comparison of Income and Return on Assets (RoA) ............................................. 11
Figure 3.2 Comparison of Gross Margin and Net Profit.......................................................... 11
Figure 3.3 Impact on operating profit of increasing a) irrigation water; b) concentrate costs
and c) urea fertiliser costs........................................................................................ 15

v
Acknowledgments The financial and in-kind support of Dairy Australia, the Industry & Investment NSW, the Department of Primary Industries Victoria and The University of Sydney is gratefully acknowledged. Importantly, the technical support of field staff of Industry & Investment NSW, Elizabeth Macarthur Agricultural Institute and University of Sydney, Camden while the trials were conducted is also gratefully recognised.
Acronyms and Abbreviations Used in the Report ABARE Australian Bureau of Agricultural and Resource Economics CDF Cumulative distribution function CFR Complementary Forage Rotation CFS Complementary Forage System DM Dry matter DPI Vic Department of Primary Industries, Victoria EMAI Elizabeth Macarthur Agricultural Institute, NSW DPI, Camden MilkBiz A dairy farm business management software package by Industry &
Investment NSW MJME Megajoules of metabolisable energy t tonnes

vi
Executive Summary
Australian dairy farmers manage their businesses in the context of a deregulated market that is exposed to competition and the protectionist vagaries functioning within the international dairy trade, which has historically resulted in declining terms of trade. Further, increased competition for land in many of Australia’s traditional dairying regions from both alternate agricultural and non-agricultural activities has increased the effective cost of operating dairy businesses. Dairy farmers respond by increasing farm productivity. Intensity of Australian dairy farming has seen increased stocking rates and production per cow. This has been achieved by increasing the quantity of purchased feed, particularly concentrates, and increased production of home-grown feed from pastures and forage crops. At the same time, the increasing cost of dairy land, projections of increased grain costs, and limited availability and increasing cost of irrigation, highlight the potential benefits of technologies aimed at increasing the production of home-grown feed. The complementary forage rotation (CFR) component of the Future Dairy project aims to achieve high levels of home-grown forage to complement high performance dairy pastures. A preliminary economic analysis of the potential impact of CFR in the East Gippsland area of Victoria has been completed, with major inputs by Dan Armstrong (DPI Vic). The study looked at two case studies, the”average” pasture-based dairy farm, in which the farmer may ask the question, what role, if any, could a CFR play in his/her farming system?; and the ”fodder reliant” dairy farm, in which the farmer may ask, how does growing more forage through a CFR compare to buying more land/water, or buying supplements or just doing what I currently do, better? The analysis concluded that a CFR had the potential to increase profit in both cases, but, as expected with strong dependence on forage yields and the proportion of the farm area devoted to CFR. Also as expected, implementation of CFR was more risky on the relatively small farm (55 ha), than on the fodder reliant farm (>270 ha). The implicit message highlighted in this analysis is that CFR can be a realistic option only after the potential of pasture utilisation has been fully exploited. Therefore, a step-wise analysis of the cost of feed production, risk, impact of infrastructure costs, and whole farm implementation is warranted, and this analysis is reported here. In this study, the economic evaluation of the CFR technology is extended from that presented in the companion report (Alford, Garcia, Farina and Fulkerson, 2009a), which evaluated the technology using variable cost budgets and cost budgets and risk based upon the data from paddock-scale trials at Elizabeth Macarthur Agricultural Institute (EMAI). Biophysical modelling combined with preliminary results from farm trials conducted at the University of Sydney’s Corstorphine Dairy were used to apply steady state whole farm budgets to compare alternate or progressive scenarios that might be considered by farmers looking at the potential to increase farm productivity through their feeding system. The economic whole farm evaluation was structured to address the following question:
Would an integrated combination of CFR and high production pasture (referred to as complementary forage system or CFS) be a potentially profitable alternative to other options such as growing and utilising more pasture or purchasing more feed?

vii
This question was addressed by a combination of physical and economic whole-farm modelling. Results clearly show that a CFS system has the potential to be profitable under the conditions and assumptions detailed in the modelling exercise. In this study, a base scenario describes a relatively well managed dairy farm in NSW. The farm, with 140 ha of milking area, is stocked at 2.4 total cows/ha, utilises about 12 t DM/ha/year under irrigation and produces more than 16,000 L/ha/year from 6,900 L/cow, and achieves 0.9 % return on assets. A pasture and supplement (concentrates) production system implemented on the base farm achieved 6 per cent return on assets (3.7 cows/ha, 9,000L/cow and 2.3 t DM/cow/lactation concentrates), while the CFS system achieved a return on total assets of 8 to 12 per cent, based upon actual or targeted (best case) forage yield results, respectively. The CFS-based farm business became relatively more profitable when scenarios with increased cost of fertiliser, water and especially grain were examined. However, these results looked at a steady state situation after the implementation of the systems on farm, and so do not look at implementation costs associated with adopting the technology on farm, which will be particularly dependent upon the current financial circumstances of individual farm businesses.

viii

1
1. Introduction Australian dairy farmers have increased farm productivity, in part through higher stocking rates and production per cow, in response to historically declining terms of trade and increased competition for resources, such as land and water. This has been achieved by increasing the quantity of purchased feed, particularly concentrates, and increased production of home-grown feed from pastures and forage crops (Lubulwa and Shafron, 2007). Consistent with these industry trends, the Future Dairy research program has investigated the potential for a complementary forage rotation (CFR) system. This system involves the use of an intensive forage rotation including Maize for silage, forage Brassica and a forage legume, to complement a pasture based production system. An economic evaluation of the CFR system using cost budgets was outlined in a companion report (Alford et al., 2009a) and indicated the potential role of the CFR as a competitive feed source to partially replace feeds such as concentrates. As discussed in Alford et al. (2009a), variable cost budgets are a necessary first step in the analysis of such a technology and can provide a generalised and transparent format for researchers and farmers to understand basic economic implications of the system. Such cost analyses are limited in their usefulness to evaluate the potential impact of a new technology on the whole farm business. Therefore, in this economic assessment of the CFR system, whole farm budgets for a representative farm are constructed and compared with some other potential production systems that might be applied to intensify a dairy business.

2
2. Method and Key Physical and Economic Assumptions The method used in this initial whole farm economic analysis was to derive a model farm based upon real data obtained from the Corstorphine dairy trial being conducted at the University of Sydney, in combination with industry data obtained from ABARE farm survey data. Several economic methodologies are frequently applied in the literature to undertake farm level evaluations. Broadly, these include budgeting techniques, linear and quadratic programming, dynamic programming and econometric approaches. Each of these broad methodologies differ in their data requirements and in the complexity of their development, as well as in their ability to measure the required components of the farm-level evaluation problem (Pannell, 1999). Two methods typically used as a means of initial assessment are technical efficiency ratios and partial budgets, given their limited information requirements (Ghodake and Hardaker, 1981). In the case of efficiency ratios, the new technology is compared with the traditional activity in terms of input output ratios. Obviously such an analysis does not take into account economic efficiency, and is thus of only limited use. In the case of the partial budgeting approach, the benefits of the technology under investigation are defined in monetary value terms, and an attempt is made to identify those costs that will be incurred or affected directly from its implementation on the farm. This includes extra income and costs obtained by the farm and income and costs forgone from implementing the new technology (Makeham and Malcolm, 1993). The costs include related variable and fixed costs, such as the additional capital investment and depreciation necessary to utilise the technology. These budgets are typically set up on an annual basis. Tronsco (1985) identifies two significant limitations of the partial budgeting approach to evaluate technologies at the farm level. Firstly, partial budgeting takes no account of the pervasive impacts of a new technology upon the whole-farm system and secondly, it cannot easily accommodate the impact of risk. However, as discussed in the next sub-section, stochastic budgeting techniques could equally be applied to partial budgets. Further, the use of partial budgets for the CFR technology are not easily applicable since the introduction of CFR to the farm system will result in a fundamental change in the entire feed base of the farm. However, this does not exclude the potential for partial adoption of the technology on a particular farm, which could potentially be analysed with the use of partial budgets. Gross margin analysis, cash flow and whole-farm budgeting are frequently applied methods for evaluating the economic benefits of new technologies at the farm level. These techniques are extensively reviewed by various authors including Dillon and Hardaker (1984), Makeham and Malcolm (1993) and Farquharson (1991). These budgets also form the basis for more advanced mathematical programming methods. Budgeting methods are relatively straightforward to develop and the technical and price assumptions applied can be transparent. A further advantage of budgeting methods is that they are able to incorporate various degrees of sensitivity analysis to investigate the impact of uncertainty on the evaluation results. Budgeting techniques can be extended further to incorporate uncertainty by the inclusion of probability distributions for selected variables (Hardaker et al., 1997).

3
A major limitation of these budgeting methods is that they cannot provide optimal farm plans, so the issue of how and to what extent a farm manager is likely to adopt a new technology amongst existing farm activities remains undetermined. However, their transparency and broad applicability are a good first step in economic analysis of a new technology such as CFR. 2.1. Corstorphine farm trials
A whole farm system study was conducted at University of Sydney Corstorphine Farm commencing in April 2007. The study farm used 21.5 ha, with 65 per cent of the area being kikuyu based pasture (Pennisetum clandestinum) oversown with short rotation ryegrass (Lolium multiflorum L.) in autumn, and 35 per cent CFR. The CFR is based on Maize (Zea mays L.) as the bulk crop, followed by Forage Rape (Brassica napus) and Persian Clover (Trifolium resupinatum) as described in Figure 2.1. The herd comprised of 100 Holstein-Friesian cows calving in two batches (autumn and spring). Oct Nov Dec Jan Feb Mar Apr May Jun Jul Aug Sep
Persian Clover
Forage Rape Maple Peas
Maize
Persian Clover
Figure 2.1 CFR area forage crop annual calendar Pasture grazing management was based on both number of live leaves/tiller (which for ryegrass is 2.5 leaves and for kikuyu four leaves) and biomass (target pre- and post-grazing pasture cover were defined as 2600 and 1400 kg DM/ha, respectively). Forage Rape was grazed when at least 4,500 kg DM/ha was on offer, while Persian Clover was grazed when there was approximately 2000 kg DM/ha on offer. Utilised forage was calculated as the difference between pre- and post-grazing using a Rising Plate Meter (RPM) for pasture, and forage cuts to ground level for Forage Rape and legumes. In addition, DM on each pasture paddock was assessed weekly using an Ellinbank Sound Meter, in order to calculate growth rate and estimate the feed allocation for that week accordingly. Preliminary results
Over 32,000 L/ha and 8,700 L/cow (rolling average) were achieved in the first year from a diet based on 82 per cent home grown feed. Figure 2.2 shows the daily milk production per cow and the composition of the diet through the year. Concentrates were the only bought in feed at a rate of 1.26 t DM/cow/year. The grazed forage component included pasture and winter forage crops (Forage Rape and Persian Clover), while the conserved forage was mainly silage made from the Maize grown on the CFR area. Forage yields (t DM/ha) are shown in Table 2.1. Target utilised yields for the pasture and the CFR components were set by the researchers based upon experience from previous experimental trials that were deemed as possible to obtain at the farm level.

4
02468
101214161820222426
26-A
pr
17-M
ay7-J
un
27-Ju
n18
-Jul
8-Aug
5-Sep
26-S
ep
17-O
ct7-N
ov
28-N
ov
19-D
ec
11-Ja
n1-F
eb
22-Feb
15-M
ar5-A
pr
26-A
pr
DM
inta
ke (k
g/co
w/d
ay)
maize silage
grain
2022242628
Milk
(L/c
ow/d
ay)
grazed forage
Figure 2.2 Diet composition (kgDM/cow/day) and milk production (L/cow/day)
Table 2.1 Utilised forage yields (t DM/ha) compared to targeted yields
Forage Actual yield Target yield Difference
(t DM/ha) (%, Actual/Target)
Pasture 20.4 18.0 113
Winter forage crops 8.6 15.0 57
Maize 24.2 25.0 97
Utilised forage yields of Maize and pasture were on or above target. However, utilised forage yield of winter forages was only 57 per cent of target (15 t DM/ha). This lower production from winter forages was a consequence of their delayed sowing. Despite this, the overall forage production was on target, allowing a high stocking rate and per cow production to be maintained with relatively low dependence on imported feed. 2.2. Whole farm scenarios modelled
The purpose of this study was to identify management strategies available to farmers, to increase farm income, for example, to maintain the farm family, using the same land resource. Such situations might occur where neighbouring land may be cost prohibitive or not available for purchase or lease. Given limited opportunities to expand, farmers may consider increasing the intensity of their farming business. Therefore, a set of five scenarios were developed to illustrate the possible progression of increasing farm intensity (Table 2.2). In each scenario, dry cows are not run on the dairy area so that an agistment fee is charged to each of the scenarios. This accounts for variations in stocking rates between scenarios. The scenarios tested were developed following a logical sequence of steps farmers might follow if faced with the need to increase farm income and are described below.

5
The Scenarios The base scenario (scenario 1) describes a relatively well managed dairy farm in NSW. The farm is stocked at 2.4 cows/ha, utilises about 12 t DM/ha/year under irrigation and produces more than 16,000 L milk/ha/year from less than 6,700 L milk/cow. It is widely agreed that increasing home-grown feed and its utilisation is a very important factor for farm profitability. Therefore, the most logical step forward for this farm would be to increase total milk production by means of increasing stocking rate and consequently, pasture utilisation to a maximum of about 18 t DM/ha/year. This target can be achieved using existing knowledge and accepted management practices, thus this scenario is referred to as ‘good pasture management’ scenario (scenario 2). Production per cow was assumed to remain as per the base scenario (6,900 L/cow), whilst production per ha increased from 16,000 to >27,000 L/year as a consequence of running more cows on the farm. It is also widely accepted that achieving >18 t DM/ha of utilised pasture across the whole farm area is very difficult, as the ceiling yield is about 20 t DM/ha (see for example, Stockdale, 1983). Thus, if the farmer still needs to increase milk production beyond the level achieved with ‘good pasture management’, they have two options: 1) grow more feed on farm by replacing some pasture area with complementary forage rotation area. This is referred to as a complementary forage system (CFS) and the scenario was called CFS target (scenario 5, or 2) buy in more feed to sustain both a higher stocking rate and milk yield/cow (scenario 3, pasture + supplement). CFS target scenario represents the modelled case of The University of Sydney dairy “Corstorphine” whole farm study. However, as we have some preliminary data from this trial, an additional scenario (CFS actual, Scenario 4) was also evaluated, which incorporates actual yields obtained during the autumn-winter phase of the first year of the experiment. These last three scenarios described have the same target of milk production per cow (~9,000L) and per ha (~34,000L). A small reduction in stocking rate (from 4 cows/ha in the ‘good management’ scenario to 3.7 cows/ha in the last three cases) was considered logical if farmers would be pushing for higher production/cow.
Table 2.2 Whole farm scenarios tested
Scenarios1 Stocking Rate
Production per cow
Concentrates fed
Pasture utilised
CFR yield
Milk production
Milk from home grown feed2
Cows/ha L/cow t DM/cow t DM/ha
t DM/ha
L/ha L/ha
1 2.4 6,900 1.2 12 - 16,600 14,200 2 4.0 6,900 1.2 18 - 27,600 23,600 3 3.7 9,000 2.3 18 - 34,000 26,900 4 3.7 9,000 1.2 18 33,500 34,000 30,300 5 3.7 9,000 0.6 18 39,000 34,000 32,100
1 1: Base, 2: Good Pasture Management, 3: Pasture + Supplement, 4: CFR (Actual), 5: CFR (Target) 2 Assumes 1.2L/kg DM of concentrate fed.

6
The quantities of feed consumed used in the whole farm analyses, and expressed in terms of tonnes of dry matter (t DM) per hectare or per cow, for each of the scenarios are given in Table 2.3. These were derived using a spreadsheet based model (System Evaluation Model, SEM) developed by FutureDairy (S.G. Garcia, unpublished data). Key inputs are the number of cows, calving dates, replacement rate, total area, the proportion of ryegrass- and kikuyu-based pastures, and the expected target utilisation of each pasture/forage used. The SEM model calculates the energy requirements of the herd on a monthly basis and allows the user to change the supplements (type and levels) in order to match cows requirements with energy offered.
Table 2.3 Feed consumed for the different whole farm production system scenarios
Scenarios1 Pasture utilised Concentrate Grass silage/hay Maize silage t DM/ha t DM/ha t DM/cow t DM/ha t DM/ha 1 9.4 3.0 1.2 1.4 - 2 15.6 5.1 1.3 2.2 - 3 16.2 8.5 2.3 1.3 - 4 14.0 4.8 1.3 0.3 7.7 5 16.2 2.2 0.6 0.3 7.6 1 1: Base, 2: Good Pasture Management, 3: Pasture + Supplement, 4: CFR (Actual), 5: CFR (Target) Modelled Farm Whole-farm modelling may be undertaken by the use of representative farms or real case study farms. Representative farms are constructed or validated with reference to appropriate survey data from a variety of sources so as to best represent typical physical, financial and management resources available, for a defined region or industry of interest. Malcolm (2004a,b) highlights the limitations of using representative farms to evaluate technologies and suggests the use of real case study farms to enhance the use of model farms. However, in the case of ex ante analyses of technologies such as the CFR, the representative farm approach is warranted as a first step prior to adoption on real farms. A further limitation of the whole-farm modelling approach undertaken here is that such a budgeting approach is static, analysing the CFR technology in a steady state, while many problems associated with evaluating the profitability of a new technology relate to the time required to implement the technology on farm. Thus, the use of development budgets and cashflow budgets are essential to estimate the profitability of a new technology adopted in a farm business (Alford, Griffith and Davies, 2003) and will be addressed in future analyses. The farm modelled by the whole farm budgets was constructed from various sources of data including ABARE data, Industry & Investment NSW, MilkBiz whole-farm budgeting program and physical data from the Corstorphine dairy trial (University of Sydney, Camden). These data sources were used to determine the resources available to the typical Australian dairy farm, while specific regional costs and constraints for similar sized farms using ABARE data and compared with other sources of data such as MilkBiz, or obtained directly from the CFR trials. Feed costs were obtained from budgets developed based on the trial results and commercial input prices (Alford et al. 2009a). Key feed related costs including grain, and pasture costs were obtained from real data used in the CFR trials and prices obtained from local suppliers. Similarly, associated contractor rates

7
were taken from published commercial contractor rates. Other farm costs, such as herd and shed costs, could not be taken from the Corstorphine trial and were taken from ABARE farm survey data. These are described by ABARE in terms of average prices on a per farm basis or on a per litre, cow or hectare basis. The result is that average costs are used and we cannot infer anything about the marginal cost of the inputs for a given scenario, or whether the modelled outcome is maximising profit. However, using the farm survey data allows us to undertake an ex ante economic evaluation of the experimental farm protocols in a commercial context. Where economic values for the additional farm inputs and costs were not obtainable from ABARE survey data, estimates were made by the researchers with reference to farm data. A conservative approach was adopted when modelling the proposed intensified forage and grazing management of the dairy. Farm input costs, apart from the feed related costs, were taken from ABARE dairy farm survey data for herds of over 180 cows for 2004/05 and converted to 2005/06 dollar values using the consumer price index. These costs were found to be broadly consistent with farm cost benchmarks provided by the NSW MilkBiz whole farm economic model. It is important to note that this ABARE data provides average production costs and values. It is widely accepted that specialist benchmarking programs, such as RedSky, typically reflect better performing dairy business with potentially lower average costs, and higher incomes and higher productivity measures. Thus, by cross referencing with the average farm data a more conservative picture would be expected. Assumptions used in the development of the whole farm model are described below. Milk Price A milk price of 35 cents per litre was used in this modelling exercise which was the typical price paid by NSW factories to producers in 2005/06. Throughout Australia in 2005/06, the average price paid for a litre of standard milk was 33.1 c/L, varying between 29.0 c/L in Western Australia to 36.6 c/L in Queensland (Dairy Australia, 2006/7).
Farm Area This analysis focuses on the dairy area, so to account for dry cows not run on this area an agistment charge is included. Approximately 50 per cent of the total farm area is utilised by the dairy herd (ABARE 2007), while the top ranked dairy farms (for return on assets) had a total land area of 275 ha in 2004-05 (ABARE 2006). Therefore, a total milking area of 140 ha was used for the dairy herd. Herd costs Herd costs range from 1.5 to 3.0 c/L or $70 to $180 per cow in the MilkBiz program. The ABARE survey (2006) found that herd costs of $82/cow was the average for large herds of over 220 cows, in 2004/05. Assuming a 5 per cent increase in costs, this is equivalent to $86 /cow in 2005/06, and this was applied in the scenarios budgets. Shed costs The MilkBiz benchmark for shed costs ranges from 1.0 to 1.5 c/L, or 3 per cent of total dairy income, while 2004/05 ABARE (2006) average large herd shed costs are in the order of $74/cow amongst year round producing farms. For this study, 3 per cent of total dairy income was used which is equivalent to $90.58/cow in annual shed costs.

8
Feed costs Pasture and forage crop costs were derived from the variable cost budgets presented in the companion report (Alford et al., 2009a), and the level of inputs based upon the Corstorphine trial data. Pasture and CFR input costs include the use of contractors for all farming and harvesting. The cost of the base pasture was $905 /ha, the high production pasture was $1,363/ha and $3,959/ha for the CFR. These budgets are detailed in Appendix 1. Concentrate was costed at $330/t delivered which was the approximate average price paid by NSW DPI for concentrate purchased at EMAI for 2005 and 2006 adjusted to 2006 dollar value. Required feed inputs from the pasture, CFR and concentrate were determined by the use of the SEM feed budgeting model and compared with data from the Corstorphine trials. Common fixed costs Common fixed costs include accounting, insurance and administration costs, rates and telephone charges and other sundry items. Milkbiz benchmarks suggest common fixed costs would be in the range from 4 to 6 per cent of total dairy income, or 3 c/L. A value of 5 per cent of total dairy income was used in the model. Labour inputs and costs All labour was included in the whole farm model as paid labour, and a ratio of 80 cows per labour unit was used. For validation, the ABARE (2006) survey found that for large herds, over 220 cows, labour productivity was 425,000 litres/labour unit and 80 cows per labour unit. The 80 cows per labour unit used in this study is conservative when it is considered that farming and harvesting contractor costs are included in the pasture and CFR costs and charges for irrigation and feeding out of silage are also included in the CFR variable costs. A labour cost of $60,000 per annum including on-costs was included. A summary of the incomes and costs associated with the whole farm model are provided in Table 2.4. Additional assumptions regarding the asset values are also necessary, and include a land value of $12,000 /ha and asset values for building and machinery and vehicles of $600,000 and $70,000 respectively.

9
Table 2.4 Summary of income and cost assumptions used in the whole farm analyses
Source: Economic data INCOME Milk price $0.35/L Actual 05/06 NSW price Cattle sales $500/hd (cull cows) Refer to 1 below. COSTS Herd costs $86/cow MilkBiz Shed costs 2.0 c/L 1.0 - 1.5c/L
Feed costs CFR $3,959/ha Appendix 1 Pasture (high
production) $1,363/ha Appendix 1
Pasture (base scenario)
$905/ha Appendix 1
Pasture silage $100/ha This study Pasture hay $100/ha This study Concentrate $330/t as fed NSW DPI Other variable costs 1.0 c/L MilkBiz Repairs & Maintenance
5% of total dairy income MilkBiz
Labour $60,000/ EFT This study Replacement cows $1,000/cow This study ASSETS Land $12,000/ ha This study Buildings and Machinery
$600,000 This study
Vehicles $70,000 This study Assumptions attributed to this study include: 1Cow cull price assumes 267 c/kg dressed weight (dw) ABARE (2007), equivalent to 105 c/kg lw (assuming 9% marketing and transport costs and charges, and dw of 43%), a discount is also applied to reflect a proportion of cull cows due to health issues do not make abattoir specifications.

10
3. Results and Discussion 3.1. Comparison of scenarios
Results of the whole farm budgets show that the four scenarios achieved increased dairy gross margin and net profit over the base scenario (Table 3.1, Figures 3.1 and 3.2). For each of the scenarios increased stocking rates and higher production per cow resulted in increased dairy income and increased total variable costs. With the exception of the good pasture management scenario, feed costs per cow were higher than the base scenario. However, the dairy gross margin was higher for each of these scenarios ranging from $4,204/ha for the good pasture management system to $6,254/ha for the Target CFR scenario. Similarly, each of the scenarios 2 to 5, achieved an increase in return of assets above scenario 1, ranging from 3.4 per cent by improving pasture management including increased stocking rate to 12.0 per cent through achieving the targeted production of the CFR. In comparison, scenario 1, the base case, achieved a return on assets of 0.9 per cent. In the case of the scenarios 4 and 5, which incorporated CFR covering 35 per cent of the dairy area, an additional cost including financing and depreciation from an investment in a feed pad and feedout machinery was included. This was taken from the companion analysis undertaken in Alford et al. (2009a). A factor impacting the results was the cost of labour and how it was determined. As previously described (refer to Section 2.2), the labour requirements were set at 80 cows per labour unit, the Australian average for larger herds (ABARE, 2006). This meant that for the scenarios with lower production per cow, scenarios 1 and 2, labour costs are relatively higher (10.8 c/L) on a per litre of milk basis compared to the scenarios 3, 4 and 5 with labour costs of 8.2 c/L (Table 3.3). Alternative assumptions regarding the labour requirement, such as determining requirements on some combination of cows and litres per labour unit would impact on the relative profitability of the scenarios.
Table 3.1 Comparison of key economic outcomes for the various whole farm scenarios
Scenarios1 Dairy Income
Total Variable Costs
Feed costs
Dairy Gross Margin
Net Profit
Return on Assets
$ $ $/cow $/ha $ % 1 775,157 425,571 955 2,462 24,097 0.9 2 1,291,944 694,997 930 4,204 99,132 3.4 3 1,611,381 892,165 1,337 5,065 173,788 6.0 4* 1,611,387 845,536 1,248 5,393 232,024 8.1 5* 1,611,387 723,379 1,016 6,254 354,181 12.0 1 1: Base, 2: Good Pasture Management, 3: Pasture + Supplement, 4: CFR (Actual), 5: CFR (Target) * Note the CFR scenarios incorporate a $250,000 infrastructure investment, at 9 per cent interest and additional depreciation, for feedpad and feed out machinery.

11
0
400,000
800,000
1,200,000
1,600,000
2,000,000
Base
Good p
astur
e mng
t
Pastur
e + S
upple
ment
CFR (Actu
al)
CFR (Targ
et)
Inco
me
($)
0
2
4
6
8
10
12
14
Ret
urn
on A
sset
s (%
)
Income
RoA
Figure 3.1 Comparison of Income and Return on Assets (RoA)
0
1,000
2,000
3,000
4,000
5,000
6,000
7,000
Base
Good p
astur
e mng
t
Pastur
e + S
upple
ment
CFR (Actu
al)
CFR (Targ
et)
Gro
ss M
argi
n ($
/ha)
0
50,000
100,000
150,000
200,000
250,000
300,000
350,000
400,000N
et P
rofit
($)
Gross Margin
Net Profit
Figure 3.2 Comparison of Gross Margin and Net Profit
Table 3.1 Paid labour requirements
Scenarios1 Cows per labour unit
Litres per labour unit
Labour Cost
Labour Cost
Labour Cost
Cows/l.u. L/l.u. ¢/L $/cow $/ha 1 80 553,040 10.8 750 1,800 2 80 553,040 10.8 750 3,000 3 80 734,162 8.2 750 2,775 4 80 734,162 8.2 750 2,775 5 80 734,162 8.2 750 2,775
1 1: Base, 2: Good Pasture Management, 3: Pasture + Supplement, 4: CFR (Actual), 5: CFR (Target)

12
Additional Infrastructure to coincide with herd expansion Given the need to increase the size of the dairy herd and significantly lift total milk production from the base scenario to scenarios 2 to 5 it was assumed in many instances that such spare capacity on a dairy farm would not be available. Therefore, additional expenditure was included. The additional dairy farm capacity is in terms of dairy shed and vat capacity and associated effluent systems and laneways. This was assumed to be the same for the scenarios 2, 3, 4 and 5 (Table 3.4). Note that additional livestock capital expenditure is already included in these steady state analyses.
Table 3.2 Additional capital expenditure for Scenarios 2 to 5
Additional Capital Expenditure Dairy $250,000 Vat $100,000 Effluent system $ 50,000 Laneways $ 30,000 Total
$430,000
When additional infrastructure costs to expand the milking capacity for the farm scenarios other than the base case were included, the return on assets was lower for each of the scenarios 2 to 5. These ranged from 1.7 per cent for the good pasture management system (Scenario 2) to 5.2 and 8.6 per cent for the actual and target CFR scenarios respectively (Scenarios 4 and 5) (Table 3.5).
Table 3.3 Comparison of economic measures after investing additional capital
Scenarios1 Dairy Gross Margin
Overhead Costs
Net Profit Return on Assets
$/ha $/L $/ha % 1 2,462 0.141 170 0.9 2 4,205 0.137 139 1.7 3 5,066 0.115 889 5.0 4 5,394 0.12 883 5.2 5 6,248 0.12 1,736 8.6
1 1: Base, 2: Good Pasture Management, 3: Pasture + Supplement, 4: CFR (Actual), 5: CFR (Target)
3.2. Sensitivity Testing
Key inputs were identified as being likely to impact upon the relative profitability of the different scenarios; these included the cost of water, concentrate and urea fertilizer. These were tested by parametric budgeting with prices for water being $30/ML (pumping costs alone), $100/ ML and $200/ ML, in addition to pumping costs. Concentrate prices tested were $330/t DM, $450/t DM and $600/t DM, while urea fertilizer prices of $630/t, $815/t and $1000/t were used. Higher grain and urea prices were used in this study than that used in Alford et al. (2009a), which were based upon historical price ranges. Recent research and market commentary suggests that higher grain prices are likely in the medium term due to increasing demand for grain for human consumptions and demand for grain from the international biofuel industry
13
(ABARE, 2008). Similarly, higher expected oil prices will increase the cost of urea. This supports the use of higher concentrate and urea prices in the parametric budgets. The sensitivity of the different scenarios to changes in key feed related input prices (concentrate, irrigation water and urea) are provided in Table 3.6 and shown graphically in Figure 3.3. These results show the impact of increasing input prices on the return on assets (RoA) of the farm expressed as a percentage, the preferred measure of farm profit to measure the efficiency of all resources used (Malcolm, 2004b). The slopes of the curves in Figure 3.3 show the relative sensitivity of each scenario’s operating profit to a change in price of each of the three key feed related inputs. The scale on the vertical axis (operating profit $) of each graph is the same. These slopes are presented in Table 3.7. All the slopes are negative, as increasing the cost of an input reduces the operating profit of the farm business. While the greater the absolute number that is the steeper the slope indicating that more sensitive net profit of the business is to the particular input cost. For example, all the farm scenarios are relatively insensitive to the cost of urea, while the Pasture + Supplement system is especially sensitive to the cost of concentrate (-8.5). The CFR system has the highest sensitivity to the price of water (-6.5) although only marginally higher than that of the high input pasture systems (-6.0). To further examine the sensitivity of the production systems described, the input prices for urea, irrigation water and concentrate feeds were varied simultaneously. Results in terms of net profit ($/ha) and RoA (%) are presented in Tables 3.8 and 3.9 respectively. Overall, the CFR scenarios (Actual and Target) were relatively robust with their RoA’s consistently higher than the other scenarios 1, 2 and 3. At the lower grain price of $330/t, the CFR Actual and the Pasture + Concentrate scenarios achieve very similar RoA with the CFR Actual being 0.2 to 0.3 per cent higher across the urea and water price combinations tested. However, the Pasture + Concentrate scenario was found to be vulnerable in terms of net profit (Table 3.8) and return to assets (Table 3.9) to rising concentrate prices with the profitability of the production system decreasing relative to all the other scenarios as concentrate prices increased.

Tab
le 3
.4 S
ensi
tivity
of f
arm
ope
ratin
g pr
ofit
and
corr
espo
ndin
g re
turn
on
asse
ts to
cha
nges
in p
rice
s of k
ey in
puts
, lan
d va
lue,
ir
riga
tion
wat
er, c
once
ntra
te a
nd u
rea
fert
ilise
r
Sc
enar
ios1
1 2
3 4
5
RoA
O
pera
ting
Prof
it R
oA
Ope
ratin
g Pr
ofit
RoA
O
pera
ting
Prof
it R
oA
Ope
ratin
g Pr
ofit
RoA
O
pera
ting
Prof
it
%
$/
ha
%
$/ha
%
$/
ha
%
$/ha
%
$/
ha
Cur
rent
0.9
170
1.7
411
5.0
1162
5.
2 13
14
8.6
2167
L
and
1200
0 0.
9
1.7
5.
0
5.2
8.
6
$/ha
20
000
0.6
1.
3
3.7
4.
0
6.5
2800
0 0.
5
1.0
2.
9
3.2
5.
3
Wat
er
$/
ML
0 0
.9
170
1
.7
411
5
.0
1162
5.
2 13
14
8.6
2167
100
-0.7
-1
30
-0.8
-1
90
2.4
5
61
2.6
662
6.0
1516
200
-2.3
-4
30
-3.3
-7
90
-0.2
-
39
0 10
3.
4 8
64
Con
cent
rate
$/
t 33
0 0
.9
170
1
.7
411
5
.0
116
2 5.
2 13
14
8.6
2167
450
-1.0
-1
88
-0.9
-2
02
0.6
1
36
2.9
739
7.
6 19
09
60
0 -3
.3
-635
-4
.1
-124
1 -4
.9
-114
6 0.
1
20
6.3
1578
U
rea
$/
t 63
0 0
.9
170
1.
7 41
1 5.
0 11
62
5.2
1314
8.
6 21
67
81
5 -3
.8
78
1.1
263
4.3
1014
4.
6 11
61
8.0
2014
1000
-4
.3
-15
0.5
115
3.7
866
4.0
1007
7.
4 18
61
1 1: B
ase,
2: G
ood
Past
ure
Man
agem
ent,
3: P
astu
re +
Sup
plem
ent,
4: C
FR (A
ctua
l), 5
: CFR
(Tar
get)
14

15
-1500-1000
-500
0500
10001500
20002500
0 100 200
Irrigation Water ($/ML)
Ope
ratin
g Pr
ofit
($)
Base Good Past Mngt P+S CFR Actual CFR Target
-1500-1000
-500
0500
10001500
20002500
330 450 600
Concentrate ($/t)
Ope
ratin
g Pr
ofit
($)
Base Good Past Mngt P+S CFR Actual CFR Target
-1500-1000
-500
0500
10001500
20002500
630 815 1000
Urea ($/t)
Ope
ratin
g Pr
ofit
($)
Base Good Past Mngt P+S CFR Actual CFR Target
Figure 3.3 Impact on operating profit of increasing a) irrigation water; b) concentrate costs and c) urea fertiliser costs

16
Table 3.5 Relative sensitivity of the various scenario’s operating profit to increases in the unit cost of three major feed related inputs
Scenario 1 2 3 4 5 Water -3.0 -6.0 -6.0 -6.5 -6.5 Concentrate -3.0 -6.2 -8.5 -4.8 -2.2 Urea -0.5 -0.8 -0.8 -0.8 -0.8
1 1: Base, 2: Good Pasture Management, 3: Pasture + Supplement, 4: CFR (Actual), 5: CFR (Target) It is worth noting that the good pasture scenario (scenario 2) did not achieve particularly high profitability given the assumptions made, especially with higher water charges. With a combination of the lowest key input costs tested the RoA was 1.7 per cent compared with 0.9 per cent for the base scenario. This is in part explained by the assumption made that additional capital is included in Scenario 2. Further labour costs are relatively high due to the assumption that labour is based upon 80 cows per labour unit and the good pasture system has the largest number of cows. However, compared with the other intensification scenarios these cows also have a lower production per cow, disadvantaging the good pasture system relative to the other scenarios. Another assumed technical coefficient for labour would have resulted in different economic outcomes. This dilemma is faced by any budgeting method projecting input requirements, including mathematical programming techniques. A more realistic solution might be a technical coefficient for labour based upon a combination of cow numbers and yield per cow. Importantly, the methodology here did not intend to identify the optimal allocation of resources and, hence, production targets (per ha and per cow) for each of the production systems analysed. For example, a more moderate level of expansion requiring less capital investment may have resulted in different profitability results. However, this would require use of sophisticated mathematical programming techniques that can effectively capture the different potential production systems described. Further, each scenario does not in reality represent a discrete production system, rather the different production systems might be adjusted strategically or tactically in a dynamic environment by a farm manager in response to critical input costs. Despite these limitations the current whole-farm steady state analysis does indicate that the profitability of the CFS system, even at the lower productions levels achieved in farm scale trials, can compare favourably with more traditional strategies to increase productivity. For example, by increasing concentrates fed in concert with increased pasture production and utilisation.

Tab
le 3
.6 S
ensi
tivity
of s
cena
rio
prod
uctio
n sy
stem
s’ n
et p
rofit
($/h
a) to
key
inpu
t cos
ts
a) S
ensi
tivity
of s
cena
rio p
rodu
ctio
n sy
stem
s’ n
et p
rofit
($/h
a) to
key
inpu
t cos
ts w
ith c
once
ntra
te a
t $33
0/t
Wat
er ($
/ML)
0 10
0 20
0 U
rea
($/t)
63
0 81
5 10
00
630
815
1000
63
0 81
5 10
00
Scen
ario
1 1
170
78
-15
-130
-2
22
-315
-4
30
-522
-6
15
2
1
39
-9
-157
-4
62
-609
-7
57
-1,0
62
-1,2
09
-1,3
57
3
88
9 74
1 59
3 28
8 14
1 -7
-3
12
-459
-6
07
4
88
3 73
0 57
6 23
1 78
-7
6 -4
21
-574
-7
27
5
1,
736
1,58
3 1,
430
1,08
5 93
2 77
8 43
3 28
0 12
7 b)
Sen
sitiv
ity o
f sce
nario
pro
duct
ion
syst
ems’
net
pro
fit ($
/ha)
to k
ey in
put c
osts
with
con
cent
rate
at $
450/
t
Wat
er ($
/ML)
0 10
0 20
0 U
rea
($/t)
63
0 81
5 10
00
630
815
1000
63
0 81
5 10
00
Scen
ario
1 1
-188
-2
80
-373
-1
30
-580
-6
73
-788
-8
80
-973
2
-474
-6
22
-770
-1
,075
-1
,222
-1
,370
-1
,675
-1
,822
-1
,970
3
-136
-2
84
593
-737
-8
84
-1,0
32
-1,3
37
-1,4
84
-1,6
32
4
30
8 15
4 57
6 34
4 -4
97
-651
-9
96
-1,1
49
-1,3
02
5
1,
478
1,32
5 1,
172
826
674
520
175
22
-131
c)
Sen
sitiv
ity o
f sce
nario
pro
duct
ion
syst
ems’
net
pro
fit ($
/ha)
to k
ey in
put c
osts
with
con
cent
rate
at $
600/
t
Wat
er ($
/ML)
0 10
0 20
0 U
rea
($/t)
63
0 81
5 10
00
630
815
1000
63
0 81
5 10
00
Scen
ario
1 1
-635
-7
27
-820
-9
35
-1,0
27
-1,1
20
-1,2
35
-1,3
27
-1,4
20
2
-1
,241
-1
,389
-1
,537
-1
,842
-1
,989
-2
,137
-2
,442
-2
,589
-2
,737
3
-1,4
18
-1,5
66
-1,7
14
-2,0
19
-2,1
66
-2,3
14
-2,6
19
-2,7
66
-2,9
14
4
-4
41
-564
-7
18
-1,0
63
-1,2
16
-1,3
69
-1,7
15
-1,8
68
-2,0
21
5
1,
147
994
841
495
343
189
-156
-3
09
-462
1 1
: Bas
e, 2
: Goo
d Pa
stur
e M
anag
emen
t, 3:
Pas
ture
+ S
uppl
emen
t, 4:
CFR
(Act
ual),
5: C
FR (T
arge
t)
17

Tab
le 3
.7 S
ensi
tivity
of s
cena
rio
prod
uctio
n sy
stem
s’ r
etur
n on
ass
ets (
%) t
o ke
y in
put c
osts
a)
Sen
sitiv
ity o
f sce
nario
pro
duct
ion
syst
ems’
retu
rn o
n as
sets
(%) t
o ke
y in
put c
osts
with
con
cent
rate
at $
330/
t
Wat
er ($
/ML)
0 10
0 20
0 U
rea
($/t)
6
30
815
1000
63
0 81
5 10
00
630
815
1000
Sc
enar
io1 1
0.
9 0.
4 -0
.1
-0.7
-1
.2
-1.6
-2
.3
-2.7
-3.2
2
1
.7
1.1
0.5
-0.8
-1
.4
-2.0
-3
.3
-3.9
-4.6
3
5.
0 4.
3 3.
7 2.
4 1.
8 1.
1 -0
.2
-0.8
-1.4
4
5.
2 4.
6 4.
0 2.
6 2.
0 1.
4 0
-0.6
-1.2
5
8.
6 8.
0 7.
4 6.
0 5.
4 4.
8 3.
4 2.
82.
2 b)
Sen
sitiv
ity o
f sce
nario
pro
duct
ion
syst
ems’
retu
rn o
n as
sets
(%) t
o ke
y in
put c
osts
with
con
cent
rate
at $
450/
t
Wat
er ($
/ML)
0 10
0 20
0 U
rea
($/t)
63
0 81
5 10
00
630
815
1000
63
0 81
5 10
00
Scen
ario
1 1
0 -1
.5
-0.2
-2
.6
-3.0
-3
.5
-4.1
-4
.6-5
.1
2
-1.
0 -1
.5
-2.1
-3
.4
-4.0
-4
.6
-5.9
-6
.5-7
.2
3
0.6
-0.1
-0
.7
-2.0
-2
.6
-3.2
-4
.5
-5.2
-5.8
4
2.
9 2.
3 1.
7 0.
3 -0
.3
-0.9
-2
.2
-2.8
-3.5
5
7.
6 7.
0 6.
4 5.
0 4.
4 3.
8 2.
4 1.
81.
2 c)
Sen
sitiv
ity o
f sce
nario
pro
duct
ion
syst
ems’
retu
rn o
n as
sets
(%) t
o ke
y in
put c
osts
with
con
cent
rate
at $
600/
t
Wat
er ($
/ML)
0 10
0 20
0 U
rea
($/t)
63
0 81
5 10
00
630
815
1000
63
0 81
5 10
00
Scen
ario
1 1
-3.3
-3
.8
-4.3
-4
.9
-5.4
-5
.9
-6.5
-6
.9-7
.4
2
-4.
1 -4
.7
-5.3
-6
.6
-7.2
-7
.8
-9.1
-9
.8-1
0.4
3
-4
.9
-5.5
-6
.1
-7.5
-8
.1
-8.7
-1
0.0
-10.
6-1
1.3
4
0.
1 -0
.5
-1.1
-2
.5
-3.1
-3
.7
-5.1
-5
.7-6
.3
5
8.6
8.0
7.4
6.0
5.4
4.8
3.4
2.8
2.2
1 1: B
ase,
2: G
ood
Past
ure
Man
agem
ent,
3: P
astu
re +
Sup
plem
ent,
4: C
FR (A
ctua
l), 5
: CFR
(Tar
get)
18

19
4. Conclusions The economic evaluation of the CFR technology undertaken in this study used biophysical modelling and preliminary results from trials conducted at the University of Sydney’s Corstorphine Dairy. These applied steady state whole farm budgets to compare alternate or progressive scenarios that might be considered by farmers looking at the potential to increase farm productivity through their feeding system. The base farm scenario included a milking area of 140 ha and a stocking rate of 2.4 total cows/ha, utilising approximately 12 t DM/ha/year under irrigation, producing 16,000 L/ha/year from 6,900 L/cow, achieved 0.9 % return on assets. A pasture and supplement (Pasture + Concentrates) production system implemented on the base farm achieved 6 per cent return on assets (3.7 cows/ha, 9,000L/cow and 2.3 t DM/cow concentrates) while the CFS system achieved return on total assets of 8 to 12 per cent, based upon actual or targeted (best case) forage yield results, respectively. The CFR systems also achieved relatively high RoA when the capital costs of additional infrastructure to accommodate herd expansion were accounted for. The CFR Actual achieved a similar RoA to the Pasture + Concentrate scenario, 5.2 per cent and 5.0 per cent respectively. Sensitivity of the production systems to selected key input prices, including the cost of irrigation water, concentrates and urea fertilizer, using parametric budgeting was undertaken. The CFR system was found to have the highest sensitivity to the price of water although only marginally higher than that of the high input pasture systems. When these input prices were varied, simultaneously, the CFR scenarios (Actual and Target) were relatively robust with RoAs consistently higher than for the other scenarios. At a low grain price, the CFR Actual and the Pasture + Concentrate scenarios achieved similar RoA, while the CFR Actual scenario had a higher RoA across the urea and water price combinations tested. The Pasture + Concentrate scenario was most sensitive to concentrate prices with the profitability of the production system decreasing relative to all the other scenarios as concentrate prices increased. These results broadly reflect the generally higher efficiency achieved by the CFR with respect to these key inputs. This whole-farm steady state analysis supports the hypothesis that the CFS system even at the lower realised production levels represented by CFR Actual, compares profitability with more traditional strategies used by farmers to increase farm productivity and profitability such as increasing concentrates fed in concert with increased pasture production and utilisation. However, these results looked at a steady state situation after the implementation of the systems on farm, and so do not look at implementation costs associated with adopting the technology on farm, which will be particularly dependent upon the current financial circumstances of individual farm businesses.

20
References ABARE (2006). Production Systems, Productivity, Profit and Technology, Australian Dairy Industry Series 06.1, October, Canberra. Conducted on behalf of Dairy Australia, Melbourne.
ABARE (2007). Australian Commodity Statistics 2007, Australian Bureau of Agricultural and Resource Economics, Canberra.
Alford, A.R., Garcia, S.C., Fulkerson, W.F. and Farina, S. (2009a). An Economic Evaluation of the Future Dairy - Complementary Forage Rotation System Using Cost Budgeting, Economic Research Report No. 44, NSW Department of Primary Industries, Armidale, July. Alford, A.R., Griffith, G.R. and Davies, B.L. (2003). Livestock Farming Systems in the Northern Tablelands of NSW: An Economic Analysis, Economic Research Report No.12, NSW Agriculture Orange, October.
Dairy Australia (2006a). Australian Dairy Industry in Focus 2006. Dairy Australia, Melbourne.
Dairy Australia (2006b). Dairy 2006: Situation & Outlook. Report to the Australian Dairy Industry. Dairy Australia, Melbourne.
Dairy Australia (2007). Dairy 2007: Situation & Outlook. Report to the Australian Dairy Industry. Dairy Australia, Melbourne.
Dillon, J.L. and Hardaker, J.B. (1984). Farm Management Research for Small Farmer Development. FAO Agricultural Services Bulletin 41, Rome.
Farquharson, R.J. (1991). A Farm Level Evaluation of a New Twinning Technology in Beef Cattle. Review of Marketing and Agricultural Economics, 59 (1), pp. 66-86.
Foltz, J.D. and Chang, H.H. (2002). The Adoption and Profitability of rBST on Connecticut Dairy Farms. American Journal of Agricultural Economics, 84 (4), pp. 1021-1032.
Ghodake, R.D. and Hardaker, J.B. (1981). Whole-Farm Modelling for Assessment of Dryland Technology. Economic Program Progress Report No. 29, International Crops. Research Institute for the Semi-Arid Tropics (ICRISAT), Andhra Pradesh.
Hardaker, J.B., Huirne, R.B.M. and Anderson, J.R. (1997). Coping with Risk in Agriculture. CAB International, Wallingford UK.
Lubulwa, M. and Shafron, W. (2007). Australian Dairy Industry: Technology and Farm Management Practices, 2004-05. ABARE Research Report 07.9 Prepared for Dairy Australia, Canberra, April.
Makeham, J.P. and Malcolm, L.R. (1993). The Farming Game Now. Cambridge University Press, Melbourne.
Malcolm, L.R. (2004a). Farm Management analysis: a core discipline, simple sums, sophisticated thinking. AFBM Journal 1 (1), pp. 45-56.

21
Malcolm, B. (2004b). Where’s the economics? The core discipline of farm management has gone missing! The Australian Journal of Agricultural and Resource Economics, 48 (3), pp. 395-417.
Pannell, D.J. (1999). On the estimation of on-farm benefits of agricultural research. Agricultural Systems, 61 (2), pp. 123-134.
Stockdale, C.R. (1983). Irrigated pasture productivity and its variability in the Shepparton Region of northern Victoria. Australian Journal of Experimental Agriculture and Animal Husbandry, 23, pp. 131-139.
Tronsco, J.L. (1985). An ex ante evaluation of three new beef technologies developed for the conditions of the Lake region of Chile. Unpublished PhD. thesis, University of New England, Armidale, N.S.W.

22
Appendix 1: Pasture and CFR Budgets used for Whole Farm Model
BASE PASTURE 2005/06 dollar values
Pasture Yield (t DM/ha utilised) 12.0
units /ha $/unit
Seed - annual ryegrass (kg) 30 $ 4.00 $ 120.00
Fertilizer (kg)
- triple super 200 $ 0.65 $ 129.20
- potash 200 $ 0.61 $ 121.60
- topdress - Urea 500 $ 0.63 $ 315.00
Contractor rates (hrs)
- sowing 1 $ 53.55 $ 53.55
- fertiliser spreading (x 2) 0.1 $101.50 $ 20.30
- topdressing (Urea) (x 4) 0.1 $101.50 $ 40.60
Slashing (hrs) 0.2 $ 72.45 $ 14.48
Irrigation (ML) 3 $ 30.00 $ 90.00
Total variable costs ($/ha) $ 904.73
Total variable costs ($ /t DM utilised) $ 75.40
Note: No allowance for labour has been included including irrigation labour.
23
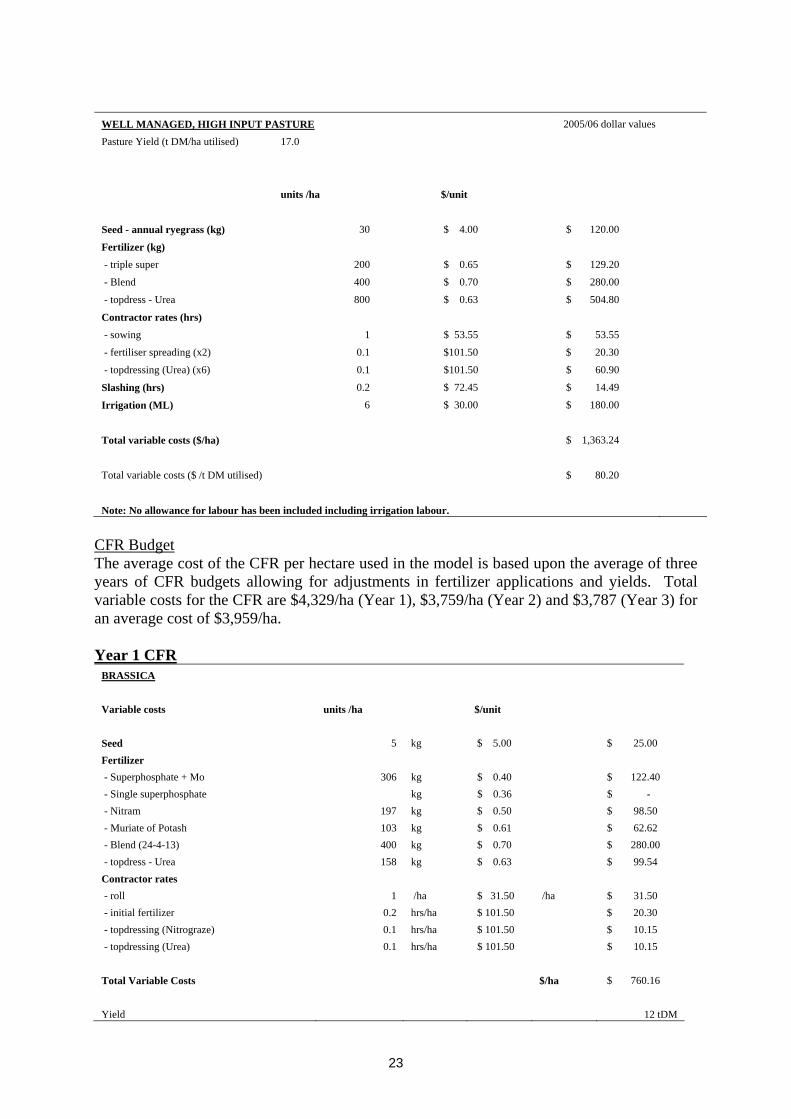
WELL MANAGED, HIGH INPUT PASTURE 2005/06 dollar values
Pasture Yield (t DM/ha utilised) 17.0
units /ha $/unit
Seed - annual ryegrass (kg) 30 $ 4.00 $ 120.00
Fertilizer (kg)
- triple super 200 $ 0.65 $ 129.20
- Blend 400 $ 0.70 $ 280.00
- topdress - Urea 800 $ 0.63 $ 504.80
Contractor rates (hrs)
- sowing 1 $ 53.55 $ 53.55
- fertiliser spreading (x2) 0.1 $101.50 $ 20.30
- topdressing (Urea) (x6) 0.1 $101.50 $ 60.90
Slashing (hrs) 0.2 $ 72.45 $ 14.49
Irrigation (ML) 6 $ 30.00 $ 180.00
Total variable costs ($/ha) $ 1,363.24
Total variable costs ($ /t DM utilised) $ 80.20
Note: No allowance for labour has been included including irrigation labour.
CFR Budget The average cost of the CFR per hectare used in the model is based upon the average of three years of CFR budgets allowing for adjustments in fertilizer applications and yields. Total variable costs for the CFR are $4,329/ha (Year 1), $3,759/ha (Year 2) and $3,787 (Year 3) for an average cost of $3,959/ha. Year 1 CFR
BRASSICA Variable costs units /ha $/unit Seed 5 kg $ 5.00 $ 25.00 Fertilizer - Superphosphate + Mo 306 kg $ 0.40 $ 122.40 - Single superphosphate kg $ 0.36 $ - - Nitram 197 kg $ 0.50 $ 98.50 - Muriate of Potash 103 kg $ 0.61 $ 62.62 - Blend (24-4-13) 400 kg $ 0.70 $ 280.00 - topdress - Urea 158 kg $ 0.63 $ 99.54 Contractor rates - roll 1 /ha $ 31.50 /ha $ 31.50 - initial fertilizer 0.2 hrs/ha $ 101.50 $ 20.30 - topdressing (Nitrograze) 0.1 hrs/ha $ 101.50 $ 10.15 - topdressing (Urea) 0.1 hrs/ha $ 101.50 $ 10.15 Total Variable Costs $/ha $ 760.16 Yield 12 tDM

24
CFR Year 1 Cont’d $ / kgDM $ 0.06 $ /MJME LEGUME Variable costs units /ha $/unit Seed - Persian clover 15 kg $ 4.45 $ 66.75 - Maple pea (cv. Secada) 210 kg $ 0.80 $ 168.00 Fertilizer - Blend (24-4-13) 164 kg $ 0.70 $ 114.80 - Triple SuperP 177 kg $ 0.65 $ 114.34 - topdress - Urea 143 kg $ 0.63 $ 90.09 Herbicide (Glyphosate) 3 L $ 5.00 $ 15.00 Contractor rates - spray 1 $ 22.00 /ha $ 22.00 - sowing 1 /ha $ 53.55 /ha $ 53.55 - pregrazing fertiliser spreading 0.1 hrs/ha $ 101.50 $ 10.15 Total Variable Costs $/ha $ 654.68 Yield 3.5 tDM $ / kgDM $ 0.19 $ /MJME MAIZE Yield 26.6 t DM/ha 8.9 MJ ME/kg DM 33% DM (assumed) Variable costs units /ha $/unit Seed 31.25 kg $ 8.00 $ 250.00 Fertilizer - Lime 4000 kg $ 0.05 $ 200.00 - MAP 102 kg $ 0.68 $ 69.77 - DAP 407 kg $ 0.67 $ 271.47 - Urea 533 kg $ 0.63 $ 335.79 - Muriate of Potash 407 kg $ 0.61 $ 247.46 Pre-emergent herbicide (Dual Gold) 3 L $ 12.00 $ 36.00 - glyphosate 3 L $ 5.00 $ 15.00 Contractor rates - lime spreading 0.2 hrs/ha $ 101.50 $ 20.30 - direct drill 1 $ 89.25 /ha $ 89.25 - topdressing (Urea) 0.2 $ 101.50 /ha $ 20.30 - presowing fertiliser spreading 0.1 hrs/ha $ 101.50 $ 10.15 Irrigation 8.3 ML $ 30.00 $ 249.00

25
CFR Year 1 Cont’d Silage costs - precission chop/ cartage 1.5 hrs/ha $ 260.00 /hr $ 390.00 - rolling 81 wet t $ 3.00 /wet t $ 241.82
- plastic seal 63 m2 $ 1.10 $/m2 $ 69.30 - feedout costs 13.3 hrs/ha $ 30.00 $ 399.00 Total Variable Costs $/ha $ 2,914.60 Feedout wastage 20% Total Variable Costs (after wastage) per kgDM $ 0.137 Total CFR Total forage yield (tDM/ha) 42.1 36.78 after wastage Total variable cost ($/ha) $ 4,329.45
Year 2 CFR
BRASSICA Variable costs units /ha $/unit Seed 5 kg $ 5.00 $ 25.00 Fertilizer - Superphosphate + Mo 250 kg $ 0.40 $ 100.00 - Triple superphosphate 100 kg $ 0.65 $ 64.60 - Nitram kg $ 0.40 $ - - Muriate of Potash 250 kg $ 0.61 $ 152.00 - Blend (24-4-13) 300 kg $ 0.70 $ 210.00 - topdress - Urea 450 kg $ 0.63 $ 283.50 Contractor rates - roll 1 /ha $ 31.50 /ha $ 31.50 - initial fertilizer 0.2 hrs/ha $ 101.50 $ 20.30 - topdressing (Nitrograze) 0.1 hrs/ha $ 101.50 $ 10.15 - topdressing (Urea) 0.1 hrs/ha $ 101.50 $ 10.15 Total Variable Costs $/ha $ 907.20 Yield 10.7 tDM $ / kgDM $ 0.08 $ /MJME LEGUME Variable costs units /ha $/unit Seed - Persian clover 15 kg $ 4.45 $ 66.75 Herbicide (Glyphosate) 3 L $ 5.00 $ 15.00 Contractor rates - spray 1 $ 22.00 /ha $ 22.00 - sowing 1 /ha $ 53.55 /ha $ 53.55

26
CFR Year 2 Cont’d Total Variable Costs $/ha $ 157.30 Yield 5.1 tDM $ / kgDM $ 0.03 $ /MJME MAIZE Yield 26.2 t DM/ha 8.9 MJ ME/kg DM 33% DM (assumed) Variable costs units /ha $/unit Seed 31.25 kg $ 8.00 $ 250.00 Fertilizer - DAP 400 kg $ 0.67 $ 266.80 - MAP 100 kg $ 0.68 $ 68.40 - Triple SuperP 18 kg $ 0.65 $ 11.63 - Blend (24-4-13) 88 kg $ 0.70 $ 61.60 - Urea 530 kg $ 0.63 $ 333.90 - Muriate of Potash 400 kg $ 0.61 $ 243.20 Pre-emergent herbicide (Dual Gold) 3 L $ 12.00 $ 36.00 - glyphosate 3 L $ 5.00 $ 15.00 Contractor rates - direct drill 1 $ 89.25 /ha $ 89.25 - topdressing (Urea) 0.2 $ 101.50 /ha $ 20.30 - presowing fertiliser spreading 0.1 hrs/ha $ 101.50 $ 10.15 Irrigation 6.6 ML $ 30.00 $ 198.00 Silage costs - precission chop/ cartage 1.5 hrs/ha $ 260.00 /hr $ 390.00 - rolling 79 wet t $ 3.00 /wet t $ 238.18
- plastic seal 63 m2 $ 1.10 $/m2 $ 69.30 - feedout costs 13.1 hrs/ha $ 30.00 $ 393.00 Total Variable Costs $/ha $ 2,694.71 Feedout wastage 20% Total Variable Costs (after wastage) per kgDM $ 0.129 Total CFR Total forage yield (tDM/ha) 42 36.76 after wastage Total variable cost ($/ha) $ 3,759.21

27
Year 3 CFR BRASSICA Variable costs units /ha $/unit Seed 5 kg $ 5.00 $ 25.00 Fertilizer - Superphosphate + Mo 250 kg $ 0.40 $ 100.00 - Triple superphosphate 100 kg $ 0.65 $ 64.60 - Nitram kg $ 0.40 $ - - Muriate of Potash 200 kg $ 0.61 $ 121.60 - Blend (24-4-13) 300 kg $ 0.70 $ 210.00 - topdress - Urea 300 kg $ 0.63 $ 189.00 Contractor rates - roll 1 /ha $ 31.50 /ha $ 31.50 - initial fertilizer 0.2 hrs/ha $ 101.50 $ 20.30 - topdressing (Nitrograze) 0.1 hrs/ha $ 101.50 $ 10.15 - topdressing (Urea) 0.1 hrs/ha $ 101.50 $ 10.15 Total Variable Costs $/ha $ 782.30 Yield 11.6 tDM $ / kgDM $ 0.07 $ /MJME LEGUME Variable costs units /ha $/unit Seed - Persian clover 15 kg $ 4.45 $ 66.75 Herbicide (Glyphosate) 3 L $ 5.00 $ 15.00 Contractor rates - spray 1 $ 22.00 /ha $ 22.00 - sowing 1 /ha $ 53.55 /ha $ 53.55 Total Variable Costs $/ha $ 157.30 Yield 3.9 tDM $ / kgDM $ 0.04 $ /MJME MAIZE Yield 29.2 t DM/ha 8.9 MJ ME/kg DM 33% DM (assumed) Variable costs units /ha $/unit Seed 31.25 kg $ 8.00 $ 250.00 Fertilizer - DAP 400 kg $ 0.67 $ 266.80 - MAP 170 kg $ 0.68 $ 116.28

28
CFR Year 3 Cont’d - Triple SuperP kg $ 0.65 $ - - Blend (24-4-13) 70 kg $ 0.70 $ 49.00 - Urea 530 kg $ 0.63 $ 333.90 - Muriate of Potash 450 kg $ 0.61 $ 273.60 Pre-emergent herbicide (Dual Gold) 3 L $ 12.00 $ 36.00 - glyphosate 3 L $ 5.00 $ 15.00 Contractor rates - direct drill 1 $ 89.25 /ha $ 89.25 - topdressing (Urea) 0.2 $ 101.50 /ha $ 20.30 - presowing fertiliser spreading 0.1 hrs/ha $ 101.50 $ 10.15 Irrigation 7.5 ML $ 30.00 $ 225.00 Silage costs - precission chop/ cartage 1.5 hrs/ha $ 260.00 /hr $ 390.00 - rolling 88 wet t $ 3.00 /wet t $ 265.45
- plastic seal 63 m2 $ 1.10 $/m2 $ 69.30 - feedout costs 14.6 hrs/ha $ 30.00 $ 438.00 Total Variable Costs $/ha $ 2,848.03 Feedout wastage 20% Total Variable Costs (after wastage) per kgDM $ 0.122 Total CFR Total forage yield (tDM/ha) 44.7 38.86 after wastage Total variable cost ($/ha) $ 3,787.63

29
Industry & Investment NSW
Economic Research Report Series (All available at http://www.dpi.nsw.gov.au/research/areas/biosecurity/economics-
research/reports) Number 1 Brennan, J.P. and Bantilan, M.C.S. 1999, Impact of ICRISAT Research on Australian
Agriculture, Report prepared for Australian Centre for International Agricultural Research, Economic Research Report No. 1, NSW Agriculture, Wagga Wagga.
2 Davies, B.L., Alford, A. and Hollis, G. 1999, Analysis of ABARE Dairy Data for Six Regions in NSW 1991-92 to 1996-97, Economic Research Report No 2, NSW Agriculture, C.B. Alexander College, Paterson.
3 Brennan, J.P. and Singh, R.P. 2000, Economic Assessment of Improving Nutritional Characteristics of Feed Grains, Report prepared for Grains Research and Development Corporation, Economic Research Report No. 3, Wagga Wagga.
4 Zhao. X., Mullen, J.D., Griffith, G.R., Griffiths, W.E. and Piggott, R.R. 2000, An Equilibrium Displacement Model of the Australian Beef Industry, Economic Research Report No 4, NSW Agriculture, Armidale.
5 Griffith, G., I’Anson, K., Hill, D., Lubett, R. and Vere, D. 2001. Previous Demand Elasticity Estimates for Australian Meat Products, Economic Research Report No 5, NSW Agriculture, Armidale.
6 Griffith, G., I’Anson, K., Hill, D. and Vere, D. 2001. Previous Supply Elasticity Estimates for Australian Broadacre Agriculture, Economic Research Report No 6, NSW Agriculture, Armidale.
7 Patton, D.A. and Mullen, J.D. 2001, Farming Systems in the Central West of NSW: An Economic Analysis, Economic Research Report No. 7, NSW Agriculture, Trangie.
8 Brennan, J.P. and Bialowas, A. 2001, Changes in Characteristics of NSW Wheat Varieties, 1965-1997, Economic Research Report No. 8, NSW Agriculture, Wagga Wagga.
9 Mullen, J.D. 2001, An Economic Perspective on Land Degradation Issues, Economic Research Report No. 9, NSW Agriculture, Orange.
10 Singh, R.P., Mullen, J.D., and Jayasuriya, R. 2005, Farming Systems in the Murrumbidgee Irrigation Area in NSW: An Economic Analysis, Economic Research Report No. 10, NSW Department of Primary Industries, Yanco.
11 Brennan, J.P., Aw-Hassan, A., Quade, K.J. and Nordblom, T.L. 2002, Impact of ICARDA Research on Australian Agriculture, Economic Research Report No. 11, NSW Agriculture, Wagga Wagga.
12 Alford, A., Griffith, G. and Davies, L. 2003, Livestock Farming Systems in the Northern Tablelands of NSW: An Economic Analysis, Economic Research Report No. 12, NSW Agriculture, Armidale.
13 Alford, A., Griffith, G. and Cacho, O. 2003, A Northern Tablelands Whole-Farm Linear Program for Economic Evaluation of New Technologies at the Farm Level, Economic Research Report No. 13, NSW Agriculture, Armidale.

30
14 Mullen, J.D. and Vere, D.T. 2003, Research and Extension Capabilities - Program Economists in New South Wales Agriculture, Economic Research Report No. 14, NSW Agriculture, Orange.
15 Farquharson, R.J., Griffith, G.R., Barwick, S.A., Banks, R.G. and Holmes, W.E. 2003, Estimating the Returns from Past Investment into Beef Cattle Genetic Technologies in Australia, Economic Research Report No. 15, NSW Agriculture, Armidale.
16 O'Donnell, C.J., Griffith, G.R., Nightingale, J.J. and Piggott, R.R. 2004, Testing for Market Power in Multiple-Input, Multiple-Output Industries: The Australian Grains and Oilseeds Industries, Technical Report for the Rural Industries Research and Development Corporation, Economic Research Report No. 16, NSW Agriculture, Armidale.
17 Brennan, J.P., Martin, P.J. and Mullen, J.D. 2004, An Assessment of the Economic, Environmental and Social Impacts of NSW Agriculture’s Wheat Breeding Program, Economic Research Report No. 17, NSW Agriculture, Wagga Wagga.
18 Griffith, G.R., Davies, B.L., Alford, A.R., Herd, R.M., Parnell, P.F. and Hegarty, R.S. 2004, An Assessment of the Economic, Environmental and Social Impacts of NSW Agriculture’s Investment in the Net Feed Efficiency R,D&E Cluster, Economic Research Report No. 18, NSW Department of Primary Industries, Armidale.
19 Scott, J.F. and Farquharson, R.J. 2004, An Assessment of the Economic Impacts of NSW Agriculture’s Research and Extension: Conservation Farming and Reduced Tillage in Northern NSW, Economic Research Report No. 19, NSW Department of Primary Industries, Tamworth.
20 Scott, J.F., Farquharson, R.J. and Mullen, J.D. 2004, Farming Systems in the Northern Cropping Region of NSW: An Economic Analysis, Economic Research Report No. 20, NSW Department of Primary Industries, Tamworth.
21 Crean, J., Shaw, A., Singh. R. and Mullen, J.D. 2004, An Assessment of the Economic, Environmental and Social Impacts of NSW Agriculture’s Advisory Programs in Water Use Efficiency, Economic Research Report No. 21, NSW Department of Primary Industries, Orange.
22 Mullen, J.D. 2004, Evaluations in 2003 of Five Areas of Investment by NSW Agriculture: Summary, Economic Research Report No. 22, NSW Department of Primary Industries, Orange.
23 Vere, D.T., Jones, R.E. and Dowling, P.M. 2004, An Economic Evaluation of Research into the Improved Management of the Annual Grass Weed Vulpia in Temperate Pastures in South-Eastern Australia, Economic Research Report No. 23, NSW Department of Primary Industries, Orange.
24 Jones, R.E. and Dowling, P.M. 2004, Sustainability, Externalities and Economics: The Case of Temperate Perennial Grazing Systems in NSW, Economic Research Report o. 24, NSW Department of Primary Industries, Orange.
25 Brennan, J.P. and Quade, K.J. 2004, Analysis of the Impact of CIMMYT Research on the Australian Wheat Industry, Economic Research Report No. 25, NSW Department of Primary Industries, Wagga Wagga.
26 Brennan, J.P., Sykes, J.D. and Scott, J.F. 2005, Trends in Pulse and Oilseed Crops in Winter Cereal Rotations in NSW, Economic Research Report No. 26, NSW Department of Primary Industries, Wagga Wagga.

31
27 Vere, D.T., Griffith, G.R. and Silvester, L. 2005, Australian Sheep Industry CRC: Economic Evaluations of Scientific Research Programs, Economic Research Report No. 27, NSW Department of Primary Industries, Orange.
28 Singh, R.P., Brennan, J.P. Lacy, J. and Steel, F. 2005, An Assessment of the Economic, Environmental and Social Impacts of the Ricecheck Program, Economic Research Report No. 28, NSW Department of Primary Industries, Yanco.
29 Jones, R., Saunders, G. and Balogh, S. 2005, An Economic Evaluation of a Pest Management Control Program: “Outfox the Fox”, Economic Research Report No. 29, NSW Department of Primary Industries, Orange.
30 Griffith, G.R., Parnell, P.F. and McKiernan, W. 2005, An Evaluation of the Economic Benefits to NSW from Investment in the CRC for Beef Genetics Technologies, Economic Research Report No. 30, NSW Department of Primary Industries, Orange.
31 Khairo, S.A., Mullen, J.D., Hacker, R.B. and Patton, D.P 2008, Farming Systems in the Pastoral Zone of NSW: An Economic Analysis, Economic Research Report No. 31, NSW Department of Primary Industries, Trangie.
32 Griffith, G., Vere, D., and Jones, R. 2006, Sheep CRC Renewal Proposal:Economic Evaluation of the Proposed Scientific Themes, Economic Research Report No. 32, NSW Department of Primary Industries, Armidale.
33 Alford, A.R., Cafe, L.M., Greenwood, P.L. and Griffith, G.R. 2007, The Economic Effects of Early-Life Nutrition in Crossbred Cattle Bred on the NSW North Coast, Economic Research Report No. 33, NSW Department of Primary Industries, Armidale.
34 Jones, R. and Aluwihare, P. 2007, A bioeconomic model for measuring the opportunity costs of water sharing plans in unregulated river systems: the Mooki river catchment, Economic Research Report No. 34, NSW Department of Primary Industries, Orange.
35 Davies, B.L., Carberry, P.M., Graham, R.P., Mullen, J.D. and Meaker, G.P., (2007) StockPlan®: A Decision Aid for Management of Livestock During Drought and Other Times, Economic Research Report No. 35, NSW Department of Primary Industries, Paterson.
36 Gibson, T.S., Allan, G.L., File, G., Mullen, J.D., Scott-Orr, H., 2005, ‘Priorities and Principles for Investment in Aquaculture Research by NSW Department of Primary Industries’, Economic Research Report No. 36, NSW Department of Primary Industries, Orange. Available at: http://www.agric.nsw.gov.au/reader/10550
37 Mounter, S., Griffith, G., Piggott, R., Fleming, E. and Zhao, X. (2007), Composition of the National Sheep Flock and Specification of Equilibrium Prices and Quantities for the Australian Sheep and Wool Industries, 2002-03 to 2004-05, Economic Research Report No. 37, NSW Department of Primary Industries, Armidale, September.
38 Mounter, S., Griffith, G., Piggott, R., Fleming, E. and Zhao, X. (2007), An Equilibrium Displacement Model of the Australian Sheep and Wool Industries, Economic Research Report No. 38, NSW Department of Primary Industries, Armidale, September.
39 Davies, L., Quinn, H., Della Bosca, A., Griffith, G., Trengove, G. and Alford, A. (2007), The Economic Effects of Alternate Growth Path and Breed Type Combinations to Meet Beef Market Specifications across Southern Australia, Economic Research Report No. 39, NSW Department of Primary Industries, Armidale, September.

32
40 Orr, L., McDougall, S. and Mullen, J. (2008), An Evaluation of the Economic, Environmental and Social Impacts of NSW DPI Investments in IPM Research in Lettuce, Economic Research Report No. 40, NSW Department of Primary Industries, Orange.
41 Orr, L., Stevens, M. and Mullen, J. (2008), An Evaluation of the Economic, Environmental and Social Impacts of NSW DPI Investments in IPM Research in Invertebrate Rice Pests, Economic Research Report No. 41, NSW Department of Primary Industries, Orange.
42 Alford, A.R., McKiernan, W.A., Cafe, L.M., Greenwood, P.L. and Griffith, G.R. (2008), The Economic Effects of Using Heterozygotes for a Non-functional Myostatin Mutation within a Commercial Beef Production System, Economic Research Report No. 42, NSW Department of Primary Industries, Armidale, May.
43 Nordblom T, Finlayson JD, Hume IH, Kelly JA (2009), Supply and demand for water use by new forest plantations: a market to balance increasing upstream water use with downstream community, industry and environmental use?, Economic Research Report No. 43, NSW Department of Primary Industries.
44 Alford, A.R., Garcia, S.C., Farina, S. and Fulkerson, W.J. (2009), An Economic Evaluation of the FutureDairy Complementary Forage Rotation System - Using Cost Budgeting, Economic Research Report No. 44, Industry and Investment NSW, Armidale, August.
45 Alford, A.R., Garcia, S.C., Farina, S. and Fulkerson, W.J. (2009), An Economic Evaluation of the FutureDairy Complementary Forage Rotation System - Using Whole Farm Budgeting, Economic Research Report No. 45, Industry & Investment NSW, Armidale, August.

E CO N O M I C R E S E A R C H R E P O R T N O. 45
An Economic Evaluation of the FutureDair y Complementar y Forage Rotation System –
Using Whole Farm Budgeting
August 2009