an economy that works for all americans -...
TRANSCRIPT

“An Economy That Works for All Americans”
Jeffrey Frankel Harpel Professor of Capital Formation and Growth
Harvard Institute for Learning in Retirement
February 24, 2017
1
“An Economy That Works for All Americans” *
I. Are ordinary Americans being left behind in the modern economy?
II. If so, why?
III. And what is to be done about it?
2
* The title comes from a session at the Harvard Bipartisan Program for Newly Elected Members of Congress, HKS, December 7, 2016.
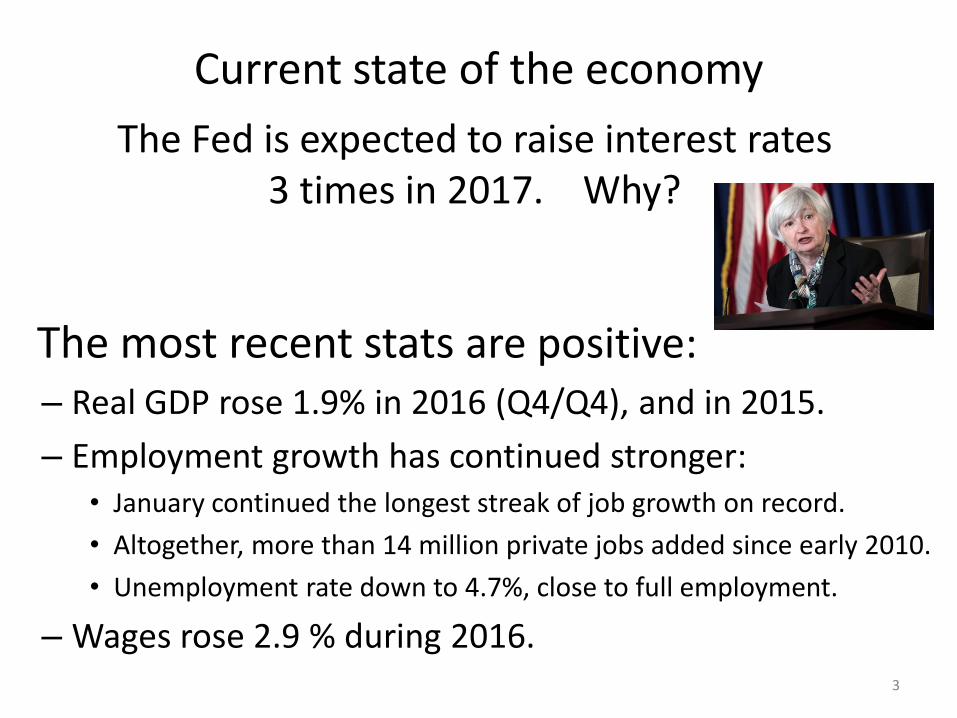
Current state of the economy
The most recent stats are positive: – Real GDP rose 1.9% in 2016 (Q4/Q4), and in 2015.
– Employment growth has continued stronger: • January continued the longest streak of job growth on record.
• Altogether, more than 14 million private jobs added since early 2010.
• Unemployment rate down to 4.7%, close to full employment.
– Wages rose 2.9 % during 2016.
3
The Fed is expected to raise interest rates 3 times in 2017. Why?
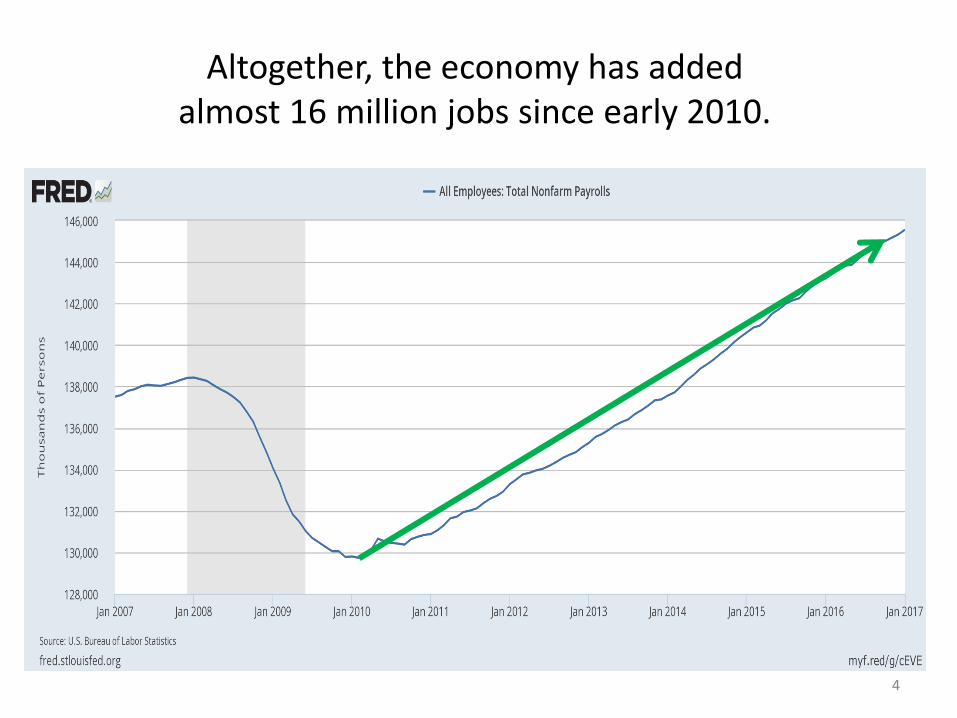
Altogether, the economy has added almost 16 million jobs since early 2010.
4
(I) If the economy is in such good shape, why has there been such discontent?
One obvious answer:
5
The longer-term trend for the typical American has not been good:
The longer-term trend for typical Americans has not been good.
Since 2000, the gains have gone to those at the top.
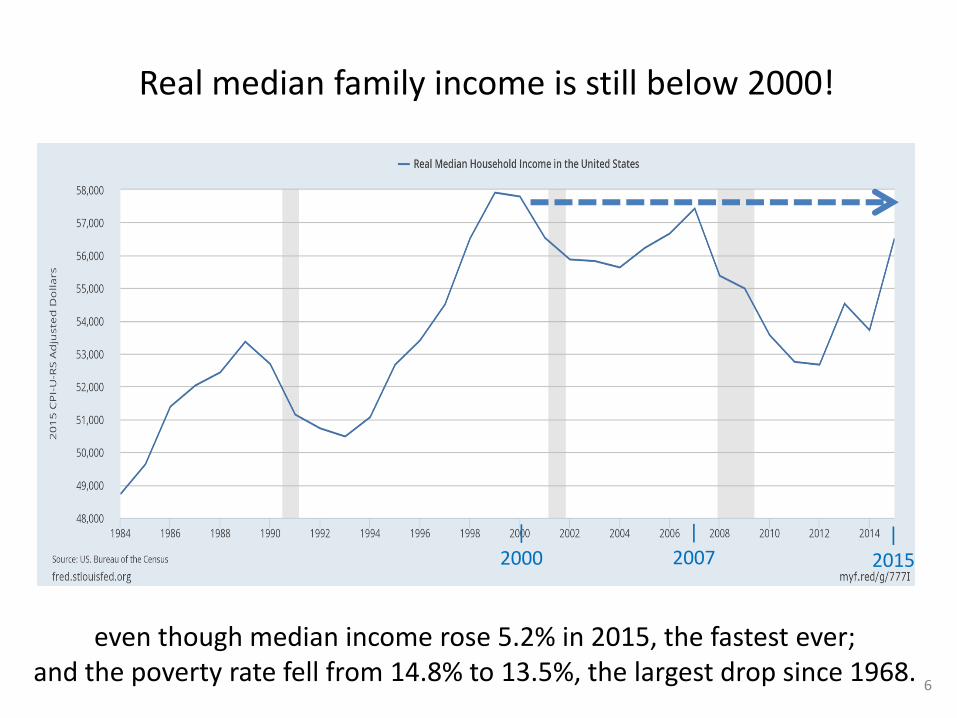
Real median family income is still below 2000!
| 2015
| 2007
| 2000
6
even though median income rose 5.2% in 2015, the fastest ever; and the poverty rate fell from 14.8% to 13.5%, the largest drop since 1968.
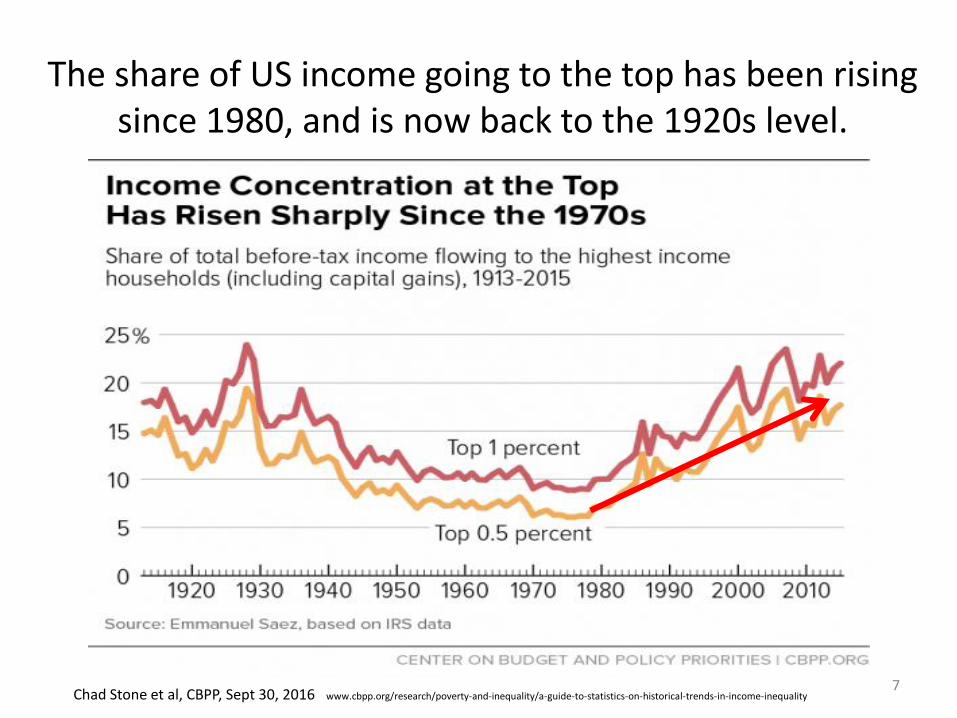
The share of US income going to the top has been rising since 1980, and is now back to the 1920s level.
Chad Stone et al, CBPP, Sept 30, 2016 www.cbpp.org/research/poverty-and-inequality/a-guide-to-statistics-on-historical-trends-in-income-inequality 7
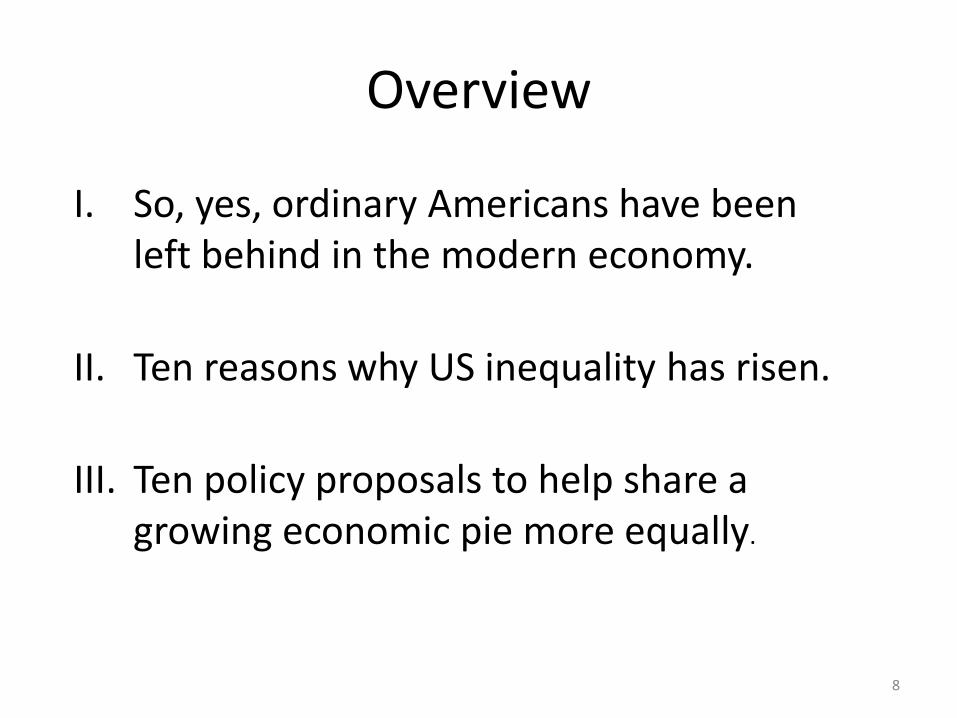
Overview
I. So, yes, ordinary Americans have been left behind in the modern economy.
II. Ten reasons why US inequality has risen.
III. Ten policy proposals to help share a growing economic pie more equally.
8
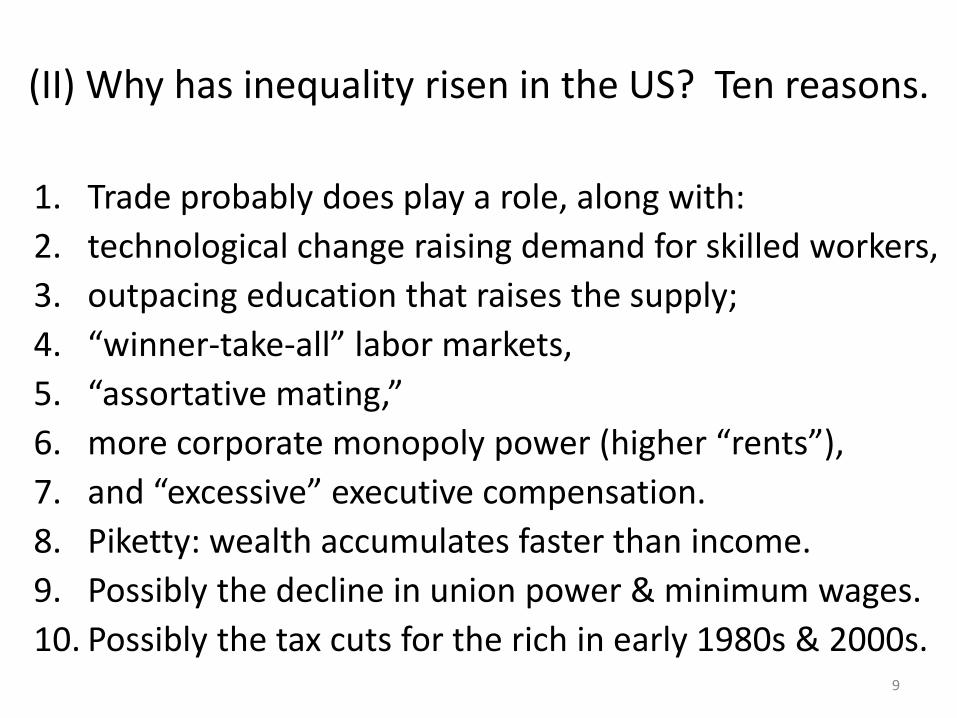
(II) Why has inequality risen in the US? Ten reasons.
1. Trade probably does play a role, along with:
2. technological change raising demand for skilled workers,
3. outpacing education that raises the supply;
4. “winner-take-all” labor markets,
5. “assortative mating,”
6. more corporate monopoly power (higher “rents”),
7. and “excessive” executive compensation.
8. Piketty: wealth accumulates faster than income.
9. Possibly the decline in union power & minimum wages.
10. Possibly the tax cuts for the rich in early 1980s & 2000s. 9
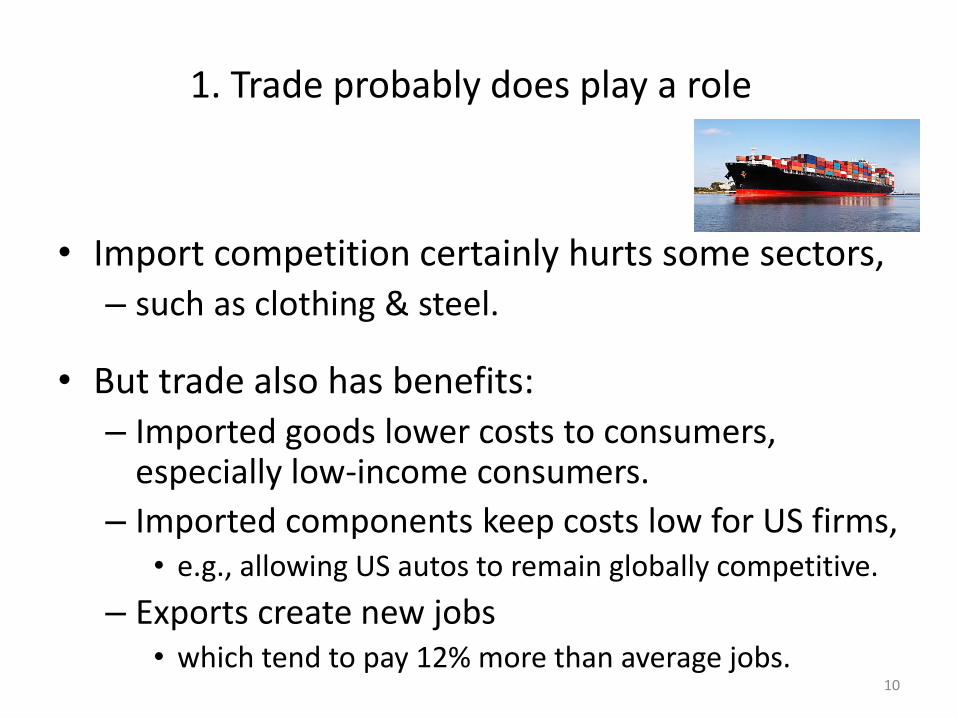
1. Trade probably does play a role
• Import competition certainly hurts some sectors, – such as clothing & steel.
• But trade also has benefits: – Imported goods lower costs to consumers,
especially low-income consumers.
– Imported components keep costs low for US firms, • e.g., allowing US autos to remain globally competitive.
– Exports create new jobs • which tend to pay 12% more than average jobs.
10
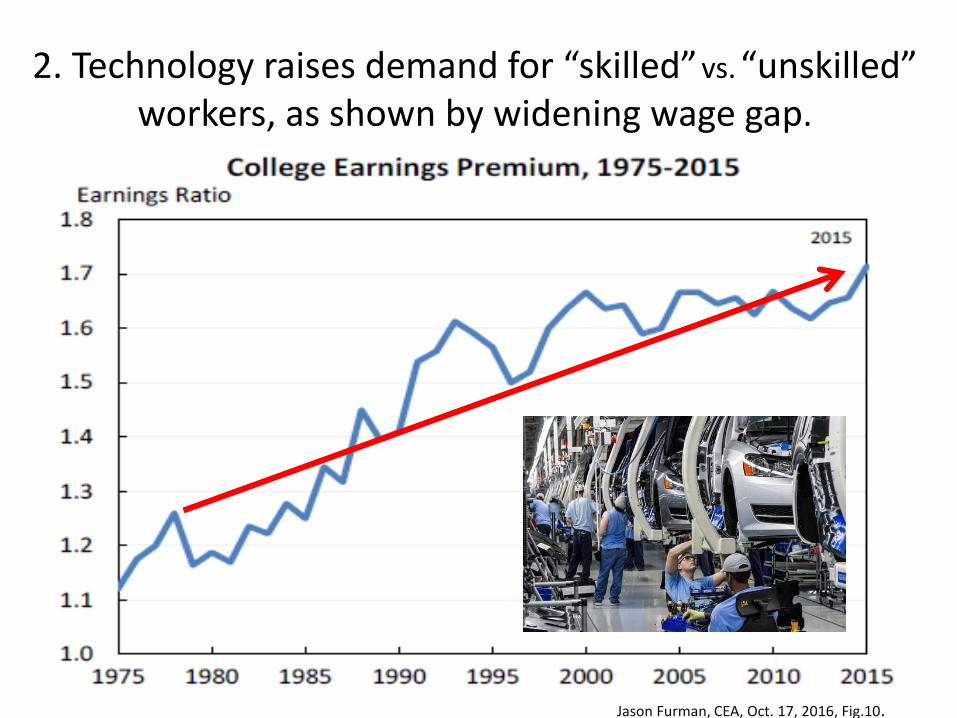
2. Technology raises demand for “skilled” vs. “unskilled” workers, as shown by widening wage gap.
11
Jason Furman, CEA, Oct. 17, 2016, Fig.10.
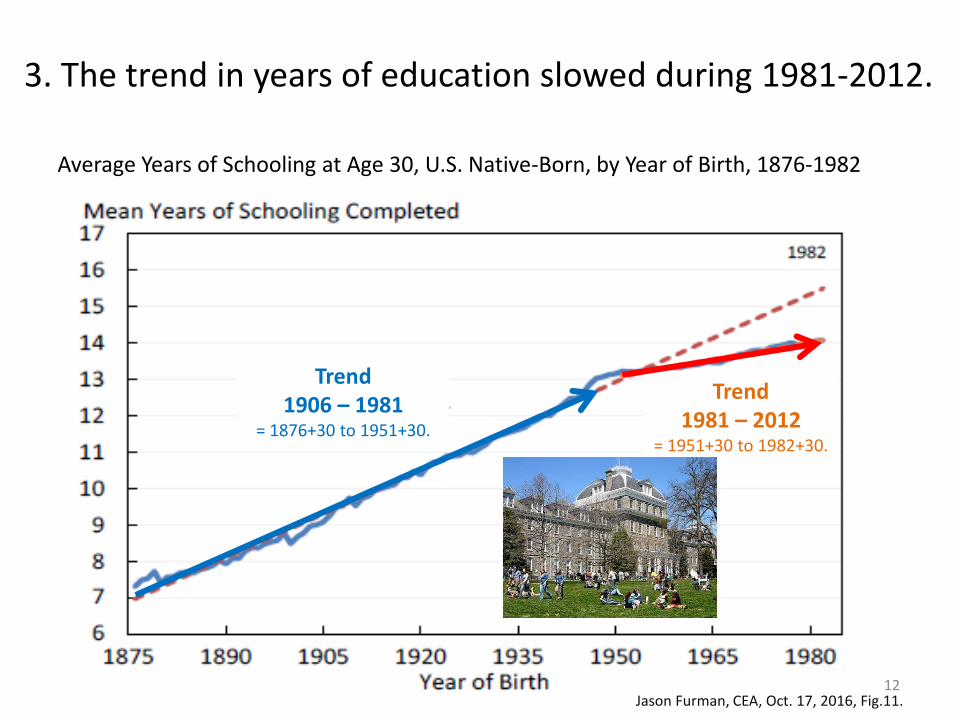
3. The trend in years of education slowed during 1981-2012.
Jason Furman, CEA, Oct. 17, 2016, Fig.11.
Trend 1981 – 2012
= 1951+30 to 1982+30.
Trend 1906 – 1981
= 1876+30 to 1951+30.
Average Years of Schooling at Age 30, U.S. Native-Born, by Year of Birth, 1876-1982
12

4. “Winner take all” labor markets
Taylor Swift earned $170 million last year, making her the world’s highest paid celebrity (according to Forbes).
13
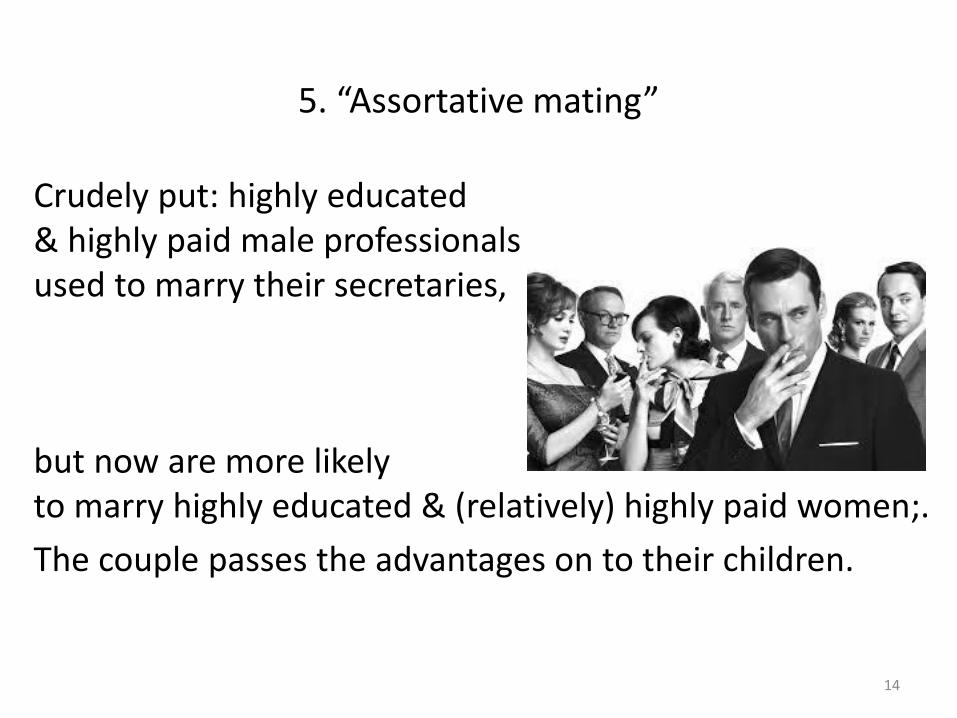
5. “Assortative mating”
Crudely put: highly educated & highly paid male professionals used to marry their secretaries,
but now are more likely to marry highly educated & (relatively) highly paid women;.
The couple passes the advantages on to their children.
14
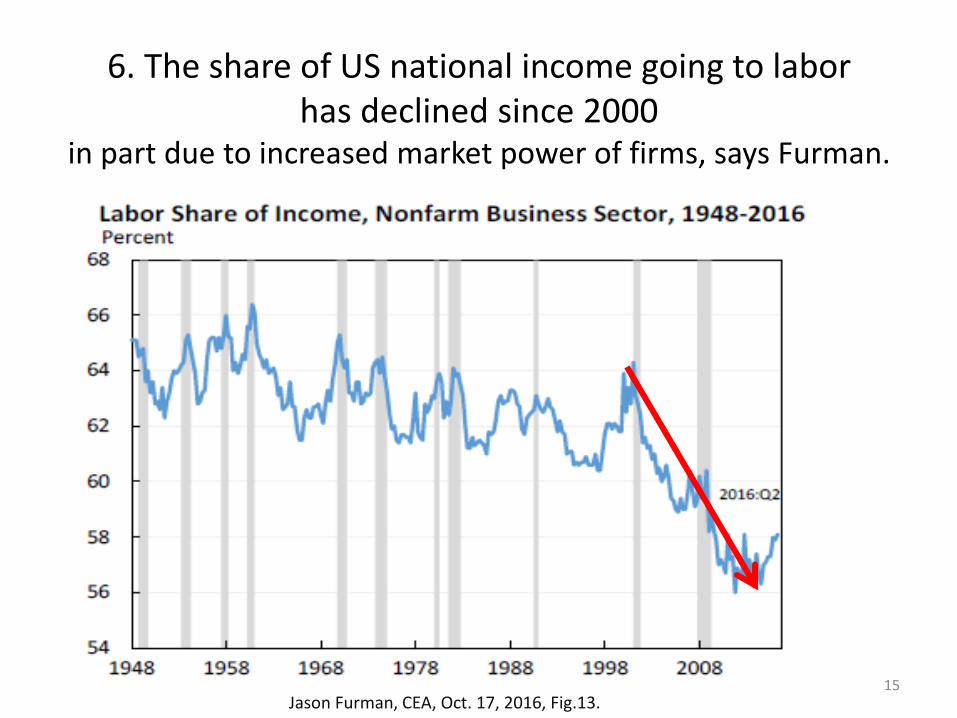
6. The share of US national income going to labor has declined since 2000
in part due to increased market power of firms, says Furman.
Jason Furman, CEA, Oct. 17, 2016, Fig.13. 15
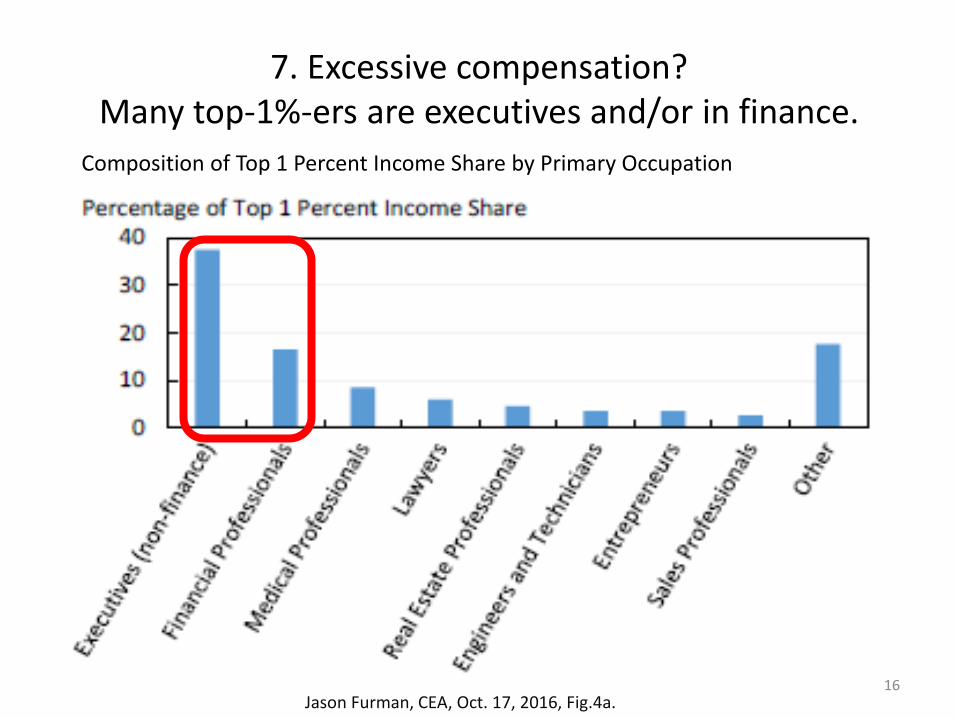
7. Excessive compensation? Many top-1%-ers are executives and/or in finance.
Jason Furman, CEA, Oct. 17, 2016, Fig.4a.
Composition of Top 1 Percent Income Share by Primary Occupation
16
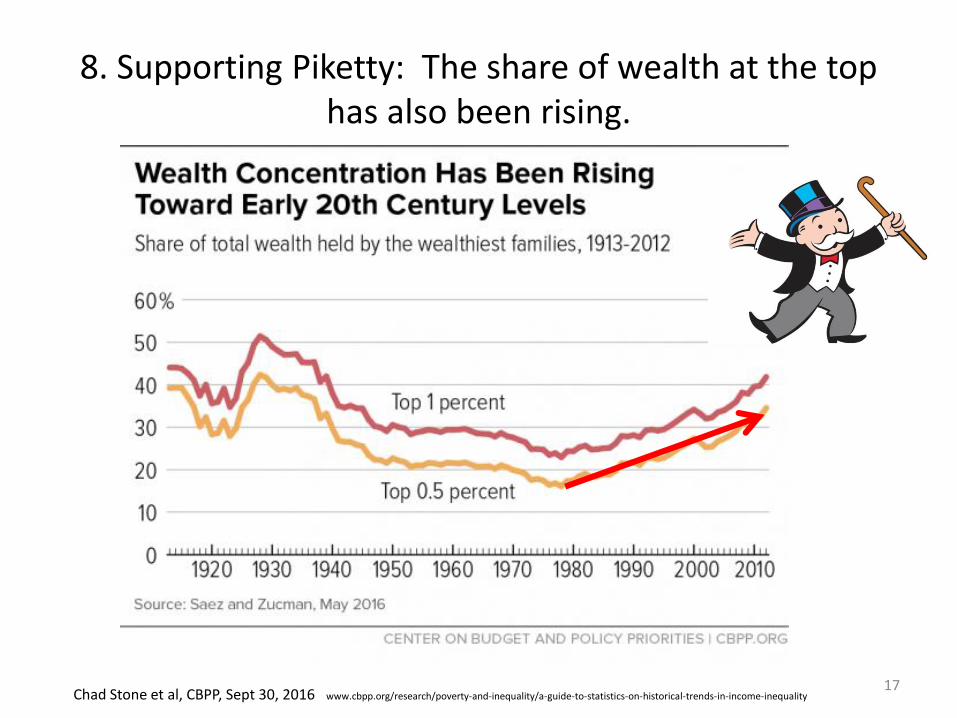
8. Supporting Piketty: The share of wealth at the top has also been rising.
Chad Stone et al, CBPP, Sept 30, 2016 www.cbpp.org/research/poverty-and-inequality/a-guide-to-statistics-on-historical-trends-in-income-inequality 17
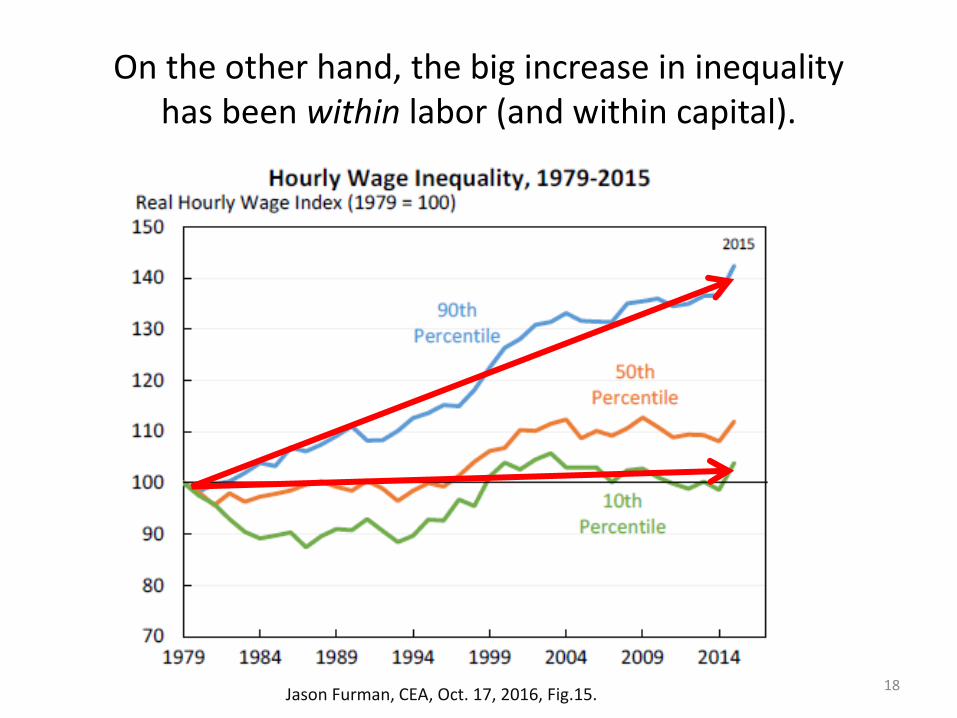
On the other hand, the big increase in inequality has been within labor (and within capital).
Jason Furman, CEA, Oct. 17, 2016, Fig.15. 18
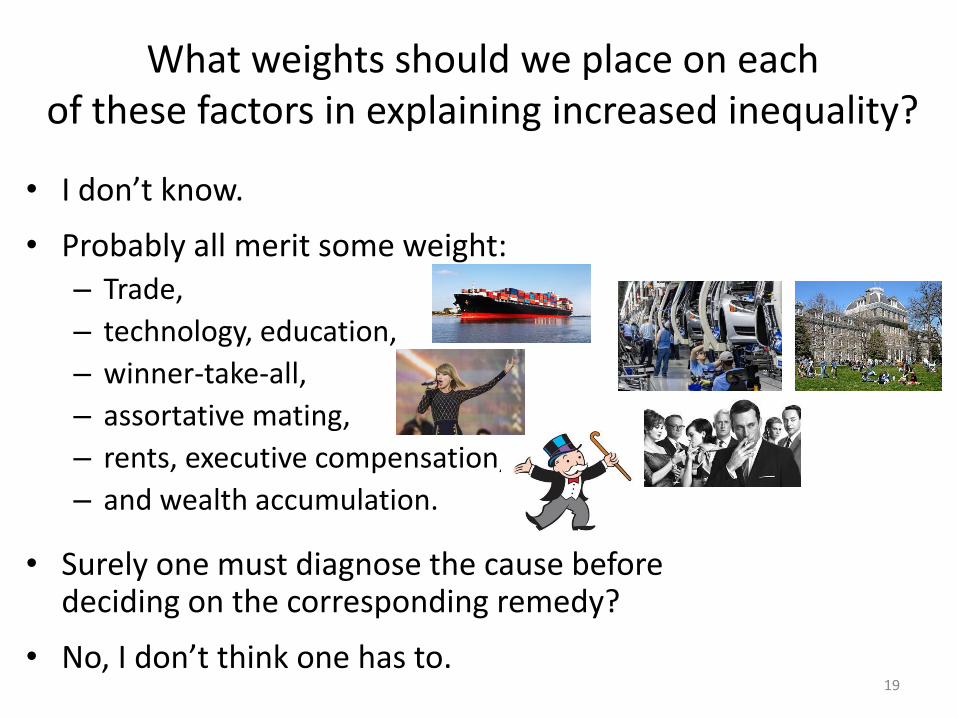
What weights should we place on each of these factors in explaining increased inequality?
• I don’t know.
• Probably all merit some weight: – Trade,
– technology, education,
– winner-take-all,
– assortative mating,
– rents, executive compensation,
– and wealth accumulation.
• Surely one must diagnose the cause before deciding on the corresponding remedy?
• No, I don’t think one has to.
19
(III) Ten policy proposals to promote An Economy That Works for All Americans
1. Expand, don’t reduce, the health-insured population.
2. Strengthen, don’t weaken, US financial regulation.
3. Address the long-term rise in household debt.
4. Reform the tax system
5. Put social security on a sound footing.
6. Increase infrastructure spending.
7. Allow fracking (but with careful regulation).
8. Improve education, esp. universal pre-school education.
9. Keep US global economic leadership, including abiding by trade agreements.
10. Consider wage insurance. 20
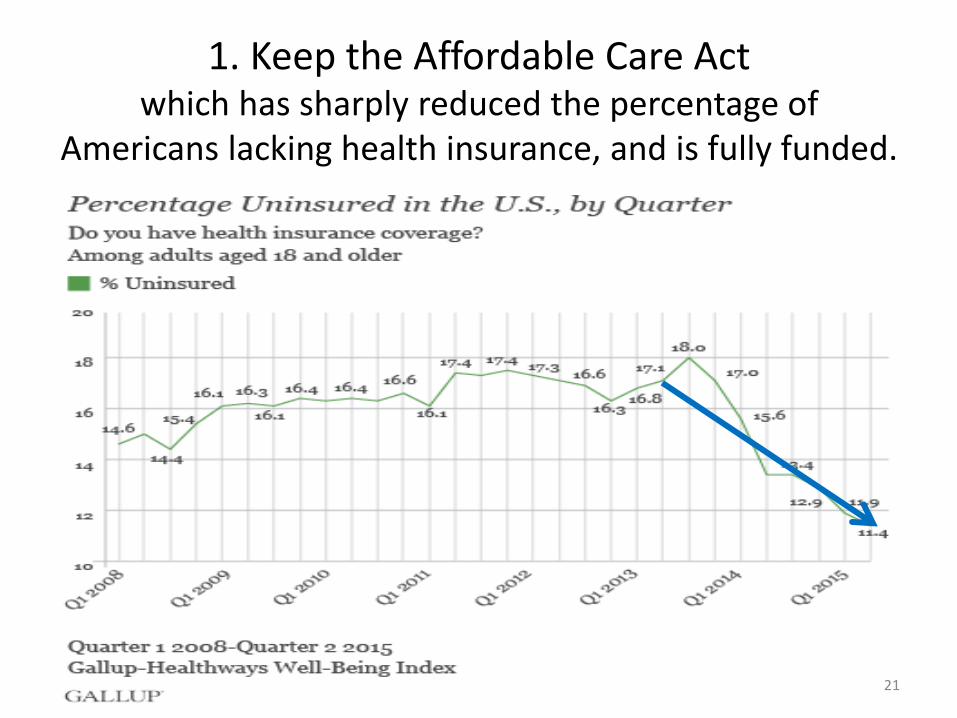
1. Keep the Affordable Care Act which has sharply reduced the percentage of
Americans lacking health insurance, and is fully funded.
21
2. Retain intelligent financial regulation
• Let the “fiduciary rule” on financial advisers go into effect in April.
• Don’t gut Dodd-Frank financial reform, esp. its: – higher capital requirements for banks,
– tough stress tests on banks,
– designation of Systemically Important Fin. Institutions,
– enhanced transparency for derivatives, and
– the Consumer Financial Protection Bureau.
22
3: Address the long-term rise in household debt: housing, auto, & student loans
• Reduce the policy tilt toward getting American families up to their eyeballs in mortgage debt they can’t afford.
– It led to 2007-09 financial crisis.
• without even much raising home ownership rates.
– Specific policies:
• Require a serious minimum down payment, as other countries do.
• Require “skin in the game,” on the part of mortgage-originators.
• Curtail tax deductibility of mortgage interest,
– which mainly benefits the well-off.
» It generally saves less than $200 for households earning $65,000.
– Reduce deductions at the upper end,
– especially if loan is used other than for purchase of residence
» i.e., 2nd home or “cash out” for spending.
• Don’t repeat the mistake of privatized Fannie Mae & Freddie Mac. 23
And it drives up housing prices
Address household debt: housing, auto & student loans, continued
• Auto dealers should not have been exempted from the Consumer Finance Protection Bureau.
– A rising share of sub-prime auto loans are now delinquent.
• Although most college educations are still a good deal, and worth going into debt for if that is the only way, some enterprises are bad deals.
• Especially a majority of for-profit universities.
• Government should expand student grants & loans,
• but tighten requirements that the college or university have a decent record regarding rates of graduation & gainful employment, not loosen them.
24
4. Reform the tax system
• Corporate income tax stay revenue-neutral: – lower rate, – but cut distorting deductions,
• e.g., oil subsidies & interest deductions.
• Reform personal income tax to make it more progressive, not regressive. – E.g., expand EITC , – and abolish the carried interest deduction.
• Don’t eliminate the estate tax.
• The most efficient taxes are on energy: – Gasoline & carbon taxes, as proposed by Feldstein & Mankiw.
25
5. Put social security on a sound footing
(1) Gradually raise the retirement age. Meanwhile,
(2) Make payroll taxes more progressive:
– Exempt low-income workers and
– raise the cap on payroll taxes (now at $117,000).
26
6. Increase infrastructure spending.
(1) It’s good for growth
(2) and makes jobs for construction workers though we could have really used it 5-7 years ago, when unemployment was twice as high.
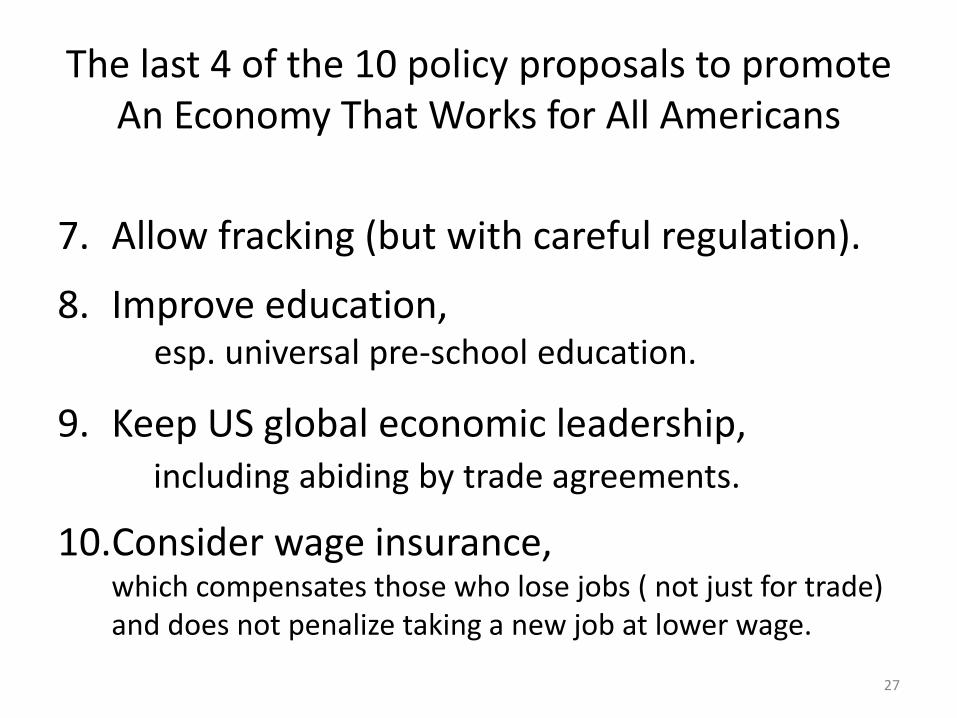
The last 4 of the 10 policy proposals to promote An Economy That Works for All Americans
7. Allow fracking (but with careful regulation).
8. Improve education, esp. universal pre-school education.
9. Keep US global economic leadership, including abiding by trade agreements.
10.Consider wage insurance, which compensates those who lose jobs ( not just for trade) and does not penalize taking a new job at lower wage.
27
An Economy That Works for All Americans
Jeffrey Frankel Harpel Professor of Capital Formation and Growth
Harvard University
28
Appendices
1. More on macroeconomic developments
– 2009 turnaround from recession
– Budget deficit
– Trade deficit
2. Long-term job losses in some sectors: manuf., ag., & coal
3. Policies targeted toward individual causes of inequality
29
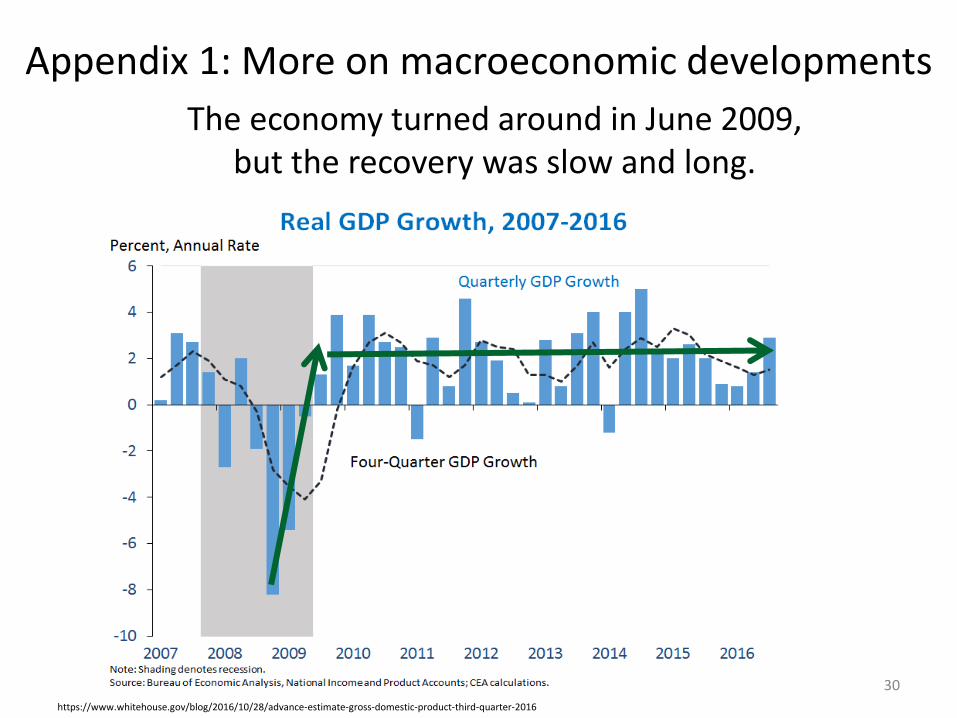
Appendix 1: More on macroeconomic developments
https://www.whitehouse.gov/blog/2016/10/28/advance-estimate-gross-domestic-product-third-quarter-2016
The economy turned around in June 2009, but the recovery was slow and long.
30
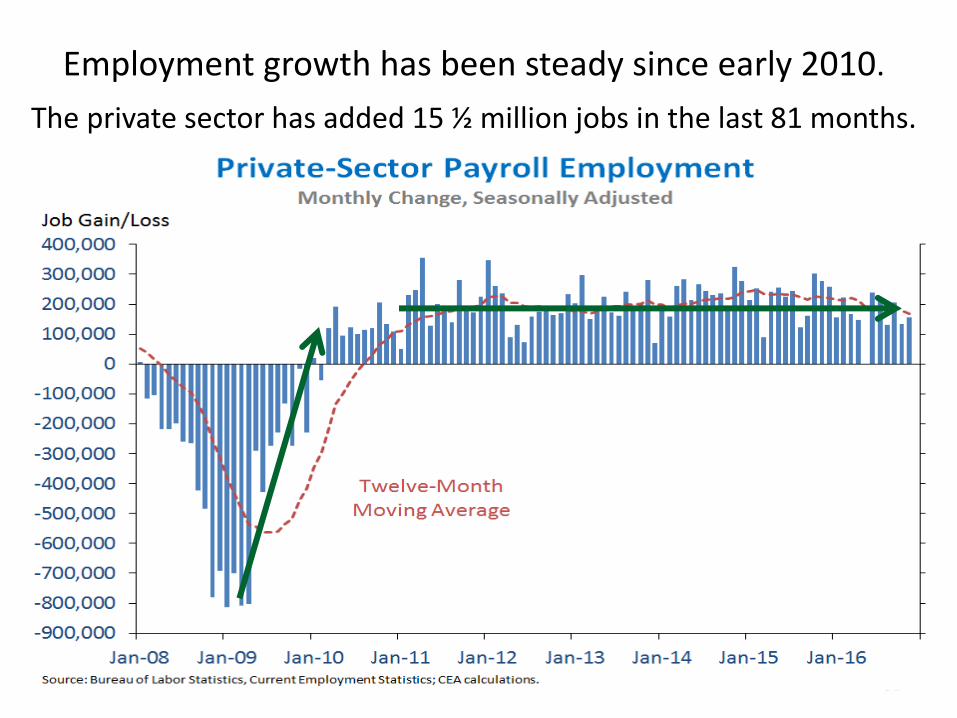
Employment growth has been steady since early 2010.
The private sector has added 15 ½ million jobs in the last 81 months.
31
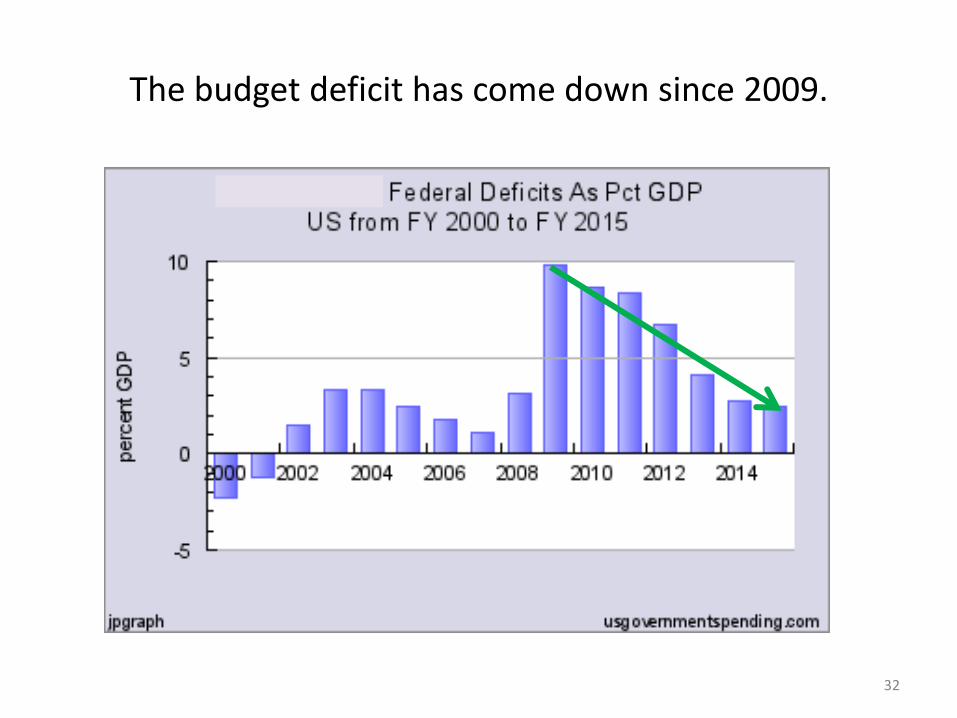
The budget deficit has come down since 2009.
32
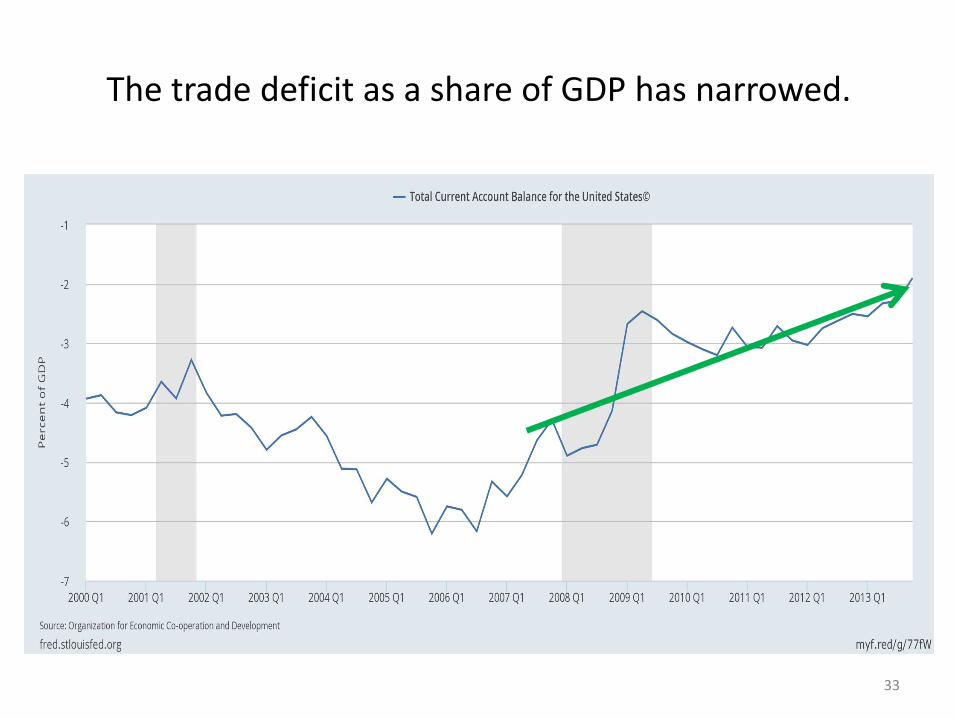
The trade deficit as a share of GDP has narrowed.
33
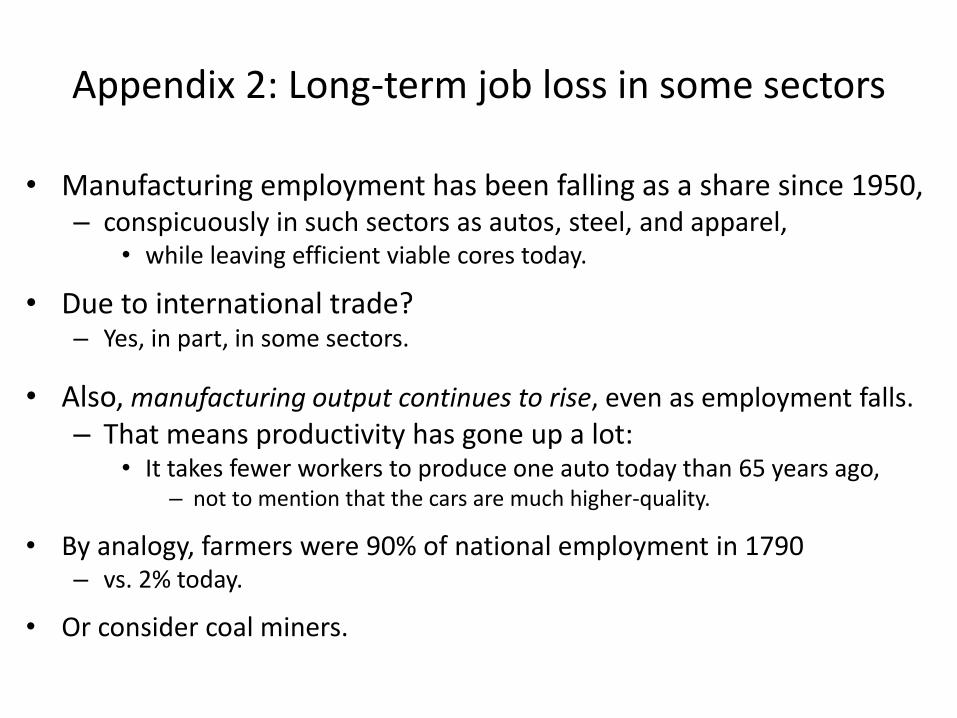
Appendix 2: Long-term job loss in some sectors
• Manufacturing employment has been falling as a share since 1950, – conspicuously in such sectors as autos, steel, and apparel,
• while leaving efficient viable cores today.
• Due to international trade? – Yes, in part, in some sectors.
• Also, manufacturing output continues to rise, even as employment falls.
– That means productivity has gone up a lot: • It takes fewer workers to produce one auto today than 65 years ago,
– not to mention that the cars are much higher-quality.
• By analogy, farmers were 90% of national employment in 1790 – vs. 2% today.
• Or consider coal miners.
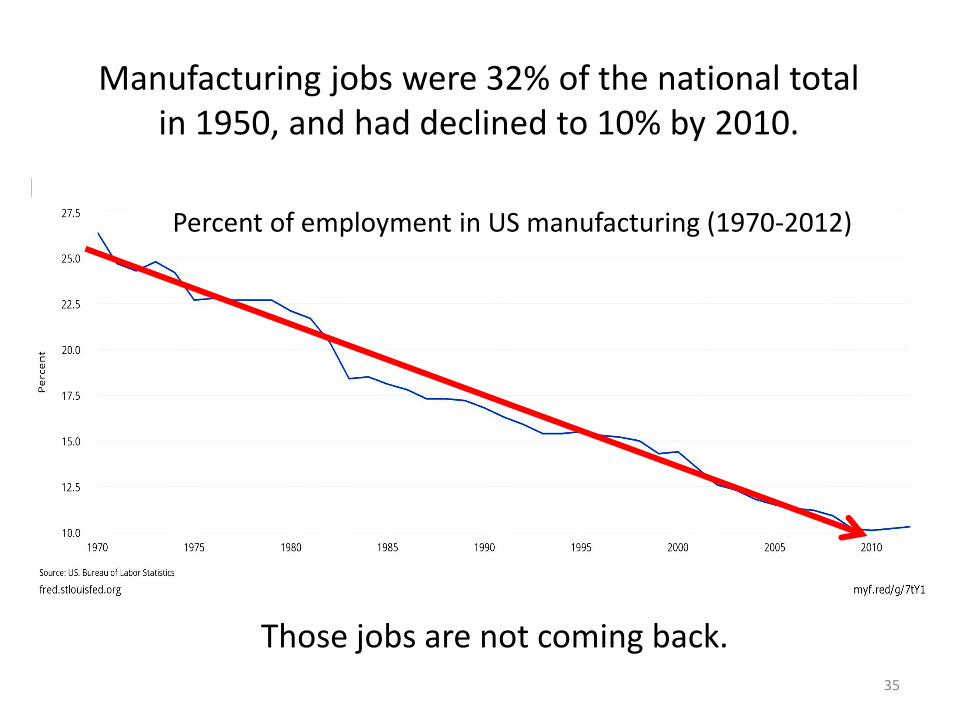
Manufacturing jobs were 32% of the national total in 1950, and had declined to 10% by 2010.
35
Percent of employment in US manufacturing (1970-2012)
Those jobs are not coming back.
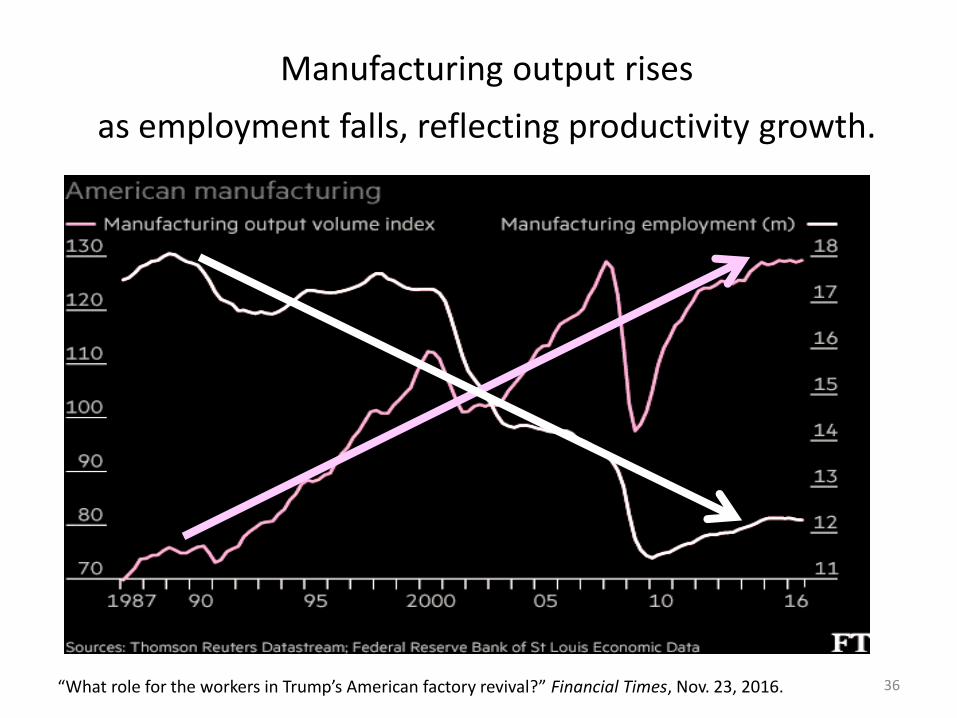
Manufacturing output rises
“What role for the workers in Trump’s American factory revival?” Financial Times, Nov. 23, 2016. 36
as employment falls, reflecting productivity growth.
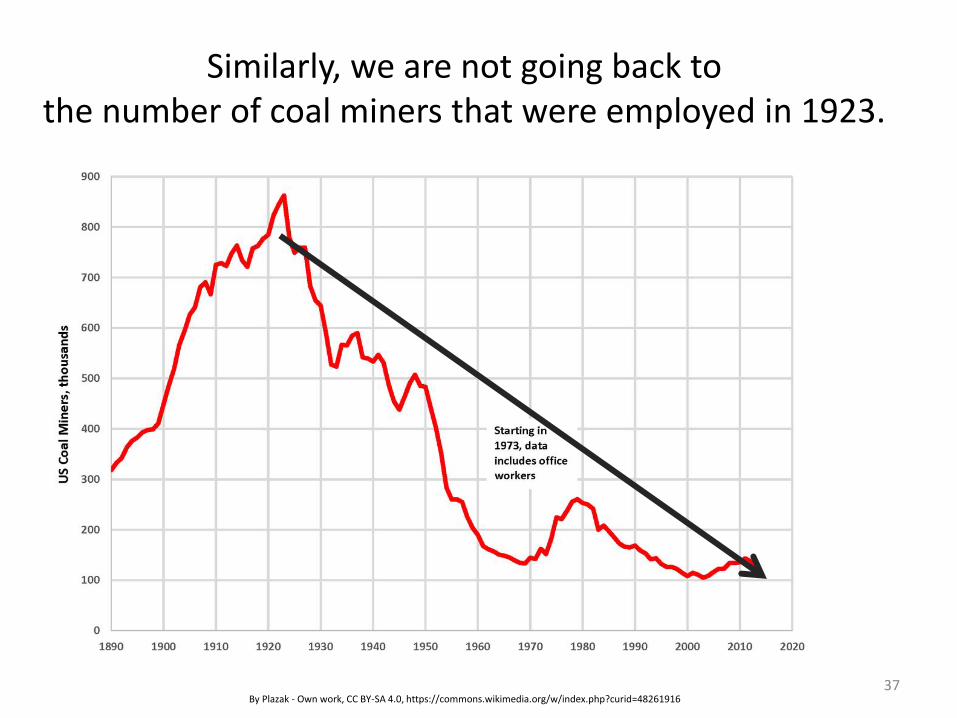
Similarly, we are not going back to the number of coal miners that were employed in 1923.
By Plazak - Own work, CC BY-SA 4.0, https://commons.wikimedia.org/w/index.php?curid=48261916 37
Some reasons for employment shifts
• Trade? It works in favor of the US agricultural and coal sectors.
• Even regulation has not been the big source of job loss in coal. – Rather, in recent years, it has been cheap natural gas from fracking; – and, before that, the shift from Appalachian underground mining
to Wyoming open-pit mining.
• In the case of all 3 sectors, the biggest reason for the decline in jobs has not been trade, but rather productivity growth, – particularly arising from technological progress, including automation. – The demand for labor has shifted toward high-skill jobs. – Meanwhile the supply of high-skilled workers has not kept up.
• But regardless the causes of rising inequality, good policies can share income gains more widely.
38
Appendix 3: For each of the 8 inequality diagnoses, one might think of a targeted policy response:
1. Trade
– Trade Adjustment Assistance or, better yet, wage insurance.
2. Technology and 3. education
– Make college more accessible to lower-income students.
4. “Winner-take-all” labor markets.
– Raise income taxes & payroll taxes for the upper 0.1%.
5. “Assortative mating”
– Education again, especially universal pre-school.
…
39
For each of the 8 inequality diagnoses, a targeted policy response continued:
… 6. Corporate monopoly power
– More aggressive anti-trust action.
7. Executive compensation, especially in finance
– Reforms such as “say on pay,” separating the function of CEO & Chairman of the Board, “claw-back provisions,” and so on;
– Continued financial reform, begun under Dodd-Frank
• e.g., risk-tax on large financial institutions.
– Higher tax rates on the upper 0.1% and, very specifically, eliminating the carried-interest deduction.
8. Piketty’s wealth accumulation:
-- Inheritance tax, at least on estates above $5 million. 40