an efci survey edition 2016 (data 2014) - sba.di.dks branchestatistik... · edition 2016 (data...
TRANSCRIPT

THE CLEANING INDUSTRY IN EUROPE
AN EFCI SURVEY
Edition 2016 (Data 2014)
February 2017 – Price: 180 €
Edited and published by the European Federation of Cleaning Industries (EFCI) Rue de l’Association 27 – 1000 Brussels – Belgium – Tel: +32 2 225 83 30 – Fax: +32 2 225 83 39 – www.efci.eu
© Copyright 1987-2016 - EFCI. None of the contents may be reproduced in whole or in part without explicit authorisation.

2
INTRODUCTION This is the 20th annual survey on the Cleaning Industry in Europe published by the EFCI. It has been progressively improved over the years and, although it is still not a “statistical” survey in the strictest sense of the term, it gives quite a fair picture of the industry and its evolution since 1989.
As usual, data is gathered through the EFCI member associations on the basis of a questionnaire and the report has been elaborated by the EFCI Secretariat. A special thank must be given to the members of the EFCI Economic Affairs Committee, who have dedicated an important part of their work to this exercise.
Please note that all data refer to the year 2014. For the purpose of this survey, “cleaning industry” has to be understood in reference to the NACE classification – REV. 2, section N, division 81, group 81.2: “cleaning activities”. It includes “general cleaning of buildings” and “industrial cleaning activities” as well as some other activities carried out by cleaning contractors, such as waste management services, chimney sweeping, façade cleaning, or maintenance of areas around buildings.
Unfortunately only limited data was available for other service industries. Therefore, a comparison of cleaning with other service sectors has not been possible this year. Furthermore the cooperation with the World Federation of Building Service Contractors (WFBSC) has not yet resulted in the possibility to compare European markets with other international markets. In addition, general European economic indicators have been taken from Eurostat statistics and the European Commission publications, in particular:
“Employment and Social Developments in Europe 2015” – Directorate General for Employment, Social Affairs and Inclusion (Unit A1), January 2016
High-Level Group on Business Services final report, Directorate General for Enterprise and Industry (Unit A4), 08.04.2014
Eurostat, Statistical books – 2015 edition, “People in the EU: who are we and how do we live?”
“Demographic future of Europe – from challenge to opportunity”, European Commission, COM (2006) 0571 final, 12.10.2006
Further information can be obtained directly from the EFCI Secretariat: Rue de l’Association, 27
B – 1000 Brussels Tel: + 32 2 225 83 30 – Fax: + 32 2 225 83 39 Email: [email protected] / Website: www.efci.eu
3
TABLE OF CONTENT Part 1: Market developments
Turnover page 4
Breakdown per country page 5
Market penetration page 6
Market segments page 7
Trends in market segments page 8 Part 2: The contractors
Number of companies page 9
Breakdown by size page 10
Breakdown by country page 10
Turnover per company page 12 Part 3: The people
Employment page 13
National breakdown page 14
Productivity page 15
Work organisation page 17
Part-time work page 19
Duration of work page 20
Gender aspects page 21
Ethnic minorities page 22
Structure of the workforce page 23 Annex: Market leaders in the year 2014 page 24

4
Part 1 MARKET DEVELOPMENTS
Turnover In 2014, cleaning contractors achieved a total turnover of 73.925 billion € in the 20 European countries covered by the survey. This demonstrates the good recovery of the industry after the most severe global financial and economic crisis between 2008 and 2010 since the Great Depression of the 1930’s. Indeed, it represents a net increase of 14.54% over two years (2012-2014), while the EU-27 GDP was limited to a growth of 0.2% in 2012-2013 and of 1.4% in 2013-20141. On average, the annual turnover growth in the industry over the last 25 years is at 9.35%.
No updated data available for the Czech Republic, Luxembourg, Hungary, Poland and Portugal
Although the economic crisis strongly hit the economy as a whole in 2009, it had less seriously affected the industry. Indeed, the industry’s resistance could be explained by higher productivity gains and the continuous increase in market penetration2. Even if the general economic context with a yearly EU-28 GDP growth of only 0,8% on average between 2012 and 2014 was not very favourable, this figure however confirms the continuous general shift from an industrial economy towards a service-based economy during the last 24 years. This macroeconomic context is due to a number of factors: the first and most important reason is the continuous trend to outsourcing, whereby supporting and ancillary operations, previously done in-house, are awarded to external contractors. Secondly, a higher productivity growth has been recorded in the industrial economy, while at the same time there has been a transfer of jobs from industrial to service activities. Another reason is the overlap between services and industry which tends to accentuate the apparent reduction in the importance of manufacturing. Indeed, this phenomenon has been deeply examined and identified by the HLG as “the servitization of manufacturing - the tendency for manufacturing firms to sell services and solutions, rather than products and goods”3.
1 Source: Employment and Social Developments in Europe 2015, Statistical annex, Real GDP – table 1, page 337, Directorate General
Employment, Social Affairs and Inclusion (Unit A1) 2 Share of the global cleaning market contracted out to specialised companies (the difference being performed in-house)
3 High-Level Group on Business Services, Final report, Executive summary, page 5, par. 2, Directorate General for Enterprises and Industry
12,8 13,9 18,5 19,5 21 22,3 24,4 25,5
28,3 32,1 33,3 34,8
38,1 39,9 44,4
49,9 54,4
62,0 61,5 64,5
73,9
0
10
20
30
40
50
60
70
80TURNOVER 1989 - 2014
BILLION EURO

5
Breakdown by country
No updated data available for the Czech Republic, Hungary, Poland and Portugal
Germany, France, UK, Italy and Spain are the 5 largest national markets. Together, they represent around 72% of the total European turnover. The high growth of industry turnover registered in the UK and Luxembourg between 2012 and 2014 is mainly due to an actualisation of turnover figures demonstrating an annual organic growth over recent years, and partly to the increase of outsourcing. Indeed, the strong increase of the British figure in 2014 is due to a mismatch of the figure provided in 2012. The 2014 UK figure is therefore again coherent with the 2010 survey edition, and the trend mentioned in the 2012 edition is not confirmed. Moreover, it’s been the first time since 2005 that the turnover figure from Luxembourg was updated. A comparison between 2012 and 2014 shows some interesting developments. Four of the five largest markets in Europe (UK, Germany, Spain and France) registered a strong growth, whilst the turnover in Italy increased modestly (+1.3%). The Swiss, Belgian, Norwegian, Slovenian and Austrian markets remain very dynamic, which reflects the significant increase in market penetration over the last years. The strong decrease of industry turnover in Denmark is the result of a review of the calculation system. In 2012, the Danish figure also included the catering industry in the calculation, which is not the case anymore. As explained above, the Luxembourgish and British growth indications should be taken cautiously because the industry turnover was largely underestimated in previous years.
No updated data available for Cyprus, the Czech Republic, Hungary, Poland and Portugal
A 1250 1,69%
B 1744 2,36%
CH 2000 2,71%
CY 36 0,05%
CZ 645 0,87%
D 14674 19,85%
DK 2711 3,67%
ES 7540 10,2% F 12595
17,04% FI 1700 2,3%
HU 500 0,68%
IT 8390 11,35%
L 264 0,36%
NL 4221 5,71%
NO 1235 1,67%
PL 168 0,23%
PT 400 0,54%
SE 3118 4,22%
SI 165 0,22%
UK 10569 14,3%
Turnover by country 2014 (million €)
-20,4%
0,0% 0.0% 0,0% 0,0% 0,0% 0,8% 1,3% 3,9% 5,0% 9,3% 13,6% 13,8% 14,6% 16,3% 17,4% 20,9% 22,1%
99,0%
164,%
DK FI PL PT HU CZ NL I SE F ES A SI EU NO D B CH UK L
Biannual growth 2012 / 2014
6
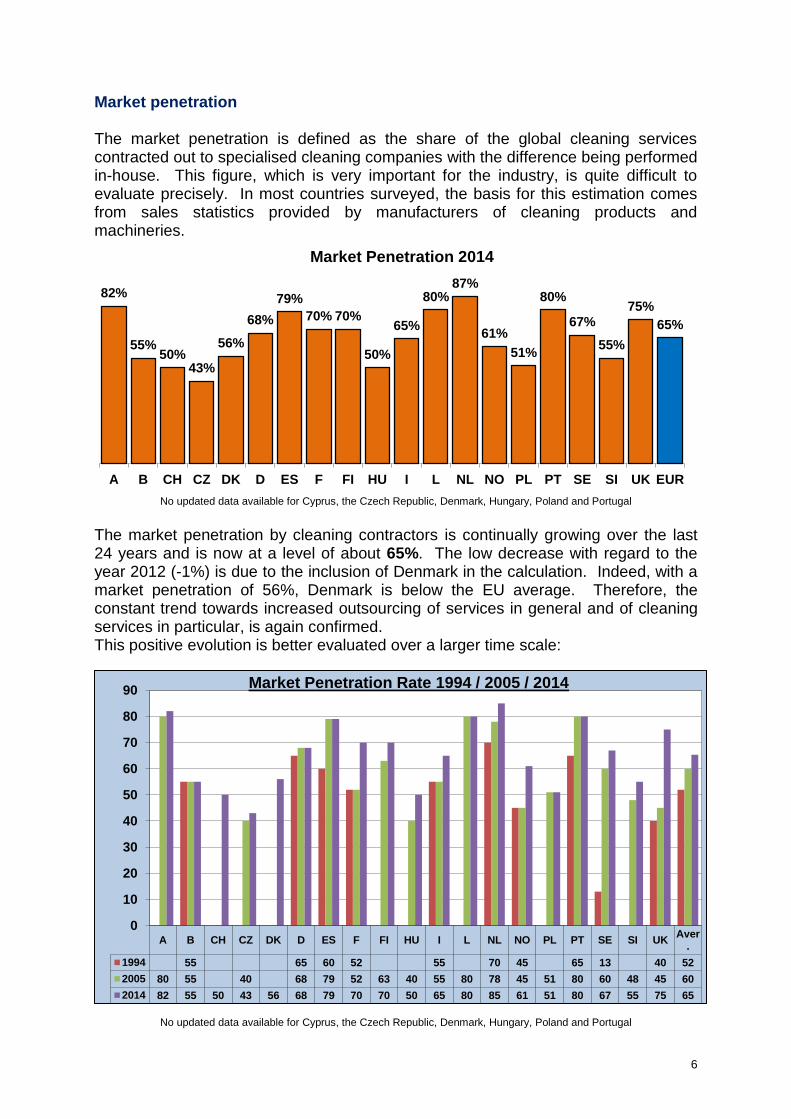
Market penetration The market penetration is defined as the share of the global cleaning services contracted out to specialised cleaning companies with the difference being performed in-house. This figure, which is very important for the industry, is quite difficult to evaluate precisely. In most countries surveyed, the basis for this estimation comes from sales statistics provided by manufacturers of cleaning products and machineries.
No updated data available for Cyprus, the Czech Republic, Denmark, Hungary, Poland and Portugal
The market penetration by cleaning contractors is continually growing over the last 24 years and is now at a level of about 65%. The low decrease with regard to the year 2012 (-1%) is due to the inclusion of Denmark in the calculation. Indeed, with a market penetration of 56%, Denmark is below the EU average. Therefore, the constant trend towards increased outsourcing of services in general and of cleaning services in particular, is again confirmed. This positive evolution is better evaluated over a larger time scale:
No updated data available for Cyprus, the Czech Republic, Denmark, Hungary, Poland and Portugal
82%
55% 50%
43%
56%
68%
79%
70% 70%
50%
65%
80% 87%
61%
51%
80%
67%
55%
75%
65%
A B CH CZ DK D ES F FI HU I L NL NO PL PT SE SI UK EUR
Market Penetration 2014
A B CH CZ DK D ES F FI HU I L NL NO PL PT SE SI UKAver
.
1994 55 65 60 52 55 70 45 65 13 40 52
2005 80 55 40 68 79 52 63 40 55 80 78 45 51 80 60 48 45 60
2014 82 55 50 43 56 68 79 70 70 50 65 80 85 61 51 80 67 55 75 65
0
10
20
30
40
50
60
70
80
90Market Penetration Rate 1994 / 2005 / 2014

7
It is noteworthy that on average about 35% of the market is still performed in-house, which represents a huge potential in terms of economic development for the sector, with direct impact on employment. In national terms, 3 groups of countries can be distinguished in 2014: 1. The first group with a penetration rate of 70% or higher includes the Netherlands,
Austria, Luxembourg, Portugal, the UK, Spain, Finland and France. 2. The second group with a rate of 55% or higher includes Germany, Sweden,
Norway, Italy, Belgium, Denmark and Slovenia. 3. The third group with a rate lower than 55% includes Poland, Hungary, Switzerland
and the Czech Republic. Market segments Besides the evolution of the turnover in quantitative terms, it is quite interesting to look at the developments of the sector in terms of activity. The sector is mainly devoted to maintaining and improving a working or leisure environment that is clean and pleasant for everyone. However, one has to consider that cleaning contractors are directly involved in ensuring the necessary level of hygiene in hospitals, in the food and high-tech industries, to quote only three of the most significant examples of industry’s specific activities.
No updated data available for Cyprus, the Czech Republic, Finland, Hungary, Poland, Portugal, Slovenia and Switzerland
Offices 51,8%
Industrial sites 8,1%
Hospitals 7,3%
Schools & leisure 8,5%
Public transports 3,6%
Windows 4,1%
Facade cleaning 1,2%
Shops & Commercial sites
6,8% Serv. for individuals
2,2%
Associated services (waste collection,
catering etc.) 2,6%
Reception 0,2%
Gardening 0,4%
Maintenance services 0,3%
Others (misc…) 3,2%
Breakdown by market segments 2014

8
The table above indicates the breakdown of turnover between the various market segments. “Office cleaning” remains by far the most important segment in terms of turnover (51.8%) with an increase of 2.3% compared to 2012. As the previous survey highlighted, the relative importance of office cleaning continuously decreased since 1995 and, for the first time, dropped below 50% in 2008. Since 2008, it remained rather stable and is levelling off at around 50%. The diversification of activities towards integrated services, facilities management etc. is a fact in all EU Member states. However at present, there are no data collection systems available that would allow for its quantification (especially in terms of turnover). Although the diversification of new activities is not anymore a new trend, the non-availability of data can also be explained by the fact that this kind of information is considered by most companies as part of their commercially sensitive data and is therefore kept confidential. Trends in market segments Due to the diversification of activities in the various countries, it is recommended to see these figures as estimations. Either no systematic data collection exists at national level, or the collection of data is gathered using different sources and breakdowns. Consequently, the presented figure gives a fair idea of the reality but cannot be seen as exact in the strictest sense of the term.
Office cleaning remains the core activity and represents 51.8% of the total turnover. In spite of an increase of 2.3% between 2012 and 2014, its relative importance continuously decreased by 15.8% since 1995. In parallel, specialised services have increased constantly by 18.6% since 1995, even if a slow decrease of 1% could be registered between 2012 and 2014.
No updated data available for Cyprus, the Czech Republic, Finland, Hungary, Poland, Portugal, Slovenia and Switzerland
It may seem too early to draw final conclusions from this figure but the constantly progressing upwards curve of specialised and related services seems to have come to a halt at a high level and thus confirms the tendency towards a diversification of activities, i.e. multi-service and facilities management. This trend is increasingly influencing the strategic and operational planning of cleaning contractors. As a consequence of the changes in the clients’ needs and expectations, adaptation of the employees’ professional competences is an even more strategic challenge for the whole industry.
67,6 %
59 %
52,7 %
51,7 %
57 %
55.4 %
53.4 %
52.7 %
48,6%
50,5%
49,5%
51,8
13,3 %
22,8 %
26 %
29,6 % 20.2 %
22.3 %
23 %
23.7 %
26,3%
30,9% 32,9%
31,9%
0
10
20
30
40
50
60
70
80
1995 1997 1999 2001 2002 2003 2005 2006 2008 2010 2012 2014
% o
f M
ark
et
Trends in Market Segments
Office Cleaning

9
Part 2 THE CONTRACTORS
Number of companies The total number of cleaning contractors in the 20 countries covered by the survey exceeded 171 560. This represents a decrease of 3% over two years (2012-2014), thus an average decrease of 1.5% per year. However, it must be noted that the UK alone accounts for a diminution of more than 16.000 companies (-51%) in these two years. This development is mainly due to a mistake in the data provision for the previous survey. Therefore, the figure regarding the number of companies in the previous survey was inaccurate and it can be assumed that - without this mistake - the total 2012 figure would have been around 160.000 companies. As a consequence, the 2014 figure of 171.561 represents a real increase of 7.2% between 2012 and 2014. Like in 2012, the increase is explained by indicators demonstrating that the number of people setting up companies and being self-employed largely increased between 2012 and 2014. While between 2008 and 2010 the rate of creation of new companies decreased for the first time since 1989, this negative trend was not confirmed between 2010-2012 and 2012-2014, and on average over the last 24 years about 9% of new companies were created every year. In this regard, it is important to note that the improved economic situation led to an increase in the number of companies in a majority of countries: Austria, Finland, France, Italy, Luxembourg, the Netherlands, Norway, Spain, Sweden and Switzerland.
No updated data available for the Czech Republic, Hungary, Poland and Portugal
Since the early 90’s a higher level of concentration of companies could be registered and therefore the link between the increase in turnover and the creation of companies was less and less proportionate. However, except in the aftermath of the crisis between 2008 and 2010, this proportionality was taking place again since 2003 (between the periods 2003 – 2008 and 2010 – 2014). The future editions of the survey will show whether this phenomenon will be further confirmed.
31.8
09
33.5
72
34.8
49
39.7
38
41.0
93
44.6
28
47.4
02
47.4
39
53.9
94
57.2
44
64.2
82
68.5
53
75.2
81
85.2
68
99.5
54
121.8
36
129.4
36
158.4
30
139.2
09 1
76.9
02
171.5
61
0
20.000
40.000
60.000
80.000
100.000
120.000
140.000
160.000
180.000
200.000
1989 1990 1991 1992 1993 1994 1995 1996 1997 1998 1999 2000 2001 2002 2003 2005 2006 2008 2010 2012 2014
Number of companies between 1989 and 2014

10
Breakdown by size Figures on the breakdown of companies according to their turnover do not exist in most of the countries covered by the survey. Therefore, the breakdown of companies has been carried out according to the number of employees. However, it is widely assessed that, on average, companies employing more than 500 people (i.e. about 1.39%) achieve almost half of the total turnover in the industry. In absolute figures, the cleaning industry is still largely dominated by very small companies: about 77.15% of them employ less than 10 people. In 2010, it was the first time since 2003 that the number of medium-sized companies (with 10 to 500 workers) decreased, a trend that was again slightly confirmed in 2014 (-0.72%) The number of very small companies is increasing since 2008 and the number of very large companies remains quite stable.
No updated data available for the Czech Republic, Denmark, Hungary, Poland and Portugal
Germany appears to be quite an exception in Europe. Indeed, the German market is organised in quite a different way: as a matter of fact, 7.50% of the companies in these countries employ more than 500 people, 18.5% employ between 50 and 500 people, 5.5% employ between 10 and 50 people and 68.50% employ less than 10 people. Breakdown by country In national terms, the most important increase in the number of companies between 2012 and 2014 could be registered in Norway (+53%), Luxembourg (+26%), Sweden (+25%), France (+23%) and Switzerland (+18%). While the number of companies remained stable in the Czech Republic, Denmark, Hungary, Poland and Portugal, a decrease could be only registered in four countries: UK (-51%, see explanation on page 9), Belgium (-3.2%), Germany (-2.4%) and Slovenia (-0.5%).
The strong increase in Norway is mainly due to the increase of self-employed persons that establish companies, to the favourable national economic climate and to a recent actualisation of previously underestimated figures. In Luxembourg, Sweden and Switzerland, the company increase is directly related to an underestimation of previous figures and a strong increase of business activities, in parallel to the turnover growth in these countries (see page 5).
< 10 workers 77,15%
10 < workers < 50
14,46%
50 < workers < 500 7,00%
> 500 workers 1,39%
Breakdown by size

11
In France, the increase can be explained by a recent actualisation of the previously underestimated figures and by a continuous recourse to the widespread statutes of “self-entrepreneur”, established in 2010. Finally, a growth in the number of companies could also be registered in Austria (+7.1%), the Netherlands (+5.2%), Finland (+3.8%), Spain (+1.2%) and Italy (+0.45%). These figures can be mainly explained by the favourable economic climate. As explained above, the strong company decrease in the UK is due to a mismatch of the figure provided in 2012. Indeed, the figure of 31.300 companies provided for 2012 was inaccurate and was therefore revised for 2014. The 2014 UK figure (15.240) is therefore again coherent with the 2010 figure (14.500 companies). The company decrease in Germany and Slovenia can be explained by a higher level of concentration of companies. Indeed, in these two countries, the turnover and the number of employees increased between 2012 and 2014 (see page 5 and 14-15). In Belgium, the reason for the company decrease is unclear. Although the industry turnover increased by 21% between 2012 and 2014, the Belgian GDP stagnated in 2013 (0%) and only grew by 1.3% in 20144.
No updated data available for the Czech Republic, Hungary, Poland and Portugal
The high number of companies in France (20.96%), Spain (14.49%) and Italy (12.94%) is explained by the high number of individuals or small family business registered as cleaning contractors in these countries.
4 Source: Employment and Social Developments in Europe 2015, Statistical annex, Real GDP Belgium, page 345, Directorate General
Employment, Social Affairs and Inclusion (Unit A1)
A 7500 - 4,37%
B 2115 - 1,23%
CH 2635 - 1,54%
CY 322 - 0,19%
CZ 3300 1,92%
D 19522 - 11,38%
DK 4000 - 2,33%
ES 24851 - 14,49%
F 35963 - 20,96%
FI 4800 - 2,80% HU 2386 - 1,39%
I 22192 - 12,94%
L 171 - 0,10%
NL 11610 - 6,77%
NO 6000- 3,50%
PL 4000 - 2,33%
PT 1500 - 0,87%
SE 2387 - 1,39% SI 1067 - 0,62%
UK 15240 - 8,88%
Number of companies per country 2014: 171.561

12
Turnover per company The table below indicates the turnover by company (relationship between the countries’ turnover and the number of contractors) and gives an indication of the concentration of the private sector in each country. On EU-average, this figure increased by 8.52% from 444.000 € in 2012 to 482.000 € in 2014. The correction of the UK figures regarding the turnover and the number of companies can explain the increase, as well as the Luxembourg updated figures. The major decrease in the number of companies in the UK, as well as the actualisation of the turnover figure in Luxembourg widely influenced the average outcome. As a result, Luxembourg now has the highest turnover per company, followed by Sweden, Belgium, Switzerland, Germany, Denmark and the UK.
No updated data available for the Czech Republic, Hungary, Poland and Portugal
Next to the spectacular increase of company turnover in Luxembourg (+110%) and in the UK (+308%) (see pages 5 and 10-11), an increase of company turnover can also be registered in Belgium (+24.8%), Germany (+20.3%), Slovenia (+14.3%), Spain (+7.9%), Austria (+6.1%) and Switzerland (+3.7%). For Belgium, Germany, and Slovenia, this increase is directly caused by the decrease in the number of companies (respectively -3.2%, -2.4%, and -0.5%) with a favourable turnover growth (+20.9%, +17.4% and +13.8%). For Spain, Austria and Switzerland, this development can be explained by a turnover growth that is more important than the increase in the number of companies. The opposite trend, i.e. an important decrease of company turnover, can be registered in Norway (-24.1%), Denmark (-20.4%), Sweden (-16.7%), France (-14.4%), the Netherlands (-4.2%) and Finland (-3.7%). For Norway, France, the Netherlands and Finland, this is due an important increase in the number of companies compared to an either smaller turnover growth. For Denmark, it is directly linked to the important turnover decrease whilst the number of companies remained stable.
A B CH CY CZ D DK ES F FI HU I L NL NO PL PT SE SI UKEU
aver.
2012 157 660 732 195 625 851 281 409 368 210 375 735 379 271 42 267 1.56 135 170 444
2014 167 824 759 85 195 752 678 303 350 354 210 378 1544 364 206 42 267 1.30 155 694 482
0
250
500
750
1.000
1.250
1.500
1.750
Th
ou
san
ds
EU
RO
Turnover per company 2012 - 2014

13
Part 3 THE PEOPLE
Employment In 2014, more than 3.39 million people5 were employed in the cleaning industry, as opposed to 3.32 million in 2012. This represents an increase of 2.3% over two years (2012-2014), thus an average growth of 1.15% per year, while the EU-28 employment respectively decreased by 0.3% in 2013 and increased by 1% in 20146. After the crisis in 2008-2010, which obliged companies to strongly reduce their employee base due to expenses’ cuts of (public and private) clients in almost all European countries, the employment increase of the sector restarted in 2012 (+0.1%) and continued in 2014 (+2.3%), by surpassing the level of 2005. Moreover, the average annual employment growth in the industry over the last 25 years is at 4.13%.
No updated data available for the Czech Republic, Hungary, Portugal and Poland
The drop in employment between 1998 and 1999 (-5.2%) has to be viewed in direct connection with the two previous years’ high growth in the sector: +10% in 1997 and +4.9% in 1998. After a moderate growth of 1.2% in 2000, the industry was again growing faster: +7.3% in 2001, +4.5% in 2002, +18.6% in 2003 (addition of Poland), +4.18% between 2003 and 2005 (addition of Slovenia), +5.3% in 2006 (addition of Switzerland) and +5% between 2006 and 2008. Due to the economic crisis, a strong decrease (-10.5%) was registered in 2010 for the first time since 1999. Since then, the situation improved again. Indeed, cleaning is a highly labour intensive industry and therefore any decrease or increase of activities has a direct influence on the employment rate.
Comparing the average annual turnover growth of 9.35% over the last 25 years (see page 4) with the average annual employment growth of 4.13%, it can be seen that job creation starts at a turnover growth of about 2%. On the other side, the productivity gains obtained through technological developments (better equipment and products) have to be taken into account. 5 Employment figures are expressed “per capita” and not in terms of “full-time equivalent”
6 Source: Employment and Social Developments in Europe 2015, Statistical annex, Total employment , page 337, Directorate General
Employment, Social Affairs and Inclusion (Unit A1)
1,65 1,68 1,76
1,46
1,96 2,07 2,11
2,20
2,42 2,54
2,41 2,44
2,62 2,71
3,22 3,35
3,53
3,71
3,32 3,32 3,39
1989 1990 1991 1992 1993 1994 1995 1996 1997 1998 1999 2000 2001 2002 2003 2005 2006 2008 2010 2012 2014
Employment growth (millions)

14
National breakdown
No updated data available for the Czech Republic, Hungary, Poland and Portugal
Germany remains the biggest employer in absolute figures (18.18% of the total workforce) with an employment growth of 6.2% (+35.859 employees) between 2012 and 2014. After the market liberalisation in 2004, the self-employed rate increased significantly between 2004 and 2006 lowering as a result the number of persons in an employment relationship. Between 2006 and 2008, this constant company growth has also led to a strong employment increase. This increase was not at all confirmed during 2008-2010 when the figures related to employment and the number of companies strongly decreased., which was due to the fact that the German statistical office was again providing actualised data by only considering those companies that have a yearly minimum turnover of 17.500 € or that pay social contributions for their employees. Between 2010 and 2012, both the employment rate and the number of companies were on the rise again. Between 2012 and 2014 however, employment grew (+6.2%) while the number of companies decreased (-2.4%), thus signalling a higher level of concentration of companies.
Germany is followed by France, the UK, Italy and Spain (all between 14.2% and 9.74% of the workforce). Together, about 68% of the total workforce of the cleaning industry is employed in these five countries.
A comparison between 2012 and 2014 shows some interesting developments: With the exception of Denmark, Belgium, Spain and the Netherlands, the industry in all other countries registered a growth or stood stable.
The most spectacular increases were registered in Finland, in Luxembourg and in Norway. They have to be taken however cautiously, as they partly result in an improvement of statistical data provision (Luxembourg and Norway) or in a change of employees counting method (Finland).
A 5200 1,53%
B 49078 1,45%
CH 70000 2,06%
CY 1615 0,05%
CZ 81000 2,39% D 616900
18,18%
DK 35100 1,03%
ES 333260 9,74%
F 481 675 14,20% FI 57397
1,69%
HU 130000 3,83%
I 424845 12,52%
L 8649 0,25%
NL 139189 4,10%
NO 34372 1,18%
PL 320000 9,43%
PT 40000 1,01%
SE 54121 1,60%
SI 5870 0,17%
UK 460800 13,58%
Employment 2014: 3 392 959 persons

15
No updated data available for Czech Republic, Hungary, Poland and Portugal
In Denmark, the significant decrease in employment is due to a general update of previous figures. Indeed, employment in the catering sector is not anymore included in the 2014 figure as was the case before. The employment decrease in Belgium is directly linked to the decrease in the number of companies (-3.2%). In Spain, the employment decrease is unclear, insofar as there has been a strong turnover increase (+9.3%) and a slight increase in the number of companies (+1.2%). The same goes for the Netherlands where an increase in turnover (+0.9%) and in the number of companies (+5%) could be registered. The next survey will probably give a better picture on these developments. The growth in employment observed in Sweden, Switzerland, Germany and the UK can be explained by the improved economic climate in these countries. Productivity “Productivity” in the cleaning industry again increased in 2014. The average turnover per worker in 2014 is at 26.880 €. This represents an increase of 8.9% compared to the year 2012 (24.680 €). This increase follows the trend observed in the years 2001–2005 (+3% in 2002, +5.8% in 2003, +6% in 2004 and 2005). By contrast, in 2006 and between 2006 and 2008, the increase was respectively of only 1.92% and 1.56%. In 2010 however, the productivity of the cleaning industry strongly increased again (+7.66%) and returned to the levels of the years 2001-2005. This development was accelerated through the spectacular increase in 2012 (+20.5% - see explanations in previous edition) and was again confirmed in 2014 (+8.9%). It will be interesting to see in the next survey whether this development will continue. In any case, the technological innovation is strongly supporting the increase in productivity.
A B CH CY CZ D DK ES F FI HU I L NL NO PL PT SE SI UK
0%
-5,00%
7,69%
0,00% 0.00%
6,17%
-27,22%
-4,10%
2,70%
43,49%
0,00% 0,71%
13,01%
-2,73%
13,33%
0,00% 0,00%
7,89%
2,73% 5,30%
Employment 2012 / 2014

16
No updated data available for the Czech Republic, Hungary, Poland and Portugal
As shown in the following table, national situations in most of the countries have only slightly changed, expect in Luxembourg, the UK and Finland. The figure from Luxembourg (+134%) can only be explained by the recent data actualisation, including a turnover increase of 164% and a parallel employment increase of 13% (see explanations on pages 5 and 15). The British figure (+89%) is explained by a recent correction of the turnover data (see explanations on page 5). The Finnish figure (-43.5%) is due to a strong increase of the number of workers (+43.4%, see explanation page 15) while the turnover remained stable. The productivity increase in Belgium (+27.2%) can be explained by a turnover increase (+21%) and a decrease in the number of employees (-5.3%). Spain, Austria, Switzerland, Slovenia, Germany and Denmark show productivity improvements with an increase of respectively +14%, +13.5%, +13.3%, +11%, +10.2% and +9.4% compared to 2012.
No updated data available for Cyprus, the Czech Republic, Hungary, Poland and Portugal
0,53
3,85
7,96
10,00
17,75
19,75
22,29
22,82
23,79
24,04
26,15
26,88
28,11
28,57
29,62
30,33
30,52
35,54
35,93
57,71
77,24
PL
HU
CZ
PT
UK
I
CY
ES
D
A
F
EU
SI
CH
FI
NL
L
B
N…
SE
DK
Turnover per worker - 2014 (thousands €)
0
10
20
30
40
50
60
70
80
A B CH CY CZ D DK ES F FI HU I L NL NO PL PT SE SI UK EU
2012 21,1 27,9 25,2 7,96 21,5 70,6 20,0 25,5 42,5 3,85 19,6 13,0 29,2 35,0 0,53 10,0 59,8 25,3 12,1 24,8
2014 24,0 35,5 28,5 22,2 7,96 23,7 77,2 22,8 26,1 29,6 3,85 19,7 30,5 30,3 35,9 0,53 10,0 57,6 28,1 22,9 26,8
Turnover per worker 2012 / 2014 (x1000€)

17
WORK ORGANISATION Working periods With quite remarkable exceptions, cleaning services remain predominantly performed outside the usual periods of occupation of the premises. This is particularly true for office cleaning, but also applies to commercial premises or buildings with public access. Indeed the following table7 shows that, on an EU-average, cleaning services are performed either early in the morning8 (27%), in the late afternoon / beginning of the evening9 (37%). In Finland and Sweden however, daytime cleaning10 became the rule and represents respectively 75% and 73% of the total. Poland and Norway are both at the third place with 50% of cleaning services performed during the day followed by Denmark and Belgium, where it covers almost half of the total. In the rest of Europe, daytime cleaning remains limited: the average of 30% is reduced to 13.7% if these six countries are not taken into account in the calculation.
No updated data available for Cyprus, the Czech Republic, Hungary, the Netherlands, Poland and Portugal
With the exception of Spain, where night work represents 25% of the cleaning work, this phenomenon remains limited to specific situations (for instance industrial premises, hospitals, airports, etc.). National legislations or collective agreements in all EU member states do indeed provide for supplementary charges and/or higher wages for night workers, which clients do only accept if no other solution can be envisaged.
7 Based on reasonable estimations given by the relevant national associations
8 Immediately after the night period and before the beginning of “usual” working hours (generally from 5/6 to 8/9 am)
9 After the end of the “usual” working hours and before the beginning of the night period (generally from 5/6 to 8/9 pm)
10 i.e. during the occupation of the premises
20
25
25
25
35
12
17
30
40
30
5
45
15
28
15
60
27
8
44
15
17
45
75
3
15
16
50
50
25
20
7
73
11
30
70
30
50
53
10
12
75
50
40
20
35
20
55
40
8
25
37
2
1
10
5
10
1
5
5
4
0
10
10
10
25
5
4
7
0% 10% 20% 30% 40% 50% 60% 70% 80% 90% 100%
Austria
Belgium
Switzerland
Czech Rep.
Denmark
Finland
France
Germany
Luxembourg
Norway
Poland
Portugal
Slovenia
Spain
Sweden
UK
EU average
Morning
Day
Evening
Night

18
In spite of technical developments (for instance wireless and silent vacuum cleaners), which now offer adequate solutions to combat the disadvantages daytime cleaning may present (especially in office cleaning), the reluctance of clients to accept solutions including daytime cleaning remains predominant in Europe. In their Joint Declaration for the cleaning industry11, the EFCI and UNI-Europa stress the benefits daytime cleaning is offering to clients, contractors and employees and show their support to all initiatives aiming to increase daytime cleaning. Indeed, daytime cleaning offers substantially more opportunities for full-time work and, consequently, improves professionalism (easier access to professional training), employees’ motivation and recognition (cleaning is no longer anonymous) as well as a better balance between private and working life. Due to the inevitable demographic change, there will be some important challenges to face in the future. The main reasons are a significant fall in fertility, a significant increase in life expectancy and the ageing of the baby-boomer generation. This inevitable trend towards a much older population will be a major challenge for the future concerning the recruitment and retention of employees. In this regard, daytime cleaning is among the solutions, as it will allow for an increase of working hours and therefore certainly raise the attractiveness of the sector, especially for young people. In 2015, Eurostat (the statistical office of the EU) published a population projection of the 28 EU-Member States for the period 2014 - 208012. According to this projection, the EU-population will gradually increase from 506.8 million in 2014 to 526 million in 2050 and thereafter gradually declining to around 520 million in 2080. Although the total population of the EU is projected to increase modestly by 13.2 million (+2.6%) during this period, the relative and absolute sizes of the different population age groups are expected to follow contrasting developments. In detail,
The proportion of children will decrease from 79.1 million (15.6%) in 2014 to 78.7 million (15.1%) by 2080
The working age population (15-64 years) will fall by 41.5 million from 333.8 million (65.9%) to 292.3 million (56.2 %)
The number of older people (aged 65 to 79) will increase from 93.9 million (18.5%) in 2014 to 149.1 million (28.7 %) in 2080
The number of people aged over 80 will almost triple from 5.1% 26 million to 12.3% 63.9 million in 2080
Already in its communication published in October 200613, the European Commission resumed the effects of ageing and made some considerable proposals. Amongst the actions to minimise the effects of ageing, the Commission stressed the need to increase the fertility rate through a better balance between private and working life. Secondly, policies promoting more jobs for older workers have to be put in place. Finally, policies to better integrate migrants into the labour market will prevent the decline in population and contribute to economic growth.
11
Adopted in March 2007 by the European Sectoral Social Dialogue Committee on Industrial Cleaning 12
Source: Eurostat, Statistical books – 2015 edition, “People in the EU: who are we and how do we live?”, Chapter 7: Demographic challenges -
population projections, pages 157-173 13
Source: European Commission, “The demographic future of Europe – from challenge to opportunity”, COM (2006) 0571 final, 12.10.2006

19
Part-time work Part-time work14 remains the most frequent form of employment in the industry and covers 66% of the workforce. The trend decreased from 70% in 2001 to 66% in 2003 and then increased again to 67% in 2005 and to 70% in 2006. Since 2008, part-time work decreased again (69% in 2008 and 67% in 2010), remained stable in 2012 and decreased again by 1% in 2014 to a share of 66%. Over the last 11 years, the share of part-time work remained quite stable and oscillated between 70% and 66%. On a longer perspective however, the trend is decreasing, as part-time work represented more than 80% in the late 80’s and still 75% in 1995. Single national variations should be taken cautiously as they may result from changes in the reference periods or calculation methods. Finland is one of the examples where full-time work took over from part-time work. In 2001, part-time work accounted for 60% and steadily decreased over the years to be stabilised at the level of only 33% in 2014. Together with Poland (30%), the two countries have the lowest levels of part-time work in Europe.
No updated data available for Cyprus, the Czech Republic, Hungary, Poland and Portugal
Furthermore, it is also interesting to note that In Norway, following a change of source and a better sectoral data collection, part-time work is now at 50%, demonstrating a continuous shift to full-time work arrangements since 2008. The same applies to a lesser extend also to the UK, where part-time work decreased between 2008 and 2014 by 16%. Here again, a better data collection made it possible to identify this development.
14
Any duration of work inferior to full-time work as defined by law or collective agreements
A B CH CZ D DK ES F FI HU I L NL NO PL PT SE UK EU
2001 66% 68% 40% 80% 85% 70% 80% 60% 65% 90% 80% 80% 75% 50% 66% 70%
2008 67% 91% 63% 68% 80% 85% 60% 78% 33% 70% 95% 79% 80% 30% 75% 50% 75% 69%
2014 65% 90% 70% 70% 80% 85% 55% 64% 33% 60% 70% 95% 83% 50% 30% 75% 46% 59% 66%
0%
10%
20%
30%
40%
50%
60%
70%
80%
90%
100%
Part-time work - 2001 / 2008 / 2014

20
Duration of work As a result of the level of part-time work, the average duration of work in the cleaning industry is relatively low. It is estimated, on average, at 23 hours per week.
No updated data available for Cyprus, the Czech Republic, Hungary, Poland and Portugal
The table below demonstrates that the average work duration was at 19 hours/week in 2001, increased to 24 hours/week in 2008 and remained stable at 23 hours/week since 2010.
No updated data available for Cyprus, the Czech Republic, Hungary, Poland and Portugal
At national level, it is nevertheless interesting to note that since 2008 the average duration of work has decreased in Germany (from 20 to 15 hours), in Switzerland (from 18 to 12 hours) and in the UK (from 15 to 13 hours), while at the same time, it has increased in France (from 22 to 27) and in Spain (from 25 to 28).
0
5
10
15
20
25
3030
19
12
28
15
28 27
30 30
20
17
28
20
28
13
23
Hours/Week
A B CH CZ D ES F FI I L NL NO PT SE UK EU
2001 20 22 17 20 18 18 20 25 20 15 15 24 15 19
2008 30 19 18 28 20 25 22 30 30 20 17 28 20 28 18 24
2014 30 19 12 28 15 28 27 30 30 20 17 28 20 28 13 23
0
5
10
15
20
25
30
35
Wo
rkin
g h
ou
rs p
er
week
Average work duration per week 2001 / 2008 / 2014

21
Gender aspects Traditionally women constitute the major part of the workforce in the sector. Indeed, they represent on average 72% of the total number of employees. This is not only due to the nature of the activities (traditionally cleaning is considered as being a “women’ work” in society), but also to the general characteristic of employment that shows that part-time positions are predominantly occupied by women. Compared to 2012, the EU average of female employment decreased by 1%. At national level, although most countries maintained the same level, some interesting developments can be reported:
No updated data available for Cyprus, the Czech Republic, Hungary, Poland and Portugal
In most of the countries, only small changes could be registered between 2012 and 2014. The only increases were registered in France (+ 7%) and Austria (+2%) where the proportion of women grew. On the other hand, decreases could be registered in Germany (-5%), the UK (-4%), Spain (-2%) as well as Luxembourg and Slovenia (both -1%). Austria (89%), followed by the Czech Republic (85%), Luxembourg and Slovenia (both 80%) are by far the countries with the highest rate of women in the cleaning sector, while Belgium (57%), the UK (57%), Norway (60%) and Denmark (64%) on the other hand, show to be between 15% and 8% below the European average. Finally on a larger time scale (between 2006 and 2014), it is interesting to note that the average proportion of women in the sector is constantly decreasing since 2006: from 77% (in 2006) to 75% (in 2008), to 74% (in 2010), to 73% (in 2012) and finally to 72% (in 2014). Therefore, it can be concluded that over the last 8 years the proportion of women in the industry is constantly decreasing (although women still constitute the large majority of the workforce) and male employment is slightly increasing.
89%
57%
66%
61%
85%
75%
64%
77% 74% 75%
65%
70%
80%
70%
60%
80% 80% 78%
80%
57%
72%
A B CH CY CZ D DK ES F FI HU I L NL NO PL PT SE SI UK EU
Proportion of women in the industry 2014

22
No updated data available for Cyprus, the Czech Republic, Hungary, Poland and Portugal
Ethnic minorities Another characteristic of employment in the cleaning industry is a high proportion of workers from ethnic minorities or migrant workers. The table hereafter shows an estimation of their proportion in the workforce. However, it has to be cautiously interpreted insofar as, in most countries, it is either difficult or illegal to collect data relating to ethnic origins of people (with exception for the nationality).
No updated data available for Cyprus, the Czech Republic, Poland and Portugal
% of immigrant employees
Austria 65
Belgium 57
Czech Republic 24
Denmark* 45
Finland 11
France 29
Germany 35
Italy 15
Luxembourg* 96
the Netherlands* 49
Norway 60
Poland 1
Portugal 40
Spain 17
Sweden 49
Switzerland* 60
UK 24
EU 40
A B CH CY CZ D DK ES F FI HU I L NL NO PL PT SE SI UK
2010 88% 59% 75% 85% 80% 64% 79% 67% 75% 65% 70% 84% 72% 60% 80% 80% 72% 98% 59%
2012 87% 57% 66% 85% 80% 64% 79% 67% 75% 65% 70% 81% 70% 60% 80% 80% 78% 81% 61%
2014 89% 57% 66% 61% 85% 75% 64% 77% 74% 75% 65% 70% 80% 70% 60% 80% 80% 78% 80% 57%
0%
10%
20%
30%
40%
50%
60%
70%
80%
90%
100%
Proportion of women in the industry Years 2010 - 2012 - 2014

23
* The average increase from 32% in 2012 to 40% in 2014 is mainly due to the fact that four countries have been added to this figure for the first time: Denmark, Luxembourg, the Netherlands and Switzerland where the percentage of migrants is higher than 40%. In the remaining 13 countries, there have only been small changes compared to 2012, except for the UK. While in Belgium and Spain there has been a decrease of respectively 2%, in Finland and Sweden an increase of 2% and 3% could be registered. The important increase of migrants in the UK (+8%) can be mainly explained by an actualised data collection between 2012 and 2014 and by an underestimation of the previous figure. However, this figure should be also taken cautiously and the next survey will hopefully give a clearer picture. Structure of the workforce Professional categories vary greatly in the diverse member states. In most cases, they result from complex classification systems defined by collective agreements. For the sake of simplification, the study focuses on four categories: “blue-collar” (operational cleaning staff), technical staff, administrative employees as well as managers and executives.
No updated data available for Cyprus, the Czech Republic, Hungary, Poland and Portugal
The biggest part of the workforce is, by far, constituted of cleaners operating at clients’ premises. These figures have remained quite stable over the years, around 88-89%. It is also in the “blue collar” category that the proportion of part-time work is by far, the most important. Another interesting feature is the proportion of women in each category. Also here, women represent 77% of workers, 62% of administrative and commercial staff and 35% of technical staff. With more than 25% of female executives, the cleaning industry outperforms most other sectors in terms of equal opportunity employment.
AB
CHD
DKES
FFI
IL
NLNOSESI
UKEU
A B CH D DK ES F FI I L NL NO SE SI UK EU
Executives 1 0 5 1 2 1 1 1 1 1 4 1 5 2 5 2
Adm. 6 3 4 3 13 2 2 4 2 1 4 2 4 3 6 4
Technicals 4 2 1 6 13 6 6 4 4 2 5 9 5 5 1 5
Blue Collars 89 95 90 90 72 91 91 91 93 96 87 88 86 90 88 89
Structure of the workforce 2014

24
AUSTRIA
ISS SIMACEK DUSSMAN SODEXO MASCHINENRING ÔWD ATTENSAM DIW REIWAG
BELGIUM
ISS LAURENTY GOM IRIS CLEANING EUROCLEAN CLEANING MASTERS VICTOR PEETERS OIW CARE ACTIVA SHANKS
CZECH REPUBLIC (2010)
ISS ČSA JANA / TFN S.R.O. RPM CDV KAF FACILITY GSUS OLMAN SAJ SIMACEK FACILITY
DENMARK
ISS FACILITY SERVICES FORENEDE SERVICES COMPASS GROUP Danmark ELITE MILJO ALLIANCE PLUS
FINLAND
ISS PALVEUT SOL PALVELUT LASSILA & TIKANOJA OYJ RTK PALVELU N-CLEAN COOR SERVICE MGMT LP OY
COOR SERVICE MGMT
OVENIA OY SODEXO OY KIINTEISTÔHUOLTO JURVELIN
FRANCE
ONET GROUP SAMSIC ATALIAN GSF GROUP ISS GROUP ELIOR SERVICES DERICHEBOURG PROPRETE
ISOR – COFIGOR CHALLANCIN OMS
GERMANY
DUSSMANN WISAG SERVICE PIEPENBROCK GEGENBAUER KOTTER SERVICES ISS FACILITY SERVICES
DORFNER GROUP DR. SASSE AG HECTAS FACILITIES SERVICES
GEPE GEBAÛDEDIENSTE PETERHOFF
HUNGARY (2010) DUSSMANN JÁNOSIK ÉSTÁRSA PROFI KONFORT B+N REFERENCIA FUTURE FM PARTNER GROUP PQS ISS ATALIAN RIC
THE NETHERLANDS
HAGO NEDERLAND (VEBEGO)
CSU ISS ASITO GOM (FACILICOM) EW FACILITY SERVICE DOLMANS GROEP SCHOONGROEP NLD HECTAS SUCCES
NORWAY (2014)
ISS ELITE TOMA ABSOLUTIONS VIBE REINGJERINGSERVICE ROYAL RENHOLD ASC OSTLANDSKE RENGJORING MITIE NORGE REN PLUSS ACCEPT SERVICEPARTNER
POLAND (2005)
IMPEL ISS ROKA KAROR POLUDNIE ECOLAB JOHNSONDIVERSEY NIRO KARCHER POLITA
PORTUGAL (2005)
ISS IBERLIM SAFIRA SERVICES VADECA SERVIÇOS MULTIPESSOAL NOVA SERVIÇOS LIMPOTÉCNICA SERVILIMPE SERLIMA CLEAN TOMARLIMPE
SLOVENIA
ISS FACILITY SERVICES AKTIVA ČIŠČENJE CELOVITE STORITVE MIV SERVIS AFICO POSLOVNE STORITVE
CLEANING DRUZBA EES SISTEME D.O.O LOMBAR - STORITVE D.O.O MODRI VAL VALINA, DRUZBA ZA VZDR
SPAIN
CLECE ISS EULEN ACCIONA FERROVIAL SERVICIOS
ILUNION FCC VALORIZA INGESAN LIMPISA
SWEDEN
ISS FACILITY SERVICES
COOR SERVICE MGMT SODEXO COMPASS GROUP ALLIANCEPLUS FORENADE SERVICE SORMLANDS LANDSTINGSSERVICE INSPIRA NCA FACILITY SERVICES BOHUS STÂD PATRIC SVENSSOR
SWITZERLAND ISS SCHWEIZ
VEBEGO AG HONEGGER AG ENZLER REINIGUNGEN AG GALLO AG SAMPFLI AG
DOSIM SA GAMMARENAX AG ROHR AG REINIGUNGEN FARO-REINIGUNGEN AG
ANNEX: MARKET LEADERS IN THE YEAR 2014
(As indicated by the national associations)

25
UNITED KINGDOM INTERSERVE PLC WORLDWIDE
OCS GROUP UK MITIE RENTOKIL INITIAL EMPRISE SERVICES PLC INTEGRATED CLEANING MGMT
TC FACILITIES MANAGEMENT LTS
WETTON CLEANING SERVICES
AXIS CLEANING & SUPPORT SERVICES PRINCIPAL CLEANING LTD ISS UK