an empirical analysis of a dominant firm’s market power
TRANSCRIPT

An Empirical Analysis of a Dominant Firm’s Market Power in a Restructured Electricity Market,A Case Study of Colorado
by
Al Sweetser
Ph.D. candidate
Division of Economics and Business (Operations Research)
Colorado School of Mines
April 1, 1998
The author would appreciate any comments and suggestions on this work. Please forward themvia email to [email protected]

1
Overview of the Study and Its Findings
Many states in the U.S. are currently considering, or have already decided upon, plans to
implement some form of competition in the provision of electricity. “Electric restructuring” is a
term commonly used in reference to these efforts to create a competitive market for the
generation of electricity, while the transmission and distribution of electricity remain regulated
monopolies. In general, state restructuring plans are designed to offer customers a choice
regarding the source of their electricity, stimulate the marketing of innovative products, and
reduce the price of electricity for consumers. For most consumers, a key issue is price. Whether
restructuring plans will result in lower generation prices depends, in large part, on how quickly
effective competition develops among firms that sell electricity in the restructured market.
Economic theory suggests that effective competition will compel generation firms to price their
output at the marginal cost of generation.1
When effective competition doesn’t exist, a firm or group of firms has market power and
can profitably set price above marginal cost. The existence of excessive market power would
significantly erode the economic benefits of electric restructuring. Essentially, the degree of
market power firms can exercise reflects whether electric restructuring has produced truly
competitive markets or competition in name only.
This analysis focuses on horizontal market power, as opposed to vertical market power.
Horizontal market power accrues to firms that control a large market share. Vertical market
power, in contrast, comes from economies of scope of which a vertically integrated company can
take advantage. One means of mitigating vertical market power is through functional
1 Marginal cost includes all variable costs associated with power generation, such as fuel costs and variableoperations and maintenance (O & M) costs. “Marginal” is used because, at any hour, the plant with the highestvariable costs supplying power to a particular market will set the price of generation.

2
unbundling, where a formerly integrated firm separates its generation, transmission, and
distribution operations. Another means is the creation of an Independent System Operator, who
ensures that all firms have fair access to the transmission grid and dispatches the region’s
generation in a non-discriminatory manner.
Defining the potential for horizontal market power in the generation of electricity is a
complex task. There are different types of generation, and each type has unique operating
constraints. The characteristics of the transmission grid for a particular region affect the markets
that firms may enter. The relative location of demand, generation, and transmission paths create
bottlenecks on the grid that can prevent firms from entering certain markets.
A number of studies have attempted to quantify the potential for market power in places
that have been in the forefront of electric restructuring, such as the United Kingdom and
California. These studies analyzed a restructured market where a few large firms might have the
ability to exercise market power (Newbery, 1995, and Borenstein and Bushnell, 1997 are
examples). However, many states have one large firm that currently provides electric service to
most of its customers. In fact, there are thirty-two states where one firm currently owns more
than 40% of the generation capacity. In twenty of these states, one firm owns more than 50% of
the generation capacity.2 It seems intuitively obvious that market power would be a greater
concern where one firm controls most of the existing generation, yet this issue has not been
extensively analyzed.
This paper develops a measure of the ability of a dominant firm to exercise market power
in a restructured generation market and applies that measure to a particular state considering
2 The 32 states are Alabama, 57%, Arizona, 42%, Arkansas, 79%, Colorado, 51%, Connecticut, 40%, Delaware,90%, Florida, 43%, Georgia, 85%, Hawaii, 72%, Idaho, 48%, Illinois, 67%, Maine, 57%, Maryland, 49%, Michigan,48%, Minnesota, 71%, Missouri, 46%, Montana, 60%, Nebraska, 47%, New Hampshire, 46%, New Jersey, 74%,New Mexico, 41%, North Carolina, 54%, Oklahoma, 47%, Oregon, 66%, Rhode Island, 96%, South Carolina, 44%,

3
restructuring. It is a “short-run” analysis, in that it attempts to measure the amount of market
power that would exist immediately after restructuring is implemented, given the existing firms,
their generation, and the existing transmission capacity. Economic theory suggests that effective
competition will prevail in the “long-run.” However, it is difficult to determine when exactly the
“long run” might arrive. The United Kingdom restructured its electricity industry in 1991 and,
despite almost yearly re-intervention by government agencies to increase competition, a
significant degree of market power is still exercised by the two largest generation firms
(Newbery and Pollitt 1997, 2).
The intent of this analysis is not to predict how a dominant firm might behave in a
restructured market. The behavior of these firms will be the result of a number of decisions the
firm’s executives make in developing the firm’s overall business strategy. Rather, the goal is to
provide state policy makers an example of how to measure market power that considers the
many nuances pertinent to generation markets, and a means to compare policy options for
mitigating market power.
Any detailed analysis of market power must consider the specific characteristics of a
region’s demand for electricity, transmission network, and generation. In this analysis, Colorado
serves as a case study. It is the author’s hope that this study will provide insights and a
methodology appropriate for other states faced with a similar market structure.
Public Service Company of Colorado (PSCo) owns 75% of the generation in eastern
Colorado, where most of the region’s population, and, therefore, electricity demand, is
concentrated. Transmission presents significant constraints into this “load pocket.” Furthermore,
under the restructuring plans that have been introduced before the legislature, the state’s Rural
South Dakota, 58%, Tennessee, 97%, Utah, 53%, Vermont, 50%, Virginia, 83%, Wyoming, 66% (EIA 1997a,Table 20)

4
Electrical Cooperatives (RECs) and municipal power companies would have the choice of
whether to participate in the competitive retail electric market. Most RECs and municipals would
probably choose to remain monopolies in their current service territories. Competition under
electric restructuring would take place only in the service territories of the state’s two investor-
owned utilities, PSCo and WestPlains Energy.
The analysis focuses on market power PSCo could exercise in eastern Colorado during
2002-2005. The analysis initially uses a simulation model to compute the market outcome that
would occur if perfect competition existed. Then, PSCo’s ability to exercise market power is
analyzed. To summarize, the model assumes that when there is insufficient uncommitted fringe
generation at a given level of demand to mitigate PSCo’s market power, then PSCo can apply a
profit-maximizing markup over its marginal cost. The portion of the year over which the markup
can be applied and the average amount of this markup serve as measures of market power.
The results of the analysis show that, given current and currently forecast market
conditions, PSCo has the ability to set prices above marginal cost up to 93% of the year during
2002-2005. The price elasticity of demand for Colorado’s electricity consumers, which
represents their ability to reduce their demand in response to a price increase, greatly affects the
amount of the markup PSCo could apply. Since price elasticity of demand varies by customer
class, if PSCo can segregate the market, there is potential for PSCo to charge different rates to
different customer classes (price discriminate).
The study investigates three scenarios under which PSCo’s market power might be
mitigated. Relaxing transmission constraints into eastern Colorado has almost no effect on
PSCo’s market power, as long as entry over the grid is restricted to firms within the Rocky
Mountain Power Area (RMPA, which includes all of Colorado and Wyoming east of the
5
Continental Divide). The entry of 1,000 MW of fringe generation into the restructured eastern
Colorado market, either over the grid or through the construction of new generation in eastern
Colorado, reduces the amount of the year over which a markup could be applied from the base
case estimate of 93% to 72%. Divestiture of generation resources appears to affect PSCo’s
market power the most. If PSCo agrees to divest 50% of its generation, markups can be applied
only 37% of the year.
This study represents only a first effort toward a potentially more detailed analysis. As
other policy options are developed that might mitigate PSCo’s market power, these can each be
analyzed in turn. Further sensitivity analysis can be conducted over the alternative scenarios (a
range of values for levels of entry and divestiture, for instance). Additionally, the current model
is limited to a detailed analysis of only the RMPA. Entry from other regions (the Northwest
Power Pool or Arizona-New Mexico) is modeled only in an aggregate manner. Existing contracts
for power exchanges between regions are modeled, and the potential entry of up to 1,000 MW of
generation from the NWPP or Arizona-New Mexico are part of the study. However, the dynamic
interactions that might take place between regions under electric restructuring are beyond the
scope of this analysis. A multi-area model of the entire western grid might reveal additional
insights.
These results should not be interpreted as a condemnation of electric restructuring. The
study merely points out that in states where a regulated electric utility controls a large share of
generation capacity, state policy makers are presented with a special challenge in creating
effective competition. Policy makers have options to mitigate market power, including
divestiture of generation, measures to encourage the entry of new firms, the imposition of price
caps, and a continued role for regulators as a watchdog to protect consumers.

6
The Herfindahl-Hirschmann Index
The most common measure of market power is the Herfindahl-Hirschmann Index (HHI),
which is a standard used by the U.S. Department of Justice in antitrust litigation (Werden 1996,
20). The HHI is the sum of the squared market shares for each firm competing in a given market.
n,1, firms = i where) (1
2∑=
=n
iisharemarketHHI K (equation 1)
In a market with 100 firms, where each firm has 1% of the market, the HHI =
.100(1)100
1i
2 =∑=
In contrast, a monopoly market where one firm controls the entire market would
have an HHI = .000,101002 = A moderately competitive market with five equally sized firms
would have an HHI = 000,2205
1
2 =∑=i
. While the HHI is not a direct measure of a firm’s ability
to exercise market power, markets with a high HHI are more likely to experience problems with
market power.
In his testimony before the Federal Energy Regulatory Commission (FERC), Paul
Joskow from MIT (1995) recommends that a market power analysis begin by defining the
relevant market, identifying suppliers and their associated capacity, and then use the HHI as a
screen for market power. If the HHI for a market were below some threshold level, such as
2,500, the market would be presumed to be competitive. Persuasive evidence of market power
abuse would be required to merit further investigation once a market met this standard (Joskow
1995, 29).
The HHI may have value as a screening tool for measuring market power in generation
markets, but it also has shortcomings. The dimensions of an electricity market change
considerably as a function of transmission constraints. Congestion on the transmission grid can

7
isolate markets. Once these constraints are relaxed, firms over a wide area may compete, limited
only by their increased costs due to transmission charges and power losses. Thus, the HHI is a
static measure of a very dynamic situation.
Furthermore, the HHI measures only one of aspect of market power. The ability of firms
to charge prices in excess of marginal cost (MC) is also related to the price elasticity of customer
demand (|ε|). The price elasticity of demand is a measure of a consumer’s ability to reduce
consumption of a particular product in response to a price increase; it is the percent a
representative consumer would reduce demand for a good when faced with a 1% increase in
price.
price %
demandedquantity %
∆∆
=ε (equation 2)
When the price elasticity of demand is inelastic, as it is in generation markets, |ε| < 1.
This means that when a generation firm increases its price by 1%, consumers reduce demand, but
the reduction is less than 1%. Therefore, the firm can increase its total revenue by increasing
price.
In a market with “n” identical firms, it can be shown that the percent markup of price
over marginal cost is as shown.
εεHHI
nP
MCP *001.1=
•=
− (equation 3)
This equation highlights the fact that price responsive demand plays an important role in an
analysis of market power (Borenstein, Bushnell, Kahn, and Stoft 1996, 11). In a market with a
demand elasticity of |0.2| and 10 equally sized firms, equation 3 indicates that market price
would be twice marginal cost. As demand elasticity increases to |1.0|, firms realize little
additional profit if they increase price.

8
There is another problem related to defining the relevant market that the HHI fails to
consider. The HHI calculates market shares simply on the basis of generation ownership. For
fringe firms, it may be more appropriate to consider the quantity of excess generation they have
available once they’ve served their native customers. Colorado, like many states considering
restructuring, gives RECs and municipals the choice of whether to participate. If these firms do
not open their own service territories up to competition, restructuring plans usually prohibit them
from selling their excess generation in the competitive market. However, RECs, at least in
Colorado, own no generation. Tri-State Generation and Transmission, Inc., which is jointly
owned by RECs in Colorado, Wyoming, and Nebraska, supplies the RECs. Most of Colorado’s
municipal power companies, likewise, own little or no generation. They receive their power from
the Western Area Power Authority (WAPA), a federal power agency. It seems doubtful that
Colorado could impose provisions of its electric restructuring plan on extra-jurisdictional (out-
of-state) corporations, or a federal power agency to prohibit them from selling their excess
generation in a restructured market. Similarly, firms owning generation in neighboring states that
have not restructured electricity will continue to serve their native customers. However, it seems
reasonable to assume that these out-of-state firms would sell any excess power they can produce,
once they’ve served their native customers. These firms could sell generation directly to
customers in the restructured market or the generation could be sold wholesale to power
marketers, who resell it to customers in the restructured market. Even Colorado municipal power
companies that own generation (integrated firms) might be able to sell excess power to interstate
power marketers who could resell that power in Colorado’s restructured market.
For these reasons, provisions of any restructuring plan that attempt to exclude generation
firms from the restructured market might be difficult to enforce. Given the hurdles in the way of

9
creating effective competition in generation markets, it might also seem to be a questionable
policy for a state to aggressively pursue measures that limit competition. For the purposes of this
analysis, the quantity of generation significant for mitigating PSCo’s market power from any
generation and transmission cooperative, integrated municipal power company, or federal power
agency is that generation which is uncommitted once these firms serve their native load.
The HHI for the eastern Colorado generation market is approximately 5,000 when
transmission is congested, which reflects PSCo’s ownership or control through contracts of 75%
of the eastern Colorado generation. If the relevant market is the entire RMPA, the HHI is 3,000.
In either case, the HHI suggests a strong possibility that the market power PSCo could exercise
in a restructured Colorado electricity market might be a concern.
Conceptual Framework
This analysis will develop a more detailed measure of market power that provides state
policy makers a better picture of how a dominant firm might exercise market power and a means
to compare policy measures that might be employed to mitigate market power. The general
framework of the measure presumes that there is an hourly generation spot market, where all
firms that want to sell power bid the price and quantity of their generation (the supply curve)
against consumer demand for that hour (the demand curve). The time period studied is 2002-
2005. This time period was selected because it is feasible to implement electric restructuring in
Colorado by 2002, and the four year time span provides an opportunity to analyze the effects of
load growth, contract expiration, and planned construction of new generation.
If the market is competitive, firms and consumers will be “price-takers.” Consumer
demand reflects the marginal price consumers are willing to pay for a quantity of goods sold in

10
the market place (figure 1). Market supply, in
generation markets, can be thought of as a
“step” function. Each step represents the
variable production cost (marginal cost) and
generation capacity at a particular plant. The
plant at the competitive price-quantity
equilibrium is just covering its variable costs.
Plants with lower variable costs are earning
revenue in excess of their variable costs, which
ConsumerDemand
Supply
Pc
QuantityQc
Figure 1. Competitive market equilibrium
pays some portion of their fixed costs and provides a return on capital invested. Market price
reaches equilibrium at the intersection of consumer demand and generation supply (Pc and Qc).
Competitive prices are expected to be lower than prices under regulation because they reflect
only the marginal (variable) costs of supplying a product at a given level of demand. Regulated
prices, in contrast, are based on average total costs. Regulated prices give utilities an opportunity
to recover all of their fixed and variable costs, as well as earn a return on investment for the
firm’s shareholders.
When a dominant firm exercises market power, it acts as a “price maker.” Dominant
firms control such a large share of a market’s generation that they are able to set the market price
at a level above marginal cost. In addition to controlling a large share of the market, two other
conditions help the dominant firm exercise market power, price elasticity of demand that is
“inelastic” and inelastic supply of the fringe firms. When demand is “inelastic,” consumers
cannot readily reduce their quantity demanded in response to a price increase3. This is a
3 The elasticity of demand (ε) for electricity is typically modeled as being between |0.1| (very inelastic) and |0.9|(less inelastic).

11
particular problem in electricity markets. Given the current state of technology, most customers
cannot easily substitute another commodity for the electricity they need. Only the largest
customers can economically operate their own generation.
The other condition required for the dominant firm to exercise market power is that the
supply of smaller fringe firms is inelastic; there is a capacity constraint on fringe generation.
Fringe capacity constraints arise because transmission paths into an area are constrained and
because the fringe capacity that exists in a given area, once transmission constraints bind, has a
fixed upper bound on output. This problem is exacerbated in generation markets because of the
time required to construct new generation, which is twelve to twenty months by some estimates
(PSCo 1997, 3). Furthermore, in the RMPA, new generation construction will probably remain
limited for some time due to the excess generation already in the region. The Western Systems
Coordinating Council (WSCC) forecasts that the RMPA will maintain a generation reserve
margin in excess of 30% at least through 2005, which is well in excess of the 15% reserve
margin required for reliability (RDI 1997, Table R-1a). Firms with capital to invest in the
construction of new generation would probably be drawn first to other areas of the United States
that have lower reserve margins, where new plants would be required to run most of the year.
Economic theory provides an explanation of how a dominant firm exercises market
power to maximize profits. The dominant firm calculates the equilibrium that would occur under
perfect competition (figure 2). The overall market supply can be broken down into the dominant
firm’s own supply curve, and the supply of all of its competitors, the competitive fringe. This
model assumes that firms in the competitive fringe are price takers; they will accept whatever
price the dominant firm sets.4 The dominant firm subtracts the supply curve of the fringe firms
4 If any firms in the competitive fringe firms also attempted to exercise market power, price markups would be evenhigher.

12
from market demand to determine
residual demand. Residual demand is the
amount of demand “left over” when
fringe supply is exhausted at a particular
price and quantity. From the residual
demand curve, the dominant firm
calculates its marginal revenue curve.
Marginal revenue is the amount of
revenue the firm earns if it chooses to
produce an additional unit of output. The
intersection of the dominant firm’s
Pri
ceQMarket
Dominant firmSupply
ResidualDemand
MarginalRevenue
qDominant firm
PM
qfringe
MarketDemand
CompetitiveEquilibrium
Equilibriumwith Market
Power
MarketSupply
Quantity
MC
Figure 2. Dominant firm markup.
marginal revenue curve and supply curve determines the profit-maximizing quantity that the
dominant firm will supply to the market (qDominant firm). Tracing up from this quantity, the residual
demand curve, at qDominant firm, determines the optimal market price for the dominant firm (PM). At
this price, the overall market demand curve determines how much electricity consumers will
purchase (QMarket). The difference between the market quantity demanded (QMarket) and the
quantity that the dominant firm will supply (qDominant firm) will be made up by the competitive
fringe (qfringe).
Therefore, the dominant firm uses its market power to restrict the quantity it supplies to
the marketplace and increase price above marginal cost. The profit maximizing strategy for the
dominant firm can be calculated mathematically. If the dominant firm is maximizing profits, it
calculates the difference between price and marginal cost at a given level of demand as shown.
Market
firmDominant firmDominant
Q
q1=
P
MC-P markup Price •=
ε (equation 4)

13
Equation 4 shows that the markup of market price over marginal cost is affected by two factors.
The first is the inverse elasticity of demand, ε1
suggesting that, if the dominant firm is able to
price discriminate, different customer classes might face different price markups. The second
factor is the dominant firm’s market share, Q
q firmDominant . The larger the market share of the
dominant firm, the greater the markup of price over marginal cost.
The percent of a year that a dominant firm can apply a price markup and the average
price markup that the dominant firm is able to impose provide simple, aggregate measures of the
market power the dominant firm can exercise. Calculation of the average markups is shown.
)markup Price(t markup Averagei
ii∑ •= (equation 5)
where ti is the percent of a year that a particular markup can be applied and 1)(ti
i =∑ for the
year in question. When there is no price markup, prices are competitive. The extent that different
restructuring options can mitigate market power can be compared on the basis of the percent of
the year price markups can be applied and the average price markup over marginal cost that these
options produce.
In developing restructuring options, it might be appropriate to ask whether it is necessary
that prices always reflect marginal costs. There are, in fact, some good reasons why prices
sometimes diverge from marginal generation costs. For a certain portion of the year,
approximately 20% in Colorado, peaking plants are required to operate to meet power demands.
These are generally small plants that have lower capital costs for construction, but higher
operating costs. The benefit of these plants is that they can be quickly brought on-line to satisfy
short-term, peak-power demand, typically during cold periods of the winter and hot periods of

14
the summer. When these plants operate, they must recover their fixed costs, provide a return to
investors, and cover their operating costs. Unless all costs are recovered during the brief times
when these plants operate, peaking plants are not economic investments. The benefit peaking
plants provide, as part of the overall generation portfolio, would be lost if generation prices were
always set at marginal cost.
Furthermore, it might be appropriate, from an overall societal perspective, that consumers
have some motivation to reduce their energy demand during peak periods. Higher electricity
prices during peak periods could provide that motivation. This could reduce the need for
additional peaking plants, and permit society’s resources to be invested elsewhere. This study
will not attempt to define the portion of the year that it might be appropriate for prices to diverge
from marginal generation costs, because this a question for state policy makers.
While the calculated price markups represent the profit-maximizing strategy for a
dominant firm, it is doubtful that these markups would really appear in the marketplace. A profit-
maximizing strategy would result in such high prices that it would invite an unwanted backlash
from consumers and state policy makers. The ill will that such a strategy would produce between
the firm and its customers could strengthen the presence of the dominant firm’s competitors.
State policy makers might implement measures to mitigate the firm’s market power. A profit-
maximizing strategy would probably not be in the firm’s best interest in the long run. Rather, the
calculation of these markups is a tool for policy makers that provides them information on what
level of competition exists in restructured generation markets.

15
The Colorado Electricity Market
The three most significant factors that affect a generation firm’s ability to exercise market
power in a particular area are ownership of generation, the location and concentration of demand,
and the capacity and number of transmission paths. Generation factors important to Colorado’s
market have already been mentioned; PSCo controls 75% of eastern Colorado’s generation and
45% of RMPA generation. Much of PSCo’s generation is coal-fired, which, because it is close to
coal fields, is very inexpensive. The other major source of generation is the Western Area Power
Administration’s hydroelectric dams. Together, these assets provide Colorado’s electric
customers rates below the national average.5 Because of its low cost generation and high reserve
margins, the RMPA is a net exporter of its low cost power to the rest of the Western
Interconnect.
Demand for electricity is closely correlated to population density. In Colorado,
population is concentrated in eastern Colorado along the “Front Range” of the Rocky Mountains
where the cities of Greeley, Fort Collins, Boulder, Denver, Colorado Springs, and Pueblo are
located. 73% of the RMPA’s electrical demand is in eastern Colorado. However, there is a not
enough generation physically located in eastern Colorado to service demand the entire year. This
shortfall of generation must be made up through imports from western Colorado and Wyoming
into eastern Colorado to meet demand.
Limited transmission paths into eastern Colorado also play a major role in an analysis of
market power in the region. Colorado is at the eastern edge of the Western Interconnect (figure
3). There are no transmission paths directly linking Colorado to the Eastern Interconnect.
Limited DC interties to the Eastern Interconnect exist in Nebraska at Sidney and Stegall, but
5In 1996, Colorado’s rates average for all retail customers averaged 6.1¢/kWh vs. a U.S. average of 6.9¢/kWh (EIA1996a, 36).
16
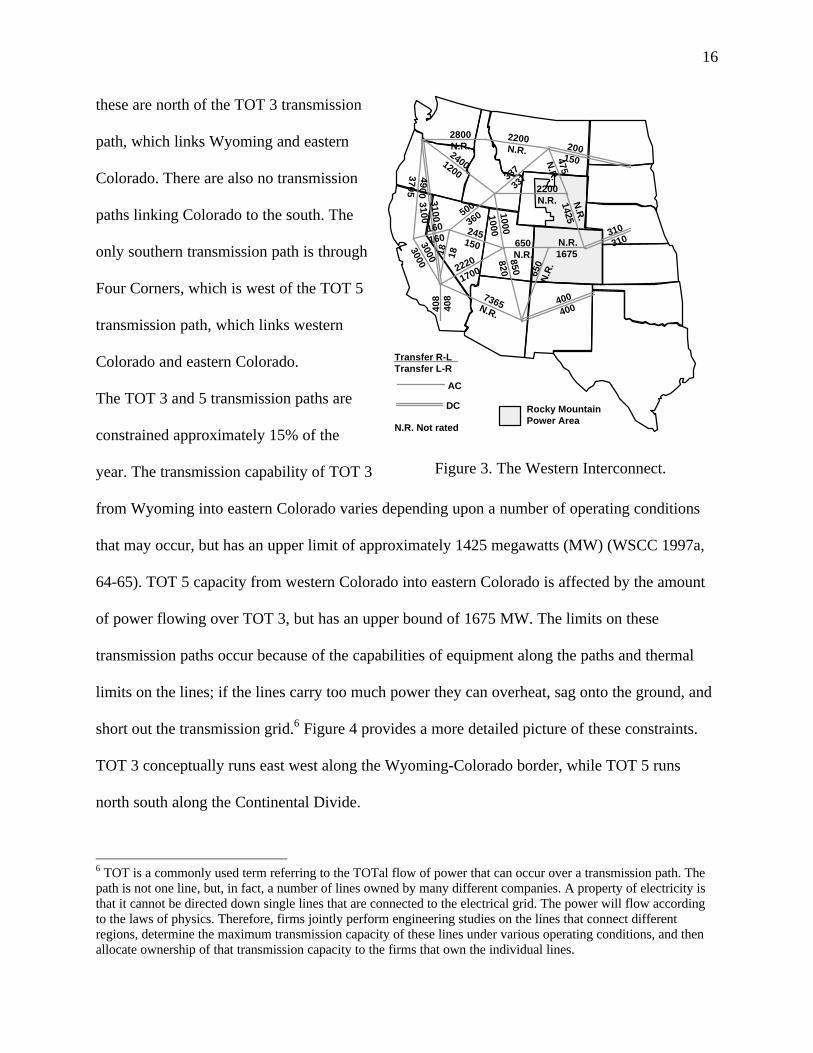
these are north of the TOT 3 transmission
path, which links Wyoming and eastern
Colorado. There are also no transmission
paths linking Colorado to the south. The
only southern transmission path is through
Four Corners, which is west of the TOT 5
transmission path, which links western
Colorado and eastern Colorado.
The TOT 3 and 5 transmission paths are
constrained approximately 15% of the
year. The transmission capability of TOT 3
N.R
.
1425
Transfer R-LTransfer L-R
310
310
200150
400
400
N.R.1675
650
N.R
.
2200N.R.
337
337
2200N.R.
850820
650N.R.
10001000
500
360
245150
2220
1700
7365N.R.
18 18
31003100
49003705
24001200
2800N.R.
408
408
3000
3000
160160
AC
DC
N.R. Not rated
475
N.R
.
Rocky MountainPower Area
Figure 3. The Western Interconnect.
from Wyoming into eastern Colorado varies depending upon a number of operating conditions
that may occur, but has an upper limit of approximately 1425 megawatts (MW) (WSCC 1997a,
64-65). TOT 5 capacity from western Colorado into eastern Colorado is affected by the amount
of power flowing over TOT 3, but has an upper bound of 1675 MW. The limits on these
transmission paths occur because of the capabilities of equipment along the paths and thermal
limits on the lines; if the lines carry too much power they can overheat, sag onto the ground, and
short out the transmission grid.6 Figure 4 provides a more detailed picture of these constraints.
TOT 3 conceptually runs east west along the Wyoming-Colorado border, while TOT 5 runs
north south along the Continental Divide.
6 TOT is a commonly used term referring to the TOTal flow of power that can occur over a transmission path. Thepath is not one line, but, in fact, a number of lines owned by many different companies. A property of electricity isthat it cannot be directed down single lines that are connected to the electrical grid. The power will flow accordingto the laws of physics. Therefore, firms jointly perform engineering studies on the lines that connect differentregions, determine the maximum transmission capacity of these lines under various operating conditions, and thenallocate ownership of that transmission capacity to the firms that own the individual lines.

17
Figure 4. RMPA transmission constraints.
The net effect of all of these factors is that the most likely region for PSCo to exercise
market power is eastern Colorado. PSCo’s share of the generation market in eastern Colorado is
quite large. The limited supply of fringe generation in eastern Colorado and the limitations on
transmission make existing supply very inelastic. If PSCo does exercise market power, fringe
firms have a limited ability to respond unless there is a large amount of new generation
constructed by fringe firms.
Methodology
The approach that will be used to analyze the potential for PSCo’s market power in a
restructured Colorado generation market has three steps. The first step is to estimate the market
outcome in eastern Colorado, western Colorado, and Wyoming with a utility production cost
model, Elfin, assuming that perfect competition exists. Elfin’s output is exported to a spreadsheet
model in the second step to determine when PSCo can exercise market power, calculate price

18
markups, and analyze power flows among the regions. Step 2 produces the base case scenario
(Scenario 1), which attempts to capture all of the factors of the current and currently forecasted
factors that affect the RMPA electricity market. The third step analyzes three alternative
scenarios (Scenarios 2-4) under which PSCo’s market power might be mitigated.
Step 1. The Elfin model is used to estimate a competitive equilibrium in the eastern
Colorado, western Colorado, and Wyoming markets, using only the generation native to each
region. Elfin is an electric utility financial and production cost model developed by the
Environmental Defense Fund (EDF). Numerous utilities, government agencies, and public
interest groups in the United States and internationally, have used this software over the past two
decades for policy analysis (EDF 1996, 1).
Interactions with regions outside the RMPA are incorporated by adjustments to demand
within the RMPA. Firm power contracts and exchanges between the RMPA and the Northwest
Power Pool (NWPP), Mid-America Power Pool (MAPP), and Southwest Power Pool (SPP), as
projected by the WSCC, are treated as part of Wyoming’s demand. Firm power contracts and
exchanges between the RMPA and the Arizona-New Mexico and California-Nevada portions of
the WSCC, as projected by the WSCC, are considered part of western Colorado’s demand.
To calculate the competitive market equilibrium, Elfin requires an hourly load curve,
representing the hour-by-hour demand for electricity, for each region. This data is obtained from
the 1996 FERC Form 714s (hourly load data) submitted by the six RMPA control centers: Black
Hills Power, WAPA, Platte River Power Authority, PSCo, Colorado Springs Municipal Utilities,
and WestPlains Energy. The hourly load from each control area is added together to get the
overall RMPA hourly load curve. Figure 5 reflects the load for each hour of 1996 from 1 AM,
January 1st through midnight on December 31st (8,784 periods, since 1996 is a leap year). Elfin

19
then scales demand for each year of the
simulation using two parameters, net
energy demand in gigawatt hours (GWh)
and peak hourly demand (MW).
Forecasts for these values were obtained
from the WSCC (1997b). Elfin also
requires detailed data on each generation
resource. This data includes generation
type (baseload, load-following,
3,000
4,000
5,000
6,000
7,000
8,000
9,000
0 2,000 4,000 6,000 8,000
Hour
Lo
ad
Figure 5. 1996 RMPA hourly load curve.
hydroelectric, pumped storage), capacity, number of units, heat rate, fixed and variable costs,
outage rates, and other factors. Contracts are modeled by assigning a share of a particular
generation resource to a company, or as a separate generation resource. Some of these
parameters are varied for particular months of the year, for instance, to account for the monthly
variations in hydroelectric capacity. Other parameters are varied by year, to account for such
factors as expansions in capacity, retirements, and contract expiration. Data for each generator is
obtained from utility FERC Form 1 submissions, Integrated Resource Plans, and a commercially
available database from Resource Data International (RDI).
Elfin then calculates the optimal (least cost) generation set for each area on an hour-by-
hour basis. It dispatches generation to service demand in order of increasing cost, subject to the
engineering constraints unique to each type of generation. Using Elfin to model this process
incorporates many of the nuances that affect the dispatch of generation such as reserve
requirements, outage rates, limitations on the use of hydroelectric generation, and the load-
following constraints of baseload plants.

20
Step 2. Elfin provides several elements of data from the competitive equilibrium that are
key to Step 2: the economic dispatch order, the time that each individual plant is the marginal
producer, and an estimate of market prices that would exist under perfect competition. In Step 2,
this data is exported to a spreadsheet to determine when PSCo can exercise market power,
calculate price markups, and analyze power flows among the regions. This analysis is performed
over what is commonly called a load
duration curve (figure 6). In a load
duration curve, hourly load data is sorted
from largest load (peak demand) to
smallest load over a given period of time,
in this case, a year. The economic
dispatch order tells how to array plants
against the load duration curve (figure 7).
The time marginal for each plant tells
what portion of a year each plant is
marginal along the load duration curve.
During the time each plant is marginal,
PSCo’s market share is calculated. To
incorporate the effect of competition
PSCo would experience if it attempted to
exert market power, the uncommitted
RMPA Load Duration Curve
3,000
4,000
5,000
6,000
7,000
8,000
9,000
0 1,000 2,000 3,000 4,000 5,000 6,000 7,000 8,000
Peak Hour Min
Lo
ad
Figure 6. RMPA load duration curve.
Plant 9 (PSCo)Plant 8 (PSCo)Plant 7 (fringe)Plant 6 (PSCo)Plant 5 (PSCo)Plant 4 (fringe)Plant 3 (PSCo)Plant 2 (fringe)Plant 1 (PSCo)
Time plant 6 is marginal
Figure 7. Use of economic dispatch order and timemarginal.
21
fringe generation (qf_E.Co) is also
identified at each point along the load
duration curve (figure 8).
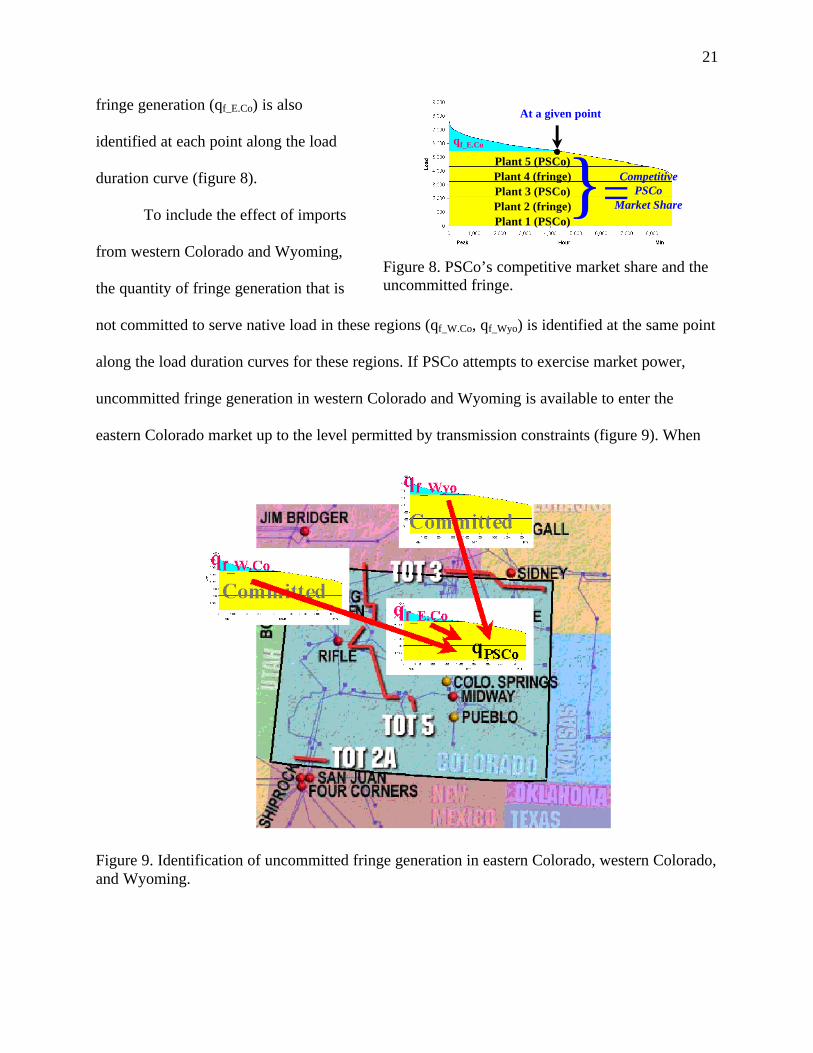
To include the effect of imports
from western Colorado and Wyoming,
the quantity of fringe generation that is
Plant 5 (PSCo)Plant 4 (fringe)Plant 3 (PSCo)Plant 2 (fringe)Plant 1 (PSCo)
CompetitivePSCo
Market Share
qf_E.Co
}=
At a given point
Figure 8. PSCo’s competitive market share and theuncommitted fringe.
not committed to serve native load in these regions (qf_W.Co, qf_Wyo) is identified at the same point
along the load duration curves for these regions. If PSCo attempts to exercise market power,
uncommitted fringe generation in western Colorado and Wyoming is available to enter the
eastern Colorado market up to the level permitted by transmission constraints (figure 9). When
Figure 9. Identification of uncommitted fringe generation in eastern Colorado, western Colorado,and Wyoming.

22
all uncommitted fringe generation is identified, PSCo’s market share if it attempted to exercise
market power is calculated as shown.
Q
qqqqShare Market Adj. PSCo
Market
f_Wyof_W.Cof_E.CoPSCo −−−= (equation 6)
In equation 6, qPSCo is the quantity PSCo would supply if the market were competitive.
The terms, qf_E.Co, qf_W.Co and qf_Wyo, are the quantities of uncommitted fringe generation in each
region. PSCo’s adjusted market share (equation 6, the quantity PSCo supplies when exercising
market power) can then be used in equation 4 to calculate PSCo’s markup over marginal cost.
These calculations are performed over the entire load duration curve.
The base case scenario (Scenario 1) attempts to capture all of the current and currently
forecasted factors that affect the RMPA electricity market. These factors include current and
planned generation, forecasted load growth, contracts, joint ownership agreements, transmission
constraints, and interactions with other regions. The significant assumptions related to this
scenario are shown.
1. Elasticity of demand is linear. Market outcomes are calculated for the
following elasticities: 0.9, 0.7, 0.4 and 0.1. These values were selected
because the same values were used in Borenstein and Bushell’s study (1997).
The EIA (1997, 24) uses a narrower range of elasticities from |0.15| to |0.5|.
2. Spinning reserve requirement: 7%.
3. Competition occurs in the service territories of Colorado’s IOUs: PSCo and
WestPlains Energy.
4. PSCo does not renew contracts for independent producers as they expire; after
contract expiration these plants become part of the competitive fringe.

23
5. Fringe generation serves its native load first; uncommitted fringe generation
competes for PSCo’s market share.
6. All fringe generation within the RMPA competes for PSCo’s market share
(5,000 MW, 2002-2005, of which 1,700-1,900 is physically located in eastern
Colorado-exact quantities vary by year).
7. Due to declining reserve margins in the rest of the WSCC, and competition in
other states with higher generation prices, no generation outside the RMPA
competes for PSCo’s market share.
8. The shape of the hourly load curve for eastern Colorado, western Colorado,
and Wyoming is the same.
Step 3. In this step, alternative scenarios are modeled to calculate the effect of various
conditions on PSCo’s market power. As these policies cause the parameters of the model to
change, Steps 1 and 2 are repeated under the new conditions so that the duration and amount of
price markups can again be estimated. The following scenarios are considered:
Scenario 2. Assume that transmission constraints (TOTs 3 and 5) do not affect the
flow of power within the RMPA. A detailed cost-benefit analysis of increasing
transmission to this level is beyond the scope of this study. The intent here is
merely to provide an estimate of how PSCo’s market power in eastern Colorado
might be affected when RMPA transmission constraints are relaxed.
Scenario 3. Assume that 1,000 MW of fringe generation enters the eastern
Colorado market, either over the transmission grid from beyond the boundaries of
the RMPA or through new generation construction in eastern Colorado. While

24
entry is not normally modeled in a short-run economic analysis, the intent of this
scenario is to explore the effect of entry by fringe firms on PSCo’s market power.
These plants are assumed to operate with the cost characteristics of PSCo’s Fort
St. Vrain plant, a modern gas turbine facility.
Scenario 4. Assume that, as part of an agreement to implement electric
restructuring, PSCo agrees to voluntarily divest 50% of its generation. PSCo
might be motivated to do this in return for the opportunity to compete for
unregulated profits or to receive compensation for stranded investments, if they
exist. Divested plants are assumed to become part of the competitive fringe. This
implies that one company is unable to purchase all plants divested by PSCo. To
implement divestiture, this scenario assumes that PSCo sells a 50% interest in
each of its generation resources. While admittedly, this is not the approach that
would necessarily be implemented, calculating divestiture in this way avoids
complications that could arise if PSCo sold off only baseload generation, or
peaking generation, or particular plants that, because of their location on the grid,
were in a “must-run” status. The 50% level of divestiture was chosen because
California’s IOUs agreed to divest 50% of their fossil plants. Additionally, this
level of divestiture reduces PSCo’s share of eastern Colorado generation to
37.5%, which is close to Joskow’s (1995, 8) threshold of 35% market share,
where a dominant firm begins to exercise market power.
As part of each scenario, the effect of making the demand for generation more price
responsive is considered. PSCo’s markup at each of the price elasticities indicated is compared
(0.1, 0.4, 0.7, and 0.9). These calculations provide an indication of the effect of

25
improving demand elasticity. Possible policy measures to improve the price elasticity of demand
include encouraging the presence of load aggregators, or requirements that utilities provide
detailed, time-of-day price information on electric bills. Whether or not these measures would
actually increase demand elasticity is an empirical issue.
Overall, the methodology is, admittedly, somewhat clumsy in the way it calculates
PSCo’s market share when the firm exercises market power. The approach described requires
that the uncommitted capacity of the fringe be completely exhausted before PSCo is able to
apply a price markup. A mathematically more-precise calculation of the market share may reveal
that PSCo could maximize profits in eastern Colorado’s market by restricting its output
somewhat less, and, in doing so, permit the firm to exercise market power a greater portion of the
year. In general, though, PSCo’s market share is so large that, for most price elasticities of
demand, the methodology described does, in fact, maximize profits. The calculated markups are
so large that the market price is set at a level higher than any generation resource in the RMPA.
This strategy would also have an advantage for PSCo in that the quantity of generation PSCo
withholds from the eastern Colorado market could be sold elsewhere on the grid, either
wholesale or in other restructured markets, such as California, and these sales further enhance
PSCo’s profits. This methodology also presents a conservative measure of market power. If
PSCo were to restrict output somewhat less so it could exercise market power a greater portion
of the year, or if fringe firms, over time, learned that they could also restrict supply and act like
dominant firms, the problem of market power would only become worse.
A more serious problem of the methodology is the assumption that the overall load curve
for the RMPA is the same as the load curve for the areas within the RMPA (eastern Colorado,
western Colorado, and Wyoming). A correlation analysis was performed on the FERC Form

26
714s (hourly load data) for the six control areas of the RMPA to test this assumption. For the five
areas that included large urban centers in their load, the correlations were approximately 90%.
However, the WAPA control center’s correlation with the other five areas was approximately
40%, although the correlation was still positive. To analyze this problem further, the hourly load
curves for each control area were plotted and compared. All areas had a morning peak and an
evening peak. The major difference was that in the five areas that served urban centers, the
morning peak was sustained throughout the day and then demand reached a higher evening peak.
In WAPA’s control area, demand declined after the morning peak. Demand then ramped up
quickly for an evening peak was approximately the same as the morning peak.
The discrepancy in hourly load introduces some error into this model. A true multi-area
model that permits control centers to interact on an hourly basis may reveal additional insights
into the problem of market power. However, given the small portion of demand represented by
WAPA’s control area (approximately 20%), the fact that most of this generation is committed to
serve its native load, and the fact that load correlation for all regions is positive anyway, the
results of the analysis might not change greatly.
Findings and Analysis
Overall, the results of this model show that PSCo can exercise a large degree of market
power in a restructured Colorado electricity market. In the base case scenario, PSCo can apply a
markup over marginal cost greater than 93% of the year, each year from 2002 through 2005
(figure 10). The average markups customers would face are a function of the price elasticity of

27
0%100%
200%300%400%
500%600%700%
800%900%
02,0004,0006,0008,000Peak Hour Min
Mar
kup
|0.9| |0.7| |0.4| |0.1|
Figure 10. Markups PSCo can apply over marginal cost given a range of price elasticities ofdemand in 2002, base case scenario.
demand. Average markups for 2002 vary from 53% to 478% as the price elasticity of demand is
decreased from |0.9| to |0.1|. It would be unlikely that PSCo would actually apply the full markup
in any case. As mentioned earlier, price gouging of this magnitude would probably invite re-
regulation, encourage customers to seek other suppliers and reduce or shift load, and encourage
other firms to construct new generation in eastern Colorado. Rather, it is more likely that PSCo
would attempt to select a lower level of profits that satisfies its shareholders, does not incur the
wrath of Colorado consumers, and does not invite entry by new firms.
The results suggest that competition will not force prices to marginal cost for a significant
portion of the year. Studies that purport to calculate the economic benefits of electric
restructuring rely on price forecasts. These studies must consider the possibility that prices will
be above marginal cost and include some type of sensitivity analysis for price. Any ex ante
estimation of stranded costs also makes assumptions regarding prices. Currently, RDI (1997, SC-
2) and Moody’s Investor Services (McGraw-Hill Energy and Business Newsletters 1997, 14),

28
using models that assume prices under electric restructuring will be at marginal cost, predict that
PSCo has negative, or no stranded generation costs. If price, as this study suggests, exceeds
marginal cost, PSCo’s generation will be even more valuable than RDI and Moody’s currently
estimate.
Another result suggested by this model is that if a utility is able to segregate the market
by customer class, price markups could vary substantially among customer classes. Specifically,
customers with a |0.1| price elasticity of demand face a price markup nine times higher than
customers with a |0.9| price elasticity of demand. Restructuring legislation should carefully
consider the market institutions the plan implements. Policy makers should carefully design
market structures that treat each customer class fairly. A common pool that all firms and
customers bid into for short-term energy sales would be one option. The pool would set the price
for all customers, regardless of class. For long-term needs, large industrial customers have an
advantage over residential customers in negotiating deals because of the size of their loads.
Nevertheless, if the restructured market encourages the presence of load aggregators, who
represent many small customers, this might prove to be one effective means of leveling the
playing field.
In terms of mitigation strategies, relaxing transmission constraints within the RMPA
(Scenario 2) does not seem to affect the portion of the year over which PSCo can exercise a
markup, or the amount of markups that are applied. The reason why this occurs is that there is
simply not enough uncommitted fringe generation in western Colorado and Wyoming, during the
periods when PSCo can apply a price markup, to make the transmission constraints an issue. It
appears that the transmission constraints would become important only if firms beyond the
RMPA (in Arizona-New Mexico, or the Northwest Power Pool) attempted to compete with

29
PSCo in eastern Colorado. Whether firms would be motivated or capable of doing this is
questionable. Certainly, if PSCo attempted to apply its maximum markup, and eastern Colorado
generation prices were inordinately high, firms from other regions would want to sell their
excess generation in eastern Colorado. However, there are other states on the western grid that
already have higher energy prices, such as California. California also has a large head start on
electric restructuring, relative to other states. It is conceivable that much of the western grid’s
excess generation could be already committed to customers in California by the time Colorado
implements electric restructuring. The significant investment that would be required to increase
the transmission capability of TOTs 3 and 5 appears risky in light of these uncertainties.
The entry of 1,000 MW of new fringe generation (Scenario 3) appears to have a limited,
negative effect upon PSCo’s ability to exercise market power. Over the period 2002-2005, the
time of year over which PSCo could apply a price markup falls from in excess of 93% to in
excess of 74%. The amount of the price markups that can be applied is similarly reduced.
Furthermore, if some entry occurs, the threat of even more entry in the long run becomes more
credible. In accordance with Baumol’s (1982, 5) theory of contestable markets, the threat of
competition could be a disciplining influence on PSCo’s pricing strategy.
On the other hand, between 1990 and 1995 in the UK, the generation market share of the
two largest firms declined from 74% to 54% because of entry by new firms and generation
retirements. The two large firms continued to exert market power keeping prices well above
marginal cost during this period (Wolak and Patrick 1997, 7). Given PSCo’s large market share
and the length of time required to construct new generation, it might take a very long time for
entry to put much of a dent in PSCo’s ability to exercise market power. Additionally, firms
constructing new generation have the option of building in the market with the greatest profit
30
potential. Whether firms would choose to build generation in eastern Colorado, where reserve
margins are expected to remain above 15% through 2006 (WSCC 1997a, 38), instead of
California or some other market with a greater population density, lower reserve margins, and
already higher energy prices is a serious concern.
PSCo divestiture of 50% of its generation (Scenario 4) appears to offer the greatest
reduction in the portion of the year markups can be applied, as well as the amount of the
markups. PSCo can apply a markup over marginal cost 47% of the year or less during 2002-
2005. The average markup is approximately one-eighth of the markup of the base case.
Divestiture of generation, either voluntarily or mandated, might have appeared to be a pipe
dream only a few years ago. However, it has become somewhat common as part of the
implementation of restructuring plans. The Montana Power Company (MPC) recently announced
that it would divest 100% of its generation as part of the state’s electric restructuring. The three
largest California utilities agreed to divest 50% of their fossil generation as part of that state’s
electric restructuring. Some New England utilities are also divesting portions of their generation
as part of state restructuring plans. Of course, to increase competition, the generation of the
dominant firm cannot be divested entirely to another firm. The divestiture plan must somehow
ensure that the divested generation becomes part of the competitive fringe.
When the outcome of each scenario is compared, the similarities and differences become
obvious (table 1 and figure 11). There is almost no difference in the extent and duration of price
markups that can be applied in the base case and when RMPA transmission constraints are
relaxed. The entry of 1,000 MW of fringe generation reduces the extent and duration of markups.
The divestiture of 50% of its generation appears to be most effective means to reduce PSCo’s

31
ability to apply a markup over marginal cost. PSCo can apply a markup over only a small portion
of the year. The amount of markup is approximately one-eighth the base case.
Table 1. Summary of Data.
2002 2003 2004 2005
Scenario 1. Base CasePSCo’s competitive market share 87% 87% 85% 85%PSCo’s market share with price markup 53% 54% 50% 51%% of year PSCo can apply a price markup 93% 95% 94% 96%
|ε| = 0.9 53% 55% 50% 53%|ε| = 0.7 68% 71% 65% 68%|ε| = 0.4 120% 125% 113% 119%
Mar
kup
|ε| = 0.1 478% 498% 452% 474%Scenario 2. Unconstrained RMPA transmission
PSCo’s competitive market share 87% 87% 85% 85%PSCo’s market share with price markup 53% 54% 50% 51%% of year PSCo can apply a price markup 93% 95% 94% 91%
|ε| = 0.9 53% 55% 50% 52%|ε| = 0.7 68% 71% 65% 67%|ε| = 0.4 120% 124% 113% 117%
Mar
kup
|ε| = 0.1 478% 498% 452% 468%Scenario 3. Entry of 1,000 MW generation
PSCo’s competitive market share 88% 87% 85% 85%PSCo’s market share with price markup 47% 45% 43% 42%% of year PSCo can apply a price markup 78% 74% 77% 79%
|ε| = 0.9 31% 35% 27% 28%|ε| = 0.7 39% 45% 34% 36%|ε| = 0.4 69% 79% 60% 63%
Mar
kup
|ε| = 0.1 276% 314% 240% 252%Scenario 4. 50% divestiture
PSCo’s competitive market share 44% 44% 42% 43%PSCo’s market share with price markup 33% 30% 29% 29%% of year PSCo can apply a price markup 37% 47% 44% 45%
|ε| = 0.9 6% 7% 6% 7%|ε| = 0.7 8% 10% 8% 9%|ε| = 0.4 14% 17% 14% 15%
Mar
kup
|ε| = 0.1 56% 67% 56% 61%

32
0%
50%
100%
150%
200%
250%
300%
350%
01,0002,0003,0004,0005,0006,0007,0008,000
Peak Hour Min
Mar
kup
Base Case Unconstrained transmission 1,000 MW entry 50% divestiture
Figure 11. Comparison of markups PSCo can apply over marginal cost to various customerclasses in 2002 in each scenario, elasticity = |0.4|.
Policy Implications and Issues for Future Analysis
This study represents an initial effort at quantifying the effects of the market power of a
dominant firm in a restructured electricity market. Although the analysis is tied to the specifics of
Colorado’s electricity market, its framework may have value to the other 31 states where one
firm controls a significant portion of the state’s generation. The economic paradigm of a
dominant firm that acts as a “price maker,” and a competitive fringe that are “price takers,”
would be suitable when one firm controls a large market share, and all other firms are so small
that they can be considered part of the competitive fringe. If there are multiple firms, each with a
large share of the market, a Cournot model may be more appropriate. The Cournot model is
detailed in analyses by Newbery (1995), Borenstein and Bushnell (1997), Klemperer and Meyer
(1989), and others.
What size market share must a dominant firm own to cause concern? There is no clear
rule. As part of his screens for market power, Joskow (1995, 8) sets a threshold market share of

33
35% for the dominant firm. However, in generation markets, defining the relevant market as a
basis to estimate market share is not an easy task. One could begin by analyzing the transmission
network relevant to a particular area. If transmission into a particular area is frequently
constrained, one could then analyze the market shares of firms within that particular geographic
area, together with the market shares of firms outside that area, that compete up to the level of
transmission constraints. During periods where transmission paths aren’t constrained, it may be
more germane to consider the entry capability of firms over a wider geographic area. For all
fringe firms, capacity by itself might not necessarily be important. Instead, it might be more
appropriate to consider the excess capacity firms own, once their native load is served.
In the case of Colorado, the analysis was simplified by the fact that eastern Colorado,
which would comprise most of Colorado’s restructured electricity market, sits at the eastern edge
of the Western Interconnect. The only two paths into this region are from western Colorado and
Wyoming and these are frequently constrained. Beyond western Colorado and Wyoming, little
power flows from the rest of the WSCC into eastern Colorado. The role of the Northwest Power
Pool and Arizona-New Mexico regions could, therefore, be assumed to be very limited. The
declining reserve margins in these regions reinforce this assumption. Transmission analysis
becomes much more complicated as the number of transmission paths increase.
The more important conclusion that can be drawn from this analysis is that there is no
guarantee that electric restructuring would force prices to marginal cost in a state with a
dominant firm. This outcome, in itself, is significant for any ex ante calculation of the benefits of
electric restructuring or stranded costs. Estimates of electric restructuring benefits or stranded
costs should incorporate a sensitivity analysis that portrays a range of markups over marginal
cost.

34
Furthermore, states developing electric restructuring plans where one firm controls a
large share of the market might want to carefully consider how to mitigate the firm’s market
power. Policy makers should consider measures that ensure fairness in the marketplace, reduce
the dominant firm’s market share, and increase the price elasticity of demand of consumers. It is
probably not necessary to attempt to completely eliminate the dominant firm’s market power.
Policy makers instead may be comfortable with the assurance that competitive pricing will
prevail “most” of the time (and these policy makers must determine what level of “most” they
are comfortable with).
In terms of appropriate market structures to mitigate market power, there are numerous
policy options, including Poolcos, Independent System Operators, transmission pricing schemes,
and market aggregators. An adequate description of each of these options is beyond the scope of
this analysis. Policy makers might choose to develop state restructuring plans that employ these
measures singly or in combination to mitigate market power.
Reducing the dominant firm’s market share would be implemented most easily if the
company simply voluntarily agreed to divest a portion of its generation in return for the
opportunity to compete for unregulated profits or for favorable consideration of its estimate of
stranded costs. If a voluntary agreement between the state and the firm cannot be reached, the
task of reducing the dominant firm’s market share is much more difficult. The restructuring plan
could include measures to make it easier for new generation firms to enter the market, but these
measures may conflict with the need to hold entrants to high standards that promote reliability.
Power marketers can also play a role in increasing competition by buying excess power
anywhere on the grid and reselling it. The restructuring plan may include provisions for how
power marketers enter the market and what standards, if any, they are held to. While increasing

35
transmission capacity is another option, the time, capital investment, and uncertainty associated
with the availability of excess generation elsewhere on the grid may make this option a risky
proposition.
Measures to increase elasticity of demand are touted by economists as an effective means
of mitigating market power, but their acceptance by customers, particularly small customers, has
not been demonstrated. Relatively few loads in a regulated environment are interruptible. It was
only during the oil shocks of the 1970s that small customers made any large-scale efforts at
conservation of electricity, or substitution to alternatives, such as solar energy. Real-time
metering and pricing of electricity has already been incorporated in some state restructuring
plans. The implicit assumption of real-time pricing is that if customers see how their electric
rates vary with overall demand, they may be more inclined to reduce consumption during peak
periods.
As stated earlier, this analysis represents only an initial effort at quantifying a dominant
firm’s market power. The analysis has already admitted its shortcomings in the way the shape of
the load curve is assumed to be the same for the entire RMPA, when this is clearly not true.
There are other ways the analysis can be refined and improved.
A new version of Elfin currently being beta-tested enables the modeling of up to ten
markets simultaneously. The six control areas of the RMPA could then be modeled, each with its
own load curve and resident generation. The Northwest Power Pool, Arizona-New Mexico, and
Eastern Interconnect, via the DC ties, could be modeled as separate markets. This might result in
a simulation that has higher fidelity to reality.
The modeling of other scenarios might also reveal additional insights. A complex, and
dynamic problem might be to model how the dominant firm can withhold a certain quantity of
36
generation from a restructured market, driving up price and encouraging entry by the competitive
fringe, while the dominant firm exports its excess generation to other restructured markets. This
analysis would require a detailed study of the available transmission capacity over which power
would move to these distant markets.
Additional scenarios will be appropriate for analysis as state policy makers develop
specific market structures. For instance, would a restructured state market be part of a larger,
regional Independent System Operator? Would the market include long-term bi-lateral contracts
as well as a short-term commodity market (Poolco)? What are the pricing effects of social
benefits charges and stranded cost recovery? Each of these issues will require the development of
additional scenarios for analysis. These issues could keep consultants and academics employed
for many years.
A final concern relates to the availability of data to do modeling of this nature.
Performing a study such as this requires a tremendous amount of detailed data on generation,
demand, and transmission capacity. While there are undoubtedly data errors in the model
regarding the costs and characteristics of individual plants, in general, these values could be
verified through several different sources. A significant concern is that, as electric restructuring
progresses, it will become increasingly difficult to obtain this data. The ability of policy makers
to do this type of analysis in the future could be severely compromised. Maintaining the ability
of policy makers to conduct analyses in the public’s interest while protecting the confidentiality
of firms will be a serious issue as restructuring progresses.

37
References Cited
Baumol, William J. 1982. “Contestable Markets: An Uprising in the Theory of IndustryStructure.” American Economic Review. 72 (1): 1-15.
Borenstein, Severin, and Bushnell, James. 1997. “An Empirical Analysis of the Potential forMarket Power in California’s Electricity Industry.” Working paper. Berkeley, Calif.:University of California Energy Institute.
Borenstein, Severin; Bushnell, James; Kahn, Edward; and Stoft, Steven. 1996. “Market Powerin California Electricity Markets.” Working paper. Berkeley, Calif.: University ofCalifornia Energy Institute.
Energy Information Administration (EIA). 1996a. The Changing Structure of the ElectricPower Industry: An Update. Washington, D.C.: U.S. Department of Energy.
____________. 1996b. Electric Power Annual, Volume I. Washington, D.C.: U.S. Departmentof Energy.
____________. 1997. Electricity Prices in Competitive Environment: Marginal Cost Pricing ofGeneration Services and Financial Status of Electric Utilities. Washington, D.C.: U.S.Department of Energy.
Environmental Defense Fund (EDF). 1996. Elfin Electric Utility Production Simulation andIntegrated Planning System, Generation Model User’s Guide, Version 3.0. Oakland,Calif.: Environmental Defense Fund.
Joskow, Paul L. 1995. “Horizontal Market Power in Wholesale Power Markets.” Workingpaper. Cambridge, Mass.: Harvard Electricity Policy Group.
Klemperer, Paul D. and Meyer, Margaret A. 1989. “Supply Function Equilibria in Oligopolyunder Uncertainty.” Econometrica. 57 (6): 1243-1277.
McGraw-Hill Energy and Business Newsletters. 1997. “New Moody’s Survey Shows ManyChanges in Estimated Stranded Costs and Prices.” Electric Utility Week. January 27:11-14.
Newbery, David M. 1995. “Power Markets and Market Power.” The Energy Journal. 16 (3):39-66.
Newbery, David M., and Pollitt, Michael G. 1997. “The Restructuring and Privatisation of theCEGB - Was it Worth It?” Working paper. Cambridge, UK: Department of AppliedEconomics and Faculty of Economics.

38
Public Service Company of Colorado (PSCo). 1997. 1996 Final Integrated Resource Plan.Denver, Colo.: Public Service Company of Colorado.
Resource Data International (RDI). 1997. Power Markets in the U.S. Boulder, Colo.: ResourceData International.
Werden, Gregory J. 1996. “Identifying Market Power in Generation.” Public UtilitiesFortnightly. 134 (4): 16-21.
Western Systems Coordinating Council (WSCC). 1997a. 10-Year Coordinated Plan Summary,1997-2006. Salt Lake City, Utah: Western Systems Coordinating Council.
____________. 1997b. Summary of Estimated Loads and Resources. Salt Lake City, Utah:Western Systems Coordinating Council.
Wolak, Frank A., and Patrick, Robert H. 1997. “The Impact of Market Rules and MarketStructure on the Price Determination Process in the England and Wales ElectricityMarket.” Working Paper. Berkeley, Calif.: University of California Energy Institute.