an empirical analysis of the impact of certificate of need
TRANSCRIPT
Kennesaw State UniversityDigitalCommons@Kennesaw State University
Faculty Publications
6-1-2015
An Empirical Analysis of the Impact of Certificateof Need Law on Utilization of Inpatient ServicesJomon Aliyas PaulKennesaw State University, [email protected]
Huan NiKennesaw State University, [email protected]
Aniruddha BagchiKennesaw State University, [email protected]
Follow this and additional works at: https://digitalcommons.kennesaw.edu/facpubs
Part of the Other Business Commons
This Article is brought to you for free and open access by DigitalCommons@Kennesaw State University. It has been accepted for inclusion in FacultyPublications by an authorized administrator of DigitalCommons@Kennesaw State University. For more information, please [email protected].
Recommended CitationPaul, J. A., Ni, H., & Bagchi, A. An Empirical Analysis of the Impact of Certificate of Need Law on Utilization of Inpatient Services.

Page 1 of 52
An Empirical Analysis of the Impact of Certificate of Need Law on Utilization of Inpatient
Services1
Jomon Aliyas Paul, Kennesaw State University
Huan Ni, Kennesaw State University
Aniruddha Bagchi, Kennesaw State University
Abstract
We investigate the impact of Certificate of Need (CON) Law and its stringency on
Inpatient service utilization measured by hospital occupancy. We show that on average the CON
legislation reduces utilization in Inpatient units. Besides, we do not find sufficient statistical
evidence to reject the exogenous assumption of CON and its features. Furthermore, we confirm
the qualitative nature of these key findings by an analysis featuring Inpatient length of stay
(LOS). Other findings include the following: Inpatient utilization is positively related to
proportion of females in a state and the proportion of Asian-Americans; a statistically significant
positive relationship exists between GDP and utilization and a negative one is noted between
utilization and proportion of population on Medicare; a statistically significant positive
relationship is noted between population availing ED services in a state and Inpatient utilization;
1 This research was funded by Kennesaw State University through three separate grants from Center for Excellence
in Teaching and Learning (CETL), Coles College of Business and Department of Economics, Finance and
Quantitative Analysis.

Page 2 of 52
as the number of democratic senators in a state increases, it has a negative impact on utilization
of Inpatient services.
Keywords: CON Law; Health Policy; Utilization; Inpatient Care.
JEL classification: I11, I18
I. Introduction
The U.S. spends more on healthcare than any other country in the world. To put it in perspective,
as per a study by the Centers of Diseases Control and Prevention, it accounts for more than 17%
of Gross Domestic Product (GDP) (NCHS, 2012). All other economic sectors lag behind
healthcare when it comes to spending. Nearly one-third of this is attributed to Inpatient hospital
services and related utilization. Specifically, between 1997 and 2011, aggregate inflation
adjusted hospital costs grew by 3.6 percent annually (Weis, Barrett and Steiner, 2014). It would
be somewhat consoling if quality of healthcare outcomes is comparable with the utilization rates
but that is not the case either. United States lags behind all other industrialized nations in this
regard (OECD, 2009).
Healthcare regulation is usually a strategy that the governments employ to make sure the
utilization and related costs do not get out of hand. As can be expected United States is no
stranger to this. A number of laws have been implemented over the years with varied goals in
mind. The 1946 federal Hill-Burton program for instance was aimed at funding new hospital
construction in areas that most needed it. It was designed to provide funds for new hospital
construction in such areas. However, a state would only receive these funds if they adopted a
health plan that would evaluate the proposed projects (Lave and Lave, 1974). Another significant
milestone in this regard was the Certificate of Need Law. The National Health Planning and
Resource Development Act (NHPA) passed this law in 1974 to curtail unnecessary spending.

Page 3 of 52
The primary goal with this law was to ensure availability of healthcare services while controlling
for unnecessary capacity, expensive duplication of services and improving quality of care and
competition (Conover and Sloan, 1998). Some states have repealed this law but then thirty six
of them still pursue the law in various fashions and it continues to have an impact on their
healthcare industry. While one would presume that these repeal and continuance decisions were
backed by concrete evidence, analysis of extant literature portrays a different story altogether.
Among other issues, one finds that a comprehensive analysis of the impact of CON Law is
notably lacking.2 Given the absence of a complete investigation of this profound issue, literature
unsurprisingly includes studies that find the law to be favorable to the healthcare industry and
then those that believe it has negatively impacted the healthcare industry without a clear
frontrunner. We provide a few examples for both sides of the aisle on relevant healthcare issues
such as entry to market, competition, cost of care and quality of care.
The Department of Justice & Federal Trade Commission (2004) and Zeta (2008) point
out that CON Law leads to higher prices as it protects incumbents by acting as a barrier to entry.
Adding support to this argument, Greenberg (1998) points out that CON Law makes it difficult
for hospitals to enter the healthcare market or for an existing hospital to justify expenditures with
regard to a medical procedure or service that is already available at other hospitals. Vaughan-
Sarrazin et al. (2002) find a negative impact of the law on health outcomes. In their study
featuring Coronary Artery Bypass Graft surgery (CABG) patients, they find the mortality rates of
the CABG patients to be 22% higher in states with CON compared to those that don’t. The
proponents of the law argue that that the law is able to deter excessive investments in expensive
technologies. Their argument is rooted in the ability of hospitals to compete on the basis of non-
2 Hellinger (2009) and Smith and Forgione (2009) provide a detailed overview of CON Law and
changes the law has gone through over the years since its enactment.

Page 4 of 52
price attributes and this allowing them to easily pass on the cost of their investment to the
consumers (or the insurers). Ferrier et al. (2010) similarly find CON Law to have a positive
impact on healthcare costs. Specifically, they are able to show that states with CON Law are able
to accomplish a more efficient allocation of resources and outputs than those without the law.
Additionally, they note that the duration of the law in a state has a positive statistical
significance. Paul et al. (2014) find that CON Law has a statistically significant negative impact
on Emergency Department (ED) average Length of Stay (LOS) and therefore positively impacts
health care quality in ED.
The primary motivation of this study is an empirical analysis of the impact of CON Law
on Inpatient utilization. An additional aspect that makes this analysis interesting and worthwhile
is the negative correlation noted between quality of Inpatient care and utilization in extant
literature (Scholle et al. 2005). The same directional nature is observed to hold between average
length of Inpatient stay and quality of care delivery (Coffman and Rundall, 2005; White and
Glazier, 2011). We would like to study given this contrast, how does CON Law impact
utilization measured by hospital occupancy and to check the robustness of these findings via an
analysis focusing on a different measure of utilization, average LOS. Additional motivation is
provided by findings in extant literature featuring EDs that demonstrate a positive impact of
CON Law on quality of care (Paul et al., 2014).
Given that two states could vary with regard to the stringency with which they enforce
the law, we control not only whether a state has CON law or not, but also we factor in the
thresholds on expenditures that states with CON have put into place. Any expenditure request
beyond these thresholds would have to go through a formal review. Therefore, a hospital or
healthcare provider would have to obtain approvals from the government if they were

Page 5 of 52
considering significant additions to their capacity or entering a new service market. To clarify, a
higher threshold represents less stringent law as in such a scenario only a handful projects would
have to go through a formal review. In this study, we devote our attention to stringency as it
applies to thresholds on service expenditures3. We also account for both the supply and demand
side of the Inpatient market in addition to the features of the law. These variables include but are
not limited to health care supply, economic indicators, demographic characteristics, health status,
health insurance coverage of local population, and state political environment/policy based
variables. Finally, given the possibility of unobserved state heterogeneity, we extend our
analysis by treating CON Indicator and its stringency as endogenous, and then test for their
endogeneity.
II. Data and Summary Statistics
In this study, we investigate the impact of CON Law on Inpatient utilization or
occupancy of hospital inpatient resources in the United States using hospital level data. We
measure utilization as follows for each hospital: ( [
]) following
extant literature (Examples include Sampson et al., 2006; Connecticut Department of Public
Health, 2013 among others).
Our outcome measure is built using Inpatient Days data of hospitals in each state for the
years 2000, 2002, 2004, 2006 and 2009. Our key variables of interest are CON Law and its
3 CON Law is usually associated with three thresholds: one to curb capital spending (for example, hospital expands
its capacity using a loan and has to pay interest), one for equipment purchases and the third featuring service related
expenditures. The one associated with equipment by definition is not relevant to Inpatient care but rather to
emergency departments. Therefore, we did not include this measure in this research. In light of concerns regarding
the consistency of threshold associated with capital spending over the time period in this study, we did not
incorporate it either. Our communication with the American Health Planning Association from whom this data was
obtained did not help resolve these inconsistency concerns.
Page 6 of 52
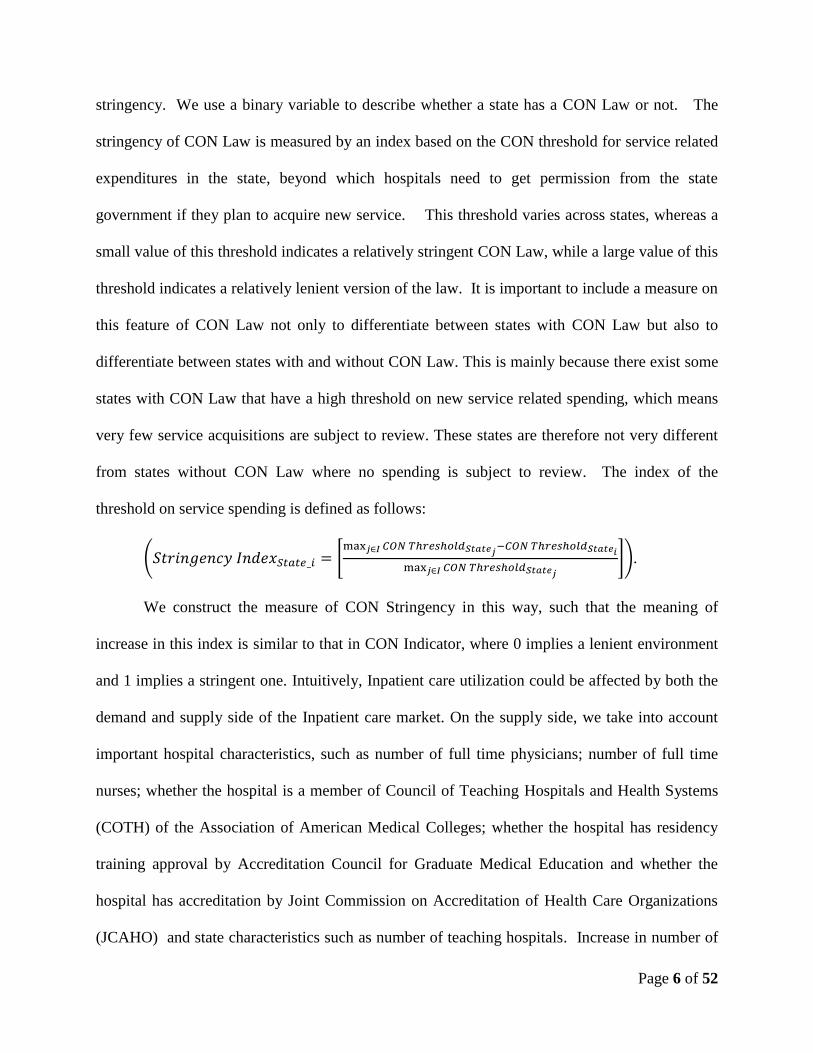
stringency. We use a binary variable to describe whether a state has a CON Law or not. The
stringency of CON Law is measured by an index based on the CON threshold for service related
expenditures in the state, beyond which hospitals need to get permission from the state
government if they plan to acquire new service. This threshold varies across states, whereas a
small value of this threshold indicates a relatively stringent CON Law, while a large value of this
threshold indicates a relatively lenient version of the law. It is important to include a measure on
this feature of CON Law not only to differentiate between states with CON Law but also to
differentiate between states with and without CON Law. This is mainly because there exist some
states with CON Law that have a high threshold on new service related spending, which means
very few service acquisitions are subject to review. These states are therefore not very different
from states without CON Law where no spending is subject to review. The index of the
threshold on service spending is defined as follows:
( [
]).
We construct the measure of CON Stringency in this way, such that the meaning of
increase in this index is similar to that in CON Indicator, where 0 implies a lenient environment
and 1 implies a stringent one. Intuitively, Inpatient care utilization could be affected by both the
demand and supply side of the Inpatient care market. On the supply side, we take into account
important hospital characteristics, such as number of full time physicians; number of full time
nurses; whether the hospital is a member of Council of Teaching Hospitals and Health Systems
(COTH) of the Association of American Medical Colleges; whether the hospital has residency
training approval by Accreditation Council for Graduate Medical Education and whether the
hospital has accreditation by Joint Commission on Accreditation of Health Care Organizations
(JCAHO) and state characteristics such as number of teaching hospitals. Increase in number of

Page 7 of 52
teaching hospitals can negatively impact their turnaround rate (because of the greater role of
resident physicians) and therefore market share of these hospitals. On the demand side, we
construct measures to capture the health need of the population in a given market (state). First,
we control for the demographic characteristics of the state population using measures on
distributions of different age, gender and ethnicity groups. An increase in population in a state
increases the demand for health care and thereby can influence utilization. Further, it is well
known that females have more health care needs when compared to men, and hence an increase
in their proportion might increase demand for Inpatient care and utilization (NCHS, 2012). An
increase in the proportion of the elderly similarly might increase the demand for Inpatient care
and related utilization. Health outcomes and socio-economic standing have been found to
significantly vary by race (Census Bureau, 2013; NCHS, 2012) and therefore any substantial
changes in the racial mix of the population can influence the demand for Inpatient care and
related utilization. Similarly, we consider population that avail Emergency Department (ED)
services). The emergency department related inputs are incorporated accounting for the fact that
a major proportion of Inpatient volume comes from the ED and therefore the ED volume have a
significant impact on Inpatient volume and therefore Inpatient utilization (Paul and Lin, 2012).
Second, we include the proportion of population covered by different types of health
insurance, which could be a natural measure of individuals’ accessibility to health care. For
instance, if the number of individuals with employer-provided insurance increases, it can
potentially lead to a reduction in demand for Inpatient care as these individuals are generally
younger and healthier. The opposite might hold true for those on Medicaid. We also consider
the number of illegal immigrants (in millions) to capture the population who lack health
insurance coverage and hence are likely to be one of the most vulnerable groups.

Page 8 of 52
Third, we try to measure the health status of a state population using the prevalence of
obesity, percent of population that smoke daily, percent of population that drink heavily and
child death rate (CDC, 2014a; CDC, 2014b; CDC, 2014c; CDC, 2014d). For instance, infant
mortality rate is a good indicator of health status as it has been found to be directly related to
health of expecting women which in turn is influenced by their life style and behavioral choices
(CDC, 2014d). Another motivation for considering them in our study is the positive relationship
noted between smoking, heavy drinking, obesity and the health care costs (NCHS, 2012).
There is no doubt that the political and economic environment of a state could affect the
Inpatient care market as well. For instance, in a richer state, Inpatient care providers would have
a stronger incentive to increase utilization of Inpatient services even if there is no real demand to
justify it. We use median household income4 to capture the economic effects.
Also, political environment of a state could very likely influence the policies
implemented in the Inpatient care market which could have an impact on available services and
related utilization. We construct several measures on the political environment of a state: 1)
Party affiliation of the state governor and senators; 2) Voting records of the two senators from a
state: both the number of affirmative votes and deviation of their votes. We include these
variables in our study for the following reasons: First, voting record of senators is an indicator of
the political climate in that state since rational senators would not vote in a manner that
jeopardizes their chance of winning future elections. A higher number of affirmative votes along
with a low deviation in the voting record of the senators is an indication of agreement between
the senators and is possibly a result of a cooperative political climate in a state, either because
one party is overwhelmingly dominant or because both parties enjoy a working relationship.
Legislative changes can be made relatively easily in such a state. In such an environment,
4 All variables in money terms used in our analysis have been adjusted for inflation in 1998 dollars for consistency.
Page 9 of 52
powerful (influential) groups with special interests can get laws passed or modified in their favor
and such changes might significantly impact utilization.
To the best of our knowledge, there is no single data set that includes all of the variables
we need for our analysis. Therefore, we collect information on these variables from a variety of
sources (Appendix Table A.1). We end up with a sample of 22639 observations at the hospital
level, which covers the period of years: 2000, 2002, 2004, 2006 and 2009. Note that variables
such as population demographics,, number of illegal immigrants, and those capturing political
and economic environment, insurance type, are collected at the state level as they cannot be
measured at the hospital level or they are not available. Table 1 provides the summary statistics
of our sample with a comparison between hospitals in states with and without CON Law. A
detailed description of the variables can be found in Appendix Table A.2.
-----------------------Table 1 about here------------------------------
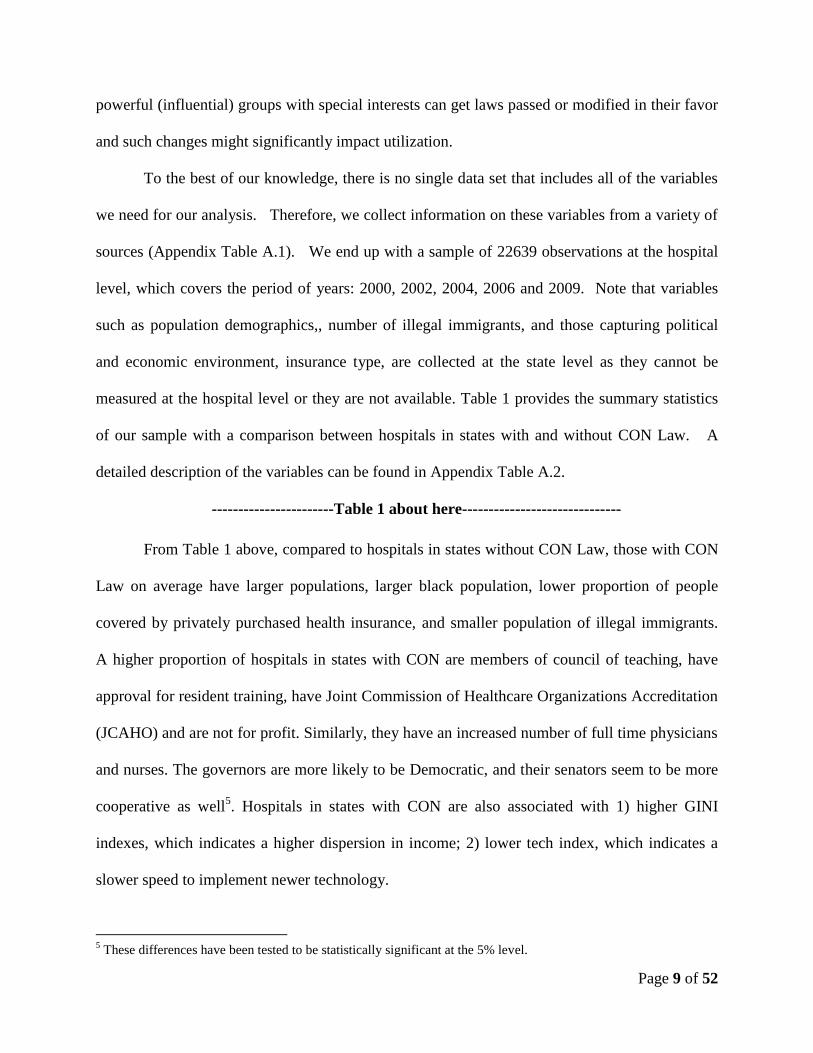
From Table 1 above, compared to hospitals in states without CON Law, those with CON
Law on average have larger populations, larger black population, lower proportion of people
covered by privately purchased health insurance, and smaller population of illegal immigrants.
A higher proportion of hospitals in states with CON are members of council of teaching, have
approval for resident training, have Joint Commission of Healthcare Organizations Accreditation
(JCAHO) and are not for profit. Similarly, they have an increased number of full time physicians
and nurses. The governors are more likely to be Democratic, and their senators seem to be more
cooperative as well5. Hospitals in states with CON are also associated with 1) higher GINI
indexes, which indicates a higher dispersion in income; 2) lower tech index, which indicates a
slower speed to implement newer technology.
5 These differences have been tested to be statistically significant at the 5% level.
Page 10 of 52
III. Econometric Specifications
In this empirical study, we would like to explore the relationship between CON Law and hospital
occupancy, a measure of utilization of hospital resources. While the effect of CON Law on
healthcare costs has been extensively investigated, to the best of our knowledge, there is no prior
literature that studies the effects of CON Law from a utilization standpoint. Our analysis starts
with a binary control of CON Law as mostly used in previous studies, then we extend it with
measures on the stringency of the law, and finally test the endogeneity of CON Law measure(s).
In all our models, we also control for other important variables as described previously that
measure both the demand and supply side of Inpatient care market, and economic and political
environment of a state.
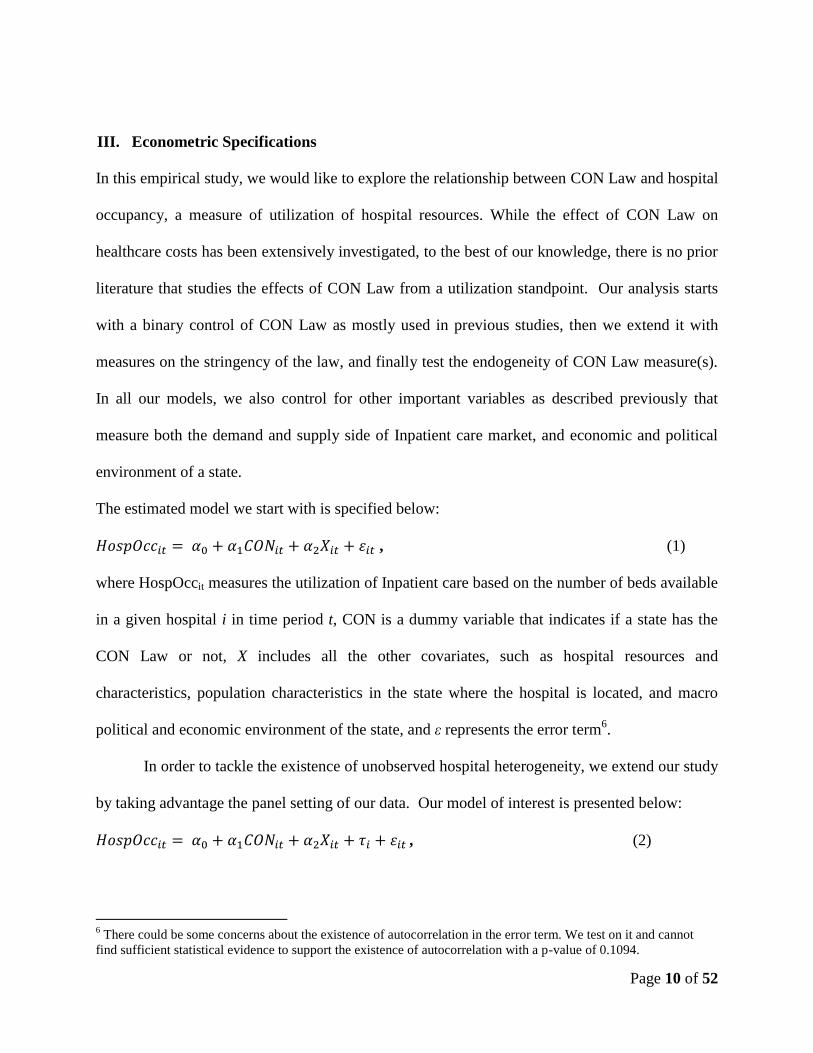
The estimated model we start with is specified below:
, (1)
where HospOccit measures the utilization of Inpatient care based on the number of beds available
in a given hospital i in time period t, CON is a dummy variable that indicates if a state has the
CON Law or not, X includes all the other covariates, such as hospital resources and
characteristics, population characteristics in the state where the hospital is located, and macro
political and economic environment of the state, and ε represents the error term6.
In order to tackle the existence of unobserved hospital heterogeneity, we extend our study
by taking advantage the panel setting of our data. Our model of interest is presented below:
, (2)
6 There could be some concerns about the existence of autocorrelation in the error term. We test on it and cannot
find sufficient statistical evidence to support the existence of autocorrelation with a p-value of 0.1094.

Page 11 of 52
where represents time invariant unobserved hospital heterogeneity. If we assume there is no
correlation between and the observables, we can use the Random Effect (RE) model to
estimate the CON Law effects. We further relax the assumption by allowing the existence of
arbitrary relationship between and the observables, where we use the Fixed Effect (FE) model
to uncover the story. We use a Breusch-Pagan Test to check the existence of this unobserved
heterogeneity of hospital and then use a Hausman type of test to compare our estimation results
from our RE and FE models.
It is worth noticing that CON Indicator, our key variable of interest, is time invariant in
the periods considered in this study. Therefore, we are not able to estimate the effect of CON in
the FE model. In order to obtain some estimates of this key variable of interest that is time
invariant, and at the same time allowing for some relationship between the observed and the
unobserved heterogeneity, we apply a Hausman Taylor (HT) type of model to obtain Generalized
IV (GIV) estimates. In this model, we allow correlation to exist between time varying
observables and unobserved heterogeneity, with an assumption that CON (indicator) is
exogenous (uncorrelated with the unobserved heterogeneity) first7. We then use a Hausman type
of test to compare the result of the HT model with that of the FE model to test the robustness of
our results towards model specification.
Since the decision to retain the law in a state depends on state-specific characteristics,
some of which are unobserved (state’s attitude towards rate of Inpatient care utilization for
instance), we cannot rule out the possibility that the CON Indicator is correlated with the error
term in equation (1) and (2) without testing for it. In other words, there is a possibility that the
CON Indicator may be an endogenous variable. If this is true then we may end up with biased
estimates of CON Law effects if we fail to tackle this issue appropriately. Therefore, we first use
7 We treat CON indicator as an endogenous variable next and test for this endogeneity.

Page 12 of 52
a two-stage least squares (2SLS) model8 to estimate the effects of the CON Law treating CON
Law indicator as endogenous. We then use the Durbin-Wu test to investigate whether we have
strong empirical evidence to believe that the CON Indicator should indeed be treated as an
endogenous variable. The 2SLS estimation is done using the following specifications:
Stage one: (3)
Stage two: HospOccit = + ̂ + +µit (4)
In the first stage, we estimate the likelihood of a state having CON Law as a function of
Instrumental Variables (IVs) and other covariates. And in the second stage, we estimate the
Inpatient utilization as a function of the estimated likelihood of having CON Law from the first
stage and other covariates. Theoretically, we need to include at least one IV for each
endogenous variable in order to identify the model. In this specification, we use the index of
science and technology and the GINI in a state as our IVs.
The following explains our motivation behind choice of these IVs i.e. why we posit that
they are likely to influence whether a state has CON Law but not likely influence the Inpatient
utilization is as follows: 1) The index of science and technology in a state is likely to be
associated with the attitude of the state administration regarding how quickly new technologies
can be adopted. A technologically advanced state will usually have a large technology sector
that provides both jobs and taxes. Everything else remaining constant, such a state is less likely
to have the law since it can hurt business interests in the state. On the other hand, states worried
that such technology and innovation related investments do not justify the resulting benefits are
more likely to have and continue to retain the law. These concerns that the effort to innovate
8 We also used a discrete model in the first step and use the predicted probability of having CON from this stage as
the IV in a 2SLS as a robustness check, and the findings of our main equation were consistent with those obtained
from the 2SLS modeling specification. The results are available upon request. We report the results of 2SLS to
make an easy comparison to the results of models where we control both CON Law indicator and law stringency.

Page 13 of 52
often overtakes the effort to economize find adequate support in extant literature (Bodenheimer,
2005). This might also lead to a scenario wherein such states are technologically less innovative
than those without CON Law. 2) The GINI index is a measure of income dispersion in the state
population. When GINI index of a state increases, the income inequality rises (World Bank,
2013). In this case, it is possible that a large fraction of the population may be unable to pay for
healthcare, particularly for inpatient services. Hospitals in states that have a higher proportion of
low income patient base get subsidies towards the cost of care. For instance, as per the Inpatient
Prospective Payment System (IPPS), the base payment rate (determined by the diagnosis-related
group of a patient) to hospitals is adjusted by an add-on payment known as the disproportionate
share hospital (DSH) adjustment (CMS, 2014). DSH basically provides for a percentage increase
in Medicare payment for hospitals that serve a disproportionate share of low-income patients.
Additionally, it includes a provision to increase this IPPS payment for expensive patient cases.
Therefore, the governments of such states would have valid concerns that hospitals could easily
pass on the cost of unnecessary treatment to them. This would in turn provide the state an
incentive to curb excessive expansion of hospital by retaining and therefore supporting CON
Law that helps curb such unnecessary expansion. This indicates that GINI index is less likely to
influence the utilization but rather is more likely to impact whether a state has CON Law or not.
We also use statistical tests to investigate the validity of these two IVs. Finally, we use a
Durbin-Wu (Hausman type) test to determine if there is empirical evidence to suggest that the
CON Indicator is indeed an endogenous variable.
We also test on the endogeneity of CON Indicator in the panel setting first in a RE
specification and then in a HT Type of model (since our key variable is time invariant).
Stage one: (5)
Page 14 of 52
Stage two: HospOccit = + ̂ + + µit (6)
In the RE model where we treat the CON Indicator as the only endogenous variable, we actually
estimate a Generalized 2SLS (G2SLS) model: first, we regress the CON Indicator on exogenous
variables Xit and IVs; second, we regress HospOcc on the estimated CON from stage1 and Xit
assuming no relation between all the covariates and the unobserved heterogeneity. Then we relax
this assumption by allowing relationships between the covariates (we assume CON Indicator to
be endogenous in this specification) and the unobserved heterogeneity in a HT Type model. We
use a Hausman type of test to test the endogeneity of CON Indicator in both RE (by comparing it
to the RE with CON Indicator as exogenous) and Hausman Taylor specifications (by comparing
it to a HT model where the CON Indicator is treated as exogenous).
Next, we extend our analysis by controlling for the stringency of the CON Law on
service spending using an identical configuration. It is vital to take this measure of the stringency
of CON Law into account9 to better understand the relationship between CON Law and
utilization of hospital Inpatient care. This is because by only using the CON Indicator, we can
only accurately differentiate between CON states and non-CON states in some cases. Namely,
within CON states, there is a large variation in the features of the law and one source of variation
that we are interested in is the stringency of the law. Moreover, states with CON Law can act
similar to those without it by setting very high (in some cases, threshold is listed as “No limit”)
threshold beyond which hospital expenditures are subject to review. Similar to the previous
section, we start our analysis by treating the stringency of CON Law as exogenous in a pooled
OLS specification as follows:
9 There could be some concern regarding the possible existence of multicollinearity between CON indicator and this
measure on its stringency. In order to detect the multicollinearity, we calculate the variance inflation factor
(VIF=8.93) and tolerance (0.1120). These statistics indicate that multicollinearity is not a serious problem in our
study.

Page 15 of 52
(7)
We then extend our study to control for the existence of unobserved hospital heterogeneity by
taking advantage the panel setting of our data. And our model of interest is presented below:
, (8)
where represents time invariant unobserved hospital heterogeneity. This model can be
estimated either by assuming no correlation between observed explanatory variables and the
unobserved effect (random effects), or allowing for arbitrary correlation between the unobserved
effect and the observed explanatory variables (fixed effects). We can then test whether the
random effects specification or the fixed effect specification is more appropriate based on a
Hausman type of test, and whether the former is more appropriate than the pooled OLS
regression using a Breusch-Pagan test. For the reason provided earlier in this section, we use a
HT model to identify the effects of the time invariant CON Indicator while allowing the
existence of relationship between the observed factors and the unobserved heterogeneity. We
then use a Hausman type of test to compare our results of the FE and HT model.
As noted earlier in this section, it is worth testing whether the CON Strigency should be
treated as an endogenous variable as well. In order to tackle this empirical issue and test for the
endogeneity of the law stringency, we estimate the effect of the CON Law on hospital occupancy
by using a 2SLS Model as follows10
:
Stage one: (9)
Stage two: HospOccit = + ̂ + +µit (10)
In this specification, we use the following IVs for stringency: tech index, and GINI index.
The relationship between techindex and service stringency could go either way. This is because
10
In this model, we treat CON Law indicator as exogenous as suggested by our results from the Hausman test
regarding the endogeneity of CON Law in equation (3) and (4).

Page 16 of 52
a state with CON Law that is highly technological innovative and believes CON Law is
beneficial could adopt a strict process with regard to review of service spending applications to
ensure that only the most deserving (in terms of public health outcomes) get approved. This in
turn would help improve the technological innovativeness standing of the state. This is analogous
to the strict process an Ivy League school follows when reviewing student applications so only
the best get accepted to sustain and/or improve the reputation of the school. This would support a
positive relationship between techindex and service stringency. On the other hand, there could
also be states that are technologically innovative and have a large technology sector that provides
both jobs and taxes that are not in favor of a strict CON Law if they believe it could hurt business
interests in the state. A low stringency index (equal to zero) would also capture those states that
do not have CON Law for similar reasons. This would support a negative relationship between
techindex and service stringency. As indicated earlier, hospitals in states that have a higher
proportion of low income patient base get subsidies towards the cost of care and provisions to
increase such payments for expensive patient cases. Therefore, the governments of such states
would have valid concerns that hospitals could easily pass on the cost of unnecessary treatment
to them. This would in turn provide the state an incentive to curb excessive expansion of hospital
by lowering the threshold or increasing the stringency of the Law as it pertains to service
expenditures by healthcare providers. This indicates that GINI index is less likely to influence
the utilization but rather is more likely to impact the CON Law. Furthermore, we test on the
endogeneity of CON Stringency in the panel setting first in a RE/FE specification (as below) and
then in a HT Type of model (since our other key variable-CON Indicator is time invariant).
Stage one: (11)
Stage two: HospOccit = + ̂ + + + µit (12)

Page 17 of 52
In the RE model, we treat the CON Stringency as the only endogenous variable. Then we
relax this assumption by allowing relationships between the covariates (we assume CON
Stringency as endogenous and CON Indicator to be exogenous in this specification) and the
unobserved heterogeneity in a HT Type model. We use a Hausman type of test to test the
endogeneity of CON Indicator in both RE (by comparing it to the RE model where both CON
Stringency and CON Indicator are treated as exogenous) and Hausman Taylor specifications (by
comparing it to a HT model where both CON Stringency and CON Indicator are treated as
exogenous).
IV. Results
In this paper, we explore the effects of CON Law on Inpatient utilization given one of the
motivations to implement the CON Law was to regulate the unnecessary healthcare utilization
and cost. The well documented concerns regarding unnecessary Inpatient utilization trends,
which could lead to a waste of resources, noted across United States provides a second
motivation for this analysis. The main results of our empirical analysis are presented in Tables
2-5 below, with our preferred specification presented in Table 4. Our main findings include: 1)
In general, CON Law (represented by the variable CON Indicator in the result tables) helps
reduce utilization of Inpatient care11
. 2). The stringency of the law measured by service
expenditure thresholds employed by states with CON Law does not have a statistically
significant impact on the utilization. 3) Durbin-Wu test shows that we cannot reject the
hypothesis that CON Law and its stringency could be treated as exogenous in estimation.
11
We also use quantile regression to investigate whether the effects of CON law differ in different states with
various occupancy rate. The results show the magnitude of effects of CON indicator decreases by 10% with
increases in occupancy (from 1st to the 3
rd quartile), while the magnitude of effects of the stringency of CON
increases by 90%.

Page 18 of 52
Table 2 below presents the results of estimation on Inpatient utilization only controlling for
a binary indicator of whether a state has CON Law or not. We have included results from all the
four models i.e. cross sectional (OLS), RE and FE panel models and then those from a HT type
model given the inability of FE to estimate coefficients of time invariant variables. A couple of
important items to note: 1) Breush Pagan test comparing RE and OLS models indicates existence
of unobserved heterogeneity of hospital (p-value<0.01). 2) A Hausman type of test comparing
RE versus FE models indicates that RE is inconsistent or misspecified (p-value <0.01) hence a
FE model is more appropriate. 3) A Hausman type of test comparing FE with HT model results
indicates that HT estimates are adequate (p-value>0.1). This can be also noted via a comparison
of magnitudes and directional nature of coefficients associated with variables that have a
statistical significant impact on Inpatient utilization in both these models. As mentioned above,
the motivation for developing an HT type of model is the inability of FE to estimate coefficients
of time invariant variables, in this case a key variable considered in our study. In short, the
Hausman Taylor specification is our preferred one in Table 2 based on the test results mentioned
above. On average CON law will reduce the occupancy rate by 33.61%12
.
-----------------------Table 2 about here------------------------------
As a next step, we evaluate the endogeneity of CON Indicator13
. These results are presented in
Table 3. In the endogenous OLS model, the Durbin-Wu test (with a p-value of 0.8787) shows
that we cannot reject the hypothesis that CON Indicator could be treated as exogenous14
. We also
12 We incorporate year dummies to check whether this effect of reduction could be driven by time effects. We do
not observe any noticeable patterns over time. Further, using a treatment effect model, we find that if all states in US
had CON law, the national average occupancy rate in our sample will be 57.11%, and if all states in US had no CON
law, the average is 66.64%, which leads to a difference of 8.53% in occupancy rate of inpatient care.
13
The results of the first stage estimation are reported in Table A.3.
14
The first stage F-test yielded a p-value<0.0001. The over-identification test indicated a p-value=0.8186. In the
Stock-Yogo test, Cragg-Donald Wald F statistic is 2715.85. These indicate we have strong and valid IVs.

Page 19 of 52
perform an endogeneity test for our RE and HT specifications. A Hausman test for both
specifications (RE – p-value>0.1 and HT – p-value>0.1) indicates that we are not able to reject
the hypothesis that CON Indicator could be treated as exogenous.
-----------------------Table 3 about here------------------------------
Other findings include the following: 1) Inpatient utilization reduces with increase the
size of population in a state. Intuitively, this could mean given constraints on Inpatient care
resources or resources remaining the same, these states tend to use available capacity more
judiciously so the population that require inpatient care can still receive it. We confirm this
rationale via our robustness check featuring Inpatient LOS (Table 6). If the rationale we mention
is indeed correct, then a negative relationship is expected between Inpatient LOS and population
size. 2) We also find that utilization is positively related to proportion of female in state and the
proportion of Asian-Americans. As mentioned earlier, this can be explained by the increased
needs for health services for female population when compared to males (NCHS, 2012). Given
the economic affluence and stability of Asian population (Census Bureau, 2013), a positive
relationship exists between the size of this population group and utilization from a hospital
revenue standpoint is understandable. 3) Similar economics based reasoning explains the
statistically significant positive relationship noted between GDP and utilization and a negative
one noted between utilization and proportion of population on Medicare. 4) As noted earlier,
Emergency Department patients make up a significant proportion of Inpatient population. This
explains the positive relation noted between population availing ED services in a state and
Inpatient utilization. 5) As the number of democratic senators in a state increases, it has a
negative impact on utilization of Inpatient services. 6). An increase in the proportion of patients
Page 20 of 52
covered by Medicare is associated with a lower (28.57%) utilization of hospital beds, which can
partly be explained by the story that the reimbursement of government provided insurance
(Medicare) may have certain requirement on the efficiency of inpatient care.
As mentioned earlier, only accounting for the presence or absence of the CON Law can
be problematic not only because the stringency of the CON Law can vary a lot across states that
have this legislation in effect, but also because a state with a very relaxed CON Law is
essentially not very different from a state without the law. Therefore, it is vital to take into
account CON Law characteristics in order to better understand the effects of CON Law. In
Table 4, we present our estimates of CON Law effects with the stringency of the law taken into
account.
-----------------------Table 4 about here------------------------------
As in the case of exogenous models (Table 2) considering merely the effect of the indicator
whether a state has CON Law or not, we have included results from all the four models i.e. cross
sectional (OLS), RE and FE panel models and then those from a HT type model given the
inability of FE to estimate coefficients of time invariant variables. A couple of important items to
note: 1) Breush Pagan test comparing RE and OLS models indicates existence of unobserved
heterogeneity of hospital (p-value<0.001). 2) A Hausman type of test comparing RE versus FE
models indicates that RE is inconsistent or misspecified (p-value <0.001) hence a FE model is
appropriate. 3) A Hausman type of test comparing FE with HT model results indicates that HT
estimates are adequate (p-value>0.1).

Page 21 of 52
As a next step, we evaluate the endogeneity of CON Stringency15
. These results are
presented in Table 5. In the endogenous OLS model, the Durbin-Wu test (with a p-value of
0.2807) shows that we cannot reject the hypothesis that CON Stringency could be treated as
exogenous16
. We also perform an endogeneity test for our RE and HT specifications. A Hausman
test for both specifications (RE – p-value>0.1 and HT – p-value>0.1) indicates that we are not
able to reject the hypothesis that CON Stringency could be treated as exogenous. In the
endogenous FE model, the Durbin-Wu test (with a p-value of 0.9987) shows that we cannot
reject the hypothesis that CON stringency could be treated as exogenous17
.
-----------------------Table 5 about here------------------------------
In light of our findings that both CON Law and its stringency should be treated as
exogenous, we next elaborate on results from exogenous specifications included in Table 4, our
preferred models. All our findings noted earlier in Table 2 hold i.e. 1) CON Law has a
statistically significant negative impact on Inpatient utilization. 2) Inpatient utilization reduces
with increase in the size of population in a state. 3) Inpatient utilization is positively related to
proportion of female in state. 4) A statistically significant positive relationship exists between
GDP and utilization and a negative one noted between utilization and proportion of population
on Medicare. 5) A statistically significant positive relationship is noted between population
availing ED services in a state and Inpatient utilization. 6) As the number of democratic senators
in a state increases, it has a negative impact on utilization of Inpatient services.
15
The results of the first stage estimation are reported in Table A.4.
16
The first stage F-test yielded a p-value<0.0001. The over-identification test indicated a p-value= 0.9414. In the
Stock-Yogo test, Cragg-Donald Wald F statistic is 286.53. These indicate we have strong and valid IVs.
17
The first stage F-test yielded a p-value<0.0001). The over-identification test indicated a p-value= 0.9095. In the
Stock-Yogo test, Cragg-Donald Wald F statistic is 1057.93. These indicate we have strong and valid IVs.
Page 22 of 52
As a robustness check to role of CON Law in reducing utilization given its negative
correlation with quality of Inpatient care noted in extant literature (Scholle et al. 2005), we
extend our analysis to study the relationship between CON Law and Inpatient LOS. Specifically,
we investigate if the same directional nature holds between CON Law and Inpatient LOS,
another metric that has been found to be negatively associated with quality of Inpatient care
(Coffman and Rundall, 2005; White and Glazier, 2011). We find that CON Law represented by
CON Indicator i.e. whether a state has CON Law or not has a negative impact on Inpatient LOS
i.e. a positive impact on quality of Inpatient care. This provides support to previously
documented positive relationship noted between CON Law and emergency department quality of
care (Paul et al, 2014). Further, the statistically significant negative relationship noted between
Inpatient LOS and population size confirms the rationale we put forth when explaining the
negative relationship between population size and inpatient utilization in an earlier discussion.
The results from the Inpatient LOS models are presented in Table 6.18
-----------------------Table 6 about here------------------------------
V. Conclusions
As discussed in the first section of the paper, CON Law was designed to reduce
healthcare costs. Given that increased Inpatient care utilization and related costs have
continuously been highlighted as a serious concern in United States, it is worthwhile to study if
the law is doing what it was originally intended for. Our results indicate that CON Law has a
18
Unlike HT model and prior specifications, although the estimated effect of service stringency is statistically
significant at the 10% level in the RE and OLS models, CON Indicator and service stringency index are tested to be
jointly significant at the 10% level. Additionally, our analysis indicated that most states that have CON Law are
found to have a stringent version of the law. Specifically, less than 40% of the states have a stringency index value
less than 0.5, and more than 60% of the states have this index value higher than 0.75 (which indicates a strict law).

Page 23 of 52
negative impact on Inpatient care utilization. Besides, we do not find sufficient statistical
evidence to reject the exogenous assumption of CON and its features. Furthermore, we confirm
the qualitative nature of these key findings by an analysis featuring Inpatient LOS.
The other key findings include the following: 1) Inpatient utilization reduces with
increase in the size of population in a state. 2) Inpatient utilization is positively related to
proportion of female in state and the proportion of Asian-Americans. 3) A statistically
significant positive relationship exists between GDP and utilization and a negative one noted
between utilization and proportion of population on Medicare. 4) A statistically significant
positive relationship is noted between population availing ED services in a state and Inpatient
utilization. 5) As the number of democratic senators in a state increases, it has a negative impact
on utilization of Inpatient services.
In summary, our results indicate that CON Law can help mitigate the increased Inpatient
care utilization issues. Our findings have significant policy implications with regard to CON
Law’s impact on healthcare. The implication of our results can aid public policy makers when
deciding the appropriate health programs or legislative framework to control unnecessary use of
health services and resulting costs.
VI.
References
Bureau of Labor Statistics. Consumer price index. Bureau of Labor Statistics 2013.
http://stats.bls.gov/cpi/home.htm. Accessed November 14 2013.
CDC. Health effects of cigarette smoking. Centers for Disease Control and Prevention 2014a.
Page 24 of 52
http://www.cdc.gov/tobacco/data_statistics/fact_sheets/health_effects/effects_cig_smoking/.
Accessed May 15 2014.
CDC. The health effects of overweight and obesity. Centers for Disease Control and Prevention
2014b. http://www.cdc.gov/healthyweight/effects/. Accessed November 10 2014.
CDC. Fact sheets- alcohol use and your health. Centers for Disease Control and Prevention
2014c.
http://www.cdc.gov/reproductivehealth/MaternalInfantHealth/InfantMortality.htm.
Accessed November 14 2014.
CDC. Infant mortality. Centers for Disease Control and Prevention 2014d.
http://www.cdc.gov/reproductivehealth/MaternalInfantHealth/InfantMortality.htm. Accessed
October 6 2014.
CMS. Acute Inpatient PPS. Centers for Medicare and Medicaid Services 2014.
http://www.cms.gov/Medicare/Medicare-Fee-for-Service-
Payment/AcuteInpatientPPS/index.html. Accessed November 14, 2014.
Coffman J, Rundall TG: The impact of hospitalists on the cost and quality of inpatient care in the
United States: a research synthesis. Medical Care Research and Review 2005; 62:379-
406.
Conover, C.J., Sloan, F.A. Does removing certificate-of-need regulations lead to a surge in
health care spending? Journal of Health Politics, Policy and Law 1998; 23(3):455-81.
Connecticut Department of Public Health. Health care utilization in connecticut.
http://www.ct.gov/dph/lib/dph/ohca/utilizationreport/utilizationreport2013.pdf. Office of
Health Care Access 2013. Accessed May 20, 2014.

Page 25 of 52
Ferrier, G., Leleu, H., Valdmanis, V. The impact of CON regulation on hospital efficiency.
Health Care Management Science 2010; 13:84–100.
Hellinger, F.J. The effect of certificate-of-need laws on hospital beds and healthcare
expenditures: an empirical analysis. American Journal of Managed Care 2009;
15(10):737-44.
Kessler, D.P., McClellan, M.B. Is hospital competition socially wasteful? The Quality Journal of
Economics 2000; 115:577–615
Lave, J., Lave, L. The hospital construction Act: Evaluation of the Hill-Burton program 1948-
1973. Washington, DC: American Enterprise Institute; 1974.
Mayo, J.W., McFarland, D.A. Regulation, market structure, and hospital costs. Southern
Economic Journal 1989; 55(3): 559–569.
NCHS. Health, United States, 2012. National Center for Health Statistics 2012.
http://www.cdc.gov/nchs/data/hus/hus12.pdf#111. Accessed September 23 2013.
OECD. Health care quality data indicators 2009. OECD 2009.
Paul, J., Huan Ni, Bagchi, A. Effect of Certificate of Need law on emergency department Quality
of care. Journal of Emergency Medicine 2014; 47(4): 453-461.
Rivers, P.A., Fotter, M.D. Do HMO penetration and hospital competition impact quality of
hospital care? Health Services Management Research 2004; 17: 237–248.
Sampson, M. J., Crowle, T., Dhatariya, K., Dozio, N., Greenwood, R. H., Heyburn, P. J., et al.
Trends in bed occupancy for inpatients with diabetes before and after the introduction of
a diabetes inpatient specialist nurse service. Diabetic Medicine 2006; 23: 1008 –1018.
Scholle, S. H., Mardon, R., Shih, S. C., Pawlson, L. G. The relationship between quality and
utilization in managed care. American Journal of Managed Care 2005; 11(8): 521-527.

Page 26 of 52
Stata. www.stata.com, 2012.
Smith, P.C., Forgione D.A. The development of certificate of need legislation. Journal of Health
Care Finance 2009; 36: 35-44.
Vaughan-Sarrazin, M.S., Hannan E.L., Gormley, C.J, Rosenthal, G.E. Mortality in medicare
beneficiaries following coronary artery bypass graft surgery in states with and without
certificate of need regulation. Journal of American Medical Association 2002;
288(15):1859-66.
Weiss, A. J., Barrett, M. L., Steiner, C. A. Trends and projections in inpatient hospital costs and
utilization, 2003–2013. Statistical Brief #175 2014. Healthcare cost and utilization
project. Agency for Healthcare Research and Quality.
White HL, Glazier RH: Do hospitalist physicians improve the quality of inpatient care delivery?
A systematic review of process, efficiency and outcome measures. BMC Medicine 2011,
9:58.
Wooldridge, J.M. Econometric analysis of cross-section and panel Data. Cambridge
Massachusetts: The MIT Press; 2001.
World Bank. GINI index. http://data.worldbank.org/indicator/SI.POV.GINI. Accessed December
26 2013.
Zeta, L.M. Fundamental first steps along the road to health care reform: Eliminating the
bureaucratic burdens of Certificate Of Need programs and embracing market competition
to improve state health care systems. Creighton Law Review 2008; 41(4): 727-762.

Page 27 of 52
Table 1: Summary statistics for variables
sample Hospitals in states
without CON
Hospitals in states
with CON
(n=22639) (n=8474) (n= 14165)
Mean
Std.
Deviation Mean Std. Deviation Mean
Std.
Deviation
Inpatient Utilization 0.595 (0.249) 0.577 (0.306) 0.606 (0.206)
CON Law
CON Indicator 0.626 (0.484) 0.000 (0.000) 1.000 (0.000)
Stringency Index – Service 0.164 (0.331) 0.000 (0.000) 0.261 (0.387)
Hospital Characteristics
Full Time Physicians and Dentists 16.269 (66.010) 13.036 (54.464) 18.204 (71.971)
Full Time Nurses 163.366 (262.751) 147.706 (241.313) 172.734 (274.359)
Member of Council of Teaching 0.063 (0.242) 0.045 (0.208) 0.073 (0.260)
Resident Training Approval 0.180 (0.384) 0.147 (0.354) 0.199 (0.400)
JCAHO Accreditation 0.732 (0.443) 0.674 (0.469) 0.766 (0.423)
Not For Profit 0.523 (0.500) 0.479 (0.500) 0.549 (0.498)
Government Ownership 0.036 (0.186) 0.037 (0.189) 0.035 (0.185)
Demographics
Population Size 11.179 (9.653) 16.423 (12.596) 8.043 (5.267)
Proportion - Female 0.508 (0.006) 0.503 (0.005) 0.510 (0.004)
Proportion (age 0-17) 0.250 (0.017) 0.261 (0.019) 0.243 (0.012)
Proportion (18-44) 0.379 (0.016) 0.386 (0.018) 0.376 (0.014)
Proportion (45-64) 0.245 (0.017) 0.236 (0.018) 0.251 (0.014)
Proportion - Black 0.127 (0.088) 0.076 (0.036) 0.158 (0.096)
Proportion - Asian 0.034 (0.030) 0.044 (0.040) 0.028 (0.019)
Proportion - Amer Indian 0.010 (0.014) 0.016 (0.021) 0.006 (0.004)
Proportion - Pacific 0.001 (0.001) 0.002 (0.002) 0.001 (0.001)

Page 28 of 52
Proportion - Oth Race 0.014 (0.005) 0.016 (0.005) 0.013 (0.004)
Illegal Immigrant 0.512 (0.717) 0.959 (0.969) 0.244 (0.264)
Health Status
Obesity 24.843 (3.517) 24.261 (3.533) 25.191 (3.462)
Proportion - Smoke Daily 15.362 (3.477) 13.654 (3.280) 16.384 (3.178)
Proportion - Drink Heavily 5.170 (1.077) 5.235 (0.968) 5.131 (1.135)
Child Death Rate 2.045 (0.487) 1.977 (0.363) 2.087 (0.545)
Health Care Access and Supply
Proportion - Emp Ins 0.535 (0.053) 0.522 (0.050) 0.543 (0.054)
Proportion - Priv Ins 0.090 (0.022) 0.096 (0.026) 0.087 (0.019)
Proportion - Medicaid 0.117 (0.030) 0.116 (0.029) 0.117 (0.030)
Proportion - Medicare 0.124 (0.018) 0.114 (0.016) 0.129 (0.016)
State ED Market 4.360 (3.175) 5.799 (3.967) 3.499 (2.172)
Number of Teaching Hospitals 16.876 (14.405) 20.142 (13.419) 15.083 (14.611)
Political and economic environment
Senator Mean 0.529 (0.365) 0.436 (0.374) 0.585 (0.347)
Senator Deviation 0.223 (0.272) 0.198 (0.232) 0.238 (0.292)
Number of Democratic Senators 1.038 (0.870) 0.792 (0.900) 1.185 (0.817)
Gov_demo 0.423 (0.494) 0.279 (0.449) 0.509 (0.500)
Gov_ind 0.008 (0.091) 0.017 (0.130) 0.003 (0.054)
Median Income 41.693 (6.400) 42.607 (5.607) 41.147 (6.772)
Proportion - Inpatient Days -
Medicare 0.449 (0.240) 0.447 (0.249) 0.451 (0.234)
Proportion - Inpatient Days -
Medicaid 0.179 (0.178) 0.175 (0.176) 0.182 (0.179)
Unemployment Rate 0.062 (0.020) 0.061 (0.018) 0.062 (0.021)
GDP 0.395 (0.369) 0.591 (0.483) 0.278 (0.202)
Instrumental Variables
GINI 228.250 (75.837) 224.834 (77.172) 230.294 (74.955)
Tech Index 55.469 (13.638) 61.840 (10.844) 51.657 (13.715)

Page 29 of 52
Table 2: Effect of CON Indicator on Inpatient utilization
CON Law as Exogenous
Cross Sectional Random Effect Fixed Effect Hausman Taylor
Variables Coef. Std.
Error
Test
Stat Coef.
Std.
Error
Test
Stat Coef.
Std.
Error
Test
Stat Coef.
Std.
Error
Test
Stat
CON Indicator -
0.027 (0.005) -5.07*** -0.023 (0.007) -3.12*** 0 (omitted)
-0.200 (0.092) -2.18**
Full Time Physicians and
Dentists
-
0.00004
(0.000
03) -1.44
-
0.00002 (0.00003) -0.78 0.00001 (0.00005) 0.13 0.00005 (0.00004) 1.14
Full Time Nurses 0.000
1
(0.000
01) 17.36*** 0.0001 (0.00001) 12.38*** 0.00002 (0.00002) 0.91 0.00003 (0.00002) 1.82
Member of Council of
Teaching
-
0.0004 (0.008) -0.05 0.013 (0.010) 1.27 0.002 (0.022) 0.10 0.020 (0.020) 1.02
Resident Training
Approval 0.018 (0.005) 3.67*** 0.022 (0.006) 3.71*** -0.003 (0.010) -0.33 0.002 (0.009) 0.24
JCAHO Accreditation 0.089 (0.004) 24.40*** 0.058 (0.004) 13.37*** -0.011 (0.007) -1.61 -0.010 (0.006) -1.56
Not For Profit -
0.004 (0.003) -1.13 -0.002 (0.004) -0.38 0.009 (0.011) 0.87 0.012 (0.010) 1.19
Government Ownership -
0.184 (0.009)
-
19.46*** -0.164 (0.013)
-
12.52*** -0.108 (0.068) -1.59 -0.012 (0.057) -0.21
Population Size -
0.007 (0.003) -2.13** -0.008 (0.003) -2.45** -0.029 (0.008) -3.75*** -0.034 (0.007) -4.61***
Proportion - Female 2.036 (0.764) 2.67*** 2.754 (0.958) 2.87*** 14.621 (4.848) 3.02*** 16.720 (4.570) 3.66***
Proportion (age 0-17) -
2.365 (0.350) -6.77*** -2.310 (0.394) -5.86*** -1.825 (1.411) -1.29 -1.322 (1.335) -0.99
Proportion (18-44) -
1.039 (0.308) -3.37*** -0.443 (0.346) -1.28 1.445 (1.429) 1.01 1.668 (1.360) 1.23
Proportion (45-64) -
0.681 (0.393) -1.73* -0.249 (0.445) -0.56 0.789 (1.511) 0.52 1.025 (1.438) 0.71
Proportion - Black 0.206 (0.039) 5.22*** 0.176 (0.049) 3.58*** 1.110 (0.780) 1.42 0.391 (0.707) 0.55
Proportion - Asian 0.032 (0.298) 0.11 0.462 (0.334) 1.38 2.621 (1.721) 1.52 3.233 (1.629) 1.99**

Page 30 of 52
Proportion - Amer Indian -
0.164 (0.151) -1.09 -0.056 (0.211) -0.26 -6.904 (4.511) -1.53 -4.387 (4.223) -1.04
Proportion - Pacific 4.803 (2.630) 1.83* 7.145 (3.460) 2.07** 53.572 (45.069) 1.19 53.390 (42.940) 1.24
Proportion - Oth Race -
0.206 (0.522) -0.39 -0.745 (0.715) -1.04 0.245 (6.953) 0.04 2.929 (6.569) 0.45
Proportion - Emp Ins -
0.145 (0.110) -1.33 -0.119 (0.108) -1.10 -0.216 (0.155) -1.39 -0.193 (0.148) -1.31
Proportion - Priv Ins -
0.714 (0.122) -5.83*** -0.518 (0.129) -4.02*** -0.333 (0.214) -1.56 -0.325 (0.204) -1.59
Proportion - Medicaid -
0.313 (0.131) -2.39** -0.215 (0.127) -1.70* -0.102 (0.179) -0.57 -0.049 (0.170) -0.29
Proportion - Medicare -
0.358 (0.258) -1.39 -0.315 (0.224) -1.41 -0.427 (0.252) -1.69* -0.405 (0.240) -1.68*
Obesity -
0.0003 (0.001) -0.39 -0.001 (0.001) -0.84 0.000 (0.001) 0.17 0.0001 (0.001) 0.16
Proportion - Smoke Daily 0.001 (0.001) 1.48 0.0005 (0.001) 0.49 0.000 (0.002) 0.11 0.0004 (0.002) 0.26
Proportion - Drink
Heavily 0.002 (0.002) 1.25 0.002 (0.002) 0.88 0.000 (0.002) 0.10 -0.0003 (0.002) -0.13
Child Death Rate -
0.009 (0.005) -1.74* 0.001 (0.0005) 2.47** 0.002 (0.005) 0.42 0.003 (0.005) 0.64
Number of Teaching
Hospitals 0.002
(0.000
4) 3.91*** -0.001 (0.004) -0.29 0 (omitted)
0.001 (0.003) 0.42
Illegal Immigrant 0.069 (0.021) 3.27*** 0.056 (0.020) 2.75*** 0.013 (0.034) 0.38 0.003 (0.032) 0.11
State ED Market -
0.012 (0.006) -2.08** -0.002 (0.006) -0.29 0.019 (0.010) 1.97** 0.021 (0.009) 2.23**
Senator Mean 0.037 (0.017) 2.12** 0.036 (0.016) 2.25** 0.028 (0.019) 1.48 0.027 (0.018) 1.46
Senator Deviation -
0.007 (0.006) -1.09 -0.004 (0.006) -0.70 0.007 (0.007) 0.97 0.007 (0.007) 1.13
Number of Democratic
Senators
-
0.014 (0.006) -2.12** -0.014 (0.006) -2.24** -0.017 (0.007) -2.30** -0.016 (0.007) -2.36**
Gov_demo -
0.003 (0.004) -0.95 -0.007 (0.003) -2.10** -0.005 (0.004) -1.36 -0.006 (0.004) -1.45
Gov_ind - (0.017) -0.77 -0.006 (0.015) -0.38 0.020 (0.016) 1.24 0.018 (0.016) 1.16

Page 31 of 52
0.013
Median Income 0.003 (0.001) 4.01*** -0.256 (0.009)
-
28.14*** 0.001 (0.001) 1.29 0.002 (0.001) 1.46
Proportion - Inpatient
Days - Medicare
-
0.307 (0.008)
-
39.69*** 0.037 (0.011) 3.35*** -0.166 (0.014)
-
12.15*** -0.167 (0.013)
-
12.78***
Proportion - Inpatient
Days - Medicaid 0.047 (0.010) 4.72*** 0.003 (0.001) 3.52*** 0.009 (0.014) 0.62 0.009 (0.014) 0.64
Unemployment Rate -
0.159 (0.120) -1.32 -0.284 (0.105) -2.70*** -0.260 (0.164) -1.58 -0.241 (0.157) -1.54
GDP 0.163 (0.081) 2.02** 0.116 (0.071) 1.63 0.288 (0.098) 2.93*** 0.296 (0.094) 3.17***
Constant 0.856 (0.525) 1.63 0.115 (0.640) 0.18 -6.984 (3.258) -2.14 -8.202 (3.049) -2.69
N 22963 22963 22963 22963 * indicates statistical significance at the 10% level
** indicates statistical significance at the 5% level
*** indicates statistical significance at the 1% level
Table 3: Effect of CON Indicator on Inpatient utilization
CON Law as Endogenous
Cross Sectional Random Effect Hausman Taylor

Page 32 of 52
Variables Coef. Std.
Error
Test
Stat Coef.
Std.
Error
Test
Stat Coef.
Std.
Error
Test
Stat
CON Indicator -0.025 (0.012) -2.08** -0.038 (0.022) -1.78* 0.531 (0.323) 1.64
Full Time Physicians and Dentists -
0.00004 (0.00003) -1.44
-
0.00002 (0.00003) -0.78 0.00001 (0.00004) 0.13
Full Time Nurses 0.0001 (0.00001) 17.37*** 0.0001 (0.00001) 12.40*** 0.00002 (0.00002) 0.94
Member of Council of Teaching -0.0004 (0.008) -0.05 0.013 (0.010) 1.26 0.002 (0.021) 0.10
Resident Training Approval 0.018 (0.005) 3.67*** 0.022 (0.006) 3.72*** -0.003 (0.010) -0.34
JCAHO Accreditation 0.089 (0.004) 24.36*** 0.059 (0.004) 13.47*** -0.011 (0.007) -1.66*
Not For Profit -0.004 (0.003) -1.15 -0.001 (0.004) -0.28 0.009 (0.010) 0.89
Government Ownership -0.184 (0.009)
-
19.48*** -0.164 (0.013)
-
12.56*** -0.108 (0.066) -1.64
Population Size -0.007 (0.004) -1.85* -0.009 (0.004) -2.51** -0.029 (0.008) -3.85***
Proportion - Female 2.015 (0.775) 2.60*** 2.981 (1.006) 2.96*** 14.621 (4.714) 3.10***
Proportion (age 0-17) -2.345 (0.373) -6.29*** -2.465 (0.445) -5.54*** -1.825 (1.372) -1.33
Proportion (18-44) -1.032 (0.311) -3.32*** -0.473 (0.347) -1.36 1.445 (1.390) 1.04
Proportion (45-64) -0.665 (0.406) -1.64 -0.346 (0.462) -0.75 0.789 (1.470) 0.54
Proportion - Black 0.203 (0.044) 4.56*** 0.202 (0.060) 3.37*** 1.110 (0.758) 1.46
Proportion - Asian 0.033 (0.298) 0.11 0.472 (0.334) 1.41 2.621 (1.674) 1.57
Proportion - Amer Indian -0.153 (0.168) -0.91 -0.159 (0.251) -0.64 -6.904 (4.387) -1.57
Proportion - Pacific 4.774 (2.635) 1.81* 7.363 (3.464) 2.13** 53.572 (43.832) 1.22
Proportion - Oth Race -0.256 (0.617) -0.42 -0.323 (0.903) -0.36 0.245 (6.762) 0.04
Proportion - Emp Ins -0.149 (0.112) -1.33 -0.107 (0.109) -0.98 -0.216 (0.151) -1.43
Proportion - Priv Ins -0.709 (0.126) -5.61*** -0.564 (0.142) -3.98*** -0.333 (0.208) -1.60
Proportion - Medicaid -0.317 (0.134) -2.37*** -0.206 (0.127) -1.62 -0.102 (0.174) -0.58
Proportion - Medicare -0.356 (0.258) -1.38 -0.318 (0.224) -1.42 -0.427 (0.245) -1.74*
Obesity 0.000 (0.001) -0.38 -0.001 (0.001) -0.90 0.0001 (0.001) 0.18
Proportion - Smoke Daily 0.001 (0.001) 1.38 0.001 (0.001) 0.71 0.0002 (0.002) 0.11
Proportion - Drink Heavily 0.002 (0.002) 1.20 0.002 (0.002) 1.01 0.0002 (0.002) 0.11
Child Death Rate -0.009 (0.005) -1.72* -0.001 (0.004) -0.33 0.002 (0.005) 0.43
Number of Teaching Hospitals 0.002 (0.0004) 3.91*** 0.001 (0.0005) 2.31** 0.003 (0.003) 1.03

Page 33 of 52
Illegal Immigrant 0.068 (0.022) 3.11*** 0.059 (0.021) 2.85*** 0.013 (0.033) 0.39
State ED Market -0.012 (0.006) -2.01** 0.000 (0.006) -0.02 0.019 (0.010) 2.02**
Senator Mean 0.037 (0.017) 2.12** 0.037 (0.016) 2.30** 0.028 (0.019) 1.52
Senator Deviation -0.007 (0.006) -1.10 -0.003 (0.006) -0.56 0.007 (0.007) 1.00
Number of Democratic Senators -0.014 (0.007) -2.12** -0.013 (0.006) -2.07** -0.017 (0.007) -2.36**
Gov_demo -0.003 (0.004) -0.95 -0.007 (0.003) -2.17** -0.005 (0.004) -1.40
Gov_ind -0.013 (0.018) -0.73 -0.008 (0.015) -0.53 0.020 (0.016) 1.27
Median Income 0.003 (0.001) 3.99*** 0.003 (0.001) 3.32*** 0.001 (0.001) 1.32
Proportion - Inpatient Days -
Medicare -0.307 (0.008)
-
39.72*** -0.256 (0.009)
-
28.22*** -0.166 (0.013)
-
12.50***
Proportion - Inpatient Days -
Medicaid 0.047 (0.010) 4.72*** 0.037 (0.011) 3.38*** 0.009 (0.014) 0.63
Unemployment Rate -0.158 (0.121) -1.31 -0.296 (0.107) -2.78*** -0.260 (0.160) -1.62
GDP 0.161 (0.081) 1.98** 0.125 (0.072) 1.73* 0.288 (0.096) 3.01***
Constant 0.856 (0.524) 1.63 0.075 (0.642) 0.12 -7.378 (3.127) -2.36**
N 22963 22963 22963 * indicates statistical significance at the 10% level
** indicates statistical significance at the 5% level
*** indicates statistical significance at the 1% level

Page 34 of 52
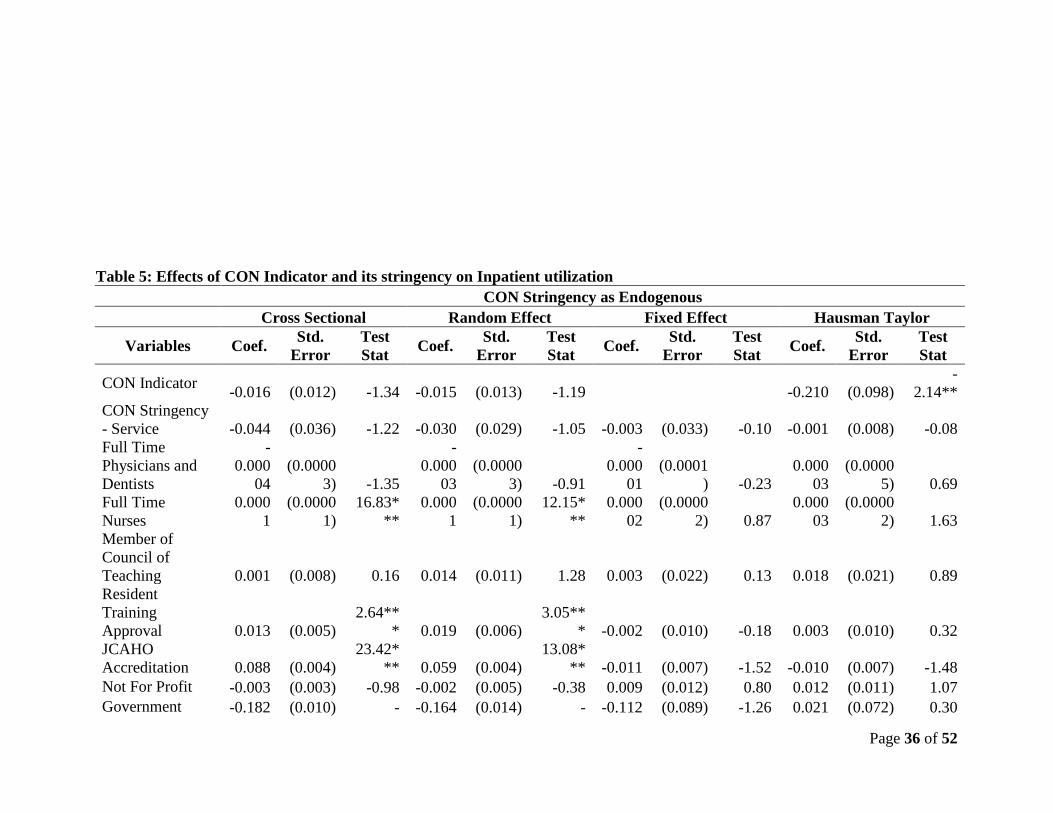
Table 4: Effects of CON Indicator and its stringency on Inpatient utilization
CON Law and Stringency as Exogenous
Cross Sectional Random Effect Fixed Effect Hausman Taylor
Variables Coef. Std.
Error
Test
Stat Coef.
Std.
Error
Test
Stat Coef.
Std.
Error
Test
Stat Coef.
Std.
Error
Test
Stat
CON Indicator -0.028 (0.006) -4.55*** -0.025 (0.008) -3.09*** 0 (omitted)
-0.218 (0.097) -2.25**
CON Stringency - Service -0.003 (0.005) -0.52 -0.001 (0.005) -0.25 0.001 (0.008) 0.09 -0.002 (0.008) -0.31
Full Time Physicians and
Dentists
-
0.00004 (0.00003) -1.34
-
0.00003 (0.00003) -0.89
-
0.00001 (0.0001) -0.23
-
0.00001 (0.00005) -0.25
Full Time Nurses 0.0001 (0.00001) 17.07*** 0.0001 (0.00001) 12.22*** 0.00002 (0.00002) 0.86 0.00002 (0.00002) 0.84
Member of Council of
Teaching 0.0002 (0.008) 0.02 0.013 (0.011) 1.23 0.003 (0.022) 0.13 0.003 (0.022) 0.12
Resident Training
Approval 0.013 (0.005) 2.66*** 0.019 (0.006) 3.05*** -0.002 (0.010) -0.17 -0.002 (0.010) -0.18
JCAHO Accreditation 0.088 (0.004) 23.41*** 0.058 (0.004) 13.01*** -0.011 (0.007) -1.52 -0.011 (0.007) -1.54
Not For Profit -0.004 (0.003) -1.11 -0.002 (0.005) -0.39 0.009 (0.012) 0.80 0.009 (0.011) 0.79
Government Ownership -0.181 (0.010)
-
18.52*** -0.163 (0.014)
-
12.04*** -0.112 (0.089) -1.26 -0.115 (0.088) -1.31
Population Size -0.007 (0.003) -1.89* -0.008 (0.003) -2.38** -0.030 (0.008) -3.70*** -0.026 (0.008) -3.49***
Proportion - Female 1.331 (0.789) 1.69* 1.965 (0.995) 1.98** 14.455 (5.159) 2.80*** 12.100 (4.806) 2.52**
Proportion (age 0-17) -2.176 (0.366) -5.94*** -2.280 (0.403) -5.66*** -1.856 (1.438) -1.29 -1.894 (1.421) -1.33
Proportion (18-44) -0.760 (0.321) -2.37** -0.405 (0.355) -1.14 1.445 (1.550) 0.93 1.033 (1.503) 0.69
Proportion (45-64) -0.192 (0.425) -0.45 -0.002 (0.464) 0.00 0.785 (1.553) 0.51 0.757 (1.534) 0.49
Proportion - Black 0.195 (0.040) 4.86*** 0.178 (0.050) 3.59*** 1.064 (0.797) 1.33 0.622 (0.720) 0.86
Proportion - Asian 0.576 (0.329) 1.75* 0.844 (0.360) 2.34** 2.488 (1.769) 1.41 1.112 (1.439) 0.77
Proportion - Amer Indian -0.258 (0.154) -1.68* -0.160 (0.214) -0.75 -7.081 (4.612) -1.54 -9.887 (4.082) -2.42**
Proportion - Pacific 9.619 (2.892) 3.33*** 12.696 (3.868) 3.28*** 57.748 (51.183) 1.13 84.054 (46.877) 1.79*
Proportion - Oth Race -3.720 (0.949) -3.92*** -4.189 (1.260) -3.32*** 0.289 (8.353) 0.03 -3.339 (7.828) -0.43
Proportion - Emp Ins -0.162 (0.111) -1.46 -0.128 (0.111) -1.15 -0.178 (0.169) -1.05 -0.123 (0.162) -0.76
Proportion - Priv Ins -0.606 (0.135) -4.51*** -0.479 (0.137) -3.50*** -0.286 (0.229) -1.25 -0.239 (0.223) -1.07

Page 35 of 52
Proportion - Medicaid -0.260 (0.138) -1.88* -0.185 (0.135) -1.37 -0.016 (0.200) -0.08 0.005 (0.197) 0.02
Proportion - Medicare -0.227 (0.267) -0.85 -0.282 (0.232) -1.22 -0.452 (0.267) -1.70* -0.423 (0.263) -1.61
Obesity -0.001 (0.001) -0.92 -0.001 (0.001) -1.04 0.0001 (0.001) 0.17 0.0001 (0.001) 0.14
Proportion - Smoke Daily 0.001 (0.001) 1.36 0.001 (0.001) 0.66 0.001 (0.002) 0.28 0.001 (0.002) 0.36
Proportion - Drink
Heavily 0.002 (0.002) 1.07 0.001 (0.002) 0.74
-
0.00001 (0.002) -0.01 0.0003 (0.002) 0.12
Child Death Rate -0.008 (0.005) -1.54 -0.002 (0.005) -0.38 0.002 (0.005) 0.37 0.001 (0.005) 0.30
Number of Teaching
Hospitals 0.001 (0.0004) 3.40*** 0.001 (0.0005) 2.17** 0 (omitted)
-0.0001 (0.003) -0.05
Illegal Immigrant 0.060 (0.022) 2.76*** -0.0001 (0.006) -0.03 0.014 (0.035) 0.40 0.030 (0.032) 0.95
State ED Market -0.008 (0.006) -1.31 0.049 (0.021) 2.30** 0.019 (0.010) 1.92* 0.020 (0.010) 2.02**
Senator Mean 0.043 (0.018) 2.41** 0.040 (0.017) 2.43** 0.028 (0.020) 1.39 0.032 (0.019) 1.65*
Senator Deviation -0.008 (0.006) -1.24 -0.005 (0.006) -0.77 0.007 (0.007) 1.02 0.006 (0.007) 0.87
Number of Democratic
Senators -0.015 (0.007) -2.22** -0.015 (0.006) -2.32** -0.017 (0.008) -2.24** -0.017 (0.007) -2.32**
Gov_demo -0.006 (0.004) -1.49 -0.008 (0.003) -2.51** -0.006 (0.004) -1.51 -0.007 (0.004) -1.77*
Gov_ind -0.020 (0.018) -1.12 -0.008 (0.015) -0.51 0.021 (0.017) 1.23 0.019 (0.016) 1.17
Median Income 0.003 (0.001) 3.93*** 0.003 (0.001) 3.58*** 0.001 (0.001) 1.23 0.001 (0.001) 0.98
Proportion - Inpatient
Days - Medicare -0.305 (0.008)
-
38.07*** -0.258 (0.009)
-
27.37*** -0.173 (0.014)
-
11.98*** -0.173 (0.014)
-
12.12***
Proportion - Inpatient
Days - Medicaid 0.049 (0.010) 4.88*** 0.039 (0.011) 3.46*** 0.010 (0.015) 0.70 0.010 (0.015) 0.69
Unemployment Rate -0.152 (0.124) -1.23 -0.263 (0.109) -2.43** -0.240 (0.171) -1.40 -0.261 (0.168) -1.55
GDP 0.104 (0.083) 1.26 0.100 (0.073) 1.38 0.290 (0.101) 2.86*** 0.259 (0.098) 2.65***
Constant 0.957 (0.533) 1.79 0.458 (0.655) 0.70 -6.921 (3.446) -2.01 -5.330 (3.214) -1.66
N 21764 21764 21764 21764 * indicates statistical significance at the 10% level
** indicates statistical significance at the 5% level
*** indicates statistical significance at the 1% level
Page 36 of 52
Table 5: Effects of CON Indicator and its stringency on Inpatient utilization
CON Stringency as Endogenous
Cross Sectional Random Effect Fixed Effect Hausman Taylor
Variables Coef. Std.
Error
Test
Stat Coef.
Std.
Error
Test
Stat Coef.
Std.
Error
Test
Stat Coef.
Std.
Error
Test
Stat
CON Indicator -0.016 (0.012) -1.34 -0.015 (0.013) -1.19
-0.210 (0.098)
-
2.14**
CON Stringency
- Service -0.044 (0.036) -1.22 -0.030 (0.029) -1.05 -0.003 (0.033) -0.10 -0.001 (0.008) -0.08
Full Time
Physicians and
Dentists
-
0.000
04
(0.0000
3) -1.35
-
0.000
03
(0.0000
3) -0.91
-
0.000
01
(0.0001
) -0.23
0.000
03
(0.0000
5) 0.69
Full Time
Nurses
0.000
1
(0.0000
1)
16.83*
**
0.000
1
(0.0000
1)
12.15*
**
0.000
02
(0.0000
2) 0.87
0.000
03
(0.0000
2) 1.63
Member of
Council of
Teaching 0.001 (0.008) 0.16 0.014 (0.011) 1.28 0.003 (0.022) 0.13 0.018 (0.021) 0.89
Resident
Training
Approval 0.013 (0.005)
2.64**
* 0.019 (0.006)
3.05**
* -0.002 (0.010) -0.18 0.003 (0.010) 0.32
JCAHO
Accreditation 0.088 (0.004)
23.42*
** 0.059 (0.004)
13.08*
** -0.011 (0.007) -1.52 -0.010 (0.007) -1.48
Not For Profit -0.003 (0.003) -0.98 -0.002 (0.005) -0.38 0.009 (0.012) 0.80 0.012 (0.011) 1.07
Government -0.182 (0.010) - -0.164 (0.014) - -0.112 (0.089) -1.26 0.021 (0.072) 0.30

Page 37 of 52
Ownership 18.57*
**
12.10*
**
Population Size
-0.008 (0.004)
-
2.23** -0.007 (0.003)
-
2.23** -0.029 (0.009)
-
3.42**
* -0.034 (0.008)
-
4.55**
*
Proportion -
Female 0.439 (1.063) 0.41 1.383 (1.130) 1.22
14.56
8 (5.349)
2.72**
*
17.05
0 (4.888)
3.49**
*
Proportion (age
0-17) -1.706 (0.507)
-
3.36**
* -2.161 (0.414)
-
5.22**
* -1.829 (1.472) -1.24 -1.496 (1.380) -1.08
Proportion (18-
44) -0.725 (0.322)
-
2.25** -0.416 (0.355) -1.17 1.535 (1.943) 0.79 1.723 (1.490) 1.16
Proportion (45-
64) 0.272 (0.545) 0.50 0.173 (0.487) 0.36 0.867 (1.854) 0.47 0.891 (1.496) 0.60
Proportion -
Black 0.186 (0.041)
4.58**
* 0.176 (0.050)
3.54**
* 1.092 (0.874) 1.25 0.398 (0.733) 0.54
Proportion -
Asian 1.000 (0.471) 2.12** 0.946 (0.374) 2.53** 2.464 (1.794) 1.37 3.173 (1.688) 1.88*
Proportion -
Amer Indian -0.185 (0.164) -1.13 -0.120 (0.217) -0.56 -7.181 (4.757) -1.51 -3.900 (4.305) -0.91
Proportion -
Pacific
11.74
1 (3.281)
3.58**
*
14.05
6 (4.037)
3.48**
*
57.73
1
(51.122
) 1.13
45.81
7
(49.132
) 0.93
Proportion - Oth
Race -4.831 (1.285)
-
3.76**
* -4.799 (1.377)
-
3.49**
* 0.272 (8.336) 0.03 4.941 (7.885) 0.63
Proportion -
Emp Ins -0.151 (0.112) -1.36 -0.179 (0.120) -1.49 -0.187 (0.209) -0.89 -0.153 (0.162) -0.95
Proportion - Priv
Ins -0.441 (0.179)
-
2.47** -0.433 (0.141)
-
3.07**
* -0.290 (0.231) -1.26 -0.285 (0.220) -1.29
Proportion -
Medicaid -0.218 (0.142) -1.54 -0.215 (0.137) -1.56 -0.025 (0.236) -0.11 0.036 (0.192) 0.19
Proportion - 0.003 (0.322) 0.01 -0.239 (0.236) -1.01 -0.456 (0.273) -1.67* -0.445 (0.257) -1.73*

Page 38 of 52
Medicare
Obesity -0.001 (0.001) -1.43 -0.001 (0.001) -1.24
0.000
2 (0.001) 0.18
0.000
1 (0.001) 0.12
Proportion -
Smoke Daily 0.003 (0.002) 1.88* 0.001 (0.001) 1.19 0.001 (0.002) 0.29 0.001 (0.002) 0.42
Proportion -
Drink Heavily 0.004 (0.003) 1.72* 0.002 (0.002) 1.05
-
0.000
02 (0.002) -0.01 -0.001 (0.002) -0.25
Child Death Rate -0.007 (0.005) -1.29 -0.001 (0.005) -0.17 0.002 (0.005) 0.36 0.002 (0.005) 0.50
Number of
Teaching
Hospitals 0.001 (0.001) 1.01 0.001 (0.001) 1.25
0.002 (0.003) 0.72
Illegal
Immigrant 0.037 (0.029) 1.29 0.031 (0.026) 1.18 0.013 (0.036) 0.37 0.004 (0.033) 0.11
State ED Market 0.002 (0.010) 0.22 0.002 (0.006) 0.33 0.019 (0.010) 1.92* 0.021 (0.010) 2.21**
Senator Mean 0.034 (0.019) 1.79* 0.040 (0.017) 2.42** 0.028 (0.020) 1.39 0.025 (0.019) 1.30
Senator
Deviation -0.009 (0.007) -1.45 -0.005 (0.006) -0.89 0.007 (0.007) 0.97 0.008 (0.007) 1.20
Number of
Democratic
Senators -0.011 (0.007) -1.58 -0.015 (0.006)
-
2.42** -0.017 (0.008)
-
2.21** -0.016 (0.007)
-
2.23**
Gov_demo
-0.012 (0.006) -1.93* -0.010 (0.004)
-
2.72**
* -0.006 (0.004) -1.51 -0.007 (0.004) -1.62
Gov_ind -0.025 (0.018) -1.38 -0.009 (0.015) -0.60 0.021 (0.017) 1.24 0.018 (0.016) 1.11
Median Income 0.003 (0.001)
3.73**
* 0.003 (0.001)
3.75**
* 0.001 (0.001) 1.17 0.001 (0.001) 1.32
Proportion -
Inpatient Days -
Medicare -0.307 (0.008)
-
37.82*
** -0.259 (0.009)
-
27.44*
** -0.173 (0.014)
-
11.99*
** -0.173 (0.014)
-
12.45*
**
Proportion -
Inpatient Days -
Medicaid 0.048 (0.010)
4.75**
* 0.039 (0.011)
3.43**
* 0.010 (0.015) 0.70 0.010 (0.014) 0.72

Page 39 of 52
Unemployment
Rate -0.278 (0.158) -1.75* -0.291 (0.112)
-
2.60**
* -0.234 (0.183) -1.28 -0.230 (0.165) -1.40
GDP 0.111 (0.083) 1.34 0.110 (0.073) 1.50 0.292 (0.104)
2.82**
* 0.300 (0.098)
3.07**
*
Constant 1.095 (0.547) 2.00 0.686 (0.689) 1.00
-8.370 (3.243) -2.58
N 21764 21764 21764 21764 * indicates statistical significance at the 10% level
** indicates statistical significance at the 5% level
*** indicates statistical significance at the 1% level

Page 40 of 52
Table 6: Effects of CON Indicator and its stringency on Inpatient LOS
CON Law and Stringency as exogenous
Cross Sectional Random Effect Hausman Taylor
Variables Coef. Std.
Error
Test
Stat Coef.
Std.
Error Test Stat Coef. Std. Error
Test
Stat
CON Indicator -0.598 (2.484) -0.24 -0.647 (2.563) -0.25 -352.174 (198.490) -1.77*
CON Stringency - Service -4.430 (2.227) -1.99** -3.741 (2.265) -1.65* 5.040 (8.606) 0.59
Full Time Physicians and
Dentists 0.019 (0.019) 1.01 0.019 (0.019) 0.97 0.014 (0.063) 0.22
Full Time Nurses -0.003 (0.004) -0.72 -0.003 (0.004) -0.71 -0.008 (0.024) -0.33
Member of Council of
Teaching -5.132 (3.740) -1.37 -4.812 (3.860) -1.25 3.488 (22.129) 0.16
Resident Training Approval -1.014 (2.203) -0.46 -0.988 (2.275) -0.43 2.195 (11.155) 0.20
JCAHO Accreditation 2.821 (1.815) 1.55 2.903 (1.863) 1.56 7.642 (7.224) 1.06
Not For Profit -4.533 (1.563) -2.90*** -4.503 (1.628) -2.77*** 1.136 (11.916) 0.10
Government Ownership -28.673 (4.414) -6.50*** -26.962 (4.553) -5.92*** 8538.173 (14745.080) 0.58
Population Size 2.560 (1.151) 2.22** 2.190 (1.144) 1.91* 7.341 (5.880) 1.25
Proportion - Female 1643.176 (358.770) 4.58*** 1512.419 (367.788) 4.11*** -2042.432 (3680.587) -0.55
Proportion (age 0-17) 4.879 (157.175) 0.03 14.404 (159.233) 0.09 -2307.086 (969.887) -2.38**
Proportion (18-44) -29.959 (137.803) -0.22 -29.335 (140.330) -0.21 1184.213 (1179.199) 1.00
Proportion (45-64) 99.716 (167.818) 0.59 110.956 (171.135) 0.65 -313.390 (1003.778) -0.31
Proportion - Black -50.071 (16.526) -3.03*** -45.293 (16.992) -2.67*** 1874.862 (810.805) 2.31**
Proportion - Asian -47.724 (118.445) -0.40 -65.566 (121.691) -0.54 -3999.068 (1817.364) -2.20**
Proportion - Amer Indian 293.274 (55.120) 5.32*** 266.567 (57.229) 4.66*** -25157.630 (4864.013)
-
5.17***
Proportion - Pacific 1839.159 (613.148) 3.00*** 1749.532 (634.577) 2.76*** -81004.590 (31775.800) -2.55**
Proportion - Oth Race -799.957 (365.725) -2.19** -721.980 (380.186) -1.90* 22664.270 (5909.519) 3.84***
Proportion - Emp Ins -167.681 (51.632) -3.25*** -152.505 (51.706) -2.95*** -135.674 (177.827) -0.76
Proportion - Priv Ins -367.656 (60.889) -6.04*** -326.543 (60.915) -5.36*** -33.300 (212.861) -0.16
Proportion - Medicaid -139.193 (58.999) -2.36** -118.809 (59.253) -2.01** -97.808 (211.124) -0.46

Page 41 of 52
Proportion - Medicare -170.360 (110.995) -1.53 -141.525 (109.432) -1.29 -133.699 (246.130) -0.54
Obesity 0.206 (0.295) 0.70 0.210 (0.293) 0.72 0.212 (0.778) 0.27
Proportion - Smoke Daily -0.786 (0.401) -1.96** -0.718 (0.402) -1.79* 0.536 (1.733) 0.31
Proportion - Drink Heavily 0.589 (0.764) 0.77 0.473 (0.767) 0.62 -0.224 (2.284) -0.10
Child Death Rate -2.751 (1.991) -1.38 -2.454 (1.951) -1.26 -1.689 (4.421) -0.38
Senator Mean -2.466 (7.515) -0.33 -1.948 (7.547) -0.26 11.397 (20.685) 0.55
Senator Deviation -6.510 (2.741) -2.38** -6.983 (2.721) -2.57** -14.715 (6.328) -2.33**
Number of Democratic
Senators 0.048 (2.851) 0.02 0.064 (2.864) 0.02 -5.050 (8.148) -0.62
Gov_demo 4.824 (1.545) 3.12*** 4.335 (1.529) 2.83*** -1.673 (3.796) -0.44
Gov_ind -3.991 (6.316) -0.63 -4.716 (6.161) -0.77 -7.972 (13.597) -0.59
Illegal Immigrant -10.290 (7.789) -1.32 -7.967 (7.809) -1.02 -3.759 (34.381) -0.11
Median Income 0.644 (0.315) 2.05** 0.697 (0.314) 2.22** 1.500 (1.089) 1.38
State ED Market -6.824 (2.272) -3.00*** -5.940 (2.260) -2.63*** -6.608 (9.346) -0.71
Proportion - Inpatient Days -
Medicare -47.045 (4.429)
-
10.62*** -44.401 (4.512) -9.84*** -8.556 (15.723) -0.54
Proportion - Inpatient Days -
Medicaid -33.167 (3.799) -8.73*** -30.980 (3.841) -8.07*** -3.838 (10.259) -0.37
Constant -644.118 (254.947) -2.53** -607.867 (261.232) -2.33** 1028.359 (2384.377) 0.43
N 4452
4452
4452

Page 42 of 52
APPENDIX
Table A.1: Variable description and data source
No Variables
Detail
Level Type Data source
1 Inpatient Days Hospital Dependent www.aha.org
2
Hospital variables such as type of
hospital (not for profit, government
ownership, etc.), number of full
time physicians and nurses, etc. Hospital Independent www.aha.org
3 Extent of Con - stringent, None etc. State Independent Hellinger (2009) see reference section for more details
4 CON Law characteristics State Independent http://www.ahpanet.org/websites_copn.html
5 Age distribution State Independent http://www.census.gov/popest/estbygeo.html
6 Race Distribution State Independent
http://factfinder.census.gov/servlet/DatasetMainPageServlet?
_program=PEP
7 Population County Independent http://www.census.gov/popest/data/
8 Illegal immigrant State Independent
http://immigrationroad.com/resource/illegal-immigrants-by-
state.php
9
% of uninsured, medicaid, medicare
patients in state State Independent
http://www.statehealthfacts.org/profileind.jsp?cmprgn=1&ca
t=3&rgn=12&ind=125&sub=39
10 Percentage of obese population State Independent www.cdc.gov
11
Percentage of population that smoke
daily State Independent www.cdc.gov
12
Percentage of population that drink
heavily State Independent www.cdc.gov
13 Child death rate State Independent www.cdc.gov
14 ED patient market State Independent http://kff.org/other/state-indicator/emergency-room-visits/

Page 43 of 52
15
Inpatient days covered by Medicare
and Medicaid State Independent www.aha.org
16 Median Income State Independent http://www.bea.gov/regional/gsp/
17 GDP State Independent http://www.bea.gov/regional/gsp/
18 Senators State Voting Record State Independent http://www.adaaction.org/
19 Party in Power State Independent
http://www.nga.org/cms/home/governors/past-governors-
bios.html;jsessionid=567B4C3B27E3CF6210B93BC608D3
FED5
20 GINI coefficient State Instrumental www.census.gov
21 Technology index State Instrumental http://www.milkeninstitute.org/tech/tech2010.taf?sub=tswf

Page 44 of 52
Table A.2: Variable categorization and description
Variable name Variable Description
Outcome Variable
Inpatient Utilization Measure built using Inpatient
days and beds in a hospital
Inpatient LOS Measure built using Inpatient
days and Inpatient discharges
from a hospital
Independent Variables
CON Law
CON Indicator Dummy variable for con law
coverage
Stringency Index - Service Index of strictness of con
threshold on service, can take
values between 0 and 1
Hospital Characteristics
Full Time Physicians and Dentists Number of full time physicians
and dentists in a hospital
Full Time Nurses Number of full time nurses in a
hospital
Member of Council of Teaching Dummy variable – whether
hospital is a member of council
of teaching
Resident Training Approval Dummy variable – whether
hospital has approval for
resident training
JCAHO Accreditation Dummy variable – whether
hospital has Joint Commission
of Healthcare Organizations
Accreditation (JCAHO)
Not For Profit Dummy variable – whether
hospital is not for profit

Page 45 of 52
Government Ownership Dummy variable – whether
hospital has government
ownership
Demographics
Population Size Population size (millions)
Proportion - Female Proportion of female
Proportion (age 0-17) Proportion of people aged 17 or
under
Proportion (18-44) Proportion of people aged
between 18 and 44
Proportion (45-64) Proportion of people aged
between 45 and 64
Proportion - Black Proportion of population that is
Black
Proportion - Asian Proportion of population that is
Asian
Proportion - Amer Indian Proportion of population that is
American Indian
Proportion - Pacific Proportion of population that is
Pacific Islander
Proportion - Oth Race Proportion of population that
belongs to two or more races
Illegal Immigrant Illegal immigrants (millions)
Health Status
Obesity Proportion of population that is
obese
Proportion - Smoke Daily Proportion of population that
smoke daily
Proportion - Drink Heavily Proportion of population that
drink heavily

Page 46 of 52
Child Death Rate Death rate of children 5 and
under
Health Care Access and Supply
Proportion - Emp Ins Proportion of individuals with
employer provided insurance
Proportion - Priv Ins Proportion of individuals with
privately purchased insurance
Proportion - Medicaid Proportion of individuals with
Medicaid
Proportion - Medicare Proportion of individuals with
Medicare
Proportion of Population – ED
Services
Proportion of State population
that has availed Emergency
Department Services
TeachHosp_Num
Number of Teaching Hospitals
Economic and Political Environment
Median Income Median Income
GDP State gross domestic product
Senator Mean Mean of “yes” votes of the state
senators
Senator Deviation Absolute deviation in the voting
record of the state senators
Gov_demo Dummy variable of Democratic
party governor
Gov_ind Dummy variable of governor
who is an Independent
Unemployment Rate Self-explanatory
Proportion - Inpatient Days - Proportion of Inpatientdays

Page 47 of 52
Medicare covered by Medicare
Proportion - Inpatient Days -
Medicaid
Proportion of Inpatientdays
covered by Medicaid
Instrumental Variables
GINI Gini Index (measure of
Inequality)
Tech Index Index of Science & Technology

Page 48 of 52
Table A.3: First stage regression of CON Indicator on exogenous variables
CON Law as Endogenous
Cross Sectional Random Effect
Variables Coef. Std.
Error
Test
Stat Coef.
Std.
Error Test Stat
Full Time Physicians and Dentists -0.00001 (0.00003) -0.37 0.000003 (0.00003) 0.12
Full Time Nurses 0.00001 (0.00001) 1.46 -0.000001 (0.00001) -0.11
Member of Council of Teaching -0.008 (0.009) -0.85 0.003 (0.009) 0.35
Resident Training Approval -0.005 (0.005) -0.95 0.004 (0.005) 0.84
JCAHO Accreditation 0.027 (0.004) 6.60*** 0.025 (0.004) 6.79***
Not For Profit 0.027 (0.004) 7.35*** 0.030 (0.004) 8.20***
Government Ownership 0.019 (0.011) 1.82* 0.011 (0.011) 1.01
Population Size -0.086 (0.004)
-
22.66*** -0.056 (0.003)
-
20.22***
Proportion - Female 37.555 (0.929) 40.42*** 30.547 (0.855) 35.73***
Proportion (age 0-17) -12.324 (0.384)
-
32.10*** -9.522 (0.325)
-
29.31***
Proportion (18-44) 9.555 (0.402) 23.77*** 6.743 (0.332) 20.28***
Proportion (45-64) -1.851 (0.449) -4.12*** -0.656 (0.388) -1.69*
Proportion - Black 0.620 (0.046) 13.50*** 0.918 (0.043) 21.43***
Proportion - Asian -0.186 (0.337) -0.55 2.115 (0.282) 7.49***
Proportion - Amer Indian -5.087 (0.169)
-
30.15*** -5.675 (0.175)
-
32.35***
Proportion - Pacific 15.694 (2.944) 5.33*** 15.523 (2.899) 5.36***
Proportion - Oth Race 31.668 (0.557) 56.85*** 27.849 (0.575) 48.43***
Proportion - Emp Ins 2.286 (0.127) 17.99*** 0.472 (0.093) 5.06***
Proportion - Priv Ins -2.583 (0.140)
-
18.39*** -2.654 (0.111)
-
24.00***
Proportion - Medicaid 1.771 (0.149) 11.85*** 0.015 (0.108) 0.14
Proportion - Medicare -2.397 (0.288) -8.33*** -1.051 (0.189) -5.57***
Obesity -0.002 (0.001) -2.00** -0.001 (0.001) -1.18
Proportion - Smoke Daily -0.034 (0.001)
-
25.58*** -0.013 (0.001)
-
13.61***
Proportion - Drink Heavily 0.042 (0.002) 22.36*** 0.024 (0.001) 16.29***
Child Death Rate -0.076 (0.006)
-
13.48*** -0.030 (0.004) -8.35***
Number of Teaching Hospitals -0.008 (0.0005)
-
17.70*** -0.006 (0.0004)
-
14.03***
Illegal Immigrant 0.225 (0.024) 9.49*** 0.021 (0.017) 1.23
State ED Market 0.147 (0.006) 23.34*** 0.100 (0.005) 20.79***
Senator Mean -0.220 (0.020)
-
10.97*** -0.070 (0.014) -5.00***
Senator Deviation 0.097 (0.007) 13.77*** 0.051 (0.005) 10.40***

Page 49 of 52
Number of Democratic Senators 0.156 (0.007) 21.49*** 0.084 (0.005) 16.08***
Gov_demo 0.032 (0.004) 8.03*** -0.014 (0.003) -5.30***
Gov_ind -0.330 (0.019)
-
17.02*** -0.173 (0.012)
-
13.99***
Median Income 0.008 (0.001) 9.71*** 0.003 (0.001) 4.59***
Proportion - Inpatient Days -
Medicare -0.013 (0.009) -1.46 -0.011 (0.008) -1.44
Proportion - Inpatient Days -
Medicaid 0.020 (0.011) 1.79* 0.006 (0.009) 0.61
Unemployment Rate 0.474 (0.135) 3.51*** -0.515 (0.089) -5.78***
GDP 0.367 (0.090) 4.09*** 0.138 (0.060) 2.29**
Tech Index -0.025 (0.0003)
-
73.00*** -0.015 (0.0003)
-
54.95***
GINI 0.0002 (0.0001) 3.76*** -0.0001 (0.00004) -2.11**
Constant -18.379 (0.639) -28.78 -14.256 (0.578) -24.66
N 22963 22963
* indicates statistical significance at the 10% level
** indicates statistical significance at the 5% level
*** indicates statistical significance at the 1% level

Page 50 of 52
Table A.4: First stage regression of CON Stringency on exogenous variables
CON Stringency as Endogenous
Cross Sectional Random Effect Fixed Effect
Variables Coef. Std.
Error
Test
Stat Coef.
Std.
Error
Test
Stat Coef.
Std.
Error
Test
Stat
CON Indicator 0.232 (0.007) 33.59*** 0.274 (0.008) 35.04***
Full Time Physicians and Dentists
-
0.00001 (0.00003) -0.38
-
0.00001 (0.00003) -0.45
-
0.00002 (0.00003) -0.75
Full Time Nurses -
0.00002 (0.00001) -2.01**
-
0.00002 (0.00001) -1.91* 0.00002 (0.00001) 1.69*
Member of Council of Teaching 0.020 (0.009) 2.12** 0.016 (0.010) 1.55 -0.024 (0.015) -1.62
Resident Training Approval -0.002 (0.006) -0.31 0.002 (0.006) 0.37 -0.012 (0.007) -1.74*
JCAHO Accreditation 0.016 (0.004) 3.73*** 0.011 (0.004) 2.40** 0.009 (0.005) 2.03***
Not For Profit 0.009 (0.004) 2.41** 0.003 (0.004) 0.56 0.011 (0.008) 1.5
Government Ownership -0.022 (0.011) -1.96** -0.018 (0.013) -1.34 0.040 (0.058) 0.68
Population Size -0.021 (0.004) -5.23*** 0.026 (0.003) 7.81*** 0.076 (0.005) 14.43***
Proportion - Female -6.509 (1.059) -6.15*** -1.904 (1.093) -1.74* 65.701 (3.406) 19.29***
Proportion (age 0-17) 8.113 (0.420) 19.31*** 2.866 (0.395) 7.25*** 20.534 (0.986) 20.82***
Proportion (18-44) 6.019 (0.433) 13.91*** 6.855 (0.406) 16.90*** 38.784 (0.989) 39.21***
Proportion (45-64) 11.123 (0.487) 22.82*** 9.510 (0.469) 20.30*** 44.916 (1.056) 42.53***
Proportion - Black -0.465 (0.048) -9.64*** -0.335 (0.051) -6.51*** 11.777 (0.518) 22.74***
Proportion - Asian 8.609 (0.386) 22.31*** 4.169 (0.356) 11.71*** -17.122 (1.211)
-
14.14***
Proportion - Amer Indian 2.187 (0.181) 12.09*** 2.402 (0.213) 11.25*** 5.997 (3.152) 1.90*
Proportion - Pacific 32.191 (3.348) 9.62*** 29.406 (3.805) 7.73*** 101.665 (33.626) 3.02***
Proportion - Oth Race -14.696 (1.165)
-
12.62*** -10.750 (1.278) -8.41*** -7.410 (5.585) -1.33
Proportion - Emp Ins 0.148 (0.135) 1.10 -2.171 (0.113)
-
19.26*** -3.896 (0.107)
-
36.47***
Proportion - Priv Ins 2.841 (0.156) 18.17*** 0.629 (0.138) 4.56*** -1.926 (0.151)
-
12.78***

Page 51 of 52
Proportion - Medicaid 0.552 (0.164) 3.38*** -1.765 (0.136)
-
13.02*** -3.735 (0.129)
-
29.06***
Proportion - Medicare 4.521 (0.309) 14.64*** 0.934 (0.230) 4.06*** -1.898 (0.175)
-
10.84***
Obesity -0.009 (0.001)
-
10.93*** -0.003 (0.001) -5.33*** 0.000 (0.001) -0.6
Proportion - Smoke Daily 0.012 (0.001) 8.66*** 0.001 (0.001) 0.65 -0.008 (0.001) -6.12***
Proportion - Drink Heavily 0.053 (0.002) 24.88*** 0.020 (0.002) 10.83*** -0.004 (0.002) -2.51**
Child Death Rate -0.002 (0.006) -0.29 0.004 (0.005) 0.91 -0.011 (0.003) -3.32***
Number of Teaching Hospitals -0.016 (0.0005)
-
34.11*** -0.011 (0.0005)
-
23.17***
Illegal Immigrant
-0.566 (0.025)
-
22.52*** -0.619 (0.021)
-
29.84*** -0.341 (0.023)
-
14.96***
State ED Market 0.207 (0.007) 30.62*** 0.085 (0.006) 14.72*** -0.002 (0.007) -0.35
Senator Mean -0.318 (0.021)
-
14.98*** -0.159 (0.017) -9.47*** -0.149 (0.013)
-
11.17***
Senator Deviation -0.035 (0.007) -4.68*** -0.028 (0.006) -4.76*** -0.050 (0.005)
-
10.94***
Number of Democratic Senators 0.107 (0.008) 13.80*** 0.030 (0.006) 4.77*** 0.014 (0.005) 2.68***
Gov_demo -0.116 (0.004)
-
26.94*** -0.049 (0.003)
-
14.70*** -0.003 (0.003) -0.97
Gov_ind -0.151 (0.020) -7.42*** -0.079 (0.015) -5.36*** 0.049 (0.011) 4.46***
Median Income 0.004 (0.001) 3.89*** 0.010 (0.001) 12.66*** 0.013 (0.001) 17.06***
Proportion - Inpatient Days -
Medicare -0.038 (0.009) -4.16*** -0.019 (0.009) -2.06*** 0.006 (0.009) 0.68
Proportion - Inpatient Days -
Medicaid -0.023 (0.012) -2.01** -0.018 (0.011) -1.61 0.001 (0.010) 0.09
Unemployment Rate -2.253 (0.143)
-
15.71*** -0.926 (0.108) -8.60*** 2.241 (0.112) 20.00***
GDP 0.047 (0.095) 0.49 0.036 (0.072) 0.49 0.581 (0.066) 8.78***
Tech Index -0.010 (0.0004)
-
23.58*** -0.011 (0.0004)
-
30.90*** -0.011 (0.000)
-
24.04***
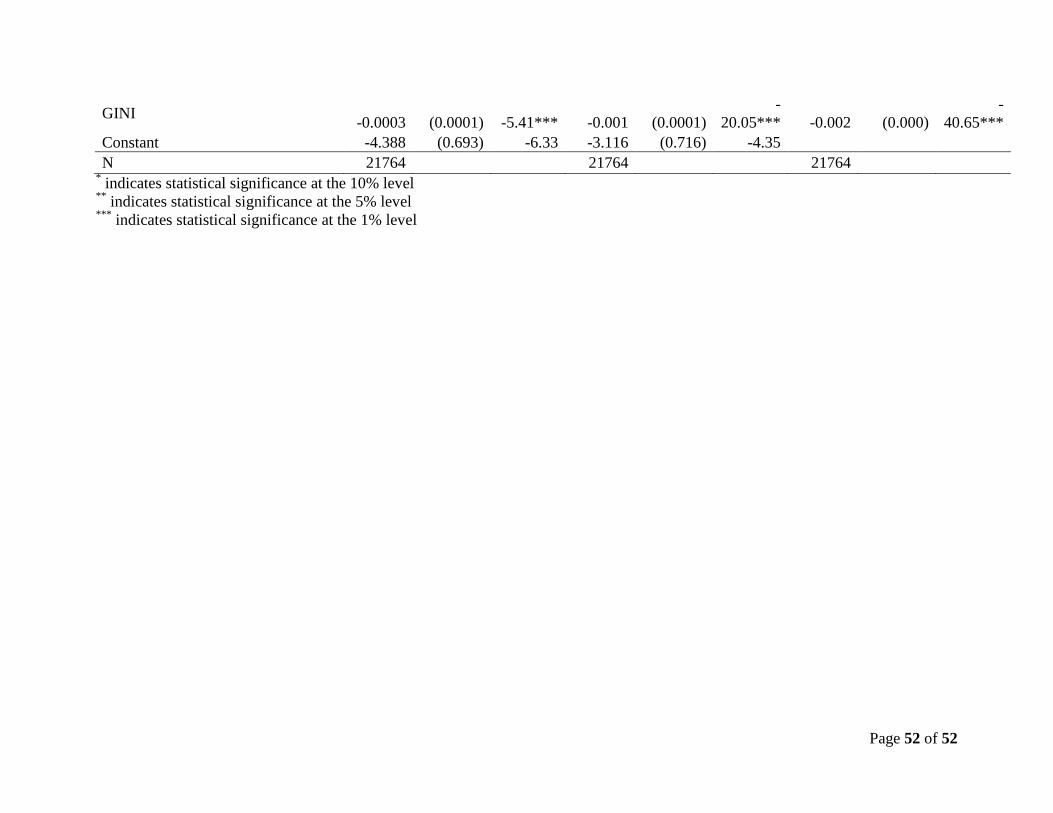
Page 52 of 52
GINI -0.0003 (0.0001) -5.41*** -0.001 (0.0001)
-
20.05*** -0.002 (0.000)
-
40.65***
Constant -4.388 (0.693) -6.33 -3.116 (0.716) -4.35
N 21764 21764 21764 * indicates statistical significance at the 10% level
** indicates statistical significance at the 5% level
*** indicates statistical significance at the 1% level