an empirical investigation of supply chain operations
TRANSCRIPT

An empirical investigationof supply chain operations
reference model practices andsupply chain performanceEvidence from manufacturing sector
Sri Yogi KottalaFaculty 7, LogDynamics, Bremen, Germany and
Department of Operations, School of Business Management,SVKM’s NMIMS University, Hyderabad Campus, Hyderabad, India, and
Kotzab HerbertDepartment of Business Studies and Economics,
University of Bremen, Bremen, Germany
AbstractPurpose – The purpose of this paper is to develop and validate a scale measurement of supply chain operationsreference (SCOR)-related performance indicators and proposed constructs, SCOR-related performance indicatorsas practices within the Indian manufacturing sector.Design/methodology/approach – A literature-based model on SCOR processes with five constructs andrespective performance indicators was empirically validated by using a structured questionnaire. A total of 155respondents among Indian manufacturing sector participated in this research, and the returned questionnaireswere analyzed by using structural equation modeling.Findings – The study established a relationship among the SCOR-related performance indicators and overallsupply chain performance indicators (OSCPI). The moderation effect of demographic characteristics, namely,employee size, company age and type of company showed significant differences between SCOR-relatedperformance indicators and overall supply chain indicators.Research limitations/implications – The scope of the study is limited to specific Indian manufacturingfirms. The survey could not represent whole population of manufacturing sector.Practical implications – The findings assist managers/supply chain practitioners in improving theperformance measures identified using the standard framework, i.e., SCOR processes, overall supply chainperformance measures as standard practices for Indian manufacturing sector for a profitable and sustainablebusiness growth in global environment.Originality/value – This research holds a value for suggested practices under SCOR processes and theproposed model for OSCPI, a path finder/performance measurement tool for supply chain professionals inthe Indian context.Keywords ANOVA, SEM, SCOR model, CFA, Multiple regression, Moderation effectPaper type Research paper
1. IntroductionThe supply chain operations reference (SCOR) model was developed by the SupplyChain Council (SCC) in the late 1990’s and focuses on the operational aspects of supply chainmanagement (SCM) (see Huang et al., 2004). Today it is the most recognized and consistentSCM framework including seven core business processes, performance evaluation and thebest practice (Figure 1).
SCOR also includes all customer interactions (order entry through invoice payment), allphysical transactions (including equipment, suppliers, spare parts, bulk products,software, etc.), and all market interactions ( from demand forecast to order fulfillment).
International Journal ofProductivity and Performance
Management© Emerald Publishing Limited
1741-0401DOI 10.1108/IJPPM-09-2018-0337
Received 3 October 2018Revised 23 February 2019Accepted 26 March 2019
The current issue and full text archive of this journal is available on Emerald Insight at:www.emeraldinsight.com/1741-0401.htm
Supply chainoperations

So far, a big number of leading companies and organizations have adopted the SCORframework as knowledge is available on the empirical validity of the framework. One of thefew works is by Zhou et al. (2011) who tested the power of the model for supply chainintegration among 125 manufacturing companies in the USA. Furthermore, there is littlework on examining the relationship between SCOR-related performance indicators and theirinfluence on the overall supply chain performance (SCP).
In this paper, an empirical validation of the SCOR model as a performancemeasurement system is performed in two ways. First, we have validated theSCOR-specific performance indicators in an Indian manufacturing context. Second, wetest the power of the model of being a SCP measurement system by finding out a positiveinfluence of the different SCOR-related performance indicators performance measureson overall supply chain performance indicators (OSCPI). In order to complete our goals,a literature-based conceptual model was set up that was empirically tested with asurvey among 155 Indian manufacturing companies. Our research is driven by these tworesearch questions:
RQ1. What are the SCOR-based supply chain performance indicators (SCPI) for theIndian manufacturing sector?
RQ2. What is the influential effect between SCOR-related performance indicators andoverall SCP measures for the Indian manufacturing sector?
By answering these questions we can close the identified research gaps as modeldevelopment and case application for measuring SCOR as a performance system is scarce.Our literature review showed no records of prior research work on adaptation of the SCORmodel for Indian manufacturing sector using empirical studies.
The paper comprises six sections. Section 2 sets the context of the research coveringIndian manufacturing development sectorial view, the literature-based model andhypotheses development used by this research. Section 3 describes the researchmethodology covering questionnaire design, sample size and data collection approachesused. Section 4 analyses the field work data, reporting the results to assess the SCOR-relatedperformance indicators as practices and overall SC performance indicators. Section 5describes discussion with highlights of SCOR-related performance indicator practices
Plan
Internal or External
Supplier CustomerYour OrganizationSuppliers’Supplier
Customers’Customer
Deliver
Return
Source: Adapted from the supply chain operations reference model Version 7, SupplyChain Council (2005)
Return
Source
Plan
Make
Enable
Deliver
Return Return
Source SourceDeliver
Plan
Make
Enable
Return ReturnReturn
Source Make Deliver
Return
Enable
Internal or External
SCOR MODELFigure 1.Applying the SCORmodel for Supplychain linkage
IJPPM

prioritized by respondents as well as hypothesis testing. Last section summarizesconclusions drawn related to the SCOR-related performance indicator practices and OSCPIin the Indian manufacturing sector.
2. The Indian manufacturing development sectorial viewStudies like Dhawan et al. (2015), PWC (2017) and Deloitte (2017) have presented anexponential performance of the Indian manufacturing sector over the past few years. Withthe remarkable growth in the different segments of the manufacturing sector, all eyes are seton how the future of the industry will shape up the new policy “Make in India” promoted bygovernment of India. A realistic assessment gives confidence that there is no dramaticdecline in store for the sector – whether globally or in India.
In fact, there are opportunities to tap into certain sectors for both champions of productivityand participants in global value chains. But at the same time, churning is bound to happen on alarge scale. There are success stories alongside closures. Winners and losers would getseparated across sectors and within India becoming a base for export to third world countries.
For example, Hyundai Motors is using India as export base for foreign markets, currentlyexporting to eight countries and looking forward to expand the same to markets in theEuropean Union and Latin America. The company has also set up an R&D center at itsChennai plant. India has world-class R&D facilities. It has come out as a global manufacturinghub with the presence of multinational companies (MNCs) such as LG, Samsung,Hyundai, Pepsi, GE, General Motors, Ford and Suzuki. India has increased implementationof state-of-the-art IT technologies, and presently, the IT usage is approximately 15 percent. Thesectors showing high potential are automobiles, textiles, steel, aluminum, cement, autoancillaries, forging and pharmaceuticals.
The manufacturing sector in India has been pioneering in SCM as well. Whether it is inautomobiles or technology, a large number of MNCs see India as favorable destination forinvestment. For instance, various companies in automobile industry plan to set up plants inIndia and those having their base plan for major expansion of their existing units. The world’sleading auto part makers have relocated their product lines to India. Many leading carmanufacturers are currently using India as a manufacturing and export base for their products.
According to 12th planning commission of India, an apex agency of Government of Indiapresently restructured as National Institution for Transforming India (NITI AYOG).Combinations of different manufacturing sector classified as Group A covers strategicimportance, i.e., defense equipment, aerospace, ship building and repair, commercial vehicles,electric motors, wagons, heavy locomotives. Second Group B covers basic input, namely, i.e.,steel, mineral exploration, fertilizer and cement. Third Group C covers depth and valueaddition, i.e., automobile, electronics, pharmaceutical, chemical, paper and textile, and fourthGroup D covers sector for employment: food processing, leather and leather goods, gems andjewelry. This classification was later used for our empirical study by labeling the respondingcompanies as Group A, Group B, Group C and Group D of companies for our easiness toperform statistical analysis to accomplish the research objectives.
3. Model development3.1 SCOR business processes as a supply chain performance viewCompanies perform plenty of processes in shaping a final product and, as part of performancemanagement, it is complex to understand/categorize these processes as key performanceindicators based on different levels. Thus, SCOR model comprising of plan, source, make deliverand return are an essence, a horizontal, abstract process architecture and methodology forcompanies that want to develop supply chain applications from performance perspective. SCORbusiness processes can be categorically applied at different levels, namely, Level 1, Level 2, Level 3
Supply chainoperations

and Level 4 mapping onto the management hierarchy, i.e., top, middle and lower or strategic,operational and tactical focus on performance measures of any manufacturing company.
Bolstorff (2006) classified balanced scored categories of supply chain for only Level 1metrics for different process models covering SCOR, DCOR and CCOR. We made anyattempt to view SCOR business processes from a SCP point of view in an empirical wayamong the Indian manufacturing sector. The SCOR reference model provides an overallarchitecture for supply chain systems, high-level processes and sub-processes, managementgoals and measures that companies can use and tailor to create their own individual supplychain systems from a performance perspective (see Table I).
Level 2 defines 26 core process categories that are possible components of a supply chain.Organizations can configure their ideal or actual operations using this process. Level 3provides the information required for successfully planning and setting goals for supply chainimprovements. This includes defining process element, setting target benchmarks, definingbest practices and system software capabilities to enable best practices. Level 4 focuses onimplementation, i.e., putting specific supply chain improvements into action. These are notdefined within an industry standardmodel as implementation can be unique to each company.
In the context of SCOR, Table II presents a linkage of SCP measures to eight of the fiveSCOR processes as well as their foundation in the literature.
However, few researchers, namely, Georgise et al. (2017), argued that existing models aredeveloped and tested based on the manufacturing sector of developed world. In developedcountries, well-designed and admirable infrastructure leads to quality of information andphysical goods flow among supply chain entities that is chaotic in Indian manufacturingsector. Most firms lack a clear vision to develop efficient performance metrics for SCP(Shepherd and Guenter, 2006). Sukati et al. (2012) argued that validating the SCP shouldinclude three different types of performance measurement – resources measurement (howwell the resource is sourced), output measurement (how well it delivers value to theconsumer), and flexibility (how flexible is the system to external uncertainties).
The manufacturing sector in emerging economies like India, and SCP measure usingSCOR is complicated as majority of Indian companies have not implementing the concept of
SCOR processes Relevant activities impact on supply chain performance
Plan Supply resources, aggregate and prioritize demand requirements, planinventory, distribution requirements, production, material andrough-cut capacity, long-term capacity and resource planning, productphase-in/phase-out
Source Infrastructure management, vendor certification and feedback,sourcing quality monitoring, vendor contracts receiving of materiallike: obtain, receive, inspect, hold and issue material
Make Production, execution production execution activities likemanufacturing, testing, packaging, holding and releasing of product,“make” infrastructure, engineering changes, facilities and equipmentmanagement, production status, production quality, shopscheduling/sequencing and short-term capacityOrder management, warehouse management and transportationmanagement, maintaining and entering orders, generating quotations,configuring products. Create and maintain customer database,maintain product and price database, managing receivables andcredit management
Warehouse management Pick-up, package, creating customer specific packaging/labeling,shipment of products
Transportation and deliveryinfrastructure management
Transportation management, traffic management, freightmanagement
Table I.Level 1 SCORprocesses
IJPPM
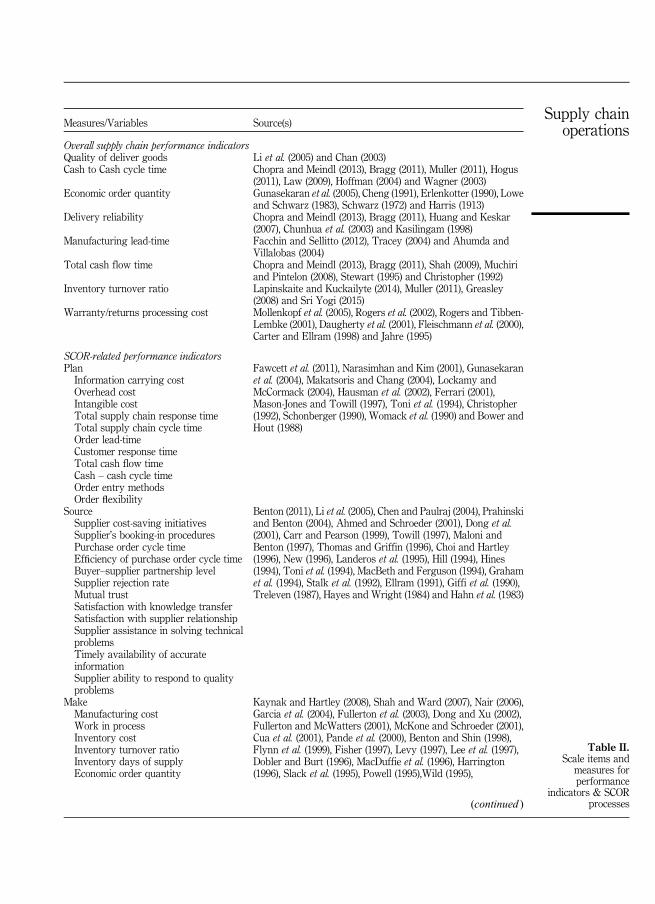
Measures/Variables Source(s)
Overall supply chain performance indicatorsQuality of deliver goods Li et al. (2005) and Chan (2003)Cash to Cash cycle time Chopra and Meindl (2013), Bragg (2011), Muller (2011), Hogus
(2011), Law (2009), Hoffman (2004) and Wagner (2003)Economic order quantity Gunasekaran et al. (2005), Cheng (1991), Erlenkotter (1990), Lowe
and Schwarz (1983), Schwarz (1972) and Harris (1913)Delivery reliability Chopra and Meindl (2013), Bragg (2011), Huang and Keskar
(2007), Chunhua et al. (2003) and Kasilingam (1998)Manufacturing lead-time Facchin and Sellitto (2012), Tracey (2004) and Ahumda and
Villalobas (2004)Total cash flow time Chopra and Meindl (2013), Bragg (2011), Shah (2009), Muchiri
and Pintelon (2008), Stewart (1995) and Christopher (1992)Inventory turnover ratio Lapinskaite and Kuckailyte (2014), Muller (2011), Greasley
(2008) and Sri Yogi (2015)Warranty/returns processing cost Mollenkopf et al. (2005), Rogers et al. (2002), Rogers and Tibben-
Lembke (2001), Daugherty et al. (2001), Fleischmann et al. (2000),Carter and Ellram (1998) and Jahre (1995)
SCOR-related performance indicatorsPlanInformation carrying costOverhead costIntangible costTotal supply chain response timeTotal supply chain cycle timeOrder lead-timeCustomer response timeTotal cash flow timeCash – cash cycle timeOrder entry methodsOrder flexibility
Fawcett et al. (2011), Narasimhan and Kim (2001), Gunasekaranet al. (2004), Makatsoris and Chang (2004), Lockamy andMcCormack (2004), Hausman et al. (2002), Ferrari (2001),Mason-Jones and Towill (1997), Toni et al. (1994), Christopher(1992), Schonberger (1990), Womack et al. (1990) and Bower andHout (1988)
SourceSupplier cost-saving initiativesSupplier’s booking-in proceduresPurchase order cycle timeEfficiency of purchase order cycle timeBuyer–supplier partnership levelSupplier rejection rateMutual trustSatisfaction with knowledge transferSatisfaction with supplier relationshipSupplier assistance in solving technicalproblemsTimely availability of accurateinformationSupplier ability to respond to qualityproblems
Benton (2011), Li et al. (2005), Chen and Paulraj (2004), Prahinskiand Benton (2004), Ahmed and Schroeder (2001), Dong et al.(2001), Carr and Pearson (1999), Towill (1997), Maloni andBenton (1997), Thomas and Griffin (1996), Choi and Hartley(1996), New (1996), Landeros et al. (1995), Hill (1994), Hines(1994), Toni et al. (1994), MacBeth and Ferguson (1994), Grahamet al. (1994), Stalk et al. (1992), Ellram (1991), Giffi et al. (1990),Treleven (1987), Hayes and Wright (1984) and Hahn et al. (1983)
MakeManufacturing costWork in processInventory costInventory turnover ratioInventory days of supplyEconomic order quantity
Kaynak and Hartley (2008), Shah and Ward (2007), Nair (2006),Garcia et al. (2004), Fullerton et al. (2003), Dong and Xu (2002),Fullerton and McWatters (2001), McKone and Schroeder (2001),Cua et al. (2001), Pande et al. (2000), Benton and Shin (1998),Flynn et al. (1999), Fisher (1997), Levy (1997), Lee et al. (1997),Dobler and Burt (1996), MacDuffie et al. (1996), Harrington(1996), Slack et al. (1995), Powell (1995),Wild (1995),
(continued )
Table II.Scale items and
measures forperformance
indicators & SCORprocesses
Supply chainoperations

SCOR processes explicitly as PMS. However, some common processes of SCOR are beingused as performance measures. Thus, we have made an attempt to suggest or prioritize theSCOR-based processes for enhancing the PMS among the Indian manufacturing sector forthe ease of implementation and using it as an exemplar from our empirical study and also asa distinctive view from developed economy.
3.2 Supply chain performanceOne of the major goals of SCM is the maximization of the effectiveness of a chain’s outcomeby providing superior service to the ultimate customer (e.g. Bowersox et al., 2010).Consequently, SCP is the bottom line for supply chain strategies, but it is difficult tomeasure as this includes the observation of economic components like sales volumes andcosts as well as qualitative components such as flexibility or delivery ability (e.g. Keeberet al., 1999; Van Hoek, 1998). Every supply chain manager knows this dilemma of balancingcosts, productivity, customer service and quality as well as financial benefits (see Brewerand Speh, 2000). However, supply chain performance measurement (SCPM) is recognized asan important tool for managing supply chain behavior and orientation (e.g. Karrer, 2003). Itspurpose is to establish supply chain goals, evaluate SCP and determine future supply chaindirections and activities (Gunasekaran et al., 2001, 2004).
When measuring SCP, it is necessary to identify the SCPI that constitute the overallperformance (see Lambert and Pohlen, 2001; Lebas, 1995). A SCPI is understood as anempirically observable numerical reference or illustration that is relevant for the supplychain success of an organization (see Neely, 2003; Lapide, 2000). SCPIs show regularly howwell supply chain processes are executed and how well they can be expressed in absolute orin relative terms (see e.g. Keebler et al., 1999).
For the measurement of SCPI, typically, the efficiency or the effectiveness of an outcomeof a supply chain activity is analyzed (e.g. Fugate et al., 2010). Efficiency describes aninput/output relation, whereas effectiveness shows how well supply chain goals have been
Measures/Variables Source(s)
Warehouse costsDisposal costsPlanned process cycle timeProduction flexibilityVolume flexibility
Pyke and Cohen (1994), Henig and Levin (1992), Lee andBillington (1992), Blackburn (1991), Nakajima (1988)and Hahn et al. (1983)
DeliverTotal logistics costsDistribution costsDelivery costsTransport costsDelivery efficiencyDelivery lead-timeQuality of delivered goodsQuality of delivery documentationFrequency of deliveryDelivery flexibilityTransport flexibility
SCC (2010), Garcia et al. (2004), Makatsoris and Chang (2004),Ha et al. (2003), Dong and Xu (2002), Hausman et al. (2002),Ahmad and Schroeder (2001), Goldsby and Stank (2000),Gurin (2000), Mapes et al. (1997), Lee et al. (1997), Thomas andGriffin (1996), Slack et al. (1995), Stewart (1995), Gelders et al.(1994), Hill (1994), Neely et al. (1994), Cavinato (1992), Henig andLevin (1992), Stalk et al. (1992), Rushton and Oxley (1991) andNovich (1990)
ReturnCustomer response timeLevel of customer perceived value ofproductCustomer complaintsRate of complaint
Luo et al. (2009), Luo and Homburg (2008), Santos andFernandes (2008), Landrum and Prybutok (2004), Grönroos(2004), Yang and Peterson (2004), Wang et al. (2004), Khatibiet al. (2002), Peter and Olson (1993), Patterson and Spreng (1997),Monroe (1991), Day (1990), Zeithaml (1988), Clawson and Donald(1978), Howard and Sheth (1969) and Kotler and Levy (1969)Table II.
IJPPM

achieved (see e.g. Bowersox et al., 2010). In this sense, SCP can be seen as a function of theutilization of supply chain resources or as a function of supply chain results as compared tosupply chain targets. Gunasekaran et al. (2004) suggested further to measure SCP onstrategic, tactical and operational levels and, thus, suggested adequate financial andnon-financial SCPIs.
When it comes to our research, we considered those measures suggested by Shepherdand Guenter (2006) and categorized them according to the applicability of the five supplychain processes defined in the SCOR model. Whether the variables measure cost, time,quality, flexibility and innovativeness or they are quantitative or qualitative. Otto andKotzab (2003) suggested six perspectives in SCP measurement based on their work, and wehave considered two, i.e., first, logistics perspective issues: integration lead times, ordercycle time, inventory level concept of flexibility for different measure under five processes ofSCOR. Second, strategic perspective: time to network, time to mark and ROI of focalorganization have relevancy to the measures considered in this study. Birhanu et al. (2018)argued that supply chain strategies are driven by respective companies and their supplychain measures. Manage environmental and sustainability expectations with profoundeffect on supply chain network configuration. GSCM dimensions are found to be related toat least one of the performance dimensions (Cankaya and Sezen, 2019). Amongmanufacturers, retailers and third party logistics companies (3PLs) in Asia pacific regionfinancial category are dominating performance categories in managing warehouseoperations (Laosirihongthong et al., 2013). In Performance metrics of SCM economic valueaddition and SCOR are frequently used mechanism, companies focus more on costoriented customer service; whereas social and environmental metrics are legally enslavedperformance measures (Piotrowicz and Cuthbertson, 2015). As performance measures thatincludes all major links in a supply chain, as well as the three pillars of sustainability has asignificant role in partnering supply chain (Abdullah et al., 2014). Majority of researchersintegrated the concept of TBL for SCP management as a framework (Taticchi et al., 2013).
3.3 Hypotheses developmentStructural contingency theory (SCT) posits that there should be a fit betweenorganizational processes and the environment (Burns and Stalker, 1961; Lawrence andLorsch, 1967). It further advocates that firms those match their configurations withenvironment requirement tend to perform better than those who do not match (Holmes,2013). In the context of supply chain, the SCT advocates that each supply chain process ordimension should be aligned to achieve best performance (Flynn et al., 2010). In thecontext of SCOR model, all five dimensions, plan, source, make, deliver and return, shouldbe aligned to firm’s requirement in order to match demand and supply. Needless tomention that all stakeholders are an important part of a firm’s environment. Therefore, webelieve that all the dimensions defined in the SCOR model influence overall performance ofthe supply chain of a firm.
3.3.1 Plan. Supply chain planning process happens at all three levels: strategic, tacticaland operational levels. Planning is an integral element and is required in each of other fourdomains of SCOR model. For example, demand forecasting is required for source, make,deliver and return at all time frames: long, mid and short terms (Souza, 2014). Demand dataforecasted during planning process improves the SCP (SCC, 2010). Next, information alsoplays an important role in planning various activities throughout supply chain. Real-timeinformation sharing is used in balancing supply/demand, logistics, inventory managementand return. Information sharing leads to improved SCP (Fawcett et al., 2011). Informationsharing also plays a vital role in supply chain collaboration and supply chain integration(Cao and Zhang, 2011; Zhou et al., 2011). The extant literature suggests that supply chaincollaboration and supply chain integration improve the SCP. The other activities of
Supply chainoperations
planning stage include supply resources, aggregate and prioritize demand requirements,plan inventory, distribution requirements, production, material and rough-cut capacity,long-term capacity and resource planning, product phase-in/phase-out. Based on abovediscussion, we hypothesize:
H1. Plan-based performance indicators positively influence OSCPI.
3.3.2 Source. Sourcing involves selecting best suppliers using an optimal combination ofcost and lead-time, in order to meet demand. There are several sourcing best practicesdiscussed in literature (Carr and Pearson, 1999; Prahinksi and Benton, 2004; Li et al., 2005).For example, long-term relationship with suppliers, trust, real-time information sharing andcollaboration with suppliers are some noted best practices (Zhou et al., 2011). The literatureon sourcing suggests that firms that collaborate with its suppliers tend to perform better(Cao and Zhang, 2011). Other studies show the positive impact of long-term relationshipwith suppliers, trust and real-time information sharing performance (Dyer and Singh, 1998;Kwon and Suh, 2004, 2005; Cai et al., 2009; Hsu et al., 2011; Nazim and Raja Yaacob, 2017;Özer and Zheng, 2017; Dadzie et al., 2018). Based on above discussion, we hypothesize:
H2. Source-based performance indicators positively influences OSCPI.
3.3.3 Make. The make process is essentially a transformation process of converting rawmaterial into finished goods. Therefore, researchers have developed several techniques overlast few decades that improve transformation process. These improvements includereducing production and inventory costs, reducing production lead-time, reducing wasteduring production and improving quality. Some noted best practices that are developedduring last few decades include just-in-time ( JIT), total quality management (TQM), leanmanufacturing, agile manufacturing, scheduling and push-pull manufacturing. Severalstudies in the literature have established the link between these best practices and SCP (e.g.Beamon, 1999; Gunasekaran et al., 2001, 2004; Kannan and Tan, 2005; Li et al., 2006; Kohet al., 2007; Shepherd and Guenter, 2010; Green et al., 2005; Govindan et al., 2015; Prajogoet al., 2016; Mani et al., 2018). Therefore, we hypothesize:
H3. Make-based performance indicators positively influences OSCPI.
3.3.4 Deliver. Logistics has two parts: inbound logistics and outbound logistics. The deliverprocess of SCOR model discusses and evaluates the later part. Logistics becomes essentialpart of planning process of SCM as it completes the supply chain, that is, from supplier tocustomer (Gunasekaran and Kobu, 2007). In other words, logistics facilitates physical flow ofgoods from a supply node (supplier or manufacturer) to a demand node (customer). Researchhas shown that an effective logistics management can provide a sustainable competitiveadvantage to a firm (Christopher, 2016). However, firms face trade-off of time and cost ineffectively managing the logistics function. For example, full truckload may provide costadvantage to a firm, but, in doing so, firm may have to compromise with the speed of delivery.Another example is that lower lead-time may not provide cost advantage to a firm. Theliterature shows that those firms that efficiently manage time and cost trade-off are likely tohave better business performance (e.g. Lai et al., 2002; Gunasekaran and Kobu, 2007; Coyleet al., 2016; Christopher, 2016). Based on above discussion, we hypothesize:
H4. Deliver-based performance indicators positively influences OSCPI.
3.3.5 Return. The return process in the SCOR model is added in its 5.0 version onwards.The return process is defined as return defective products, return excess product, returnmaintenance, repair and overhaul products (Palma-Mendoza et al., 2014). All theaforementioned returns are part of reverse logistics activities (Guide and Wassenhove,2009). Firms, across the globe, are trying to reduce all kinds of returns as much as possible
IJPPM
(Kleindorfer et al., 2005). Some noted best practices to reduce the returns include reducedefect at source, TQM, JIT, etc. The literature on reverse logistics suggests that those supplychains that are able to reduce the returns show better performance (Daugherty et al., 2005;Govindan et al., 2012; Agarwal et al., 2016; Mahindroo et al., 2018). Based on the abovediscussion, we hypothesize:
H5. Return-based performance indicators positively influences OSCPI.
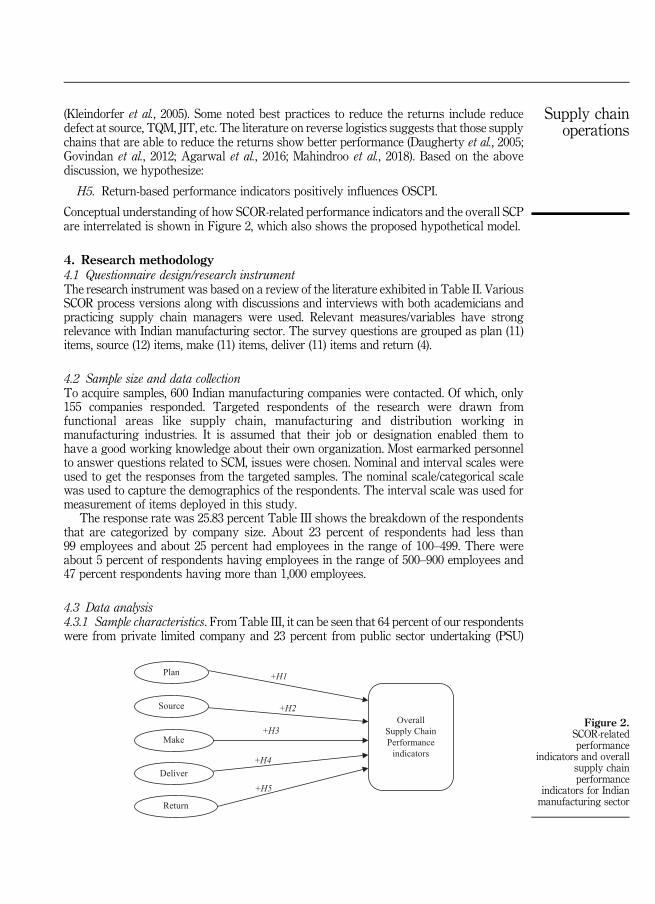
Conceptual understanding of how SCOR-related performance indicators and the overall SCPare interrelated is shown in Figure 2, which also shows the proposed hypothetical model.
4. Research methodology4.1 Questionnaire design/research instrumentThe research instrument was based on a review of the literature exhibited in Table II. VariousSCOR process versions along with discussions and interviews with both academicians andpracticing supply chain managers were used. Relevant measures/variables have strongrelevance with Indian manufacturing sector. The survey questions are grouped as plan (11)items, source (12) items, make (11) items, deliver (11) items and return (4).
4.2 Sample size and data collectionTo acquire samples, 600 Indian manufacturing companies were contacted. Of which, only155 companies responded. Targeted respondents of the research were drawn fromfunctional areas like supply chain, manufacturing and distribution working inmanufacturing industries. It is assumed that their job or designation enabled them tohave a good working knowledge about their own organization. Most earmarked personnelto answer questions related to SCM, issues were chosen. Nominal and interval scales wereused to get the responses from the targeted samples. The nominal scale/categorical scalewas used to capture the demographics of the respondents. The interval scale was used formeasurement of items deployed in this study.
The response rate was 25.83 percent Table III shows the breakdown of the respondentsthat are categorized by company size. About 23 percent of respondents had less than99 employees and about 25 percent had employees in the range of 100–499. There wereabout 5 percent of respondents having employees in the range of 500–900 employees and47 percent respondents having more than 1,000 employees.
4.3 Data analysis4.3.1 Sample characteristics. From Table III, it can be seen that 64 percent of our respondentswere from private limited company and 23 percent from public sector undertaking (PSU)
+H1
+H5
+H4
+H3
+H2
Plan
Source
Make
Deliver
Return
OverallSupply ChainPerformance
indicators
Figure 2.SCOR-relatedperformance
indicators and overallsupply chainperformance
indicators for Indianmanufacturing sector
Supply chainoperations

(i.e. the government-owned corporations are termed as PSU in India). In a PSU, majority(51 percent or more) of the paid up share capital is held by central government or by anystate government or partly by the central governments and partly by one or more stategovernments in India; 7 percent of respondents were from public limited and 6 percent werefrom others (others mean which are neither private, government nor public limited companiescategory according to the Indian manufacturing sector).
The respondents were also asked about their company’s prime business service toidentify the industry; it has been observed from Table III that 15 percent of the respondents
Respondents (in percentage)
Employee size range1–99 23100–499 25500–999 5Greater than 1,000 47
Type of companiesPrivate limited 64Public sector undertaking 23Public limited 7Others 6
Firm characteristicsType of industryEngineering (A) 15Automobiles(A) 13Electronics (A) 11Consumer (B) 8Petroleum (B) 3Fertilizer (B) 2Power (B) 2Steel (B) 3Cement (B) 2Pharmaceutical (C) 9Agro-based(C) 8Chemical (C) 8Textile (D) 10Food production (D) 7
Company’s establishment in yearsLess than 5 105–10 911–20 2921–30 1131–40 1041–50 8Greater than 50 23
Respondent characteristicsPresident 14Director 10General manager 14Assistant general manager 15Manager 26Consultant 10Practitioner 10
Table III.Demographics
IJPPM

were from engineering industry, over 13 percent from automobile, 11 percent fromelectronics, consumer, 10 percent from textile, 7 percent from food production, 9 percentfrom pharmaceuticals, 8 percent from agro-based and chemical industry have, 3 percentfrom petroleum and steel and2 percent from fertilizer, power and cement. From Figure 3, itcan be observed that Group A had 39 percent respondents, Group B 20 percent, Group C25 percent and Group D 17 percent respondents. Regarding the age of company’sparticipation in the questionnaire administered, it has been observed that 29 percent ofrespondents were from 11 to 20 years old establishment, 23 percent from more than 50 yearsold establsihment,11 percent from 21 to 23 years old establishment, 10 percent from lessthan 5 years old and 31–40 years old establishment, 9 percent from 5 to 10 year oldestablishment, and, least of all, 8 percent respondents from 41 to 50 years old establishment(see Table III). Descriptive statistics were also generated for the position/title of therespondent (see Table III). The respondents were asked about their position and knowledgeof impacts of SCOR-related performance indicators and OSCPI in the company theyare working. It has been observed that 26 percent of respondents had titles of Managers,14 percent titles of president and general manager, 15 percent title of assistant generalmanager, 10 percent title of consultant and practitioners and 10 percent title of director.
Trend seems to continue in future among range of employee size of 100–499 and500–900. There is a rising trend in private limited companies regarding participation in thiskind of empirical survey. Group A showed highest participated respondents followed byGroup B, Group C and Group D; however, Groups B and C followed a steady trend asparticipative respondents. Young companies of age between range of 5–11 years and10–15 years followed a peak trend of participation as respondents in the survey. A validupward trend shown by general managers, assistant general managers and managerparticipation in this survey indicates that mid-level managers in organization hierarchyhave a more awareness level regarding SCOR model practices and its implications as acompetitive tool of their business profits growth.
4.3.2 Test of reliability. The reliability of the survey instrument was tested usingCronbach’s (1951) α as a test of internal consistency for the SCOR-related performanceindicators under processes, i.e., plan, source, make, deliver and return. Cronbach’s α tests theinterrelationship among the items composing a construct to determine if the items aremeasuring a single construct. Cicchetti and Sparrow (1990) identified acceptable reliabilityguidelines ro0.70 (unacceptable), between 0.70 and 0.80 ( fair), 0.80–0.90 (good) andrW0.90 (excellent).
Table IV presents the means, standard deviations and Cronbach’s α for the SCOR-relatedperformance indicators as practices in the Indian manufacturing sector.
Type of Industry Response (in Percentage)
A, 39
B, 20
C, 25
D, 17
100
Figure 3.Type of Industry
(percentage) response
Supply chainoperations

The results show that αs range is 0.93, indicating that proposed 17 performance indicatorsunder SCOR processes, i.e., plan, source, make, deliver and return have acceptable reliability.
4.3.3 Test of validity. Convergent and discriminant validity. As part of test of measuresand to assess the convergent validity, we examined the parameters such as factor loading ofthe item, average variance extracted (AVE), and composite reliability Hair et al. (2010).
All the estimates with respect to item loadings are presented in Table IV that shows thatitems are significantly related to their corresponding factors. Furthermore, the Table Vindicates that the AVE and CR values exceed the threshold levels (AVE⩾ 0.50; CR⩾ 0.70).AVE is the primary indicator of convergence, and a CR value over 0.70 indicates the internalconsistency of the latent construct analyzed (Hair et al., 2010). These results suggestadequate fit with respect to convergent validity.
According to Churchill (1979) and Hair et al. (2010), discriminant validity can be evaluatedbased on three parameters that include the examination of factor correlations, maximumshared variance, average shared variance (ASE) and assessment of whether the square root ofAVE is greater than inter-construct correlation values below 0.80, suggesting the discriminantvalidity of the scale (Bhattacherjee, 2002). Furthermore, MSV values are found to be lessthan the average shared variance of the factors. Additionally, average shared variance valuesare less than the AVE (ASVoAVE). The values presented in Table VIII suggest that the
SCORprocess Item Mean SD
Corrected item-totalcorrelation
Cronbach’s αscore
Factorloading
Plan TSCRT 3.61 0.99 0.62 0.93 0.83TSCCT 3.74 1.07 0.59 0.93 0.79OFLEX 3.71 0.85 0.61 0.93 0.55
Source POCC 3.74 0.86 0.63 0.93 0.78EOPOCC 3.86 0.83 0.60 0.93 0.75SASTRTQP 4.00 0.78 0.61 0.93 0.59
Make WIP 3.86 0.84 0.59 0.93 0.73INVC 3.96 0.78 0.54 0.93 0.72INVDS 3.87 0.81 0.66 0.93 0.64
Deliver DELEFF 3.82 0.95 0.71 0.93 0.77DELLT 3.73 0.94 0.67 0.93 0.79FOD 3.77 0.98 0.68 0.93 0.78DEFLEX 3.69 0.86 0.71 0.93 0.79TRANFLEX 3.72 0.93 0.67 0.93 0.77
Return LCVP 3.88 0.86 0.61 0.93 0.72CC 4.08 0.98 0.51 0.93 0.81ROC 3.95 1.04 0.54 0.93 0.83
Notes: n¼ 155. Mean/SD of constructs measured along a five- point Likert scale (1¼ strongly disagree;5¼ strongly agree). α¼Cronbach’s α test of internal consistency. Tests of model fit for confirmatory factoranalysis (CFA)¼ χ2¼ 303.814, df¼ 109, po0.001; RMSEA (90% CI)¼ 0.61; CFI¼ 0.859. All factor loadingsare significant at po0.05
Table IV.Descriptive Statisticsand Reliabilitymeasures for SCOR-related performanceindicators (plan,source, make, deliverand return)
CR AVE MSV ASV
Plan 0.773 1.570 0.422 0.361Source 0.752 1.500 0.387 0.333Make 0.739 1.500 0.473 0.381Deliver 0.886 3.000 0.306 0.306Return 0.800 2.400 0.306 0.280
Table V.Convergent anddiscriminant validity
IJPPM

square root of AVE is greater than inter-construct correlations. Therefore, all the latentconstructs statistically passed discriminant validity.
Confirmatory factor analysis (CFA) loadings were used to determine the content andconstruct validity of SCOR process. Construct validity, also referred to as content validity,determines how accurately the survey items measure each of construct.
CFA was conducted using SPSS software to evaluate overall construct validities usingstructural equation modeling. The validity of the construct is based on fit of the structuralequation model to the data using three measures of goodness of fit: ratio of χ2 statistic anddegrees of freedom ( χ2/df ), ratio less than 2–1, a CFI value ⩾0.90 and RMSEA⩽ 0.08.Table VI also shows that goodness of fit is acceptable for all the five constructs. Thenomenclature for coding the variable used in the reliability testing, validity testing andhypothesis testing is presented in Appendix.
Table VI is the result of CFA; at first, we have conducted factor analysis using SPSS onthe data collected, extraction method: principal component analysis, rotation methodquartimax with Kaiser Normalization rotation converged in 19 iterations. From the totalvariance, explained 13 items were reduced satisfying the conditions, i.e., having eigenvaluesgreater than 1 as well as acceptable total variance explained on all 13 items. However, inorder to make the proposed scale a valid, we have done CF using SEM and AMOS 24.0,in the process of further statistical analysis deleted items that have factor loading of lessthan 0.4 suggested by Brown (2015) and in this process initial 52 items reduced to 17 items.These 17 items have been named as five constructs relevant to core SCOR processes, thusaccomplishing one of the research objectives of this work.
First construct as plan (three items): total supply chain response time (TSCRT), totalsupply chain cycle time (TSCCT) and order flexibility (OFLEX); second construct as source(three items): purchase order cycle time (POCC), efficiency of purchase order cycle time(EOPOCC) and supplier ability to respond to quality problems (SATRTQP); third constructas make ( four items): work in process (WIP), inventory cost (INVC) and inventory days ofsupply (INVDS); fourth construct as deliver ( five items): delivery efficiency (DELEFF),delivery lead-time (DELLT), frequency of delivery (FOD), delivery flexibility (DEFLEX)and transport flexibility (TRANFLEX) and fifth construct as return (three items): levelof customer perceived value of product (LCVP), customer complaints (CC) and rate ofcomplaint (ROC).
In this study, to validate our research objectives, GOF indices are presented first andlater validity and reliability of measurement model are discussed. The initial measure ofGOF is standardized root mean square (SRMS residual) that is an average differencebetween the predicted and observed variances and covariances in the model, based onstandardized residuals. In the model, predicted SRMS is 0.018 that is in range of 0.05–0.08,hence, adequate fit Garson (2011). Other common goodness of fit indicators to assess amodel are Normed fit Index (NFI), Non-Firmed Fit Index (NNFI also known as TLI) and
Goodness of fit indicesCFI NFI GFI RMR CMIN/DF
Scale No. of itemsRange of standardizedregression weights 0–1.0* 0–1.0* 0–1.0* 0.05–0.08* Less than 3*
Plan 3 0.551–0.831 0.86 0.802 0.889 0.018 2.787Source 3 0.592–0.784Make 3 0.642–0.720Deliver 5 0.765–0.793Return 3 0.719–0.830Note: *Acceptable range for model fit
Table VI.Confirmatory factoranalysis: construct
validity test of variousscales for SCOR-
related performanceindicators
Supply chainoperations

Incremental Fit Index, Comparative Fit Index (CFI) and root mean square error ofapproximation (RMSEA).
Hu and Bentler(1999) and Mac-Callum et al. (1996) argued that and acceptable model fitusing different indices depend on sample sizes, type of data and range of acceptable scoresas influencing factors. However, Schreiber et al. (2006) suggested that TLI, CFI and RMSEAfor one time analyses are preferred to support the proposed SEM model. Current studyreported (Table VI) most of goodness of fit measures found in model fit summary usingAMOS 24.0.
5. ResultsBased on the structural equation model, the results of the five hypotheses are shown inTable VII. According to the t-values in the table, all five hypotheses are supported at the 0.05significance level. In addition to a good fit of the structural model, a good structural equationmodel needs to have a good measurement model (i.e. the path coefficients of all indicators tothe related latent variables are significant at the 0.05 level).
According to the SEM results, all the path coefficients are significant at the 0.05 level andt-values are larger than 2.0. Thus, all our hypotheses are accepted. Similar researchmethodologies, statistical techniques: CFA, SEM and multiple regression are used byDegroote and Marx (2013), Li et al. (2011), Laia et al. (2004), Rodrigues et al. (2004), Zhou et al.(2011) and Kuo et al. (2009). Thus, plan, source, make, deliver and return processes havepositive influence on SCPI: quality of goods, economic order quantity, cash to cash cycletime, delivery reliability, manufacturing lead-time, total cash flow time, inventory turnoverratio and warranty/returns processing cost.
Current study to understand differences among the identified four groups, i.e., Group A,Group B, Group C and Group D of Indian manufacturing sector found significant differenceof SCOR processes practices as planning, sourcing, make, deliver and return processesstrongly depend on different complex nature of manufacturing activities. Thesemanufacturing activities are strongly linked with SCOR processes, but, in each group,these activities differ at large that has strong relation with SCPI (see Table VIII).
Using the SPSS, output table shows the results of multiple regression results using thestepwise method, p-value less than 0.01 SCOR processes as independent variables and
Path in the structural model Path coefficient (t-value) Outcome
Plan→ OSCPI 0.217* (3.67) H1 acceptedSource→OSCPI 0.209* (3.83) H2 acceptedMake→OSCPI 0.446* (3.80) H3 acceptedDeliver→OSCIP 0.322* (3.78) H4 acceptedReturn→OSCPI 0.262* (3.96) H5 acceptedNote: *po0.05
Table VII.SCOR-relatedperformanceindicators vs overallsupply chainperformanceindicators
SCOR processes F p-value F crit.
Plan 2.899 0.047 2.839Source 2.591 0.065 2.616Make 3.587 0.021 2.716Deliver 8.843 0.000 2.816Return 12.736 0.000 3.239Note: Using ANOVA two-factor with replication
Table VIII.Practices of SCORprocesses basedperformanceindicators amongfour groups ofmanufacturingindustries
IJPPM
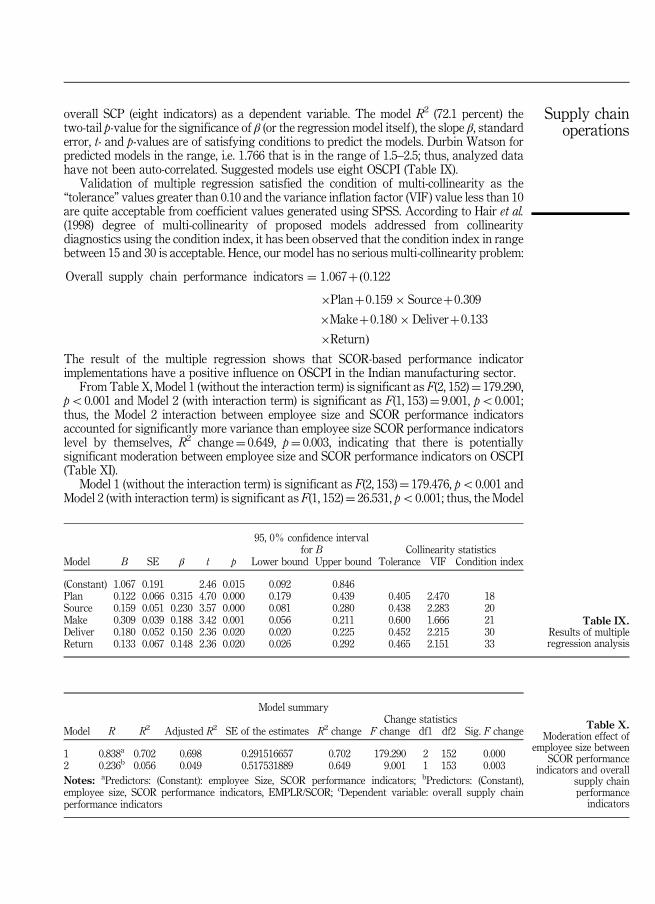
overall SCP (eight indicators) as a dependent variable. The model R2 (72.1 percent) thetwo-tail p-value for the significance of β (or the regression model itself ), the slope β, standarderror, t- and p-values are of satisfying conditions to predict the models. Durbin Watson forpredicted models in the range, i.e. 1.766 that is in the range of 1.5–2.5; thus, analyzed datahave not been auto-correlated. Suggested models use eight OSCPI (Table IX).
Validation of multiple regression satisfied the condition of multi-collinearity as the“tolerance” values greater than 0.10 and the variance inflation factor (VIF) value less than 10are quite acceptable from coefficient values generated using SPSS. According to Hair et al.(1998) degree of multi-collinearity of proposed models addressed from collinearitydiagnostics using the condition index, it has been observed that the condition index in rangebetween 15 and 30 is acceptable. Hence, our model has no serious multi-collinearity problem:
Overall supply chain performance indicators ¼ 1:067þ 0:122ð�Planþ0:159� Sourceþ0:309
�Makeþ0:180� Deliverþ0:133
�ReturnÞThe result of the multiple regression shows that SCOR-based performance indicatorimplementations have a positive influence on OSCPI in the Indian manufacturing sector.
From Table X, Model 1 (without the interaction term) is significant as F(2, 152)¼ 179.290,po0.001 and Model 2 (with interaction term) is significant as F(1, 153)¼ 9.001, po0.001;thus, the Model 2 interaction between employee size and SCOR performance indicatorsaccounted for significantly more variance than employee size SCOR performance indicatorslevel by themselves, R2 change¼ 0.649, p¼ 0.003, indicating that there is potentiallysignificant moderation between employee size and SCOR performance indicators on OSCPI(Table XI).
Model 1 (without the interaction term) is significant as F(2, 153)¼ 179.476, po0.001 andModel 2 (with interaction term) is significant as F(1, 152)¼ 26.531, po0.001; thus, the Model
95, 0% confidence intervalfor B Collinearity statistics
Model B SE β t p Lower bound Upper bound Tolerance VIF Condition index
(Constant) 1.067 0.191 2.46 0.015 0.092 0.846Plan 0.122 0.066 0.315 4.70 0.000 0.179 0.439 0.405 2.470 18Source 0.159 0.051 0.230 3.57 0.000 0.081 0.280 0.438 2.283 20Make 0.309 0.039 0.188 3.42 0.001 0.056 0.211 0.600 1.666 21Deliver 0.180 0.052 0.150 2.36 0.020 0.020 0.225 0.452 2.215 30Return 0.133 0.067 0.148 2.36 0.020 0.026 0.292 0.465 2.151 33
Table IX.Results of multipleregression analysis
Model summaryChange statistics
Model R R2 Adjusted R2 SE of the estimates R2 change F change df1 df2 Sig. F change
1 0.838a 0.702 0.698 0.291516657 0.702 179.290 2 152 0.0002 0.236b 0.056 0.049 0.517531889 0.649 9.001 1 153 0.003Notes: aPredictors: (Constant): employee Size, SCOR performance indicators; bPredictors: (Constant),employee size, SCOR performance indicators, EMPLR/SCOR; cDependent variable: overall supply chainperformance indicators
Table X.Moderation effect of
employee size betweenSCOR performance
indicators and overallsupply chainperformance
indicators
Supply chainoperations

2 interaction between company age and SCOR performance indicators accounted forsignificantly more variance than company age SCOR performance indicators level bythemselves, R2 change¼ 0.555, p¼ 0.003, indicating that there is potentially significantmoderation between company age and SCOR performance indicators on OSCPI.
From Table XII, Model 1 (without the interaction term) is significant as F(2, 153)¼ 26.531,po0.001 and Model 2 (with interaction term) is significant as F(1, 152)¼ 10.451, po0.001;thus, the Model 2 interaction between type of company (private vs non-private) and SCORperformance indicators accounted for significantly more variance than company age SCORperformance indicators level by themselves, R2 change¼ 0.084, p¼ 0.003, indicating thatthere is potentially significant moderation between type of company (private vs non-private)and SCOR performance indicators on OSCPI.
6. DiscussionSimilar empirical studies by Zhou et al. (2011) and Jamehshooran et al. (2015) are supportingthe results of the current work. Zhou et al. (2011) empirically proved that plan processespositively influences source, make and deliver processes and also source process positivelyinfluences make, make process positively influences deliver process and plan processinfluences make process, i.e., mediated by source process and influence of plan process ondeliver process is mediated by make process based on 125 North American manufacturingfirms respondents which suggested that the SCOR model shall help practitioners as aperformance measurement system as well as a benchmarking tool for other companies andto optimize the supply chain investments.
6.1 Practical relevanceSupply chain managers are chosen as respondents in this study with reference to previousstudies as majority of researchers have made significant contribution to the SCPmeasurement system among automobile, textile, pharmaceutical companies. However, ahuge gap exists relating SCOR-based PMS covering different types of companies (based onownership), firm characteristics covering 14 types of Indian manufacturing industries.
Model summaryChange statistics
Model R R2 Adjusted R2 SE of the estimates R2 change F change df1 df2 Sig. F change
1 0.384a 0.148 0.142 0.491615805 0.148 26.531 2 153 0.0002 0.253b 0.064 0.058 0.515230348 0.084 10.451 1 153 0.003Notes: aPredictors: (Constant), type of company (private vs non-private) SCOR performance indicators;bPredictors: (Constant), type of company, SCOR performance indicators, type of comp./SCORPI; cDependentvariable: overall supply chain performance indicators
Table XII.Moderation effect oftype of company(private vs non-private) between SCORperformance indicatorsand overall supplychain performanceindicators
Model summaryChange statistics
Model R R2 Adjusted R2 SE of the estimates R2 change F change df1 df2 Sig. F change
1 0.838a 0.703 0.699 0.29141 0.703 179.476 2 153 0.0002 0.384b 0.148 0.142 0.49162 0.555 26.531 1 152 0.000Notes: aPredictors: (Constant), company age SCOR performance indicators; bPredictors: (Constant),company age, SCOR performance indicators, comp. age/SCORPI; cDependent variable: overall supply chainperformance indicators
Table XI.Moderation effect ofcompany age betweenSCOR performanceindicators and overallsupply chainperformanceindicators
IJPPM
Thus, this research shall be a pathfinder for SCM managers in the Indian manufacturingsector, i.e., the proposed SCOR-based model (see Figure 2) (processes to be prioritized for aneffective and efficient practice or as a paradigm of SCP measurement system). SCOR-basedprocesses to be designed in SCPMS are the quality of delivery of goods, quality of deliverydocumentation, CC, manufacturing cost, timely available of accurate information,SATRTQP, inventory costs and ROC supported by Jääskeläinen and Thitz (2018). Thus,by considering our proposed models (see Figure 2), this shall enhance the performance oforganization with a sustainable business growth and profits. The generic manufacturingcapabilities/priorities often mentioned in significant contribution such as Hayes andWheelwright (1984), Hill (1987) and Gerwin (1993) have been cost, quality, dependability,flexibility and innovation. Hill (1987) introduced the concept of order winners and orderqualifiers and differentiated between them. Order qualifiers are those criteria that acompany must meet for a customer even to consider it as a potential supplier. Order winnersare those criteria that could win the order. To provide qualifiers, companies need only to beas good as competitors but to provide order winners they need to be better than theircompetitors. Thus, our study also supported manufacturing companies that are mainlyfocused on quality, customer orientation and supplier integration with information sharingbeing most important parameters in manufacturing companies weaved with the concept ofsome critical process of proposed SCOR-based PMS.
Best practices as the results provide that under plan process the total cash flow time, cashto cash cycle time, OFLEX are dominant preference, under make respondents chosenmanufacturing cost, inventory turnover ratio and inventory cost, as cost effective tools forsustainable business growth whereas in source the timely availability of accurate information,SATRTQP are considered as sourcing plays a crucial aspect in any manufacturing activity asa business process reliable vendors/supplier who can supply reliable information, promisedtime of delivery of materials helps in increasing the business growth as well as productivity ofany firm. Subsequently, undelivered mutual trust, poor quality of delivery goods, poor qualityof delivery documentation, delivery reliability that are priorities forfeited, erroneous delivery,protracted lead times lead to loss of business growth as well as loss of good will amongcustomers, as respondents in this survey converged reliability issues of deliver process.Finally, in return, the CC, ROC, in India reverse logistics is emerging core business process ofconventional logistics, in this survey respondents suggest to consider CC after sale of goods toimprove the brand image among customers.
6.2 Academic contributionsOur study has identified and embedded a unique approach already being practiced bydeveloped economies for SCPMS using the proposed SCOR-based processes to developingeconomy like India. By measuring the SCP using the proposed factors as well as SCT tounderstand the perceived levels of proposed SCOR-based processes, our findings alsohighlighted that organizations must first be integrated before they can have visibility oftheir SC partner’s activities with reference to the proposed SCOR-based processes as amodel reinforced by work of Ramish and Aslam (2016). Once there is visibility,organizations can integrate the PMS as a holistic approach between SC partners. Using thisstudy, future research can propose or design customized information systems for theoptimization of sourcing, manufacturing strategy and deliver as well as return strategicprocesses by a broader view of SCPMS using the SCOR-based process as a paradigm toIndian manufacturing sector distinct view of Elgazzar et al. (2019).
7. ConclusionThe study, at hand, attempts to verify the relationship between SCOR processes from a supplychain perspective in the Indian manufacturing sector. Our results show that SCOR decision
Supply chainoperations
areas are vital to supply chain processes. This study is one of the first attempts to empiricallyevaluate the SCOR model processes in the Indian manufacturing sector. Thus, the results ofour study have several implications on SCM practitioners in terms of understanding the bestpractices to be chosen in line of SCOR processes. First, our study is supported by the literaturethat finds that SCOR processes play a critical role in improving the SCP. Our study found thatquality, customer satisfaction and supplier integrity embedded into SCOR processes, i.e., plan,source, make, deliver and return. As suggested constructs, i.e., plan, source make, deliver andreturn performance indicators with respect to Indian manufacturing sector has close linkswith logistics drivers, distribution management, information, cash cycle, supplier relationshipmanagement, inventory management and purchasing operations. Similar studies by Delipinarand Kocaoglu (2016) suggested the need of research on implementation of SCOR model.Exploratory study by Lockamy and McCormack (2004) suggested important SCM practicesas a planning prospective only, whereas our study made an effort to suggest other processesof the SCOR model covering source, make, deliver and return. Zhou et al. (2011) distinct viewof this study but they validated only for Level 1 processes of SCOR model; however, our workfocused relatively on all levels processes of SCOR model. Sri Yogi and Kotzab (2019) proposeda conceptual model using performance measures and SCM models association usingorganizational theories.
Our discussion and results reported infer that framed research objective, i.e., influentialeffect between SCOR-related performance indicators and OSCPI as measures to Indianmanufacturing sector is accomplished. Second, our study provides empirical support forfindings in the literature that OSCPI have to be considered as the proposed composite modelcomprising of perceived quality of goods, perceived economic order quantity, perceived cashto cash cycle time, perceived economic order quantity, perceived delivery reliability,perceived manufacturing lead-time, perceived total cash flow time, perceived inventoryturnover ratio and perceived warranty/returns processing cost which should be used as themeasure of SCPI in Indian manufacturing sector by practitioners.
Lastly, our study also supports that the literature’s findings on some of the vital SCORprocesses have not been prioritized by respondents, namely, order entry method, DEFLEX,volume flexibility, warehouse cost, overhead cost, TSCRT, information carrying cost,distribution cost, supplier rejection rate and intangible cost.
However, there are limitations to the study. First, our survey does not represent thewhole population of the Indian manufacturing sector. Second, the study was limited tomanufacturing firms. Service firms were not included because the majority of SCORprocesses cannot be embedded in transformation processes of service firms. Thus, thegeneralization of these results to service firms is limited. Finally, the study focuses on Indianmanufacturing sector, which may restrict the applicability of the findings to non-Indianmanufacturing sector. Although few manufacturing companies that participated in thesurvey have global presence as they most likely do not operate under the same market andsame supply chain, SCOR processes are same barring some companies that participated inthe survey and do not have all processes under the SCOR framework due to differentbusiness processes.
Future researchers need to establish or develop the levels of the SCOR-based processesspecifically to different types of Indian manufacturing Industries. This would give moreprosperous information on levels to prioritize the SCOR-based SCPMS.
The limitations of our study refer to the chosen geographical setting as we focused on 14types of Indian industries but excluded the service industry.
We used the perceived values of the proposed SCOR-based processes to adopt as a SCPMSparadigm. However, manufacturing companies lack a standardized approach in implementingSCPMS as compared to global standards established by developed economies. This proposedSCOR-based SCPMS should lead to more standardization specifically to different types of
IJPPM

Indian manufacturing Industries complemented by Ganeshkumar et al. (2014). This willenable Indian manufacturing industries to compare and benchmark their SCPMS and exploreperformance metrics based on SCOR processes. This will allow manufacturing industries tocompare their own levels with those global standards.
References
Abdullah, R., Hassan, M.G. and Johari, N.A. (2014), “Exploring the linkage of supply chain integrationbetween green supply chain practices and sustainable performance: a conceptual link”, 2014 4thInternational Conference on Future Environment and Energy IPCBEE, Vol. 61, p. 22.
Agarwal, V., Govindan, K., Darbari, J.D. and Jha, P.C. (2016), “An optimization model for sustainablesolutions towards implementation of reverse logistics under collaborative framework”,International Journal of System Assurance Engineering and Management, Vol. 7 No. 4,pp. 480-487.
Ahmad, S. and Schroeder, R. (2001), “The impact of electronic data interchange on deliveryperformance”, Production and Operations Management, Vol. 10 No. 1, pp. 16-30.
Beamon, B.M. (1999), “Measuring supply chain performance”, International Journal of Operations &Production Management, Vol. 19 No. 3, pp. 275-292.
Benton, W.C. Jr (2011), “Push and pull production systems”, in Cochran, J. (Ed.), Encyclopedia ofOperations Research and Management Science, January 14, Wiley and Sons, Hoboken, NJ.
Benton, W.C. and Shin, H. (1998), “Manufacturing planning and control: the evolution of MRP and JITintegration”, European Journal of Operational Research, Vol. 110 No. 3, pp. 411-440.
Bhattacherjee, A. (2002), “Individual trust in online firms: scale development and initial test”, Journal ofManagement Information Systems, Vol. 19 No. 1, pp. 211-241.
Birhanu, D., Krishnanand, A.L. and Neelakanteswara, R. (2018), “Supply chain strategies ofmanufacturers in Ethiopia”, International Journal of Productivity and Performance Management,Vol. 67 No. 2, pp. 318-340.
Blackburn, J. (1991), Time-Based Competition, Business One Irwin, Homewood, IL.
Bolstorff, P. (2006), “Balancing your value chain metrics”, available at: www.scelimited.com/sitebuildercontent/sitebuilderfiles/balancingyourvaluechainmetrics.pdf (accessed January 16, 2017).
Bower, J.L. and Hout, T.M. (1988), “Fast cycle capability for competitive power”, Harvard BusinessReview, Vol. 66 No. 6, pp. 110-118.
Bowersox, D., Closs, D. and Cooper, M. (2010), Supply Chain Logistics Management, International ed.,McGraw-Hill, New York, NY.
Bragg, S.M. (2011), Inventory Best Practices, 2nd ed., John Wiley & Sons, Hoboken, NJ.
Brewer, P. and Speh, T. (2000), “Using the balanced scorecard to measure supply chain performance”,Journal of Business Logistics, Vol. 21 No. 1, pp. 75-93.
Brown, T.A. (2015), Confirmatory Factor Analysis for Applied Research, 2nd ed., The Guilford Press,New York, NY and London.
Burns, T. and Stalker, G. (1961), The Management of Innovation, Tavistock, London.
Cai, J., Liu, X., Xiao, Z. and Liu, J. (2009), “Improving supply chain performance management: asystematic approach to analysing iterative KPI accomplishment”, Decision Support Systems,Vol. 46 No. 2, pp. 512-521.
Cankaya, S. and Sezen, B. (2019), “Effects of green supply chain management practices onsustainability performance”, Journal of Manufacturing Technology Management, Vol. 30 No. 1,pp. 98-121.
Cao, M. and Zhang, Q. (2011), “Supply chain collaboration: impact on collaborative advantage and firmperformance”, Journal of Operations Management, Vol. 29 No. 3, pp. 163-180.
Carr, A. and Pearson, J. (1999), “Strategically managed buyer-supplier relationships and performanceoutcomes”, Journal of Operations Management, Vol. 17 No. 5, pp. 497-519.
Supply chainoperations
Carter, C. and Ellram, L. (1998), “Reverse logistics: a review of the literature and framework for futureinvestigation”, Journal of Business Logistics, Vol. 19 No. 1, pp. 85-102.
Cavinato, J.L. (1992), “Total cost value model for supply chain competitiveness”, Journal of BusinessLogistics, Vol. 13 No. 2, pp. 285-301.
Chan, F. (2003), “Performance measurement in a supply chain”, International Journal of AdvancedManufacturing Technology, Vol. 21 No. 7, pp. 534-548.
Chen, I.J. and Paulraj, A. (2004), “Towards a theory of supply chain management: the constructs andmeasurements”, Journal of Operations Management, Vol. 22 No. 2, pp. 19-150.
Cheng, T.C.E. (1991), “An economic order quantity model with demand dependent unit production costand imperfect production processes”, IIE Transactions, Vol. 23 No. 1, pp. 23-28.
Choi, T. and Hartley, J. (1996), “An exploration of supplier selection practices across the supply chain”,Journal of Operations Management, Vol. 14 No. 4, pp. 333-343.
Chopra, S. and Meindl, P. (2013), Supply Chain Management: Strategy, Planning, and Operation, 5th ed.,Pearson Education, Boston Consulting Group, Upper Saddle River, NJ.
Christopher, M. (1992), Logistics and Supply Chain Management, Financial Times PitmanPublishing, London.
Christopher, M. (2016), Logistics & Supply Chain Management, 5th ed., Pearson EducationLimited, Harlow.
Chunhua, T., Chai, Y., Liu, Y. and Ren, S. (2003), “Performance management in supply chain”, IEEEInternational Conference on Systems, Man and Cybernetics, pp. 4934-4939.
Churchill, G.A. Jr (1979), “A paradigm for developing better measures of marketing constructs”, Journalof Marketing Research, Vol. 16 No. 1, pp. 64-73.
Cicchetti, D.V. and Sparrow, S.A. (1990), “Developing criteria for establishing inter rater reliability ofspecific items: applications to assessment of adaptive behavior”, American Journal of MentalDeficiency, Vol. 86 No. 2, pp. 127-137.
Clawson, C.J. and Donald, E.V. (1978), “Human values: a historical and interdisciplinary analysis”, inHunt, K. and Abor, A. (Eds), NA – Advances in Consumer Research Volume 05, Association forConsumer Research, MI, pp. 396-402.
Coyle, J.J., Novack, R.A., Gibson, B. and Bardi, E.J. (2016), Transportation: A Global Supply ChainPerspective, 8th ed., Cengage Learning, Boston, MA.
Cronbach, L.J. (1951), “Coefficient alpha and the internal structure of tests”, Psychometrika, Vol. 16No. 3, pp. 297-334.
Cua, K., McKone, K. and Schroeder, R. (2001), “Relationships between implementation of TQM, JIT andTPM and manufacturing performance”, Journal of Operations Management, Vol. 19 No. 6,pp. 675-694.
Dadzie, A.S., Uren, V., Miller, T. and Abba-Dabo, A. (2018), “Value-driven partner search for energyfrom waste projects”, SEMANTiCS 2018 14th International Conference on Semantic Systems,Vienna, September 10–13.
Daugherty, P.J., Autry, C.W. and Ellinger, A.E. (2001), “Reverse logistics: the relationship betweenresource commitment and program performance”, Journal of Business Logistics, Vol. 22 No. 1,pp. 107-123.
Daugherty, P.J., Richey, R.G., Genchev, S.E. and Chen, H. (2005), “Reverse logistics: superiorperformance through focused resource commitments to information technology”,Transportation Research Part E: Logistics and Transportation Review, Vol. 41 No. 2,pp. 77-92, doi: 10.1016/j.tre.2004.04.002.
Day, G.S. (1990), Market Driven Strategy, Free Press, New York, NY.
Degroote, S.E. and Marx, T.G. (2013), “The impact of IT on supply chain agility and firm performance:an empirical investigation”, International Journal of Information Management, Vol. 33 No. 6,pp. 909-916.
IJPPM

Delipinar, G.E. and Kocaoglu, B. (2016), “Using SCOR model to gain competitive advantage: a literaturereview”, Procedia – Social and Behavioral Sciences, Vol. 229, pp. 398-406.
Deloitte (2017), “India expected to be among top 5 manufacturing nations by 2020”, report by Deloitte,available at: www2.deloitte.com/in/en/pages/manufacturing/articles/global-manufacturing-competitiveness-index_msm_moved.html (accessed May 18, 2018).
Dobler, D.W. and Burt, D.N. (1996), Purchasing and Supply Management, The McGraw-Hill Companies,New York, NY.
Dong, Y. and Xu, K. (2002), “A supply chain model of vendor managed inventory”, TransportationResearch Part E, Logistics & Transportation Review, Vol. 38 No. 2, pp. 75-95.
Dong, Y., Carter, C. and Dresner, M. (2001), “JIT purchasing and performance: an exploratoryanalysis of buyer and supplier perspectives”, Journal of Operations Management, Vol. 19 No. 4,pp. 471-483.
Dyer, J.H. and Singh, H. (1998), “The relational view: cooperative strategy and sources ofinterorganizational competitive advantage”, The Academy of Management Review, Vol. 23 No. 4,pp. 660-679.
Elgazzar, S., Tipi, N. and Jones, G. (2019), “Key characteristics for designing a supply chainperformance measurement system”, International Journal of Productivity and PerformanceManagement, Vol. 68 No. 2, pp. 296-318.
Ellram, L.M. (1991), “A managerial guide for the development and implementation of purchasingpartnerships”, International Journal of Purchasing and Materials Management, Vol. 27 No. 3,pp. 2-8.
Erlenkotter, D. (1990), “Ford Whitman Harris and the economic order quantity model”, OperationsResearch, Vol. 38 No. 6, pp. 937-946.
Facchin, T. and Sellitto, M.A. (2012), “Measurement of work-in-process and manufacturing lead time bypetri nets modeling and throughput diagram PETRI – Nets”, Manufacturing and ComputerScience, pp. 95-106, available at: http://dx.doi.org/10.5772/50288
Fawcett, S.E., Wallin, C., Allred, C., Fawcett, A.M. and Magnan, G.M. (2011), “Information technology asan enabler of supply chain collaboration: a dynamic-capabilities perspective”, Journal of SupplyChain Management, Vol. 47 No. 1, pp. 38-59.
Ferrari, R. (2001), “Sourcing and planning need to converge”, Supply Chain Management Review, Vol. 5No. 6, pp. 19-20.
Fisher, L.M. (1997), “What is the right supply chain for your product?”, Harvard Business Review,March–April, pp. 105-116.
Fleischmann, M., Krikke, H.R., Dekker, R. and Flapper, S.D.P. (2000), “A characterization of logisticsnetworks for product recovery”, Omega, Vol. 28 No. 1, pp. 653-666.
Flynn, B.B., Huo, B. and Zhao, X. (2010), “The impact of supply chain integration on performance:a contingency and configuration approach”, Journal of Operations Management, Vol. 28 No. 1,pp. 58-71.
Flynn, B.B., Schroeder, R.G. and Flynn, E.J. (1999), “World class manufacturing: an investigation ofHayes and Wheelwright’s foundation”, Journal of Operations Management, Vol. 17 No. 1,pp. 249-269.
Fugate, B., Mentzer, T. and Stank, T. (2010), “Logistics performance: efficiency, effectiveness anddifferentiation”, Journal of Business Logistics, Vol. 31 No. 1, pp. 43-62.
Fullerton, R.R. and McWatters, C.S. (2001), “The production performance benefits from JITImplementation”, Journal of Operations Management, Vol. 19 No. 1, pp. 81-96.
Fullerton, R.R., McWatters, C.S. and Fawson, C. (2003), “An Examination of the relationships betweenJIT and financial performance”, Journal of Operations Management, Vol. 21 No. 4, pp. 383-404.
Ganeshkumar, C., Mathan Mohan, G. and Nambirajan, T. (2014), “Multi-group moderating effect ofgoods produced in the manufacturing industry: supply chain management context”, NMIMSManagement Review, Vol. 25 No. 5, pp. 10-30.
Supply chainoperations

Garcia, J.M., Lozano, S. and Canca, D. (2004), “Coordinated scheduling of production and deliveryfrom multiple plants”, Robotics & Computer-Integrated Manufacturing, Vol. 20 No. 3,pp. 191-198.
Garson, G.D. (2011), “Structural equation modelling, stat notes”, available at: http://faculty.chass.ncsu.edu/garson/PA/765/Structur.html#AIC (accessed June 19, 2018).
Gelders, L., Mannaerts, P. and Maes, J. (1994), “Manufacturing strategy, performance indicatorsand improvement programs”, International Journal of Production Research, Vol. 32 No. 4,pp. 797-805.
Georgise, F.B., Wuest, T. and Thoben, K.D. (2017), “SCOR model application in developing countries:challenges & requirements”, Production Planning & Control, Vol. 28 No. 1, pp. 17-32.
Gerwin, D. (1993), “Manufacturing flexibility: a strategic perspective”, Management Science, Vol. 39No. 4, pp. 395-410.
Giffi, C., Roth, A. and Seal, G. (1990), Competing in World Class Manufacturing: America’s 21st CenturyChallenge, Business One Irwin, Homewood, IL.
Goldsby, T.J. and Stank, T.P. (2000), “World class logistics performance and environmentallyresponsible logistics practices”, Journal of Business Logistics, Vol. 21 No. 2, pp. 187-208.
Govindan, K., Soleimani, H. and Kannan, D. (2015), “Reverse logistics and closed-loop supply chain: acomprehensive review to explore the future”, European Journal of Operational Research, Vol. 240No. 3, pp. 603-626.
Govindan, K., Palaniappan, M., Zhu, Q. and Kannan, D. (2012), “Analysis of third party reverse logisticsprovider using interpretive structural modeling”, International Journal of Production Economics,Vol. 140 No. 1, pp. 204-211, doi: 10.1016/j.ijpe.2012.01.043.
Graham, T.S., Dougherty, P.J. and Dudley, W.N. (1994), “The long term strategic impact of purchasingpartnerships”, International Journal of Purchasing and Materials Management, Vol. 30 No. 4,pp. 13-18.
Greasley, A. (2008), “Using simulation to assess the introduction of technology in a continuousoperations process”, Journal of Manufacturing Technology Management, Vol. 19 No. 8,pp. 979-984.
Green, S.D., Fernie, S. andWeller, S. (2005), “Making sense of supply chain management: a comparativestudy of aerospace and construction”, Construction Management & Economics, Vol. 23 No. 6,pp. 579-593.
Grönroos, C. (2004), “The relationship marketing process: communication, interaction, dialogue, value”,Journal of Business & Industrial Marketing, Vol. 19 No. 2, pp. 99-113.
Guide, L.D. and Wassenhove, V. (2009), “The evolution of closed-loop supply chain research”,Operations Research, Vol. 57 No. 1, pp. 10-18.
Gunasekaran, A. and Kobu, B. (2007), “Performance measures and metrics in logistics and supply chainmanagement: a review of recent literature (1995–2004) for research and applications”,International Journal of Production Research, Vol. 45 No. 12, pp. 2819-2840.
Gunasekaran, A., Patel, C. and McGaughey, R.E. (2004), “A framework for supply chain performancemeasurement”, International Journal of Production Economics, Vol. 87 No. 3, pp. 333-347.
Gunasekaran, A., Patel, C. and Tirtiroglu, E. (2001), “Performance measures and metrics in a supplychain environment”, International Journal of Operations & Production Management, Vol. 21Nos 1-2, pp. 71-87.
Gunasekaran, A., Williams, H.J. and McGaughey, R.E. (2005), “Performance measurement and costingsystem in new enterprise”, Technovation, Vol. 25 No. 5, pp. 523-533.
Gurin, R. (2000), “Online system to streamline Ford’s delivery process”, Frontline Solutions, Vol. 1 No. 4,pp. 1-3.
Ha, A.Y., Li, L. and Ng, S. (2003), “Price and delivery logistics competition in a supply chain”,Management Science, Vol. 49 No. 9, pp. 1139-1153.
IJPPM

Hahn, C., Pinto, P. and Bragg, D. (1983), “Just-in-time production and purchasing”, International Journalof Purchasing and Materials Management, Vol. 19 No. 3, pp. 2-10.
Hair, J.F., Tatham, R.L. and Anderson, R.E. (1998), Multivariate Data Analysis, 5th ed., Prentice Hall,Englewood Cliffs, NJ.
Hair, J.F., Black, W.C., Babin, B.J. and Anderson, R.E. (2010), Multivariate Data Analysis, 7th ed.,Prentice Hall, Englewood Cliffs, NJ.
Harrington, L. (1996), “Untapped savings abound”, IndustryWeek, July 15, pp. 53-58.
Harris, F.M. (1913), “How many parts to make at once”, Factory: The Magazine of Management, Vol. 10No. 2, pp. 135-136.
Hausman, W., Montgomery, D. and Roth, A. (2002), “Why should marketing and manufacturing worktogether? Some exploratory empirical results”, Journal of Operations Management, Vol. 20 No. 3,pp. 241-258.
Hayes, R.H. and Wheelwright, S.C. (1984), Restoring our Competitive Edge: Competing throughManufacturing, John Wiley, New York, NY.
Henig, M. and Levin, N. (1992), “Joint production planning and product delivery commitments withrandom yield”, Operations Research, Vol. 40 No. 2, pp. 404-410.
Hill, T. (1994), Manufacturing Strategy: Text and Cases, Richard D. Irwin, Blue Ridge, IL.
Hill, T.J. (1987), “Teaching manufacturing strategy”, International Journal of Operations & ProductionManagement, Vol. 6 No. 3, pp. 10-20.
Hines, P. (1994), Creating World Class Suppliers, Pitman Publishing, London.
Hoffman, D. (2004), “The hierarchy of supply chain metrics: diagnosing your supply chain health”,AMR Research, Boston, MA.
Holmes, G. (2013), “What role do private protected areas have in conserving global biodiversity?”, SRIWorking Papers No. 46, Leeds.
Howard, J.A. and Sheth, J.N. (1969), The Theory of Buyer Behaviour, Wiley, New York, NY.
Hsu, C.W., Hu, A.H., Chiou, C.Y. and Chen, T.C. (2011), “Using the FDM and ANP to construct asustainability balanced scorecard for the semiconductor industry”, Expert Systems withApplications, Vol. 38 No. 10, pp. 12891-12899.
Hu, L. and Bentler, P.M. (1999), “Cutoff criteria for fit indices in covariance structure analysis:conventional criteria versus new alternatives”, Structural Equation Modeling, Vol. 6 No. 1,pp. 1-55.
Huang, S.H. and Keskar, H. (2007), “Comprehensive and configurable metrics for supplier selection”,International Journal of Production Economics, Vol. 105 No. 2, pp. 510-523.
Huang, S.H., Sheoran, S.K. and Wang, G. (2004), “A review and analysis of SCOR model”, InternationalJournal of Supply Chain Management, Vol. 9 No. 1, pp. 23-29.
Jääskeläinen, A. and Thitz, O. (2018), “Prerequisites for performance measurement supportingpurchaser-supplier collaboration”, Benchmarking: An International Journal, Vol. 25 No. 1,pp. 120-137.
Jahre, M. (1995), “Household waste collection as reverse channels – a theoretical perspective”,International Journal of Physical Distribution & Logistics Management, Vol. 25 No. 2, pp. 39-55.
Jamehshooran, B.G., Shaharoun, A.M. and Haron, H.N. (2015), “Assessing supply chain performancethrough applying the SCOR Model”, International Journal of Supply Chain Management, Vol. 4No. 1, pp. 1-11.
Kannan, V.R. and Tan, K. (2005), “Just-in-time, total quality management, and supply chainmanagement: understanding their linkages and impact on business performance”, Omega,Vol. 33 No. 2, pp. 153-162.
Karrer, M. (2003), “Supply chain event management. Impulse zur ereignisorientierten Steuerung vonSupply Chains”, in Dangelmaier, W., Gajewski, T. and Kösters, C. (Eds), Innovationen imE-Business, Paderborn, pp. 187S-197S.
Supply chainoperations

Kasilingam, R.G. (1998), Logistics and Transportation: Design and Planning, Springer, Boston, MA.
Kaynak, H. and Hartley, J.K. (2008), “A replication and extension of quality management into thesupply chain”, Journal of Operations Management, Vol. 26 No. 4, pp. 468-489.
Keebler, J., Manrodt, K., Durtsche, D. and Ledyard, D. (1999), Keeping Score: Measuring the Value ofLogistics in the Supply Chain, Council of Logistics Management, Chicago, IL.
Khatibi, A.A., Ismail, H. and Thyagarajan, V. (2002), “What drives customer loyalty: an analysis fromthe telecommunications industry”, Journal of Targeting, Measurement and Analysis forMarketing, Vol. 11 No. 1, pp. 34-44.
Kleindorfer, P.R., Singhal, K. and Van Wassenhove, L.N. (2005), “Sustainable operations management”,Production and Operations Management, Vol. 14 No. 4, pp. 482-492.
Koh, S.C.L., Demirbag, M., Bayraktar, E., Tatoglu, E. and Zaim, S. (2007), “The impact of supply chainmanagement practices on performance of SMEs”, Industrial Management & Data Systems,Vol. 107 No. 1, pp. 103-124.
Kotler, P. and Levy, S.J. (1969), “Broadening the concept of marketing”, Journal of Marketing, Vol. 33No. 1, pp. 10-16.
Kuo, Y.F., Wu, C.M. and Deng, W.J. (2009), “The relationships among service quality, perceived value,customer satisfaction, and post-purchase intention in mobile value-added services”, Computersin Human Behaviour, Vol. 25 No. 4, pp. 887-896.
Kwon, I.-W.G. and Suh, T. (2004), “Factors affecting the level of trust and commitment in supply chainrelationships”, The Journal of Supply Chain Management, Vol. 40 No. 2, pp. 4-14.
Lai, K., Ngai, E.W. and Cheng, T.C. (2002), “Measures for evaluating supply chain performance intransport logistics”, Transportation Research Part E: Logistics and Transportation Review,Vol. 38 No. 6, pp. 439-456.
Laia, K.H., Ngaib, E.W.T. and Chenga, T.C.E. (2004), “An empirical study of supply chain performancein transport logistics”, International Journal of Production Economics, Vol. 87 No. 3, pp. 321-331.
Lambert, D. and Pohlen, T. (2001), “Supply chain metrics”, International Journal of LogisticsManagement, Vol. 12 No. 1, pp. 1-19.
Landeros, R., Reck, R. and Plank, R.E. (1995), “Maintaining buyer supplier partnerships”, InternationalJournal of Purchasing and Materials Management, Vol. 31 No. 3, pp. 3-11.
Landrum, H. and Prybutok, V.R. (2004), “A service quality and success model for the informationservice industry”, European Journal of Operational Research, Vol. 156 No. 3, pp. 628-642.
Laosirihongthong, T., Adebanjo, D. and Choon Tan, K. (2013), “Green supply chain managementpractices and performance”, Industrial Management & Data Systems, Vol. 113 No. 8,pp. 1088-1109.
Lapide, L. (2000), “True measures of supply chain performance”, Supply Chain Management Review,Vol. 4 No. 3, pp. 25-27.
Lapinskaite, I. and Kuckailyte, J. (2014), “The impact of supply chain cost on the price of the finalproduct”, Business, Management and Education, Vol. 12 No. 1, pp. 109-126.
Law, J. (2009), A Dictionary of Business and Management, Oxford University Press, Oxford.
Lawrence, P. and Lorsch, J. (1967), Organization and Environment, Harvard Business School Divisionof Research, Boston, MA.
Lebas, M. (1995), “Performance measurement and performance management”, International Journal ofProduction Economics, Vol. 41 Nos 1-3, pp. 23-35.
Lee, H., Padmanabham, V. and Whang, S. (1997), “The bullwhip effect in supply chains”, SloanManagement Review, Vol. 38 No. 3, pp. 93-102.
Lee, H.L. and Billington, C. (1992), “Managing supply chain inventory: pitfalls and opportunities”, SloanManagement Review, Spring, pp. 65-73.
Levy, D.L. (1997), “Lean production in an international supply chain”, Sloan Management Review,Winter, pp. 94-102.
IJPPM

Li, L., Su, Q. and Chen, X. (2011), “Ensuring supply chain quality performance through applying theSCOR model”, International Journal of Production Research, Vol. 49 No. 1, pp. 33-57.
Li, S., Ragu Nathan, B., Ragu-Nathan, T.S. and Subba Rao, S. (2006), “The impact of supply chainmanagement practices on competitive advantage and organizational performance”, Omega,Vol. 34 No. 2, pp. 107-124.
Li, S., Rao, S., Ragunathan, T. and Ragunathan, B. (2005), “Development and validation of ameasurement instrument for studying supply chain management practices”, Journal ofOperations Management, Vol. 23 No. 6, pp. 618-641.
Lockamy, A. and McCormack, K. (2004), “Linking SCOR planning practices to supply chainperformance: an exploratory study”, International Journal of Operations and ProductionManagement, Vol. 24 No. 12, pp. 1192-1218.
Lowe, T.J. and Schwarz, L.B. (1983), “Parameter estimation for the EOQ lot-size model: minimax andexpected-value choices”, Naval Research Logistics Quarterly, Vol. 30 No. 2, pp. 367-376.
Luo, X. and Homburg, C. (2008), “Christian, satisfaction, complaint, and the stock value gap”, Journal ofMarketing, Vol. 72 No. 4, pp. 29-43.
Luo, Y., Liu, Y. and Xue, J. (2009), “Relationship investment and channel performance: an analysis ofmediating forces”, Journal of Management Studies, Vol. 46 No. 7, pp. 1113-1137.
McKone, K. and Schroeder, R. (2001), “The impact of total productive maintenance practices onmanufacturing performance”, Journal of Operations Management, Vol. 19 No. 1, pp. 39-57.
MacBeth, D.K. and Ferguson, N. (1994), Partnership Sourcing: An Integrated Supply chain ManagementApproach, Pitman Publishing, London.
Mac-Callum, R.C., Browne, M.W. and Sugawara, H.M. (1996), “Power analysis and determinationof Sample size for covariance structure modelling”, Psychological Methods, Vol. 1 No. 1,pp. 130-149.
MacDuffie, J., Sethuraman, K. and Fisher, M. (1996), “Product variety and manufacturing performance:evidence from the international automotive assembly plant study”,Management Science, Vol. 42No. 3, pp. 350-369.
Mahindroo, A., Samalia, H.V. and Verma, P. (2018), “Information systems road map to enhanceeconomic and operational reverse logistics performance”, International Journal of LogisticsSystems and Management, Vol. 29 No. 2, pp. 215-240.
Makatsoris, H. and Chang, Y. (2004), “Design of a demand driven collaborative supply-chain planningand fulfillment system for distributed enterprises”, Production Planning & Control, Vol. 15 No. 3,pp. 256-269.
Maloni, M.J. and Benton, W.C. (1997), “Supply chain partnerships: opportunities for operationsresearch”, European Journal of Operational Research, Vol. 101 No. 3, pp. 419-429.
Mani, V., Gunasekaran, A. and Delgado, C. (2018), “Enhancing supply chain performance throughsupplier social sustainability: an emerging economy perspective”, International Journal ofProduction Economics, Vol. 195 No. 1, pp. 259-272.
Mapes, J., New, C. and Szwejczewski, M. (1997), “Performance trade-offs in manufacturing plants”,International Journal of Operations and Production Management, Vol. 17 No. 10, pp. 1020-1033.
Mason-Jones, R. and Towill, D.R. (1997), “Enlightening supplies”, Manufacturing Engineer, Vol. 76No. 4, pp. 156-160.
Mollenkopf, H., Marcellini, F., Ruoppila, I., Széman, Z. and Tacken, M. (2005), Enhancing Mobility inLater Life: Personal Coping, Environmental Resources and Technical Support; The Out-of-homeMobility of Older Adults in Urban and Rural Regions of Five European Countries, IOS Press,Amsterdam, pp. 257-277.
Monroe, K.B. (1991), Pricing: Making Profitable Decisions, 2nd ed., McGraw-Hill, New York, NY.
Muller, M. (2011), Essentials of Inventory Management, 2nd ed., American Management Association,New York, NY.
Supply chainoperations

Nair, A. (2006), “Meta-analysis of the relationship between quality management practices and firmperformance-implication for quality management theory development”, Journal of OperationsManagement, Vol. 24 No. 6, pp. 948-975.
Nakajima, S. (1988), Introduction to TPM, Productivity Press, Cambridge, MA.
Narasimhan, R. and Kim, S. (2001), “Information system utilization strategy for supply chainintegration”, Journal of Business Logistics, Vol. 22 No. 2, pp. 51-75.
Nazim, R. and Raja Yaacob, R.A.I. (2017), “Criteria for supplier selection: an application of AHP-SCORintegrated model”, International Journal of Supply Chain Management, Vol. 6 No. 3,pp. 2051-3771.
Neely, A., Mills, J., Platts, K., Gregory, M. and Richards, H. (1994), “Realizing strategy throughmeasurement”, International Journal of Operations & Production Management, Vol. 14 No. 3,pp. 140-152.
Neely, N. (2003), Business Performance Measurement, Cambridge University Press, Cambridge.
New, S.J. (1996), “A framework for analyzing supply chain improvement”, International Journal ofOperations and Production Management, Vol. 16 No. 4, pp. 19-34.
Novich, N. (1990), “Distribution strategy: are you thinking small enough?”, Sloan Management Review,Fall, pp. 71-77.
Otto, A. and Kotzab, H. (2003), “Does supply chain management really pay? Six perspectives tomeasure the performance of managing a supply chain”, European Journal of OperationsResearch, Vol. 144 No. 2, pp. 306-320.
Özer, Ö. and Zheng, Y. (2017), “Trust and trustworthiness”, in Ha, A.Y. and Tang, C.S. (Eds), Handbookof Information Exchange in Supply Chain Management, Springer International Publishing,Hoboken, NJ, pp. 489-524.
Palma-Mendoza, J.A., Neailey, K. and Roy, R. (2014), “Business process re-design methodology tosupport supply chain integration”, International Journal of Information Management, Vol. 34No. 2, pp. 167-176.
Pande, P.S., Neuman, R.P. and Cavangh, R.R. (2000), The Six Sigma way: How GE, Motorola, and othertop Companies are Honing their Performance, McGraw-Hill, New York, NY.
Patterson, P.G. and Spreng, R.A. (1997), “Modeling the relationship between perceived value,satisfaction and repurchase intentions in a business-to-business, services context: anempirical examination”, International Journal of Service Industry Management, Vol. 8 No. 5,pp. 414-434.
Peter, J.P. and Olson, J.C. (1993), Consumer Behavior and Marketing Strategy, 3rd ed., Irwin,Homewood, IL.
Piotrowicz, W. and Cuthbertson, R. (2015), “Performance measurement and metrics in supply chains:an exploratory study”, International Journal of Productivity and Performance Management,Vol. 64 No. 8, pp. 1068-1091.
Powell, T. (1995), “Total quality management as competitive advantage: a review and empirical study”,Strategic Management Journal, Vol. 16 No. 1, pp. 15-27.
Prahinski, C. and Benton, W.C. (2004), “Supplier evaluations: communication strategies to improvesupplier performance”, Journal of Operations Management, Vol. 22 No. 1, pp. 39-62.
Prajogo, D., Oke, A. and Olhager, J. (2016), “Supply chain processes: linking supply logisticsintegration, supply performance, lean processes and competitive performance”, InternationalJournal of Operations & Production Management, Vol. 36 No. 2, pp. 220-238.
Pyke, D.F. and Cohen, M.A. (1994), “Multiproduct integrated production-distribution systems”,European Journal of Operational Research, Vol. 74 No. 1, pp. 18-49.
Ramish, A. and Aslam, H. (2016), “Measuring supply chain knowledge management (SCKM)performance based on double/triple loop learning principle”, International Journal ofProductivity and Performance Management, Vol. 65 No. 5, pp. 704-722.
IJPPM

Rodrigues, A.M., Stank, T.P. and Lynch, D.F. (2004), “Linking strategy, structure, process, andperformance in integrated logistics”, Journal of Business Logistics, Vol. 25 No. 2, pp. 65-94.
Rogers, D.S. and Tibben-Lembke, R. (2001), “An examination of reverse logistics practices”, Journal ofBusiness Logistics, Vol. 22 No. 2, pp. 129-148.
Rogers, D.S., Lambert, D.M., Croxton, K.L. and Garcia-Dastugue, S.J. (2002), “The returns managementprocess”, The International Journal of Logistics Management, Vol. 13 No. 2, pp. 1-18.
Rushton, A. and Oxley, J. (1991), Handbook of Logistics and Distribution Management, KoganPage, London.
Santos, C.P. and Fernandes, D. (2008), “Antecedents and consequences of consumer trust in the contextof service recovery context of service recovery”, Brazilian Administrative Review, Vol. 5 No. 3,pp. 225-244.
SCC (2010), “Supply chain operations reference model, overview (Version 10.0)”, Supply Chain Council,Chicago, IL, available at: docs.huihoo.com/scm/supply-chain-operations-reference-model-v10.0.pdf (accessed June 22, 2017).
Schonberger, R.J. (1990), Building a Chain of Customers, The Free Press, London.
Schreiber, J.B., Nora, A., Stage, F.K., Barlow, E.A. and King, J. (2006), “Reporting structural equationmodelling and confirmatory factor analysis results: a review”, Journal of Educational Research,Vol. 99 No. 6, pp. 323-337.
Schwarz, L.B. (1972), “Economic order quantities for products with finite demand horizons”,AIIE Transactions, Vol. 4 No. 3, pp. 234-237.
Shah, R. and Ward, P.T. (2007), “Lean manufacturing: context, practice bundles, and performance”,Journal of Operations Management, Vol. 21 No. 2, pp. 129-149.
Shepherd, C. and Guenter, H. (2006), “Measuring supply chain performance: current research andfuture directions” International Journal of Productivity and Performance Management, Vol. 55Nos 3-4, pp. 242-258.
Shepherd, C. and Guenter, H. (2010), “Measuring supply chain performance: current research andfuture directions”, in Fransoo, J., Waefler, T. and Wilson, J. (Eds), Behavioral Operations inPlanning and Scheduling, Springer, Berlin, Heidelberg, pp. 105-121.
Slack, N., Chambers, S., Harland, C., Harrison, A. and Johnston, R. (1995), Operations Management,Pitman Publishing, London.
Souza, G.C. (2014), “Supply chain analytics”, Business Horizons, Vol. 57 No. 5, pp. 595-605.
Sri Yogi, K. (2015), “Performance evaluation of reverse logistics: a case of LPG agency”, CogentBusiness & Management, Vol. 2 No. 1, pp. 1-17.
Sri Yogi, K. and Kotzab, H. (2019), “The intellectual foundation of supply chain managementperformance models: a bibliometric analysis and syntheses”, International Journal ofComparative Management, Vol. 2 No. 1, pp. 67-91.
Stalk, G., Evans, P. and Schulman, L.E. (1992), “Competing on capabilities: the new rules of corporatestrategy”, Harvard Business Review, Vol. 70 No. 2, pp. 57-69.
Stewart, G. (1995), “Supply chain performance benchmarking study reveals keys to supply chainexcellence”, Logistics Information Management, Vol. 8 No. 2, pp. 38-44.
Sukati, I., Hamid, A.B., Baharun, R. and Mdyusoff, R. (2012), “The study of supply chain managementstrategy and practices on supply chain performance”, Procedia – Social and Behavioral Sciences,Vol. 40 No. 185, pp. 225-233.
Supply Chain Council (2005), “Supply chain operations reference model, overview (Version 7.0).(Software)”, Supply Chain Council, Chicago, IL, available at: www.supply-chain.org (accessedJune 21, 2018).
Taticchi, P., Tonelli, F. and Pasqualino, R. (2013), “Performance measurement of sustainable supplychains: a literature review and a research agenda”, International Journal of Productivity andPerformance Management, Vol. 62 No. 8, pp. 782-804.
Supply chainoperations

Thomas, D.J. and Griffin, P.M. (1996), “Co-ordinated supply chain management”, European Journal ofOperational Research, Vol. 94 No. 3, pp. 1-15.
Toni, A.D., Nissimbeni, G. and Tonchia, S. (1994), “New trends in supply environment”, LogisticsInformation Management, Vol. 7 No. 4, pp. 41-50.
Towill, D.R. (1997), “The seamless supply chain the predator’s strategic advantage”, InternationalJournal of Technology Management, Vol. 14 No. 1, pp. 37-55.
Tracey, M. (2004), “Transportation effectiveness and manufacturing firm performance”,The International Journal of Logistics Management, Vol. 15 No. 2, pp. 31-50.
Treleven, M. (1987), “Single sourcing: a management tool for the quality supplier”, International Journalof Purchasing and Materials Management, Vol. 23 No. 1, pp. 19-24.
Van Hoek, R. (1998), “Measuring the immeasurable’ – measuring and improving performance in thesupply chain”, Supply Chain Management, Vol. 3 No. 4, pp. 187-192.
Wagner, S.M. (2003), “Intensity and managerial scope of supplier integration”, Journal of Supply ChainManagement, Vol. 39 No. 3, pp. 4-15.
Wang, Y., Lo, H.P. and Yang, Y. (2004), “An integrated framework for service quality, customer value,satisfaction: evidence from China’s telecommunication industry”, Information SystemsFrontiers, Vol. 6 No. 4, pp. 325-340.
Wild, R. (1995), Production and Operations Management, Cassell Educational Limited, London.
Womack, J., Jones, D. and Roos, D. (1990), The Machine That Changed the World, Rawson Associates,New York, NY.
Yang, Z. and Peterson, R.T. (2004), “Customer perceived value, satisfaction, and loyalty: the role ofswitching costs”, Psychology and Marketing, Vol. 21 No. 10, pp. 799-822.
Zeithaml, V.A. (1988), “Consumer perceptions of price, quality and value: a means-end model andsynthesis of evidence”, Journal of Marketing, Vol. 52 No. 3, pp. 2-22.
Zhou, H., Benton, W.C., Schilling, D.A. and Milligan, G.W. (2011), “Supply chain integration and theSCOR model”, Journal of Business Logistics, Vol. 32 No. 4, pp. 332-344.
Further reading
Ahumada, O. and Villalobos, J. (2004), “Efficiency measures for inbound logistics performance”,IIE Annual Conference Proceedings, pp. 1-6.
Birhanu, D., Lanka, K. and Rao, A.N. (2014), “A survey of classifications in supply chain strategies”,12th Global Congress on Manufacturing and Management, Vol. 97, pp. 2289-2297.
Daugherty, P.J., Richey, R.G., Roath, A.S., Min, S., Chen, H., Arndt, A.D. and Genchev, S.E. (2006),“Is collaboration paying off for firms?”, Business Horizons, Vol. 49 No. 1, pp. 61-70.
Dhawan, R., Swaroop, G. and Zainulbhai, A. (2012), “Fulfilling the promise of India’s manufacturingsector”, available at: www.mckinsey.com/business-functions/operations/our-insights/fulfilling-the-promise-of-indias-manufacturing-sector (accessed May 24, 2017).
Fawcett, S.E., Jones, S.L. and Fawcett, A.M. (2012), “Supply chain trust: the catalyst for collaborativeinnovation”, Business Horizons, Vol. 55 No. 2, pp. 163-178.
Hugos, M. (2003), Essentials of Supply Chain Management, Wiley, New York, NY.
PWC (2007), “India manufacturing barometer”, available: www.pwc.in/assets/pdfs/publications/2017/india-manufacturing-barometer-standing-strong.pdf (accessed May 21, 2017).
Siomkas, G. and Shrivastava, P. (1993), “Responding to product liability crises”, Long Range Planning,Vol. 26 No. 5, pp. 72-79.
Supply Chain Council (2000), “Supply chain operations reference model Version 5.0.
Tajbakhsh, A. and Hassini, E. (2015), “Performance measurement of sustainable supply chains: areview and research questions”, International Journal of Productivity and PerformanceManagement, Vol. 64 No. 6, pp. 744-783.
IJPPM
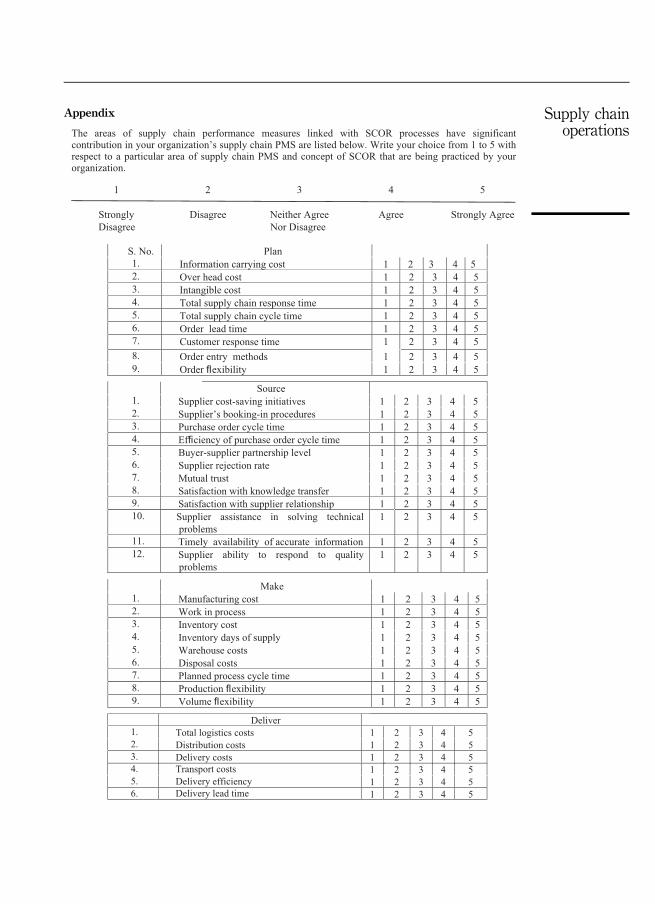
Appendix Supply chainoperations

About the authorsSri Yogi Kottala (1978) is Assistant Professor at the Department of Operations in School of BusinessManagement, SVKM’s NMIMS University, Hyderabad Campus, India. A gLink post-doctoral researchfellow in Business with Technology from LogDynamics and Faculty of Economics and BusinessStudies University of Bremen, Germany. He received the PhD Degree (2014) from Indian Institute ofTechnology Roorkee, Roorkee India, Master of Engineering Specializing Industrial Engineering &Management Degree (2006) from Shri G.S. Institute of Technology & Science, Indore, India andBachelor of Technology (Mechanical Engineering) from Sri Acharya Nagarjuna University GunturAndhrapradesh, India. Prior to his post-doctoral research Sri Yogi held Assistant Professor Position atthe Department of Industrial & Production Engineering, Guru Ghasidas Vishwavidyalaya (A CentralUniversity), Bilaspur, India. His doctoral work has appeared in referred international conferenceproceedings as well as referred national journals of India. Sri Yogi Research focuses on supply chainmanagement, sustainability of supply chain, revere logistics, quality control, purchase behavior andbibliometrics. He is the Regional Editor (Asia Pacific) of Transnational Corporations Review. He iscurrently Regular Reviewer of 12 top tier referred management journals. Sri Yogi Kottala is thecorresponding author and can be contacted at: [email protected]
Kotzab Herbert (1965) is Professor and Chairman of Logistics Management at the University ofBremen. He received a Master of Business Administration Degree in Marketing and Management, a PhDDegree (1996) and a post-doctoral degree (Habilitation; 2002) from the Vienna University of Economicsand Business Administration. Prior to his assignment at Bremen, Herbert held a professor position at theCopenhagen Business School at the Department of Operations Management. Herbert’s research focuseson supply chain management, service operations and consumer driven value networks. The research isdocumented in over 300 publications in leading journals such as Journal of Business Logistics, TheInternational Journal of Physical Distribution and Logistics Management, Industrial MarketingManagement, European Journal of Operational Research, Production & Operations Management(POM), Supply Chain Management: An International Journal, Electronic Markets, Journal of Business andIndustrial Marketing, Industrial Management and Data systems, chapters in books, conferenceproceedings and non-refereed journals. Since 2013, he is Editor-In-Chief of Logistics Research. Herbertreceived several awards for his teaching and research (e.g. NOFOMA Best Paper Award).
For instructions on how to order reprints of this article, please visit our website:www.emeraldgrouppublishing.com/licensing/reprints.htmOr contact us for further details: [email protected]
IJPPM