an energy economy interaction model for egypt
TRANSCRIPT

AN ENERGY ECONOMY INTERACTION MODEL
FOR EGYPT
“RESULTS OF ALTERNATIVE PRICE REFORM SCENARIOS”
BY MOTAZ KHORSHID
Vice President of the British University in Egypt (BUE)
Ex-Vice President of Cairo University (CU)
El Sherouk City
Misr-Ismalia Road
Egypt
E-Mail: [email protected]
Phone : +(202)26876982
Mobile :+ (2012)2440988
Fax: +(202)26875889
EcoMod2009
International Conference on Policy Modeling
Ottawa, Canada
June 24-26, 2009

2
ABSTRACT
To face the increasing burden of subsidies on government budget and to reform the prevailing distortions of the commodity pricing system, the Egyptian government is currently revising its pricing strategy with the objectives of eliminating subsidies and having more cost reflective prices. Given the significant share of the energy prices in the overall government subsidy payments – which accounted for 77 percent of total subsidy in 2006/2007 – coupled with the considerable variations in the international oil and other energy products prices since 2005, the government of Egypt is reconsidering its energy pricing, production and distribution policies as an important part of its current development strategy. Furthermore, as exporter of oil, Natural Gas and other products, the energy production and pricing policies have generated sensible impact on Egypt’s external balance, social welfare and the growth prospects of the economy. To analyze these issues in a comprehensive and consistent manner, an issue-oriented energy economy wide interaction model is developed and implemented based on a disaggregated social accounting matrix for the year 2006/2007. The model follows the general equilibrium tradition with detailed energy sector (including crude oil, natural gas, gasoline, fuel oil, gas oil, LPG, other products and electricity). This issue-oriented economy wide model is particularly designed to test alternative domestic energy pricing strategies, production policies of crude oil and natural gas, investment spending patterns, government expenditure policies as well as the impact of these policies on the performance of the Egyptian economy as a whole. The model is implemented using the general algebraic modeling system (GAMS) and validated using national accounting data collected and adjusted from the ministry of economic development, the central bank of Egypt and the central agency for public mobilization and statistics. The model was used to assess the economy wide impact of alternative medium term scenarios (2006/2006 – 2011-2012) associated with domestic energy pricing and subsidy policies. Three energy pricing scenarios are tested using the issue-oriented economy wide model. The first scenario assumes the continuation of the currently adopted energy pricing and subsidy policies. The two other scenarios assess the economic impact of two pricing program, based on the actual cash cost pricing principle with 5 and 10 years application periods. The results of the model have pointed out the following points. First, the increase in energy prices has generated an inflationary impact on non-energy sectors given energy inputs to the industry and services. Second, the change in prices has affected both the size and structure of demand for commodities. Third, in the absence of appropriate policy measures, the income generation and distribution processes would witness declining effects. Fourth, although the household sector and private companies are negatively affected, the impact on government savings is positive due to the elimination of subsidies. Fifth, Most of the resource gaps – such as saving-investments, external balance and fiscal gap – behaved positively due to the reduction in price distortions and subsidy payment. Finally, overall impact on real GDP was limited because of the improved growth rates of non energy sectors has overshadowed the negative impact on the growth rates of the energy GDP.
Keywords: Energy Production and Pricing Policies, Economy Wide Modeling and Analysis, Energy-Economic Interaction Models, Economy Wide Impact Assessment.

3
AN ENERGY ECONOMY INTERACTION MODEL General Purpose and Specific Objectives The dramatically increased public interest in energy policy issues – since the early 1970s – has resulted in the construction and application of the so called energy system models, a type of models that treats the entire energy sector as integrated system [1, 6, 25, and 26]. These models can be regarded as a simplified partial equilibrium analytical tool of the energy sector, usually specified as linear programming or simulation models. Most energy system models are quite detailed with respect to the representation of energy system technology, however, the economic determinants of the demand for useful energy, as well as mutual interdependence of the energy sector and the rest of the economy, are essentially neglected in these models. Thus despite their usefulness for energy planning purposes, they have little to say about the impact of changes in energy supply conditions or domestic energy policies on relative prices and the allocation of resources within the national economy [1]. Furthermore, the recent fluctuations of energy prices and their impact on the performance of the energy sector and other parts of the economy necessitated the development of different analytical tools capable of capturing the interactions between prices, demand for commodities, supply of goods and services and the rest of the economy. The demand for such information has induced the development of a number of energy economy wide models based essentially on the computable general equilibrium tradition and the social accounting matrix principles [1, 3, 10, 16, 19, and 25]. These models can be viewed as a general equilibrium economy wide model with detailed energy sector. This type of issue oriented economy wide models has witnessed a considerable success and general acceptance from policy makers during the last two decades. Examples of these models include the labour or population economy models, the public finance economy models, energy economy models and agriculture economy models [1, 3, 12, 14, 15, 16, 17, and 19]. Recently, hybrid models of the energy-economy have been developed with the objective of combining the strengths of the energy system models and the energy economy wide interaction analytical approach to capture macro-micro relationship within the economy. In Egypt, the Organization of Energy Planning (OEP) – jointly with the World Bank and the Institute of National Planning (INP) - has successfully developed and implemented a number of energy economic interaction models. This modelling effort was mainly based on linear programming method coupled with input output models or the computable general equilibrium methodology [3, 10, and 19]. These models have considerably contributed to enhancing the energy planning process in Egypt. The extended dynamic computable general equilibrium (CGE) model, described in this paper, can be viewed as an energy economy wide interaction model which is particularly designed to capture the impact of raising energy prices - either due to changes in the international energy markets or as a result of adopting a new domestic energy pricing strategy – on the performance of the energy sector as well as the economy as a whole. Based on the above rationale, the model is constructed to achieve a general analytical objective and a set of specific purposes. On the general level, the model can be viewed as an analytical tool designed to capture the interaction between the energy sector and the rest of the economy, with special emphasis on the impact of pricing mechanisms and systems. More specifically, the model can be used to address the following energy economic issues:

4
1. The economy wide effects of domestic energy production, pricing and subsidy policies.
2. The impact of expected changes in the international energy prices on the performance of the domestic energy sector and the rest of the economy.
3. The interdependence between energy prices and the prices of other goods and services.
4. The economic effects generated from the application of alternative energy tax and subsidy policies.
5. The impact of changes in energy prices on the income of domestic institutions and their spending behaviour.
6. The changes in the demand for goods and services resulting from alternative domestic energy pricing policies.
7. The substitution effects within the energy products and between energy and non-energy commodities.
8. The impact of changes in energy pricing strategy on various economic resource gaps such as; saving-investment balance, government deficit, commodity trade balance, foreign exchange balance and labour unemployment level.
9. The impact of alternative energy pricing and production policies on economic growth, income distribution and welfare measures.
A Social Accounting Matrix for Egypt A first and important step in the economy wide modelling process is to develop a consistent and a comprehensive accounting framework for the base year. The social accounting matrix (SAM) represents generally the most appropriate accounting structure for the construction of economy wide, or computable general equilibrium, models. To properly reflect the database of any economy wide model, the SAM should be designed to capture the rationale and structure of the country-specific economy. The SAM for Egypt – constructed in this paper –ensures to a great extend this concept. It should be considered as an accounting framework which is particularly designed to cope with the set of modelling objectives summarized in the previous section. The SAM for Egypt is assembled for the fiscal year 2006/07, the most recent year with comprehensive set of socioeconomic data. The detailed description of the SAM might need a separate document which goes beyond the scope of this paper. In the remaining part of this section, we will only concentrate on the distinguishing features of the SAM and their relation to the energy economy modelling purpose. The Accounting Structure of the SAM The SAM for Egypt is a square matrix consisting of 218 columns (rows). These accounts can be broadly divides into five basic categories which are:
1. Activity / commodity accounts 2. Factors of production accounts 3. Institutional current accounts 4. Institutional capital accounts 5. Taxes and subsidies accounts
The breakdown of activity/commodity accounts is schematically shown in figure (1). To reflect the prevailing interactions between the energy sector and the remaining parts of the economy, the activities and commodities is grouped under three basic categories; a) activities of the energy sector (8 accounts), b) activities with high energy consumption rates (7 accounts) and c) other economic sectors (6 accounts). The data pertaining to each of this group of accounts will provide the means to differentiate between the

5
Energy Sectors
1. Crude Oil Production 2. Natural Gas 3. Petroleum Products- Mazot 4. “ “ - Solar 5. “ “ - LPG 6. “ “ - Gasoline 7. “ “ - Others 8. Electricity Production
Intensive Energy Consumption
1. Chemical Industries 2. Basic Metal Industries 3. Engineering Industries 4. Fertilizer & Medical 5. Non-Metallic Industries 6. Others Industries 7. Transport & Communication
Other Sectors 1. Agriculture and Fishing 2. Food and Beverages 3. Weaving, Spinning & Clothes 4. Construction 5. Tourism, Financial & Business Sector 6. Other Services
Figure (1) The Activity / Commodity Breakdown in the SAM and the Model

6
Factors of Production
Labor by Sector and Household Area
Institutions
Capital- Operating Sector by Sector
Saving Investment
Current Account
Households:
• Urban
• Rural
Private Companies
Public Companies
General Government
Rest of the World
Saving by Institutions
Investment by Sector of Origin & Destination
Figure (2) The Composition of the Non Activity / Commodity of the SAM

7
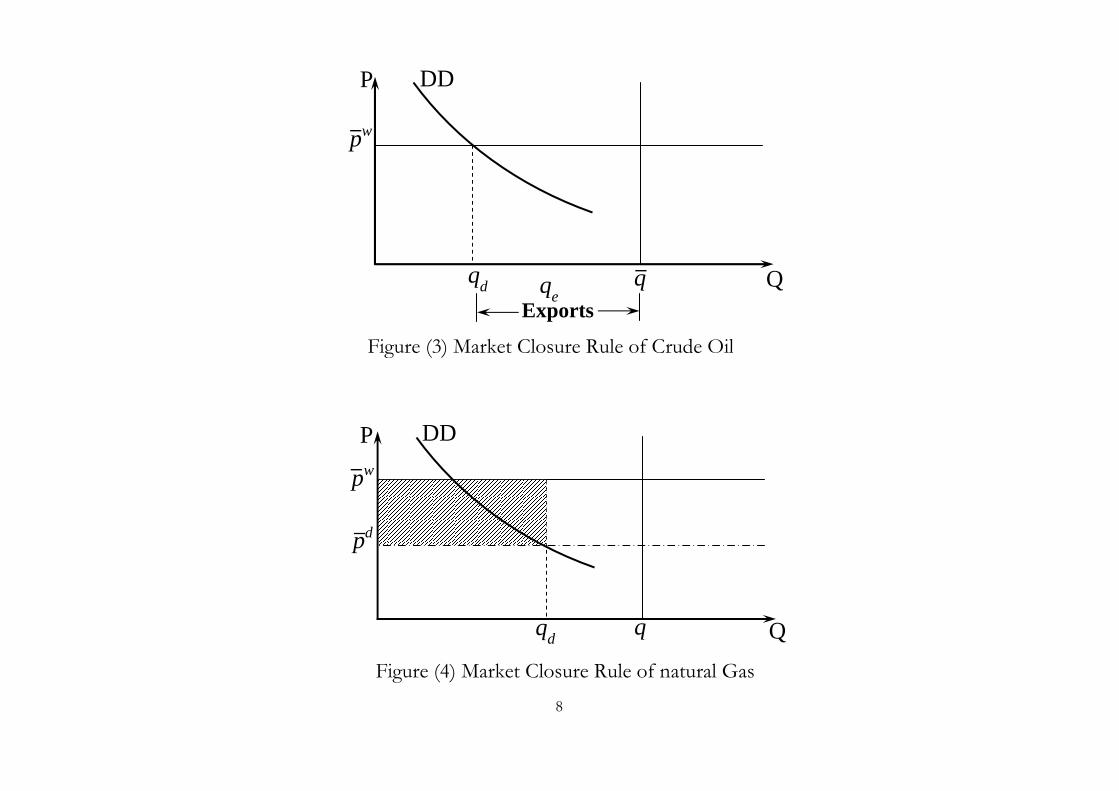
production functions pertaining to each of them within the modelling framework, and provide as well the basis for estimating their structural parameters. Figure (2) represent the decomposition scheme of other SAM-related accounts. Factors of production is divided into labour (or compensation of employees) and capital income (or gross operating surplus) with each of them broken down by production activities (21 sectors). Furthermore, labour income is divided between urban and rural household areas as shown in the value added matrix. Institutions in the SAM have both current and capital accounts. The current account of institutions includes urban and rural households, private and public enterprises, general government and the outside world (see figure (5)). Their capital account is however divided only into aggregated private and public sectors. Private sector includes households and private enterprises whereas public capital account groups both government and publicly owned enterprises. The investment / saving balance in the SAM is secured by four institution saving accounts and an investment matrix by sectors of origin and destination. Finally, the SAM for Egypt has a complex taxes and subsidies accounts to reflect the detailed energy and non energy commodity pricing mechanisms. Taxes include direct taxes collected from households and companies, import taxes on imported goods and other indirect taxes levied on domestic commodities. The SAM as well as the model make the distinction between energy subsidies (treated as rent collected by energy companies) and other subsidies (estimated as a percent of the before tax commodity value). Representative sample of published papers and books on SAM principles and construction can be found in the reference [8, 10, 23, 24, 27, 28, 29, 31, 35 & 36]. Modelling of Energy Producing Sectors To achieve the main purpose of the energy economy wide model, three types of production functions are embedded in its mathematical structure. The first type of production functions estimates the cost of producing energy commodities. The second category of functions deals with the non energy sectors with intensive energy consumption Behaviour. The third category of production functions groups the remaining sectors of the economy. The economic rationale behind this breakdown is to permit the model to deeply analyze the impact of energy sector as a generator of the national income, as part of the intermediate inputs of other industries and as a component of the final consumption expenditures. In Figure (3) the modelling of the crude oil sector is schematically sown. We assume that crude oil yearly production rate is fixed or exogenously specified. It depends on Egypt’s policy for conserving this natural resource and its export oriented strategy. Given the domestic demand curve (DD) and the world price of crude oil, the quantity of domestic demand is determined. When the crude oil production quantity is subtracted from the quantity of domestic demand. Egypt’s exports of crude oil is determined as a residual. The modelling of natural gas sector follows the same economic rationale with only one exception. The natural gas commodity is subsidised by government and accordingly it has two price indices; the world or opportunity cost price and the domestic (or regulated) price. In this formulation schematically represented in figure (4), subsidies are a negative rent collected by government (or positive payment to natural gas companies). It is estimated as the difference between average cost reflective world price and the regulated price. Again here, the domestic demand curve (DD) with the domestic price determine the quantity of domestic demand, and exports are then computed as the difference between the fixed extraction rate of natural gas and the size of domestic demand.
8
DD P
Q qe
Exports
q
─
pw
─
qd
P
Q
DD
qd q
pw
─
pd
─
Figure (3) Market Closure Rule of Crude Oil
Figure (4) Market Closure Rule of natural Gas

9
P
Q
DD1
S pr
─
DD2
M2
MC
M1
qd
1
qd
2
M1 = Negative rent (subsidy) incurred by government M2 = Positive rent (profit) Accumulated by government
Figure (5) Market Closure Rule of Petroleum Products
P
Q
DD
qd q
pw
─
pd
─
S
Exports
Figure (6) Market Closure Rule of Electricity Commodity
10
Note here that, in the general case, the domestic price is lower than the world price with negative rent or subsidy payment. If the domestic price is increased over the world price, we may face the case of positive rent, where the subsidies turn to a surplus over and above the total cost. In figure(5), the market clearing mechanism for petroleum products is presented. This graph includes two prices; the regulated domestic price and the world export price. The world export price and the supply curve (SS) determine the level of production (or supply) at q. The demand curve (DD) and the subsidized domestic price provide an estimate for the level of domestic demand, and the difference between the supply quantity and the level of domestic demand compute the quantity of exports. The figure(6) shows the behaviour of the electricity market. The schedule (MC) is the marginal cost curve. The supply curve is the straight line (S) at the regulated price (p). Therefore, the supply is assumed to be perfectly elastic at the administrated price. Thus, if the demand schedule is at (DD1), the supply is provided at (q1), and the sector collects a pure rent over and above the marginal cost (M1). Alternatively, if the demand curve is at (DD2), the sector supplies (q2), but its profits being squeezed (marginal cost (M2) is higher than the regulated price). For the latter case - currently encountered in Egypt –the consumers of electricity are receiving an implicit subsidy.
Modelling of Non-Energy Producing Sectors Non energy sectors are divided into activities with intensive energy consumption behaviour and other economic sectors. The first category of activities is modelled by a multi-level production function. As shown in figure(7), the first level divides the inputs of the sector into substitutable and non substitutable inputs. In level two, substitutable inputs are broken down into gross value added and composite energy inputs. The third level of the production function divides the value added into labour and capital factor income, and the composite energy commodities into natural gas, petroleum products and the electricity sector. This activity level is modelled using a multi-level constant elasticity of substitution function (CES).The non substitutable cost inputs include other intermediate consumption goods and it is represented by a Leontief production function (IO). This breakdown of the production function allows for the analysis of substitution effects on two levels; a) the aggregate substitution between the value added and the composite energy as part of the factors of production and b) the lower level substitution among capital and labour income on the one hand, and the substitution between energy products on the other hand. The second category of non energy activities is modelled using a nested production function. On the upper level, total value added and aggregate intermediate inputs are linked by a CES formulation. The lower level of the nested function – modelled either by a CES or an IO specification – explains the breakdown of value added into labour and capital factor income and the decomposition of the aggregate intermediate inputs into a set of composite commodities. Here also, the substitution effects are captured on two levels; the aggregate level between gross value added and aggregate intermediate inputs and the disaggregated level between the components of the value added and the commodities included in the intermediate consumption of the sector. The only exception to this rule is the agriculture sector, where the gross value added function is modelled using a Cob Douglas function.

11
Value Added
Gross Output
Composite Energy Input
Non Energy Inputs
Substitutable Inputs
Non-Substit-utable Inputs
Labor Demand Demand for Capital
Natural Gas
Petroleum Products
Electricity
Figure (7) Modeling of Energy Intensive Consumption sectors

12
Transfers to Domestic & Foreign Institutions
Household Expenditure / Income
Disposable Income
Direct Tax Payment
Household Final Consumption Spending
Household Saving
Composite Energy Consumption
Consumption of Non-energy Commodities
Natural Gas
Petroleum Products
Electricity Consumption
Figure (8) Households expenditure functions

13
Imported Commodities (CIF Prices)
Import Taxes
Domestic Production of Commodities (Factor Cost)
Indirect Commodity Tax
Commodity Subsidy
(+)
(+)
(─)
Imported Commodities (Landed Price)
Sales Tax on Imports
Domestic Production (Market price exclusive
of sales tax)
Sales tax on domestic production
(+)
(+)
Imported Commodities (Market Price)
Composite Commodities (Market Price)
Domestic Production (Market price inclusive of
sales tax)
Figure (9) The structure of the pricing system in Egypt

14
Households and Government Expenditure Functions The household sector in the energy economy model includes both urban and rural areas. Each household category is represented in the model by a multi-level expenditure function as shown in figure (8). The first level determines current transfers of households to domestic and foreign institutions, their direct tax payments and their disposable income. The second level divides households disposable income into aggregate final consumption spending and gross savings. These two levels of households expenditure functions are modelled as a fixed value share of total households income and disposable income, respectively. The third level distinguishes composite (or aggregate) energy consumption from the consumption of other non energy commodities by household. The selected consumption function for this level is the linear expenditure system (LES). Finally, the fourth level of the household expenditure pattern divides the composite energy consumption into the basket of energy commodities consumed by households such as ; natural gas, petroleum products and electricity. This fourth level applies a constant elasticity of substitution (CES) functional form. Note that the separate identification of the composite energy commodities of total households consumption spending is adopted in the model to permit the analysis of substitution possibilities between these products. Government sector expenditure levels are exogenously specified in the model. They are considered as policy variables that affect the demand for goods and services, influence households welfare level via direct cash transfers and provide financial support to private and public enterprises. These exogenous government spending is however determined by two different allocation rules; current transfers of government to domestic and foreign institutions are fixed in nominal term whereas government final consumption by commodity type is fixed in real term. Government savings is computed then as a residual (the difference between total government income, current transfers and government final consumption spending). Pricing System of Commodities Since the main purpose of the model is to properly analyze alternative energy pricing strategies along with their impact on other non energy commodity prices, a detailed specification of the pricing system is required. A schematic representation of the pricing system in Egypt – as captured by the energy economy interaction model – is shown in figure (9). First, the domestic production of goods and services is evaluated at factor cost (or basic price). When indirect taxes less commodity subsidy rates are added to the value of domestic production at factor cost, the domestic sales at market prices exclusive of sales tax are determined. If sales taxes are applicable to the domestic commodity, we can have the domestic sales evaluated at market price inclusive of sales taxes. On the other hand, imported goods at CIF price coupled with import taxes determine the quantity of imports evaluated at landed price. Again here, if sales taxes are alleviated on imported goods, the market price of imports is computed. At this stage, we have two type of commodities exchanged in the domestic markets; domestic sales and imported goods. When these two commodities are combined, we get the composite commodity evaluated at market price. The model includes also the price of commodity supplied for exports. The price of this exported commodity is computed by the domestic production at factor cost adjusted by the export subsidy rate (if applicable). System Constraints or Markets Closure Rules Based on the economy wide modelling approach , the CGE models should include a set of closure rules and/or markets clearing mechanisms (commonly known as system

15
constraints). The system constraints explains how each commodity and factor markets achieve the equilibrium point. It addresses also the institutional and the macro economic balances that reflect the adopted policy measures and/or the economic rationale of the model. In the previous sections of the paper, the closure rules of energy commodity markets are explained in a detailed manner. The non energy sectors applies the flexible market clearing mechanism where prices are free to adjust on the bases of the intersection of the supply and demand curves. In the labour markets, average wage rates are fixed in the within period model and adjusted exogenously in the inter period dynamic model. The fixed wage rates interact with the curve of demand for labour to determine the quantity of labour demand by households area and economic activity. In the model, the supply of labour force is computed as a function of the natural growth rate of population and the labour participation rate (the quantity of labour force divided by total population size). When the supply and the demand quantities are determined, an estimate of the unemployment rate can be obtained. On the other hand, return on capital in real term is computed as a fixed share of the capital stock by sector which is dynamically adjusted using one year lagged real investment spending and the prevailing rate of depreciation (or the consumption of fixed assets). With respect to the foreign exchange markets, the foreign exchange rate is assumed flexible to clears the market. As it was explained previously, government income is composed of tax income, public enterprises profit transfers and other domestic and foreign transfers. Government expenditure pattern is fixed either in nominal term (public transfers to domestic and foreign institutions) or in real term (government final consumption spending). The balance of the government sector is obtained by treating government saving as a residual variable, computed as the difference between income and total expenditure. Finally, the macro economic closure rule assumes that investment expenditure in real term is fixed in the within period model as a policy variable, the savings of domestic Institutions is computed as a fixed share of their nominal income and foreign savings clears the macroeconomic market. Note that the model includes capital account for both public and private sectors. The private capital sector includes households and private enterprises whereas public capital account groups both general government and public enterprises. THE IMPACT OF ENERGY PRICING SCENARIOS – ASSUMPTIONS
Energy Sector Assumptions The assumptions of the energy sector – required to conduct policy analysis using the energy economic interaction model – are grouped under two categories. The first category includes the expected growth rates of crude oil and natural gas over the projection period from 2007/08 up to 2011/12. These assumptions are based on Egypt’s energy strategy related to the extraction, domestic consumption and exports of crude oil and natural gas. Based on discussions with officials and policy makers of energy sector in Egypt, the crude oil extraction is assumed to increase annually by 2% on the average to cope with the adopted energy conservation program and export oriented policies. Natural gas production is assumed to grow by 5-6 percent yearly. This assumption is mainly based on the government policy concerned with the expanded utilization of natural gas in both residential areas and industrial sectors, the expected technological changes during the projection period and the approved export policy.

16
In a separate study for the government of Egypt, alternative energy price reform scenarios have been developed [34]. This Study identified Three energy pricing scenarios along with two implementation periods for each of them(5 and 10 years). The first scenario is the “reference path” which represent the continuation of the energy pricing and subsidy policies adopted by the Egyptian government. It represents the base or reference run to be compared with new energy pricing reforms. The actual cash cost approach reflects the second scenario and the opportunity cost method defines the third scenario [34]. Given the structure and disaggregated level of the energy economy wide model, weighted averages of both the natural gas and the electricity prices are computed, whereas the prices of petroleum products are grouped under five price categories; gasoline, gas oil, fuel oil, LPG and other products (mainly composed of Kerosene). Given the above rationale, the pricing assumptions of the energy sector – to be tested by the economy wide model - can be summarized as follows: A. The weighted average annual growth rates for ELECTRICITY are:
For the actual cash cost scenario, 27.61% each year for the 5 year transition scenario, and 16.56% each year for the 10 year transition scenario.
B. The weighted average annual growth rates for GAS are:
For the actual cash cost scenario, 10.2% each year for the 5 year transition scenario, and 7.6% each year for the 10 year transition scenario.
C. The weighted average annual increases for OIL PRODUCTS based on the actual
cash Cost scenarios: Weighted average annual increases required under the 5 and 10 Year Transition period
Product Actual Cash Cost Scenario (5 Years)
Actual Cash Cost Scenario (10 Years)
LPG 59.3% 30.3% Gasoline 21.5% 13.8% Kerosene 27.1% 16.4% Gas oil 19.8% 13.0% Fuel Oil 5.4% 6.0%
The economy wide impact of these alternative energy pricing scenarios are assessed in the forthcoming section of this paper. Economy Wide Assumptions The assumptions used for projecting the economy wide performance of the Egyptian economy are based on multiple sources of data which are:
1. The time series analysis of the socioeconomic data and indicators published by the ministry of economic development (MOED), Ministry of finance (MOF), the central agency for public mobilization and statistics (CAPMAS), the central bank of Egypt (CBE) and some complementary data sources such as the information and decision support centre (IDSC), the institute of national planning (INP) and the publications of the World Bank (WB) local office in Egypt.
2. The document of the five-year socioeconomic development plan (2007-2012)
along with its quarterly and annual follow up reports produced by MOED. Most of the future assumptions of government final consumption spending, private and

17
public investments in real term, government current transfers to domestic and foreign institutions and transfers from the outside world in foreign currency. The assumptions of the five year plan and the follow up reports are however adjusted to reflect the recent changes in the world economic performance.
3. The published reports and development indicators of the world bank (WB) and
the international monetary fund (IMF). The assumptions of the world prices of the exports and imports are mainly based on the scenarios defined in the world economic outlook published by the IMF. The projected international prices of crude oil and other energy products are based on the estimation made by the cost of supply and pricing study [34] and the international energy related institutions.
Based on the above sources, public investments in real term is assumed to increase annually by 5% on the average during the projection period. Given the expectation of the current five-year development plan and its follow up reports and the recent developments in the Egyptian economy, private investment spending in real term would grow by 7% annually on the average. Government real final consumption expenditure is expected to increase by around 4.5% per year. Similarly, government domestic and foreign transfers in nominal term will grow by 4.3 percent annually. Based in recent statistics of the central bank of Egypt and the assumption of the plan, transfers from the outside world in foreign currency are assumed to increase annually by 5% on the average. Based on recent world wide commodity price changes coupled with the government efforts to reduce the inflation rate in Egypt, the consumer price index is assumed to grow by 7% to 6% annually during the period 2008/09 – 2011/12. Finally, the population annual growth rate will decline from 2.01 percent in the base year to 1.85 percent in the terminal year (2011/12). THE IMPACT OF ENERGY PRICING SCENARIOS – EXPERIMENTAL
RESULTS
Introductory Remarks Based on the above economic rationale, the selected energy pricing scenarios and the economy wide assumptions, the dynamic energy economy interaction model is used to assess the impact of alternative energy pricing strategies on the behavior of the economy as a whole as well as the performance of its sectors and institutions. Based on the energy pricing and other economy wide assumptions, two scenarios are adopted for further experimentation and evaluation. These scenarios are the reference path run and the actual cash cost energy price changes. The actual cash cost scenario included however two options, the first one is directed to eliminate energy subsidies and reduce the price distortions of the energy sector in 10 years, whereas the second one accelerates the price reform process to be completed in 5 years only. The adopted experimental methodology – based on the energy economy wide model - begins with a definition of a base line (or a reference path) scenario reflecting the continuation of the policy measures and development options prevailing in the 1990 decade and the beginning of the current century, and then with an analysis of the effects generated by alternative energy pricing reform strategies. Although the 1990 decade and the first years of the current century have witnessed considerable policy changes on the economy wide level, the energy sector performance and its pricing system have shown

18
little changes in policies and trends. The comparative analysis – from 2006/07 to 2011/12 – is organized into two groups of experiments as follows:
1. The first simulation experiment generates the reference path of the economy – or the laisser-faire scenario - with special emphasis on the behavior of energy production, domestic and foreign demand, consumption by institutional category and the size of commodity subsidies.
2. The second group compares the 10 and 5 years scenarios of the actual cash
costing scenarios against the reference path medium term projections. The purpose of these experiments are; i) to estimate the economy wide changes resulting from applying this proposed price reform, and ii) to assess the velocity of these changes when the implementation period is becoming shorter (from 10 to 5 years).
Before going into the detailed experimental analysis, It would be useful in a first step to summarize the general economic rationale and directions of the economy wide impact along with their determinants and consequences as captured by the energy economy model. The economic rationale and directions of the economy wide effects – explained in this section – will constitute the general analytical base governing the subsequent analysis of results in the forthcoming sections.
Directions and Rationale of the economy wide Impact It is evident that any changes in economic variables and/or policies will interact with other parts (or subsystems) of the economy through cycles of dampening multiplier effects. In our context, it is required to trace the impact of applying different energy pricing strategies on the Egyptian economy as well as its institutions and sectors. This can be summarized in the following points: First, the changes in energy prices would result in a direct effect on non energy prices and then on the overall inflation rate. Because energy products form a significant part of the intermediate consumption of most production activities, one would expect that the prices of non energy sectors will respond to this change. The impact should however vary from on activity to another based on its dependence on energy inputs. These changes in prices would necessarily affect the economic decision making and the resource allocation processes of institutions, consumers, producers and other economic actors. Second, the increase in energy prices would necessarily affect both the size and composition of the demand for goods and services. With higher prices – assuming no simultaneous changes in other economic variables – the size of demand by various institutions is expected to decline. Furthermore, given the varying response of commodity groups to changes in energy prices, it is expected that this change will generate various substitution effects between energy and non energy goods based on their relative price level. Again, the changes in the level and composition of demand for goods and services will generate varying effects on the economy wide system. Third, in the absence of appropriate policy measures to reduce the negative impact on demand for commodities, the level of gross output by sector, the magnitude of value added and the income generation and distribution processes will witness similar declining effects. Depending on the structural and behavioral features of the economy, the growth rates of income, spending and saving of domestic institution are also

19
expected to decline. Through a set of multiplier rounds the economy is expected to be in a status of less economic growth and deteriorated welfare measures. Fourth, despite the expected general decline in institutional revenues resulting from higher prices of energy products, this effect is not necessarily equally distributed among domestic institutions. Households and private enterprises will witness a drop in both their income and spending capacities. Government, on the contrary, might improve its overall performance measured by the level of its accumulated savings. In principles, government income will decline due to less current transfers and decreased tax revenues. Government spending might however benefit from the elimination of subsidy transfers. Given the considerable size of government subsidies – which account for 13 percent of its gross income in the base year – the net outcome would be an improvement in government saving behavior. Fifth, the impact on gross domestic product (GDP) is determined by a set of contradicting effects. On the energy sector front, one would expect a net decline in growth rates of energy GDP due to higher prices. The overall growth rate of GDP would however be less affected. This can be explained by observing the changes in the uses of GDP which are composed of final consumption, investment spending and net exports (exports minus imports). Although final consumption expenditures are expected to decline, net exports will increase due to the reduced demand for imported goods caused by the general decline in demand for goods and services. The positive effect on net exports would contribute then to limiting the negative impact on aggregate GDP. Sixth, the last point in tracing the impact of increasing energy prices is the behavior of the economic resource gaps which include; saving-investment gap, foreign trade balance and fiscal gap. Most of these resource gaps are in favor of reducing the distortions of energy prices and the elimination of commodity subsidies. Eliminating subsidies would improves the saving rates of government sector and the decreases its budget deficit. Due to the reduction in government deficit that exceeds the decline in non government savings, aggregate national savings would increase and one would expect a better investment environment on the economy wide level. On the other hand, an ameliorated net exports can contribute to improving external balance or the balance with the outside world. Results of the Reference Path Scenario Based on the economy wide assumptions and scenarios explained in the previous sections and considering the absence of any energy price reforms, the medium term projections (2007/08 – 2011/12) of the reference path can be summarizes as follows:
1. The real (or fixed price) GDP of crude oil and natural gas is expected to grow annually by 2% and 6% on the average, respectively. This growth rate is a direct result of oil and natural gas extraction policies, which fix the rates of increase of their production during the projection period.
2. The real GDP growth of other energy products in real term – petroleum products
and electricity - will depend however on the changes in the levels of residential and industrial demand in the domestic markets, the demand for energy exports and the average price level of energy products. Given the continuation of the energy pricing and subsidy policy, the demand for energy products will increase annually from 6.5% to 13% on the average depending on the type of energy product. Accordingly, aggregate GDP of energy sector will increase from

20
(151,141) LE Million in the base year (2006/07) to around (207,872) LE million in the target year (2011/12) with an average annual growth rate of 6.6%.
3. With no energy pricing policy reform, aggregate real GDP at market price is
expected to grow annually by 7.4% on the average during the projection period. The most growing sectors are industry and services with an average growth rate of 8% annually. This result can be explained by the high growth rate of private investments which is expected to increase by 7% annually. Note that private investments represent around 70% of total gross fixed capital formation. Based on the above results, Aggregate GDP would increase from (729,230) LE million in the base year to the value of (1040,585) LE million in 2011/12.
4. The sources of growth of GDP can be captured by the analysis of its various
uses. These uses include final consumption, investments and net exports of goods and services (exports less imports). Final consumption spending – in the reference path – is expected to increase by 4.5% per year during the projection period. Private and government final consumptions will increase annually by 5% and 4.5%, respectively. The increase in private consumption is explained by the continuing behavioral trends of household demand for goods and services, whereas the yearly increase in government final consumption reflects the directives compatible with the previous policy trends and the projections of the five year development plan (2007-2011). As it was explained above, the government of Egypt is pursuing a policy of encouraging private investments while directing public investments mainly to strategic industries and general government services. Accordingly, private and public investments are assumed to grow in real term by 7.3% and 5.2% annually. The final source of GDP growth is the difference between Exports and imports of commodities (net exports). In the reference path scenario generated by the model, net exports increased from (- 23,999) LE Million in 2006/07 to (67,799) LE Million in 2011/12.
5. Based on the assumptions of the current five-year socioeconomic development
plan for Egypt, the general price level is expected to increase by 6 to 7% during the projection period. This would in principle contribute to higher growth rate of most national accounting indicators in nominal term (or in current prices). For example, projections from the model indicate that annual increase in GDP, gross national product (GNP) and gross national income (GNI) ranges from 11% to 12% on the average. Gross national savings - including consumption of fixed assets – is expected to increase by 14% annually. Finally, under the assumptions of the reference path, the current account surplus of the balance of payments will realize an increase from (15,339) LE Million to (33,057) LE million. This improved performance results from an amelioration in trade balance coupled with an increase in other net transfers from abroad.
6. Based on the reference path assumptions, both energy and non energy subsidy
rates are assumed not to change. When this subsidy policy is coupled with the growth prospects of the Egyptian economy, total value of subsidies in LE million is expected to increase considerably from (42,917) LE Million in the base year to around (141,910) LE Million in 2011/12. Since energy subsidies in the base year account for 77% of total subsidy transferred by government to commodity producers, the larger percent of the growth of subsidy payments comes mainly from the energy subsidies which is expected to increase from (33,099) LE Million in the base year to (125,444) LE Million in 2011/12.

21
7. To assess the overall performance in the economy under the assumptions of the reference path, some composite indicators are computed as a percent of GDP in both nominal and real term. As a percent of GDP, government total revenues have decreased from 38.1% to 31.9% during the projection period. Similarly, households income – as a percent of GDP – has witnessed a small decline from 115.8% in the base year to around 113.8% in 2011/12. This declining performance is However overshadowed by the improvement in per-GDP government savings, trade balance of goods and services and the current account surplus of the balance of payments.
Impact of the Actual Cash Cost Scenario (10 and 5 Years) In This section, the economy wide impact of applying the actual cash cost scenario is analysed in a detailed manner. The analysis will follow the economic rationale of the impact directions discussed previously. This economy wide rationale begins with an analysis of the behaviour of non energy pricing system and the effects on energy and non energy GDP in real term, and then with a discussion of the performance of other principal aggregates of national accounts, the balance of payments and the saving-investment accounts. This detailed discussion of the overall economic effects will be complemented by a sector specific analysis of government and households income and spending flows. A. Non Energy Commodity Prices The increase in energy prices will significantly affect the pricing system of the economy as a whole. It is expected however that the sectors with higher energy consumption rates will be affected more than others. Table(1) summarizes the changes in non-energy domestic prices resulting from applying the actual cash cost scenario. At the end of the projection period, price indices – under the reference path scenario- are expected to increase by a range of 20 to 45 percent on the average. Engineering industries will realize the highest price increase (45%) and the transport fees will increase by only 20%. When the actual cash cost scenario is adopted, the increase in prices jump to a range from a minimum of 29% to a maximum of 48% compared to the base year. The results show that Chemical products are the most affected commodity followed by basic metal products.
B. GDP of Energy Sectors Given the large increase in energy prices, the demand for energy products as well as the energy GDP are expected to be negatively affected during the projection period. As shown in table(2), the average annual growth rates of aggregate energy GDP decreased from 6.6% in the reference path to 4.2% in case of 10-year actual cash cost and to 3.5% in case of the 5-year actual cash cost scenario. The decrease in each sector will depend nonetheless on the size of the price increase, the demand pattern and the adopted production and export policies. For example, the extraction (or the production) rate of crude oil and natural gas follows an exogenous policy variable determined by the government of Egypt. The GDP growth rate – in these two sectors – is expected not to be affected by the increase in energy prices but to rise by their production growth rates. Other energy GDP growth rates depend mainly on the demand pattern and the increase in prices. When applying the ten and five year actual cash cost price reform, The annual growth rate of electricity GDP for example, will decrease from 6.4% in the reference path to 3.8% and 3% in the two price reform scenarios, respectively. Other energy products have witnesses similar decline in their GDP growth rates.

22
Table (1) Impact of Cash Scenario on Domestic Commodity Prices
Price of Domestic goods (2011 / 2012)
Price Indices
Base Year (2006-2007)
Reference Path (2011 / 2012)
Actual Cash
Scenario (10 Years)
Actual Cash Scenario (5 Years)
Fertilizers & Medicals 100 121.8 131.8 133.6
Chemical Products 100 130.3 144.7 148.8
Non-Metallic Products 100 124.5 136.5 140.3
Basic Metal Products 100 127.1 138.3 142.3
Engineering Industries 100 144.9 143.6 142.8
Transportation Fees 100 120.7 126.2 128.5
Table (2) Impact of Actual Cash Scenario on Energy GDP at Fixed Prices
Energy Pricing Scenarios (2007/08 – 2011/12)
Reference Path
Actual Cash Cost Scenario (10) Years
Actual Cash Cost Scenario (5) Years
Economic Indicators (LE Million)
Base Year (2006-2007)
Value Annual growth Av. (%)
Value Annual growth. Av. (%)
Value Annual growth. Av. (%)
Crude Oil 456,968 50,752 2.0 50,752 2.0 50,752 2.0
Natural Gas Sector 64,034 86,502 6.2 86,502 6.2 86,502 6.2
Gasoline Sector 4,327 8,087 13.3 5,841 6.2 5,247 3.9
Fuel Oil (Mazot) 4,394 7,517 11.3 5,966 6.3 5,890 6.0
Gas Oil (Solar) 14,032 27,679 14.6 17,077 4.0 14,393 0.5
LPG 6,772 11,003 10.2 4,850 (6.5) 3,282 (13.3)
Other Products 1,733 2,834 10.4 2,432 7.0 2,385 6.6
Electricity Sector 9,881 13,497 6.4 11,928 3.8 11,426 3.0
Energy GDP 151,141 207,872 6.6 185,349 4.2 179,878 3.5

23
C. Sources and uses of Real GDP In tables (3) and (4), the impact of applying the actual cash cost scenarios on GDP is summarized. These two tables reflect a number of significant results as follows: a) the overall GDP growth rate at market price will slightly decline from 7.4% in the reference path to 7.3% and 7.1% when the two versions of the actual cash scenario are adopted. b) the impact on Growth rates of non energy GDP (except for the construction sector) are very limited. This point applies to agriculture and food, manufacturing and services sectors. c) the growth in Construction GDP and net indirect taxes – as a result of applying the actual cash scenario – overshadows the declining growth rate of energy GDP. d) the average annual growth rate of private final consumption expenditure – as part of GDP uses – has declined from 5% in the reference path to around 3.5% when adopting the actual cash cost scenario. e) the behavior of net exports improves due to the significant decrease in demand for imported commodity and the slight increase in aggregate exports. The above varying effects can be explained by considering the following points:
1. The higher energy and non energy prices would negatively affect the quantity of final and intermediate demand. Based on the results of the model, average annual growth rate of private final consumption spending in real term is expected to decrease from 5% in the reference path to 3.8% and 3.5% when the two versions of the actual cash cost scenarios are adopted.
2. Since the demand for commodities is composed of both domestic and imported
goods, demand for imports is expected also to decline from 4.1% in the reference path to about 2.5% when the actual cash cost scenarios are adopted.
3. Given the exogenous (or fixed) crude oil and natural gas production (or
extraction) rates associated with the decline in domestic demand, the exports of these energy products are expected to grow. Because crude oil and natural gas exports account for a considerable part of total Egyptian export proceeds, overall real exports would relatively increase.
4. The relative increase in exports coupled with the drop in demand for imports
would improve the performance of net exports. The positive effect on net exports mitigates the negative impact on demand for goods and services – reflected in final consumption spending - and then reduces the negative impact on aggregate GDP.
5. On the other hand, the negative impact on energy GDP is overshadowed by two
positive effects; a) the increase in net indirect taxes resulting from the elimination of energy subsidies and b) the observed increase in the GDP of construction sector. The results of the model show that the annual growth rate of the GDP in the construction sector will witness a significant increase from nearly 7% in the reference path to an average of 10% when adopting the two actual cash cost scenarios.
6. The increase in the GDP of construction sector can be explained by tracing the
impact of higher energy prices on the saving behavior of the Egyptian economy. In principle, higher prices would eliminate energy subsidies transferred by government to public enterprises. This would in turn significantly improves the saving behavior of government sector. If this positive impact on government savings is higher than the negative effects on non government savings of house-

24
Table (3) Impact of Actual Cash Scenario on Aggregate GDP at Fixed Prices
Energy Pricing Scenarios (2007/08 – 2011/12)
Reference Path
Actual Cash Cost Scenario (10) Years
Actual Cash Cost Scenario (5) Years
Economic Indicators (LE Million)
Base Year (2006-2007)
Value Annual growth Av. (%)
Value Annual growth Av. (%)
Value Annual growth Av. (%)
GDP Indicators
• Agriculture & Food 146,765 201,026 6.5 201,275 6.5 201,372 6.5
• Industry 56,410 83,938 8.3 84,306 8.4 84,271 8.4
• Energy 151,141 207,872 6.6 185,349 4.2 179,878 3.5
• Construction 32,600 44,795 6.6 52,213 9.9 55,566 11.3
• Services 328,614 512,164 9.3 510,875 9.2 507,881 9.1
GDP at Factor Cost 715,530 1049,795 8.0 1034,018 7.6 1028,967 7.5
Net Indirect Taxes 13,701 2,905 (25.7) 22,851 10.8 27,141 14.7
GDP Market Price 729,230 1040,585 7.4 1035,647 7.3 1025,148 7.1
Table (4) Impact of Actual Cash Scenario on Uses or GDP at Fixed Prices
Energy Pricing Scenarios (2007/08 – 2011/12)
Reference Path
Actual Cash Cost Scenario (10) Years
Actual Cash Cost Scenario (5) Years
Economic Indicators (LE Million)
Base Year (2006-2007)
Value Annual growth Av. (%)
Value Annual growth Av. (%)
Value Annual growth Av. (%)
Total Consumption 597,930 759,670 4.9 720,469 3.8 709,673 3.5
• Private Consumption 513,531 654,494 5.0 615,293 3.7 604,497 3.3
• Public Consumption 84,399 105,176 4.5 105,176 4.5 105,176 4.5
Total Investment 155,300 213,116 6.5 213,116 6.5 213,116 6.5
• Private 97,258 138,331 7.3 138,331 7.3 138,331 7.3
• Public 58,042 74,785 5.2 74,785 5.2 74,785 5.2
Exports 230,597 378,566 10.4 391,174 11.2 386,467 10.9
(Less) Imports 254,596 310,767 4.1 289,111 2.6 284,108 2.2
GDP Uses 729,230 1040,585 7.4 1035,647 7.3 1025,148 7.1

25
holds and private companies, national savings will increase. Given the saving-investment balance on the macro level, the increased growth rate of national savings would enhance Egypt’s capacity to invest. This effect on national savings and investments would necessarily increase the demand for construction services as an important component of the investment spending.
D. Principal Aggregates of National Accounts The aggregates of national accounts generated by the energy economy model under the reference path and the two actual cash cost scenarios are summarized in table (5). The results show a slight improvement in the growth rate of all income generation aggregates. These aggregates include the gross domestic and national products (GDP and GNP) and the gross national income (GNI). When the slight decrease in real GDP corresponding to the actual cash cost scenario is coupled with higher increase in prices, the net outcome could be a moderate amelioration of the national income aggregates in nominal terms. The magnitude of improvements is however very small since it accounts for only 1% on the average. Furthermore, as previously indicated in the second section of this chapter, the increase of energy prices to remove pricing distortions and eliminate subsidies would have a positive impact on most measures of resource gaps. The projected results in table(5) confirm this direction with respect to the national savings and the current account balance with the outside world. The average annual growth rate of national savings in nominal term increased from 14% in the reference path case to reach 20% under the two versions of the actual cash cost scenario. The current account surplus of the balance of payments has witnesses similar improved annual growth as will be described below. E. Impact on the external balance Table(6) summarizes the impact of alternative energy pricing policy on the behavior of exports, imports, trade balance and the current account surplus. The analytical effects of applying the two versions of the actual cash cost scenarios can be delineated as follows:
1. Due to the drop in domestic demand for energy and the fixed extraction rates, crude oil and natural gas exports will significantly increase under the conditions of the 10 and 5-year actual cash cost scenarios. Based on the modeling results, crude oil exports at the end of the projection period (in nominal term) has grown from (12,168) LE Million in the reference path to (25,809) LE million and (27,857) LE Million in the two actual cash cost scenarios, respectively. The exports of natural gas have similarly increased due to the application of the two pricing reform scenarios.
2. On the contrary, the application of the actual cash scenarios has generated
negative impact on exports of petroleum refined products and the non energy commodity exports. For example, non energy exports in 2011/12 have decreased from (412,340) LE Million to (368,767) LE Million due to the application of the five-year actual cash cost scenario.
3. When adding the positive and negative effects of points 1 and 2 on exports, the
outcome is a net increase in total exports from (478,508) LE Million in the reference path to around (500,780) LE Million in the ten-year actual cash cost scenario.

26
Table (5) Impact of Actual Cash Scenario on Principal Aggregates of National Accounts
Energy Pricing Scenarios (2007/08 – 2011/12)
Reference Path
Actual Cash Cost Scenario (10) Years
Actual Cash Cost Scenario (5) Years
Economic Indicators (LE Million)
Base Year (2006-2007)
Value Annual growth Av. (%)
Value Annual growth Av. (%)
Value Annual growth Av. (%)
Gross Domestic Products 729,231 1261,048 11.6 1300,216 12.3 1304,726 12.3
(+) Net Factor Income 27,247 51,460 13.6 50,184 13.0 49,471 12.7
(=) Gross National Products 756,478 1312,508 11.7 1350,400 12.3 1354,197 12.4
(+) Net Current Transfers 12,091 33,491 22.6 34,971 23.7 34,849 23.6
(=) Gross National Income 768,568 1345,998 11.9 1385,371 12.5 1389,046 12.6
(-) Final Consumption 597,930 1012,665 11.1 968,502 10.1 957,796 9.9
(=) National Savings 170,639 333,333 14.3 418,868 19.6 431,250 20.4
(-) Gross Investment 155,300 300,276 14.1 313,995 15.1 320,673 15.6
(=) Current Account Surplus 15,339 33,057 16.7 102,874 47.5 110,577 51.0
Table (6) Impact of Actual Cash Scenario on the Balance of Payments
Energy Pricing Scenarios (2007/08 – 2011/12)
Reference Path
Actual Cash Cost Scenario (10) Years
Actual Cash Cost Scenario (5) Years
Economic Indicators (LE Million)
Base Year (2006-2007)
Value Value Value
Total Exports 203,597 478,508 500,780 494,477
Non-Energy Exports 165,482 412,340 384,037 368,767
Energy Exports 65,115 66,168 116,743 125,711
• Crude Oil 23,636 12,081 25,809 27,857
• Natural Gas 15,034 3,037 49,683 58,248
• Petroleum Products 26,386 50,921 41,165 39,531
Total Imports 254,596 530,401 483,061 468,220
Trade Balance (23,999) (51,893) 17,719 26,258
Current Acc. Surplus 15,339 33,057 102,874 110,577
27
4. On the other hand, the increase in energy prices due to the application of the actual cash cost method, would reduce the demand for imported goods and services due to the expected drop in household consumption spending and the demand for intermediate inputs.
5. The moderate increase in exports coupled with the significant drop in imports –
under the two actual cash cost scenarios - would contribute to improving the performance of the balance of trade for goods and services and the current account surplus as shown in table(6).
F. The Saving Investments Macroeconomic Balance The investment-saving macro balance, shown in table(7), explains the role of the savings of domestic institutions and the borrowing from the rest of the world (or the foreign savings) in financing private and public investments. When the two actual cash cost scenarios are adopted as a strategy to reform energy pricing system, one would expect to have two different effects on the savings of domestic institutions; a) a drop in household, private companies and public enterprises income – due to the effect of higher energy price – coupled with a decrease in their capacity to save, and b) an increase in the savings of government sector given the elimination of subsidy payments as part of the government expenditures account. Again here, the net result will depend on the magnitude of the positive and negative effects on national savings. In table(7), national savings have increased from (333) LE Billion in the reference path to (417) LE Billion and (431) LE Billion when adopting the ten-year and five-year actual cash cost scenarios. Given that the investment spending of private and public sectors in real term is treated as a policy variable with exogenous growth behavior, the difference between national savings and investment spending is channeled to the outside world - either as foreign borrowing that finance domestic investments or as lending to abroad to create foreign assets - in a way to ensure the desired balance between investments and savings on the macroeconomic level. G. Impact on Government Income and Spending The proposed energy price reform is mainly directed to achieve two objectives. The first one is concerned with reducing the distortions in the pricing system via the adoption of more cost reflective prices and the elimination of commodity subsidies. This objective can have a far reaching impact on the decision making process and the behavior of most macroeconomic variables within the economy wide sphere. The second objective is to reduce the burden on government spending - via the elimination of subsidies - and to permit then a better allocation of public finance resources. These effects are captured by observing the changes in government income and expenditure accounts as shown in table(8). The first observation is the negative impact of applying the two actual cash cost scenarios on government income. The annual growth rate of government revenues decreased from 11% in the reference path to around 9% when the two version of the actual cash cost is applied.
This drop of revenues comes from the expected decreases in both the domestic current transfers and the collected direct and indirect tax income. In principle, higher prices of energy products would contribute to a decline in households and enterprises income and then to a drop in direct tax revenues. Similarly, import tax income is expected to decrease given the negative impact on demand for imports under the actual cash cost scenarios. On the expenditure side, the subsidy payments have witnessed a significant changes when the actual cash cost pricing scenarios are applied. In table (8), government subsidy payment in 2011/12 decreased considerably from (141,910) LE

28
Table (7) Impact of Actual Cash Scenario on Saving Investment Macro-Balance
Energy Pricing Scenarios (2007/08 – 2011/12)
Reference Path
Actual Cash Cost Scenario (10) Years
Actual Cash Cost Scenario (5) Years
Economic Indicators (LE Million)
Base Year (2006-2007)
Value Annual growth Av. (%)
Value Annual growth Av. (%)
Value Annual growth Av. (%)
Total Investments 155,300 300,276 14.1 313,995 15.1 320,673 15.6
• Public 58,042 105,371 12.7 110,185 13.7 112,528 14.2
• Private 97,258 194,905 14.9 203,810 16.0 208,145 16.4
Domestic Savings 170,639 333,333 14.3 416,868 19.6 431,250 20.4
• Households 71,657 121,816 11.2 114,298 9.8 111,855 9.3
• Private 107,942 190,734 12.1 179,024 10.3 171,395 9.7
• Public 32,854 52,168 9.7 49,550 8.6 48,653 8.2
• Government (41,814) (31,384) (5.5) 76,996 ▬ 99,348 ▬
Foreign Savings (15,339) (33,057) (16.7) (102,874) ▬ (110,577) ▬
Table (8) Impact of Actual Cash Scenario on Government Income and Expenditures
Energy Pricing Scenarios (2007/08 – 2011/12)
Reference Path
Actual Cash Cost Scenario (10) Years
Actual Cash Cost Scenario (5) Years
Economic Indicators (LE Million)
Base Year (2006-2007)
Value Annual growth Av. (%)
Value Annual growth Av. (%)
Value Annual growth Av. (%)
Government Income 320,780 543,783 11.13 512,486 9.2 502,401 9.4
• Dom.& Foreign Transfers. 206,456 346,766 10.7 327,794 8.6 320,582 8.9
• Direct Tax Income 57,706 69,944 10.9 90,832 8.8 88,841 9.1
• Import Taxes 10,371 20,390 14.5 19,013 11.4 18,543 11.7
• Other Indirect Taxes 46,247 79,684 11.5 75,448 9.8 74,435 10.1
Government Spending
• Dom.& Foreign Transfers. 235,278 293,182 4.5 293,182 4.5 293,182 4.5
• Consumption Spending 84,399 140,075 10.7 149,794 12.2 156,593 13.2
• Government Subsidies 42,917 141,910 27.2 (7,486) ▬ (46,722) ▬
• Government Savings (41,814) (31,384) (5.5) 76,996 ▬ 99,348 ▬

29
Million in the reference path to (- 7,486) LE Million under the ten-year actual cash cost scenario and then to (-46,722) LE Million under the five-year actual cash cost scenario. The negative subsidy in this context, means that government will collect positive rent over and above the cost of producing the subsidized commodity. This additional income has contributed to improving the performance of public savings and consequently reducing government deficit. According to the results of the model, the negative government savings in the reference path (which accounts for – 31,348 LE Million) has turned to a positive value in the two actual cash cost scenarios with values representing 76,996 and 99,348 LE Million, respectively. This positive impact on government savings represents a main determinant in improving the national savings for the Egyptian economy when the energy price reform is adopted.
H. The Impact on Subsidy System Table(9) demonstrate the impact of alternative energy pricing strategies on the cash subsidy payments by commodity type. In the reference path, given the expected 6 to 7% increase of real economic growth coupled with the continuation of current energy subsidy policy, the subsidies of energy sector is expected to increase from (33,099) LE Million in the base year to (125,444) LE Million in the terminal year (2011/12). This result reflects to a great extend the increasing burden of energy subsidy on government spending and the need to adopt a new energy pricing strategy. Similarly, subsidies of non energy sectors have grown from (9,818) LE Million in 2006/07 to (16,466)LE Million in 2011/12 under the assumptions of the reference path. The application of the ten-year actual cash cost scenarios has turned the subsidies of energy commodities from payments by government to a surplus (or positive rent) collected by government. The amount of energy subsidies was (-22,918) LE Million and the non energy subsidy estimates were (15,432) LE Million at the end of the projection period. Under the five-year actual cash cost scenario, the energy subsidies have reached (61,818) LE Million in 2011/12 while non energy subsidy stayed at (15,096) LE Million. As we have concluded in a previous section, the accumulated positive rent has contributed to improving the behavior of government savings, national savings and then the investment environment in Egypt. The disaggregated subsidies between different energy products are also shown in table(9). I. Concluding Remarks The application of new pricing strategy to reform the pricing system of energy sector and reduce the negative impact of subsidies on the allocation of resources and government financing capacity, has produced both positive and negative effects on the performance of the Egyptian economy as a whole as well as its sectors and institutions. The ways for accumulating on positive effects and reducing the impact of the negative effects largely depends on the adopted government economic choices and development options. In table(10), we have estimated a collection of per-GDP composite indicators that can be used to demonstrate the effects of energy pricing policy. On the negative side, the increase in energy prices would contribute to augmenting other domestic prices and then the aggregate inflation rate. This price increase would reduce the demand for final and intermediate consumption goods as well as the income of households and other private and public institutions (including the general government sector). This is reflected on government earned transfers and the income collected from various types of taxes. In table (10), both per-GDP income and expenditures of households have declined when the two actual cash cost scenarios are considered. Furthermore, the GDP at factor cost shows a slight drop and the energy GDP declines significantly. Finally, the growth rates of non energy exports are expected to decrease due to high energy prices associated with the adopted actual cash cost scenarios. In table(10), non oil exports - as a percent

30
Table (9) Impact of Actual Cash Scenario on Commodity Subsidies
Energy Pricing Scenarios (2007/08 – 2011/12)
Reference Path
Actual Cash Cost Scenario (10) Years
Actual Cash Cost Scenario (5) Years
Economic Indicators
(LE Millions)
Base Year (2006-2007)
Value Annual growth Av. (%)
Value Annual growth Av. (%)
Value Annual growth Av.(%)
Total Subsidies 42,917 141,910 (7,486) (46,722)
• Energy 33,099 125,444 (22,918) (61,818)
• Non-Energy 9,818 16,466 15,432 15,096
Energy Subsidies 33,099 125,444 (22,918) (61,818)
• Natural Gas 6,282 43,876 4,604 (2,655)
• Gasoline 2,794 9,705 (2,895) (6,404)
• Fuel Oil (Mazot) 2,937 14,833 514 1,363
• Gas Oil (Solar) 12,016 33,813 3,664 (3,672)
• LPG 6,679 13,889 (385) (5,294)
• Other Products 390 1,118 (542) (1,191)
• Electricity 2,000 8,209 (27,877) (43,962)
Table (10) Impact of Actual Cash Scenario on Per-GDP Indicators
Energy Pricing Scenarios (2007/08 – 2011/12)
Reference Path
Actual Cash Cost Scenario (10) Years
Actual Cash Cost Scenario (5) Years
Per-Capita Indicators
Base Year (2006-2007)
Value (%)
Annual growth (%)
Value (%)
Annual growth (%)
Value (%)
Annual growth (%)
Government Revenues 38.1 31.9 ▬ 40.0 ▬ 42.1 ▬
Government Savings (5.7) (2.5) ▬ 5.9 ▬ 7.6 ▬
Household Revenues 115.8 113.8 ▬ 103.6 ▬ 101.0 ▬
Trade Balance (303) (4.1) ▬ 1.4 ▬ 2.0 ▬
Current Account Surplus
2.1 2.6 ▬ 7.9 ▬ 8.5 ▬
Private Consumption 70.4 69.2 ▬ 63.0 ▬ 61.4 ▬
Investment Spending 21.3 23.8 ▬ 24.2 ▬ 24.6 ▬
Oil Exports 8.9 5.2 ▬ 9.0 ▬ 9.6 ▬
Non-Oil Exports 22.7 32.7 ▬ 29.5 ▬ 28.3 ▬
Imports 34.9 42.1 ▬ 37.2 ▬ 35.9 ▬

31
of GDP – has decreased from 32.9% to 28.3% in 2011/12 when the energy price reform is considered. On the positive side, both government revenues and savings – as a percent of GDP- have improved. Per-GDP Government savings have increased at the end of the projection period from -2.5 % in the reference path to 5.9% and 7.6% when applying the ten-year and five-year actual cash cost scenario, respectively. Another considerable positive impact is related to the economic resource gaps such as national savings, trade balance of goods and services and the current account of the balance of payments. In table(10), the current account surplus has significantly increased – as a percent of GDP - from 2.6% in the reference path to 7.9% and 8.5% a a result of adopting the ten-year and five-year versions of the actual cash cost scenarios, respectively.
REFERENCES 1. Bergman, L. (1988) “Energy Policy Modeling: A Survey of General Equilibrium
Approaches”, Journal of Policy Modeling, Vol. 10, No. 3, pp: 377-399. 2. Bergman, L. (1982) “A System of Computable general equilibrium Models for a
Small Open Economy”, Mathematical Modeling, Vol. 3, and pp: 421-435. 3. Blitzer, C. R. and R. Eckaus (1988) “An energy Economic Interaction Model for
Egypt”, Organization of Energy Planning (OEP), Egypt. 4. Dervis, K., J. De Melo and S. Robinson (1982) “General equilibrium Models for
Development policy.” Cambridge University Press. New York. 5. Drud, A., W. Grais and G. Pyatt (1986) “Macroeconomic Modeling Based on
Social Accounting Principles. “Journal of Policy modeling. Vol. 8. No. 1:111-145. 6. Hudson, E. A. and Jorgenson, D. W. (1975) “U.S. Energy Policy and Economic
Growth”, Bell Journal of Economics and Management Science, Vol. 5, No. 2, and pp: 461-514.
7. ILO. (1987) “Social Accounting Matrix: A Tool for Socioeconomic Planning and
Analysis”, International Labor Office, Geneva. 8. Keuning, S.J. (1994) “The SAM and beyond: Open, SESAME!” Economic System
Research, Journal of the International Input-Output Association, Vol. 6, No. 1, pp: 21-50.
9. Keuning, S.J and W. De Ruijter (1987) “Guidelines for the Construction of a Social
Accounting matrix”, the international Symposium on the social accounting matrix: Methods and application, Naples, Italy, June 17-19.
10. Khorshid M. (2008) "Social Accounting Matrices for Modeling and Policy Analysis-
Development Issues from the Middle East" Proceedings of the International Conference on Policy Modeling, Berlin, Germany, July 2-4.

32
11. Khorshid M., Shehab Marzban (2005) “An Interactive GAMS-based Model Management System for Economy Wide Analysis”, Proceedings of The Third International Conference on Informatics and Systems, CairoUniversity, 19-22 March.
12. Khorshid M. (2004) “Model-Centered Government Decision Support Systems for
Socioeconomic Development In The Arab World”, Proceedings of The International Conference On Input-Output and General Equilibrium: Data, Modeling and Policy analysis” Brussels, Belgium, 2-4 September.
13. Khorshid M., Hesham Hassan, Mohamed Abdel Hamied (2004) “Towards An
Intelligent Model-Based Decision Support System for An Integrated Oil Company”, Proceedings of The Seventh International Conference for chemical Engineering, The Egyptian Engineers Association, Cairo, 27-29 December.
14. Khorshid, M. H. and Y. Al-Ibraheem (2001) “Analysis of Public finance Policies in
Kuwait Using an Economy wide Model” Arab Economic Journal, accepted for publication in February (in Arabic).
15. Khorshid, M. (2001) “A Prototype Labor Market economic Interaction Model for a
Gulf cooperation Council country”, The Middle East Business and Economic Review, Vol. 13, No.1,July
16. Khorshid, M.H. (1998) “An Issue-oriented Multi-sector Economy-wide Simulation
Model for Kuwait- Database, Economic rationale and Mathematical Specifications.” Unpublished Report, The Ministry of Planning, Kuwait.
17. Khorshid, M.H (1996) “A Multi-sector Population Economy-wide Simulation Model
for Egypt.” Finance and Industry. The Industrial Bank of Kuwait. No. 12: 39-155. 18. Khorshid, M.H. (1994) “A Dynamic Multi-sector Economy-wide Model for Egypt:
Database, Structure and Policy Analysis.” The IBK Papers. The Industrial Bank of Kuwait. No. 41: 1-68.
19. Khorshid, M. H. and O. M. Osman (1994) “An energy Economy-wide Interaction
Model for Egypt: Database, Structure and Mathematical Specifications” Unpublished Technical Report, Organization of Energy Planning (OEP) and Institute of National Planning (INP), March.
20. Khorshid, M.H. (1991) “A Social-accounting-matrix-based Long-term Model for a
Gulf Cooperation Council Country.” Economic Systems Research, Vol. 3. No. 3: 229-313.
21. Khorshid, M. H. (1990) “A Dynamic Macroeconomic Model for Kuwait- Analysis of
the Medium-term Path.” Energy Economics.Vol.12. No. 4: 289-301. 22. Khorshid, M. and B. Khalaf (1989) “An Accounting Framework for Medium Term
development Planning “Kuwait Institute for Scientific research, technical Report No. KISR 3075, Kuwait, July.
23. Khorshid, M., J. Dahdah and N. Al-Mussallam (1988) “A Consistent Data
Framework for the Kuwaiti Economy: the Social Accounting Matrix of 1983”,

33
Report No. KISR 2888, Ed 11, Kuwait Institute for Scientific Research, Kuwait, December.
24. Khorshid, M. (1986) “National Accounts and Social accounting Matrices- an
Application to the Kuwaiti Economy”, Finance and Industry, IBK, No. 7, December. 25. Manne, A. (1977) “ETA-Macro: A Model of energy economic Interactions”, EA-
592, Research Report 1o14, Palo Alto: Electric Power Research Institute. 26. Nordhaus, W. D. (1974) “The Allocation of Energy resources”, Brookings Papers
on Economic activity, Vol.4, pp: 529-577. 27. Pyatt, G. (1991) “Fundamentals of social accounting”, Economic System research,
No.3, pp: 315-341. 28. Pyatt, G. and J. I. Round (1985) “Social Accounting Matrices – A Basis for
Planning”, the World Bank, Washington, D. C., U.S.A. 29. Quesnay, f. (1972) “Tableau economiquie” Macmillan, London; Kelley, New York. 30. Robinson, S. (1989) “Multisectoral Models” Chapter 18 in Chenery and T.
Srinivasan. (eds) Handbook of Development Economics. Elsivier Publishers. Amsterdam.
31. Stone, R. (1997) “The Accounts of Society”, The American Economic review, Vol.
87,No. 6, December, pp: 17-29. 32. Stone, R. (1981) “Aspects of Economic and Social Modeling”, Librairie Droz,
Geneva. 33. Taylor, L. (Ed), (1990) “Socially relevant policy Analysis: Structuralist CGE Models
for the Developing World.” MIT Press. Cambridge. 34. The Government of Egypt (2008) “ Energy Cost of Supply and Pricing”, Un-
published Technical Report, prepared by KANTOR Management Consultants and Environmental Quality International (EQI), November,26.
35. United Nations (1968) “A System of National Accounts”, Studies in Methods,
Series F, 2, Rev. 3, United Nations, New York. 36. United Nations (1993a) “A System of National Accounts”, Studies in Methods,
Series F, 2, Rev. 4, United Nations, New York. 37. United Nations (1993b) “Integrated environmental and Economic Accounting”,
Studies in Methods, Series F, 61, United Nations, New York.