an enhanced rcs heuristic and an enhanced rcpm algorithm
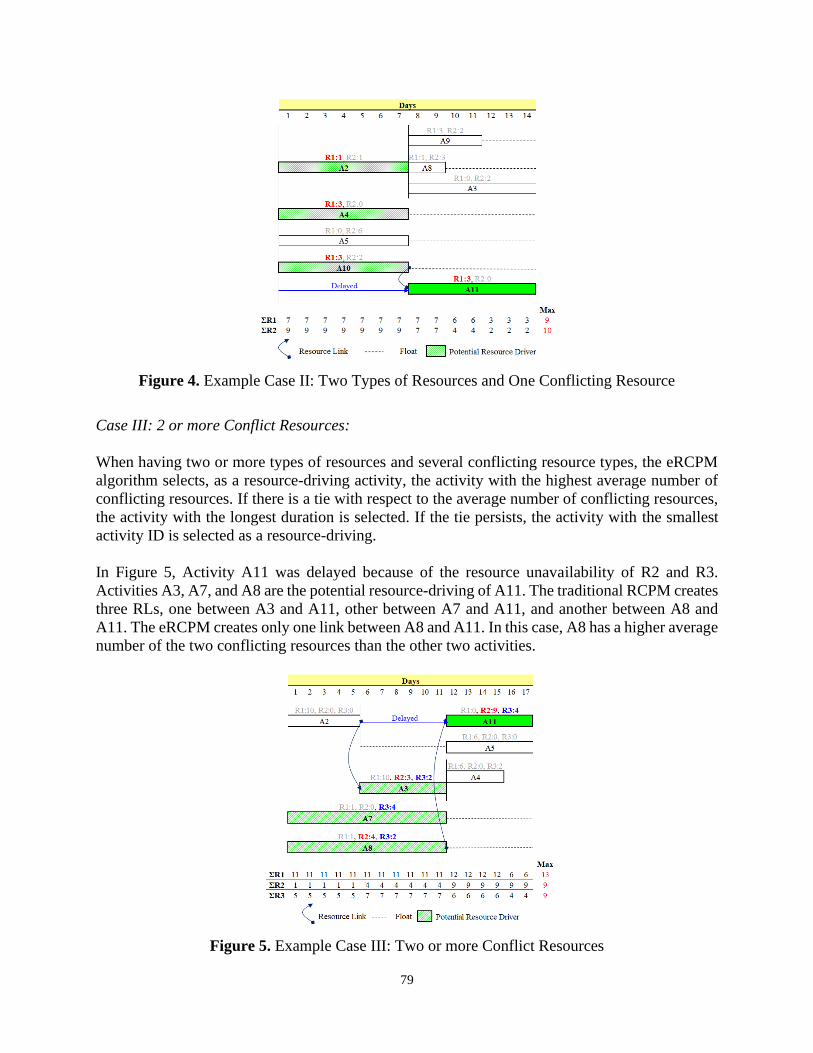
TRANSCRIPT
An Enhanced RCS Heuristic and an Enhanced RCPM Algorithm to Perform Delay
Analysis in Schedules without Phantom Float
By
Diana Marcela Franco Duran
Dissertation submitted to the faculty of the Virginia Polytechnic Institute and State
University in partial fulfillment of the requirements for the degree of
Doctor of Philosophy
In Civil Engineering
Jesuacutes M de la Garza Chair
Subhash C Sarin
Michael J Garvin
Farrokh Jazizadeh
March 16 2020
Blacksburg Virginia
Keywords Phantom Float Primavera P6 Resource Overallocation Resource-
Constrained Scheduling Resource-Depend Activity Relationships
Copyright copy 2020 Diana M Franco Duran
An Enhanced RCS Heuristic and an Enhanced RCPM Algorithm to Perform Delay
Analysis in Schedules without Phantom Float
Diana Marcela Franco Duran
ACADEMIC ABSTRACT
On a regular basis project managers concentrate their efforts on critical and near-critical
activities However the concepts of total float and critical path lose their significance after
applying resource-constrained scheduling (RCS) methodologies RCS techniques solve the
resource conflicts but create phantom float in the schedules (ie a float that does not exist)
RCS techniques overlook the resources relationships between activities that compete for the
same but unavailable resources Therefore each time an activity uses this apparent float
(phantom float) there is a resource violation in the schedule
Due to the projectsrsquo size and complexity schedulers use scheduling software such as Primavera
P6 to fix the resource conflicts of a schedule The software correctly determines the activitiesrsquo
earliest dates that satisfy the resource limitations but they calculate total float based on a ldquoTime
Contextrdquo ignoring the presence of resource constraints Thus the results show incorrect total
float values and a broken critical path The lack of a continuous critical path makes impossible
the anticipation of the impact of a delaying event in the project completion time
Several algorithms have been developed to address the shortcomings of RCS methods These
RCS related algorithms were developed with the aim of providing project managers a tool to
correctly schedule and identify critical activities with respect to time and resource allocation
and correctly calculate the total float of each activity under resource constraints In this regard
the Resource-Constrained Critical Path Method (RCPM) is an algorithm that correctly
calculates the floats of activities and identifies a continuous critical path in resource-
constrained schedules
Regardless of the RCPM provides more reliable float values than traditional RCS-related
algorithms there are some shortcomings that must be addressed to enhance its capability This
study addresses the existing shortcomings of RCPM to make it more practical for real
construction projects
An Enhanced RCS Heuristic and an Enhanced RCPM Algorithm to Perform Delay
Analysis in Schedules without Phantom Float
Diana Marcela Franco Duran
GENERAL AUDIENCE ABSTRACT
One of the challenges of resource allocation is resource availability because oftentimes the
resource demand exceeds the supply When resources are over-allocated activities are delayed
until resources become available
Due to the projectsrsquo size and complexity schedulers use available software to solve the
resource conflicts of a schedule After testing Primavera P6 versions and MS Project v2016
both software create phantom float in a resource-constrained schedule This is the RCS
calculations suggest that activities have float but this float might not exist at all
Resource-Constrained Scheduling (RCS) techniques mitigate a resource supply-demand
problem but fail to identify a project critical path The methods do not consider the resource-
activity dependencies that arise when activities are delayed due to resource limits As a result
the critical path is broken and all the activities must be considered as critical
To provide correct float values and a continuous critical path the Resource-Constrained
Critical Path (RCPM) was introduced by Kim and de la Garza in 2003 Regardless of the
RCPM provides more reliable float values than traditional RCS-related algorithms there are
some shortcomings that must be addressed to enhance its capability This study addresses the
existing shortcomings of RCPM to make it more practical for real construction projects
iv
To God
Thanks for being my rock
my fortress and my shield
on this journey
v
ACKNOWLEDGMENTS
There are many who helped me along the way on this journey I want to take a moment to
thank them
First I would like to express my deepest gratitude to my advisor Dr Jesuacutes de la Garza
Thank you for believing in me before I believed in myself Thank you for giving me the
opportunity to make one of my dreams come true ldquoGraciasrdquo Your support and guidance
were essential to achieve this important milestone in my life Now I look back and I cry
for the same two reasons you mentioned on day one Thank you for your PATIENCE
valuable advice and encouragement Thank you for all the lessons stories and laughs (I
already miss our weekly meetings in 117 Patton Hall) Thank you for helping me to
navigate towards a successful career Thank you for pushing myself so I could reach my
full potential You will ALWAYS BE part of an important chapter of my life
I would also like to thank the members of my committee Dr Michael Garvin Dr
Farrokh Jazizadeh and Dr Subhash Sarin Thank you for your time comments and
constructive feedback throughout this process Your valuable insights were essential for
the successful development of my research work
I would also like to thank my family for supporting me throughout these years To my best
friend Freddie Salado I enjoyed every single moment I shared with you Thanks to you
I proved that friends become family when you are far away from home
Finally but not least to my fellow for life David I am forever grateful for your patience
and understanding Your love helped me to finish strong It is time to celebrate you earned
this degree right along with me
vi
TABLE OF CONTENTS
Page
INTRODUCTION1
CHAPTER 1 Phantom Float in Commercial Scheduling Software
Abstract 2
Introduction 2
Background 4
Methodology 7
Results 8
Discussion 14
Conclusion 15
References 16
CHAPTER 2 Review of Resource-Constrained Scheduling Algorithms
Abstract 19
Introduction 19
Methodology 21
Algorithms Review 23
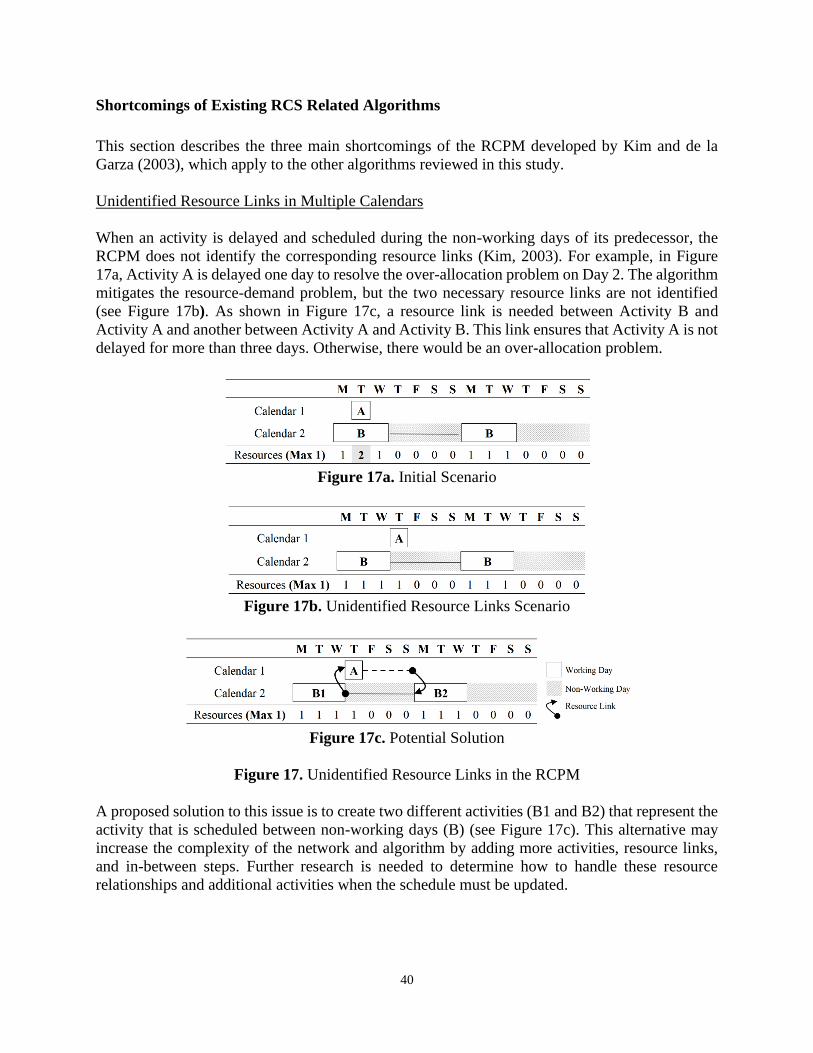
Shortcomings of Existing RCS Related Algorithms 40
Discussion 42
Conclusion 44
References 45
CHAPTER 3 Performance of Resource-Constrained Scheduling Heuristics
Abstract 49
Introduction 49
Theoretical Background 50
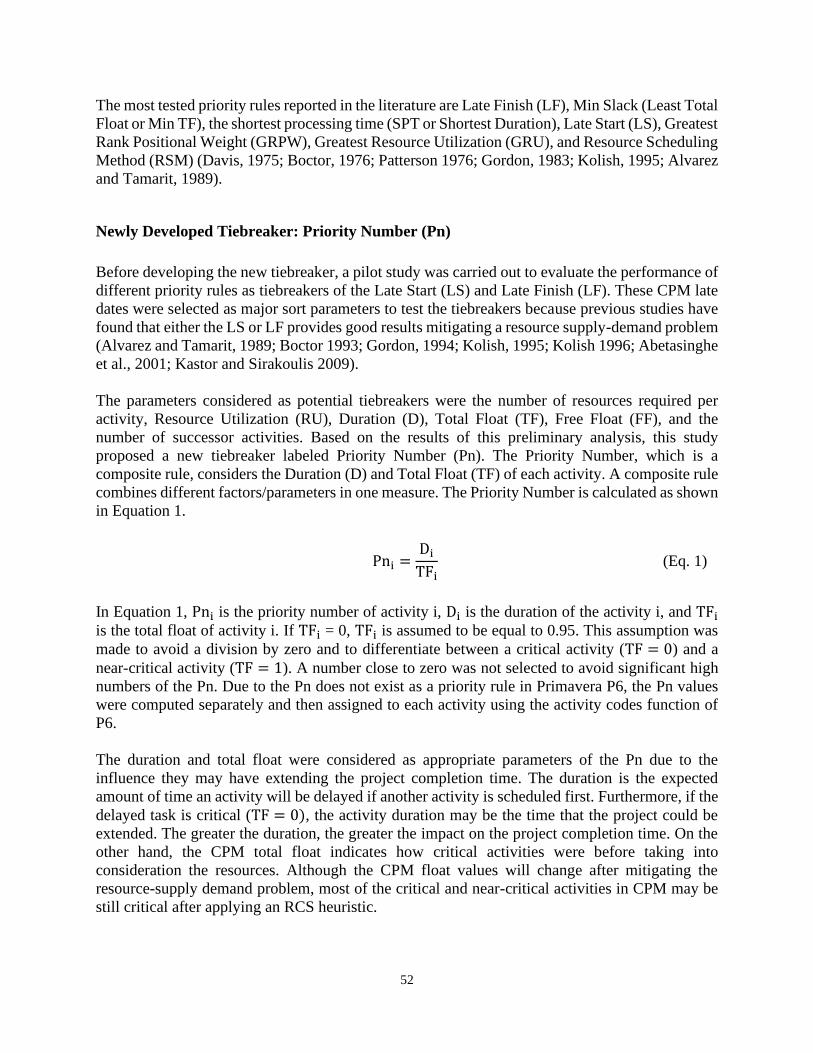
Newly Developed Tiebreaker Priority Number (Pn) 52
Methodology 53
vii
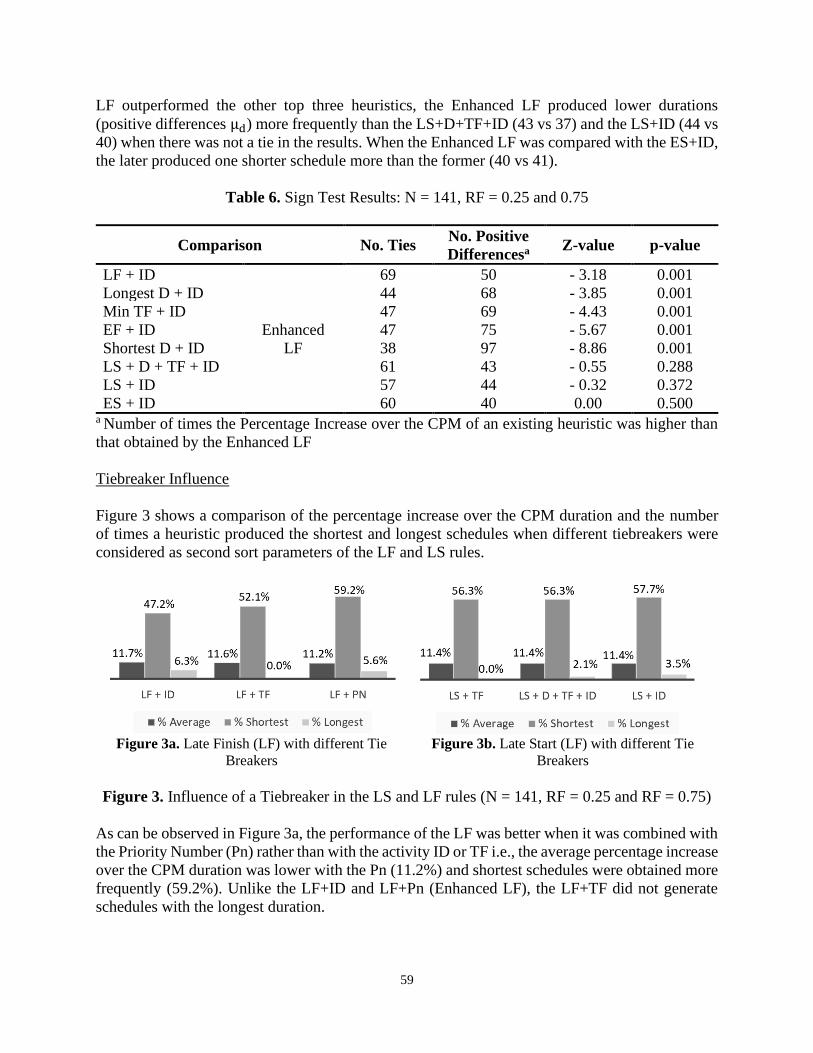
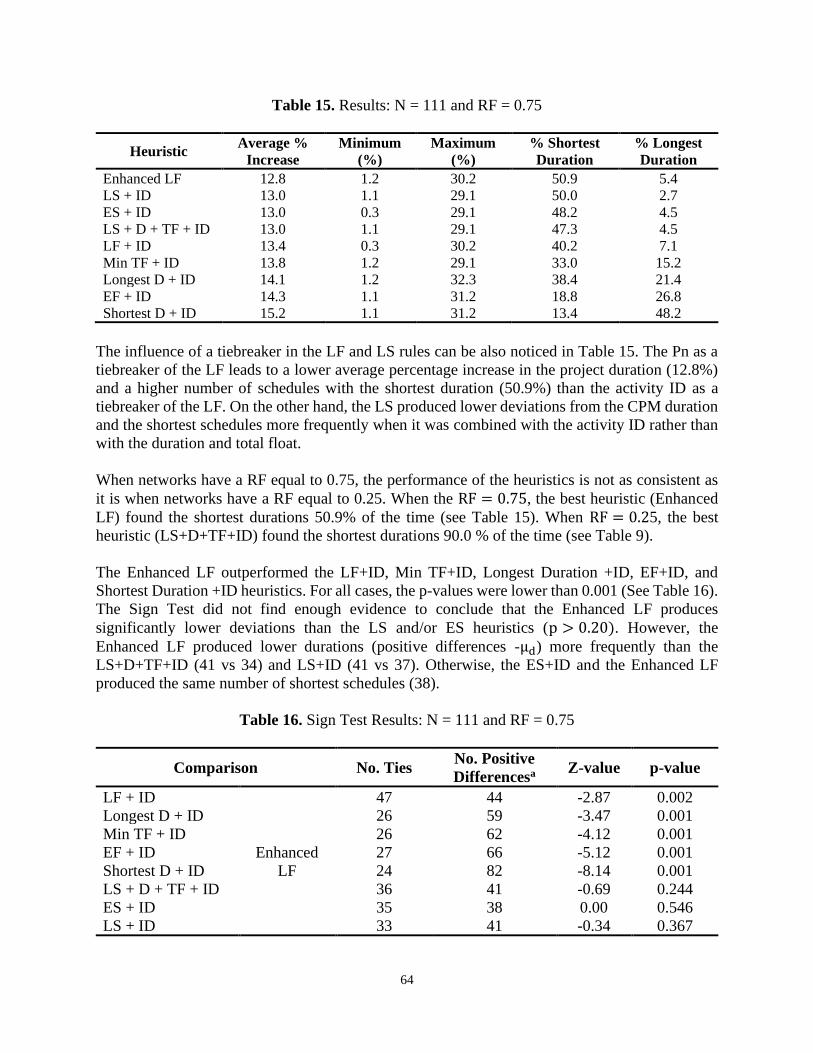
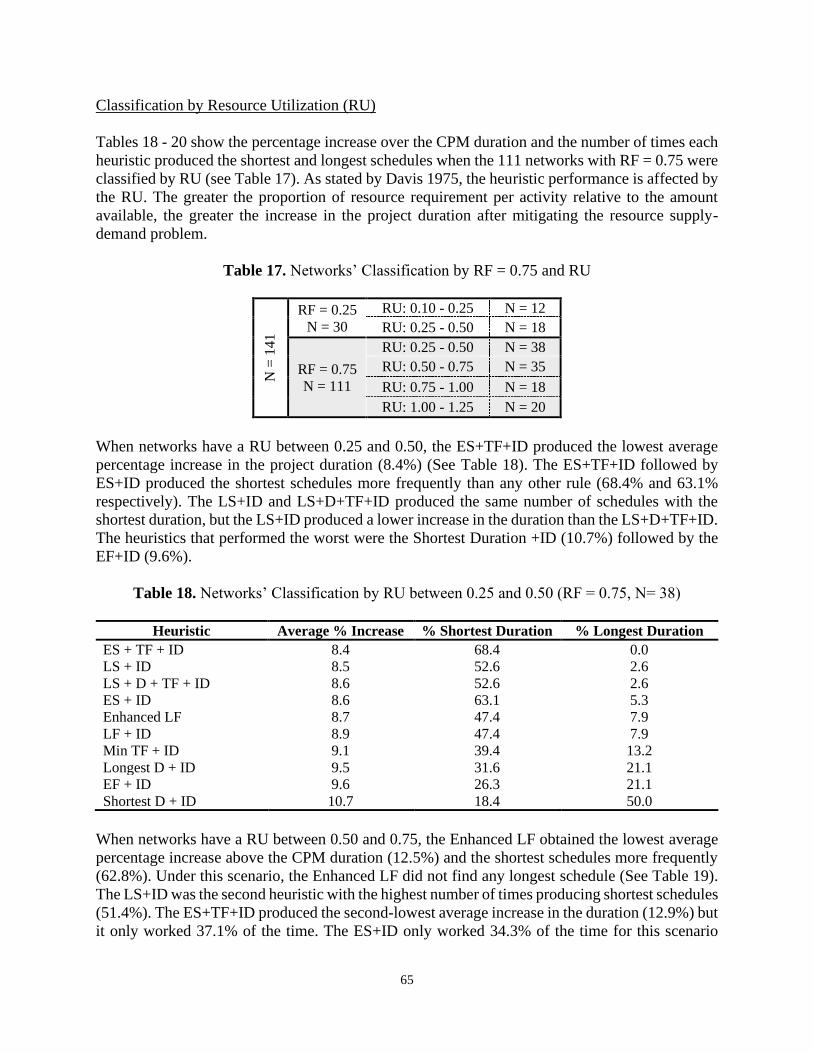
Results 58
Discussion 68
Conclusion 70
References 71
CHAPTER 4 Application of An Enhanced Resource-Constrained Critical Path
Method (eRCPM) to Non-progressed and Progressed Schedules
Abstract 73
Introduction 73
RCPM Shortcomings 74
Enhanced Resource-Constrained Critical Method (eRCPM)75
Enhanced RCPM (eRCPM) System 82
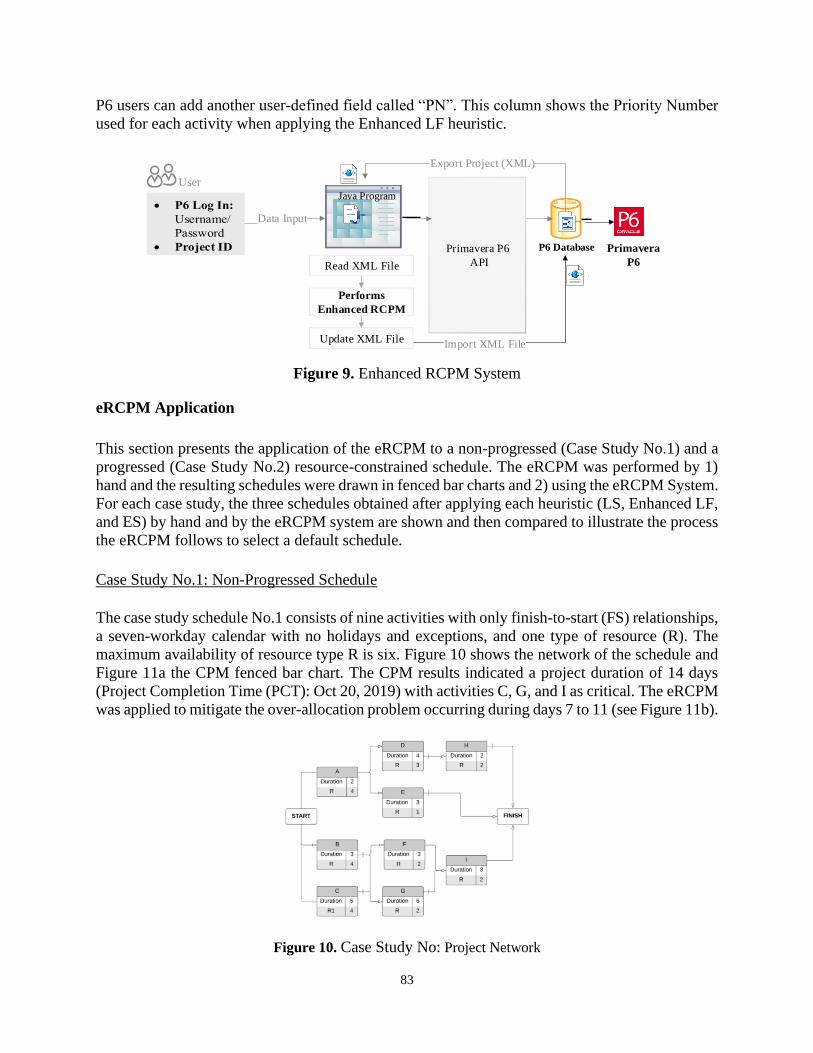
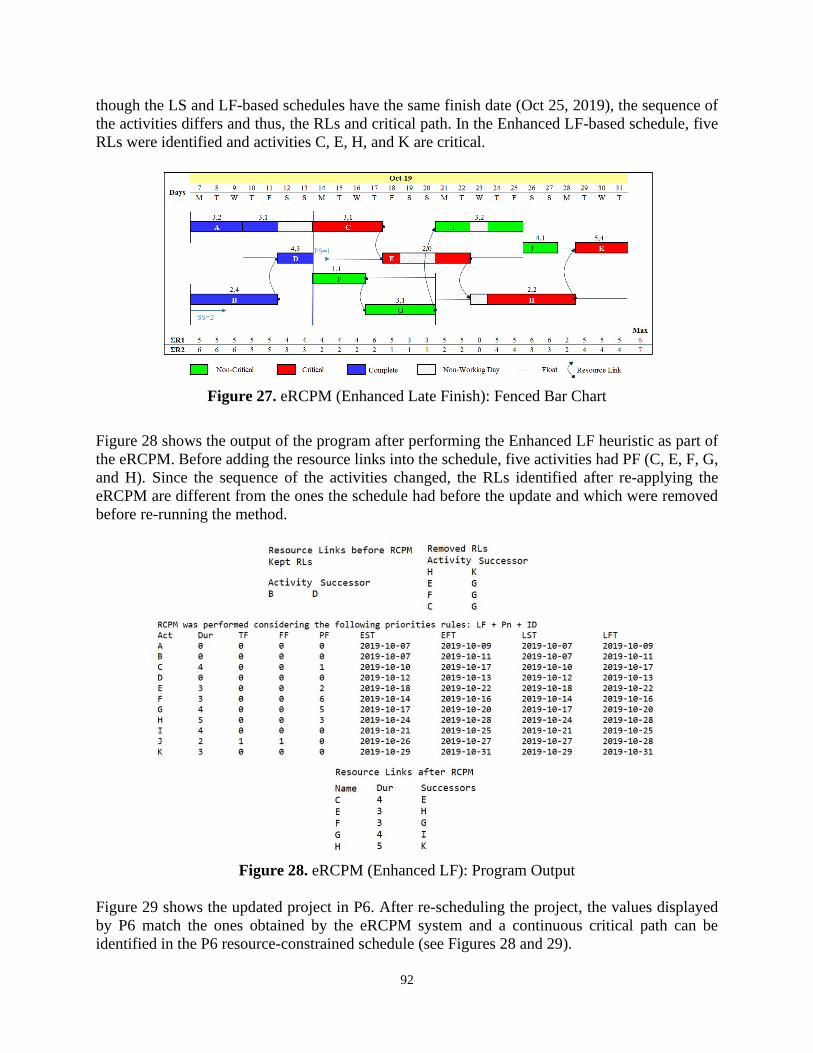
eRCPM Application 83
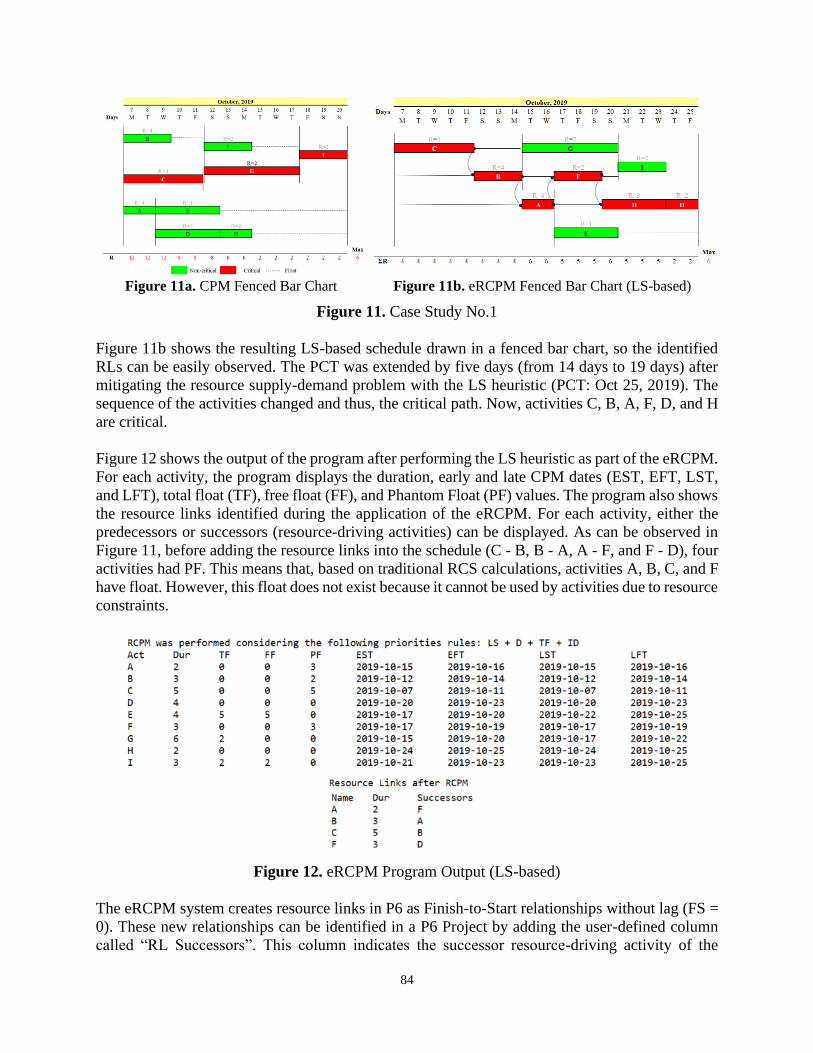
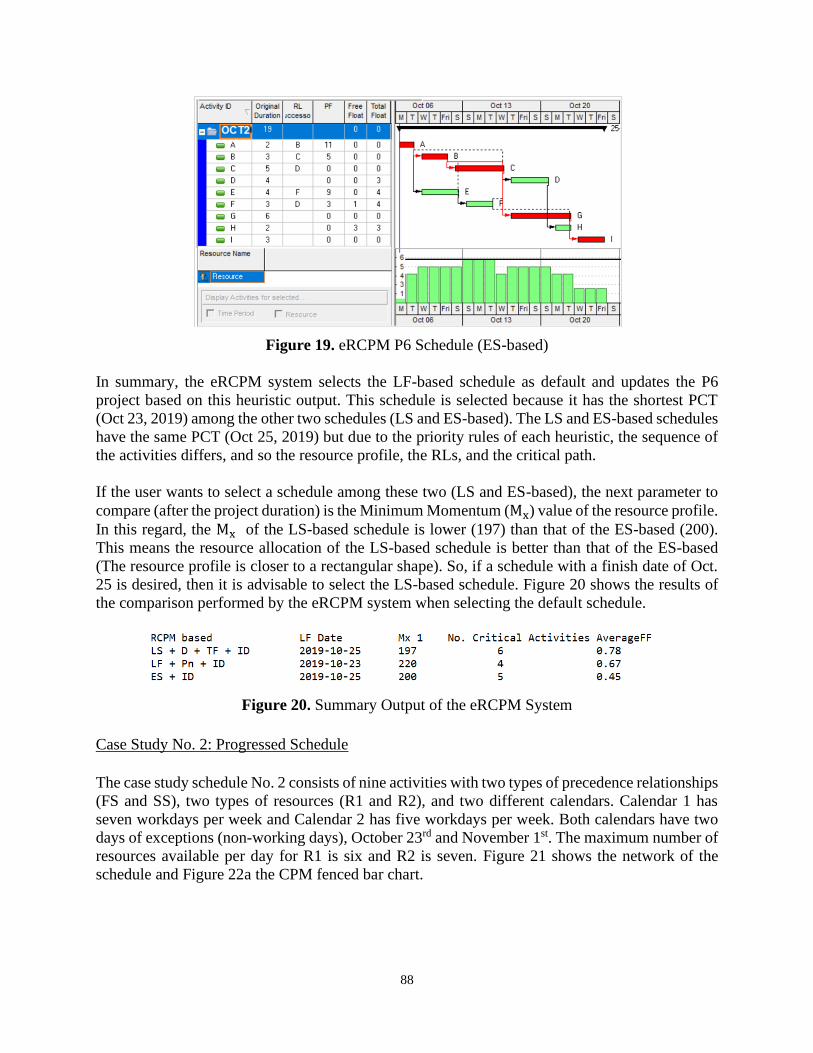
Case Study No1 Non-Progressed Schedule 83
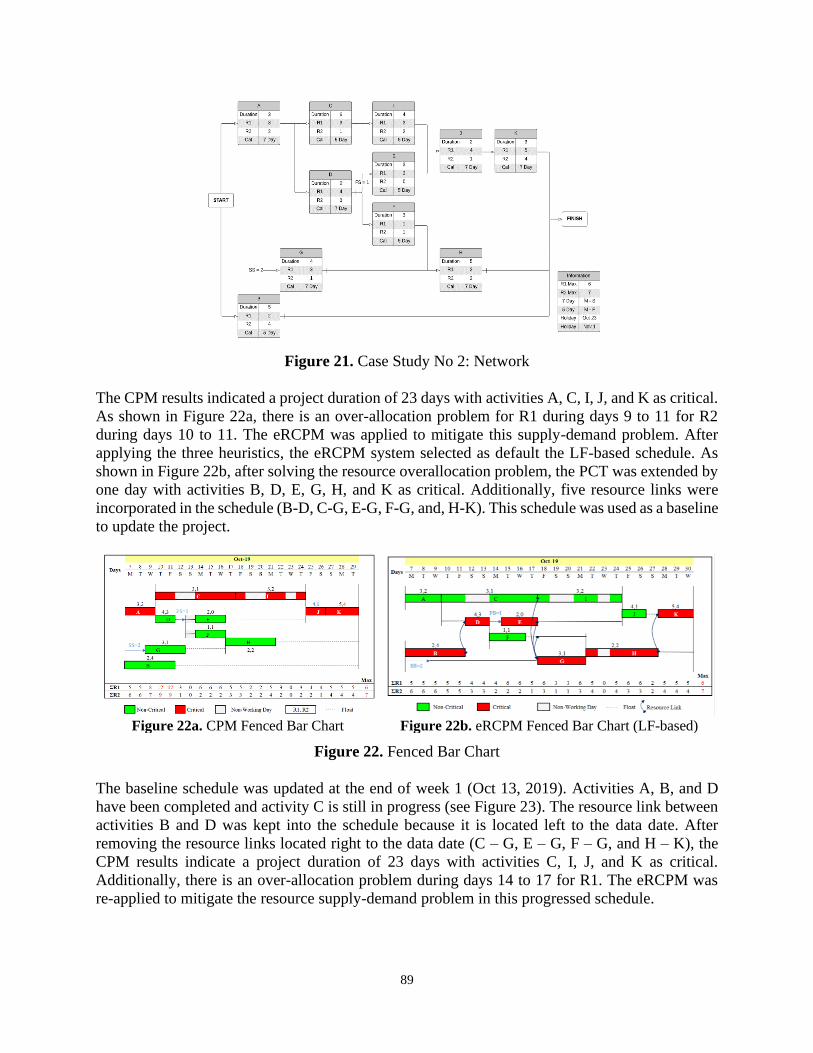
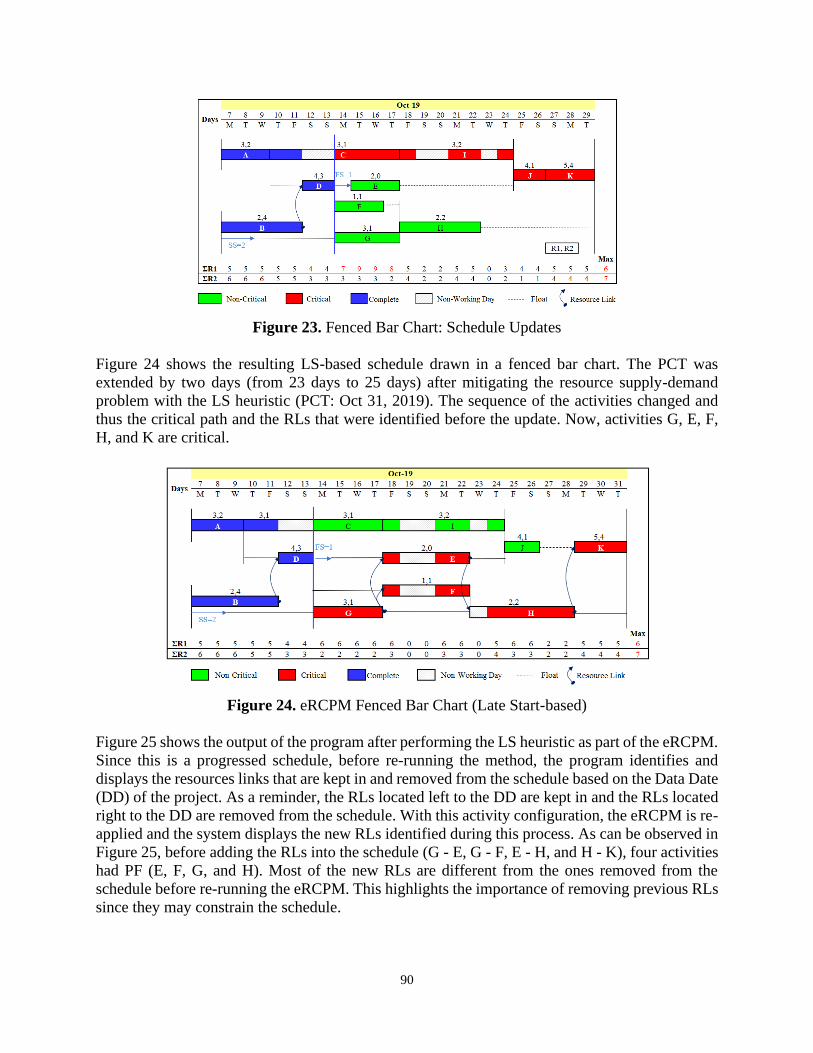
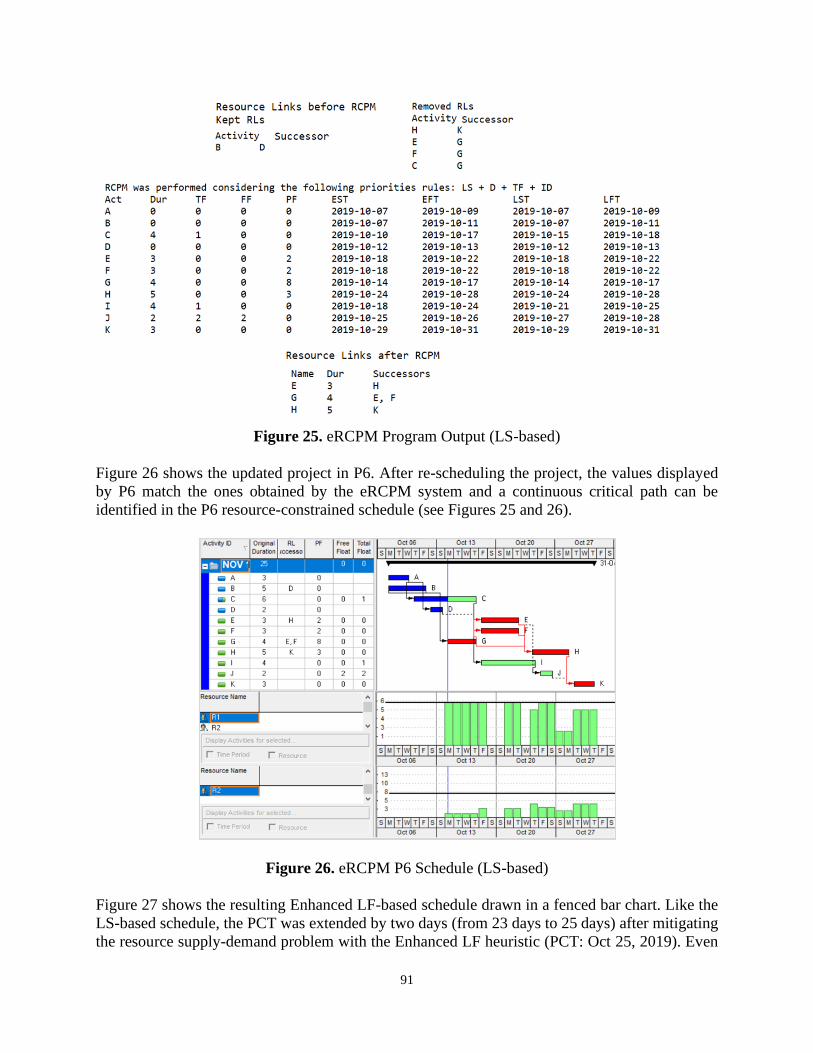
Case Study No 2 Progressed Schedule 88
Future Research and Limitations95
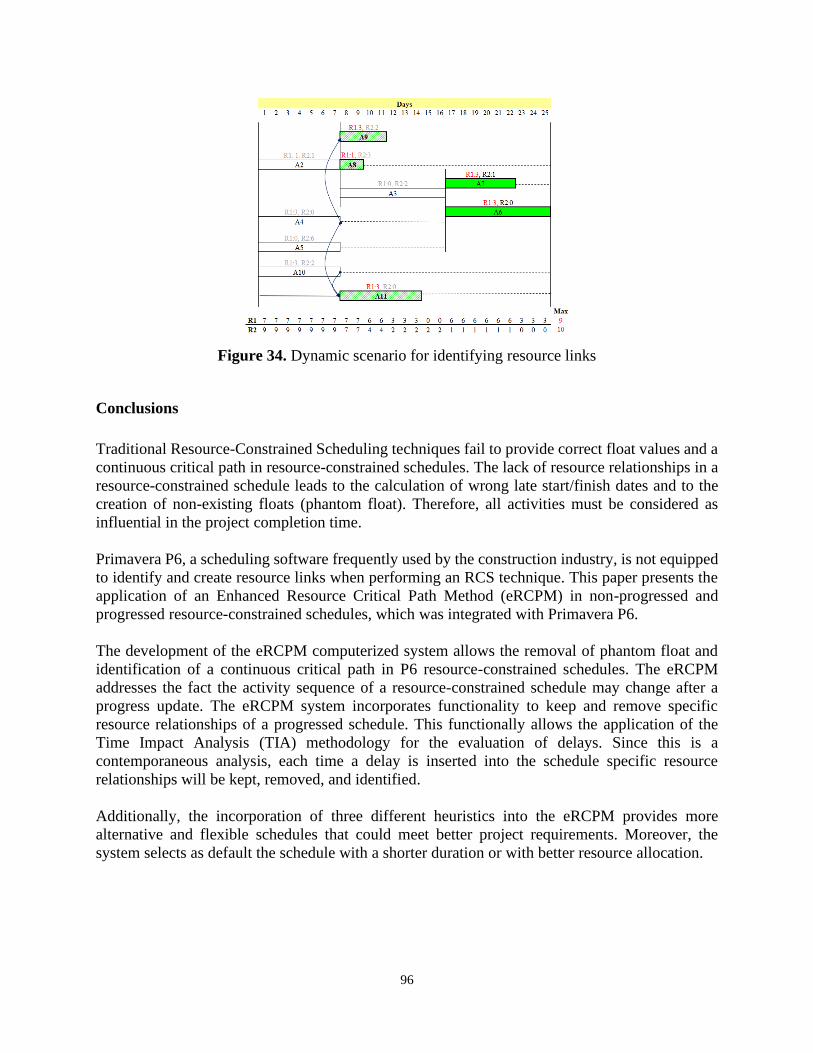
Conclusions 96
References 97
CONCLUSION 98
Contributions to the Body of Knowledge 98
Future Research 100
REFERENCES 102
1
INTRODUCTION
This study 1) developed an Enhanced Late Finish (LF) heuristic for scheduling activities
under resource constraints in which the project duration compares favorably with the
results of other existing heuristics under specific scenarios (Objective 1) 2) enhanced the
Resource-Constrained Critical Path Method (eRCPM) (Objective 2) and 3) developed an
eRCPM computerized system (Objective 3)
To meet these objectives this study first illustrated in Chapter 1 the presence of phantom
float in Primaverarsquos P6 v161 and Microsoftrsquos Project v2016 schedules This section
highlights the need of incorporating an algorithm that correctly identifies a critical path in
resource-constrained schedules and that users of P6 and MS Project should recognize that
the calculation of total float by the software relies on a time-based context ignoring the
presence of resource constraints
Then this study reviewed existing RCS related algorithms with the purpose of identifying
the shortcomings that must be addressed so they can be applied for delay analysis In this
regard Chapter 2 shows the performance of eight RCS-related algorithms discusses
potential solutions to the identified shortcomings provides recommendations on the
algorithms that can be used by industry professionals and proposes a system to facilitate
the selection of an algorithm based on their common features constraints and project
characteristics
Subsequently to achieve Objective 1 this study first analyzed the influence of different
tiebreakers that are usually incorporated in RCS heuristics In this regard Chapter 3
describes a new tiebreaker (Priority Number - PN) which improves the performance of the
Late Finish heuristic Additionally this section shows the performance of the Enhanced LF
heuristic compared to the other eight existing RCS heuristics and describes a heuristicsrsquo
performance classification system to help schedulers deciding which heuristic applies
when mitigating the resource supply-demand problem
Finally to achieve Objective No2 and Objective No 3 this study addressed the following
flaws of the existing RCPM number of RCS heuristics removal of resource links in
progressed schedules identification of resource-driving activities selection of a default
schedule and lack of a computerized system In this regard Chapter 4 describes the
Enhanced RCPM (eRCPM) and shows its application in non-progressed and progressed
resource-constrained schedules throughout the prototype system of the algorithm that was
developed and integrated with Primavera P6
Finally the main contributions to the body of knowledge and limitations of this study as
well as future research can be found in the conclusions section
2
CHAPTER 1
Phantom Float in Commercial Scheduling Software1
Abstract
On a regular basis construction professionals use scheduling software to resource load the
schedules without paying attention to the resulting critical path Current scheduling
software fix the resource supply-demand problem by performing a Resource-Constrained
Scheduling (RCS) technique but they report incorrect total float values and a broken
critical path
RCS calculations suggest that activities have float but much of this float does not exist
(phantom float) Phantom float is created in resource-constrained schedules because the
existing RCS methodologies neglect the resource relationships that arise between activities
when competing for the same but unavailable resources This paper illustrates the presence
of phantom float in Primaverarsquos P6 and Microsoftrsquos Project schedules After removing
phantom float from the schedule non-critical activities may become resource critical and
the actual float may be shorter than calculated or may be altogether non-existent
Users of P6 and MS Project should recognize that the calculation of total float by the
software relies on a time-based context (LF ndash EF andor LS ndash ES) ignoring the presence
of resource constraints Therefore the float reported cannot be trusted or used to mitigate
delaying events like the traditional time-based context definition of total float suggests
Currently research is being carried out in order to remove phantom float from P6 and
Microsoft Project schedules
Keywords Phantom Float Resource-Constrained Schedules Scheduling Software
Introduction
Since its emergence in the late 1950s the Critical Path Method (CPM) has been widely
applied in the construction industry The results of the four surveys taken by the
Engineering New-Recordrsquos (ENR) Top 400 contractors in 1970 1987 2003 and 2017
show that on average 93 of the contractors responding apply CPM on their projects
(Davis 1974 Tavakoli and Riachi 1990 Kelleher 2004 de la Garza and Franco-Duran
2017) CPM is considered a useful tool to plan and to coordinate project work (Baki 1998
Liberatore Pollack-Johnson Smith 2001) The results of a survey taken by 240 project
management professionals of the Project Management Institute (PMI) in 2001 show that
89 of the construction responders use CPM for project planning and 72 for project
control (Liberatore Pollack-Johnson and Smith 2001)
1 Franco-Duran D M amp de la Garza J M (July 01 2019) Phantom float in commercial scheduling
software Automation in Construction 103 291-299 DOIorg101016jautcon201903014
3
Professionals are heavy users of the Critical Path Method to schedule and control projects
Nevertheless CPM neglects the resource project allocations and constraints which is a
common feature among most of construction and engineering projects (Wiest 1964
Woodworth and Shanahan 1988 Lu and Li 2003 Pantouvakis and Manoliadis 2006
Kastor and Sirakoulis 2009) Most projects have a limited amount of resources available
that usually are shared by several activities Because oftentimes resource demands exceed
the maximum number of resources available several Resource-Constrained Scheduling
(RCS) techniques have been introduced to mitigate the resource supply-demand problem
(Woodworth and Shanahan 1988 Lu and Li 2003 Pantouvakis and Manoliadis 2006)
Despite RCS techniques do help project managers to solve the resource conflicts in project
schedules RCS usage in the industry has been quite moderate The two surveys taken by
the ENRrsquos Top 400 Contractors in 1987 and 2003 show that only 16 and 35
respectively of the responders use RCS techniques as advanced methodologies in their
projects (Tavakoli and Riachi 1990 Kelleher 2004) In 2001 Liberatore Pollack-
Johnson and Smith (2001) reported that over 50 of construction professionals use RCS
techniques for project planning and about 44 of the responders use RCS techniques for
project control
Project Management Software (PMS) which incorporate CPM and RCS methods has
become an essential tool for planning and control projects However at present the use of
scheduling software in the construction industry has not been systematically reported The
few studies found in the literature agree that Primaveratrade is the most frequently used
software for construction professionals followed by Microsoft (MS) Projecttrade (Liberatore
Pollack-Johnson and Smith 2001 Galloway 2006) The Liberatore surveyrsquos results show
that 51 of the construction responders use Primavera and 24 of them use Microsoft
Project (Liberatore Pollack-Johnson and Smith 2001) Additionally the results of the
ENRrsquos Top 400 Contractors survey in 2003 show that 78 of the responders use Primavera
and 35 use Microsoft Project (Kelleher 2004) In 2005 an online survey sent to 430
stakeholders involved in construction indicates that Primavera was the specified software
for their projects From an owner and contractor perspective on average over 60 used
Primavera and only 20 Microsoft Project (Galloway 2006)
Although Primavera P6 and MS Project fix the resource supply-demand problem by
performing specific RCS methods these techniques create phantom float in each
softwarersquos schedule RCS techniques overlook the resources relationships between
activities that compete for the same but unavailable resources RCS calculations suggest
that activities have float but much of this float does not exist hence the name of phantom
float (Kim and de la Garza 2003) The aim of this paper is to illustrate the presence of
phantom float in Primaverarsquos P6 v161 and Microsoftrsquos Project v2016 schedules
4
Background
Resource-Constrained Scheduling (RCS)
In resource-constrained schedules when resources are not available to complete a specific
task selected activities are delayed until the completion of the more crucial tasks that
employ the same type of resources (Boyle 2016) This process is governed by two steps
The first step is to set activity priorities according to specific rules The second is to
schedule activities in the order determined subject to logic precedence and resource
availability The criterion to assign activity priorities depends on the heuristic chosen to
solve the resource conflicts
Two of the most well-known methods employed in RCS are the serial method and the
parallel method The serial method sorts all activities as a single group and then schedules
one activity at a time If there are insufficient resources to start an activity the activity is
delayed until resources become available (Moder Phillips and Davis 1983) The primary
heuristic or priority rule to schedule activities is the Late Start Time (LS) Activities with
an early LS are scheduled first In cases when there is a tie with respect to the LS the higher
priority is given to the activity with the shorter duration and total float respectively If the
tie persists then the activity with the smaller number ID is selected (Kim and de la Garza
2003)
The parallel method selects a group of activities whose predecessors were already all
scheduled Activities are eligible to be scheduled if the activity Early Start Time (ES) is
less than or equal to the period of analysis Then from this Eligible Activity Set (EAS)
activities are scheduled based on the total float values (Kastor and Sirakoulis 2009)
Higher priority is given to the activity with the shorter total float If there is a tie with
respect to the total float the activity with the shorter duration is selected to be scheduled
If there are not enough resources to start an activity activities with lower priority are then
examined If the ES of an activity is delayed due to resource unavailability the ES must be
increased to the following period and a new rank for the EAS is defined (Moder Phillips
and Davis 1983) This process should be repeated until all activities are scheduled
Each commercial scheduling software uses a specific RCS method For instance Primavera
P6 applies the serial method and MS Project the parallel method Therefore schedulers and
project managers can expect to obtain different resource-constrained schedules with each
software RCS methods provide good but not optimal solutions (Wiest 1964 Lu and Li
2003 Pantouvakis and Manoliadis 2006) As a rule-based some heuristics may perform
better for some project schedules than for others (Moder Phillips and Davis 1983)
Phantom Float
RCS techniques mitigate the resource-supply problem but they fail to identify the correct
project critical path (Woodworth and Shanahan 1988 Bowers 1995) RCS methodologies
do not consider the resource dependencies that arise when activities are delayed due to
resource unavailability (Woodworth and Shanahan 1988 Kim and de la Garza 2005
5
Boyle 2016) The RCS calculations suggest that activities have float but this float might
not exist at all (Fondahl 1991) Kim and de la Garza (2003) labeled this float as phantom
float Hence the critical path is broken and all the activities must be considered critical
(Kim 2003) This weakness was first noticed by Fondahl (1991) In his study Fondahl
(1991) states that in a resource-constrained schedule the concepts of total float and critical
path are no longer satisfied Non-critical activities may be considered resource critical if
they fail to release the resources needed by a critical activity on time (Fondahl 1991 Lu
and Li (2003)
To provide correct float values and a continuous critical path some authors modified
existing RCS methods andor developed new methods These enhanced algorithms
consider not only the technological relationships but also the resource relationships
between activities in the schedule (Kim and de la Garza 2003 Kim and de la Garza 2005)
Once the resource relationships or Resources Links (RLs) are added to the schedule and
the backward pass is performed a continuous critical path can be obtained The priority
rules to schedule activities differ between each method as well as the process of identifying
the RLs Therefore different resource-constrained schedules with no phantom float can be
obtained when applying any of the methodologies described below
The algorithm proposed by Woodworth and Shanahan (1988) which is based on the
parallel method identifies the critical path of a resource-constrained schedule by creating
resource links (RLs) In this method during the forward pass a label is given to each
activity with the purpose of recording the resource being used and the usage order in a
resource pool The activities that have used the resource are also recorded During the
backward pass a search is made in the pool to find the immediate predecessor of the current
activity by considering the logical and resource dependencies If the Early Start (ES) of the
predecessor activity and the Early Finish (EF) of the current activity are equal and
activities are not technologically connected a Resource Link (RL) is created ((Woodworth
and Shanahan 1988 Kim and de la Garza 2005)
Like Woodworth and Shanahan (1988) Bowers (1995) proposed an algorithm based on
the parallel method that identifies the critical path of a resource-constrained schedule In
this case the RLs are identified during the forward pass by considering the resource usage
of each activity Bowers (1995) The RLs are checked and validated by examining the
history of resource availability during the backward pass Nonetheless as mentioned by
Kim and de la Garza (2005) Bowers (1995) did not provide detailed information about
how the RLs should be created
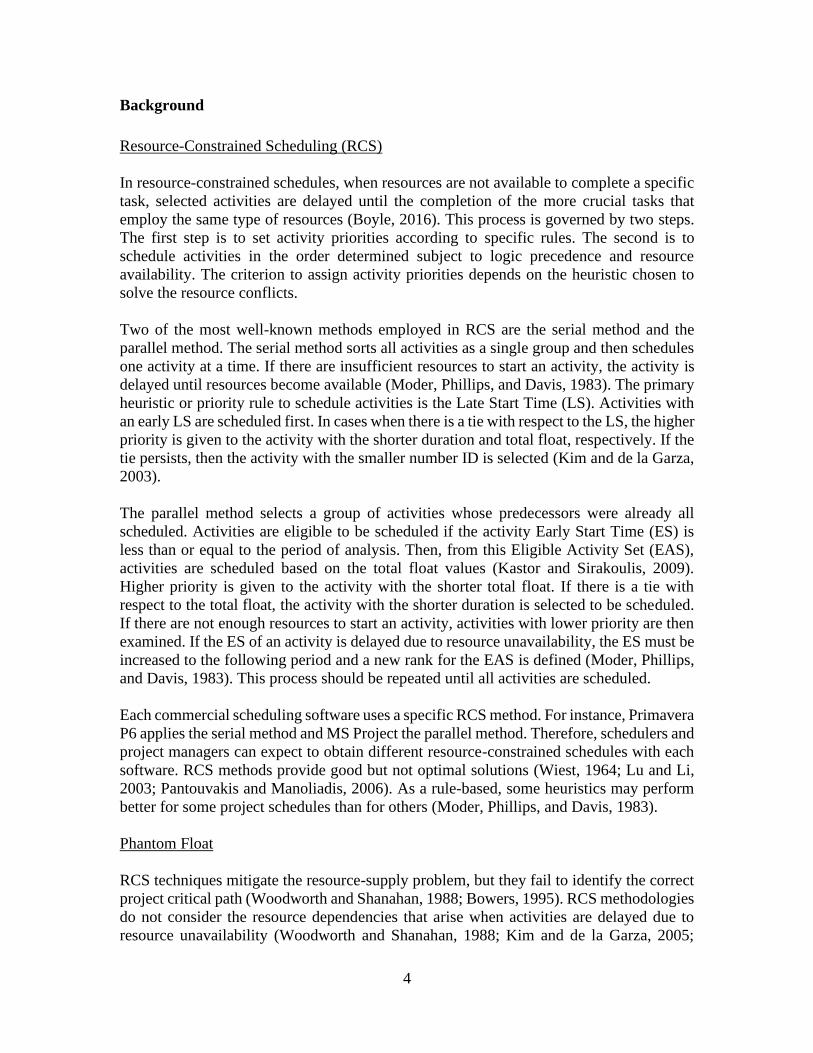
Kim and de la Garza (2003) developed the Resource-Constrained Critical Path (RCPM) to
provide a more realistic resource-constrained schedule by eliminating phantom float The
algorithm which is based on the serial method consists of five steps as shown in Figure 1
The first step is to perform CPM Then while the serial method is performed in the second
step RLs are identified and added to the schedule if an activity is delayed due to a resource
limit In the third step the backward pass is performed considering both the technological
and resource relationships that were identified during the forward pass The next step
determines if the total float of the noncritical activities can be used during the whole period
6
(ie if there is still phantom float) If the float cannot be used the corresponding RLs are
added to the schedule After this procedure the final schedule is obtained As a final step
the algorithm identifies alternative schedules looking for activities that can be scheduled
during another period without breaching all the relationships (Kim and de la Garza 2003
Kim and de la Garza 2005)
Figure 1 RCPM steps
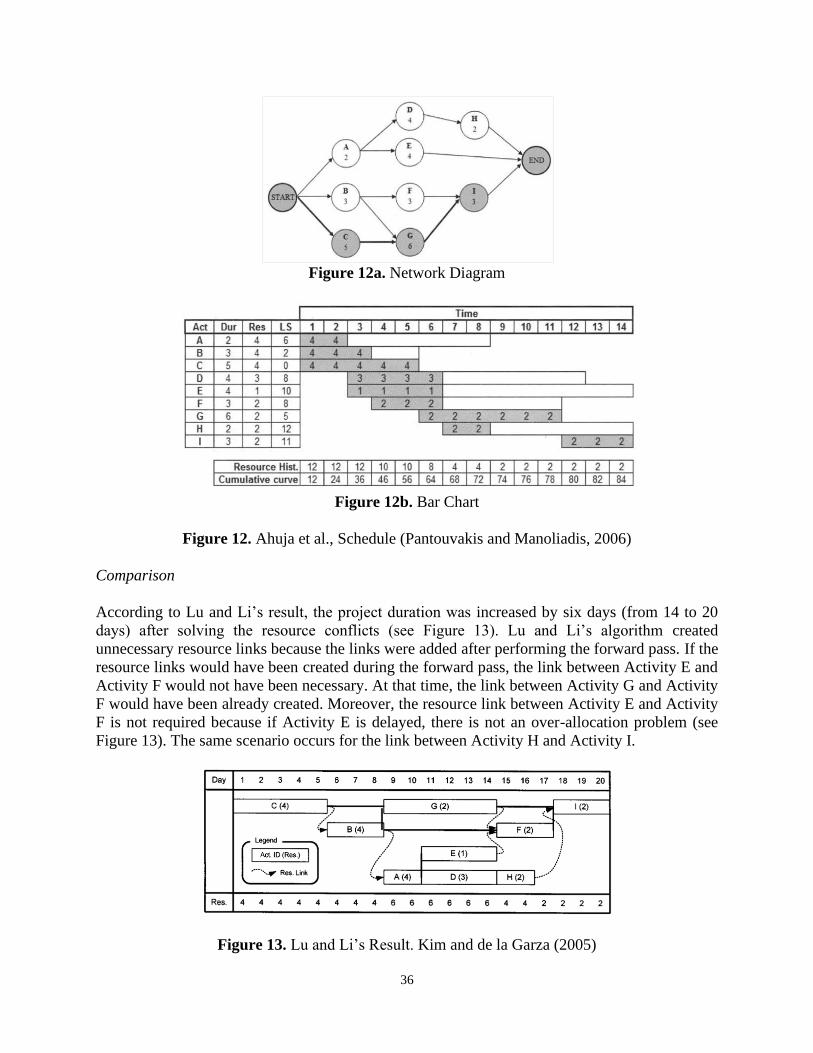
While the RCPM algorithm was introduced by Kim and de la Garza (2005) Lu and Li
(2003) developed the Resource-Activity Critical-Path Method (RACPM) as a serial
heuristic method for resource-constrained scheduling The work content which is the
relative weight of each activity with respect to the time and resource usage is the primary
criterion to select an activity when activities are competing for constrained resources
Limited resources are first assigned to activities with higher work content since these
activities may affect the project completion time
If there is a tie with respect to the work content the activity with a larger number of
resources or longer duration is scheduled first (Lu and Li 2003) If an activity needs
various quantities of the same type of resource the priority is given to the resource that is
available to perform the activity at that time (Ready-to-Serve Time ndashRST) The RST is the
time when resources are ready to work If there is a tie with respect to RST resources are
randomly chosen The activity that first uses the same resource unit of the current or
predecessor activity is considered as a resource-constrained successor activity (Kim and de
la Garza 2003) Lu and Lirsquos method creates redundant RLs because the links are identified
based on the resource requirements and work content neglecting the technological
relationships of the original CPM (Lu and Li 2003 Kim and de la Garza 2005)
Scheduling Software
In 2003 Kim and de la Garza reported that when resource demands exceed the supply and
users of Primavera Project Plannertrade (known as P3) performed RCS three things
happened 1) P3 fixed the resource supply-demand problem 2) P3 broke the Critical Path
and 3) P3 reported incorrect total float values because phantom float was created when
RCS was performed In order to fix these issues Kim and de la Garza [15] developed an
application that incorporates the RCPM The system reads project information directly
from a P3 project performs RCPM and then updates the P3 schedule The RCPM
application removes phantom float from P3 schedules but it does not remove phantom
float from P6 schedules because P6 is built on a different platform than P3
Over the last few years Boyle Project Consulting (BPC) and Ron Winter Consulting LLC
have developed their own software to overcome the weakness of current software when
7
dealing with resource-constrained schedules These two developments fix the RCS
techniquesrsquo shortcomings by identifying resource relationships of P6 and MS Project
schedules respectively However the programs do not apply an algorithm to systematically
identify and to add the RLs in the schedule They search the activities that were postponed
by the RCS method and create a relationship between the delayed task and the activities
that caused the delay This process does not identify all the RLs of the schedule
After testing Primavera P6 versions (P6 v832 and P6 v161) and MS Project v2016 both
software still creates phantom float in a resource-constrained schedule because they do not
apply any algorithm to remove phantom float This paper illustrates the presence of
phantom float in Primaverarsquos P6 v161 and MS Projectrsquos v2016 schedules
Methodology
Case of Study
To illustrate the presence of phantom float in Primaverarsquos P6 and MS Projectrsquos schedules
a warehouse project was used as a case of study (Fondahl 1991) The project consists of
31 activities with finish-to-start relationships and three types of resources carpenters (R1)
ironworkers (R2) and unskilled labor (R3) The maximum number of resources available
for each type of resource is four The activity calendar reflects a seven-day workweek The
project schedule was built on Primavera P6 v161 and MS Project v2016
Research Approach
The RCPM system developed by Kim and de la Garza (2005) was used to remove phantom
float from the P6 v161 schedule Since this RCPM application only reads and updates data
from a P3 file several steps were carried out to convert the P6 v161 file to a P3 format
(see Figure 2) Because a P6 v161 file cannot be directly exported to P3 this study also
used P6 v832 as an intermediary This process is very impractical since the user should
have installed P3 v31 and P6 v832 on a computer with an XP operating system (which is
no longer supported by Microsoft) However this approach was followed because the
RCPM system to remove phantom float from P6 andor MS Project schedules is still under
development
The warehouse project schedule was first created in P6 v161 and CPM and RCS were
performed This file was exported to P6 v832 and thereafter exported to P3 v31 With the
schedule in P3 the RCPM system identified the RLs removed phantom float and updated
the P3 schedule This schedule without phantom float was uploaded into P6 v161 by
performing the same process but in reverse (see Figure 2)
8
Figure 2 Process to remove phantom float on P6 v161 schedule
The RCPM system developed by Kim and de la Garza does not work for MS Project
Therefore phantom float was removed from this software schedule performing RCPM by
hand The RLs were identified while the forward pass of the parallel method was performed
and each of the non-critical activities was checked afterward to identify additional RLs
The resource relationships were added to the MS Project schedule manually to obtain the
real total float values and the correct critical path
Results
CPM and RCS in P6 v161
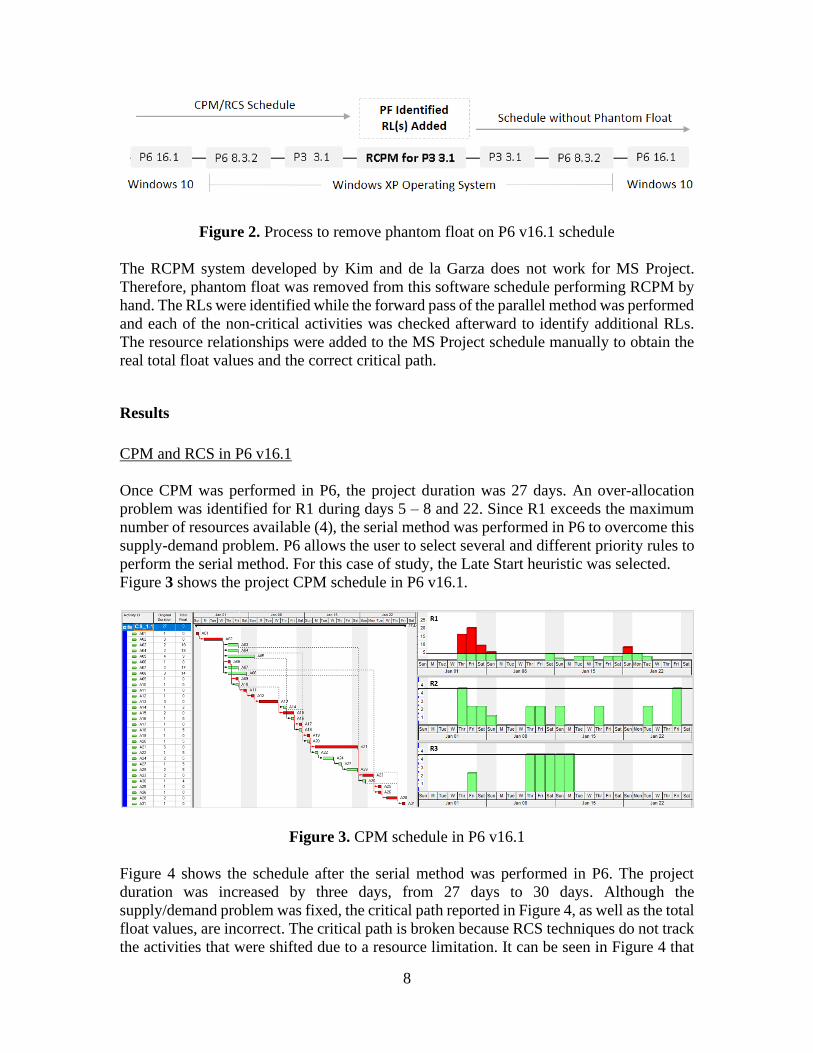
Once CPM was performed in P6 the project duration was 27 days An over-allocation
problem was identified for R1 during days 5 ndash 8 and 22 Since R1 exceeds the maximum
number of resources available (4) the serial method was performed in P6 to overcome this
supply-demand problem P6 allows the user to select several and different priority rules to
perform the serial method For this case of study the Late Start heuristic was selected
Figure 3 shows the project CPM schedule in P6 v161
Figure 3 CPM schedule in P6 v161
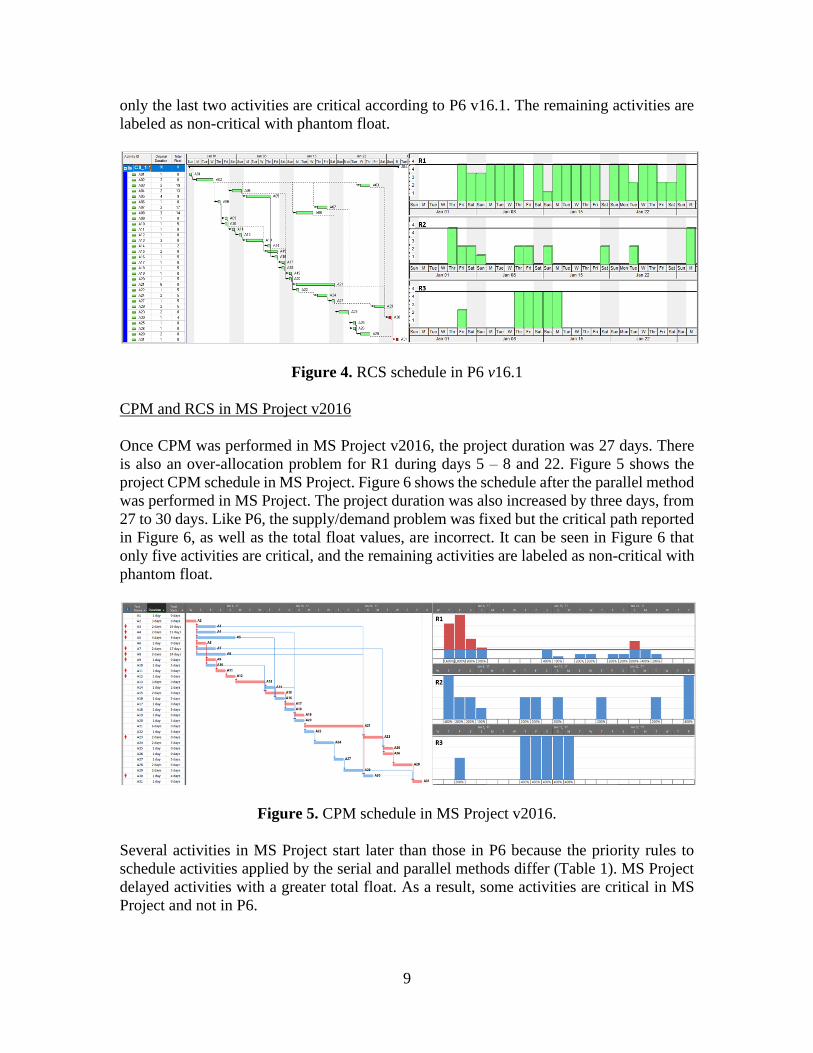
Figure 4 shows the schedule after the serial method was performed in P6 The project
duration was increased by three days from 27 days to 30 days Although the
supplydemand problem was fixed the critical path reported in Figure 4 as well as the total
float values are incorrect The critical path is broken because RCS techniques do not track
the activities that were shifted due to a resource limitation It can be seen in Figure 4 that
9
only the last two activities are critical according to P6 v161 The remaining activities are
labeled as non-critical with phantom float
Figure 4 RCS schedule in P6 v161
CPM and RCS in MS Project v2016
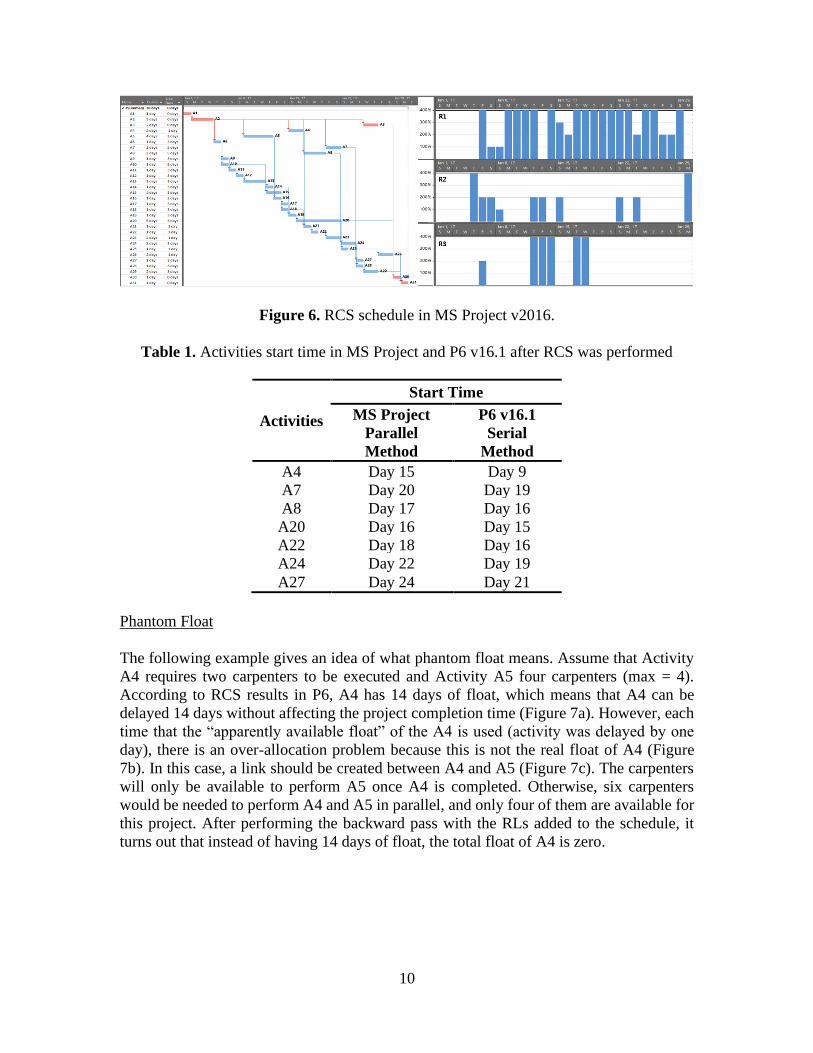
Once CPM was performed in MS Project v2016 the project duration was 27 days There
is also an over-allocation problem for R1 during days 5 ndash 8 and 22 Figure 5 shows the
project CPM schedule in MS Project Figure 6 shows the schedule after the parallel method
was performed in MS Project The project duration was also increased by three days from
27 to 30 days Like P6 the supplydemand problem was fixed but the critical path reported
in Figure 6 as well as the total float values are incorrect It can be seen in Figure 6 that
only five activities are critical and the remaining activities are labeled as non-critical with
phantom float
Figure 5 CPM schedule in MS Project v2016
Several activities in MS Project start later than those in P6 because the priority rules to
schedule activities applied by the serial and parallel methods differ (Table 1) MS Project
delayed activities with a greater total float As a result some activities are critical in MS
Project and not in P6
10
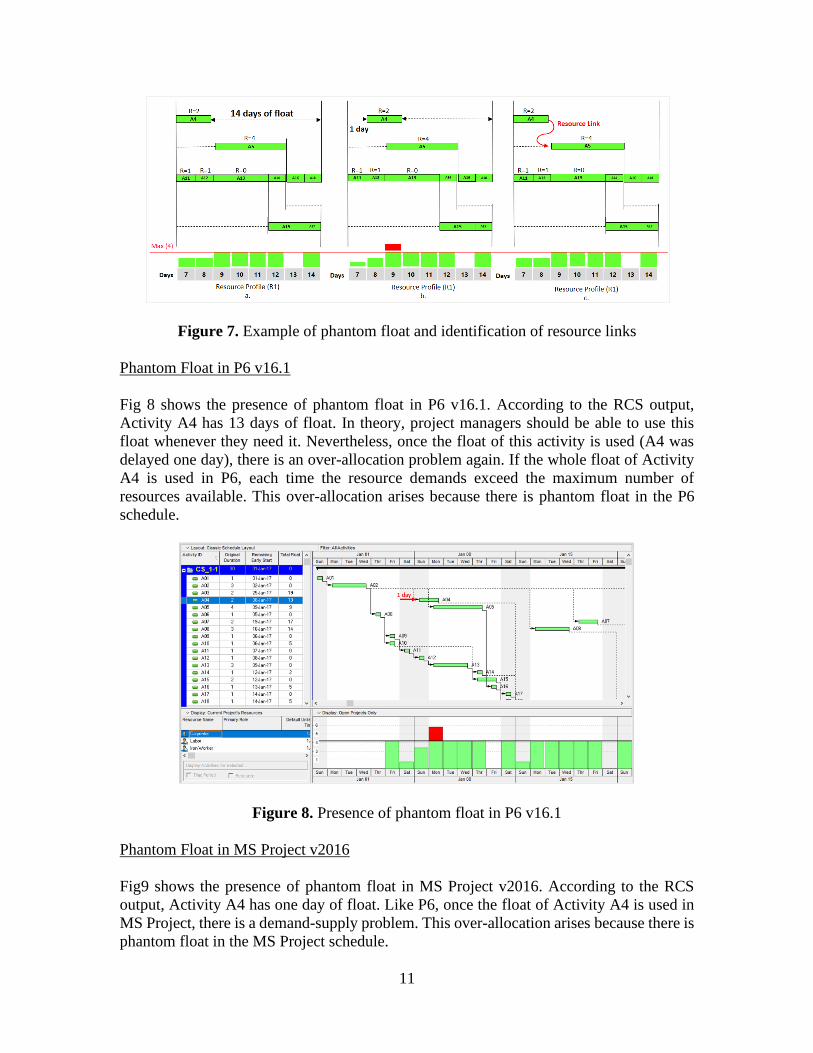
Figure 6 RCS schedule in MS Project v2016
Table 1 Activities start time in MS Project and P6 v161 after RCS was performed
Activities
Start Time
MS Project
Parallel
Method
P6 v161
Serial
Method
A4 Day 15 Day 9
A7 Day 20 Day 19
A8 Day 17 Day 16
A20 Day 16 Day 15
A22 Day 18 Day 16
A24 Day 22 Day 19
A27 Day 24 Day 21
Phantom Float
The following example gives an idea of what phantom float means Assume that Activity
A4 requires two carpenters to be executed and Activity A5 four carpenters (max = 4)
According to RCS results in P6 A4 has 14 days of float which means that A4 can be
delayed 14 days without affecting the project completion time (Figure 7a) However each
time that the ldquoapparently available floatrdquo of the A4 is used (activity was delayed by one
day) there is an over-allocation problem because this is not the real float of A4 (Figure
7b) In this case a link should be created between A4 and A5 (Figure 7c) The carpenters
will only be available to perform A5 once A4 is completed Otherwise six carpenters
would be needed to perform A4 and A5 in parallel and only four of them are available for
this project After performing the backward pass with the RLs added to the schedule it
turns out that instead of having 14 days of float the total float of A4 is zero
11
Figure 7 Example of phantom float and identification of resource links
Phantom Float in P6 v161
Fig 8 shows the presence of phantom float in P6 v161 According to the RCS output
Activity A4 has 13 days of float In theory project managers should be able to use this
float whenever they need it Nevertheless once the float of this activity is used (A4 was
delayed one day) there is an over-allocation problem again If the whole float of Activity
A4 is used in P6 each time the resource demands exceed the maximum number of
resources available This over-allocation arises because there is phantom float in the P6
schedule
Figure 8 Presence of phantom float in P6 v161
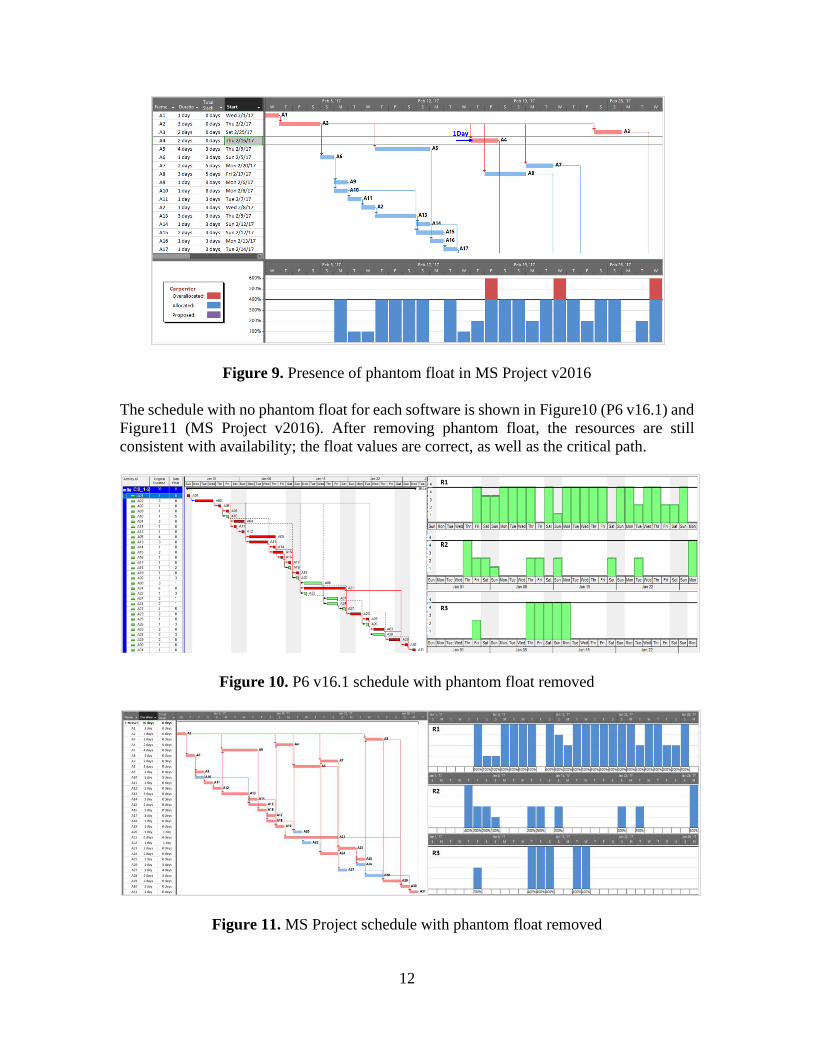
Phantom Float in MS Project v2016
Fig9 shows the presence of phantom float in MS Project v2016 According to the RCS
output Activity A4 has one day of float Like P6 once the float of Activity A4 is used in
MS Project there is a demand-supply problem This over-allocation arises because there is
phantom float in the MS Project schedule
12
Figure 9 Presence of phantom float in MS Project v2016
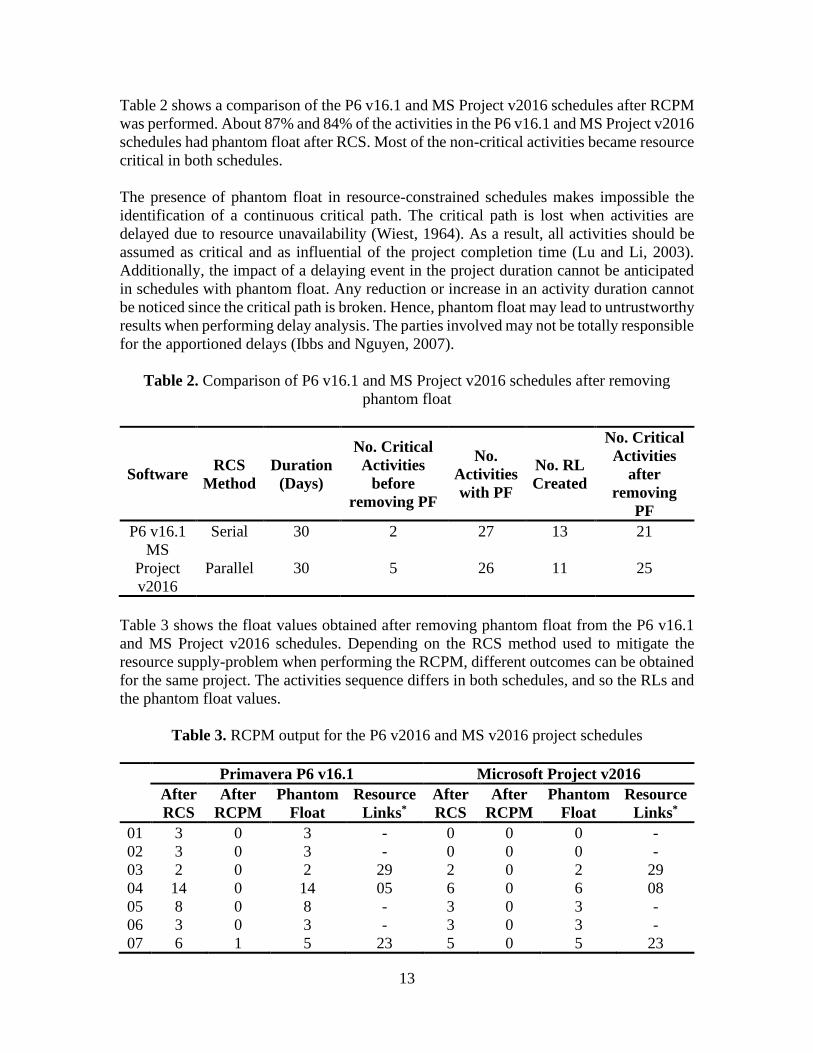
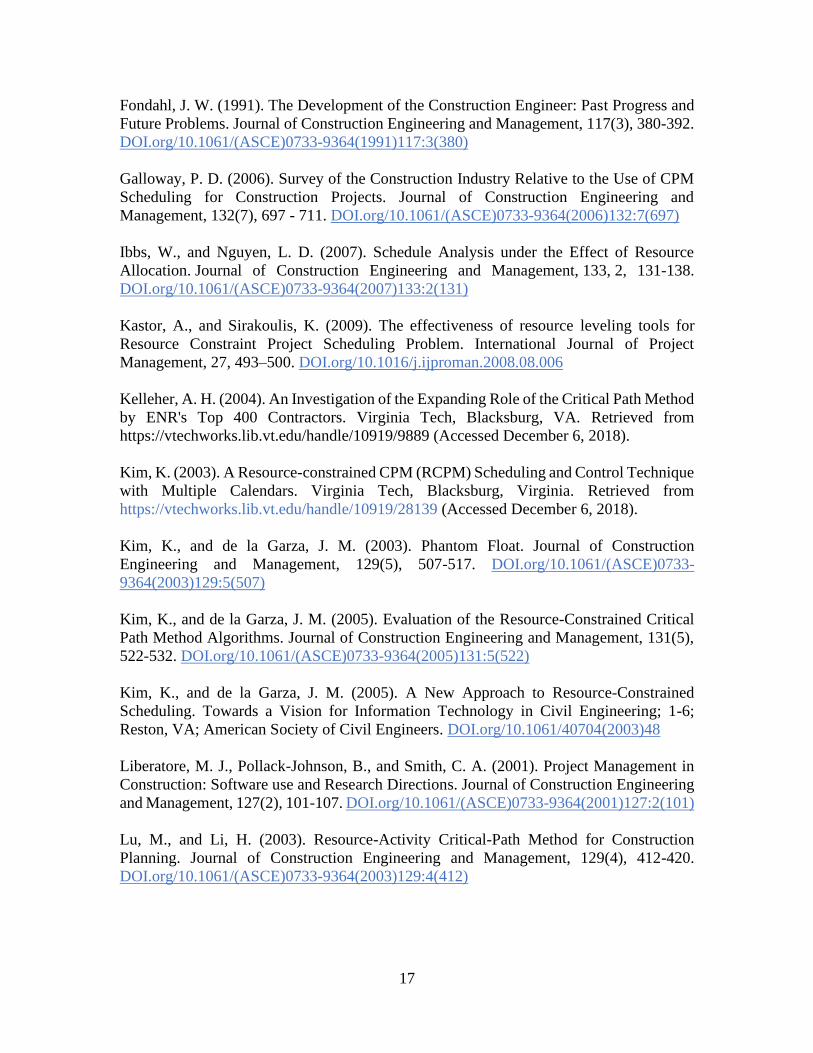
The schedule with no phantom float for each software is shown in Figure10 (P6 v161) and
Figure11 (MS Project v2016) After removing phantom float the resources are still
consistent with availability the float values are correct as well as the critical path
Figure 10 P6 v161 schedule with phantom float removed
Figure 11 MS Project schedule with phantom float removed
13
Table 2 shows a comparison of the P6 v161 and MS Project v2016 schedules after RCPM
was performed About 87 and 84 of the activities in the P6 v161 and MS Project v2016
schedules had phantom float after RCS Most of the non-critical activities became resource
critical in both schedules
The presence of phantom float in resource-constrained schedules makes impossible the
identification of a continuous critical path The critical path is lost when activities are
delayed due to resource unavailability (Wiest 1964) As a result all activities should be
assumed as critical and as influential of the project completion time (Lu and Li 2003)
Additionally the impact of a delaying event in the project duration cannot be anticipated
in schedules with phantom float Any reduction or increase in an activity duration cannot
be noticed since the critical path is broken Hence phantom float may lead to untrustworthy
results when performing delay analysis The parties involved may not be totally responsible
for the apportioned delays (Ibbs and Nguyen 2007)
Table 2 Comparison of P6 v161 and MS Project v2016 schedules after removing
phantom float
Software RCS
Method
Duration
(Days)
No Critical
Activities
before
removing PF
No
Activities
with PF
No RL
Created
No Critical
Activities
after
removing
PF
P6 v161 Serial 30 2 27 13 21
MS
Project
v2016
Parallel 30 5 26 11 25
Table 3 shows the float values obtained after removing phantom float from the P6 v161
and MS Project v2016 schedules Depending on the RCS method used to mitigate the
resource supply-problem when performing the RCPM different outcomes can be obtained
for the same project The activities sequence differs in both schedules and so the RLs and
the phantom float values
Table 3 RCPM output for the P6 v2016 and MS v2016 project schedules
Primavera P6 v161 Microsoft Project v2016
After
RCS
After
RCPM
Phantom
Float
Resource
Links
After
RCS
After
RCPM
Phantom
Float
Resource
Links
01 3 0 3 - 0 0 0 -
02 3 0 3 - 0 0 0 -
03 2 0 2 29 2 0 2 29
04 14 0 14 05 6 0 6 08
05 8 0 8 - 3 0 3 -
06 3 0 3 - 3 0 3 -
07 6 1 5 23 5 0 5 23
14
08 6 1 5 0724 5 0 5 07 24
09 3 0 3 04 3 0 3 -
10 8 5 3 - 8 5 3 -
11 3 0 3 - 3 0 3 -
12 3 0 3 05 3 0 3 05
13 3 0 3 - 3 0 3 -
14 5 0 5 - 3 0 3 -
15 3 0 3 - 3 0 3 -
16 8 0 8 17 8 0 8 -
17 3 0 3 - 3 0 3 -
18 8 2 6 08 8 0 8 04 19
19 3 0 3 08 3 0 3 -
20 8 3 5 - 6 1 5 -
21 3 0 3 - 3 0 3 -
22 8 3 5 - 6 1 5 -
23 3 0 3 - 3 0 3 -
24 6 1 5 23 5 0 5 23
25 3 0 3 03 3 0 3 03
26 3 3 0 - 3 3 3 -
27 6 5 1 - 5 4 1 -
28 3 3 0 - 3 3 0 -
29 1 0 1 30 1 0 1 30
30 0 0 0 - 0 0 0 -
31 0 0 0 - 0 0 0 - Successor Activities
Discussion
In time-constrained scheduling unlimited resources are assumed Under this scenario the
traditional definition of total float is valid ie the amount of time an activity can be
delayed without affecting the project completion time The resulting critical path allows 1)
to identify critical and near-critical activities and 2) to anticipate the effect of a delay or
change in a project schedule
Conversely in resource-constrained scheduling (RCS) there is limited resource
availability in a project The resource supply-demand problem is addressed by considering
both the logical relationships among the activities and the availability of resources at any
given point in time RCS algorithms first prioritize the order of activities then schedule
them as early as possible subject to existing logical relationships and resource availability
When resources are not available RCS algorithms postpone the start time of the activities
until the resources required become available In consequence the intended project
completion date may be extended Indeed it is well documented in the literature that RCS
algorithms do not guarantee that the original project completion date will be met
Unlike time-constrained schedules in resource-constrained schedules the concepts of total
float and critical path lose their significance (Wiest 1964 Fondahl 1991 Bowers 1995
15
Raz and Marshall 1996 Rivera and Duran 2004) That is the total float is now constrained
by both forward and backward CPM calculations as well as resource availability which is
not the case in time-constrained schedules where the total float is only constrained by
forward and backward CPM calculations
To date Primavera P6 continues to be plagued by the same issues pointed out by Kim and
de la Garza in 2003 when P3 was available (Kim and de la Garza 2003) That is in
resource-constrained schedules Primavera P6 calculates the total float assuming a time-
constrained schedule as opposed to a resource-constrained schedule Primavera P6
correctly determines the activitiesrsquo earliest dates that satisfy the resource limitations but it
calculates total float based on a ldquoTime Contextrdquo (LF ndash EF andor LS ndash ES) ignoring the
presence of resource constraints As illustrated in this paper and in these circumstances
the total float is no longer the amount of time an activity can be delayed without affecting
the project completion time The combination of resource-constrained schedules with total
float calculated on a time-context basis makes impossible the anticipation of the impact of
a delaying event in the project completion time
Scheduling software developers such as Oracle and Microsoft have not progressed in
removing phantom float from resource-constrained schedules Therefore it is the userrsquos
responsibility to recognize that the calculation of total float by the software relies on a time-
based context and hence the total float reported cannot be trusted andor used to mitigate
delaying events like the traditional time-based context definition of total float suggests
Conclusion
Project management software has become an essential tool for planning and control
projects Primavera P6 and Microsoft (MS) Project are two of the most frequently used
scheduling software in the construction industry Although these programs help users to
develop the project plan and to report the project status they do not appropriately support
the decision process when dealing with resource project allocations and constraints In
order to mitigate the resource supply-demand problem Resource-Constrained Scheduling
(RCS) techniques have been incorporated in Primavera P6 and MS Project
RCS methodologies solve the resource conflicts but create phantom float in the schedules
ndasha float that does not really exist RCS methods overlook the resourcesrsquo relationships
between activities that compete for the same but unavailable resources As a result the
critical path is broken In the last years several algorithms have been developed to identify
the critical path in a resource-constrained schedule However some of them identify
unnecessary resource links andor remove some technological relationships from the
schedule The redundant resource links increase the network complexity and the removal
of technological relationships jeopardizes the updating process of the schedule since the
logical sequence of the project may be lost
After testing Primavera P6 versions (P6 v832 and P6 v161) and MS Project v2016 both
software packages still create phantom float in resource-constrained schedules because
16
they do not apply any algorithm to remove phantom float The software correctly
determines the activitiesrsquo earliest dates that satisfy the resource limitations but they
calculate total float based on a ldquoTime Contextrdquo (LF ndash EF andor LS ndash ES) ignoring the
presence of resource constraints Hence the floats calculated by the software cannot be
trusted or used as traditional definitions suggest ie the amount of time an activity can be
delayed without affecting the project completion time
On a regular basis professionals use commercial available software to resource load the
schedules without paying attention to the resulting critical path and float values However
they should recognize the presence of phantom float in resource-constrained schedules
because it may lead them to make decisions based on unreliable schedules Non-critical
activities may be considered resource critical if they fail to release the resources needed by
a critical activity on time The actual float values may be shorter than calculated during
RCS or may be altogether non-existent (Fondahl 1991) This makes impossible the
identification of the critical path and thus the anticipation of the impact of a delaying event
in the project completion time The incorporation of an enhanced Resource Constraint
Critical Path (RCPM) in a system to solve the RCSrsquo drawbacks in Primavera P6 and MS
Project is being explored at Virginia Tech
References
Baki M A (1998) CPM scheduling and its use in todays construction industry Project
Management Journal 29(1) 7ndash9 Retrieved from
httpswwwpmiorglearninglibrarycritical-path-method-scheduling-construction-
industry-2069 (Accessed December 6 2018)
Bowers J A (1995) Criticality in Resource-Constrained Networks Journal of the
Operational Research Society 46 80-91 DOIorg101057jors19959
Boyle T M (2016) BCP Logic Filter for Microsoft Project Retrieved from Charlotte
NC httpwwwboyleprojectconsultingcomWeb20FilesBPCLogicFilter-
Intro20R2pdf (Accessed December 6 2018)
Davis E W (1974) CPM Use in Top 400 Construction Firms Journal of the Construction
Division 100 (1) 39-49 Retrieved from
httpscedbasceorgCEDBsearchrecordjspdockey=0021563 (Accessed December 6
2018)
de la Garza J M and Franco-Duran D M (2017 December 20) CPM Benefits in
Estimating Bidding Reported in Survey (B Buckley Ed) Retrieved from Engineering
News-Record httpswwwenrcomarticles43666-cpm-benefits-in-estimating-bidding-
reported-in-survey (Accessed December 6 2018)
17
Fondahl J W (1991) The Development of the Construction Engineer Past Progress and
Future Problems Journal of Construction Engineering and Management 117(3) 380-392
DOIorg101061(ASCE)0733-9364(1991)1173(380)
Galloway P D (2006) Survey of the Construction Industry Relative to the Use of CPM
Scheduling for Construction Projects Journal of Construction Engineering and
Management 132(7) 697 - 711 DOIorg101061(ASCE)0733-9364(2006)1327(697)
Ibbs W and Nguyen L D (2007) Schedule Analysis under the Effect of Resource
Allocation Journal of Construction Engineering and Management 133 2 131-138
DOIorg101061(ASCE)0733-9364(2007)1332(131)
Kastor A and Sirakoulis K (2009) The effectiveness of resource leveling tools for
Resource Constraint Project Scheduling Problem International Journal of Project
Management 27 493ndash500 DOIorg101016jijproman200808006
Kelleher A H (2004) An Investigation of the Expanding Role of the Critical Path Method
by ENRs Top 400 Contractors Virginia Tech Blacksburg VA Retrieved from
httpsvtechworkslibvteduhandle109199889 (Accessed December 6 2018)
Kim K (2003) A Resource-constrained CPM (RCPM) Scheduling and Control Technique
with Multiple Calendars Virginia Tech Blacksburg Virginia Retrieved from
httpsvtechworkslibvteduhandle1091928139 (Accessed December 6 2018)
Kim K and de la Garza J M (2003) Phantom Float Journal of Construction
Engineering and Management 129(5) 507-517 DOIorg101061(ASCE)0733-
9364(2003)1295(507)
Kim K and de la Garza J M (2005) Evaluation of the Resource-Constrained Critical
Path Method Algorithms Journal of Construction Engineering and Management 131(5)
522-532 DOIorg101061(ASCE)0733-9364(2005)1315(522)
Kim K and de la Garza J M (2005) A New Approach to Resource-Constrained
Scheduling Towards a Vision for Information Technology in Civil Engineering 1-6
Reston VA American Society of Civil Engineers DOIorg10106140704(2003)48
Liberatore M J Pollack-Johnson B and Smith C A (2001) Project Management in
Construction Software use and Research Directions Journal of Construction Engineering
and Management 127(2) 101-107 DOIorg101061(ASCE)0733-9364(2001)1272(101)
Lu M and Li H (2003) Resource-Activity Critical-Path Method for Construction
Planning Journal of Construction Engineering and Management 129(4) 412-420
DOIorg101061(ASCE)0733-9364(2003)1294(412)
18
Moder J J Phillips C R and Davis E W (1983) Project Management with CPM
PERT and precedence diagramming (3rd ed ed) New York Van Nostrand Reinhold
ISBN 780442254155
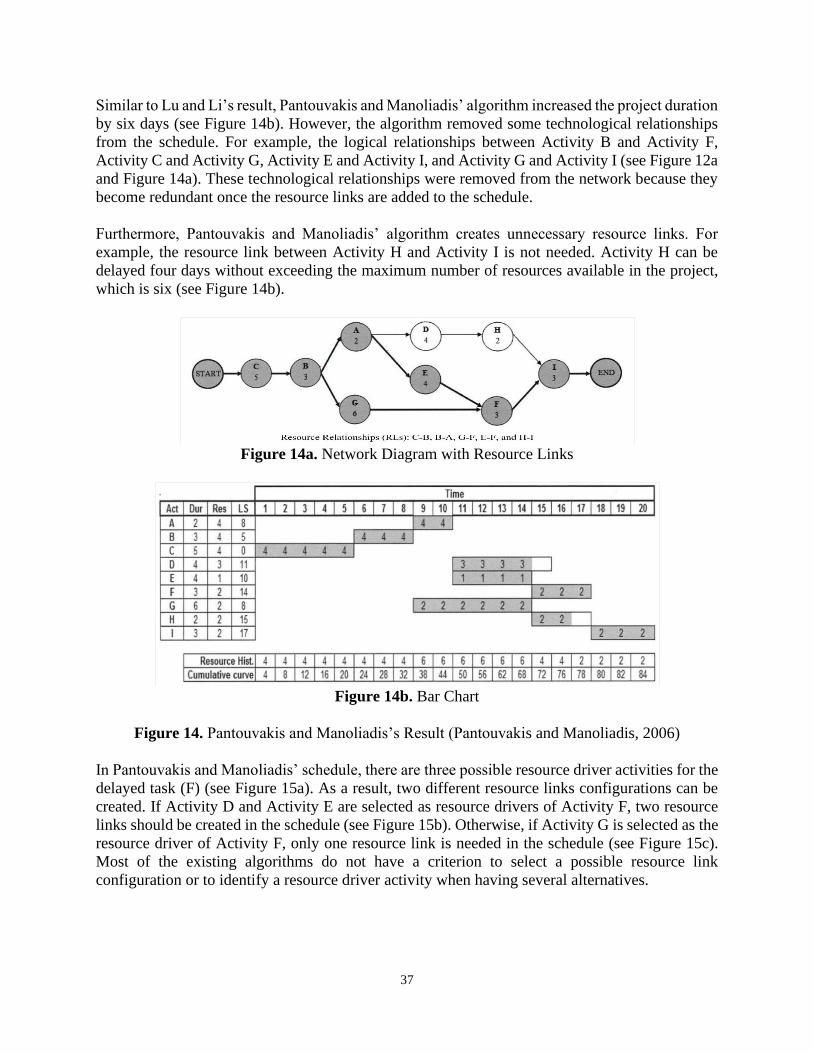
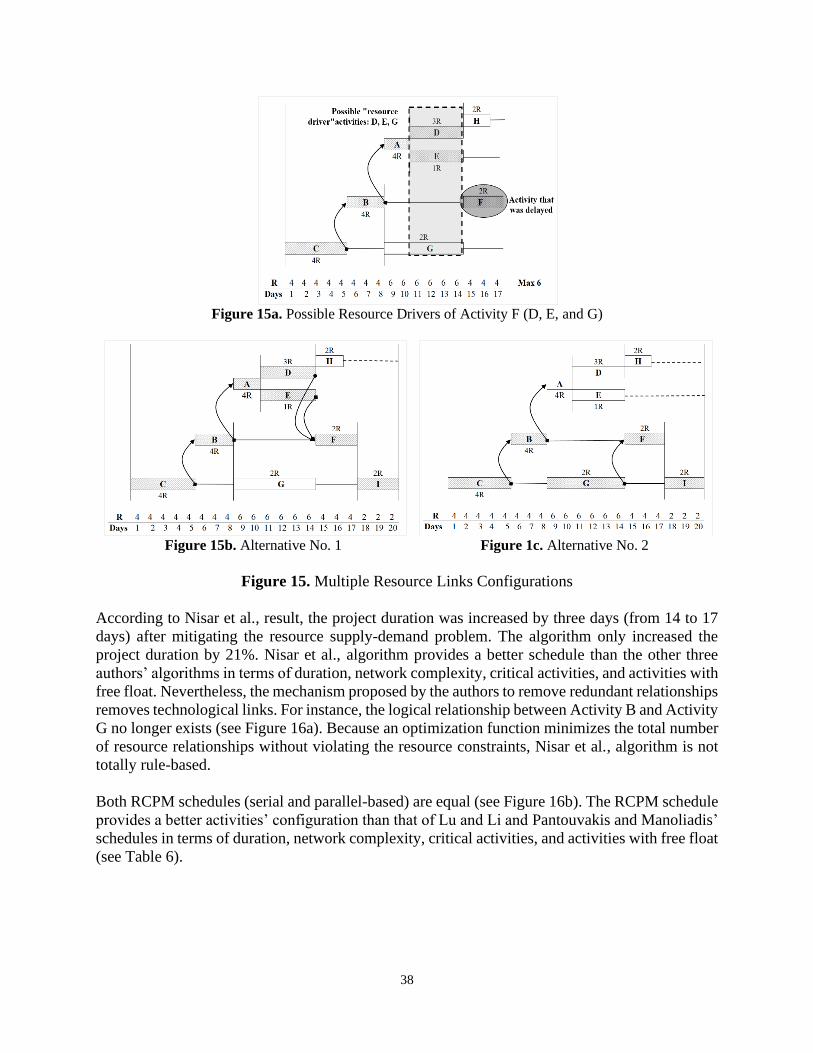
Pantouvakis J-P and Manoliadis O G (2006) A Practical Approach to Resource-
Constrained Project Scheduling Operational Research An International Journal 6(3)
299-309 DOIorg101007BF02941258
Raz T and Marshall B (1996) Effect of resource constraints on float calculations in
project networks International Journal of Project Management 14(4) 241-248
DOIorg1010160263-7863(95)00090-9
Rivera F A and Duran A (2004) Critical clouds and critical sets in resource-constrained
projects International Journal of Project Management 22(6) 489-497
DOIorg101016jijproman200311004
Tavakoli A and Riachi R (1990) CPM Use in ENR Top 400 Contractors Journal of
Management in Engineering 6(3) 282-295 DOIorg101061(ASCE)9742-
597X(1990)63(282)
Wiest J D (1964) Some Properties of Schedules for Large Projects with Limited
Resources Operation Research 12(3) 395-418 DOIorg101287opre123395
Woodworth B M and Shanahan S (1988) Identifying the critical sequence in a
resource-constrained project International Journal of Project Management 6(2) 89-96
DOIorg1010160263-7863(88)90030-0
19
CHAPTER 2
Review of Resource-Constrained Scheduling Algorithms2
Abstract
On a regular basis project managers concentrate their efforts on critical and near-critical
activities However the concepts of total float and critical path lose their significance after
applying resource-constrained scheduling (RCS) techniques RCS techniques mitigate the
resource supply-demand problem but break the critical path As a result several algorithms
have been developed to identify a continuous critical path in resource-constrained
schedules
This study reviews and evaluates the performance of eight RCS related algorithms with the
purpose of identifying the shortcomings that must be addressed so they can be applied for
delay analysis The review shows that a systematic procedure is needed to 1) incorporate
and handle dynamic resource links when the schedule is updated and 2) select a potential
resource link configuration Addressing these limitations will make the algorithms more
practical for real construction and engineering projects and will allow a more realistic delay
analysis since schedules will reflect the real conditions of the project (resource loaded)
This study 1) discusses potential solutions to the shortcomings of the existing algorithms
2) provides recommendations on the methods that can be used by industry professionals
and 3) proposes a system to facilitate the selection of an algorithm based on their common
features (heuristic) constraints (removal of logic links) and project characteristics
(resources and calendars)
Keywords Critical Path Delay Analysis Phantom Float Resource-Constrained
Schedules Resource Relationships
Introduction
The Critical Path Method (CPM) is a useful tool to plan and control the work of a project
(Baki 1998 de la Garza and Franco-Duran 2017) In fact about 97 of the Engineering
News-Recordrsquo (ENR) Top 400 contractors indicated that CPM is a valid management tool
(de la Garza and Franco-Duran 2017) Over half of the contractors also indicated that CPM
does not have major disadvantages (de la Garza and Franco-Duran 2017) However CPM
does not consider resource project allocations and constraints
Instead CPM assumes that unlimited resources will be available at any time when required
to execute project activities (Wiest 1963 Woodworth and Shanahan 1988 Lu and Li
2 Franco-Duran D M amp de la Garza J M (November 01 2019) Review of Resource-Constrained
Scheduling Algorithms Journal of Construction Engineering and Management 145 11)
DOIorg101061(ASCE)CO1943-78620001698
20
2003 Pantouvakis and Manoliadis 2006 Kastor and Sirakoulis 2009 Nisar et al 2013)
This assumption is unrealistic because activities require a specific amount of resources to
be executed and projects have a certain number of resources available to complete
activities which constraints the schedule in terms of resources (Resource-Constrained
Schedules)
Oftentimes the resource demand exceeds the maximum number of resources available for
the project (Woodworth and Shanahan 1988 Lu and Li 2003 Pantouvakis and
Manoliadis 2006) To mitigate this resource-supply demand problem Resource-
Constrained Scheduling (RCS) techniques which are based on priority rules postpone the
start time of some activities when the units of resources required to complete them are not
available (Abeyasinghe et al 2001 Lu and Li 2003)
RCS techniques solve the resource conflicts but they create phantom float in the schedule
(a float that does not exist) ie each time an activity uses this apparent float there is a
resource violation in the schedule (Kim and de la Garza 2003) RCS techniques neglect
the resource relationships between activities that compete for the same but limited
resources (Fondahl 1991) As a result the critical path is broken and all activities must be
considered critical The lack of a continuous critical path makes impossible the anticipation
of the impact of a delaying event in the project completion time (Woodworth amp Shanahan
1988 Bowers 1995 Kim 2009)
Several algorithms have been developed to address the shortcomings of RCS methods
Some of these algorithms provide correct float values and a continuous critical path
because they consider not only the technological relationships but also the resource
relationships between activities In 2005 Kim and de la Garza compared the performance
of the Resource Critical Path Method (RCPM) with four RCS related algorithms
At present CPM is frequently used for delay analysis and courts accept CPM as a reliable
tool to perform this analysis Indeed one of the main reasons noted by 100 out of 133 ENR
Top 400 contractors for using the CPM is to perform schedule impact and claim analysis
(de la Garza and Franco-Duran 2017) Because the existing delay methodologies are based
on CPM schedules the resource load and constraints are relevant aspects often disregarded
during the application of a delay analysis technique (Ibbs and Nguyen 2007 Braimah
2013) These factors may influence the outcome of the analysis since the project
completion time can be affected by resource availability Up to date few studies have been
published about how to perform a delay analysis considering resource-constrained
schedules without phantom float
As an extension of the work published by Kim and de la Garza (2005) the present study
reviews eight RCS related algorithms with the purpose of identifying the shortcomings that
must be addressed so they can be applied for delay analysis (Woodworth and Shanahan
1988 Bowers 1995 Kim and de la Garza 2003 Lu and Li 2003 Abeyasinghe et al
2001 Rivera and Duran 2004 Pantouvakis and Manoliadis 2006 and Nisar et al 2013)
Four out of the eight algorithms were not considered by Kim and de la Garza (2005)
Additionally this paper evaluates the algorithmsrsquo performance to provide some
21
recommendations on the methods that can be used by industry professionals The
performance is measured in terms of four indicators 1) the percentage increase of project
duration above the CPM length the percentage increase of the network complexity 3) the
percentage of activities with free float and 4) the percentage of critical activities
Methodology
The performance of the Resource-Constrained Critical Path Method (RCPM) developed
by Kim and de la Garza in 2003 was compared with that of seven RCS related algorithms
Initially the RCPM was developed under a serial approach This study performed the
RCPM under the serial and parallel methods
In the RCPM serial-based activities are sorted in ascending order according to the Late
Start Time (LS) If there is a tie with respect to the LS the priority is given to the activity
with the least duration (D) If the tie persists the activity with the least Total Float (TF) is
scheduled first If there is still a tie with respect to the TF the tie is broken by the smallest
activity number (ID) In the RCPM parallel-based activities are sorted in ascending order
according to the Early Start Time (ES) If there is a tie with respect to the ES the priority
is given to the activity with the least LS If the tie persists the activity with the least D is
scheduled first If there is still a tie with respect to the D the tie is broken by the smallest
activity ID
The examples provided by Woodworth and Shanahan (1988) Bowers (1995)
Abeyasinghe et al (2001) Lu and Li (2003) Rivera and Duran (2004) Pantouvakis and
Manoliadis (2006) and Nisar et al (2013) were used to generate the RCPM schedules
(serial and parallel-based)
In the serial approach the activitiesrsquo sequence is defined before scheduling the project
(Moder et al 1983 Abeyasinghe et al 2001 Lu and Li 2003) All activities are sorted as
a single group and then scheduled one at a time (Moder et al 1983) In the parallel
approach the activitiesrsquo sequence is defined and updated at the start of each day
(Abeyasinghe et al 2001 Lu and Li 2003) The RCPM is briefly described as follows
(Kim and de la Garza (2003) Kim (2003)
1 Apply the Late Start heuristic under the serial approach If an activity is delayed
create a resource link between the postponed activity and the preceding activity that
shares the same resources
2 Perform the backward pass considering the technological and resource
relationships
3 Determine if the total float values of noncritical activities can be used during the
whole period If not create the corresponding resource link
4 Find alternative schedules by looking for activities that can be scheduled during a
different period without breaching the technological and resource relationships
22
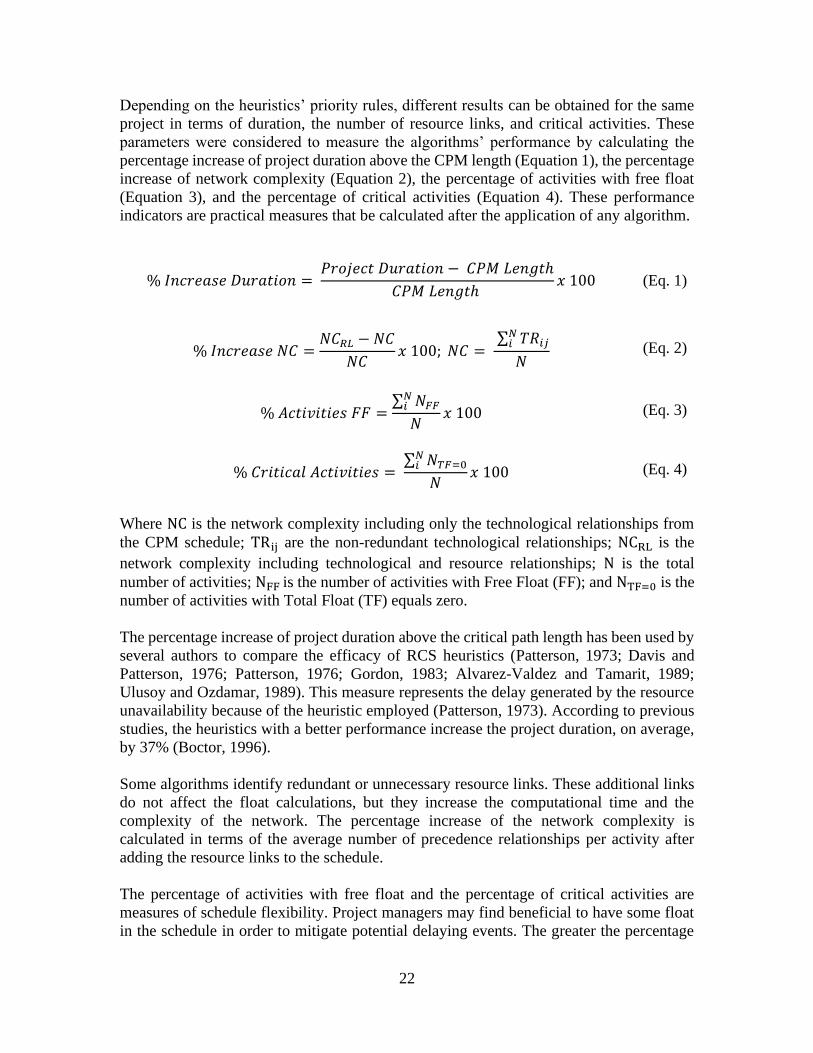
Depending on the heuristicsrsquo priority rules different results can be obtained for the same
project in terms of duration the number of resource links and critical activities These
parameters were considered to measure the algorithmsrsquo performance by calculating the
percentage increase of project duration above the CPM length (Equation 1) the percentage
increase of network complexity (Equation 2) the percentage of activities with free float
(Equation 3) and the percentage of critical activities (Equation 4) These performance
indicators are practical measures that be calculated after the application of any algorithm
119868119899119888119903119890119886119904119890 119863119906119903119886119905119894119900119899 = 119875119903119900119895119890119888119905 119863119906119903119886119905119894119900119899 minus 119862119875119872 119871119890119899119892119905ℎ
119862119875119872 119871119890119899119892119905ℎ 119909 100 (Eq 1)
119868119899119888119903119890119886119904119890 119873119862 =119873119862119877119871 minus 119873119862
119873119862119909 100 119873119862 =
sum 119879119877119894119895119873119894
119873 (Eq 2)
119860119888119905119894119907119894119905119894119890119904 119865119865 =sum 119873119865119865
119873119894
119873119909 100 (Eq 3)
119862119903119894119905119894119888119886119897 119860119888119905119894119907119894119905119894119890119904 = sum 119873119879119865=0
119873119894
119873119909 100 (Eq 4)
Where NC is the network complexity including only the technological relationships from
the CPM schedule TRij are the non-redundant technological relationships NCRL is the
network complexity including technological and resource relationships N is the total
number of activities NFF is the number of activities with Free Float (FF) and NTF=0 is the
number of activities with Total Float (TF) equals zero
The percentage increase of project duration above the critical path length has been used by
several authors to compare the efficacy of RCS heuristics (Patterson 1973 Davis and
Patterson 1976 Patterson 1976 Gordon 1983 Alvarez-Valdez and Tamarit 1989
Ulusoy and Ozdamar 1989) This measure represents the delay generated by the resource
unavailability because of the heuristic employed (Patterson 1973) According to previous
studies the heuristics with a better performance increase the project duration on average
by 37 (Boctor 1996)
Some algorithms identify redundant or unnecessary resource links These additional links
do not affect the float calculations but they increase the computational time and the
complexity of the network The percentage increase of the network complexity is
calculated in terms of the average number of precedence relationships per activity after
adding the resource links to the schedule
The percentage of activities with free float and the percentage of critical activities are
measures of schedule flexibility Project managers may find beneficial to have some float
in the schedule in order to mitigate potential delaying events The greater the percentage
23
of activities with free float the greater the number of activities that can start late without
affecting the start of its successor activities On the other hand the lower the number of
critical activities the lower the probability to cause delays to the project
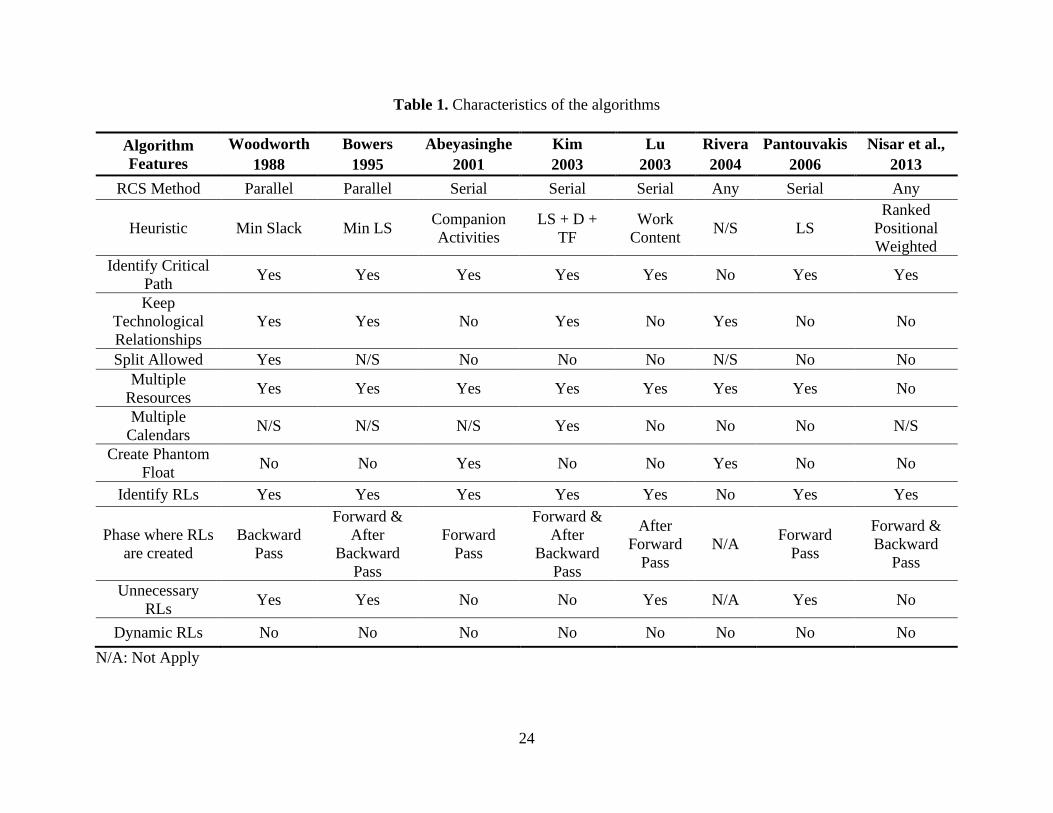
Algorithms Review
This section describes and compares the algorithms developed by Woodworth and
Shanahan (1988) Bowers (1995) Abeyasinghe et al (2001) Kim and de la Garza (2003)
Lu and Li (2003) Rivera and Duran (2004) Pantouvakis and Manoliadis (2006) and Nisar
et al (2013) Table 1 shows a summary of these eight algorithms
These RCS related algorithms were developed with the aim of providing project managers
a tool to 1) correctly schedule and identify critical activities with respect to time and
resource allocation and 2) correctly calculate the total float of each activity under resource
constraints (Woodworth and Shanahan 1988) In practice the algorithms have been
implemented as mechanisms to 1) prioritize and re-examine critical activities and 2) control
the project (Abeyasinghe et al 2001)
24
Table 1 Characteristics of the algorithms
Algorithm
Features
Woodworth Bowers Abeyasinghe Kim Lu Rivera Pantouvakis Nisar et al
1988 1995 2001 2003 2003 2004 2006 2013
RCS Method Parallel Parallel Serial Serial Serial Any Serial Any
Heuristic Min Slack Min LS Companion
Activities
LS + D +
TF
Work
Content NS LS
Ranked
Positional
Weighted
Identify Critical
Path Yes Yes Yes Yes Yes No Yes Yes
Keep
Technological
Relationships
Yes Yes No Yes No Yes No No
Split Allowed Yes NS No No No NS No No
Multiple
Resources Yes Yes Yes Yes Yes Yes Yes No
Multiple
Calendars NS NS NS Yes No No No NS
Create Phantom
Float No No Yes No No Yes No No
Identify RLs Yes Yes Yes Yes Yes No Yes Yes
Phase where RLs
are created
Backward
Pass
Forward amp
After
Backward
Pass
Forward
Pass
Forward amp
After
Backward
Pass
After
Forward
Pass
NA Forward
Pass
Forward amp
Backward
Pass
Unnecessary
RLs Yes Yes No No Yes NA Yes No
Dynamic RLs No No No No No No No No
NA Not Apply
25
Woodworth and Shanahan (1988)
Woodworth and Shanahanrsquos algorithm identifies critical resources the time of resource critically
and a critical sequence According to Woodworth and Shanahan a critical sequence consists of
activities that share technological and resource relationships and takes the longest time to be
completed The algorithm is briefly described as follows
1 Perform the Minimum Slack heuristic under the parallel method approach
2 Record a label for each activity the resource ID and the order in which each resource is
used during the forward pass In addition record in a resource pool the ID of the activities
that use the resources
3 Search the resource usage history and the activitiesrsquo order to find the immediate
predecessor of the current activity during the backward pass Create a resource link if the
Early-Start Time (ES) of the predecessor activity and the Early-Finish Time (EF) of the
current activity are equal and they are not technologically connected
4 Calculate the technologicalresource slack (Total Float) as the difference between the ES
and EF of each activity once all activities are connected
Comparison
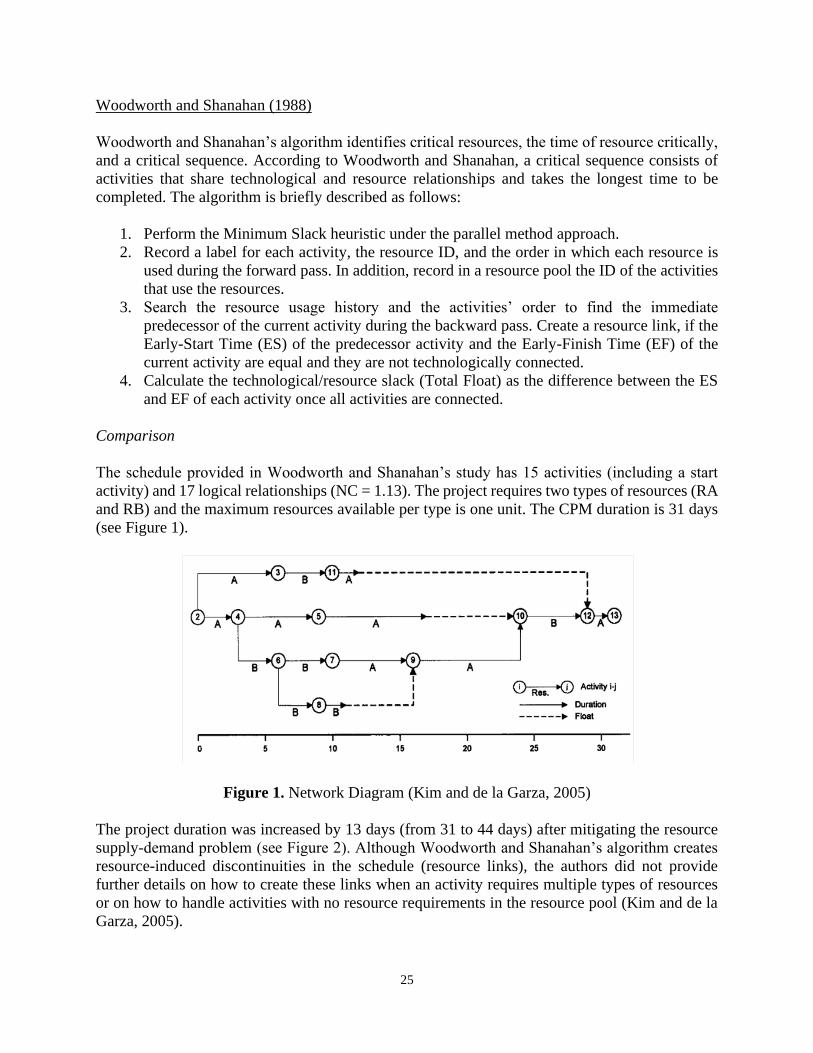
The schedule provided in Woodworth and Shanahanrsquos study has 15 activities (including a start
activity) and 17 logical relationships (NC = 113) The project requires two types of resources (RA
and RB) and the maximum resources available per type is one unit The CPM duration is 31 days
(see Figure 1)
Figure 1 Network Diagram (Kim and de la Garza 2005)
The project duration was increased by 13 days (from 31 to 44 days) after mitigating the resource
supply-demand problem (see Figure 2) Although Woodworth and Shanahanrsquos algorithm creates
resource-induced discontinuities in the schedule (resource links) the authors did not provide
further details on how to create these links when an activity requires multiple types of resources
or on how to handle activities with no resource requirements in the resource pool (Kim and de la
Garza 2005)
26
Figure 2 Woodworth and Shanahanrsquos Schedule (Woodworth and Shanahan 1988)
The RCPM schedules under the serial and parallel approaches are shown in Figure 3 The main
difference between the two schedules is the activitiesrsquo sequence which leads to a different resource
link configuration Specifically the sequence of activities A5-10 A7-9 and A9-10
Figure 3a Serial-Based Schedule
Figure 3b Parallel-Based Schedule
Figure 3 RCPM Results for Woodworth and Shanahanrsquos Example
27
All three schedules have a continuous critical sequence and they do not have phantom float
Although Woodworth and Shanahanrsquos algorithm provides a shorter duration (44 days) and the
schedule has fewer critical activities (53) the algorithm increases the network complexity by
101 (see Table 2) The RCPM serial-based schedule is more flexible than the RCPM parallel-
based schedule in terms of the number of activities with free float but it has more critical activities
and creates more resource links Both algorithms increased the project duration by more than 37
Table 2 Comparison with Woodworth and Shanahanrsquos Result
Authors
RCS
Method Duration
(Days)
Resource
Links
Increase
Duration
Increase
NC
Critical
Activities
Activities
with FF
Woodworth
and
Shanahan
Parallel
(ES +
TF)
44 8 42 101 53 13
Kim and de
la Garza
Serial
(LS) 46 5 48 76 67 20
Parallel
(ES +
LS)
45 4 45 68 60 13
Bowers (1995)
Bowersrsquo algorithm is similar to that proposed by Woodworth and Shanahan (1988) The main
difference between the two algorithms is the phase where resource links are identified and created
in the schedule While in Woodworth and Shanahanrsquos algorithm resource links are created during
the backward pass in Bowersrsquo algorithm resource links are created during the forward pass
Bowersrsquo algorithm is briefly described as follows
1 Apply the Minimum Latest Start heuristic under the parallel approach (This rule is
equivalent to the Minimum Slack heuristic)
2 Identify and create resource links during the forward pass considering the resource usage
of each activity
3 Perform the backward pass considering the technological and resource links
Comparison
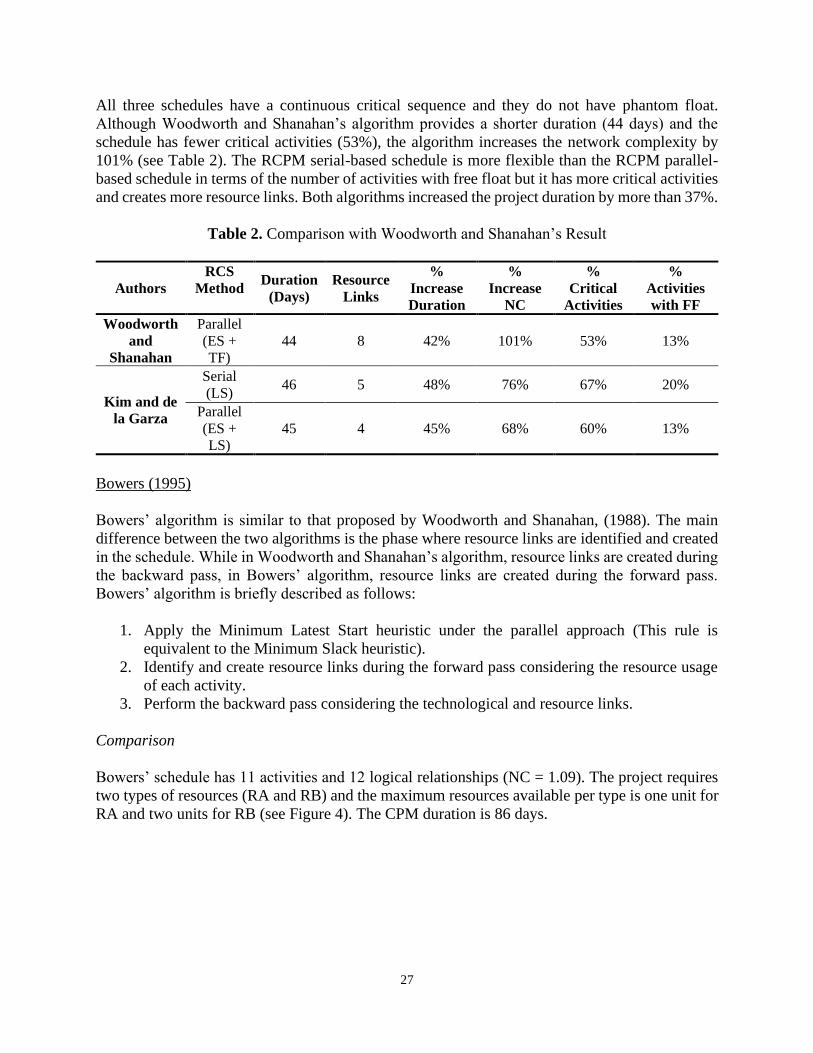
Bowersrsquo schedule has 11 activities and 12 logical relationships (NC = 109) The project requires
two types of resources (RA and RB) and the maximum resources available per type is one unit for
RA and two units for RB (see Figure 4) The CPM duration is 86 days
28
Figure 4 Bowersrsquo Network Diagram Modified from (Bowers 2005)
According to Bowersrsquo result the project duration was increased by 15 days (from 86 to 101 days)
after solving the resource conflicts (see Figure 5) Bowersrsquo algorithm assumes that resource
allocation does not change over time (Kim and de la Garza 2005) This assumption which is
unrealistic in todayrsquos projects neglects the possibility of schedule changes in terms of resource
availability Besides Bowers did not explain whether unidentified or additional resource links are
added to the schedule during or after the backward pass For instance the resource link between
Activities A6 and Activity A5 cannot be identified during the forward pass (see Figure 5)
Figure 5 Bowersrsquo Result (Bowers 2005)
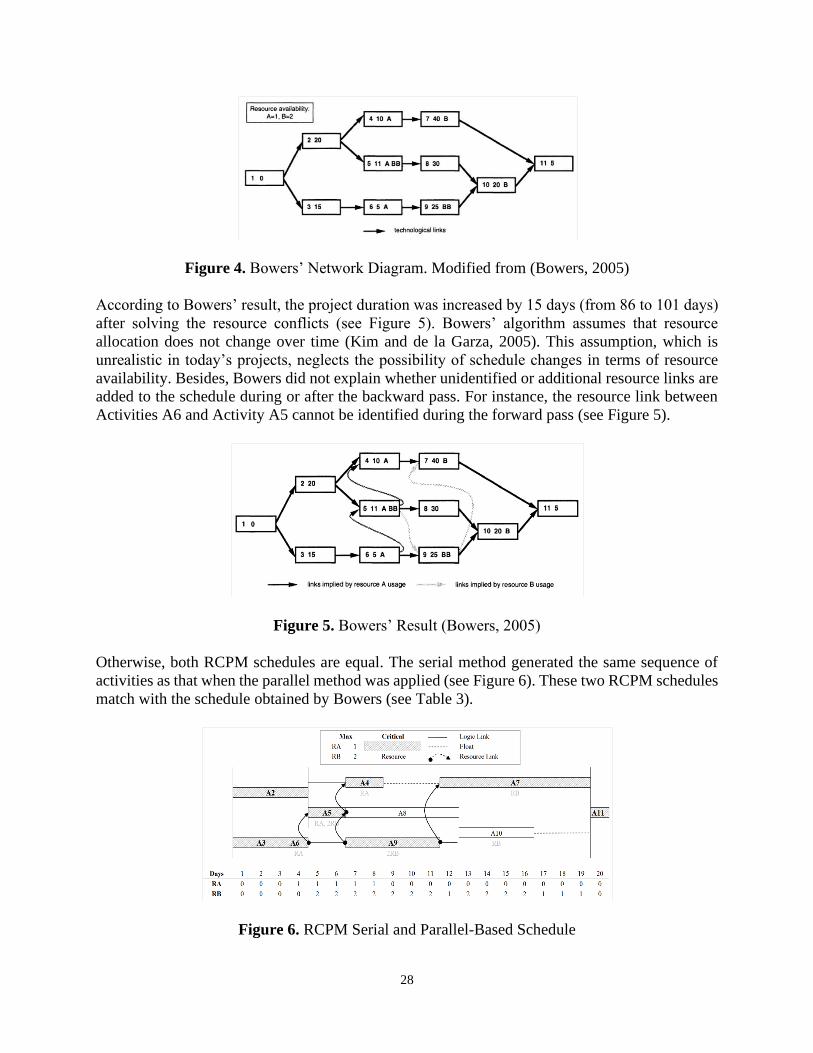
Otherwise both RCPM schedules are equal The serial method generated the same sequence of
activities as that when the parallel method was applied (see Figure 6) These two RCPM schedules
match with the schedule obtained by Bowers (see Table 3)
Figure 6 RCPM Serial and Parallel-Based Schedule
29
Table 3 Comparison with Bowersrsquo Result
Authors
RCS
Method Duration
(Days)
Resource
Links
Increase
Duration
Increase
NC
Critical
Activities
Activities
with FF
Bowers Parallel 101 4 17 33 64 18
Kim and
de la
Garza
Serial amp
Parallel 101 4 17 33 64 18
Abeyasinghe Greenwood and Johansen (2001)
The algorithm proposed by Abeyasinghe et al is briefly described as follows
1 Perform CPM and create the Gantt chart of the project based on early dates
2 Draw the link-structure of the project This structure is a combination of the various logic
paths of the project network Vertical lines and right-handed arrows represent activity
relationships
3 Manipulate the link-structure to eliminate the resource conflicts while ensuring a minimum
project duration The structure is compressed according to some rules defined by the
authors
4 Identify possible critical paths The longest path becomes the only critical path
Comparison
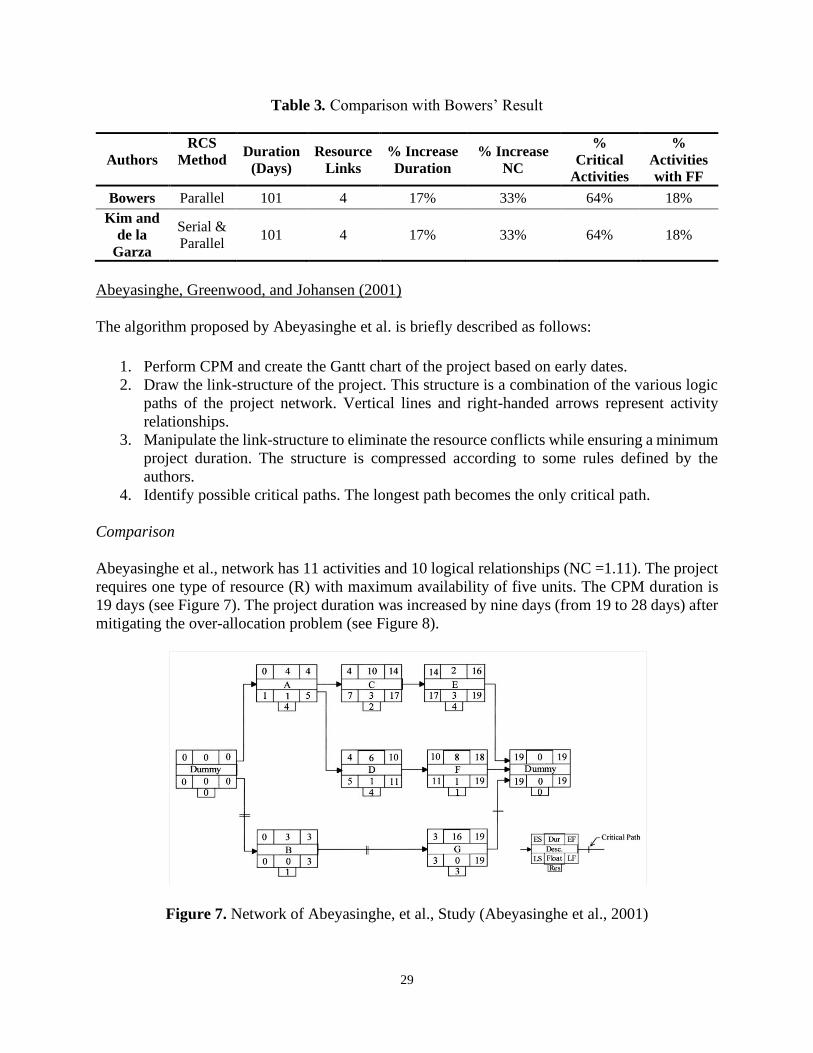
Abeyasinghe et al network has 11 activities and 10 logical relationships (NC =111) The project
requires one type of resource (R) with maximum availability of five units The CPM duration is
19 days (see Figure 7) The project duration was increased by nine days (from 19 to 28 days) after
mitigating the over-allocation problem (see Figure 8)
Figure 7 Network of Abeyasinghe et al Study (Abeyasinghe et al 2001)
30
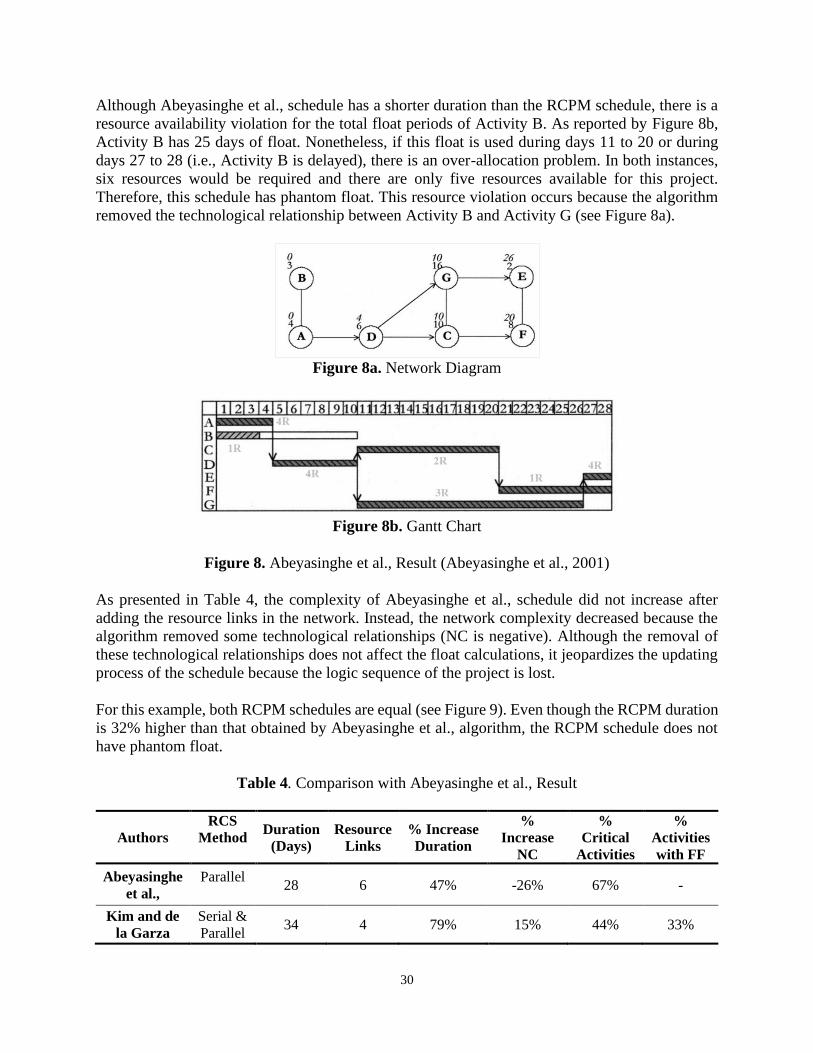
Although Abeyasinghe et al schedule has a shorter duration than the RCPM schedule there is a
resource availability violation for the total float periods of Activity B As reported by Figure 8b
Activity B has 25 days of float Nonetheless if this float is used during days 11 to 20 or during
days 27 to 28 (ie Activity B is delayed) there is an over-allocation problem In both instances
six resources would be required and there are only five resources available for this project
Therefore this schedule has phantom float This resource violation occurs because the algorithm
removed the technological relationship between Activity B and Activity G (see Figure 8a)
Figure 8a Network Diagram
Figure 8b Gantt Chart
Figure 8 Abeyasinghe et al Result (Abeyasinghe et al 2001)
As presented in Table 4 the complexity of Abeyasinghe et al schedule did not increase after
adding the resource links in the network Instead the network complexity decreased because the
algorithm removed some technological relationships (NC is negative) Although the removal of
these technological relationships does not affect the float calculations it jeopardizes the updating
process of the schedule because the logic sequence of the project is lost
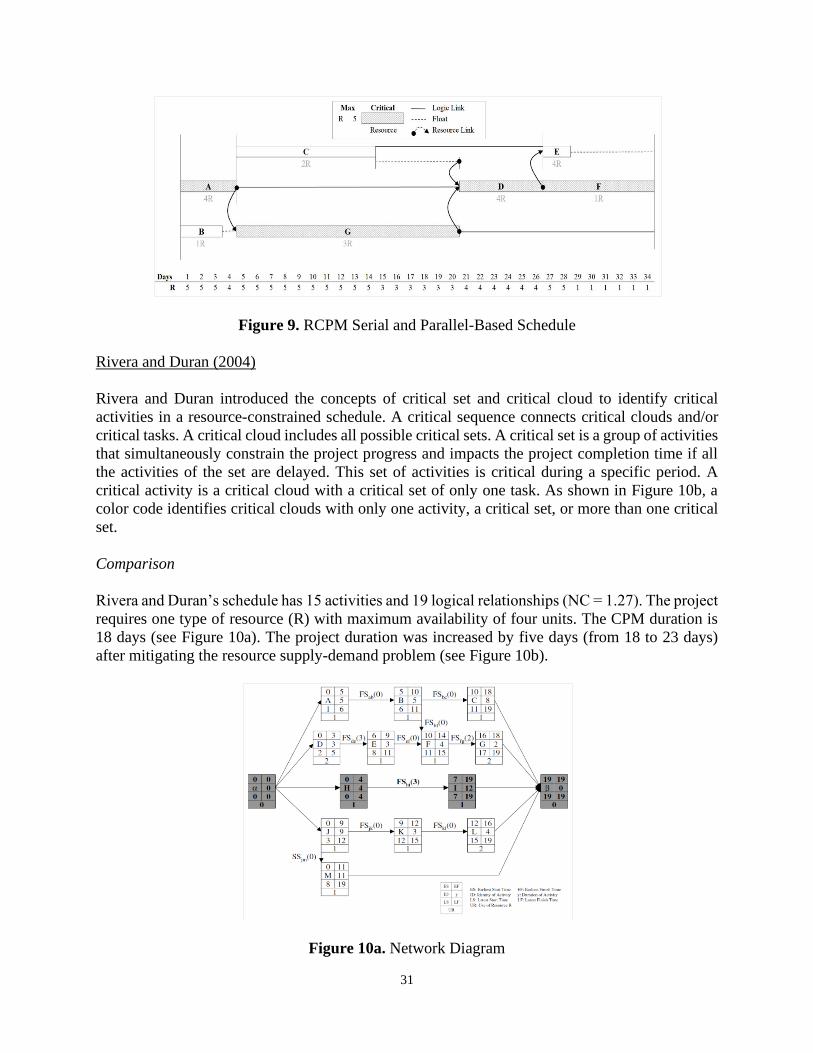
For this example both RCPM schedules are equal (see Figure 9) Even though the RCPM duration
is 32 higher than that obtained by Abeyasinghe et al algorithm the RCPM schedule does not
have phantom float
Table 4 Comparison with Abeyasinghe et al Result
Authors
RCS
Method Duration
(Days)
Resource
Links
Increase
Duration
Increase
NC
Critical
Activities
Activities
with FF
Abeyasinghe
et al
Parallel
28 6 47 -26 67 -
Kim and de
la Garza
Serial amp
Parallel 34 4 79 15 44 33
31
Figure 9 RCPM Serial and Parallel-Based Schedule
Rivera and Duran (2004)
Rivera and Duran introduced the concepts of critical set and critical cloud to identify critical
activities in a resource-constrained schedule A critical sequence connects critical clouds andor
critical tasks A critical cloud includes all possible critical sets A critical set is a group of activities
that simultaneously constrain the project progress and impacts the project completion time if all
the activities of the set are delayed This set of activities is critical during a specific period A
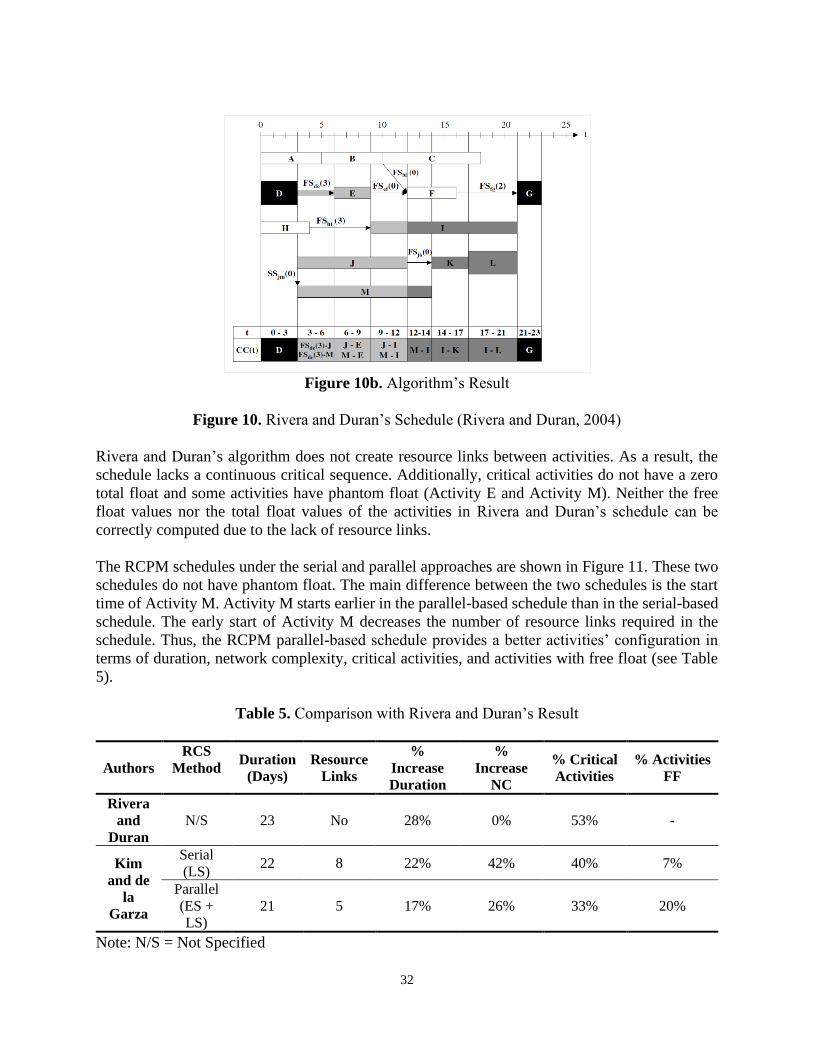
critical activity is a critical cloud with a critical set of only one task As shown in Figure 10b a
color code identifies critical clouds with only one activity a critical set or more than one critical
set
Comparison
Rivera and Duranrsquos schedule has 15 activities and 19 logical relationships (NC = 127) The project
requires one type of resource (R) with maximum availability of four units The CPM duration is
18 days (see Figure 10a) The project duration was increased by five days (from 18 to 23 days)
after mitigating the resource supply-demand problem (see Figure 10b)
Figure 10a Network Diagram
32
Figure 10b Algorithmrsquos Result
Figure 10 Rivera and Duranrsquos Schedule (Rivera and Duran 2004)
Rivera and Duranrsquos algorithm does not create resource links between activities As a result the
schedule lacks a continuous critical sequence Additionally critical activities do not have a zero
total float and some activities have phantom float (Activity E and Activity M) Neither the free
float values nor the total float values of the activities in Rivera and Duranrsquos schedule can be
correctly computed due to the lack of resource links
The RCPM schedules under the serial and parallel approaches are shown in Figure 11 These two
schedules do not have phantom float The main difference between the two schedules is the start
time of Activity M Activity M starts earlier in the parallel-based schedule than in the serial-based
schedule The early start of Activity M decreases the number of resource links required in the
schedule Thus the RCPM parallel-based schedule provides a better activitiesrsquo configuration in
terms of duration network complexity critical activities and activities with free float (see Table
5)
Table 5 Comparison with Rivera and Duranrsquos Result
Authors
RCS
Method Duration
(Days)
Resource
Links
Increase
Duration
Increase
NC
Critical
Activities
Activities
FF
Rivera
and
Duran
NS 23 No 28 0 53 -
Kim
and de
la
Garza
Serial
(LS) 22 8 22 42 40 7
Parallel
(ES +
LS)
21 5 17 26 33 20
Note NS = Not Specified
33
Figure 11a Serial-Based Schedule
Figure 11b Parallel-Based Schedule
Figure 11 RCPM Results for Rivera and Duranrsquos Example
Lu and Li (2003)
Lu and Li (2003) developed the Resource-Activity Critical-Path Method as a serial based approach
in which the Work Content (WC) is the primary criterion to schedule activities The work content
is the relative weight of each activity with respect to time and resource usage The work content is
calculated as the number of resources multiplied by the activity duration Limited resources are
first assigned to activities with higher work content since these activities may affect the project
completion time Lu and Lirsquos algorithm is briefly described as follows
1 Determine the status of each activity as CAN-DO TO DO or DONE Update this status
each time that an activity is scheduled Then calculate the work content of each activity
34
2 Sort the CAN-DO activities in descending order according to their work content If there
is a tie with respect to the work content schedule the activity with a larger number of
resources or longer duration first
3 Determine and update the time when resources are ready to work (Ready to Serve Time -
RST) Allocate the number of resources needed for the current activity based on the RST
4 Determine the Early Start Time (ES) of each activity considering the maximum date
between the Early Finish Time (EF) of its predecessors and the RST of its resources
5 Calculate the idle time of resources before being allocated to an activity as the difference
between the ES of the current activity and the RST of the participating resources Check if
the resources allocated to the current activity can be allocated to another CAN-DO activity
6 Replace the RST of the resources participating in the current activity with the EF of the
current activity Repeat the previous steps until all activities are completed
7 Identify the resource-constrained successor activities ie the first activity that uses the
same resource of the current or predecessor activity Then create the corresponding links
between the activities
8 Perform the backward pass considering the technological and resource relationships
Lu and Lirsquos algorithm requires a lot of in-between work (additional networks andor tables) to
handle the interaction and allocation of resources This turns out to be impractical when applying
it to real projects (Pantouvakis and Manoliadis 2006) Besides the use of the work content as a
priority rule generates different results for the same project when having activities with multiple
types of resource requirements Under this scenario the user should determine which type of
resource is more important and based on that criterion calculate the work content
Besides Lu and Li did not specify how to schedule activities with no resource requirement These
activities do not affect the schedule by holding up resources but they are necessary to keep the
logic sequence of a project Activities with no resource requirements should not have the least
priority to be scheduled (WC = 0) On the other hand when there is a resource-dependency
between activities that are also technologically connected the resource relationship takes
precedence over the logical relationship ie some technological relationships are removed from
the schedule
Pantouvakis and Manoliadis (2006)
Pantouvakis and Manoliadisrsquo algorithm is briefly described as follows
1 Apply any RCS method to mitigate the resource supply-demand problem
2 Identify the resource dependencies that exist between the activities from the resource
histogram A resource dependence exists if an activity uses part or all the resources of its
predecessor activity
3 Re-draw the network considering not only the logical relationships but also the resource
relationships Review the schedule to determine if the project can be logically performed
If not reconsider the resource limits and perform the algorithm a second time
4 Perform the CPM in the final network to obtain the total float values
5 Pantouvakis and Manoliadisrsquo algorithm assumes that resource requirements do not change
over time Besides since the algorithm is based on the resource-leveled histogram the user
35
should identify the resource dependencies between activities by inspection This process is
prone to errors when having large networks
Nisar Yakamamoto and Suzuki (2013)
Nisar et al proposed the Resource-Dependent Critical Path Method which 1) identifies different
types of resource dependencies 2) determines alternative schedules and 3) optimizes the number
of resource links when having multiple alternatives to create them for a specific activity The
algorithm is described as follows
1 Perform the forward and backward pass of any RCS method (Nisar et al applied the
Ranked Positional Weighted method)
2 Perform the backward pass of the selected RCS method
21 Reverse the original schedule (ie the predecessor activities become the successorrsquos
activities and vice-versa) Then perform the CPM forward pass
22 Calculate the Constrained Latest Finish (CLF) time for each activity of the reverse
schedule obtained in Step 21 (CLF = Project Duration ndash Early Start Time) Perform
the RCS a second time and obtain the reverse RCS schedule
23 Calculate the CLF time for the reverse RCS schedule of Step 22
3 Determine resource dependencies
31 Create a strict resource precedence relationship when the start time of a current activity
is delayed by the same time that its predecessor activity is delayed
32 Create a flexible resource precedence relationship when the predecessor activity is
delayed more than one day and if it affects the start time of the current activity
33 Minimize the total number of resource relationships without violating any resource
constraint
4 Remove redundant relationships from the schedule
The two main limitations of Nisar et al algorithm are 1) multiple types of resources cannot be
considered and 2) technological relationships with lags cannot be included in the schedule In
addition the authors did not provide a reasonable argument that supports the development of
reverse CPM and RCS schedules These several in-between steps of the algorithm are impractical
for practitioners
Case Study
Ahuja et al schedule was used by Lu and Li (2003) Pantouvakis and Manoliadis (2006) and
Nisar et al (2013) to illustrate their proposed algorithms The schedule has 11 activities and 14
logical relationships (NC = 127) The project requires one type of resource (R) and the maximum
resource availability is six units The CPM duration is 14 days (see Figure 12)
36
Figure 12a Network Diagram
Figure 12b Bar Chart
Figure 12 Ahuja et al Schedule (Pantouvakis and Manoliadis 2006)
Comparison
According to Lu and Lirsquos result the project duration was increased by six days (from 14 to 20
days) after solving the resource conflicts (see Figure 13) Lu and Lirsquos algorithm created
unnecessary resource links because the links were added after performing the forward pass If the
resource links would have been created during the forward pass the link between Activity E and
Activity F would not have been necessary At that time the link between Activity G and Activity
F would have been already created Moreover the resource link between Activity E and Activity
F is not required because if Activity E is delayed there is not an over-allocation problem (see
Figure 13) The same scenario occurs for the link between Activity H and Activity I
Figure 13 Lu and Lirsquos Result Kim and de la Garza (2005)
37
Similar to Lu and Lirsquos result Pantouvakis and Manoliadisrsquo algorithm increased the project duration
by six days (see Figure 14b) However the algorithm removed some technological relationships
from the schedule For example the logical relationships between Activity B and Activity F
Activity C and Activity G Activity E and Activity I and Activity G and Activity I (see Figure 12a
and Figure 14a) These technological relationships were removed from the network because they
become redundant once the resource links are added to the schedule
Furthermore Pantouvakis and Manoliadisrsquo algorithm creates unnecessary resource links For
example the resource link between Activity H and Activity I is not needed Activity H can be
delayed four days without exceeding the maximum number of resources available in the project
which is six (see Figure 14b)
Figure 14a Network Diagram with Resource Links
Figure 14b Bar Chart
Figure 14 Pantouvakis and Manoliadisrsquos Result (Pantouvakis and Manoliadis 2006)
In Pantouvakis and Manoliadisrsquo schedule there are three possible resource driver activities for the
delayed task (F) (see Figure 15a) As a result two different resource links configurations can be
created If Activity D and Activity E are selected as resource drivers of Activity F two resource
links should be created in the schedule (see Figure 15b) Otherwise if Activity G is selected as the
resource driver of Activity F only one resource link is needed in the schedule (see Figure 15c)
Most of the existing algorithms do not have a criterion to select a possible resource link
configuration or to identify a resource driver activity when having several alternatives
38
Figure 15a Possible Resource Drivers of Activity F (D E and G)
Figure 15b Alternative No 1 Figure 1c Alternative No 2
Figure 15 Multiple Resource Links Configurations
According to Nisar et al result the project duration was increased by three days (from 14 to 17
days) after mitigating the resource supply-demand problem The algorithm only increased the
project duration by 21 Nisar et al algorithm provides a better schedule than the other three
authorsrsquo algorithms in terms of duration network complexity critical activities and activities with
free float Nevertheless the mechanism proposed by the authors to remove redundant relationships
removes technological links For instance the logical relationship between Activity B and Activity
G no longer exists (see Figure 16a) Because an optimization function minimizes the total number
of resource relationships without violating the resource constraints Nisar et al algorithm is not
totally rule-based
Both RCPM schedules (serial and parallel-based) are equal (see Figure 16b) The RCPM schedule
provides a better activitiesrsquo configuration than that of Lu and Li and Pantouvakis and Manoliadisrsquo
schedules in terms of duration network complexity critical activities and activities with free float
(see Table 6)
39
Figure 16a Nisar et al Result
Figure 16b RCPM Serial and Parallel-Based Schedule
Figure 16 Nisar et al (2013) and RCPM Results
Table 6 Comparison with Lu and Li Pantouvakis and Manoliadis and Nisar et al Results
Authors RCS
Method
Duration
(Days)
Resource
Links
Increase
Duration
Increase
NC
Critical
Activities
Activities
FF
Lu and Li Serial
(WC) 20 5 43 36 64 9
Pantouvakis Serial
(LS) 20 5 43 36 55 9
Nisar RPW 17 3 21 21 36 27
Kim and de
la Garza
Serial
Parallel 19 4 36 29 55 18
Note RPW Ranked Positional Weighted
40
Shortcomings of Existing RCS Related Algorithms
This section describes the three main shortcomings of the RCPM developed by Kim and de la
Garza (2003) which apply to the other algorithms reviewed in this study
Unidentified Resource Links in Multiple Calendars
When an activity is delayed and scheduled during the non-working days of its predecessor the
RCPM does not identify the corresponding resource links (Kim 2003) For example in Figure
17a Activity A is delayed one day to resolve the over-allocation problem on Day 2 The algorithm
mitigates the resource-demand problem but the two necessary resource links are not identified
(see Figure 17b) As shown in Figure 17c a resource link is needed between Activity B and
Activity A and another between Activity A and Activity B This link ensures that Activity A is not
delayed for more than three days Otherwise there would be an over-allocation problem
Figure 17a Initial Scenario
Figure 17b Unidentified Resource Links Scenario
Figure 17c Potential Solution
Figure 17 Unidentified Resource Links in the RCPM
A proposed solution to this issue is to create two different activities (B1 and B2) that represent the
activity that is scheduled between non-working days (B) (see Figure 17c) This alternative may
increase the complexity of the network and algorithm by adding more activities resource links
and in-between steps Further research is needed to determine how to handle these resource
relationships and additional activities when the schedule must be updated
41
Lack of Dynamic Resource Links
By the time the eight algorithms were developed the main concern was to solve the problem of a
broken critical path in a resource-constrained schedule For that reason the majority of the authors
did not explore the use of resource links to update the schedule or to perform a delay analysis
During the control phase of a project an update or a delay event may change the priority order
designated by the RCS heuristic to schedule the activities Thus the resource links identified
before the update may no longer be required andor new resource links can be identified after the
update The initial resource links should be removed from the schedule before updating the
schedule because they were identified based on previous or different project conditions Keeping
the resource links during the update constrains the schedule For that reason the resource links
have the feature of being temporal or dynamic Kim (2009) considered resource links for updating
the schedule but the author did not remove the resource links from the schedule each time that the
RCPM was re-applied
The incorporation of dynamic resource links in an algorithm does not create analytical challenges
if the data date of the update is known By knowing the data date of the update the algorithm will
remove only the resource links located right of the data date Even though the resource links
located right of the data date should be removed each time that an algorithm is re-applied the
resource links located left of the data date should remain on the schedule In that way after all
activities have been completed the as-built schedule will have a continuous critical path with no
phantom float
Several of the algorithms reviewed in this paper remove some technological relationships from the
schedule because these relationships become redundant after adding the resource links to the
network This process jeopardizes the updating process Due to the resource links should be
removed before updating or performing a Time Impact Analysis the logic sequence of the project
will be lost if there is no record of the logical relationships that were removed The challenge of
incorporating dynamic resource links in the schedule is knowing how to handle and keep track of
the links that have been created removed andor updated since each time the schedule is updated
the sequence of the activities may change
Selection of a Resource Links Configuration
The major problem when identifying the resource relationships in the schedule is the fact that
multiple alternatives for creating resource links between activities may exist when many current
activities have many predecessor activities Hence multiple and different schedules can be
generated for the same project (Kim 2003 Nisar et al 2013) The difference between the multiple
schedules that can be generated is not only the number of resource links created but also the critical
path So the question that arises is which schedule should be considered as the baseline
Despite Abeyasinghe et al (2001) mentioning that solving resource-constrained problems with
optimization tools is impractical in large projects due to the significant number of variables and
constraints involved this mathematical mechanism could be effective when having multiple
resource links configurations According to Nisar Yamamoto amp Suzuki (2013) the resource links
42
should be created in a way that the total number of relationships is minimized without violating
the resource constraints Nisar Yamamoto amp Suzuki (2013) proposed a function to find the
optimal resource links between activities The main goal is to not increase the complexity of the
network Further research is needed to determine the effectiveness of this approach under different
project characteristics and constraints An important factor to consider in the analysis is the
algorithmrsquos running time
On the other hand Bowers (1995) suggested that when having identical parallel activities it is the
project managerrsquos responsibility to determine the activity with higher priority Another alternative
that also keeps the algorithms rule-based is to establish and test a criterion to select one of the
multiple resource links configurations For instance the resource driver activity could be the
predecessor activity with the highest number of resources In a resource-constrained schedule this
activity is more likely to delay the project due to the high demand for resources that it requires If
this activity is delayed more activities could be delayed because they would need the resources
that the resource driver activity is using Several parameters should be tested in order to establish
a rule that provides good solutions in most of the cases These are schedules with a lower number
of resource links to avoid a complex network Current research is being carried out to determine
which priority rules may be considered for selecting a potential resource link configuration This
rule will be included in an enhanced RCPM algorithm
A criterion to select among alternative schedules should be also determined For instance 1) the
schedule with the lowest number of resource links since it may be less complex in terms of number
of relationships 2) the schedule with the lowest percentage of critical activities since the
probability to cause delays to the project is lower 3) the schedule with the highest percentage of
activities with free float since it is more flexible or 4) the schedule with the fewest resource idle
time Further research should be performed to determine which criterion is the most appropriate
Discussion
Delay Analysis
The limited amount of resources allocated to projects demands the use of resource-loaded
schedules for delay analysis (Braimah 2013) As stated by Ibbs and Nguyen (2007) ldquoperforming
a schedule analysis without considering resource allocations may increase the ownerrsquos or
contractorrsquos risk of assuming delay responsibility which is not his or her faultrdquo
The main issue when incorporating resources in a delay analysis is the fact that the RCS existing
algorithms do not incorporate and handle dynamic resource links This leads to untrusted results
because the schedule does not reflect the real conditions of the project Therefore the parties
involved may not be totally responsible for the apportioned delays (Ibbs amp Nguyen 2007)
Besides the algorithms do not allow activities to be interrupted which is a common scenario when
having a delay event
Another issue when incorporating resources in the analysis is the selection of a heuristic to solve
the resource conflicts As demonstrated by Nguyen and Ibbs (2008) the sequence of activities may
43
be altered each time that the network is re-scheduled because of a project update The updates may
change the priority rank assigned to each activity when performing an RCS heuristic and as a
result different results can be obtained for the same delay scenario (Kim 2009)
Performance of Existing RCS Related Algorithms
These heuristics provide ldquogoodrdquo but not optimal solutions (Wiest 1963 Lu and Li 2003
Pantouvakis and Manoliadis 2006) Some rules may work well for a project but may not work
well when they are applied to a different project (Wiest 1963) Based on the results of this
research which are limited to small networks the methods proposed by Nisar et al (2013) and
Kim and de la Garza (2003) provide good solutions in terms of time In most of the cases the
average increase in the project duration was lower than 37 when the RCPM was applied
Nisarrsquos algorithm generates schedules with lower complexity in terms of relationships because it
incorporates a function that minimizes the number of resource links created in the schedule
Nevertheless the algorithm removes some technological relationships from the schedule after
identifying the resource links It is suggested to keep track of the technological relationships that
are removed from the schedule Otherwise the logical sequence of the project will be lost when
updating the schedule or performing a delay analysis
Unlike Nisarrsquos algorithm Kimrsquos algorithm does not have any mechanism to optimize the number
of resource links created in the schedule but it does not remove the logical relationships from the
schedule Additionally RCPM is practical and easy to understand In this regard Nisarrsquos algorithm
requires a lot of in-between steps and the authors defined two types of resource relationships (strict
and flexible) that may be not practical for professionals Worthy of note none of the algorithms
consider the dynamic feature of resource links Therefore using these methods is not
recommended for updating the schedule or for applying a Time Impact Analysis unless they
incorporate and handle dynamic resource links
The RCS related algorithms reviewed in this paper were tested by the corresponding authors in
one or two hypotheticalreal-life projects Therefore it is not possible to develop a method of
selection based on the algorithmsrsquo performance However the indicators used in this study to
evaluate algorithm performance can help practitioners decide which method selects to mitigate the
resource supply-demand problem without generating phantom float in the schedule Algorithms
with a percentage of increase in the project duration smaller than 40 are preferred (Boctor 1976
Woodworth and Shanahan 1988) If there are several algorithms that meet this criterion the
percentage of critical activities can be used as a tiebreaker Having float in the schedule may be
beneficial when addressing potential delaying events Because most of the algorithms were tested
in small networks (20 ndash 30 activities) further investigation is required to test the performance of
the RCS related algorithms in real-life and large projects
Based on the features of each algorithm (heuristic) constraints (removal of logic links) and project
characteristics (resources and calendars) a system was developed to guide practitioners in the
selection process of an algorithm (see Figure 18)
44
Figure 18 Guide to select an Algorithm
Conclusion
On a regular basis project managers concentrate their efforts on critical and near-critical activities
However the concepts of total float and critical path lose their significance after applying resource-
constrained scheduling (RCS) methodologies (Fondahl 1961 Wiest 1964 Bowers 1995 Raz
and Marshall 1996 Rivera and Duran 2004) RCS techniques mitigate the resource supply-
demand problem but create phantom float in the schedules (ie a float that does not exist)
Therefore several algorithms have been developed to provide correct float values and a continuous
critical path in resource-constrained schedules This study reviews and evaluates the performance
of eight RCS related algorithms with the purpose of identifying the shortcomings that must be
addressed so they can be applied for delay analysis
Most of the algorithms identify resource dependences but some of them still create phantom float
in the schedule because they do not identify all the necessary resource links Some algorithms also
create unnecessary resource relationships andor remove technological relationships from the
schedule Furthermore most of the algorithms do not provide a mechanism or criterion to select a
resource links configuration among multiple alternatives and neither to select a schedule when
having multiple options Finally none of the algorithms consider the dynamic feature of resource
dependences These limitations should be addressed to make the algorithms more practical for real
construction and engineering projects
This study 1) discusses potential solutions to the shortcomings of the existing algorithms 2)
provides recommendations on the methods that can be used by industry professionals and 3)
45
proposes a system to facilitate the selection of an algorithm based on their common features
(heuristic) constraints (removal of logic links) and project characteristics (resources and
calendars) The algorithms proposed by Kim and de la Garza (2003) and Nisar et al (2013)
provide good solutions in terms of time However as presented in the discussion section there are
points to consider when applying any of these RCS related techniques
Future Research
The eight algorithms reviewed in this paper lack features for their use in delay analysis Activities
cannot be interrupted which is a common scenario when having non-working days or delaying
events In addition none of the algorithms handle dynamic resource relationships Resource links
should be removed before updating the schedule because they were created based on previous
project conditions The initial conditions may not prevail after the update Therefore a systematic
procedure is needed to incorporate and handle dynamic resource links in the algorithms when 1)
there are schedule changes 2) resource utilization changes and 3) different delay methodologies
are applied Addressing these limitations will allow a more realistic delay analysis since schedules
will reflect the real conditions of the project
Otherwise the manual identification and creation of resource links are a time consuming and error-
prone process in large and complex projects At present commercial scheduling software such as
Primavera P6 and Microsoft Project create phantom float in resource-constrained schedules
because they do not incorporate an algorithm to identify the resource relationships between the
activities Since the major scheduling software developers such as Oracle and Microsoft do not
seem to be interested in moving forward to remove phantom float from resource-constrained
schedules a system that incorporates an algorithm to remove phantom float from P6 and Microsoft
Project schedules is needed The development of a computerized system will allow the removal
in a practical way of phantom float from resource-constrained schedules
Currently research is being carried out in order to develop an enhanced RCPM-based algorithm
that addresses the shortcomings of the existing algorithms so it can properly apply for delay
analysis and project controls The enhanced RCPM algorithm will be computerized in a system
integrated with Primavera P6
References
Abeyasinghe M C L Greenwood D J amp Johansen D E (2001) An efficient method for
scheduling construction projects with resource constraints International Journal of Project
Management 19(1) 29-45 DOIorg101016S0263-7863(00)00024-7
Ahuja H Dozzi SP and AbouRizk SM (1994) Project management techniques in planning
and controlling construction projects 2nd edition Wiley New York
Alvarez-Valdes R and Tamarit JM (1989b) Algoritmos heuristicos deterministas y aleatorios
en secuenciacion de proyectos con recursos limitados Q~estiio 13 173-191
46
Baki M A (1998) CPM scheduling and its use in todays construction industry Project
Management Journal 29(1) 7ndash9 DOIorg101057jors19959
Boctor F F (April 01 1996) A new and efficient heuristic for scheduling projects with resource
restrictions and multiple execution modes European Journal of Operational Research 90 2 349-
361 DOIorg10108000207549308956882
Bowers J A (1995) Criticality in Resource-Constrained Networks Journal of the Operational
Research Soc 46 80-91 DOIorg101057jors19959
Braimah N (2013) Construction Delay Analysis TechniquesmdashA Review of Application Issues
and Improvement Needs Buildings 3 506-531 DOI103390buildings3030506
Davis E W amp Patterson J H (April 01 1975) A Comparison of Heuristic and Optimum
Solutions in Resource-Constrained Project Scheduling Management Science 21 8 944-955
de la Garza J M amp Franco-Duran D M (2017) CPM Benefits in Estimating Bidding Reported
in Survey (B Buckley Ed) httpswwwenrcomarticles43666-cpm-benefits-in-estimating-
bidding-reported-in-survey
Fondahl J W (1991) The Development of the Construction Engineer Past Progress and Future
Problems Journal of Construction Engineering and Management 117(3) 380-392
DOIorg101061(ASCE)0733-9364(1991)1173(380)
Gordon J H (January 01 1983) Heuristic methods in resource allocation International Journal
of Project Management 1 3 163-168 DOIorg1010160263-7863(83)90022-4
Ibbs W amp Nguyen L D (2007) Schedule Analysis under the Effect of Resource
Allocation Journal of Construction Engineering and Management 133 2 131-138
DOIorg101061(ASCE)0733-9364(2007)1332(131)
Kastor A amp Sirakoulis K (2009) The effectiveness of resource leveling tools for Resource
Constraint Project Scheduling Problem International Journal of Project Management 27(5) 493-
500 DOIorg101016jijproman200808006
Kim K (2003) A Resource-constrained CPM (RCPM) Scheduling and Control Technique with
Multiple Calendars (Doctor of Philosophy Dissertation) Department of Civil and Environmental
Engineering Virginia Tech Blacksburg Virginia
Kim K amp de la Garza J M (2003) Phantom Float Journal of Construction Engineering and
Management 129 (5) 507-517 DOIorg101061(ASCE)0733-9364(2003)1295(507)
Kim K amp de la Garza J M (2005) Evaluation of the Resource-Constrained Critical Path Method
Algorithms Journal of Construction Engineering and Management 131(5) 522-532
DOIorg101061(ASCE)0733-9364(2005)1315(522)
47
Kim K (2009) Delay Analysis in Resource-constrained Schedules Canadian Journal of Civil
Engineering 36 295-303 DOIorg101139L08-121
Lu M amp Li H (2003) Resource-Activity Critical-Path Method for Construction Planning
Journal of Construction Engineering and Management 129(4) 412-420
DOIorg101061(ASCE)0733-9364(2003)1294(412)
Moder J J Phillips C R amp Davis E W (1983) Project Management with CPM PERT and
precedence diagramming (3rd ed ed) New York Van Nostrand Reinhold
Nisar S A Yamamoto Koshi amp Suzuki K (2013) Resource-Dependent Critical Path Method
for Identifying the Critical Path and the ldquoReal Floatsrdquo in Resource-Constrained Project
Scheduling Journal of Japan Society of Civil Engineers 69(4) 97-107
DOIorg102208jscejcm69I_97
Nguyen L D amp Ibbs W (2008) FLORA New forensic schedule analysis technique Journal of
Construction Engineering and Management 134 7 483-491 DOIabs101061(ASCE)0733-
9364(2008)1347(483)
Pantouvakis JP amp Manoliadis OG (2006) A practical approach to resource-constrained project
scheduling Operational Research An International Journal 6(3) 299-309
DOIorg101007BF02941258
Patterson J H (1973) Alternate methods of project scheduling with limited resources Naval
Research Logistics Quarterly 20(4) 767-784 DOIorg101002nav3800200415
Patterson J H (March 01 1976) Project scheduling The effects of problem structure on heuristic
performance Naval Research Logistics Quarterly 23 1 95-123
Raz T amp Marshall B (1996) Effect of resource constraints on float calculations in project
networks International Journal of Project Management 14(4) 241-248 DOIorg1010160263-
7863(95)00090-9
Rivera F A amp Duran A (2004) Critical clouds and critical sets in resource-constrained
projects International Journal of Project Management 22(6) 489-497
DOIorg101016jijproman200311004
Ulusoy G and Ozdamar L (1989) Heuristic performance and networkresource characteristics
in resource-constrained project scheduling Journal of the Operational Research Society 40 1145-
1152 DOIorg101057jors1989196
Wiest J D (1964) Some Properties of Schedules for Large Projects with Limited Resources
Operation Research 12(3) 395-418 DOI101287opre123395
48
Woodworth B M amp Shanahan S (1988) Identifying the critical sequence in a resource-
constrained project International Journal of Project Management 6 (2) 89-96
DOIorg1010160263-7863(88)900
49
CHAPTER 3
Performance of Resource-Constrained Scheduling Heuristics3
Abstract
Over the years the study of Resource-Constrained Scheduling heuristics has focused on testing
different sets of priority rules without paying attention to the conditions under which each heuristic
produces better results Although some authors have recommended the use of specific heuristics
over any other rule these recommendations are general and do not encompass all possible project
characteristics in terms of resources and network topology Without a guidance system schedulers
must try several combinations of rules until they find one that compares favorably (shortest
duration) with the results of the other priority rules
This study proposes a new tiebreaker (Priority Number) that enhances the performance of an
existing heuristic and classifies the heuristicsrsquo performance based on specific project
characteristics The results show that the Priority Number as a tiebreaker of the Late Finish leads
to obtain schedules with lower deviations from the CPM duration and a higher number of shortest
schedules than with traditional tiebreakers
The proposed classification system indicates the two heuristics with the best performance for
specific resource network characteristics This classification will help practitioners to decide which
heuristic applies when mitigating the resource supply-demand problem given the project
characteristics
Keywords Heuristics Resource-Constrained Scheduling Tiebreaker
Introduction
Resources are included in a schedule to better represent the actual conditions of a project Under
such a scenario several activities may require the same group of resources to be completed These
activities cannot be executed at the same time unless the supply of resources would be increased
Otherwise a resource supply-demand problem (over-allocation) will arise in the schedule
In a resource-constrained schedule the initial project completion time may be extended due to
some activities that need to be delayed solving the resource over-allocation The decision of
delaying some activities and scheduling others immediately is subjected to logic precedence and
priority rules (heuristic)
3 Franco-Duran D M amp de la Garza J M (February 12 2020) Performance of Resource-Constrained Scheduling
Heuristics Journal of Construction Engineering and Management 146 (4) pp 1-12
DOIorg101061(ASCE)CO1943-78620001804
50
As rules of thumb heuristics may work better for some project characteristics than for others
(Davis 1975 Ulusoy 1989 Abetasinghe et al 2001) Previous findings suggest that heuristic
performance is poor when 1) the proportion of resources required per activity to the resources
available is high (Davis 1975) 2) activities require several types of resources (Kolish 1995) 3)
a network is highly constrained (Kolish 1995 Chen et al 2018) 4) a network has a high number
of activities (Boctor 1976 Zhan 1994) and 5) the complexity of a network which is the average
number of successors relationships per activity is around 15 to 21 (medium-high) (Davis 1975
Alvarez and Tamarit 1989 Kolish 1995)
Additionally some authors have recommended the use of specific heuristics over any other rule
For example Patterson (1976) recommended using the Minimum Total Float (TF) and Late Finish
(LF) in networks with a high average free float per activity and in networks with a high variation
in the activity duration Chen et al (2018) recommended using the LF in highly resource-
constrained networks and using the Late Start (LS) in slightly constrained networks Although
these recommendations may be useful for practitioners they are general and do not encompass all
possible project characteristics in terms of resources and network topology
Heuristics have been incorporated in commercial scheduling software like Primavera P6 and
Microsoft Project (Marimuthu et al 2018) For instance Primavera users can employ any
combination of the 26 rules listed by the software as resource-constrained priorities or any other
rule defined by the user However without a classification system that helps users to decide which
heuristic applies when mitigating the resource over-allocation problem schedulers must try several
combinations of rules until they find one that compares favorably (shortest duration) with the
results of the other priority rules
So far the study of Resource-Constrained Scheduling (RCS) heuristics has focused on testing
different sets of priority rules without paying attention to the conditions under which each heuristic
produces better results ie shorter durations A preliminary analysis showed that the performance
of existing heuristics is not consistent when networks have more than 50 activities and activities
require several types of resources For a sample of 18 networks the percentage of times that eight
existing heuristics produced the shortest schedules ranged from 11 to 39 These low numbers
highlight the need to develop a heuristic or enhancing an existing one that produces better results
under these project characteristics
The aim of this study is to 1) propose a new tiebreaker that enhances the performance of an existing
heuristic under specific project parameters 2) analyze the influence of different tiebreakers in the
resulting schedules and 3) classify the heuristicsrsquo performance based on explicit resource and
network characteristics
Theoretical Background
Heuristics have two main components the scheduling method and priority rules The scheduling
method determines the way activities are scheduled either under a serial or parallel approach
Under a serial approach activities are sorted and then scheduled one at a time Under a parallel
51
approach the activitiesrsquo sequence is determined and updated at the beginning of a specific period
ie activities are scheduled by intervals of time (Moder et al 1983)
Priority rules are criteria that establish the order to sequence activities A set of priority rules is
known as a heuristic Rules are based on information regarding activities (duration) network
(successorspredecessors) Critical Path Method (CPM) calculations (earlylate dates and float
values) and resource demand Although the first criterion of the set of priority rules (major sort
parameter) has a significant effect on the resulting schedule a minimum of two parameters is
needed for any heuristic so ties can be solved (Gordon 1974) The rule that breaks a tie ie when
two or more activities have the same value of a parameter is called tiebreaker Existing priority
rules incorporate as a tiebreaker (second sort parameter) either the ID number the duration or
total float of the activities These parameters or any other should be carefully selected since they
may have an impact on the calculated project completion time if a tie for the major sort parameter
exists
Heuristics have been tested employing different types of networks Typically networks are
generated from topological structure and resource parameters The topological structure
parameters are the number of activities the Network Complexity (NC) and the serialparallel
indicator (I2) Networks with 30 activities are considered as small size problems and networks
with more than 120 activities as large size problems (Gordon 1983) The complexity of a network
(NC) denotes the average number of successors relationships per activity It is calculated as the
ratio between the number of successor relations and the number of total activities of a project The
SerialParallel Indicator (I2) defines how close a network is to a serial or parallel chain of activities
(Kolisch 1996) This indicator ranges from zero to one If I2 = 0 activities are scheduled under
a parallel approach ie there are no precedence relationships between activities If I2 = 1
activities are serial-based scheduled (chain of activities)
Otherwise the resource parameters are the number of type of resources the Resource Strength
(RS) the Resource Factor (RF) and the Resource Utilization (RU) The Resource Utilization
factor (RU) indicates the proportion of resource requirements per activity relative to the number
of resources available The Resource Strength (RS) measures the proportion of resource demand
and availability of a network ie how constrained a network is in terms of resources considering
the maximum availability of resources The Resource Factor (RF) indicates the proportion of
resource types required per activity ie the average number of resource types needed to execute
activities Both indicators (RS and RF) range from zero to one If RS = 0 at least one activity
demands all the resource capacity Conversely if RS = 1 resources are not over-allocated If RF =1 each activity demands at least some amount of each type of resource Contrariwise if RF = 0
activities do not demand any amount of any resource
The percentage increase above the CPM duration has been used by several authors to compare and
evaluate the efficacy of several RCS related heuristics when the optimum duration of the network
is not calculated (Patterson 1973 Patterson 1976 Gordon 1986 Ulusoy and Ozdamar 1989
Boctor 1993 Kolisch 1996 Boctor 1996 Kastor and Sirakoulis 2009) The percentage increase
above the CPM duration represents the delay generated by the resource unavailability because of
the heuristic employed The lower the percentage the better the performance
52
The most tested priority rules reported in the literature are Late Finish (LF) Min Slack (Least Total
Float or Min TF) the shortest processing time (SPT or Shortest Duration) Late Start (LS) Greatest
Rank Positional Weight (GRPW) Greatest Resource Utilization (GRU) and Resource Scheduling
Method (RSM) (Davis 1975 Boctor 1976 Patterson 1976 Gordon 1983 Kolish 1995 Alvarez
and Tamarit 1989)
Newly Developed Tiebreaker Priority Number (Pn)
Before developing the new tiebreaker a pilot study was carried out to evaluate the performance of
different priority rules as tiebreakers of the Late Start (LS) and Late Finish (LF) These CPM late
dates were selected as major sort parameters to test the tiebreakers because previous studies have
found that either the LS or LF provides good results mitigating a resource supply-demand problem
(Alvarez and Tamarit 1989 Boctor 1993 Gordon 1994 Kolish 1995 Kolish 1996 Abetasinghe
et al 2001 Kastor and Sirakoulis 2009)
The parameters considered as potential tiebreakers were the number of resources required per
activity Resource Utilization (RU) Duration (D) Total Float (TF) Free Float (FF) and the
number of successor activities Based on the results of this preliminary analysis this study
proposed a new tiebreaker labeled Priority Number (Pn) The Priority Number which is a
composite rule considers the Duration (D) and Total Float (TF) of each activity A composite rule
combines different factorsparameters in one measure The Priority Number is calculated as shown
in Equation 1
Pni =Di
TFi (Eq 1)
In Equation 1 Pni is the priority number of activity i Di is the duration of the activity i and TFi
is the total float of activity i If TFi = 0 TFi is assumed to be equal to 095 This assumption was
made to avoid a division by zero and to differentiate between a critical activity (TF = 0) and a
near-critical activity (TF = 1) A number close to zero was not selected to avoid significant high
numbers of the Pn Due to the Pn does not exist as a priority rule in Primavera P6 the Pn values
were computed separately and then assigned to each activity using the activity codes function of
P6
The duration and total float were considered as appropriate parameters of the Pn due to the
influence they may have extending the project completion time The duration is the expected
amount of time an activity will be delayed if another activity is scheduled first Furthermore if the
delayed task is critical (TF = 0) the activity duration may be the time that the project could be
extended The greater the duration the greater the impact on the project completion time On the
other hand the CPM total float indicates how critical activities were before taking into
consideration the resources Although the CPM float values will change after mitigating the
resource-supply demand problem most of the critical and near-critical activities in CPM may be
still critical after applying an RCS heuristic
53
Enhanced LF Heuristic
Activities must be scheduled subject to precedence or logical relationships This study considered
the Late Finish (LF) as the major rule to sort the activities and used the Priority Number (Pn) as a
tiebreaker The Enhanced LF heuristic is described below
1 Sort activities by earliest Late Finish (LF)
2 If there is a tie with respect to the LF the priority is given to activities with the lowest
Priority Number (Pn) The preliminary analysis showed that shorter schedules are obtained
more frequently when the priority is given to activities with a lower Pn than a higher
number
3 If there is a tie with respect to the Pn the tie is broken by the smallest activity number (ID)
Methodology
This study generated 142 different networks to evaluate and classify the performance of RCS
heuristics The networks were created using the generator program RanGen developed by
Demeulemeester Vanhoucke and Herroelen (2003) The programrsquos output (a text file with a
Patterson Format structure) was converted to a Primavera P6 format (Franco Duran 2019)
RanGen considers two types of input parameters to construct random networks 1) the networksrsquo
topology and 2) the networksrsquo resource characteristics
Topological Structure
The topological structure of a network is determined by the SerialParallel Indicator (I2) and the
number of activities The 142 generated networks were limited in size to between 30 and 90
activities with an average of 64 activities per network Their complexity ranges from 140 to 165
with an average value of 150 ie three immediate successors per activity RanGen assigned
durations between one and ten units of time to activities The average activity duration of the
networks is five units of time
To resemble a network with parallel and serial activities I2 was defined as 065 (see Figure 1b)
Figure 1 shows the structure of a network of 12 activities when I2 = 020 (parallel-based) I2 =065 (serial and parallel-based combination) and I2 = 10 (serial-based)
Figure 1a Network with I2 =
02 (Parallel-Based)
Figure 1b Network with I2 = 065 (serial and parallel-
based combination)
54
Figure 1c Network with I2 = 10 (Serial-Based)
Figure 1 Network Topologies
Resource Measures
The number of types of resources the Resource Strength (RS) and the Resource Factor (RF) were
the three resource-related parameters defined in RanGen to construct networks The 142 networks
have single or multiple resource requirements with a maximum of three types of resources per
project All resource types are subjected to fixed resource availabilities which were randomly
assigned by RanGen and were constant over the project duration The resource maximum
availability per type varies between 10 and 16 units
In this study the RS was defined as 025 to guarantee an over-allocation scenario in each of the
generated networks Because heuristic performance decreases when the RF is close to 1 most of
the generated networks of this study (N = 112) have a RF equal to 075 (Kolish 1995) Few
networks have a RF equal to 025 (N = 30) Figure 2 shows the resource profiles of a network
with a RF equal to 025 and 075 respectively When RF = 025 activities need less of the resource
type(s) to be executed (see Figure 2a) and when RF = 075 activities need more of the resource
type(s) to be executed (see Figure 2b)
Figure 2a Resource Profile when RF = 025 Figure 2b Resource Profile when RF = 075
Figure 2 Resource profiles when RF = 025 and RF = 075 for a network with I2 = 065 and
RS = 025
The Resource Utilization factor (RU) was calculated as shown in Equation (2) where rk is the
amount of resources of type k required by an activity i and Rk is the maximum amount of resources
55
of type k required by the activity i An example of how the RU factor is calculated for an activity
and a project is provided in Table 1
RUi = sumrk
RkK
(Eq 2)
Table 1 Sample Calculation of RU
ID R1 R2 R3
Resource Utilization (RU) Resource
Availability Max 12 Max 11 Max 13
A1 5 7 1 RUA1 = (512) + (711) + (113) = 113
A2 0 4 8 RUA2 = (411) + (813) = 098
Project RU = (113 + 098)2 = 105
The RU factor of the 30 networks with a RF = 025 ranges from 010 to 050 and that of the 112
networks with a RF = 075 ranges from 025 to 15 Table 2 shows a summary of the
characteristics of the 142 generated networks All networks have in common a I2 = 065 and a
RS = 025
Table 2 Sample Characteristics (N = 142 Networks)
Resource Factor (RF) 025 075 025 and 075
No Networks 30 112 142
No Activities 30 - 80 30 ndash 90 30 ndash 90
Network Complexity (NC) 140 ndash 165 140 - 162 140 ndash 165
No Type of Resources 1 - 3 1 - 3 1 - 3
Resource Utilization (RU) 012 ndash 046 028 ndash 134 012 ndash 134
Performance Criteria
Eight existing priority rules were considered to evaluate and compare the performance of the
Enhanced LF heuristic proposed in this study These heuristics were selected based on the
opportunity to perform each of them in Primavera P6 Primavera allows the user to select specific
parameters as priority rules and combined them as preferred when mitigating the resource supply-
demand problem in a schedule The eight heuristics are described below In all cases ties were
broken by the smallest activity number (ID)
Minimum Total Float (Min Slack) Priority is given to activities with the lowest Total Float
(TF) (Davis and Patterson 1975 Patterson 1976)
Shortest Duration Priority is given to activities with the shortest duration (D) (Davis and
Patterson 1975 Patterson 1976)
Longest Duration Priority is given to activities with the longest duration (D) (Davis and
Patterson 1975)
56
Minimum Late Finish Priority is given to activities with the earliest values of Late Finish
(LF) (Davis and Patterson 1975)
Minimum Late Start Priority is given to activities with the earliest values of Late Start
(LS)
Late Start Sort Priority is given to activities with the earliest values of Late Start (LS) If
there is a tie with respect to the LS priority is given to the activity with the least duration
(D) If the tie persists priority is given to the activity with the least total float (TF)
Earliest Start Time Priority is given to activities with the earliest values of Early Start
(ES)
Earliest Finish Time Priority is given to activities with the earliest values of Early Finish
(EF)
The eight existing heuristics plus the Enhanced LF heuristic were applied to the 142 generated
networks using Primavera P6 All heuristics were tested under a serial approach (P6 default
method) The CPM duration was considered as the benchmark to compare the durations obtained
with each heuristic The percentage increase in the project duration (after applying RCS) with
respect to the CPM duration was considered as an indicator to measure the performance of the
heuristics The indicator was calculated as the difference (time units) between the heuristic
duration and the CPM duration as a percentage of the CPM duration
Furthermore the performance of each heuristic relative to one another was assessed considering
the number of times each heuristic produces the shortest and longest schedules The number of
times producing the shortest duration was considered as a consistent measure of a heuristic
performance Based on the results of previous studies and given the variable nature of heuristics
a consistency rate of at least 60 is preferred Ideally heuristics with good performance will have
1) a lower percentage of deviation in the project duration 2) a higher percentage of times
producing the shortest duration (not optimum) and 3) a lower percentage of times producing the
largest duration
The performance of the heuristics was also evaluated in terms of the Resource Factor (RF) and
Resource Utilization (RU) of the networks To this end networks were classified according to the
RF and RU values shown in Table 3 These values have been commonly used in literature to
compare heuristicsrsquo performance (Ulusoy 1989) One network with a RF = 075 was excluded
from the analysis because its RU (134) did not fit the last range considered in the classification
system (10 ndash 125) As a result the final sample of this study consists of 141 networks
Table 3 Networksrsquo Classification by RF and RU
N =
14
1
RF = 025
N = 30
RU 010 - 025 N = 12
RU 025 - 050 N = 18
RF = 075
N = 111
RU 025 - 050 N = 38
RU 050 - 075 N = 35
RU 075 - 100 N = 18
RU 100 - 125 N = 20
57
Statistical Analysis
The sample size of this study was selected to guarantee a power greater than 090 in the non-
parametric tests performed The power represents the probability of rejecting the Null Hypothesis
(H0) when the Alternative Hypothesis (Ha) is true The higher the power the lower the chance of
having a Type Error II (Failing to reject Ho when it is false) and the better the probability of finding
a difference between the two groups of analysis (Elliot 2007)
Due to the similarity in the results among the heuristics the Sign Test was performed to ascertain
whether the Enhanced LF heuristic produced better results than a specific existing heuristic when
there was not a tie in the results Each time the test compared the differences in the increase of
project duration obtained by the Enhanced LF heuristic and an existing heuristic (microd) (see Equation
3) By excluding the number of times both heuristics produce the same result (tie) it is possible to
statistically determine whether the Enhanced LF heuristic outperformed a specific existing
heuristic
microd = micro₁ minus micro₂ (Eq 3)
In Equation 3 microd is the difference in the average increase between the two paired heuristics micro₁ is
the mean of the average percentage increase of project duration above the CPM duration obtained
by an existing heuristic j and micro₂ is the mean of the average percentage increase of project duration
above the CPM duration obtained by the Enhanced LF heuristic
Positive differences will occur if the existing heuristic (j) produces higher deviations from the
CPM duration than the Enhanced LF heuristic Conversely negative differences will occur if the
existing heuristic (j) produces lower deviations from the CPM duration than the Enhanced LF
heuristic The difference (microd) will be equal to zero if both heuristics obtained the same results (tie)
The hypothesis being examined by the Sign test are
H0 The probability of a positive difference is equal to the probability of a negative
difference
Ha The probability of a positive difference is greater than the probability of a negative
difference
If the Alternative Hypothesis (Ha) is accepted (p le 005) it is more likely to find lower durations
with the Enhanced LF heuristic than with a specific existing heuristic when the two paired
heuristics do not find the same solution All the statistical tests were performed at a confidence
level α = 005
The Sign Test was applied because it is not possible to assume that the differences in the increase
of duration by the two heuristics analyzed each time have an approximately normal distribution
The results of the Anderson-Darling goodness of fit test indicated the data (microd) do not follow a
normal distribution (for all cases AD between 5 and 10 p le 005) Additionally as it is expected
in a paired-sample test the data are related to each other
58
Results
The heuristicsrsquo performance was first analyzed by considering all networks of the sample as a
single group ie networks with a RF equal to 025 and 075 (see Table 4) Table 5 shows the
results of the average percentage increase over the CPM duration after applying the eight existing
heuristics and the Enhanced LF in each of the 141 networks and the percentage of times each
heuristic produced the shortest and longest durations
Table 4 Networksrsquo Classification (N = 141)
N
= 1
41
RF = 025
N = 30
RU 010 - 025 N = 12
RU 025 - 050 N = 18
RF = 075
N = 111
RU 025 - 050 N = 38
RU 050 - 075 N = 35
RU 075 - 100 N = 18
RU 100 - 125 N = 20
Although the Enhanced LF heuristic produced the lowest average increase above the CPM duration
(112 ) there is not enough statistical evidence to conclude that it is significantly better than the
following three heuristics with the lowest average increase in the duration (ES+ID LS+ID and
LS+D+TF+ID) The slight difference in the average percentage increase among the top four
heuristics is because when the Enhanced LF did not produce the shortest duration it produced the
second shortest duration
Table 5 Results N = 141 RF = 025 and 075
Heuristic Average
Increase
Minimum
()
Maximum
()
Shortest
Duration
Longest
Duration
Enhanced LF 112 13 313 592 56
ES + ID 113 03 291 585 35
LS + ID 114 11 327 577 21
LS + D + TF + ID 114 11 327 563 35
LF + ID 117 03 327 472 63
Min TF + ID 121 16 327 415 155
Longest D + ID 123 16 327 437 218
EF + ID 125 11 313 268 268
Shortest D + ID 134 11 312 190 486
The heuristics that performed the worst were the Shortest Duration+ID followed by the EF+ID
They produced the largest deviations in the networks (134 and 125 respectively) Previous
studies also have found that the Shortest Duration+ID produced the worst results (Davis 1975)
The Sign Test results indicate that there is enough statistical evidence to conclude that the
Enhanced LF heuristic produced significantly lower deviations than the LF+ID Min TF+ID
Longest Duration + ID EF+ID and Shortest Duration+ID heuristics For all cases p-value = 0001
(see Table 6) Although there is not sufficient statistical evidence to ascertain that the Enhanced
59
LF outperformed the other top three heuristics the Enhanced LF produced lower durations
(positive differences microd) more frequently than the LS+D+TF+ID (43 vs 37) and the LS+ID (44 vs
40) when there was not a tie in the results When the Enhanced LF was compared with the ES+ID
the later produced one shorter schedule more than the former (40 vs 41)
Table 6 Sign Test Results N = 141 RF = 025 and 075
Comparison No Ties No Positive
Differencesa Z-value p-value
LF + ID
Enhanced
LF
69 50 - 318 0001
Longest D + ID 44 68 - 385 0001
Min TF + ID 47 69 - 443 0001
EF + ID 47 75 - 567 0001
Shortest D + ID 38 97 - 886 0001
LS + D + TF + ID 61 43 - 055 0288
LS + ID 57 44 - 032 0372
ES + ID 60 40 000 0500 a Number of times the Percentage Increase over the CPM of an existing heuristic was higher than
that obtained by the Enhanced LF
Tiebreaker Influence
Figure 3 shows a comparison of the percentage increase over the CPM duration and the number
of times a heuristic produced the shortest and longest schedules when different tiebreakers were
considered as second sort parameters of the LF and LS rules
Figure 3a Late Finish (LF) with different Tie
Breakers
Figure 3b Late Start (LF) with different Tie
Breakers
Figure 3 Influence of a Tiebreaker in the LS and LF rules (N = 141 RF = 025 and RF = 075)
As can be observed in Figure 3a the performance of the LF was better when it was combined with
the Priority Number (Pn) rather than with the activity ID or TF ie the average percentage increase
over the CPM duration was lower with the Pn (112) and shortest schedules were obtained more
frequently (592) Unlike the LF+ID and LF+Pn (Enhanced LF) the LF+TF did not generate
schedules with the longest duration
60
The Sign Test results indicate that the LF rule leads to better results when it is combined with the
Pn (p = 0001) than with the activity ID (p = 0187) Specifically the LF+Pn (Enhanced LF)
produced 28 shorter schedules more than the LF+ID when both heuristics did not get the same
results (ties = 69) Otherwise the Sign Test did not find enough statistical evidence to assert that
the Pn yields to a better performance than the TF when used as a tiebreaker of the LF (see Table
7 p = 0187) Noteworthy when there was not a tie in the results the LF+Pn (Enhanced LF)
produced 9 shorter schedules more than the LF+TF
Table 7 Sign Test Results (N =141 RF = 025 and RF = 075)
Comparison No Ties No Positive
Differences Z-value p-value
LF + TF Enhanced
LF
60 45a -088 0187
LF + ID 69 50a - 318 0001
LS + TF LS + D + TF +ID
130 6b - 0254
LS + ID 132 3b - 0254 a Number of times the Percentage Increase over the CPM of either the LF+TF and LF+ID was
higher than that obtained by the Enhanced LF
b Number of times the Percentage Increase over the CPM of either the LS+TF or LS+ID was higher
than that obtained by the LS+D+TF+ID
The LS rule produced almost the same results whether it is combined with the TF D or activity
ID (see Figure 3b) For all three instances the average percentage increase in the CPM duration
was about 114 This consistency can be corroborated by the number of times each pair of
heuristics obtained the same networksrsquo duration In the case of the LS+ID vs LS+D+TF+ID it
happened 132 times and in the case of LS+TF vs LS+D+TF+ID it occurred 130 times
Due to the similarity in the results the Sign Test did not find any significant difference between
the three tiebreakers used for the LS For all cases the p = 0254 (see Table 7) There is only a
slight difference in the number of times each LS heuristic produced the shortest and longest
schedules The LS+ID produced 577 shortest schedules meanwhile the other two LS rules
produced 563 schedules Unlike the LS+ID and LS+D+TF+ID the LS+TF did not generate
schedules with the longest duration
Classification by RF = 025
The sample networks were classified by RF equal to 025 (see Table 8) Table 9 shows the
summary of the average percentage increase over the CPM duration the percentage of times each
heuristic produced the shortest and longest duration for the 30 networks with RF = 025
The LS+D+TF+ID heuristic produced the lowest average increase above the CPM duration (45)
and the ES+ID produced the shortest schedules more frequently than any other heuristic (933)
Although the Enhanced LF and the LS+D+TF+ID heuristics found the shortest duration the same
number of times (900) the LS+D+TF+ID heuristic produced a lower increase in the project
duration (see Table 9) Overall the top four heuristics (LS+D+TF+ID ES+ID Enhanced LF and
61
LS+ID) 1) had a lower average percentage increase above the CPM duration 2) found the shortest
duration more frequently and 3) found the worst duration (longest duration) less frequently
Table 8 Networksrsquo Classification by RF = 025
N =
14
1
RF = 025
N = 30
RU 010 - 025 N = 12
RU 025 - 050 N = 18
RF = 075
N = 111
RU 025 - 050 N = 38
RU 050 - 075 N = 35
RU 075 - 100 N = 18
RU 100 - 125 N = 20
Table 9 Results RF = 025 and N = 30
Heuristic Average
Increase
Minimum
()
Maximum
()
Shortest
Duration
Longest
Duration
LS + D + TF + ID 45 04 118 900 00
ES + ID 46 04 125 933 33
Enhanced LF 46 04 146 900 67
LS + ID 47 04 139 867 00
LF + ID 50 04 146 733 100
Min TF + ID 52 04 153 733 167
Longest D + ID 52 04 132 633 200
EF + ID 53 14 132 600 267
Shortest D + ID 60 14 183 400 467
The heuristics that performed the worst were the Shortest Duration +ID (60) followed by the
EF+ID (53) Due to the high consistency of the results among the top heuristics (900) the
Sign Test only found evidence to indicate that the Enhanced LF heuristic produces significantly
lower deviations than the EF+ID and Shortest Duration +ID (see Table 10) Worthy of note the
Enhanced LF produced lower durations (positive differences microd) more frequently than the Longest
Duration +ID (9 vs 3) EF+ID (9 vs 1) LF+ID (6 vs 2) and Min TF+ID (7 vs 2) when there was
not a tie in the results When the Enhanced LF was compared with the ES+ID and LS+D+TF+ID
both heuristics produced one shorter schedule more than the Enhanced LF
Table 10 Sign Test Results RF = 025 and N = 30
Comparison No Ties No Positive
Differencesa p-value
LF + ID
Enhanced
LF
22 6 0145
Longest D + ID 18 9 0073
Min TF + ID 21 7 0090
EF + ID 20 9 0011
Shortest D + ID 14 15 0001
LS + D + TF + ID 25 2 0500
ES + ID 25 2 0500
62
LS + ID 24 3 0656 a Number of times the Percentage Increase over the CPM of an existing heuristic was higher than
that obtained by the Enhanced LF
Classification by Resource Utilization (RU)
Table 12 and Table 13 show a comparison of the percentage increase over the CPM duration and
the number of times each heuristic produced the shortest and longest schedules when 30 networks
with RF = 025 were classified according to the RU factor (see Table 11)
Table 11 Networksrsquo Classification by RF = 025 and RU
N =
141
RF = 025
N = 30
RU 010 - 025 N = 12
RU 025 - 050 N = 18
RF = 075
N = 111
RU 025 - 050 N = 38
RU 050 - 075 N = 35
RU 075 - 100 N = 18
RU 100 - 125 N = 20
When networks have a RU between 010 and 025 either the ES+TF+ID or ES+ID rules obtained
the best results Both heuristics produced the lowest average percentage increase above the CPM
duration (33) and found the shortest durations all the time (See Table 12) Although four
heuristics found the second-lowest deviation from the CPM duration (34) the Enhanced LF
heuristic obtained the highest number of shortest schedules (916) The heuristics that performed
worst were the Shortest Duration +ID (59) followed by the EF+ID (46) Worthy of note half
of the schedules obtained by the Shortest Duration +ID have the longest duration
Table 12 Networksrsquo Classification by RU between 010 and 025 (RF = 025 N = 30)
Heuristic Average Increase Shortest
Duration
Longest
Duration
ES + TF + ID 33 1000 00
ES + ID 33 1000 00
Enhanced LF 34 916 83
LF + ID 34 833 00
LS + ID 34 833 00
LS + D + TF + ID 34 833 00
Min TF + ID 37 750 00
Longest D + ID 39 666 166
EF + ID 46 583 166
Shortest D + ID 59 416 500
When networks have a RU between 025 and 050 the LS+D+TF+ID obtained the lowest average
percentage increase above the CPM duration (53) and the shortest schedules more frequently
(940) (See Table 13) Under this scenario the LS+D+TF+ID did not find any longest schedule
63
The Enhanced LF was the second heuristic with the highest number of times producing shortest
schedules (889) The heuristics that performed the worst were the Min TF+ID followed by the
Shortest Duration +ID (62) Despite the Min TF+ID produced a significant number of schedules
with the shortest duration (722) it obtained the highest average percentage increase in the
project duration In other words the Min TF+ID produced higher deviations from the CPM
duration than the other rules when it did not work
Table 13 Networksrsquo Classification by RU between 025 and 050 (RF = 025 N = 30)
Heuristic Average Increase Shortest Duration Longest Duration
LS + D + TF + ID 53 940 00
ES + TF + ID 54 833 00
Enhanced LF 55 889 56
ES + ID 56 833 56
LS + ID 56 833 00
EF + ID 58 611 278
LF + ID 60 667 167
Longest D + ID 60 611 222
Shortest D + ID 62 389 444
Min TF + ID 62 722 278
Classification by RF = 075
The sample networks were classified by a RF equal to 075 (see Table 14) Table 15 shows the
summary of the average percentage increase over the CPM duration the percentage of times each
heuristic produced the shortest and longest duration for the 111 networks of the sample with a
RF = 075
Table 14 Networksrsquo Classification by RF = 075
N =
141
RF = 025
N = 30
RU 010 - 025 N = 12
RU 025 - 050 N = 18
RF = 075
N = 111
RU 025 - 050 N = 38
RU 050 - 075 N = 35
RU 075 - 100 N = 18
RU 100 - 125 N = 20
The Enhanced LF produced the lowest average increase above the CPM duration (128) and the
shortest schedules more frequently than any other heuristic (509) Overall the top three
heuristics (Enhanced LF LS+ID and ES+ID) 1) had a lower average percentage increase above
the CPM duration 2) found the shortest duration more frequently and 3) found the worst (longest)
duration less frequently (see Table 15) The heuristic that performed the worst was the Shortest
Duration +ID (152)
64
Table 15 Results N = 111 and RF = 075
Heuristic Average
Increase
Minimum
()
Maximum
()
Shortest
Duration
Longest
Duration
Enhanced LF 128 12 302 509 54
LS + ID 130 11 291 500 27
ES + ID 130 03 291 482 45
LS + D + TF + ID 130 11 291 473 45
LF + ID 134 03 302 402 71
Min TF + ID 138 12 291 330 152
Longest D + ID 141 12 323 384 214
EF + ID 143 11 312 188 268
Shortest D + ID 152 11 312 134 482
The influence of a tiebreaker in the LF and LS rules can be also noticed in Table 15 The Pn as a
tiebreaker of the LF leads to a lower average percentage increase in the project duration (128)
and a higher number of schedules with the shortest duration (509) than the activity ID as a
tiebreaker of the LF On the other hand the LS produced lower deviations from the CPM duration
and the shortest schedules more frequently when it was combined with the activity ID rather than
with the duration and total float
When networks have a RF equal to 075 the performance of the heuristics is not as consistent as
it is when networks have a RF equal to 025 When the RF = 075 the best heuristic (Enhanced
LF) found the shortest durations 509 of the time (see Table 15) When RF = 025 the best
heuristic (LS+D+TF+ID) found the shortest durations 900 of the time (see Table 9)
The Enhanced LF outperformed the LF+ID Min TF+ID Longest Duration +ID EF+ID and
Shortest Duration +ID heuristics For all cases the p-values were lower than 0001 (See Table 16)
The Sign Test did not find enough evidence to conclude that the Enhanced LF produces
significantly lower deviations than the LS andor ES heuristics (p gt 020) However the
Enhanced LF produced lower durations (positive differences -microd) more frequently than the
LS+D+TF+ID (41 vs 34) and LS+ID (41 vs 37) Otherwise the ES+ID and the Enhanced LF
produced the same number of shortest schedules (38)
Table 16 Sign Test Results N = 111 and RF = 075
Comparison No Ties No Positive
Differencesa Z-value p-value
LF + ID
Enhanced
LF
47 44 -287 0002
Longest D + ID 26 59 -347 0001
Min TF + ID 26 62 -412 0001
EF + ID 27 66 -512 0001
Shortest D + ID 24 82 -814 0001
LS + D + TF + ID 36 41 -069 0244
ES + ID 35 38 000 0546
LS + ID 33 41 -034 0367
65
Classification by Resource Utilization (RU)
Tables 18 - 20 show the percentage increase over the CPM duration and the number of times each
heuristic produced the shortest and longest schedules when the 111 networks with RF = 075 were
classified by RU (see Table 17) As stated by Davis 1975 the heuristic performance is affected by
the RU The greater the proportion of resource requirement per activity relative to the amount
available the greater the increase in the project duration after mitigating the resource supply-
demand problem
Table 17 Networksrsquo Classification by RF = 075 and RU
N =
14
1
RF = 025
N = 30
RU 010 - 025 N = 12
RU 025 - 050 N = 18
RF = 075
N = 111
RU 025 - 050 N = 38
RU 050 - 075 N = 35
RU 075 - 100 N = 18
RU 100 - 125 N = 20
When networks have a RU between 025 and 050 the ES+TF+ID produced the lowest average
percentage increase in the project duration (84) (See Table 18) The ES+TF+ID followed by
ES+ID produced the shortest schedules more frequently than any other rule (684 and 631
respectively) The LS+ID and LS+D+TF+ID produced the same number of schedules with the
shortest duration but the LS+ID produced a lower increase in the duration than the LS+D+TF+ID
The heuristics that performed the worst were the Shortest Duration +ID (107) followed by the
EF+ID (96)
Table 18 Networksrsquo Classification by RU between 025 and 050 (RF = 075 N= 38)
Heuristic Average Increase Shortest Duration Longest Duration
ES + TF + ID 84 684 00
LS + ID 85 526 26
LS + D + TF + ID 86 526 26
ES + ID 86 631 53
Enhanced LF 87 474 79
LF + ID 89 474 79
Min TF + ID 91 394 132
Longest D + ID 95 316 211
EF + ID 96 263 211
Shortest D + ID 107 184 500
When networks have a RU between 050 and 075 the Enhanced LF obtained the lowest average
percentage increase above the CPM duration (125) and the shortest schedules more frequently
(628) Under this scenario the Enhanced LF did not find any longest schedule (See Table 19)
The LS+ID was the second heuristic with the highest number of times producing shortest schedules
(514) The ES+TF+ID produced the second-lowest average increase in the duration (129) but
it only worked 371 of the time The ES+ID only worked 343 of the time for this scenario
66
with an average percentage increase above the CPM duration of 131 The heuristics that
performed the worst were the Shortest Duration +ID (159) followed by the EF+ID (146)
Table 19 Networksrsquo Classification by RU between 050 and 070 (RF = 075 N= 35)
Heuristic Average Increase Shortest Duration Longest Duration
Enhanced LF 125 628 00
ES + TF 129 371 00
LS + ID 131 514 00
ES + ID 131 343 28
LS + D + TF + ID 131 496 00
LF + ID 137 371 28
Min TF + ID 143 228 143
Longest D + ID 145 371 228
EF + ID 146 114 286
Shortest D + ID 159 86 514
When networks have a RU between 075 and 100 the heuristicsrsquo performance is poor ie the
consistency in the results for each heuristic was lower than 56 (See Table 20) More heuristics
should be tested under this scenario in order to identify a more efficient heuristic (percentage of
consistency of at least 60) The ES+TF+ID produced the shortest schedules more frequently
(555) than any other rule However it produced a higher average increase in the project duration
(147) than the ES+ID (144) The heuristics that performed the worst were the Shortest
Duration +ID (170) followed by the Min TF+ID (163)
Table 20 Networksrsquo Classification by RU between 075 and 100 (RF = 075 N= 18)
Heuristic Average Increase Shortest Duration Longest Duration
ES + ID 144 500 55
ES + TF + ID 147 555 00
Enhanced LF 148 333 55
LS + ID 150 333 55
LS + D + TF + ID 151 278 167
LF + ID 153 278 111
Longest D + ID 158 333 111
EF + ID 160 167 278
Min TF + ID 163 278 333
Shortest D + ID 170 55 500
When networks have a RU between 100 to 125 the LS+ID obtained the lowest average
percentage increase above the CPM duration (192) and the shortest schedules more frequently
(60) Additionally the LS+ID did not find any longest schedule (See Table 21) The ES+TF+ID
produced the same number of shortest schedules than the LS+ID (60) but the former produced
higher deviations from the CPM duration (197) than the LS+ID (192) Similarly the
Enhanced LF produced the same number of shortest schedules than the LS+D+TF+ID (55) but
the former produced higher deviations from the CPM duration (196) than the LS+ID (194)
Worthy of note the ES+ID only worked 45 of the time for this scenario with an average
67
percentage increase above the CPM duration of 198 The heuristics that performed the worst
were the Shortest Duration +ID (212) followed by the EF+ID (208)
Table 21 Networksrsquo Classification by RU between 100 and 125 (RF = 075 N= 20)
Heuristic Average Increase Shortest Duration Longest Duration
LS + ID 192 600 00
LS + D + TF + ID 194 550 00
LF + ID 195 450 50
Enhanced LF 196 550 100
ES + TF + ID 197 600 00
Min TF + ID 197 450 00
ES + ID 198 450 50
Longest D + ID 204 550 250
EF + ID 208 200 300
Shortest D + ID 212 200 400
Heuristics Selection
A matrix that classifies the performance of the heuristics was created based on the results obtained
in this study (see Table 22) The matrix was developed for networks with a SerialParallel Indicator
(I2) equal to 065 a Resource Strenght (RS) equal to 025 and a Network Complexity (NC) equal
to 15 (on average three successors per activity) Although the size of the network has been reported
as another influential parameter of heuristic performance it was not considered in the classification
system due to the fact that real construction projects have a significant number of activities that
are challenging to simulate and test by scholars (Boctor 1996 Zhan 1994) The two parameters
required to select a heuristic in the matrix are the Resource Factor (RF) and the Resource
Utilization factor (RU) These two resource measures can be easily simulated and tested Besides
they are calculated as a function of the number of total activities of the project
The matrix indicates the two heuristics with better performance for each of the scenarios
considered Given the variable nature of heuristics it is recommended to apply both options to
determine which one gives the best solution (shortest duration but not optimum) If the matrix is
empty it means that networks with the specified resource characteristics were not tested in this
study
The heuristic labeled as Option 1 is the one that produced the lowest increase in the project duration
and the shortest schedules more frequently The heuristic labeled as Option 2 is the second
heuristic which had the highest number of times producing the shortest schedules regardless of
the average increase in the project duration If there was a tie with respect to the number of times
producing the shortest duration (consistency rate) the heuristic that produced the lowest average
increase in the project duration was selected as Option 2 In real construction projects even one
day of difference in the completion time can significantly impact the budget
68
Table 22 Classification Matrix based on Heuristicsrsquo Performance
RU RF = 025 RF = 075
Option 1 Option 2 Option 1 Option 2
010 ndash 025 ES + TF + ID or ES + ID Enhanced LF - -
025 ndash 050 LS + D + TF + ID Enhanced LF ES + TF + ID ES + ID
050 ndash 075 - - Enhanced LF LS + IDa
075 ndash 100 - - ES + IDb ES + TF + IDb
100 ndash 125 - - LS + ID ES + TF + ID a Consistency rate ( Shortest Duration) lower than 50 b Consistency rate ( Shortest Duration) lower than 55
The LS has been reported as one of the heuristics that produces better results (lower deviations
from the CPM duration) by several authors However as shown in Table 17 the performance of
the LS is better and more consistent when the RF of the networks equals 025 and the RU ranges
from 025 to 050
Real construction projects have a significant amount of activities Therefore calculating the RU
and RF values for each activity can be time-consuming To overcome this issue practitioners could
rough estimate the degree of a project resource demand by randomly selecting 20 of the activities
to calculate these two resource parameters Table 23 shows the results obtained for two projects
after following this approach Although there is a slight difference in the RU rough estimate for
P2 (073) in comparison with the actual value (065) the estimated value (073) falls in the range
associated with the actual value (See Table 17)
Table 23 Rough Estimate of the RU and RF
Project
ID
No
Activities
No Type
Resources
RF RU
Rough Estimate Actual Rough Estimate Actual
1 49 3 077 075 112 105
2 73 2 077 075 073 065
As future research another heuristic that yields to more consistent results when the RF is equal to
075 and the RU ranges from 075 to 100 should be identified For this scenario the two heuristics
selected as Option 1 and Option 2 in the matrix (ES+ID and ES+TF+ID) produced the shortest
schedules only 55 of the time Heuristics with a higher consistency rate are preferred (at least
60) Similarly when the RU ranges from 050 to 075 the LS+ID (Option 2) only worked 50
of the time The same matrix should be developed but this time for networks with a RF equal to
050 and 1
Discussion
None of the heuristics produced the best results for all the 141 networks However the Enhanced
LF heuristic produced the shortest duration more frequently than any other heuristic (592) This
percentage is low but similar to some values obtained in previous studies For instance Davis
69
(1975) reported that the Min TF+ID heuristic found the shortest duration 60 of the times
followed by the LF+ID with a percentage of 46 The heuristic proposed by Boctor (1976) which
was the best among the other heuristics tested found the best solution 54 of the time Ulusoy
(1989) found that the WRUP and LF+ID obtained the best results for 75 of the time Otherwise
Boctor (1993) reported that only 30 of the times the best solution was found by a heuristic
In previous studies few authors have tested the performance of early CPM dates (ES and EF) as
major rules to sort activities The majority of them have focused on evaluating the efficacy of late
CPM dates such as the LS and LF In this study when evaluating the 141 networks (RF = 025 and
075) the ES+ID obtained the second-lowest average percentage increase over the CPM duration
(113) and produced the shortest schedules 585 of the times Moreover it was the only rule
that produced the lowest maximum percentage increase (291) and alongside the LF+ID
produced the lowest percentage increase over the CPM duration (03)
The results of this paper reinforce the statement that certain heuristics work better for certain type
of networks than for others Besides the LS+ID the Min TF+ID and the LF+ID have been reported
in the literature as the most effective heuristics minimizing the project duration (Kolish 1995
Ulusoy 1989 Davis 1975 Chen et al 2018) However in this study the performance of these
two heuristics (Min TF+ID and LF+ID) is poor in terms of the average percentage increase over
the CPM duration and the number of times producing the shortest and largest schedules (see Table
4) These opposing results emphasize the need for determining under which network and resource
characteristics heuristics produce better results A heuristic classification system will help
practitioners to decide which heuristic applies when mitigating the resource supply-demand
problem given the project characteristics
On the other hand the main parameter for sorting the activities significantly influences the
resulting schedule However if a tie exists the tiebreaker also influences the resulting schedule
Therefore schedulers should carefully select the tiebreaker of a heuristic not doing so may lead
to obtaining longer schedules if a tie exists The highest number of longest schedules was obtained
when the activity ID was considered as a tiebreaker of either the LS or LF
Future Research and Limitations
The eight existing heuristics tested in this study were selected based on the opportunity to apply
them using scheduling software However other heuristics such as the Resource Scheduling
Method (RSM) the Greatest Rank Positional Weight (GRPW) and the Weighted Resource
Utilization and Precedence (WRUP) should be tested under the same scenarios since they have
been reported in previous studies as priority rules with good performance
Additionally all heuristics were evaluated under a serial approach Given the differences between
the serial and parallel methods the heuristics should be tested under a parallel approach as well
This classification will provide practitioners the option of splittinginterrupting the work which
may be beneficial for some activities and may also reduce the project completion time
The matrix developed in this study is a point of departure for the development of a more complete
classification system for the industry The results of this study are limited to networks with I2=
70
065 RS = 025 NC = 150 and RF = 025 and 075 The classification system should be extended
so other common values of RF RS and NC can be included
Conclusion
This study proposed a new tiebreaker (Priority Number - Pn) that considers the duration and total
float of the activities The Pn enhanced the performance of the LF priority rule Lower deviations
from the CPM duration and a higher number of shortest schedules were obtained when the LF was
combined with Pn than when the LF was combined with the total float or activity ID The Enhanced
LF produced lower deviations than the LS when both heuristics did not get the same results This
study recommends using the Pn as a tiebreaker of the LF and either the duration or total float as a
tiebreaker of the LS
Overall the heuristics with good performance are LS Enhanced LF and ES The average increase
in the project duration obtained by these three rules compares favorably with the results obtained
by the other priority rules tested in this study The ES+ID and ES+TF have the potential of being
considered as one of the top heuristics since its performance is good and consistent for specific
project parameters Otherwise the Shortest Duration+ID and EF+ID heuristics are inappropriate
choices when attempting to minimize the project duration Both produced the largest deviations in
the networks for all the scenarios analyzed in this study
The heuristicsrsquo performance is more consistent (number of times producing the shortest schedules)
when the proportion of resource types required per activity is low (RF = 025) When the RF =
075 the rate of consistency is less than 60 This reinforces the fact that some rules may work
better for specific project characteristics than for others Therefore it is vital to identify under
which circumstances each one of the best heuristics produces good results
This study developed a matrix to help schedulers deciding which heuristic applies when mitigating
the resource supply-demand problem depending on the resource characteristics of a network (RF
and RU) Given the variable nature of heuristics the matrix indicates the two heuristics with better
performance for each of the scenarios considered As a best practice practitioners should perform
both heuristics and determine which one gives the best solution (shortest schedule) For real-life
purposes the decision of selecting a schedule with the shortest possible duration or an optimum
duration comes down to evaluating the viability of executing the schedule eg in terms of means
and methods or in terms of resource disruption
Data Availability Statement
Data generated by the authors can be found at Franco Duran (2019)
71
References
Abeyasinghe M C L Greenwood D J amp Johansen D E (January 01 2001) An efficient
method for scheduling construction projects with resource constraints International Journal of
Project Management DOIorg101016S0263-7863(00)00024-7
Alvarez-Valdes R and Tamarit JM (1989) Algoritmos heuristicos deterministas y aleatorios
en secuenciacion de proyectos con recursos limitados Questiio 13 173-191
Boctor F F (January 01 1993) Heuristics for scheduling projects with resource restrictions and
several resource-duration modes International Journal of Production Research 31 11 2547
DOIorg10108000207549308956882
Chen Z Demeulemeester E Bai D E amp Guo S (2018) Efficient priority rules for the
stochastic resource-constrained project scheduling problem European Journal of Operational
Research 270 3 957-967 DOIorg101016jejor201804025
Davis E W amp Patterson J H (April 01 1975) A Comparison of Heuristic and Optimum
Solutions in Resource-Constrained Project Scheduling Management Science 21 8 944-955
DOIorg101287mnsc218944
Demeulemeester E Vanhoucke M amp Herroelen W (January 01 2003) RanGen A Random
Network Generator for Activity-on-the-Node Networks Journal of Scheduling 6 1 17-38
DOIorg101023A1022283403119
Elliott A C amp Woodward W A (2007) Statistical analysis quick reference guidebook With
SPSS examples Thousand Oaks Calif Sage Publications DOIorg1041359781412985949
Gordon J H (January 01 1983) Heuristic methods in resource allocation International Journal
of Project Management 1 3 163-168 DOIorg1010160263-7863(83)90022-4
Franco Duran D Primavera P6 Schedules University Libraries Virginia
Tech DOIorg107294W4-5R6Z-D346
Kastor A amp Sirakoulis K (July 01 2009) The effectiveness of resource leveling tools for
Resource Constraint Project Scheduling Problem International Journal of Project
Management 27 5 493-500 DOIorg101016jijproman200808006
Kolisch R (1995) Project Scheduling under Resource Constraints - Efficient Heuristics for
Several Problem Classes Physical Heidelberg
Kolisch R (January 01 1996) Serial and parallel resource-constrained project scheduling
methods revisited Theory and computation European Journal of Operational Research 90 2
320-333 DOIorg1010160377-2217(95)00357-6
72
Marimuthu K Palaneeswaran E Benny R amp Ananthanarayanan K (July 15 2018) Resource
Unconstrained and Constrained Project Scheduling Problems and Practices in a Multi-project
Environment Advances in Civil Engineering 2018 DOIorg10115520189579273
Moder J J Phillips C R amp Davis E W (1983) Project Management with CPM PERT and
precedence diagramming (3rd ed ed) New York Van Nostrand Reinhold
Patterson J H (December 01 1973) Alternate methods of project scheduling with limited
resources Naval Research Logistics Quarterly 20 4 767-784
DOIorg101002nav3800200415
Patterson J H (March 01 1976) Project scheduling The effects of problem structure on heuristic
performance Naval Research Logistics Quarterly 23 1 95-123
DOIorg101002nav3800230110
Ulusoy G and Tzdamar L (1989) Heuristic performance and networkresource characteristics
in resource-constrained project scheduling Journal of the Operational Research Society 40 1145-
1152 DOIorg101057jors1989196
Zhan J (1994) Heuristics for scheduling resource-constrained projects in MPM
networks European Journal of Operational Research 76 1 192-205 DOIorg1010160377-
2217(94)90016-7
73
CHAPTER 4
Application of An Enhanced Resource-Constrained Critical Path Method (eRCPM) to
Non-progressed and Progressed Schedules
Abstract
The Resource-Constrained Critical Path Method (RCPM) is a method that identifies resource-
dependent activity relationships (links) when mitigating a resource-supply demand problem These
resource links allow the identification of a continuous critical path and the calculation of correct
float values Even though RCPM provides more reliable float values than traditional RCS
algorithms there are some shortcomings that must be addressed to enhance its capability and make
it more practical for real construction projects
This paper presents the application of an Enhanced RCPM (eRCPM) in non-progressed and
progressed resource-constrained schedules The eRCPM 1) performs three different serial-based
resource-constrained scheduling heuristics 2) keeps and removes specific resource links in a
progressed schedule before re-running eRCPM 3) selects a resource link configuration when
having many possible resource-driven activities and 4) selects a default schedule after evaluating
some schedule characteristics
Additionally an eRCPM system was developed and integrated with Primavera P6 The
development of the eRCPM computerized system allows the identification of a continuous critical
path in resource-constrained schedules in a practical way Besides construction professionals can
use these eRCPM schedules to perform delay analysis in scheduling software such as Primavera
P6
Keywords phantom float Primavera P6 resource overallocation resource-constrained
scheduling resource-depend activity relationships
Introduction
The baseline schedule is frequently used to track project performance Resources as a key
component of schedules must be also monitored to prevent or mitigate any extension on the project
completion time as a result of resource availability When the resource demand exceeds the supply
(overallocation) activities must be delayed until resources become available
Due to the projectsrsquo size and complexity schedulers use scheduling software such as Primavera
P6 or Microsoft Project to fix the resource conflicts of a schedule Even though the software solves
the overallocation problem applying Resource-Constrained Scheduling (RCS) algorithms the
results show incorrect total float values and a broken critical path This happens because
CPM+RCS calculations suggest that activities have float but this float does not exist ndash hence the
named Phantom Float (Franco-Duran and de la Garza 2019)
74
The Resource-Constrained Critical Path Method (RCPM) is a method that correctly calculates the
floats of activities and identifies a continuous critical path in resource-constrained schedules (Kim
and de la Garza 2003) The RCPM provides more reliable float values than traditional RCS
methods but there are some shortcomings that must be addressed to enhance its capability and
make it more practical for real construction projects This study tackles some of the flaws of the
RCPM which are described in the following section and illustrates the application of the
Enhanced RCPM (eRCPM) with two cases studies
RCPM Shortcomings
Priority Rules
The RCPM applies the Late Start (LS) heuristic Heuristics are problem-dependent so they are
likely to be better in some situations than in others Some priority rules may work well for a project
but may not work well when applied to a different project (Wiest 1963) Even if the Project
Completion Time (PCT) obtained by two or more heuristics is the same the sequence of the
activities may be different (Rivera and Duran 2004) Since each heuristic works differently and
produces different schedule outcomes the eRCPM incorporates 1) two additional heuristics (ES
and Enhanced LF) and 2) a criterion to evaluate the resulting schedules and selects one as a default
Removal of Resource Links
When the RCPM was developed the objective was to solve the issue of a broken critical path in a resource-
constrained schedule Hence Kim and de la Garza (2003) did not explore the application of the RCPM for
control purposes further ie the use of resource links when updating a schedule
The updates on a baseline schedule could change the priority order identified by the RCS heuristic
to schedule the activities when an over-allocation problem exists When re-applying the RCPM
the resource links identified before updating the project may no longer be required andor new
resource links can be identified because of the changes in the schedule The existing resource links
should be removed from the schedule because they were identified based on previous and different
conditions If the links are kept they constrain the schedule
In this regard the RCPM removes all existing resource links before re-running the method (Kim
and de la Garza 2003) The eRCPM removes only the resource links located right to the data date
each time a project is updated and the algorithm is re-applied The eRCPM keeps the resource
links located left to the data date because the project was already executed based on these activitiesrsquo
configurations
Selecting Resource-Driving Activities
One issue that arises when identifying activity resource relationships is having different possible
links configurations between activities (Kim 2003 Nisar 2013) This occurs when having many
current activities with many predecessors (see Figure 1) The difference between the different
schedules that can be generated is not only the number of resource links created but also the
number of critical activities
75
Figure 1 Multiple Schedule Alternatives Example taken from Nisar Yamamoto amp Suzuki (2013)
According to Nisar Yamamoto amp Suzuki (2013) the resource dependences should be created in
a way the total number of relationships is minimized without violating the resource constraints
The goal is to not increase the complexity of the network with a high number of resource links
The RCPM does not incorporate any criteria to identify resource-driving activities Instead the
algorithm creates all possible resource links configurations between the activities under
consideration (Kim and de la Garza 2003)
The eRCPM considers the number of resources and the duration of the activities as the main criteria
to determine a resource-driving activity These parameters were selected because they may affect
the PCT An activity that demands higher resources is more likely to delay a project This activity
may be delayed since other activities may need some of the resources of this activity Moreover
the longer the duration of the activity the greater the impact on the PCT
RCPM Prototype System
The RCPM prototype system developed by Kim and de la Garza in 2003 for Project Planner (P3)
does not work for Primavera P6 because P6 is built on a different platform than P3 At present
there is a lack of practical mechanisms to identify resource relationships in P6 project schedules
The eRCPM was integrated with Primavera P6 by developing a system that reads project
information from a P6 project performs the necessary eRCPM procedures and updates the P6
project with the corresponding resource relationships
Enhanced Resource-Constrained Critical Method (eRCPM)
This section explains each of the steps of the eRCPM (see Figure 1b) The eRCPM keeps the main
steps of the RCPM (see Figure 1a) but it incorporates more steps to address the above-mentioned
shortcomings
76
System Primavera Project Planner (P3) System Primavera P6
1 CPM
2 Serial-Based RCS
21 Forward Pass Heuristic
LS + D + TF + ID
211 Creating RLs
22 Finding
Unidentified RLs
23 Backward Pass
with RLs
3 Finding Alternative
Schedules
0 Removing all
Existing RLs
RCPM
Figure 1a RCPM Figure 1b Enhanced RCPM (eRCPM)
Figure 1 Outline of the RCPM and eRCPM
Step 0 KeepingRemoving Resource Links
The eRCPM checks the status of each activity to determine whether a Resource Link (RL) should
be removed from or kept on the schedule When having a progressed schedule with resource
relationships the RLs are kept in the schedule if 1) both activities (predecessor and successor) are
already completed and 2) the predecessor activity is completed and the successor activity is in
progress Otherwise the RLs are removed from the schedule if 1) the two activities (predecessor
and successor) have not started yet and 2) the predecessor activity is completed but the successor
activity has not started (see Figure 2)
Figure 2 Keeping and Removing Existing Resource Links before re-applying RCPM
77
Step 1 Critical Path Method (CPM)
The eRCPM performs the CPM to find the early and late dates and float values of each activity
If there is a resource overallocation problem the algorithm mitigates the resource-supply demand
problem by applying resource-constrained heuristics
Step 2 Serial-based RCS heuristics with Resource Links
The eRCPM performs three different heuristics to mitigate a resource supply-demand problem 1)
Late Start (LS) 2) Enhanced Late Finish (LF) and 3) Early Start (ES) These three heuristics were
incorporated into the algorithm because they produce better results in terms of extending the
project duration than other existing priority rules (Franco Duran and de la Garza 2020) The
heuristics are performed under a serial approach eg activities are sorted as a single group and
then scheduled one at a time
1 In the Late Start heuristic the priority is given to activities with the earliest values of Late
Start (LS) If there is a tie with respect to the LS the priority is given to the activity with
the least duration (D) If the tie persists the priority is given to the activity with the least
total float (TF) If the tie persists the priority is given to the activity with the smallest
activity number (ID)
2 In the Enhanced LF heuristic the priority is given to activities with the earliest values of
Late Finish (LF) If there is a tie with respect to the LF the priority is given to the activity
with the lowest Priority Number (Pn) The Priority Number which is a new tiebreaker that
can be incorporated with any rule is calculated based on the duration (119863119894) and total float
(119879119865119894) of each activity (see Equation 1) If there is a tie with respect to the Pn the tie is
broken by the smallest activity number (ID) (Franco Duran and de la Garza 2020)
119875119899 =
119863119894
119879119865119894
(Eq 1)
3 In the Earliest Start heuristic the priority is given to activities with the earliest values of
Early Start (ES) If there is a tie with respect to the ES the tie is broken by the smallest
activity number (ID)
Step 21 Forward Pass
Step 211 - Creating Resource Links During the performance of any of the three RCS heuristics
mentioned above if there are not enough resources to execute an activity the activity is delayed
until resources become available The resources causing the current activity delay are released
from other activity completion (Kim and de la Garza 2003) Like the RCPM the eRCPM creates
a resource link (relationship) between the postponed activity (successor) and the preceding activity
that shares the same resources (resource-driving activity)
Step 212 - Selecting Resource-Driving Activities The eRCPM considers three different cases to
identify the ldquoresource-driving activityrdquo for the delayed task when having multiple alternatives
78
Case I One Type of Resources
When having one type of resources the eRCPM selects as a resource-driving the activity with the
highest number of resources If there is a tie with respect to the number of resources the activity
with the longest duration is selected If the tie persists the activity with the smallest activity ID is
selected as a resource-driving activity
For example in Figure 3 Activity A7 is delayed because of resource unavailability (ten resources
would be needed but only eight are available) Either A4 or A11 can be the resource-driving
activity of A7 For this scenario the traditional RCPM creates two resource links one between A4
and A7 and another between A11 and A7 The eRCPM creates only one link between A4 and A7
because A4 requires a higher number of resources than A7 (R = 2 vs R = 1)
Figure 3 Example of Case I One Type of Resources
Case II Two Types of Resources and 1 Conflicting Resource
When having two types of resources and only one conflicting resource type the eRCPM selects
as a resource-driving activity the activity with the highest number of conflicting resources If there
is a tie with respect to the higher number of resources the activity with the longest duration is
selected If the tie persists the activity with the highest number of the other type of resource is
selected If the tie persists the activity with the smallest activity ID is selected
In Figure 4 Activity A11 was delayed because of the resource unavailability of R1 Activities A2
A4 and A10 are the potential resource-driving activities of A11 The traditional RCPM creates
three RLs one between A11and A2 another between A11 and A4 and another between A11 and
A10 The eRCPM creates only a link between A10 and A11 In this case although A10 and A4
have the same higher number of the conflicting resource (R1 = 3) and the same duration (D = 7
Days) A10 requires more resources type 2 (R2 =2) than A4 (R2 =0)
79
Figure 4 Example Case II Two Types of Resources and One Conflicting Resource
Case III 2 or more Conflict Resources
When having two or more types of resources and several conflicting resource types the eRCPM
algorithm selects as a resource-driving activity the activity with the highest average number of
conflicting resources If there is a tie with respect to the average number of conflicting resources
the activity with the longest duration is selected If the tie persists the activity with the smallest
activity ID is selected as a resource-driving
In Figure 5 Activity A11 was delayed because of the resource unavailability of R2 and R3
Activities A3 A7 and A8 are the potential resource-driving of A11 The traditional RCPM creates
three RLs one between A3 and A11 other between A7 and A11 and another between A8 and
A11 The eRCPM creates only one link between A8 and A11 In this case A8 has a higher average
number of the two conflicting resources than the other two activities
Figure 5 Example Case III Two or more Conflict Resources
80
Step 22 Finding Unidentified Resource Links
Like RCPM before performing the backward pass the eRCPM checks if non-critical activities
(non-zero total float) can fully use the float or if there is any resource constraint for the float period
(Kim and de la Garza 2003) If so an additional resource link is created between the conflicting
activities considering the three cases described above when having multiple possible resource-
driving activities
For example in Figure 7 when checking for unidentified RLs Activity A5 cannot be delayed
because otherwise an over-allocation arises with respect R2 (13 resources will be needed but only
ten are available) Activities A3 A8 and A9 are the potential resource-driving activities of A5
The traditional RCPM creates three RLs one between A5 and A3 other between A5 and A8 and
another between A5 and A9 The eRCPM creates only one link between A5 and A8 because A8
requires a higher amount of R2 than the other two activities
Figure 6 Example 1 Identification of additional Resource Links
In Figure 7 when checking for unidentified Activity A4 which has ldquoseven daysrdquo of float cannot
be delayed because otherwise an over-allocation arises with respect to R1 (11 resources will be
needed and there are only nine available) Activities A8 A9 and A11 are the potential resource-
driving activities of A4
Figure 7 Example 2 Identification of additional Resource Links
81
The traditional RCPM creates three RLs one between A4 - A8 other between A4 - A9 and another
between A4 -A11 The eRCPM creates only a link between A4 and A11 In this case although
A11 and A9 have the same higher number of resources the duration of A11 (D = 7 Days) is longer
than A9 (D = 4 Days)
Step 23 Backward Pass
Once all resource links are identified the eRCPM performs the CPM backward pass considering
both the technological and resource relationships By considering both types of relationships a
continuous critical path can be identified in a resource-constrained schedule
Step 3 Alternative Schedule
Like RCPM the eRCPM finds alternative schedules by looking for activities that can be scheduled
during a different period without breaching all the relationships
Step 4 Selecting a Schedule
Since the eRCPM performs three different RCS heuristics (LS Enhanced LF and ES) the
algorithm selects as a default schedule the one with the shortest duration If there is a tie between
the schedules with respect to the PCT the schedule with the smallest resource moment value (Mx)
is selected
The Minimum Moment (Mx) was chosen as a criterion to select a resulting resource-constrained
schedule because it is a good measure of resource utilization A lower value indicates a better
resource allocation eg a resource profile closer to a rectangular shape The moment of the daily
resource demands about the horizontal axis of a projectrsquos resource histogram (Mx) is calculated as
shown in Equation 2 (Harris 1978) Where 119910119894 represents the daily resource utilization When
having multiple types of resources in a schedule Mx is calculated for each resource profile and
then compared with the values of the other schedules The schedule with the highest number of
resource profiles with the lowest Mx is selected as a default schedule
119872119909 =
1
2sum 119910119894
2
119899
119894=1
(Eq 2)
For example the two schedules show in Figures 8a and 8b (LS-based and ES-based respectively)
have the same PCT (19 days) but different resource profiles Since the Mx of the resource profile
of the LS-based schedule is lower (1970) than the that of the ES-based schedule (200) the eRCPM
selects as default the LS-based schedule The resource profile of this schedule is closer to a
rectangular shape than that of the ES-based schedule and therefore it has better resource allocation
82
a LS-based Schedule b ES-based Schedule
Figure 8 Resource Profiles Calculation of Mx
If there is a tie with respect to the Mx the schedule with the lowest number of critical activities
(TF = 0) is selected as a default If the tie persists the schedule with the highest average of free
float is selected as a default The float values (TF and FF) were selected as parameters to select a
resource-constrained schedule because 1) having a schedule with less critical activities decrease
the probability of delaying the project completion time and 2) having a schedule with a higher
average time of free float gives more flexibility for delaying some activities without affecting the
start time of the successor activities
Finally if there is still a tie between the three resulting schedules (LS Enhanced LF and ES
based) the eRCPM selects the LS-based schedule as a default If the tie is between the Enhanced
LF and ES-based schedules the eRCPM selects as the default the Enhanced LF-based schedule
Enhanced RCPM (eRCPM) System
The eRCPM system was developed and integrated with Primavera P6 using the Primavera P6rsquos
API (Application Program Interface) The eRCPM prototype system handles smart relationships
multiple calendars holydays and exceptions multiple types of resources and progressed
schedules Specifically the system 1) exports a specific P6 project in an XML format 2) reads and
stores the project information from the XML file 3) performs the Enhanced RCPM 4) updates
the XML file by adding the identified resource relationships and 5) imports the file again into P6
Then the updated schedule appears in the userrsquos P6 database
The updated P6 schedule has already the resource relationships incorporated into the schedule
thus the user should only re-run CPM in P6 (schedule) to obtain the earlylate dates and float
values Primaverarsquos users can identify the resource links that were added to the schedule adding a
user-defined field created by the eRCPM system called ldquoRL Successorsrdquo The user-defined fields
are custom fields that P6 users can create to track specific project information The eRCPM system
also creates another user-defined field called ldquoPFrdquo which shows the phantom float each activity
had before adding the resource links into the schedule Finally if after comparing all three resulting
schedules (LS Enhanced LF and ES based) the program selects as default the LF-based schedule
83
P6 users can add another user-defined field called ldquoPNrdquo This column shows the Priority Number
used for each activity when applying the Enhanced LF heuristic
Primavera P6
API
P6 Database
User
Data Input
Export Project (XML)
Read XML File
Primavera
P6
Performs
Enhanced RCPM
Update XML FileImport XML File
Java Program
Figure 9 Enhanced RCPM System
eRCPM Application
This section presents the application of the eRCPM to a non-progressed (Case Study No1) and a
progressed (Case Study No2) resource-constrained schedule The eRCPM was performed by 1)
hand and the resulting schedules were drawn in fenced bar charts and 2) using the eRCPM System
For each case study the three schedules obtained after applying each heuristic (LS Enhanced LF
and ES) by hand and by the eRCPM system are shown and then compared to illustrate the process
the eRCPM follows to select a default schedule
Case Study No1 Non-Progressed Schedule
The case study schedule No1 consists of nine activities with only finish-to-start (FS) relationships
a seven-workday calendar with no holidays and exceptions and one type of resource (R) The
maximum availability of resource type R is six Figure 10 shows the network of the schedule and
Figure 11a the CPM fenced bar chart The CPM results indicated a project duration of 14 days
(Project Completion Time (PCT) Oct 20 2019) with activities C G and I as critical The eRCPM
was applied to mitigate the over-allocation problem occurring during days 7 to 11 (see Figure 11b)
Figure 10 Case Study No Project Network
84
Figure 11a CPM Fenced Bar Chart Figure 11b eRCPM Fenced Bar Chart (LS-based)
Figure 11 Case Study No1
Figure 11b shows the resulting LS-based schedule drawn in a fenced bar chart so the identified
RLs can be easily observed The PCT was extended by five days (from 14 days to 19 days) after
mitigating the resource supply-demand problem with the LS heuristic (PCT Oct 25 2019) The
sequence of the activities changed and thus the critical path Now activities C B A F D and H
are critical
Figure 12 shows the output of the program after performing the LS heuristic as part of the eRCPM
For each activity the program displays the duration early and late CPM dates (EST EFT LST
and LFT) total float (TF) free float (FF) and Phantom Float (PF) values The program also shows
the resource links identified during the application of the eRCPM For each activity either the
predecessors or successors (resource-driving activities) can be displayed As can be observed in
Figure 11 before adding the resource links into the schedule (C - B B - A A - F and F - D) four
activities had PF This means that based on traditional RCS calculations activities A B C and F
have float However this float does not exist because it cannot be used by activities due to resource
constraints
Figure 12 eRCPM Program Output (LS-based)
The eRCPM system creates resource links in P6 as Finish-to-Start relationships without lag (FS =
0) These new relationships can be identified in a P6 Project by adding the user-defined column
called ldquoRL Successorsrdquo This column indicates the successor resource-driving activity of the
85
activity being considered For example in Figure 13 a new link between activity A and F was
added to the schedule Activities D and E were already successors activities of activity A before
performing eRCPM (Technological Relationships) The eRCPM also creates a user-defined field
called ldquoPFrdquo to display the phantom float values of each activity before adding the resource links
into the schedule Once the user opens the file and runs the project P6 updates the early and late
CPM dates (EST EFT LST and LFT) as well as the float values (FF TF) of each activity As a
result a continuous critical path can be identified in the P6 resource-constrained schedule The
resulting values match the ones obtained by the eRCPM system (see Figures 12 and 13)
Figure 13 eRCPM Schedule in P6 (LS- based)
Figure 14 shows the resulting Enhanced LF-based schedule drawn in a fenced bar chart The PCT
was extended by five days (from 14 days to 17 days) after mitigating the resource supply-demand
problem with the Enhanced LF heuristic (PCT Oct 23 2019) Unlike the LS-based schedule only
three resource links were identified after applying the Enhanced LF heuristic and only four
activities are critical (B C G and I)
Figure 14 eRCPM Fenced Bar Chart (Enhanced LF-based)
Figure 15 shows the output of the program after performing the Enhanced LF heuristic as part of
the eRCPM Before adding the resource links into the schedule (B-C C-A and F-A) two activities
had PF (B and F)
86
Figure 15 eRCPM Program Output (Enhanced LF-based)
Figure 16 shows the updated project in P6 In addition to the two user-defined fields mentioned
before (RL Successors and PF) P6 users can add another user-defined column called ldquoPnrdquo This
column shows the Priority Number values used by the eRCPM to perform the Enhanced LF
heuristic The Pn values are only added to the P6 file when the default schedule selected by the
eRCPM system is the one obtained by this heuristic (Enhanced LF) After re-scheduling the
project the values displayed by P6 match with the ones obtained by the system and a continuous
critical path can be identified in the P6 resource-constrained schedule (see Figures 15 and 16)
Figure 16 eRCPM (Enhanced LF) P6 Schedule
Figure 17 shows the resulting ES-based schedule drawn in a fenced bar chart The PCT was
extended by five days (from 14 days to 19 days) after mitigating the resource supply-demand
problem with the ES heuristic (PCT Oct 25 2019) Even though the ES and LS-based schedules
have the same completion time (Oct 25 2019) the sequence of the activities differs and thus the
RLs and critical path In the ES-based schedule five RLs were identified and activities A B C
G and I are critical
87
Figure 17 eRCPM Fenced Bar Chart (ES-based)
Figure 18 shows the output of the program after performing the ES heuristic as part of the eRCPM
Before adding the resource links into the schedule four activities had phantom float (A B E and
F) Although this number of activities is the same as the number obtained in the LS-based schedule
the PF float values are higher in the ES-based schedule
Figure 18 eRCPM Program Output (ES-based)
Figure 19 shows the updated project in P6 After re-scheduling the project the values displayed
by P6 match the ones obtained by the eRCPM system and a continuous critical path can be
identified in the P6 resource-constrained schedule (see Figures 18 and 19)
88
Figure 19 eRCPM P6 Schedule (ES-based)
In summary the eRCPM system selects the LF-based schedule as default and updates the P6
project based on this heuristic output This schedule is selected because it has the shortest PCT
(Oct 23 2019) among the other two schedules (LS and ES-based) The LS and ES-based schedules
have the same PCT (Oct 25 2019) but due to the priority rules of each heuristic the sequence of
the activities differs and so the resource profile the RLs and the critical path
If the user wants to select a schedule among these two (LS and ES-based) the next parameter to
compare (after the project duration) is the Minimum Momentum (Mx) value of the resource profile
In this regard the Mx of the LS-based schedule is lower (197) than that of the ES-based (200)
This means the resource allocation of the LS-based schedule is better than that of the ES-based
(The resource profile is closer to a rectangular shape) So if a schedule with a finish date of Oct
25 is desired then it is advisable to select the LS-based schedule Figure 20 shows the results of
the comparison performed by the eRCPM system when selecting the default schedule
Figure 20 Summary Output of the eRCPM System
Case Study No 2 Progressed Schedule
The case study schedule No 2 consists of nine activities with two types of precedence relationships
(FS and SS) two types of resources (R1 and R2) and two different calendars Calendar 1 has
seven workdays per week and Calendar 2 has five workdays per week Both calendars have two
days of exceptions (non-working days) October 23rd and November 1st The maximum number of
resources available per day for R1 is six and R2 is seven Figure 21 shows the network of the
schedule and Figure 22a the CPM fenced bar chart
89
Figure 21 Case Study No 2 Network
The CPM results indicated a project duration of 23 days with activities A C I J and K as critical
As shown in Figure 22a there is an over-allocation problem for R1 during days 9 to 11 for R2
during days 10 to 11 The eRCPM was applied to mitigate this supply-demand problem After
applying the three heuristics the eRCPM system selected as default the LF-based schedule As
shown in Figure 22b after solving the resource overallocation problem the PCT was extended by
one day with activities B D E G H and K as critical Additionally five resource links were
incorporated in the schedule (B-D C-G E-G F-G and H-K) This schedule was used as a baseline
to update the project
Figure 22a CPM Fenced Bar Chart Figure 22b eRCPM Fenced Bar Chart (LF-based)
Figure 22 Fenced Bar Chart
The baseline schedule was updated at the end of week 1 (Oct 13 2019) Activities A B and D
have been completed and activity C is still in progress (see Figure 23) The resource link between
activities B and D was kept into the schedule because it is located left to the data date After
removing the resource links located right to the data date (C ndash G E ndash G F ndash G and H ndash K) the
CPM results indicate a project duration of 23 days with activities C I J and K as critical
Additionally there is an over-allocation problem during days 14 to 17 for R1 The eRCPM was
re-applied to mitigate the resource supply-demand problem in this progressed schedule
90
Figure 23 Fenced Bar Chart Schedule Updates
Figure 24 shows the resulting LS-based schedule drawn in a fenced bar chart The PCT was
extended by two days (from 23 days to 25 days) after mitigating the resource supply-demand
problem with the LS heuristic (PCT Oct 31 2019) The sequence of the activities changed and
thus the critical path and the RLs that were identified before the update Now activities G E F
H and K are critical
Figure 24 eRCPM Fenced Bar Chart (Late Start-based)
Figure 25 shows the output of the program after performing the LS heuristic as part of the eRCPM
Since this is a progressed schedule before re-running the method the program identifies and
displays the resources links that are kept in and removed from the schedule based on the Data Date
(DD) of the project As a reminder the RLs located left to the DD are kept in and the RLs located
right to the DD are removed from the schedule With this activity configuration the eRCPM is re-
applied and the system displays the new RLs identified during this process As can be observed in
Figure 25 before adding the RLs into the schedule (G - E G - F E - H and H - K) four activities
had PF (E F G and H) Most of the new RLs are different from the ones removed from the
schedule before re-running the eRCPM This highlights the importance of removing previous RLs
since they may constrain the schedule
91
Figure 25 eRCPM Program Output (LS-based)
Figure 26 shows the updated project in P6 After re-scheduling the project the values displayed
by P6 match the ones obtained by the eRCPM system and a continuous critical path can be
identified in the P6 resource-constrained schedule (see Figures 25 and 26)
Figure 26 eRCPM P6 Schedule (LS-based)
Figure 27 shows the resulting Enhanced LF-based schedule drawn in a fenced bar chart Like the
LS-based schedule the PCT was extended by two days (from 23 days to 25 days) after mitigating
the resource supply-demand problem with the Enhanced LF heuristic (PCT Oct 25 2019) Even
92
though the LS and LF-based schedules have the same finish date (Oct 25 2019) the sequence of
the activities differs and thus the RLs and critical path In the Enhanced LF-based schedule five
RLs were identified and activities C E H and K are critical
Figure 27 eRCPM (Enhanced Late Finish) Fenced Bar Chart
Figure 28 shows the output of the program after performing the Enhanced LF heuristic as part of
the eRCPM Before adding the resource links into the schedule five activities had PF (C E F G
and H) Since the sequence of the activities changed the RLs identified after re-applying the
eRCPM are different from the ones the schedule had before the update and which were removed
before re-running the method
Figure 28 eRCPM (Enhanced LF) Program Output
Figure 29 shows the updated project in P6 After re-scheduling the project the values displayed
by P6 match the ones obtained by the eRCPM system and a continuous critical path can be
identified in the P6 resource-constrained schedule (see Figures 28 and 29)
93
Figure 29 eRCPM (Enhanced LF) P6 Schedule
Figure 30 shows the resulting ES-based schedule drawn in a fenced bar chart The PCT was
extended by six days (from 23 days to 29 days) after mitigating the resource supply-demand
problem with the ES heuristic (PCT Nov 4 2019) In this schedule activities C E I J and K are
critical
Figure 30 eRCPM Fenced Bar Chart (Early Start-based)
Figure 31 shows the output of the program after performing the ES heuristic as part of the eRCPM
Before adding the resource links into the schedule (C - E F - G E - I H - K) five activities had
PF (C E F G and H)
94
Figure 31 eRCPM (ES Sort) Program Output
Figure 32 shows the updated project in P6 After re-scheduling the project the values displayed
by P6 match the ones obtained by the eRCPM system and a continuous critical path can be
identified in the P6 resource-constrained schedule (see Figures 31 and 32)
Figure 32 eRCPM (ES Sort) P6 Schedule
In summary the eRCPM system selects the Enhanced LF-based schedule as default and updates
the P6 project based on this heuristic output This schedule was selected by the system because
95
even though the LF and LS-based schedules have the same finish date (Oct 31 2019) the
Enhanced LF-based schedule has lower values of Mx for the two types of resources (1198721199091 = 189
1198721199092 = 645) than that of the LS-based schedule (1198721199091 = 216 1198721199092 = 665) Since this a progressed
schedule the Mx is calculated after the data date
Worthy of note after the data date the Enhanced LF-based schedule has a fewer number of critical
activities than the LS-based schedule (4 vs 5) but a higher number of RLs (5 vs 4) The Enhanced
LF-based was selected as a default because due to the sequence of the activities the resource
allocation is better than that of the LS-based schedule Figure 33 shows the results of the
comparison performed by the eRCPM system when selecting the default schedule
Figure 33 Summary Output of the eRCPM System
Future Research and Limitations
Due to the nature of each heuristic schedulers and project managers should expect to obtain
different resource-constrained schedules The eRCPM performs three different heuristics under a
serial approach - activities are sorted as a single group and then schedule one at a time The
incorporation of another well-known RCS method such as the parallel method in the algorithm
will provide schedulers more flexibility selecting the schedule that better meets the project
requirements and conditions Under the parallel approach the activity sequence is determined and
updated at the start of a specific period (Moder et al 1983)
Otherwise the three parameters defined in the eRCPM to identify resource-driving activities when
having several concurrent activities with several predecessor activities were not incorporated in
the eRCPM system So additional work should be carried out to add these criteria to the system
Additionally a dynamic scenario must be further explored when determining if the total float
values of noncritical activities can be used during the whole period (identification of additional
resource links) This scenario occurs when two or more activities are analyzed at once instead of
just one When using the available float of only one activity an overallocation problem may not
exist However if two or more activities with float are delayed at the same time an overallocation
may exist and resource links must be added to the schedule
For example in Figure 34 if activity A9 is delayed more than five days there is not an over-
allocation but if A8 is delayed more than seven days at the same time than A9 an overallocation
problem arises regarding R1 (ten resources would be needed and there are only nine available)
The scenario is the same with any possible combination of the non-critical activities (A9 A8 A11)
being scheduled in parallel on day 17 In order to determine if additional RLs should be added into
the schedule as a result of the changes made this study recommends re-applying the eRCPM each
time an activity is delayed
96
Figure 34 Dynamic scenario for identifying resource links
Conclusions
Traditional Resource-Constrained Scheduling techniques fail to provide correct float values and a
continuous critical path in resource-constrained schedules The lack of resource relationships in a
resource-constrained schedule leads to the calculation of wrong late startfinish dates and to the
creation of non-existing floats (phantom float) Therefore all activities must be considered as
influential in the project completion time
Primavera P6 a scheduling software frequently used by the construction industry is not equipped
to identify and create resource links when performing an RCS technique This paper presents the
application of an Enhanced Resource Critical Path Method (eRCPM) in non-progressed and
progressed resource-constrained schedules which was integrated with Primavera P6
The development of the eRCPM computerized system allows the removal of phantom float and
identification of a continuous critical path in P6 resource-constrained schedules The eRCPM
addresses the fact the activity sequence of a resource-constrained schedule may change after a
progress update The eRCPM system incorporates functionality to keep and remove specific
resource relationships of a progressed schedule This functionally allows the application of the
Time Impact Analysis (TIA) methodology for the evaluation of delays Since this is a
contemporaneous analysis each time a delay is inserted into the schedule specific resource
relationships will be kept removed and identified
Additionally the incorporation of three different heuristics into the eRCPM provides more
alternative and flexible schedules that could meet better project requirements Moreover the
system selects as default the schedule with a shorter duration or with better resource allocation
97
References
Franco-Duran D M amp de la Garza J M (July 01 2019) Phantom float in commercial
scheduling software Automation in Construction 103 291-299
DOIorg101016jautcon201903014
Franco-Duran D M amp de la Garza J M (November 01 2019) Review of Resource-Constrained
Scheduling Algorithms Journal of Construction Engineering and Management 145 11)
DOIorg101061(ASCE)CO1943-78620001698
Franco-Duran D M amp de la Garza J M (February 12 2020) Performance of Resource-
Constrained Scheduling Heuristics Journal of Construction Engineering and Management 146
(4) pp 1-12 DOIorg101061(ASCE)CO1943-78620001804
Harris R B 1978 Precedence and Arrow Networking Techniques for Construction Hoboken
NJ Wiley
Kim K and de la Garza J M (2003) A New Approach to Resource-Constrained Scheduling
Fourth Joint International Symposium on Information Technology in Civil Engineering November
15-16 2003 | Nashville Tennessee United States DOIorg10106140704(2003)48
Kim K and de la Garza J M (2003) Phantom Float Journal of Construction Engineering and
Management 129 5 507 DOIorg101061(ASCE)0733-9364(2003)1295(507)
KPMG (2017) Make it or Break it Remaining governance people and technology in the
construction industry Global Construction Survey 2017 Sl KPMG
Moder J J Phillips C R amp Davis E W (1983) Project Management with CPM PERT and precedence
diagramming (3rd ed ed) New York Van Nostrand Reinhold
Nisar S A Yamamoto Koshi amp Suzuki K (January 01 2013) Resource-dependent Critical
Path Method for Identifying the Critical Path and the ldquoReal Floatsrdquo in Resource-Constrained
Project Scheduling Construction and Management special Issue Construction Management
Committee Japan Society of Civil Engineers 69 4 97-107
Rivera F A amp Duran A (January 01 2004) Critical clouds and critical sets in resource-
constrained projects International Journal of Project Management 22 6 489-497
DOIorg101016jijproman200311004
Wiest J D (1964) Some Properties of Schedules for Large Projects with Limited Resources
Operation Research 12(3) 395-418 DOIorg101287opre123395
98
CONCLUSION
RCS methodologies solve the resource conflicts but create phantom float in the schedules ndash a float
that does not really exist After testing Primavera P6 versions (P6 v832 and P6 v161) the
software still creates phantom float in resource-constrained schedules because it does not apply
any algorithm to remove it The software correctly determines the activitiesrsquo earliest dates that
satisfy the resource limitations but they calculate total float based on a ldquoTime Contextrdquo (LF ndash EF
andor LS ndash ES) ignoring the presence of resource constraints Hence the floats calculated by the
software cannot be trusted or used as traditional definitions suggest ie the amount of time an
activity can be delayed without affecting the project completion time
Professionals should recognize the presence of phantom float in resource-constrained schedules
because it may lead them to make decisions based on unreliable schedules Non-critical activities
may be considered resource critical if they fail to release the resources needed by a critical activity
on time The actual float values may be shorter than calculated during RCS or may be altogether
non-existent This makes impossible the identification of the critical path and thus the anticipation
of the impact of a delaying event in the project completion time
In the last years several algorithms have been developed to identify the critical path in resource-
constrained schedules Most of the algorithms identify resource dependences but some of them
still create phantom float in a schedule because they do not identify all the necessary resource
links Some algorithms also create unnecessary resource relationships andor remove technological
relationships from the schedule Furthermore most of the algorithms do not provide a mechanism
or criterion to select a resource links configuration among multiple alternatives and neither to select
a schedule when having multiple options Finally none of the algorithms consider the dynamic
feature of resource dependences
This study tackled the flaws of the Resource Critical Path Method (RCPM) regarding the removal
of resource links selection of resource-driving activities selection of a default schedule when
having alternative schedules and the lack of a prototype system for Primavera P6
Contributions to the Body of Knowledge
This study has contributed to the body of knowledge by improving an RCS related scheduling
technique so it can be more practical for real construction projects
The Enhanced RCPM (eRCPM) addresses the fact the activity sequence of a resource-constrained
schedule may change after a progress update and the eRCPM system incorporates functionality to
keep and remove specific resource relationships of a progressed schedule This functionally allows
the application of the Time Impact Analysis (TIA) methodology for the evaluation of delays Since
this is a contemporaneous analysis each time a delay is inserted into the schedule specific resource
relationships will be kept removed and identified Additionally the incorporation of three
different heuristics into the eRCPM provides more alternative and flexible schedules that could
meet better project requirements Moreover the system selects as default the schedule with the
shortest duration or with better resource allocation Other major contributions are as follows
99
Objective No 1
Chapter 3
A new tiebreaker (Priority Number) that enhances the performance of the LF heuristic The
results show that the Priority Number as a tiebreaker of the Late Finish leads to obtain
schedules with lower deviations from the CPM duration and a higher number of shortest
schedules than with traditional tiebreakers
A classification system that indicates the two heuristics with the best performance for
specific resource network characteristics This classification will help practitioners to
decide which heuristic applies when mitigating the resource supply-demand problem given
the project characteristics
142 different schedules created in Primavera P6 v161 are available for use to evaluate and
classify the performance of Resource-Constrained Scheduling (RCS) heuristics
Objective No 2
Chapter 2
Recommendations on the RCS-related methods that can be used by industry professionals
A system to guide practitioners in the selection process of an RCS-related algorithm based
on their common features (heuristic) constraints (removal of logic links) and project
characteristics (resources and calendars)
Chapter 4
An Enhanced RCPM (eRCPM) that can be applied for delay analysis
Objective No 3
Chapter 4
An eRCPM computerized system that removes phantom float and identifies a continuous
critical path in P6 resource-constrained schedules The prototype system handles smart
relationships multiple calendars holidays ad exceptions multiple types of resources and
progressed schedules
100
Future Research
Objective No 1 (Chapter 3)
RCS Heuristics
The eight existing heuristics tested in this study were selected based on the opportunity to
apply them using scheduling software However other heuristics such as the Resource
Scheduling Method (RSM) the Greatest Rank Positional Weight (GRPW) and the
Weighted Resource Utilization and Precedence (WRUP) should be tested under the same
scenarios since they have been reported in previous studies as priority rules with good
performance
All heuristics were evaluated under a serial approach Given the differences between the
serial and parallel methods the heuristics should be tested under a parallel approach as
well This classification will provide practitioners the option of splittinginterrupting the
work which may be beneficial for some activities and may also reduce the project
completion time
The matrix developed in this study to classify heuristicsrsquo performance is a point of
departure for the development of a more complete classification system for the industry
The results of this study are limited to networks with I2= 065 RS = 025 NC = 150 and
RF = 025 and 075 Therefore the classification system should be extended so other
common values of RF RS and NC can be included
Objective No 2 (Chapter 4)
Enhanced RCPM (eRCPM)
The eRCPM performs three different heuristics under a serial approach - activities are
sorted as a single group and then scheduled one at a time The incorporation of another
well-known RCS method such as the parallel method in the algorithm will provide
schedulers more flexibility selecting the schedule that better meets the project requirements
and conditions
A dynamic scenario must be further explored when determining if the total float values of
noncritical activities can be used during the whole period (identification of additional
resource links) This scenario occurs when two or more activities are analyzed at once
instead of just one When using the available float of only one activity an overallocation
problem may not exist However if two or more activities with float are delayed at the
same time an overallocation may exist and resource links must be added to the schedule
101
Objective No 3 (Chapter 4)
Enhanced RCPM System
The three parameters defined in the eRCPM to identify resource-driving activities when
having several concurrent activities with several predecessor activities were not
incorporated in the eRCPM system Additional work should be carried out to add these
criteria to the system
102
REFERENCES
Abeyasinghe M C L Greenwood D J amp Johansen D E (2001) An efficient method for
scheduling construction projects with resource constraints International Journal of Project
Management 19(1) 29-45 DOIorg101016S0263-7863(00)00024-7
Baki M A (1998) CPM scheduling and its use in todays construction industry Project Management
Journal 29(1) 7ndash9 Retrieved from httpswwwpmiorglearninglibrarycritical-path-method-
scheduling-construction-industry-2069 (Accessed December 6 2018)
Bowers J A (1995) Criticality in Resource-Constrained Networks Journal of the Operational
Research Soc 46 80-91 DOIorg101057jors19959
Braimah N (2013) Construction Delay Analysis TechniquesmdashA Review of Application Issues
and Improvement Needs Buildings 3 506-531 DOI103390buildings3030506
Davis E W amp Patterson J H (April 01 1975) A Comparison of Heuristic and Optimum Solutions in
Resource-Constrained Project Scheduling Management Science 21 8 944-955
de la Garza J M and Franco-Duran D M (2017 December 20) CPM Benefits in Estimating Bidding
Reported in Survey (B Buckley Ed) Retrieved from Engineering News-Record
httpswwwenrcomarticles43666-cpm-benefits-in-estimating-bidding-reported-in-survey (Accessed December 6 2018)
Fondahl J W (1991) The Development of the Construction Engineer Past Progress and Future
Problems Journal of Construction Engineering and Management 117(3) 380-392
DOIorg101061(ASCE)0733-9364(1991)1173(380)
Franco-Duran D M amp de la Garza J M (July 01 2019) Phantom float in commercial
scheduling software Automation in Construction 103 291-299
DOIorg101016jautcon201903014
Franco-Duran D Primavera P6 Schedules University Libraries Virginia
Tech DOIorg107294W4-5R6Z-D346
Franco-Duran D M amp de la Garza J M (November 01 2019) Review of Resource-Constrained
Scheduling Algorithms Journal of Construction Engineering and Management 145 11)
DOIorg101061(ASCE)CO1943-78620001698
Franco-Duran D M amp de la Garza J M (February 12 2020) Performance of Resource-
Constrained Scheduling Heuristics Journal of Construction Engineering and Management 146
(4) pp 1-12 DOIorg101061(ASCE)CO1943-78620001804
Ibbs W amp Nguyen L D (2007) Schedule Analysis under the Effect of Resource
Allocation Journal of Construction Engineering and Management 133 2 131-138
DOIorg101061(ASCE)0733-9364(2007)1332(131)
103
Kastor A amp Sirakoulis K (2009) The effectiveness of resource leveling tools for Resource
Constraint Project Scheduling Problem International Journal of Project Management 27(5)
493-500 DOIorg101016jijproman200808006
Kim K amp de la Garza J M (2003) Phantom Float Journal of Construction Engineering and
Management 129 (5) 507-517 DOIorg101061(ASCE)0733-9364(2003)1295(507)
Lu M amp Li H (2003) Resource-Activity Critical-Path Method for Construction Planning
Journal of Construction Engineering and Management 129(4) 412-420
DOIorg101061(ASCE)0733-9364(2003)1294(412)
Nisar S A Yamamoto Koshi amp Suzuki K (2013) Resource-Dependent Critical Path Method
for Identifying the Critical Path and the ldquoReal Floatsrdquo in Resource-Constrained Project
Scheduling Journal of Japan Society of Civil Engineers 69(4) 97-107
DOIorg102208jscejcm69I_97
Pantouvakis JP amp Manoliadis OG (2006) A practical approach to resource-constrained project
scheduling Operational Research An International Journal 6(3) 299-309
DOIorg101007BF02941258
Raz T amp Marshall B (1996) Effect of resource constraints on float calculations in project
networks International Journal of Project Management 14(4) 241-248 DOIorg1010160263-
7863(95)00090-9
Rivera F A amp Duran A (2004) Critical clouds and critical sets in resource-constrained
projects International Journal of Project Management 22(6) 489-497
DOIorg101016jijproman200311004
Ulusoy G and Ozdamar L (1989) Heuristic performance and networkresource characteristics
in resource-constrained project scheduling Journal of the Operational Research Society 40
1145-1152 DOIorg101057jors1989196
Wiest J D (1964) Some Properties of Schedules for Large Projects with Limited Resources
Operation Research 12(3) 395-418 DOIorg101287opre123395
Woodworth B M and Shanahan S (1988) Identifying the critical sequence in a resource-
constrained project International Journal of Project Management 6(2) 89-96
DOIorg1010160263-7863(88)90030-0
An Enhanced RCS Heuristic and an Enhanced RCPM Algorithm to Perform Delay
Analysis in Schedules without Phantom Float
Diana Marcela Franco Duran
ACADEMIC ABSTRACT
On a regular basis project managers concentrate their efforts on critical and near-critical
activities However the concepts of total float and critical path lose their significance after
applying resource-constrained scheduling (RCS) methodologies RCS techniques solve the
resource conflicts but create phantom float in the schedules (ie a float that does not exist)
RCS techniques overlook the resources relationships between activities that compete for the
same but unavailable resources Therefore each time an activity uses this apparent float
(phantom float) there is a resource violation in the schedule
Due to the projectsrsquo size and complexity schedulers use scheduling software such as Primavera
P6 to fix the resource conflicts of a schedule The software correctly determines the activitiesrsquo
earliest dates that satisfy the resource limitations but they calculate total float based on a ldquoTime
Contextrdquo ignoring the presence of resource constraints Thus the results show incorrect total
float values and a broken critical path The lack of a continuous critical path makes impossible
the anticipation of the impact of a delaying event in the project completion time
Several algorithms have been developed to address the shortcomings of RCS methods These
RCS related algorithms were developed with the aim of providing project managers a tool to
correctly schedule and identify critical activities with respect to time and resource allocation
and correctly calculate the total float of each activity under resource constraints In this regard
the Resource-Constrained Critical Path Method (RCPM) is an algorithm that correctly
calculates the floats of activities and identifies a continuous critical path in resource-
constrained schedules
Regardless of the RCPM provides more reliable float values than traditional RCS-related
algorithms there are some shortcomings that must be addressed to enhance its capability This
study addresses the existing shortcomings of RCPM to make it more practical for real
construction projects
An Enhanced RCS Heuristic and an Enhanced RCPM Algorithm to Perform Delay
Analysis in Schedules without Phantom Float
Diana Marcela Franco Duran
GENERAL AUDIENCE ABSTRACT
One of the challenges of resource allocation is resource availability because oftentimes the
resource demand exceeds the supply When resources are over-allocated activities are delayed
until resources become available
Due to the projectsrsquo size and complexity schedulers use available software to solve the
resource conflicts of a schedule After testing Primavera P6 versions and MS Project v2016
both software create phantom float in a resource-constrained schedule This is the RCS
calculations suggest that activities have float but this float might not exist at all
Resource-Constrained Scheduling (RCS) techniques mitigate a resource supply-demand
problem but fail to identify a project critical path The methods do not consider the resource-
activity dependencies that arise when activities are delayed due to resource limits As a result
the critical path is broken and all the activities must be considered as critical
To provide correct float values and a continuous critical path the Resource-Constrained
Critical Path (RCPM) was introduced by Kim and de la Garza in 2003 Regardless of the
RCPM provides more reliable float values than traditional RCS-related algorithms there are
some shortcomings that must be addressed to enhance its capability This study addresses the
existing shortcomings of RCPM to make it more practical for real construction projects
iv
To God
Thanks for being my rock
my fortress and my shield
on this journey
v
ACKNOWLEDGMENTS
There are many who helped me along the way on this journey I want to take a moment to
thank them
First I would like to express my deepest gratitude to my advisor Dr Jesuacutes de la Garza
Thank you for believing in me before I believed in myself Thank you for giving me the
opportunity to make one of my dreams come true ldquoGraciasrdquo Your support and guidance
were essential to achieve this important milestone in my life Now I look back and I cry
for the same two reasons you mentioned on day one Thank you for your PATIENCE
valuable advice and encouragement Thank you for all the lessons stories and laughs (I
already miss our weekly meetings in 117 Patton Hall) Thank you for helping me to
navigate towards a successful career Thank you for pushing myself so I could reach my
full potential You will ALWAYS BE part of an important chapter of my life
I would also like to thank the members of my committee Dr Michael Garvin Dr
Farrokh Jazizadeh and Dr Subhash Sarin Thank you for your time comments and
constructive feedback throughout this process Your valuable insights were essential for
the successful development of my research work
I would also like to thank my family for supporting me throughout these years To my best
friend Freddie Salado I enjoyed every single moment I shared with you Thanks to you
I proved that friends become family when you are far away from home
Finally but not least to my fellow for life David I am forever grateful for your patience
and understanding Your love helped me to finish strong It is time to celebrate you earned
this degree right along with me
vi
TABLE OF CONTENTS
Page
INTRODUCTION1
CHAPTER 1 Phantom Float in Commercial Scheduling Software
Abstract 2
Introduction 2
Background 4
Methodology 7
Results 8
Discussion 14
Conclusion 15
References 16
CHAPTER 2 Review of Resource-Constrained Scheduling Algorithms
Abstract 19
Introduction 19
Methodology 21
Algorithms Review 23
Shortcomings of Existing RCS Related Algorithms 40
Discussion 42
Conclusion 44
References 45
CHAPTER 3 Performance of Resource-Constrained Scheduling Heuristics
Abstract 49
Introduction 49
Theoretical Background 50
Newly Developed Tiebreaker Priority Number (Pn) 52
Methodology 53
vii
Results 58
Discussion 68
Conclusion 70
References 71
CHAPTER 4 Application of An Enhanced Resource-Constrained Critical Path
Method (eRCPM) to Non-progressed and Progressed Schedules
Abstract 73
Introduction 73
RCPM Shortcomings 74
Enhanced Resource-Constrained Critical Method (eRCPM)75
Enhanced RCPM (eRCPM) System 82
eRCPM Application 83
Case Study No1 Non-Progressed Schedule 83
Case Study No 2 Progressed Schedule 88
Future Research and Limitations95
Conclusions 96
References 97
CONCLUSION 98
Contributions to the Body of Knowledge 98
Future Research 100
REFERENCES 102
1
INTRODUCTION
This study 1) developed an Enhanced Late Finish (LF) heuristic for scheduling activities
under resource constraints in which the project duration compares favorably with the
results of other existing heuristics under specific scenarios (Objective 1) 2) enhanced the
Resource-Constrained Critical Path Method (eRCPM) (Objective 2) and 3) developed an
eRCPM computerized system (Objective 3)
To meet these objectives this study first illustrated in Chapter 1 the presence of phantom
float in Primaverarsquos P6 v161 and Microsoftrsquos Project v2016 schedules This section
highlights the need of incorporating an algorithm that correctly identifies a critical path in
resource-constrained schedules and that users of P6 and MS Project should recognize that
the calculation of total float by the software relies on a time-based context ignoring the
presence of resource constraints
Then this study reviewed existing RCS related algorithms with the purpose of identifying
the shortcomings that must be addressed so they can be applied for delay analysis In this
regard Chapter 2 shows the performance of eight RCS-related algorithms discusses
potential solutions to the identified shortcomings provides recommendations on the
algorithms that can be used by industry professionals and proposes a system to facilitate
the selection of an algorithm based on their common features constraints and project
characteristics
Subsequently to achieve Objective 1 this study first analyzed the influence of different
tiebreakers that are usually incorporated in RCS heuristics In this regard Chapter 3
describes a new tiebreaker (Priority Number - PN) which improves the performance of the
Late Finish heuristic Additionally this section shows the performance of the Enhanced LF
heuristic compared to the other eight existing RCS heuristics and describes a heuristicsrsquo
performance classification system to help schedulers deciding which heuristic applies
when mitigating the resource supply-demand problem
Finally to achieve Objective No2 and Objective No 3 this study addressed the following
flaws of the existing RCPM number of RCS heuristics removal of resource links in
progressed schedules identification of resource-driving activities selection of a default
schedule and lack of a computerized system In this regard Chapter 4 describes the
Enhanced RCPM (eRCPM) and shows its application in non-progressed and progressed
resource-constrained schedules throughout the prototype system of the algorithm that was
developed and integrated with Primavera P6
Finally the main contributions to the body of knowledge and limitations of this study as
well as future research can be found in the conclusions section
2
CHAPTER 1
Phantom Float in Commercial Scheduling Software1
Abstract
On a regular basis construction professionals use scheduling software to resource load the
schedules without paying attention to the resulting critical path Current scheduling
software fix the resource supply-demand problem by performing a Resource-Constrained
Scheduling (RCS) technique but they report incorrect total float values and a broken
critical path
RCS calculations suggest that activities have float but much of this float does not exist
(phantom float) Phantom float is created in resource-constrained schedules because the
existing RCS methodologies neglect the resource relationships that arise between activities
when competing for the same but unavailable resources This paper illustrates the presence
of phantom float in Primaverarsquos P6 and Microsoftrsquos Project schedules After removing
phantom float from the schedule non-critical activities may become resource critical and
the actual float may be shorter than calculated or may be altogether non-existent
Users of P6 and MS Project should recognize that the calculation of total float by the
software relies on a time-based context (LF ndash EF andor LS ndash ES) ignoring the presence
of resource constraints Therefore the float reported cannot be trusted or used to mitigate
delaying events like the traditional time-based context definition of total float suggests
Currently research is being carried out in order to remove phantom float from P6 and
Microsoft Project schedules
Keywords Phantom Float Resource-Constrained Schedules Scheduling Software
Introduction
Since its emergence in the late 1950s the Critical Path Method (CPM) has been widely
applied in the construction industry The results of the four surveys taken by the
Engineering New-Recordrsquos (ENR) Top 400 contractors in 1970 1987 2003 and 2017
show that on average 93 of the contractors responding apply CPM on their projects
(Davis 1974 Tavakoli and Riachi 1990 Kelleher 2004 de la Garza and Franco-Duran
2017) CPM is considered a useful tool to plan and to coordinate project work (Baki 1998
Liberatore Pollack-Johnson Smith 2001) The results of a survey taken by 240 project
management professionals of the Project Management Institute (PMI) in 2001 show that
89 of the construction responders use CPM for project planning and 72 for project
control (Liberatore Pollack-Johnson and Smith 2001)
1 Franco-Duran D M amp de la Garza J M (July 01 2019) Phantom float in commercial scheduling
software Automation in Construction 103 291-299 DOIorg101016jautcon201903014
3
Professionals are heavy users of the Critical Path Method to schedule and control projects
Nevertheless CPM neglects the resource project allocations and constraints which is a
common feature among most of construction and engineering projects (Wiest 1964
Woodworth and Shanahan 1988 Lu and Li 2003 Pantouvakis and Manoliadis 2006
Kastor and Sirakoulis 2009) Most projects have a limited amount of resources available
that usually are shared by several activities Because oftentimes resource demands exceed
the maximum number of resources available several Resource-Constrained Scheduling
(RCS) techniques have been introduced to mitigate the resource supply-demand problem
(Woodworth and Shanahan 1988 Lu and Li 2003 Pantouvakis and Manoliadis 2006)
Despite RCS techniques do help project managers to solve the resource conflicts in project
schedules RCS usage in the industry has been quite moderate The two surveys taken by
the ENRrsquos Top 400 Contractors in 1987 and 2003 show that only 16 and 35
respectively of the responders use RCS techniques as advanced methodologies in their
projects (Tavakoli and Riachi 1990 Kelleher 2004) In 2001 Liberatore Pollack-
Johnson and Smith (2001) reported that over 50 of construction professionals use RCS
techniques for project planning and about 44 of the responders use RCS techniques for
project control
Project Management Software (PMS) which incorporate CPM and RCS methods has
become an essential tool for planning and control projects However at present the use of
scheduling software in the construction industry has not been systematically reported The
few studies found in the literature agree that Primaveratrade is the most frequently used
software for construction professionals followed by Microsoft (MS) Projecttrade (Liberatore
Pollack-Johnson and Smith 2001 Galloway 2006) The Liberatore surveyrsquos results show
that 51 of the construction responders use Primavera and 24 of them use Microsoft
Project (Liberatore Pollack-Johnson and Smith 2001) Additionally the results of the
ENRrsquos Top 400 Contractors survey in 2003 show that 78 of the responders use Primavera
and 35 use Microsoft Project (Kelleher 2004) In 2005 an online survey sent to 430
stakeholders involved in construction indicates that Primavera was the specified software
for their projects From an owner and contractor perspective on average over 60 used
Primavera and only 20 Microsoft Project (Galloway 2006)
Although Primavera P6 and MS Project fix the resource supply-demand problem by
performing specific RCS methods these techniques create phantom float in each
softwarersquos schedule RCS techniques overlook the resources relationships between
activities that compete for the same but unavailable resources RCS calculations suggest
that activities have float but much of this float does not exist hence the name of phantom
float (Kim and de la Garza 2003) The aim of this paper is to illustrate the presence of
phantom float in Primaverarsquos P6 v161 and Microsoftrsquos Project v2016 schedules
4
Background
Resource-Constrained Scheduling (RCS)
In resource-constrained schedules when resources are not available to complete a specific
task selected activities are delayed until the completion of the more crucial tasks that
employ the same type of resources (Boyle 2016) This process is governed by two steps
The first step is to set activity priorities according to specific rules The second is to
schedule activities in the order determined subject to logic precedence and resource
availability The criterion to assign activity priorities depends on the heuristic chosen to
solve the resource conflicts
Two of the most well-known methods employed in RCS are the serial method and the
parallel method The serial method sorts all activities as a single group and then schedules
one activity at a time If there are insufficient resources to start an activity the activity is
delayed until resources become available (Moder Phillips and Davis 1983) The primary
heuristic or priority rule to schedule activities is the Late Start Time (LS) Activities with
an early LS are scheduled first In cases when there is a tie with respect to the LS the higher
priority is given to the activity with the shorter duration and total float respectively If the
tie persists then the activity with the smaller number ID is selected (Kim and de la Garza
2003)
The parallel method selects a group of activities whose predecessors were already all
scheduled Activities are eligible to be scheduled if the activity Early Start Time (ES) is
less than or equal to the period of analysis Then from this Eligible Activity Set (EAS)
activities are scheduled based on the total float values (Kastor and Sirakoulis 2009)
Higher priority is given to the activity with the shorter total float If there is a tie with
respect to the total float the activity with the shorter duration is selected to be scheduled
If there are not enough resources to start an activity activities with lower priority are then
examined If the ES of an activity is delayed due to resource unavailability the ES must be
increased to the following period and a new rank for the EAS is defined (Moder Phillips
and Davis 1983) This process should be repeated until all activities are scheduled
Each commercial scheduling software uses a specific RCS method For instance Primavera
P6 applies the serial method and MS Project the parallel method Therefore schedulers and
project managers can expect to obtain different resource-constrained schedules with each
software RCS methods provide good but not optimal solutions (Wiest 1964 Lu and Li
2003 Pantouvakis and Manoliadis 2006) As a rule-based some heuristics may perform
better for some project schedules than for others (Moder Phillips and Davis 1983)
Phantom Float
RCS techniques mitigate the resource-supply problem but they fail to identify the correct
project critical path (Woodworth and Shanahan 1988 Bowers 1995) RCS methodologies
do not consider the resource dependencies that arise when activities are delayed due to
resource unavailability (Woodworth and Shanahan 1988 Kim and de la Garza 2005
5
Boyle 2016) The RCS calculations suggest that activities have float but this float might
not exist at all (Fondahl 1991) Kim and de la Garza (2003) labeled this float as phantom
float Hence the critical path is broken and all the activities must be considered critical
(Kim 2003) This weakness was first noticed by Fondahl (1991) In his study Fondahl
(1991) states that in a resource-constrained schedule the concepts of total float and critical
path are no longer satisfied Non-critical activities may be considered resource critical if
they fail to release the resources needed by a critical activity on time (Fondahl 1991 Lu
and Li (2003)
To provide correct float values and a continuous critical path some authors modified
existing RCS methods andor developed new methods These enhanced algorithms
consider not only the technological relationships but also the resource relationships
between activities in the schedule (Kim and de la Garza 2003 Kim and de la Garza 2005)
Once the resource relationships or Resources Links (RLs) are added to the schedule and
the backward pass is performed a continuous critical path can be obtained The priority
rules to schedule activities differ between each method as well as the process of identifying
the RLs Therefore different resource-constrained schedules with no phantom float can be
obtained when applying any of the methodologies described below
The algorithm proposed by Woodworth and Shanahan (1988) which is based on the
parallel method identifies the critical path of a resource-constrained schedule by creating
resource links (RLs) In this method during the forward pass a label is given to each
activity with the purpose of recording the resource being used and the usage order in a
resource pool The activities that have used the resource are also recorded During the
backward pass a search is made in the pool to find the immediate predecessor of the current
activity by considering the logical and resource dependencies If the Early Start (ES) of the
predecessor activity and the Early Finish (EF) of the current activity are equal and
activities are not technologically connected a Resource Link (RL) is created ((Woodworth
and Shanahan 1988 Kim and de la Garza 2005)
Like Woodworth and Shanahan (1988) Bowers (1995) proposed an algorithm based on
the parallel method that identifies the critical path of a resource-constrained schedule In
this case the RLs are identified during the forward pass by considering the resource usage
of each activity Bowers (1995) The RLs are checked and validated by examining the
history of resource availability during the backward pass Nonetheless as mentioned by
Kim and de la Garza (2005) Bowers (1995) did not provide detailed information about
how the RLs should be created
Kim and de la Garza (2003) developed the Resource-Constrained Critical Path (RCPM) to
provide a more realistic resource-constrained schedule by eliminating phantom float The
algorithm which is based on the serial method consists of five steps as shown in Figure 1
The first step is to perform CPM Then while the serial method is performed in the second
step RLs are identified and added to the schedule if an activity is delayed due to a resource
limit In the third step the backward pass is performed considering both the technological
and resource relationships that were identified during the forward pass The next step
determines if the total float of the noncritical activities can be used during the whole period
6
(ie if there is still phantom float) If the float cannot be used the corresponding RLs are
added to the schedule After this procedure the final schedule is obtained As a final step
the algorithm identifies alternative schedules looking for activities that can be scheduled
during another period without breaching all the relationships (Kim and de la Garza 2003
Kim and de la Garza 2005)
Figure 1 RCPM steps
While the RCPM algorithm was introduced by Kim and de la Garza (2005) Lu and Li
(2003) developed the Resource-Activity Critical-Path Method (RACPM) as a serial
heuristic method for resource-constrained scheduling The work content which is the
relative weight of each activity with respect to the time and resource usage is the primary
criterion to select an activity when activities are competing for constrained resources
Limited resources are first assigned to activities with higher work content since these
activities may affect the project completion time
If there is a tie with respect to the work content the activity with a larger number of
resources or longer duration is scheduled first (Lu and Li 2003) If an activity needs
various quantities of the same type of resource the priority is given to the resource that is
available to perform the activity at that time (Ready-to-Serve Time ndashRST) The RST is the
time when resources are ready to work If there is a tie with respect to RST resources are
randomly chosen The activity that first uses the same resource unit of the current or
predecessor activity is considered as a resource-constrained successor activity (Kim and de
la Garza 2003) Lu and Lirsquos method creates redundant RLs because the links are identified
based on the resource requirements and work content neglecting the technological
relationships of the original CPM (Lu and Li 2003 Kim and de la Garza 2005)
Scheduling Software
In 2003 Kim and de la Garza reported that when resource demands exceed the supply and
users of Primavera Project Plannertrade (known as P3) performed RCS three things
happened 1) P3 fixed the resource supply-demand problem 2) P3 broke the Critical Path
and 3) P3 reported incorrect total float values because phantom float was created when
RCS was performed In order to fix these issues Kim and de la Garza [15] developed an
application that incorporates the RCPM The system reads project information directly
from a P3 project performs RCPM and then updates the P3 schedule The RCPM
application removes phantom float from P3 schedules but it does not remove phantom
float from P6 schedules because P6 is built on a different platform than P3
Over the last few years Boyle Project Consulting (BPC) and Ron Winter Consulting LLC
have developed their own software to overcome the weakness of current software when
7
dealing with resource-constrained schedules These two developments fix the RCS
techniquesrsquo shortcomings by identifying resource relationships of P6 and MS Project
schedules respectively However the programs do not apply an algorithm to systematically
identify and to add the RLs in the schedule They search the activities that were postponed
by the RCS method and create a relationship between the delayed task and the activities
that caused the delay This process does not identify all the RLs of the schedule
After testing Primavera P6 versions (P6 v832 and P6 v161) and MS Project v2016 both
software still creates phantom float in a resource-constrained schedule because they do not
apply any algorithm to remove phantom float This paper illustrates the presence of
phantom float in Primaverarsquos P6 v161 and MS Projectrsquos v2016 schedules
Methodology
Case of Study
To illustrate the presence of phantom float in Primaverarsquos P6 and MS Projectrsquos schedules
a warehouse project was used as a case of study (Fondahl 1991) The project consists of
31 activities with finish-to-start relationships and three types of resources carpenters (R1)
ironworkers (R2) and unskilled labor (R3) The maximum number of resources available
for each type of resource is four The activity calendar reflects a seven-day workweek The
project schedule was built on Primavera P6 v161 and MS Project v2016
Research Approach
The RCPM system developed by Kim and de la Garza (2005) was used to remove phantom
float from the P6 v161 schedule Since this RCPM application only reads and updates data
from a P3 file several steps were carried out to convert the P6 v161 file to a P3 format
(see Figure 2) Because a P6 v161 file cannot be directly exported to P3 this study also
used P6 v832 as an intermediary This process is very impractical since the user should
have installed P3 v31 and P6 v832 on a computer with an XP operating system (which is
no longer supported by Microsoft) However this approach was followed because the
RCPM system to remove phantom float from P6 andor MS Project schedules is still under
development
The warehouse project schedule was first created in P6 v161 and CPM and RCS were
performed This file was exported to P6 v832 and thereafter exported to P3 v31 With the
schedule in P3 the RCPM system identified the RLs removed phantom float and updated
the P3 schedule This schedule without phantom float was uploaded into P6 v161 by
performing the same process but in reverse (see Figure 2)
8
Figure 2 Process to remove phantom float on P6 v161 schedule
The RCPM system developed by Kim and de la Garza does not work for MS Project
Therefore phantom float was removed from this software schedule performing RCPM by
hand The RLs were identified while the forward pass of the parallel method was performed
and each of the non-critical activities was checked afterward to identify additional RLs
The resource relationships were added to the MS Project schedule manually to obtain the
real total float values and the correct critical path
Results
CPM and RCS in P6 v161
Once CPM was performed in P6 the project duration was 27 days An over-allocation
problem was identified for R1 during days 5 ndash 8 and 22 Since R1 exceeds the maximum
number of resources available (4) the serial method was performed in P6 to overcome this
supply-demand problem P6 allows the user to select several and different priority rules to
perform the serial method For this case of study the Late Start heuristic was selected
Figure 3 shows the project CPM schedule in P6 v161
Figure 3 CPM schedule in P6 v161
Figure 4 shows the schedule after the serial method was performed in P6 The project
duration was increased by three days from 27 days to 30 days Although the
supplydemand problem was fixed the critical path reported in Figure 4 as well as the total
float values are incorrect The critical path is broken because RCS techniques do not track
the activities that were shifted due to a resource limitation It can be seen in Figure 4 that
9
only the last two activities are critical according to P6 v161 The remaining activities are
labeled as non-critical with phantom float
Figure 4 RCS schedule in P6 v161
CPM and RCS in MS Project v2016
Once CPM was performed in MS Project v2016 the project duration was 27 days There
is also an over-allocation problem for R1 during days 5 ndash 8 and 22 Figure 5 shows the
project CPM schedule in MS Project Figure 6 shows the schedule after the parallel method
was performed in MS Project The project duration was also increased by three days from
27 to 30 days Like P6 the supplydemand problem was fixed but the critical path reported
in Figure 6 as well as the total float values are incorrect It can be seen in Figure 6 that
only five activities are critical and the remaining activities are labeled as non-critical with
phantom float
Figure 5 CPM schedule in MS Project v2016
Several activities in MS Project start later than those in P6 because the priority rules to
schedule activities applied by the serial and parallel methods differ (Table 1) MS Project
delayed activities with a greater total float As a result some activities are critical in MS
Project and not in P6
10
Figure 6 RCS schedule in MS Project v2016
Table 1 Activities start time in MS Project and P6 v161 after RCS was performed
Activities
Start Time
MS Project
Parallel
Method
P6 v161
Serial
Method
A4 Day 15 Day 9
A7 Day 20 Day 19
A8 Day 17 Day 16
A20 Day 16 Day 15
A22 Day 18 Day 16
A24 Day 22 Day 19
A27 Day 24 Day 21
Phantom Float
The following example gives an idea of what phantom float means Assume that Activity
A4 requires two carpenters to be executed and Activity A5 four carpenters (max = 4)
According to RCS results in P6 A4 has 14 days of float which means that A4 can be
delayed 14 days without affecting the project completion time (Figure 7a) However each
time that the ldquoapparently available floatrdquo of the A4 is used (activity was delayed by one
day) there is an over-allocation problem because this is not the real float of A4 (Figure
7b) In this case a link should be created between A4 and A5 (Figure 7c) The carpenters
will only be available to perform A5 once A4 is completed Otherwise six carpenters
would be needed to perform A4 and A5 in parallel and only four of them are available for
this project After performing the backward pass with the RLs added to the schedule it
turns out that instead of having 14 days of float the total float of A4 is zero
11
Figure 7 Example of phantom float and identification of resource links
Phantom Float in P6 v161
Fig 8 shows the presence of phantom float in P6 v161 According to the RCS output
Activity A4 has 13 days of float In theory project managers should be able to use this
float whenever they need it Nevertheless once the float of this activity is used (A4 was
delayed one day) there is an over-allocation problem again If the whole float of Activity
A4 is used in P6 each time the resource demands exceed the maximum number of
resources available This over-allocation arises because there is phantom float in the P6
schedule
Figure 8 Presence of phantom float in P6 v161
Phantom Float in MS Project v2016
Fig9 shows the presence of phantom float in MS Project v2016 According to the RCS
output Activity A4 has one day of float Like P6 once the float of Activity A4 is used in
MS Project there is a demand-supply problem This over-allocation arises because there is
phantom float in the MS Project schedule
12
Figure 9 Presence of phantom float in MS Project v2016
The schedule with no phantom float for each software is shown in Figure10 (P6 v161) and
Figure11 (MS Project v2016) After removing phantom float the resources are still
consistent with availability the float values are correct as well as the critical path
Figure 10 P6 v161 schedule with phantom float removed
Figure 11 MS Project schedule with phantom float removed
13
Table 2 shows a comparison of the P6 v161 and MS Project v2016 schedules after RCPM
was performed About 87 and 84 of the activities in the P6 v161 and MS Project v2016
schedules had phantom float after RCS Most of the non-critical activities became resource
critical in both schedules
The presence of phantom float in resource-constrained schedules makes impossible the
identification of a continuous critical path The critical path is lost when activities are
delayed due to resource unavailability (Wiest 1964) As a result all activities should be
assumed as critical and as influential of the project completion time (Lu and Li 2003)
Additionally the impact of a delaying event in the project duration cannot be anticipated
in schedules with phantom float Any reduction or increase in an activity duration cannot
be noticed since the critical path is broken Hence phantom float may lead to untrustworthy
results when performing delay analysis The parties involved may not be totally responsible
for the apportioned delays (Ibbs and Nguyen 2007)
Table 2 Comparison of P6 v161 and MS Project v2016 schedules after removing
phantom float
Software RCS
Method
Duration
(Days)
No Critical
Activities
before
removing PF
No
Activities
with PF
No RL
Created
No Critical
Activities
after
removing
PF
P6 v161 Serial 30 2 27 13 21
MS
Project
v2016
Parallel 30 5 26 11 25
Table 3 shows the float values obtained after removing phantom float from the P6 v161
and MS Project v2016 schedules Depending on the RCS method used to mitigate the
resource supply-problem when performing the RCPM different outcomes can be obtained
for the same project The activities sequence differs in both schedules and so the RLs and
the phantom float values
Table 3 RCPM output for the P6 v2016 and MS v2016 project schedules
Primavera P6 v161 Microsoft Project v2016
After
RCS
After
RCPM
Phantom
Float
Resource
Links
After
RCS
After
RCPM
Phantom
Float
Resource
Links
01 3 0 3 - 0 0 0 -
02 3 0 3 - 0 0 0 -
03 2 0 2 29 2 0 2 29
04 14 0 14 05 6 0 6 08
05 8 0 8 - 3 0 3 -
06 3 0 3 - 3 0 3 -
07 6 1 5 23 5 0 5 23
14
08 6 1 5 0724 5 0 5 07 24
09 3 0 3 04 3 0 3 -
10 8 5 3 - 8 5 3 -
11 3 0 3 - 3 0 3 -
12 3 0 3 05 3 0 3 05
13 3 0 3 - 3 0 3 -
14 5 0 5 - 3 0 3 -
15 3 0 3 - 3 0 3 -
16 8 0 8 17 8 0 8 -
17 3 0 3 - 3 0 3 -
18 8 2 6 08 8 0 8 04 19
19 3 0 3 08 3 0 3 -
20 8 3 5 - 6 1 5 -
21 3 0 3 - 3 0 3 -
22 8 3 5 - 6 1 5 -
23 3 0 3 - 3 0 3 -
24 6 1 5 23 5 0 5 23
25 3 0 3 03 3 0 3 03
26 3 3 0 - 3 3 3 -
27 6 5 1 - 5 4 1 -
28 3 3 0 - 3 3 0 -
29 1 0 1 30 1 0 1 30
30 0 0 0 - 0 0 0 -
31 0 0 0 - 0 0 0 - Successor Activities
Discussion
In time-constrained scheduling unlimited resources are assumed Under this scenario the
traditional definition of total float is valid ie the amount of time an activity can be
delayed without affecting the project completion time The resulting critical path allows 1)
to identify critical and near-critical activities and 2) to anticipate the effect of a delay or
change in a project schedule
Conversely in resource-constrained scheduling (RCS) there is limited resource
availability in a project The resource supply-demand problem is addressed by considering
both the logical relationships among the activities and the availability of resources at any
given point in time RCS algorithms first prioritize the order of activities then schedule
them as early as possible subject to existing logical relationships and resource availability
When resources are not available RCS algorithms postpone the start time of the activities
until the resources required become available In consequence the intended project
completion date may be extended Indeed it is well documented in the literature that RCS
algorithms do not guarantee that the original project completion date will be met
Unlike time-constrained schedules in resource-constrained schedules the concepts of total
float and critical path lose their significance (Wiest 1964 Fondahl 1991 Bowers 1995
15
Raz and Marshall 1996 Rivera and Duran 2004) That is the total float is now constrained
by both forward and backward CPM calculations as well as resource availability which is
not the case in time-constrained schedules where the total float is only constrained by
forward and backward CPM calculations
To date Primavera P6 continues to be plagued by the same issues pointed out by Kim and
de la Garza in 2003 when P3 was available (Kim and de la Garza 2003) That is in
resource-constrained schedules Primavera P6 calculates the total float assuming a time-
constrained schedule as opposed to a resource-constrained schedule Primavera P6
correctly determines the activitiesrsquo earliest dates that satisfy the resource limitations but it
calculates total float based on a ldquoTime Contextrdquo (LF ndash EF andor LS ndash ES) ignoring the
presence of resource constraints As illustrated in this paper and in these circumstances
the total float is no longer the amount of time an activity can be delayed without affecting
the project completion time The combination of resource-constrained schedules with total
float calculated on a time-context basis makes impossible the anticipation of the impact of
a delaying event in the project completion time
Scheduling software developers such as Oracle and Microsoft have not progressed in
removing phantom float from resource-constrained schedules Therefore it is the userrsquos
responsibility to recognize that the calculation of total float by the software relies on a time-
based context and hence the total float reported cannot be trusted andor used to mitigate
delaying events like the traditional time-based context definition of total float suggests
Conclusion
Project management software has become an essential tool for planning and control
projects Primavera P6 and Microsoft (MS) Project are two of the most frequently used
scheduling software in the construction industry Although these programs help users to
develop the project plan and to report the project status they do not appropriately support
the decision process when dealing with resource project allocations and constraints In
order to mitigate the resource supply-demand problem Resource-Constrained Scheduling
(RCS) techniques have been incorporated in Primavera P6 and MS Project
RCS methodologies solve the resource conflicts but create phantom float in the schedules
ndasha float that does not really exist RCS methods overlook the resourcesrsquo relationships
between activities that compete for the same but unavailable resources As a result the
critical path is broken In the last years several algorithms have been developed to identify
the critical path in a resource-constrained schedule However some of them identify
unnecessary resource links andor remove some technological relationships from the
schedule The redundant resource links increase the network complexity and the removal
of technological relationships jeopardizes the updating process of the schedule since the
logical sequence of the project may be lost
After testing Primavera P6 versions (P6 v832 and P6 v161) and MS Project v2016 both
software packages still create phantom float in resource-constrained schedules because
16
they do not apply any algorithm to remove phantom float The software correctly
determines the activitiesrsquo earliest dates that satisfy the resource limitations but they
calculate total float based on a ldquoTime Contextrdquo (LF ndash EF andor LS ndash ES) ignoring the
presence of resource constraints Hence the floats calculated by the software cannot be
trusted or used as traditional definitions suggest ie the amount of time an activity can be
delayed without affecting the project completion time
On a regular basis professionals use commercial available software to resource load the
schedules without paying attention to the resulting critical path and float values However
they should recognize the presence of phantom float in resource-constrained schedules
because it may lead them to make decisions based on unreliable schedules Non-critical
activities may be considered resource critical if they fail to release the resources needed by
a critical activity on time The actual float values may be shorter than calculated during
RCS or may be altogether non-existent (Fondahl 1991) This makes impossible the
identification of the critical path and thus the anticipation of the impact of a delaying event
in the project completion time The incorporation of an enhanced Resource Constraint
Critical Path (RCPM) in a system to solve the RCSrsquo drawbacks in Primavera P6 and MS
Project is being explored at Virginia Tech
References
Baki M A (1998) CPM scheduling and its use in todays construction industry Project
Management Journal 29(1) 7ndash9 Retrieved from
httpswwwpmiorglearninglibrarycritical-path-method-scheduling-construction-
industry-2069 (Accessed December 6 2018)
Bowers J A (1995) Criticality in Resource-Constrained Networks Journal of the
Operational Research Society 46 80-91 DOIorg101057jors19959
Boyle T M (2016) BCP Logic Filter for Microsoft Project Retrieved from Charlotte
NC httpwwwboyleprojectconsultingcomWeb20FilesBPCLogicFilter-
Intro20R2pdf (Accessed December 6 2018)
Davis E W (1974) CPM Use in Top 400 Construction Firms Journal of the Construction
Division 100 (1) 39-49 Retrieved from
httpscedbasceorgCEDBsearchrecordjspdockey=0021563 (Accessed December 6
2018)
de la Garza J M and Franco-Duran D M (2017 December 20) CPM Benefits in
Estimating Bidding Reported in Survey (B Buckley Ed) Retrieved from Engineering
News-Record httpswwwenrcomarticles43666-cpm-benefits-in-estimating-bidding-
reported-in-survey (Accessed December 6 2018)
17
Fondahl J W (1991) The Development of the Construction Engineer Past Progress and
Future Problems Journal of Construction Engineering and Management 117(3) 380-392
DOIorg101061(ASCE)0733-9364(1991)1173(380)
Galloway P D (2006) Survey of the Construction Industry Relative to the Use of CPM
Scheduling for Construction Projects Journal of Construction Engineering and
Management 132(7) 697 - 711 DOIorg101061(ASCE)0733-9364(2006)1327(697)
Ibbs W and Nguyen L D (2007) Schedule Analysis under the Effect of Resource
Allocation Journal of Construction Engineering and Management 133 2 131-138
DOIorg101061(ASCE)0733-9364(2007)1332(131)
Kastor A and Sirakoulis K (2009) The effectiveness of resource leveling tools for
Resource Constraint Project Scheduling Problem International Journal of Project
Management 27 493ndash500 DOIorg101016jijproman200808006
Kelleher A H (2004) An Investigation of the Expanding Role of the Critical Path Method
by ENRs Top 400 Contractors Virginia Tech Blacksburg VA Retrieved from
httpsvtechworkslibvteduhandle109199889 (Accessed December 6 2018)
Kim K (2003) A Resource-constrained CPM (RCPM) Scheduling and Control Technique
with Multiple Calendars Virginia Tech Blacksburg Virginia Retrieved from
httpsvtechworkslibvteduhandle1091928139 (Accessed December 6 2018)
Kim K and de la Garza J M (2003) Phantom Float Journal of Construction
Engineering and Management 129(5) 507-517 DOIorg101061(ASCE)0733-
9364(2003)1295(507)
Kim K and de la Garza J M (2005) Evaluation of the Resource-Constrained Critical
Path Method Algorithms Journal of Construction Engineering and Management 131(5)
522-532 DOIorg101061(ASCE)0733-9364(2005)1315(522)
Kim K and de la Garza J M (2005) A New Approach to Resource-Constrained
Scheduling Towards a Vision for Information Technology in Civil Engineering 1-6
Reston VA American Society of Civil Engineers DOIorg10106140704(2003)48
Liberatore M J Pollack-Johnson B and Smith C A (2001) Project Management in
Construction Software use and Research Directions Journal of Construction Engineering
and Management 127(2) 101-107 DOIorg101061(ASCE)0733-9364(2001)1272(101)
Lu M and Li H (2003) Resource-Activity Critical-Path Method for Construction
Planning Journal of Construction Engineering and Management 129(4) 412-420
DOIorg101061(ASCE)0733-9364(2003)1294(412)
18
Moder J J Phillips C R and Davis E W (1983) Project Management with CPM
PERT and precedence diagramming (3rd ed ed) New York Van Nostrand Reinhold
ISBN 780442254155
Pantouvakis J-P and Manoliadis O G (2006) A Practical Approach to Resource-
Constrained Project Scheduling Operational Research An International Journal 6(3)
299-309 DOIorg101007BF02941258
Raz T and Marshall B (1996) Effect of resource constraints on float calculations in
project networks International Journal of Project Management 14(4) 241-248
DOIorg1010160263-7863(95)00090-9
Rivera F A and Duran A (2004) Critical clouds and critical sets in resource-constrained
projects International Journal of Project Management 22(6) 489-497
DOIorg101016jijproman200311004
Tavakoli A and Riachi R (1990) CPM Use in ENR Top 400 Contractors Journal of
Management in Engineering 6(3) 282-295 DOIorg101061(ASCE)9742-
597X(1990)63(282)
Wiest J D (1964) Some Properties of Schedules for Large Projects with Limited
Resources Operation Research 12(3) 395-418 DOIorg101287opre123395
Woodworth B M and Shanahan S (1988) Identifying the critical sequence in a
resource-constrained project International Journal of Project Management 6(2) 89-96
DOIorg1010160263-7863(88)90030-0
19
CHAPTER 2
Review of Resource-Constrained Scheduling Algorithms2
Abstract
On a regular basis project managers concentrate their efforts on critical and near-critical
activities However the concepts of total float and critical path lose their significance after
applying resource-constrained scheduling (RCS) techniques RCS techniques mitigate the
resource supply-demand problem but break the critical path As a result several algorithms
have been developed to identify a continuous critical path in resource-constrained
schedules
This study reviews and evaluates the performance of eight RCS related algorithms with the
purpose of identifying the shortcomings that must be addressed so they can be applied for
delay analysis The review shows that a systematic procedure is needed to 1) incorporate
and handle dynamic resource links when the schedule is updated and 2) select a potential
resource link configuration Addressing these limitations will make the algorithms more
practical for real construction and engineering projects and will allow a more realistic delay
analysis since schedules will reflect the real conditions of the project (resource loaded)
This study 1) discusses potential solutions to the shortcomings of the existing algorithms
2) provides recommendations on the methods that can be used by industry professionals
and 3) proposes a system to facilitate the selection of an algorithm based on their common
features (heuristic) constraints (removal of logic links) and project characteristics
(resources and calendars)
Keywords Critical Path Delay Analysis Phantom Float Resource-Constrained
Schedules Resource Relationships
Introduction
The Critical Path Method (CPM) is a useful tool to plan and control the work of a project
(Baki 1998 de la Garza and Franco-Duran 2017) In fact about 97 of the Engineering
News-Recordrsquo (ENR) Top 400 contractors indicated that CPM is a valid management tool
(de la Garza and Franco-Duran 2017) Over half of the contractors also indicated that CPM
does not have major disadvantages (de la Garza and Franco-Duran 2017) However CPM
does not consider resource project allocations and constraints
Instead CPM assumes that unlimited resources will be available at any time when required
to execute project activities (Wiest 1963 Woodworth and Shanahan 1988 Lu and Li
2 Franco-Duran D M amp de la Garza J M (November 01 2019) Review of Resource-Constrained
Scheduling Algorithms Journal of Construction Engineering and Management 145 11)
DOIorg101061(ASCE)CO1943-78620001698
20
2003 Pantouvakis and Manoliadis 2006 Kastor and Sirakoulis 2009 Nisar et al 2013)
This assumption is unrealistic because activities require a specific amount of resources to
be executed and projects have a certain number of resources available to complete
activities which constraints the schedule in terms of resources (Resource-Constrained
Schedules)
Oftentimes the resource demand exceeds the maximum number of resources available for
the project (Woodworth and Shanahan 1988 Lu and Li 2003 Pantouvakis and
Manoliadis 2006) To mitigate this resource-supply demand problem Resource-
Constrained Scheduling (RCS) techniques which are based on priority rules postpone the
start time of some activities when the units of resources required to complete them are not
available (Abeyasinghe et al 2001 Lu and Li 2003)
RCS techniques solve the resource conflicts but they create phantom float in the schedule
(a float that does not exist) ie each time an activity uses this apparent float there is a
resource violation in the schedule (Kim and de la Garza 2003) RCS techniques neglect
the resource relationships between activities that compete for the same but limited
resources (Fondahl 1991) As a result the critical path is broken and all activities must be
considered critical The lack of a continuous critical path makes impossible the anticipation
of the impact of a delaying event in the project completion time (Woodworth amp Shanahan
1988 Bowers 1995 Kim 2009)
Several algorithms have been developed to address the shortcomings of RCS methods
Some of these algorithms provide correct float values and a continuous critical path
because they consider not only the technological relationships but also the resource
relationships between activities In 2005 Kim and de la Garza compared the performance
of the Resource Critical Path Method (RCPM) with four RCS related algorithms
At present CPM is frequently used for delay analysis and courts accept CPM as a reliable
tool to perform this analysis Indeed one of the main reasons noted by 100 out of 133 ENR
Top 400 contractors for using the CPM is to perform schedule impact and claim analysis
(de la Garza and Franco-Duran 2017) Because the existing delay methodologies are based
on CPM schedules the resource load and constraints are relevant aspects often disregarded
during the application of a delay analysis technique (Ibbs and Nguyen 2007 Braimah
2013) These factors may influence the outcome of the analysis since the project
completion time can be affected by resource availability Up to date few studies have been
published about how to perform a delay analysis considering resource-constrained
schedules without phantom float
As an extension of the work published by Kim and de la Garza (2005) the present study
reviews eight RCS related algorithms with the purpose of identifying the shortcomings that
must be addressed so they can be applied for delay analysis (Woodworth and Shanahan
1988 Bowers 1995 Kim and de la Garza 2003 Lu and Li 2003 Abeyasinghe et al
2001 Rivera and Duran 2004 Pantouvakis and Manoliadis 2006 and Nisar et al 2013)
Four out of the eight algorithms were not considered by Kim and de la Garza (2005)
Additionally this paper evaluates the algorithmsrsquo performance to provide some
21
recommendations on the methods that can be used by industry professionals The
performance is measured in terms of four indicators 1) the percentage increase of project
duration above the CPM length the percentage increase of the network complexity 3) the
percentage of activities with free float and 4) the percentage of critical activities
Methodology
The performance of the Resource-Constrained Critical Path Method (RCPM) developed
by Kim and de la Garza in 2003 was compared with that of seven RCS related algorithms
Initially the RCPM was developed under a serial approach This study performed the
RCPM under the serial and parallel methods
In the RCPM serial-based activities are sorted in ascending order according to the Late
Start Time (LS) If there is a tie with respect to the LS the priority is given to the activity
with the least duration (D) If the tie persists the activity with the least Total Float (TF) is
scheduled first If there is still a tie with respect to the TF the tie is broken by the smallest
activity number (ID) In the RCPM parallel-based activities are sorted in ascending order
according to the Early Start Time (ES) If there is a tie with respect to the ES the priority
is given to the activity with the least LS If the tie persists the activity with the least D is
scheduled first If there is still a tie with respect to the D the tie is broken by the smallest
activity ID
The examples provided by Woodworth and Shanahan (1988) Bowers (1995)
Abeyasinghe et al (2001) Lu and Li (2003) Rivera and Duran (2004) Pantouvakis and
Manoliadis (2006) and Nisar et al (2013) were used to generate the RCPM schedules
(serial and parallel-based)
In the serial approach the activitiesrsquo sequence is defined before scheduling the project
(Moder et al 1983 Abeyasinghe et al 2001 Lu and Li 2003) All activities are sorted as
a single group and then scheduled one at a time (Moder et al 1983) In the parallel
approach the activitiesrsquo sequence is defined and updated at the start of each day
(Abeyasinghe et al 2001 Lu and Li 2003) The RCPM is briefly described as follows
(Kim and de la Garza (2003) Kim (2003)
1 Apply the Late Start heuristic under the serial approach If an activity is delayed
create a resource link between the postponed activity and the preceding activity that
shares the same resources
2 Perform the backward pass considering the technological and resource
relationships
3 Determine if the total float values of noncritical activities can be used during the
whole period If not create the corresponding resource link
4 Find alternative schedules by looking for activities that can be scheduled during a
different period without breaching the technological and resource relationships
22
Depending on the heuristicsrsquo priority rules different results can be obtained for the same
project in terms of duration the number of resource links and critical activities These
parameters were considered to measure the algorithmsrsquo performance by calculating the
percentage increase of project duration above the CPM length (Equation 1) the percentage
increase of network complexity (Equation 2) the percentage of activities with free float
(Equation 3) and the percentage of critical activities (Equation 4) These performance
indicators are practical measures that be calculated after the application of any algorithm
119868119899119888119903119890119886119904119890 119863119906119903119886119905119894119900119899 = 119875119903119900119895119890119888119905 119863119906119903119886119905119894119900119899 minus 119862119875119872 119871119890119899119892119905ℎ
119862119875119872 119871119890119899119892119905ℎ 119909 100 (Eq 1)
119868119899119888119903119890119886119904119890 119873119862 =119873119862119877119871 minus 119873119862
119873119862119909 100 119873119862 =
sum 119879119877119894119895119873119894
119873 (Eq 2)
119860119888119905119894119907119894119905119894119890119904 119865119865 =sum 119873119865119865
119873119894
119873119909 100 (Eq 3)
119862119903119894119905119894119888119886119897 119860119888119905119894119907119894119905119894119890119904 = sum 119873119879119865=0
119873119894
119873119909 100 (Eq 4)
Where NC is the network complexity including only the technological relationships from
the CPM schedule TRij are the non-redundant technological relationships NCRL is the
network complexity including technological and resource relationships N is the total
number of activities NFF is the number of activities with Free Float (FF) and NTF=0 is the
number of activities with Total Float (TF) equals zero
The percentage increase of project duration above the critical path length has been used by
several authors to compare the efficacy of RCS heuristics (Patterson 1973 Davis and
Patterson 1976 Patterson 1976 Gordon 1983 Alvarez-Valdez and Tamarit 1989
Ulusoy and Ozdamar 1989) This measure represents the delay generated by the resource
unavailability because of the heuristic employed (Patterson 1973) According to previous
studies the heuristics with a better performance increase the project duration on average
by 37 (Boctor 1996)
Some algorithms identify redundant or unnecessary resource links These additional links
do not affect the float calculations but they increase the computational time and the
complexity of the network The percentage increase of the network complexity is
calculated in terms of the average number of precedence relationships per activity after
adding the resource links to the schedule
The percentage of activities with free float and the percentage of critical activities are
measures of schedule flexibility Project managers may find beneficial to have some float
in the schedule in order to mitigate potential delaying events The greater the percentage
23
of activities with free float the greater the number of activities that can start late without
affecting the start of its successor activities On the other hand the lower the number of
critical activities the lower the probability to cause delays to the project
Algorithms Review
This section describes and compares the algorithms developed by Woodworth and
Shanahan (1988) Bowers (1995) Abeyasinghe et al (2001) Kim and de la Garza (2003)
Lu and Li (2003) Rivera and Duran (2004) Pantouvakis and Manoliadis (2006) and Nisar
et al (2013) Table 1 shows a summary of these eight algorithms
These RCS related algorithms were developed with the aim of providing project managers
a tool to 1) correctly schedule and identify critical activities with respect to time and
resource allocation and 2) correctly calculate the total float of each activity under resource
constraints (Woodworth and Shanahan 1988) In practice the algorithms have been
implemented as mechanisms to 1) prioritize and re-examine critical activities and 2) control
the project (Abeyasinghe et al 2001)
24
Table 1 Characteristics of the algorithms
Algorithm
Features
Woodworth Bowers Abeyasinghe Kim Lu Rivera Pantouvakis Nisar et al
1988 1995 2001 2003 2003 2004 2006 2013
RCS Method Parallel Parallel Serial Serial Serial Any Serial Any
Heuristic Min Slack Min LS Companion
Activities
LS + D +
TF
Work
Content NS LS
Ranked
Positional
Weighted
Identify Critical
Path Yes Yes Yes Yes Yes No Yes Yes
Keep
Technological
Relationships
Yes Yes No Yes No Yes No No
Split Allowed Yes NS No No No NS No No
Multiple
Resources Yes Yes Yes Yes Yes Yes Yes No
Multiple
Calendars NS NS NS Yes No No No NS
Create Phantom
Float No No Yes No No Yes No No
Identify RLs Yes Yes Yes Yes Yes No Yes Yes
Phase where RLs
are created
Backward
Pass
Forward amp
After
Backward
Pass
Forward
Pass
Forward amp
After
Backward
Pass
After
Forward
Pass
NA Forward
Pass
Forward amp
Backward
Pass
Unnecessary
RLs Yes Yes No No Yes NA Yes No
Dynamic RLs No No No No No No No No
NA Not Apply
25
Woodworth and Shanahan (1988)
Woodworth and Shanahanrsquos algorithm identifies critical resources the time of resource critically
and a critical sequence According to Woodworth and Shanahan a critical sequence consists of
activities that share technological and resource relationships and takes the longest time to be
completed The algorithm is briefly described as follows
1 Perform the Minimum Slack heuristic under the parallel method approach
2 Record a label for each activity the resource ID and the order in which each resource is
used during the forward pass In addition record in a resource pool the ID of the activities
that use the resources
3 Search the resource usage history and the activitiesrsquo order to find the immediate
predecessor of the current activity during the backward pass Create a resource link if the
Early-Start Time (ES) of the predecessor activity and the Early-Finish Time (EF) of the
current activity are equal and they are not technologically connected
4 Calculate the technologicalresource slack (Total Float) as the difference between the ES
and EF of each activity once all activities are connected
Comparison
The schedule provided in Woodworth and Shanahanrsquos study has 15 activities (including a start
activity) and 17 logical relationships (NC = 113) The project requires two types of resources (RA
and RB) and the maximum resources available per type is one unit The CPM duration is 31 days
(see Figure 1)
Figure 1 Network Diagram (Kim and de la Garza 2005)
The project duration was increased by 13 days (from 31 to 44 days) after mitigating the resource
supply-demand problem (see Figure 2) Although Woodworth and Shanahanrsquos algorithm creates
resource-induced discontinuities in the schedule (resource links) the authors did not provide
further details on how to create these links when an activity requires multiple types of resources
or on how to handle activities with no resource requirements in the resource pool (Kim and de la
Garza 2005)
26
Figure 2 Woodworth and Shanahanrsquos Schedule (Woodworth and Shanahan 1988)
The RCPM schedules under the serial and parallel approaches are shown in Figure 3 The main
difference between the two schedules is the activitiesrsquo sequence which leads to a different resource
link configuration Specifically the sequence of activities A5-10 A7-9 and A9-10
Figure 3a Serial-Based Schedule
Figure 3b Parallel-Based Schedule
Figure 3 RCPM Results for Woodworth and Shanahanrsquos Example
27
All three schedules have a continuous critical sequence and they do not have phantom float
Although Woodworth and Shanahanrsquos algorithm provides a shorter duration (44 days) and the
schedule has fewer critical activities (53) the algorithm increases the network complexity by
101 (see Table 2) The RCPM serial-based schedule is more flexible than the RCPM parallel-
based schedule in terms of the number of activities with free float but it has more critical activities
and creates more resource links Both algorithms increased the project duration by more than 37
Table 2 Comparison with Woodworth and Shanahanrsquos Result
Authors
RCS
Method Duration
(Days)
Resource
Links
Increase
Duration
Increase
NC
Critical
Activities
Activities
with FF
Woodworth
and
Shanahan
Parallel
(ES +
TF)
44 8 42 101 53 13
Kim and de
la Garza
Serial
(LS) 46 5 48 76 67 20
Parallel
(ES +
LS)
45 4 45 68 60 13
Bowers (1995)
Bowersrsquo algorithm is similar to that proposed by Woodworth and Shanahan (1988) The main
difference between the two algorithms is the phase where resource links are identified and created
in the schedule While in Woodworth and Shanahanrsquos algorithm resource links are created during
the backward pass in Bowersrsquo algorithm resource links are created during the forward pass
Bowersrsquo algorithm is briefly described as follows
1 Apply the Minimum Latest Start heuristic under the parallel approach (This rule is
equivalent to the Minimum Slack heuristic)
2 Identify and create resource links during the forward pass considering the resource usage
of each activity
3 Perform the backward pass considering the technological and resource links
Comparison
Bowersrsquo schedule has 11 activities and 12 logical relationships (NC = 109) The project requires
two types of resources (RA and RB) and the maximum resources available per type is one unit for
RA and two units for RB (see Figure 4) The CPM duration is 86 days
28
Figure 4 Bowersrsquo Network Diagram Modified from (Bowers 2005)
According to Bowersrsquo result the project duration was increased by 15 days (from 86 to 101 days)
after solving the resource conflicts (see Figure 5) Bowersrsquo algorithm assumes that resource
allocation does not change over time (Kim and de la Garza 2005) This assumption which is
unrealistic in todayrsquos projects neglects the possibility of schedule changes in terms of resource
availability Besides Bowers did not explain whether unidentified or additional resource links are
added to the schedule during or after the backward pass For instance the resource link between
Activities A6 and Activity A5 cannot be identified during the forward pass (see Figure 5)
Figure 5 Bowersrsquo Result (Bowers 2005)
Otherwise both RCPM schedules are equal The serial method generated the same sequence of
activities as that when the parallel method was applied (see Figure 6) These two RCPM schedules
match with the schedule obtained by Bowers (see Table 3)
Figure 6 RCPM Serial and Parallel-Based Schedule
29
Table 3 Comparison with Bowersrsquo Result
Authors
RCS
Method Duration
(Days)
Resource
Links
Increase
Duration
Increase
NC
Critical
Activities
Activities
with FF
Bowers Parallel 101 4 17 33 64 18
Kim and
de la
Garza
Serial amp
Parallel 101 4 17 33 64 18
Abeyasinghe Greenwood and Johansen (2001)
The algorithm proposed by Abeyasinghe et al is briefly described as follows
1 Perform CPM and create the Gantt chart of the project based on early dates
2 Draw the link-structure of the project This structure is a combination of the various logic
paths of the project network Vertical lines and right-handed arrows represent activity
relationships
3 Manipulate the link-structure to eliminate the resource conflicts while ensuring a minimum
project duration The structure is compressed according to some rules defined by the
authors
4 Identify possible critical paths The longest path becomes the only critical path
Comparison
Abeyasinghe et al network has 11 activities and 10 logical relationships (NC =111) The project
requires one type of resource (R) with maximum availability of five units The CPM duration is
19 days (see Figure 7) The project duration was increased by nine days (from 19 to 28 days) after
mitigating the over-allocation problem (see Figure 8)
Figure 7 Network of Abeyasinghe et al Study (Abeyasinghe et al 2001)
30
Although Abeyasinghe et al schedule has a shorter duration than the RCPM schedule there is a
resource availability violation for the total float periods of Activity B As reported by Figure 8b
Activity B has 25 days of float Nonetheless if this float is used during days 11 to 20 or during
days 27 to 28 (ie Activity B is delayed) there is an over-allocation problem In both instances
six resources would be required and there are only five resources available for this project
Therefore this schedule has phantom float This resource violation occurs because the algorithm
removed the technological relationship between Activity B and Activity G (see Figure 8a)
Figure 8a Network Diagram
Figure 8b Gantt Chart
Figure 8 Abeyasinghe et al Result (Abeyasinghe et al 2001)
As presented in Table 4 the complexity of Abeyasinghe et al schedule did not increase after
adding the resource links in the network Instead the network complexity decreased because the
algorithm removed some technological relationships (NC is negative) Although the removal of
these technological relationships does not affect the float calculations it jeopardizes the updating
process of the schedule because the logic sequence of the project is lost
For this example both RCPM schedules are equal (see Figure 9) Even though the RCPM duration
is 32 higher than that obtained by Abeyasinghe et al algorithm the RCPM schedule does not
have phantom float
Table 4 Comparison with Abeyasinghe et al Result
Authors
RCS
Method Duration
(Days)
Resource
Links
Increase
Duration
Increase
NC
Critical
Activities
Activities
with FF
Abeyasinghe
et al
Parallel
28 6 47 -26 67 -
Kim and de
la Garza
Serial amp
Parallel 34 4 79 15 44 33
31
Figure 9 RCPM Serial and Parallel-Based Schedule
Rivera and Duran (2004)
Rivera and Duran introduced the concepts of critical set and critical cloud to identify critical
activities in a resource-constrained schedule A critical sequence connects critical clouds andor
critical tasks A critical cloud includes all possible critical sets A critical set is a group of activities
that simultaneously constrain the project progress and impacts the project completion time if all
the activities of the set are delayed This set of activities is critical during a specific period A
critical activity is a critical cloud with a critical set of only one task As shown in Figure 10b a
color code identifies critical clouds with only one activity a critical set or more than one critical
set
Comparison
Rivera and Duranrsquos schedule has 15 activities and 19 logical relationships (NC = 127) The project
requires one type of resource (R) with maximum availability of four units The CPM duration is
18 days (see Figure 10a) The project duration was increased by five days (from 18 to 23 days)
after mitigating the resource supply-demand problem (see Figure 10b)
Figure 10a Network Diagram
32
Figure 10b Algorithmrsquos Result
Figure 10 Rivera and Duranrsquos Schedule (Rivera and Duran 2004)
Rivera and Duranrsquos algorithm does not create resource links between activities As a result the
schedule lacks a continuous critical sequence Additionally critical activities do not have a zero
total float and some activities have phantom float (Activity E and Activity M) Neither the free
float values nor the total float values of the activities in Rivera and Duranrsquos schedule can be
correctly computed due to the lack of resource links
The RCPM schedules under the serial and parallel approaches are shown in Figure 11 These two
schedules do not have phantom float The main difference between the two schedules is the start
time of Activity M Activity M starts earlier in the parallel-based schedule than in the serial-based
schedule The early start of Activity M decreases the number of resource links required in the
schedule Thus the RCPM parallel-based schedule provides a better activitiesrsquo configuration in
terms of duration network complexity critical activities and activities with free float (see Table
5)
Table 5 Comparison with Rivera and Duranrsquos Result
Authors
RCS
Method Duration
(Days)
Resource
Links
Increase
Duration
Increase
NC
Critical
Activities
Activities
FF
Rivera
and
Duran
NS 23 No 28 0 53 -
Kim
and de
la
Garza
Serial
(LS) 22 8 22 42 40 7
Parallel
(ES +
LS)
21 5 17 26 33 20
Note NS = Not Specified
33
Figure 11a Serial-Based Schedule
Figure 11b Parallel-Based Schedule
Figure 11 RCPM Results for Rivera and Duranrsquos Example
Lu and Li (2003)
Lu and Li (2003) developed the Resource-Activity Critical-Path Method as a serial based approach
in which the Work Content (WC) is the primary criterion to schedule activities The work content
is the relative weight of each activity with respect to time and resource usage The work content is
calculated as the number of resources multiplied by the activity duration Limited resources are
first assigned to activities with higher work content since these activities may affect the project
completion time Lu and Lirsquos algorithm is briefly described as follows
1 Determine the status of each activity as CAN-DO TO DO or DONE Update this status
each time that an activity is scheduled Then calculate the work content of each activity
34
2 Sort the CAN-DO activities in descending order according to their work content If there
is a tie with respect to the work content schedule the activity with a larger number of
resources or longer duration first
3 Determine and update the time when resources are ready to work (Ready to Serve Time -
RST) Allocate the number of resources needed for the current activity based on the RST
4 Determine the Early Start Time (ES) of each activity considering the maximum date
between the Early Finish Time (EF) of its predecessors and the RST of its resources
5 Calculate the idle time of resources before being allocated to an activity as the difference
between the ES of the current activity and the RST of the participating resources Check if
the resources allocated to the current activity can be allocated to another CAN-DO activity
6 Replace the RST of the resources participating in the current activity with the EF of the
current activity Repeat the previous steps until all activities are completed
7 Identify the resource-constrained successor activities ie the first activity that uses the
same resource of the current or predecessor activity Then create the corresponding links
between the activities
8 Perform the backward pass considering the technological and resource relationships
Lu and Lirsquos algorithm requires a lot of in-between work (additional networks andor tables) to
handle the interaction and allocation of resources This turns out to be impractical when applying
it to real projects (Pantouvakis and Manoliadis 2006) Besides the use of the work content as a
priority rule generates different results for the same project when having activities with multiple
types of resource requirements Under this scenario the user should determine which type of
resource is more important and based on that criterion calculate the work content
Besides Lu and Li did not specify how to schedule activities with no resource requirement These
activities do not affect the schedule by holding up resources but they are necessary to keep the
logic sequence of a project Activities with no resource requirements should not have the least
priority to be scheduled (WC = 0) On the other hand when there is a resource-dependency
between activities that are also technologically connected the resource relationship takes
precedence over the logical relationship ie some technological relationships are removed from
the schedule
Pantouvakis and Manoliadis (2006)
Pantouvakis and Manoliadisrsquo algorithm is briefly described as follows
1 Apply any RCS method to mitigate the resource supply-demand problem
2 Identify the resource dependencies that exist between the activities from the resource
histogram A resource dependence exists if an activity uses part or all the resources of its
predecessor activity
3 Re-draw the network considering not only the logical relationships but also the resource
relationships Review the schedule to determine if the project can be logically performed
If not reconsider the resource limits and perform the algorithm a second time
4 Perform the CPM in the final network to obtain the total float values
5 Pantouvakis and Manoliadisrsquo algorithm assumes that resource requirements do not change
over time Besides since the algorithm is based on the resource-leveled histogram the user
35
should identify the resource dependencies between activities by inspection This process is
prone to errors when having large networks
Nisar Yakamamoto and Suzuki (2013)
Nisar et al proposed the Resource-Dependent Critical Path Method which 1) identifies different
types of resource dependencies 2) determines alternative schedules and 3) optimizes the number
of resource links when having multiple alternatives to create them for a specific activity The
algorithm is described as follows
1 Perform the forward and backward pass of any RCS method (Nisar et al applied the
Ranked Positional Weighted method)
2 Perform the backward pass of the selected RCS method
21 Reverse the original schedule (ie the predecessor activities become the successorrsquos
activities and vice-versa) Then perform the CPM forward pass
22 Calculate the Constrained Latest Finish (CLF) time for each activity of the reverse
schedule obtained in Step 21 (CLF = Project Duration ndash Early Start Time) Perform
the RCS a second time and obtain the reverse RCS schedule
23 Calculate the CLF time for the reverse RCS schedule of Step 22
3 Determine resource dependencies
31 Create a strict resource precedence relationship when the start time of a current activity
is delayed by the same time that its predecessor activity is delayed
32 Create a flexible resource precedence relationship when the predecessor activity is
delayed more than one day and if it affects the start time of the current activity
33 Minimize the total number of resource relationships without violating any resource
constraint
4 Remove redundant relationships from the schedule
The two main limitations of Nisar et al algorithm are 1) multiple types of resources cannot be
considered and 2) technological relationships with lags cannot be included in the schedule In
addition the authors did not provide a reasonable argument that supports the development of
reverse CPM and RCS schedules These several in-between steps of the algorithm are impractical
for practitioners
Case Study
Ahuja et al schedule was used by Lu and Li (2003) Pantouvakis and Manoliadis (2006) and
Nisar et al (2013) to illustrate their proposed algorithms The schedule has 11 activities and 14
logical relationships (NC = 127) The project requires one type of resource (R) and the maximum
resource availability is six units The CPM duration is 14 days (see Figure 12)
36
Figure 12a Network Diagram
Figure 12b Bar Chart
Figure 12 Ahuja et al Schedule (Pantouvakis and Manoliadis 2006)
Comparison
According to Lu and Lirsquos result the project duration was increased by six days (from 14 to 20
days) after solving the resource conflicts (see Figure 13) Lu and Lirsquos algorithm created
unnecessary resource links because the links were added after performing the forward pass If the
resource links would have been created during the forward pass the link between Activity E and
Activity F would not have been necessary At that time the link between Activity G and Activity
F would have been already created Moreover the resource link between Activity E and Activity
F is not required because if Activity E is delayed there is not an over-allocation problem (see
Figure 13) The same scenario occurs for the link between Activity H and Activity I
Figure 13 Lu and Lirsquos Result Kim and de la Garza (2005)
37
Similar to Lu and Lirsquos result Pantouvakis and Manoliadisrsquo algorithm increased the project duration
by six days (see Figure 14b) However the algorithm removed some technological relationships
from the schedule For example the logical relationships between Activity B and Activity F
Activity C and Activity G Activity E and Activity I and Activity G and Activity I (see Figure 12a
and Figure 14a) These technological relationships were removed from the network because they
become redundant once the resource links are added to the schedule
Furthermore Pantouvakis and Manoliadisrsquo algorithm creates unnecessary resource links For
example the resource link between Activity H and Activity I is not needed Activity H can be
delayed four days without exceeding the maximum number of resources available in the project
which is six (see Figure 14b)
Figure 14a Network Diagram with Resource Links
Figure 14b Bar Chart
Figure 14 Pantouvakis and Manoliadisrsquos Result (Pantouvakis and Manoliadis 2006)
In Pantouvakis and Manoliadisrsquo schedule there are three possible resource driver activities for the
delayed task (F) (see Figure 15a) As a result two different resource links configurations can be
created If Activity D and Activity E are selected as resource drivers of Activity F two resource
links should be created in the schedule (see Figure 15b) Otherwise if Activity G is selected as the
resource driver of Activity F only one resource link is needed in the schedule (see Figure 15c)
Most of the existing algorithms do not have a criterion to select a possible resource link
configuration or to identify a resource driver activity when having several alternatives
38
Figure 15a Possible Resource Drivers of Activity F (D E and G)
Figure 15b Alternative No 1 Figure 1c Alternative No 2
Figure 15 Multiple Resource Links Configurations
According to Nisar et al result the project duration was increased by three days (from 14 to 17
days) after mitigating the resource supply-demand problem The algorithm only increased the
project duration by 21 Nisar et al algorithm provides a better schedule than the other three
authorsrsquo algorithms in terms of duration network complexity critical activities and activities with
free float Nevertheless the mechanism proposed by the authors to remove redundant relationships
removes technological links For instance the logical relationship between Activity B and Activity
G no longer exists (see Figure 16a) Because an optimization function minimizes the total number
of resource relationships without violating the resource constraints Nisar et al algorithm is not
totally rule-based
Both RCPM schedules (serial and parallel-based) are equal (see Figure 16b) The RCPM schedule
provides a better activitiesrsquo configuration than that of Lu and Li and Pantouvakis and Manoliadisrsquo
schedules in terms of duration network complexity critical activities and activities with free float
(see Table 6)
39
Figure 16a Nisar et al Result
Figure 16b RCPM Serial and Parallel-Based Schedule
Figure 16 Nisar et al (2013) and RCPM Results
Table 6 Comparison with Lu and Li Pantouvakis and Manoliadis and Nisar et al Results
Authors RCS
Method
Duration
(Days)
Resource
Links
Increase
Duration
Increase
NC
Critical
Activities
Activities
FF
Lu and Li Serial
(WC) 20 5 43 36 64 9
Pantouvakis Serial
(LS) 20 5 43 36 55 9
Nisar RPW 17 3 21 21 36 27
Kim and de
la Garza
Serial
Parallel 19 4 36 29 55 18
Note RPW Ranked Positional Weighted
40
Shortcomings of Existing RCS Related Algorithms
This section describes the three main shortcomings of the RCPM developed by Kim and de la
Garza (2003) which apply to the other algorithms reviewed in this study
Unidentified Resource Links in Multiple Calendars
When an activity is delayed and scheduled during the non-working days of its predecessor the
RCPM does not identify the corresponding resource links (Kim 2003) For example in Figure
17a Activity A is delayed one day to resolve the over-allocation problem on Day 2 The algorithm
mitigates the resource-demand problem but the two necessary resource links are not identified
(see Figure 17b) As shown in Figure 17c a resource link is needed between Activity B and
Activity A and another between Activity A and Activity B This link ensures that Activity A is not
delayed for more than three days Otherwise there would be an over-allocation problem
Figure 17a Initial Scenario
Figure 17b Unidentified Resource Links Scenario
Figure 17c Potential Solution
Figure 17 Unidentified Resource Links in the RCPM
A proposed solution to this issue is to create two different activities (B1 and B2) that represent the
activity that is scheduled between non-working days (B) (see Figure 17c) This alternative may
increase the complexity of the network and algorithm by adding more activities resource links
and in-between steps Further research is needed to determine how to handle these resource
relationships and additional activities when the schedule must be updated
41
Lack of Dynamic Resource Links
By the time the eight algorithms were developed the main concern was to solve the problem of a
broken critical path in a resource-constrained schedule For that reason the majority of the authors
did not explore the use of resource links to update the schedule or to perform a delay analysis
During the control phase of a project an update or a delay event may change the priority order
designated by the RCS heuristic to schedule the activities Thus the resource links identified
before the update may no longer be required andor new resource links can be identified after the
update The initial resource links should be removed from the schedule before updating the
schedule because they were identified based on previous or different project conditions Keeping
the resource links during the update constrains the schedule For that reason the resource links
have the feature of being temporal or dynamic Kim (2009) considered resource links for updating
the schedule but the author did not remove the resource links from the schedule each time that the
RCPM was re-applied
The incorporation of dynamic resource links in an algorithm does not create analytical challenges
if the data date of the update is known By knowing the data date of the update the algorithm will
remove only the resource links located right of the data date Even though the resource links
located right of the data date should be removed each time that an algorithm is re-applied the
resource links located left of the data date should remain on the schedule In that way after all
activities have been completed the as-built schedule will have a continuous critical path with no
phantom float
Several of the algorithms reviewed in this paper remove some technological relationships from the
schedule because these relationships become redundant after adding the resource links to the
network This process jeopardizes the updating process Due to the resource links should be
removed before updating or performing a Time Impact Analysis the logic sequence of the project
will be lost if there is no record of the logical relationships that were removed The challenge of
incorporating dynamic resource links in the schedule is knowing how to handle and keep track of
the links that have been created removed andor updated since each time the schedule is updated
the sequence of the activities may change
Selection of a Resource Links Configuration
The major problem when identifying the resource relationships in the schedule is the fact that
multiple alternatives for creating resource links between activities may exist when many current
activities have many predecessor activities Hence multiple and different schedules can be
generated for the same project (Kim 2003 Nisar et al 2013) The difference between the multiple
schedules that can be generated is not only the number of resource links created but also the critical
path So the question that arises is which schedule should be considered as the baseline
Despite Abeyasinghe et al (2001) mentioning that solving resource-constrained problems with
optimization tools is impractical in large projects due to the significant number of variables and
constraints involved this mathematical mechanism could be effective when having multiple
resource links configurations According to Nisar Yamamoto amp Suzuki (2013) the resource links
42
should be created in a way that the total number of relationships is minimized without violating
the resource constraints Nisar Yamamoto amp Suzuki (2013) proposed a function to find the
optimal resource links between activities The main goal is to not increase the complexity of the
network Further research is needed to determine the effectiveness of this approach under different
project characteristics and constraints An important factor to consider in the analysis is the
algorithmrsquos running time
On the other hand Bowers (1995) suggested that when having identical parallel activities it is the
project managerrsquos responsibility to determine the activity with higher priority Another alternative
that also keeps the algorithms rule-based is to establish and test a criterion to select one of the
multiple resource links configurations For instance the resource driver activity could be the
predecessor activity with the highest number of resources In a resource-constrained schedule this
activity is more likely to delay the project due to the high demand for resources that it requires If
this activity is delayed more activities could be delayed because they would need the resources
that the resource driver activity is using Several parameters should be tested in order to establish
a rule that provides good solutions in most of the cases These are schedules with a lower number
of resource links to avoid a complex network Current research is being carried out to determine
which priority rules may be considered for selecting a potential resource link configuration This
rule will be included in an enhanced RCPM algorithm
A criterion to select among alternative schedules should be also determined For instance 1) the
schedule with the lowest number of resource links since it may be less complex in terms of number
of relationships 2) the schedule with the lowest percentage of critical activities since the
probability to cause delays to the project is lower 3) the schedule with the highest percentage of
activities with free float since it is more flexible or 4) the schedule with the fewest resource idle
time Further research should be performed to determine which criterion is the most appropriate
Discussion
Delay Analysis
The limited amount of resources allocated to projects demands the use of resource-loaded
schedules for delay analysis (Braimah 2013) As stated by Ibbs and Nguyen (2007) ldquoperforming
a schedule analysis without considering resource allocations may increase the ownerrsquos or
contractorrsquos risk of assuming delay responsibility which is not his or her faultrdquo
The main issue when incorporating resources in a delay analysis is the fact that the RCS existing
algorithms do not incorporate and handle dynamic resource links This leads to untrusted results
because the schedule does not reflect the real conditions of the project Therefore the parties
involved may not be totally responsible for the apportioned delays (Ibbs amp Nguyen 2007)
Besides the algorithms do not allow activities to be interrupted which is a common scenario when
having a delay event
Another issue when incorporating resources in the analysis is the selection of a heuristic to solve
the resource conflicts As demonstrated by Nguyen and Ibbs (2008) the sequence of activities may
43
be altered each time that the network is re-scheduled because of a project update The updates may
change the priority rank assigned to each activity when performing an RCS heuristic and as a
result different results can be obtained for the same delay scenario (Kim 2009)
Performance of Existing RCS Related Algorithms
These heuristics provide ldquogoodrdquo but not optimal solutions (Wiest 1963 Lu and Li 2003
Pantouvakis and Manoliadis 2006) Some rules may work well for a project but may not work
well when they are applied to a different project (Wiest 1963) Based on the results of this
research which are limited to small networks the methods proposed by Nisar et al (2013) and
Kim and de la Garza (2003) provide good solutions in terms of time In most of the cases the
average increase in the project duration was lower than 37 when the RCPM was applied
Nisarrsquos algorithm generates schedules with lower complexity in terms of relationships because it
incorporates a function that minimizes the number of resource links created in the schedule
Nevertheless the algorithm removes some technological relationships from the schedule after
identifying the resource links It is suggested to keep track of the technological relationships that
are removed from the schedule Otherwise the logical sequence of the project will be lost when
updating the schedule or performing a delay analysis
Unlike Nisarrsquos algorithm Kimrsquos algorithm does not have any mechanism to optimize the number
of resource links created in the schedule but it does not remove the logical relationships from the
schedule Additionally RCPM is practical and easy to understand In this regard Nisarrsquos algorithm
requires a lot of in-between steps and the authors defined two types of resource relationships (strict
and flexible) that may be not practical for professionals Worthy of note none of the algorithms
consider the dynamic feature of resource links Therefore using these methods is not
recommended for updating the schedule or for applying a Time Impact Analysis unless they
incorporate and handle dynamic resource links
The RCS related algorithms reviewed in this paper were tested by the corresponding authors in
one or two hypotheticalreal-life projects Therefore it is not possible to develop a method of
selection based on the algorithmsrsquo performance However the indicators used in this study to
evaluate algorithm performance can help practitioners decide which method selects to mitigate the
resource supply-demand problem without generating phantom float in the schedule Algorithms
with a percentage of increase in the project duration smaller than 40 are preferred (Boctor 1976
Woodworth and Shanahan 1988) If there are several algorithms that meet this criterion the
percentage of critical activities can be used as a tiebreaker Having float in the schedule may be
beneficial when addressing potential delaying events Because most of the algorithms were tested
in small networks (20 ndash 30 activities) further investigation is required to test the performance of
the RCS related algorithms in real-life and large projects
Based on the features of each algorithm (heuristic) constraints (removal of logic links) and project
characteristics (resources and calendars) a system was developed to guide practitioners in the
selection process of an algorithm (see Figure 18)
44
Figure 18 Guide to select an Algorithm
Conclusion
On a regular basis project managers concentrate their efforts on critical and near-critical activities
However the concepts of total float and critical path lose their significance after applying resource-
constrained scheduling (RCS) methodologies (Fondahl 1961 Wiest 1964 Bowers 1995 Raz
and Marshall 1996 Rivera and Duran 2004) RCS techniques mitigate the resource supply-
demand problem but create phantom float in the schedules (ie a float that does not exist)
Therefore several algorithms have been developed to provide correct float values and a continuous
critical path in resource-constrained schedules This study reviews and evaluates the performance
of eight RCS related algorithms with the purpose of identifying the shortcomings that must be
addressed so they can be applied for delay analysis
Most of the algorithms identify resource dependences but some of them still create phantom float
in the schedule because they do not identify all the necessary resource links Some algorithms also
create unnecessary resource relationships andor remove technological relationships from the
schedule Furthermore most of the algorithms do not provide a mechanism or criterion to select a
resource links configuration among multiple alternatives and neither to select a schedule when
having multiple options Finally none of the algorithms consider the dynamic feature of resource
dependences These limitations should be addressed to make the algorithms more practical for real
construction and engineering projects
This study 1) discusses potential solutions to the shortcomings of the existing algorithms 2)
provides recommendations on the methods that can be used by industry professionals and 3)
45
proposes a system to facilitate the selection of an algorithm based on their common features
(heuristic) constraints (removal of logic links) and project characteristics (resources and
calendars) The algorithms proposed by Kim and de la Garza (2003) and Nisar et al (2013)
provide good solutions in terms of time However as presented in the discussion section there are
points to consider when applying any of these RCS related techniques
Future Research
The eight algorithms reviewed in this paper lack features for their use in delay analysis Activities
cannot be interrupted which is a common scenario when having non-working days or delaying
events In addition none of the algorithms handle dynamic resource relationships Resource links
should be removed before updating the schedule because they were created based on previous
project conditions The initial conditions may not prevail after the update Therefore a systematic
procedure is needed to incorporate and handle dynamic resource links in the algorithms when 1)
there are schedule changes 2) resource utilization changes and 3) different delay methodologies
are applied Addressing these limitations will allow a more realistic delay analysis since schedules
will reflect the real conditions of the project
Otherwise the manual identification and creation of resource links are a time consuming and error-
prone process in large and complex projects At present commercial scheduling software such as
Primavera P6 and Microsoft Project create phantom float in resource-constrained schedules
because they do not incorporate an algorithm to identify the resource relationships between the
activities Since the major scheduling software developers such as Oracle and Microsoft do not
seem to be interested in moving forward to remove phantom float from resource-constrained
schedules a system that incorporates an algorithm to remove phantom float from P6 and Microsoft
Project schedules is needed The development of a computerized system will allow the removal
in a practical way of phantom float from resource-constrained schedules
Currently research is being carried out in order to develop an enhanced RCPM-based algorithm
that addresses the shortcomings of the existing algorithms so it can properly apply for delay
analysis and project controls The enhanced RCPM algorithm will be computerized in a system
integrated with Primavera P6
References
Abeyasinghe M C L Greenwood D J amp Johansen D E (2001) An efficient method for
scheduling construction projects with resource constraints International Journal of Project
Management 19(1) 29-45 DOIorg101016S0263-7863(00)00024-7
Ahuja H Dozzi SP and AbouRizk SM (1994) Project management techniques in planning
and controlling construction projects 2nd edition Wiley New York
Alvarez-Valdes R and Tamarit JM (1989b) Algoritmos heuristicos deterministas y aleatorios
en secuenciacion de proyectos con recursos limitados Q~estiio 13 173-191
46
Baki M A (1998) CPM scheduling and its use in todays construction industry Project
Management Journal 29(1) 7ndash9 DOIorg101057jors19959
Boctor F F (April 01 1996) A new and efficient heuristic for scheduling projects with resource
restrictions and multiple execution modes European Journal of Operational Research 90 2 349-
361 DOIorg10108000207549308956882
Bowers J A (1995) Criticality in Resource-Constrained Networks Journal of the Operational
Research Soc 46 80-91 DOIorg101057jors19959
Braimah N (2013) Construction Delay Analysis TechniquesmdashA Review of Application Issues
and Improvement Needs Buildings 3 506-531 DOI103390buildings3030506
Davis E W amp Patterson J H (April 01 1975) A Comparison of Heuristic and Optimum
Solutions in Resource-Constrained Project Scheduling Management Science 21 8 944-955
de la Garza J M amp Franco-Duran D M (2017) CPM Benefits in Estimating Bidding Reported
in Survey (B Buckley Ed) httpswwwenrcomarticles43666-cpm-benefits-in-estimating-
bidding-reported-in-survey
Fondahl J W (1991) The Development of the Construction Engineer Past Progress and Future
Problems Journal of Construction Engineering and Management 117(3) 380-392
DOIorg101061(ASCE)0733-9364(1991)1173(380)
Gordon J H (January 01 1983) Heuristic methods in resource allocation International Journal
of Project Management 1 3 163-168 DOIorg1010160263-7863(83)90022-4
Ibbs W amp Nguyen L D (2007) Schedule Analysis under the Effect of Resource
Allocation Journal of Construction Engineering and Management 133 2 131-138
DOIorg101061(ASCE)0733-9364(2007)1332(131)
Kastor A amp Sirakoulis K (2009) The effectiveness of resource leveling tools for Resource
Constraint Project Scheduling Problem International Journal of Project Management 27(5) 493-
500 DOIorg101016jijproman200808006
Kim K (2003) A Resource-constrained CPM (RCPM) Scheduling and Control Technique with
Multiple Calendars (Doctor of Philosophy Dissertation) Department of Civil and Environmental
Engineering Virginia Tech Blacksburg Virginia
Kim K amp de la Garza J M (2003) Phantom Float Journal of Construction Engineering and
Management 129 (5) 507-517 DOIorg101061(ASCE)0733-9364(2003)1295(507)
Kim K amp de la Garza J M (2005) Evaluation of the Resource-Constrained Critical Path Method
Algorithms Journal of Construction Engineering and Management 131(5) 522-532
DOIorg101061(ASCE)0733-9364(2005)1315(522)
47
Kim K (2009) Delay Analysis in Resource-constrained Schedules Canadian Journal of Civil
Engineering 36 295-303 DOIorg101139L08-121
Lu M amp Li H (2003) Resource-Activity Critical-Path Method for Construction Planning
Journal of Construction Engineering and Management 129(4) 412-420
DOIorg101061(ASCE)0733-9364(2003)1294(412)
Moder J J Phillips C R amp Davis E W (1983) Project Management with CPM PERT and
precedence diagramming (3rd ed ed) New York Van Nostrand Reinhold
Nisar S A Yamamoto Koshi amp Suzuki K (2013) Resource-Dependent Critical Path Method
for Identifying the Critical Path and the ldquoReal Floatsrdquo in Resource-Constrained Project
Scheduling Journal of Japan Society of Civil Engineers 69(4) 97-107
DOIorg102208jscejcm69I_97
Nguyen L D amp Ibbs W (2008) FLORA New forensic schedule analysis technique Journal of
Construction Engineering and Management 134 7 483-491 DOIabs101061(ASCE)0733-
9364(2008)1347(483)
Pantouvakis JP amp Manoliadis OG (2006) A practical approach to resource-constrained project
scheduling Operational Research An International Journal 6(3) 299-309
DOIorg101007BF02941258
Patterson J H (1973) Alternate methods of project scheduling with limited resources Naval
Research Logistics Quarterly 20(4) 767-784 DOIorg101002nav3800200415
Patterson J H (March 01 1976) Project scheduling The effects of problem structure on heuristic
performance Naval Research Logistics Quarterly 23 1 95-123
Raz T amp Marshall B (1996) Effect of resource constraints on float calculations in project
networks International Journal of Project Management 14(4) 241-248 DOIorg1010160263-
7863(95)00090-9
Rivera F A amp Duran A (2004) Critical clouds and critical sets in resource-constrained
projects International Journal of Project Management 22(6) 489-497
DOIorg101016jijproman200311004
Ulusoy G and Ozdamar L (1989) Heuristic performance and networkresource characteristics
in resource-constrained project scheduling Journal of the Operational Research Society 40 1145-
1152 DOIorg101057jors1989196
Wiest J D (1964) Some Properties of Schedules for Large Projects with Limited Resources
Operation Research 12(3) 395-418 DOI101287opre123395
48
Woodworth B M amp Shanahan S (1988) Identifying the critical sequence in a resource-
constrained project International Journal of Project Management 6 (2) 89-96
DOIorg1010160263-7863(88)900
49
CHAPTER 3
Performance of Resource-Constrained Scheduling Heuristics3
Abstract
Over the years the study of Resource-Constrained Scheduling heuristics has focused on testing
different sets of priority rules without paying attention to the conditions under which each heuristic
produces better results Although some authors have recommended the use of specific heuristics
over any other rule these recommendations are general and do not encompass all possible project
characteristics in terms of resources and network topology Without a guidance system schedulers
must try several combinations of rules until they find one that compares favorably (shortest
duration) with the results of the other priority rules
This study proposes a new tiebreaker (Priority Number) that enhances the performance of an
existing heuristic and classifies the heuristicsrsquo performance based on specific project
characteristics The results show that the Priority Number as a tiebreaker of the Late Finish leads
to obtain schedules with lower deviations from the CPM duration and a higher number of shortest
schedules than with traditional tiebreakers
The proposed classification system indicates the two heuristics with the best performance for
specific resource network characteristics This classification will help practitioners to decide which
heuristic applies when mitigating the resource supply-demand problem given the project
characteristics
Keywords Heuristics Resource-Constrained Scheduling Tiebreaker
Introduction
Resources are included in a schedule to better represent the actual conditions of a project Under
such a scenario several activities may require the same group of resources to be completed These
activities cannot be executed at the same time unless the supply of resources would be increased
Otherwise a resource supply-demand problem (over-allocation) will arise in the schedule
In a resource-constrained schedule the initial project completion time may be extended due to
some activities that need to be delayed solving the resource over-allocation The decision of
delaying some activities and scheduling others immediately is subjected to logic precedence and
priority rules (heuristic)
3 Franco-Duran D M amp de la Garza J M (February 12 2020) Performance of Resource-Constrained Scheduling
Heuristics Journal of Construction Engineering and Management 146 (4) pp 1-12
DOIorg101061(ASCE)CO1943-78620001804
50
As rules of thumb heuristics may work better for some project characteristics than for others
(Davis 1975 Ulusoy 1989 Abetasinghe et al 2001) Previous findings suggest that heuristic
performance is poor when 1) the proportion of resources required per activity to the resources
available is high (Davis 1975) 2) activities require several types of resources (Kolish 1995) 3)
a network is highly constrained (Kolish 1995 Chen et al 2018) 4) a network has a high number
of activities (Boctor 1976 Zhan 1994) and 5) the complexity of a network which is the average
number of successors relationships per activity is around 15 to 21 (medium-high) (Davis 1975
Alvarez and Tamarit 1989 Kolish 1995)
Additionally some authors have recommended the use of specific heuristics over any other rule
For example Patterson (1976) recommended using the Minimum Total Float (TF) and Late Finish
(LF) in networks with a high average free float per activity and in networks with a high variation
in the activity duration Chen et al (2018) recommended using the LF in highly resource-
constrained networks and using the Late Start (LS) in slightly constrained networks Although
these recommendations may be useful for practitioners they are general and do not encompass all
possible project characteristics in terms of resources and network topology
Heuristics have been incorporated in commercial scheduling software like Primavera P6 and
Microsoft Project (Marimuthu et al 2018) For instance Primavera users can employ any
combination of the 26 rules listed by the software as resource-constrained priorities or any other
rule defined by the user However without a classification system that helps users to decide which
heuristic applies when mitigating the resource over-allocation problem schedulers must try several
combinations of rules until they find one that compares favorably (shortest duration) with the
results of the other priority rules
So far the study of Resource-Constrained Scheduling (RCS) heuristics has focused on testing
different sets of priority rules without paying attention to the conditions under which each heuristic
produces better results ie shorter durations A preliminary analysis showed that the performance
of existing heuristics is not consistent when networks have more than 50 activities and activities
require several types of resources For a sample of 18 networks the percentage of times that eight
existing heuristics produced the shortest schedules ranged from 11 to 39 These low numbers
highlight the need to develop a heuristic or enhancing an existing one that produces better results
under these project characteristics
The aim of this study is to 1) propose a new tiebreaker that enhances the performance of an existing
heuristic under specific project parameters 2) analyze the influence of different tiebreakers in the
resulting schedules and 3) classify the heuristicsrsquo performance based on explicit resource and
network characteristics
Theoretical Background
Heuristics have two main components the scheduling method and priority rules The scheduling
method determines the way activities are scheduled either under a serial or parallel approach
Under a serial approach activities are sorted and then scheduled one at a time Under a parallel
51
approach the activitiesrsquo sequence is determined and updated at the beginning of a specific period
ie activities are scheduled by intervals of time (Moder et al 1983)
Priority rules are criteria that establish the order to sequence activities A set of priority rules is
known as a heuristic Rules are based on information regarding activities (duration) network
(successorspredecessors) Critical Path Method (CPM) calculations (earlylate dates and float
values) and resource demand Although the first criterion of the set of priority rules (major sort
parameter) has a significant effect on the resulting schedule a minimum of two parameters is
needed for any heuristic so ties can be solved (Gordon 1974) The rule that breaks a tie ie when
two or more activities have the same value of a parameter is called tiebreaker Existing priority
rules incorporate as a tiebreaker (second sort parameter) either the ID number the duration or
total float of the activities These parameters or any other should be carefully selected since they
may have an impact on the calculated project completion time if a tie for the major sort parameter
exists
Heuristics have been tested employing different types of networks Typically networks are
generated from topological structure and resource parameters The topological structure
parameters are the number of activities the Network Complexity (NC) and the serialparallel
indicator (I2) Networks with 30 activities are considered as small size problems and networks
with more than 120 activities as large size problems (Gordon 1983) The complexity of a network
(NC) denotes the average number of successors relationships per activity It is calculated as the
ratio between the number of successor relations and the number of total activities of a project The
SerialParallel Indicator (I2) defines how close a network is to a serial or parallel chain of activities
(Kolisch 1996) This indicator ranges from zero to one If I2 = 0 activities are scheduled under
a parallel approach ie there are no precedence relationships between activities If I2 = 1
activities are serial-based scheduled (chain of activities)
Otherwise the resource parameters are the number of type of resources the Resource Strength
(RS) the Resource Factor (RF) and the Resource Utilization (RU) The Resource Utilization
factor (RU) indicates the proportion of resource requirements per activity relative to the number
of resources available The Resource Strength (RS) measures the proportion of resource demand
and availability of a network ie how constrained a network is in terms of resources considering
the maximum availability of resources The Resource Factor (RF) indicates the proportion of
resource types required per activity ie the average number of resource types needed to execute
activities Both indicators (RS and RF) range from zero to one If RS = 0 at least one activity
demands all the resource capacity Conversely if RS = 1 resources are not over-allocated If RF =1 each activity demands at least some amount of each type of resource Contrariwise if RF = 0
activities do not demand any amount of any resource
The percentage increase above the CPM duration has been used by several authors to compare and
evaluate the efficacy of several RCS related heuristics when the optimum duration of the network
is not calculated (Patterson 1973 Patterson 1976 Gordon 1986 Ulusoy and Ozdamar 1989
Boctor 1993 Kolisch 1996 Boctor 1996 Kastor and Sirakoulis 2009) The percentage increase
above the CPM duration represents the delay generated by the resource unavailability because of
the heuristic employed The lower the percentage the better the performance
52
The most tested priority rules reported in the literature are Late Finish (LF) Min Slack (Least Total
Float or Min TF) the shortest processing time (SPT or Shortest Duration) Late Start (LS) Greatest
Rank Positional Weight (GRPW) Greatest Resource Utilization (GRU) and Resource Scheduling
Method (RSM) (Davis 1975 Boctor 1976 Patterson 1976 Gordon 1983 Kolish 1995 Alvarez
and Tamarit 1989)
Newly Developed Tiebreaker Priority Number (Pn)
Before developing the new tiebreaker a pilot study was carried out to evaluate the performance of
different priority rules as tiebreakers of the Late Start (LS) and Late Finish (LF) These CPM late
dates were selected as major sort parameters to test the tiebreakers because previous studies have
found that either the LS or LF provides good results mitigating a resource supply-demand problem
(Alvarez and Tamarit 1989 Boctor 1993 Gordon 1994 Kolish 1995 Kolish 1996 Abetasinghe
et al 2001 Kastor and Sirakoulis 2009)
The parameters considered as potential tiebreakers were the number of resources required per
activity Resource Utilization (RU) Duration (D) Total Float (TF) Free Float (FF) and the
number of successor activities Based on the results of this preliminary analysis this study
proposed a new tiebreaker labeled Priority Number (Pn) The Priority Number which is a
composite rule considers the Duration (D) and Total Float (TF) of each activity A composite rule
combines different factorsparameters in one measure The Priority Number is calculated as shown
in Equation 1
Pni =Di
TFi (Eq 1)
In Equation 1 Pni is the priority number of activity i Di is the duration of the activity i and TFi
is the total float of activity i If TFi = 0 TFi is assumed to be equal to 095 This assumption was
made to avoid a division by zero and to differentiate between a critical activity (TF = 0) and a
near-critical activity (TF = 1) A number close to zero was not selected to avoid significant high
numbers of the Pn Due to the Pn does not exist as a priority rule in Primavera P6 the Pn values
were computed separately and then assigned to each activity using the activity codes function of
P6
The duration and total float were considered as appropriate parameters of the Pn due to the
influence they may have extending the project completion time The duration is the expected
amount of time an activity will be delayed if another activity is scheduled first Furthermore if the
delayed task is critical (TF = 0) the activity duration may be the time that the project could be
extended The greater the duration the greater the impact on the project completion time On the
other hand the CPM total float indicates how critical activities were before taking into
consideration the resources Although the CPM float values will change after mitigating the
resource-supply demand problem most of the critical and near-critical activities in CPM may be
still critical after applying an RCS heuristic
53
Enhanced LF Heuristic
Activities must be scheduled subject to precedence or logical relationships This study considered
the Late Finish (LF) as the major rule to sort the activities and used the Priority Number (Pn) as a
tiebreaker The Enhanced LF heuristic is described below
1 Sort activities by earliest Late Finish (LF)
2 If there is a tie with respect to the LF the priority is given to activities with the lowest
Priority Number (Pn) The preliminary analysis showed that shorter schedules are obtained
more frequently when the priority is given to activities with a lower Pn than a higher
number
3 If there is a tie with respect to the Pn the tie is broken by the smallest activity number (ID)
Methodology
This study generated 142 different networks to evaluate and classify the performance of RCS
heuristics The networks were created using the generator program RanGen developed by
Demeulemeester Vanhoucke and Herroelen (2003) The programrsquos output (a text file with a
Patterson Format structure) was converted to a Primavera P6 format (Franco Duran 2019)
RanGen considers two types of input parameters to construct random networks 1) the networksrsquo
topology and 2) the networksrsquo resource characteristics
Topological Structure
The topological structure of a network is determined by the SerialParallel Indicator (I2) and the
number of activities The 142 generated networks were limited in size to between 30 and 90
activities with an average of 64 activities per network Their complexity ranges from 140 to 165
with an average value of 150 ie three immediate successors per activity RanGen assigned
durations between one and ten units of time to activities The average activity duration of the
networks is five units of time
To resemble a network with parallel and serial activities I2 was defined as 065 (see Figure 1b)
Figure 1 shows the structure of a network of 12 activities when I2 = 020 (parallel-based) I2 =065 (serial and parallel-based combination) and I2 = 10 (serial-based)
Figure 1a Network with I2 =
02 (Parallel-Based)
Figure 1b Network with I2 = 065 (serial and parallel-
based combination)
54
Figure 1c Network with I2 = 10 (Serial-Based)
Figure 1 Network Topologies
Resource Measures
The number of types of resources the Resource Strength (RS) and the Resource Factor (RF) were
the three resource-related parameters defined in RanGen to construct networks The 142 networks
have single or multiple resource requirements with a maximum of three types of resources per
project All resource types are subjected to fixed resource availabilities which were randomly
assigned by RanGen and were constant over the project duration The resource maximum
availability per type varies between 10 and 16 units
In this study the RS was defined as 025 to guarantee an over-allocation scenario in each of the
generated networks Because heuristic performance decreases when the RF is close to 1 most of
the generated networks of this study (N = 112) have a RF equal to 075 (Kolish 1995) Few
networks have a RF equal to 025 (N = 30) Figure 2 shows the resource profiles of a network
with a RF equal to 025 and 075 respectively When RF = 025 activities need less of the resource
type(s) to be executed (see Figure 2a) and when RF = 075 activities need more of the resource
type(s) to be executed (see Figure 2b)
Figure 2a Resource Profile when RF = 025 Figure 2b Resource Profile when RF = 075
Figure 2 Resource profiles when RF = 025 and RF = 075 for a network with I2 = 065 and
RS = 025
The Resource Utilization factor (RU) was calculated as shown in Equation (2) where rk is the
amount of resources of type k required by an activity i and Rk is the maximum amount of resources
55
of type k required by the activity i An example of how the RU factor is calculated for an activity
and a project is provided in Table 1
RUi = sumrk
RkK
(Eq 2)
Table 1 Sample Calculation of RU
ID R1 R2 R3
Resource Utilization (RU) Resource
Availability Max 12 Max 11 Max 13
A1 5 7 1 RUA1 = (512) + (711) + (113) = 113
A2 0 4 8 RUA2 = (411) + (813) = 098
Project RU = (113 + 098)2 = 105
The RU factor of the 30 networks with a RF = 025 ranges from 010 to 050 and that of the 112
networks with a RF = 075 ranges from 025 to 15 Table 2 shows a summary of the
characteristics of the 142 generated networks All networks have in common a I2 = 065 and a
RS = 025
Table 2 Sample Characteristics (N = 142 Networks)
Resource Factor (RF) 025 075 025 and 075
No Networks 30 112 142
No Activities 30 - 80 30 ndash 90 30 ndash 90
Network Complexity (NC) 140 ndash 165 140 - 162 140 ndash 165
No Type of Resources 1 - 3 1 - 3 1 - 3
Resource Utilization (RU) 012 ndash 046 028 ndash 134 012 ndash 134
Performance Criteria
Eight existing priority rules were considered to evaluate and compare the performance of the
Enhanced LF heuristic proposed in this study These heuristics were selected based on the
opportunity to perform each of them in Primavera P6 Primavera allows the user to select specific
parameters as priority rules and combined them as preferred when mitigating the resource supply-
demand problem in a schedule The eight heuristics are described below In all cases ties were
broken by the smallest activity number (ID)
Minimum Total Float (Min Slack) Priority is given to activities with the lowest Total Float
(TF) (Davis and Patterson 1975 Patterson 1976)
Shortest Duration Priority is given to activities with the shortest duration (D) (Davis and
Patterson 1975 Patterson 1976)
Longest Duration Priority is given to activities with the longest duration (D) (Davis and
Patterson 1975)
56
Minimum Late Finish Priority is given to activities with the earliest values of Late Finish
(LF) (Davis and Patterson 1975)
Minimum Late Start Priority is given to activities with the earliest values of Late Start
(LS)
Late Start Sort Priority is given to activities with the earliest values of Late Start (LS) If
there is a tie with respect to the LS priority is given to the activity with the least duration
(D) If the tie persists priority is given to the activity with the least total float (TF)
Earliest Start Time Priority is given to activities with the earliest values of Early Start
(ES)
Earliest Finish Time Priority is given to activities with the earliest values of Early Finish
(EF)
The eight existing heuristics plus the Enhanced LF heuristic were applied to the 142 generated
networks using Primavera P6 All heuristics were tested under a serial approach (P6 default
method) The CPM duration was considered as the benchmark to compare the durations obtained
with each heuristic The percentage increase in the project duration (after applying RCS) with
respect to the CPM duration was considered as an indicator to measure the performance of the
heuristics The indicator was calculated as the difference (time units) between the heuristic
duration and the CPM duration as a percentage of the CPM duration
Furthermore the performance of each heuristic relative to one another was assessed considering
the number of times each heuristic produces the shortest and longest schedules The number of
times producing the shortest duration was considered as a consistent measure of a heuristic
performance Based on the results of previous studies and given the variable nature of heuristics
a consistency rate of at least 60 is preferred Ideally heuristics with good performance will have
1) a lower percentage of deviation in the project duration 2) a higher percentage of times
producing the shortest duration (not optimum) and 3) a lower percentage of times producing the
largest duration
The performance of the heuristics was also evaluated in terms of the Resource Factor (RF) and
Resource Utilization (RU) of the networks To this end networks were classified according to the
RF and RU values shown in Table 3 These values have been commonly used in literature to
compare heuristicsrsquo performance (Ulusoy 1989) One network with a RF = 075 was excluded
from the analysis because its RU (134) did not fit the last range considered in the classification
system (10 ndash 125) As a result the final sample of this study consists of 141 networks
Table 3 Networksrsquo Classification by RF and RU
N =
14
1
RF = 025
N = 30
RU 010 - 025 N = 12
RU 025 - 050 N = 18
RF = 075
N = 111
RU 025 - 050 N = 38
RU 050 - 075 N = 35
RU 075 - 100 N = 18
RU 100 - 125 N = 20
57
Statistical Analysis
The sample size of this study was selected to guarantee a power greater than 090 in the non-
parametric tests performed The power represents the probability of rejecting the Null Hypothesis
(H0) when the Alternative Hypothesis (Ha) is true The higher the power the lower the chance of
having a Type Error II (Failing to reject Ho when it is false) and the better the probability of finding
a difference between the two groups of analysis (Elliot 2007)
Due to the similarity in the results among the heuristics the Sign Test was performed to ascertain
whether the Enhanced LF heuristic produced better results than a specific existing heuristic when
there was not a tie in the results Each time the test compared the differences in the increase of
project duration obtained by the Enhanced LF heuristic and an existing heuristic (microd) (see Equation
3) By excluding the number of times both heuristics produce the same result (tie) it is possible to
statistically determine whether the Enhanced LF heuristic outperformed a specific existing
heuristic
microd = micro₁ minus micro₂ (Eq 3)
In Equation 3 microd is the difference in the average increase between the two paired heuristics micro₁ is
the mean of the average percentage increase of project duration above the CPM duration obtained
by an existing heuristic j and micro₂ is the mean of the average percentage increase of project duration
above the CPM duration obtained by the Enhanced LF heuristic
Positive differences will occur if the existing heuristic (j) produces higher deviations from the
CPM duration than the Enhanced LF heuristic Conversely negative differences will occur if the
existing heuristic (j) produces lower deviations from the CPM duration than the Enhanced LF
heuristic The difference (microd) will be equal to zero if both heuristics obtained the same results (tie)
The hypothesis being examined by the Sign test are
H0 The probability of a positive difference is equal to the probability of a negative
difference
Ha The probability of a positive difference is greater than the probability of a negative
difference
If the Alternative Hypothesis (Ha) is accepted (p le 005) it is more likely to find lower durations
with the Enhanced LF heuristic than with a specific existing heuristic when the two paired
heuristics do not find the same solution All the statistical tests were performed at a confidence
level α = 005
The Sign Test was applied because it is not possible to assume that the differences in the increase
of duration by the two heuristics analyzed each time have an approximately normal distribution
The results of the Anderson-Darling goodness of fit test indicated the data (microd) do not follow a
normal distribution (for all cases AD between 5 and 10 p le 005) Additionally as it is expected
in a paired-sample test the data are related to each other
58
Results
The heuristicsrsquo performance was first analyzed by considering all networks of the sample as a
single group ie networks with a RF equal to 025 and 075 (see Table 4) Table 5 shows the
results of the average percentage increase over the CPM duration after applying the eight existing
heuristics and the Enhanced LF in each of the 141 networks and the percentage of times each
heuristic produced the shortest and longest durations
Table 4 Networksrsquo Classification (N = 141)
N
= 1
41
RF = 025
N = 30
RU 010 - 025 N = 12
RU 025 - 050 N = 18
RF = 075
N = 111
RU 025 - 050 N = 38
RU 050 - 075 N = 35
RU 075 - 100 N = 18
RU 100 - 125 N = 20
Although the Enhanced LF heuristic produced the lowest average increase above the CPM duration
(112 ) there is not enough statistical evidence to conclude that it is significantly better than the
following three heuristics with the lowest average increase in the duration (ES+ID LS+ID and
LS+D+TF+ID) The slight difference in the average percentage increase among the top four
heuristics is because when the Enhanced LF did not produce the shortest duration it produced the
second shortest duration
Table 5 Results N = 141 RF = 025 and 075
Heuristic Average
Increase
Minimum
()
Maximum
()
Shortest
Duration
Longest
Duration
Enhanced LF 112 13 313 592 56
ES + ID 113 03 291 585 35
LS + ID 114 11 327 577 21
LS + D + TF + ID 114 11 327 563 35
LF + ID 117 03 327 472 63
Min TF + ID 121 16 327 415 155
Longest D + ID 123 16 327 437 218
EF + ID 125 11 313 268 268
Shortest D + ID 134 11 312 190 486
The heuristics that performed the worst were the Shortest Duration+ID followed by the EF+ID
They produced the largest deviations in the networks (134 and 125 respectively) Previous
studies also have found that the Shortest Duration+ID produced the worst results (Davis 1975)
The Sign Test results indicate that there is enough statistical evidence to conclude that the
Enhanced LF heuristic produced significantly lower deviations than the LF+ID Min TF+ID
Longest Duration + ID EF+ID and Shortest Duration+ID heuristics For all cases p-value = 0001
(see Table 6) Although there is not sufficient statistical evidence to ascertain that the Enhanced
59
LF outperformed the other top three heuristics the Enhanced LF produced lower durations
(positive differences microd) more frequently than the LS+D+TF+ID (43 vs 37) and the LS+ID (44 vs
40) when there was not a tie in the results When the Enhanced LF was compared with the ES+ID
the later produced one shorter schedule more than the former (40 vs 41)
Table 6 Sign Test Results N = 141 RF = 025 and 075
Comparison No Ties No Positive
Differencesa Z-value p-value
LF + ID
Enhanced
LF
69 50 - 318 0001
Longest D + ID 44 68 - 385 0001
Min TF + ID 47 69 - 443 0001
EF + ID 47 75 - 567 0001
Shortest D + ID 38 97 - 886 0001
LS + D + TF + ID 61 43 - 055 0288
LS + ID 57 44 - 032 0372
ES + ID 60 40 000 0500 a Number of times the Percentage Increase over the CPM of an existing heuristic was higher than
that obtained by the Enhanced LF
Tiebreaker Influence
Figure 3 shows a comparison of the percentage increase over the CPM duration and the number
of times a heuristic produced the shortest and longest schedules when different tiebreakers were
considered as second sort parameters of the LF and LS rules
Figure 3a Late Finish (LF) with different Tie
Breakers
Figure 3b Late Start (LF) with different Tie
Breakers
Figure 3 Influence of a Tiebreaker in the LS and LF rules (N = 141 RF = 025 and RF = 075)
As can be observed in Figure 3a the performance of the LF was better when it was combined with
the Priority Number (Pn) rather than with the activity ID or TF ie the average percentage increase
over the CPM duration was lower with the Pn (112) and shortest schedules were obtained more
frequently (592) Unlike the LF+ID and LF+Pn (Enhanced LF) the LF+TF did not generate
schedules with the longest duration
60
The Sign Test results indicate that the LF rule leads to better results when it is combined with the
Pn (p = 0001) than with the activity ID (p = 0187) Specifically the LF+Pn (Enhanced LF)
produced 28 shorter schedules more than the LF+ID when both heuristics did not get the same
results (ties = 69) Otherwise the Sign Test did not find enough statistical evidence to assert that
the Pn yields to a better performance than the TF when used as a tiebreaker of the LF (see Table
7 p = 0187) Noteworthy when there was not a tie in the results the LF+Pn (Enhanced LF)
produced 9 shorter schedules more than the LF+TF
Table 7 Sign Test Results (N =141 RF = 025 and RF = 075)
Comparison No Ties No Positive
Differences Z-value p-value
LF + TF Enhanced
LF
60 45a -088 0187
LF + ID 69 50a - 318 0001
LS + TF LS + D + TF +ID
130 6b - 0254
LS + ID 132 3b - 0254 a Number of times the Percentage Increase over the CPM of either the LF+TF and LF+ID was
higher than that obtained by the Enhanced LF
b Number of times the Percentage Increase over the CPM of either the LS+TF or LS+ID was higher
than that obtained by the LS+D+TF+ID
The LS rule produced almost the same results whether it is combined with the TF D or activity
ID (see Figure 3b) For all three instances the average percentage increase in the CPM duration
was about 114 This consistency can be corroborated by the number of times each pair of
heuristics obtained the same networksrsquo duration In the case of the LS+ID vs LS+D+TF+ID it
happened 132 times and in the case of LS+TF vs LS+D+TF+ID it occurred 130 times
Due to the similarity in the results the Sign Test did not find any significant difference between
the three tiebreakers used for the LS For all cases the p = 0254 (see Table 7) There is only a
slight difference in the number of times each LS heuristic produced the shortest and longest
schedules The LS+ID produced 577 shortest schedules meanwhile the other two LS rules
produced 563 schedules Unlike the LS+ID and LS+D+TF+ID the LS+TF did not generate
schedules with the longest duration
Classification by RF = 025
The sample networks were classified by RF equal to 025 (see Table 8) Table 9 shows the
summary of the average percentage increase over the CPM duration the percentage of times each
heuristic produced the shortest and longest duration for the 30 networks with RF = 025
The LS+D+TF+ID heuristic produced the lowest average increase above the CPM duration (45)
and the ES+ID produced the shortest schedules more frequently than any other heuristic (933)
Although the Enhanced LF and the LS+D+TF+ID heuristics found the shortest duration the same
number of times (900) the LS+D+TF+ID heuristic produced a lower increase in the project
duration (see Table 9) Overall the top four heuristics (LS+D+TF+ID ES+ID Enhanced LF and
61
LS+ID) 1) had a lower average percentage increase above the CPM duration 2) found the shortest
duration more frequently and 3) found the worst duration (longest duration) less frequently
Table 8 Networksrsquo Classification by RF = 025
N =
14
1
RF = 025
N = 30
RU 010 - 025 N = 12
RU 025 - 050 N = 18
RF = 075
N = 111
RU 025 - 050 N = 38
RU 050 - 075 N = 35
RU 075 - 100 N = 18
RU 100 - 125 N = 20
Table 9 Results RF = 025 and N = 30
Heuristic Average
Increase
Minimum
()
Maximum
()
Shortest
Duration
Longest
Duration
LS + D + TF + ID 45 04 118 900 00
ES + ID 46 04 125 933 33
Enhanced LF 46 04 146 900 67
LS + ID 47 04 139 867 00
LF + ID 50 04 146 733 100
Min TF + ID 52 04 153 733 167
Longest D + ID 52 04 132 633 200
EF + ID 53 14 132 600 267
Shortest D + ID 60 14 183 400 467
The heuristics that performed the worst were the Shortest Duration +ID (60) followed by the
EF+ID (53) Due to the high consistency of the results among the top heuristics (900) the
Sign Test only found evidence to indicate that the Enhanced LF heuristic produces significantly
lower deviations than the EF+ID and Shortest Duration +ID (see Table 10) Worthy of note the
Enhanced LF produced lower durations (positive differences microd) more frequently than the Longest
Duration +ID (9 vs 3) EF+ID (9 vs 1) LF+ID (6 vs 2) and Min TF+ID (7 vs 2) when there was
not a tie in the results When the Enhanced LF was compared with the ES+ID and LS+D+TF+ID
both heuristics produced one shorter schedule more than the Enhanced LF
Table 10 Sign Test Results RF = 025 and N = 30
Comparison No Ties No Positive
Differencesa p-value
LF + ID
Enhanced
LF
22 6 0145
Longest D + ID 18 9 0073
Min TF + ID 21 7 0090
EF + ID 20 9 0011
Shortest D + ID 14 15 0001
LS + D + TF + ID 25 2 0500
ES + ID 25 2 0500
62
LS + ID 24 3 0656 a Number of times the Percentage Increase over the CPM of an existing heuristic was higher than
that obtained by the Enhanced LF
Classification by Resource Utilization (RU)
Table 12 and Table 13 show a comparison of the percentage increase over the CPM duration and
the number of times each heuristic produced the shortest and longest schedules when 30 networks
with RF = 025 were classified according to the RU factor (see Table 11)
Table 11 Networksrsquo Classification by RF = 025 and RU
N =
141
RF = 025
N = 30
RU 010 - 025 N = 12
RU 025 - 050 N = 18
RF = 075
N = 111
RU 025 - 050 N = 38
RU 050 - 075 N = 35
RU 075 - 100 N = 18
RU 100 - 125 N = 20
When networks have a RU between 010 and 025 either the ES+TF+ID or ES+ID rules obtained
the best results Both heuristics produced the lowest average percentage increase above the CPM
duration (33) and found the shortest durations all the time (See Table 12) Although four
heuristics found the second-lowest deviation from the CPM duration (34) the Enhanced LF
heuristic obtained the highest number of shortest schedules (916) The heuristics that performed
worst were the Shortest Duration +ID (59) followed by the EF+ID (46) Worthy of note half
of the schedules obtained by the Shortest Duration +ID have the longest duration
Table 12 Networksrsquo Classification by RU between 010 and 025 (RF = 025 N = 30)
Heuristic Average Increase Shortest
Duration
Longest
Duration
ES + TF + ID 33 1000 00
ES + ID 33 1000 00
Enhanced LF 34 916 83
LF + ID 34 833 00
LS + ID 34 833 00
LS + D + TF + ID 34 833 00
Min TF + ID 37 750 00
Longest D + ID 39 666 166
EF + ID 46 583 166
Shortest D + ID 59 416 500
When networks have a RU between 025 and 050 the LS+D+TF+ID obtained the lowest average
percentage increase above the CPM duration (53) and the shortest schedules more frequently
(940) (See Table 13) Under this scenario the LS+D+TF+ID did not find any longest schedule
63
The Enhanced LF was the second heuristic with the highest number of times producing shortest
schedules (889) The heuristics that performed the worst were the Min TF+ID followed by the
Shortest Duration +ID (62) Despite the Min TF+ID produced a significant number of schedules
with the shortest duration (722) it obtained the highest average percentage increase in the
project duration In other words the Min TF+ID produced higher deviations from the CPM
duration than the other rules when it did not work
Table 13 Networksrsquo Classification by RU between 025 and 050 (RF = 025 N = 30)
Heuristic Average Increase Shortest Duration Longest Duration
LS + D + TF + ID 53 940 00
ES + TF + ID 54 833 00
Enhanced LF 55 889 56
ES + ID 56 833 56
LS + ID 56 833 00
EF + ID 58 611 278
LF + ID 60 667 167
Longest D + ID 60 611 222
Shortest D + ID 62 389 444
Min TF + ID 62 722 278
Classification by RF = 075
The sample networks were classified by a RF equal to 075 (see Table 14) Table 15 shows the
summary of the average percentage increase over the CPM duration the percentage of times each
heuristic produced the shortest and longest duration for the 111 networks of the sample with a
RF = 075
Table 14 Networksrsquo Classification by RF = 075
N =
141
RF = 025
N = 30
RU 010 - 025 N = 12
RU 025 - 050 N = 18
RF = 075
N = 111
RU 025 - 050 N = 38
RU 050 - 075 N = 35
RU 075 - 100 N = 18
RU 100 - 125 N = 20
The Enhanced LF produced the lowest average increase above the CPM duration (128) and the
shortest schedules more frequently than any other heuristic (509) Overall the top three
heuristics (Enhanced LF LS+ID and ES+ID) 1) had a lower average percentage increase above
the CPM duration 2) found the shortest duration more frequently and 3) found the worst (longest)
duration less frequently (see Table 15) The heuristic that performed the worst was the Shortest
Duration +ID (152)
64
Table 15 Results N = 111 and RF = 075
Heuristic Average
Increase
Minimum
()
Maximum
()
Shortest
Duration
Longest
Duration
Enhanced LF 128 12 302 509 54
LS + ID 130 11 291 500 27
ES + ID 130 03 291 482 45
LS + D + TF + ID 130 11 291 473 45
LF + ID 134 03 302 402 71
Min TF + ID 138 12 291 330 152
Longest D + ID 141 12 323 384 214
EF + ID 143 11 312 188 268
Shortest D + ID 152 11 312 134 482
The influence of a tiebreaker in the LF and LS rules can be also noticed in Table 15 The Pn as a
tiebreaker of the LF leads to a lower average percentage increase in the project duration (128)
and a higher number of schedules with the shortest duration (509) than the activity ID as a
tiebreaker of the LF On the other hand the LS produced lower deviations from the CPM duration
and the shortest schedules more frequently when it was combined with the activity ID rather than
with the duration and total float
When networks have a RF equal to 075 the performance of the heuristics is not as consistent as
it is when networks have a RF equal to 025 When the RF = 075 the best heuristic (Enhanced
LF) found the shortest durations 509 of the time (see Table 15) When RF = 025 the best
heuristic (LS+D+TF+ID) found the shortest durations 900 of the time (see Table 9)
The Enhanced LF outperformed the LF+ID Min TF+ID Longest Duration +ID EF+ID and
Shortest Duration +ID heuristics For all cases the p-values were lower than 0001 (See Table 16)
The Sign Test did not find enough evidence to conclude that the Enhanced LF produces
significantly lower deviations than the LS andor ES heuristics (p gt 020) However the
Enhanced LF produced lower durations (positive differences -microd) more frequently than the
LS+D+TF+ID (41 vs 34) and LS+ID (41 vs 37) Otherwise the ES+ID and the Enhanced LF
produced the same number of shortest schedules (38)
Table 16 Sign Test Results N = 111 and RF = 075
Comparison No Ties No Positive
Differencesa Z-value p-value
LF + ID
Enhanced
LF
47 44 -287 0002
Longest D + ID 26 59 -347 0001
Min TF + ID 26 62 -412 0001
EF + ID 27 66 -512 0001
Shortest D + ID 24 82 -814 0001
LS + D + TF + ID 36 41 -069 0244
ES + ID 35 38 000 0546
LS + ID 33 41 -034 0367
65
Classification by Resource Utilization (RU)
Tables 18 - 20 show the percentage increase over the CPM duration and the number of times each
heuristic produced the shortest and longest schedules when the 111 networks with RF = 075 were
classified by RU (see Table 17) As stated by Davis 1975 the heuristic performance is affected by
the RU The greater the proportion of resource requirement per activity relative to the amount
available the greater the increase in the project duration after mitigating the resource supply-
demand problem
Table 17 Networksrsquo Classification by RF = 075 and RU
N =
14
1
RF = 025
N = 30
RU 010 - 025 N = 12
RU 025 - 050 N = 18
RF = 075
N = 111
RU 025 - 050 N = 38
RU 050 - 075 N = 35
RU 075 - 100 N = 18
RU 100 - 125 N = 20
When networks have a RU between 025 and 050 the ES+TF+ID produced the lowest average
percentage increase in the project duration (84) (See Table 18) The ES+TF+ID followed by
ES+ID produced the shortest schedules more frequently than any other rule (684 and 631
respectively) The LS+ID and LS+D+TF+ID produced the same number of schedules with the
shortest duration but the LS+ID produced a lower increase in the duration than the LS+D+TF+ID
The heuristics that performed the worst were the Shortest Duration +ID (107) followed by the
EF+ID (96)
Table 18 Networksrsquo Classification by RU between 025 and 050 (RF = 075 N= 38)
Heuristic Average Increase Shortest Duration Longest Duration
ES + TF + ID 84 684 00
LS + ID 85 526 26
LS + D + TF + ID 86 526 26
ES + ID 86 631 53
Enhanced LF 87 474 79
LF + ID 89 474 79
Min TF + ID 91 394 132
Longest D + ID 95 316 211
EF + ID 96 263 211
Shortest D + ID 107 184 500
When networks have a RU between 050 and 075 the Enhanced LF obtained the lowest average
percentage increase above the CPM duration (125) and the shortest schedules more frequently
(628) Under this scenario the Enhanced LF did not find any longest schedule (See Table 19)
The LS+ID was the second heuristic with the highest number of times producing shortest schedules
(514) The ES+TF+ID produced the second-lowest average increase in the duration (129) but
it only worked 371 of the time The ES+ID only worked 343 of the time for this scenario
66
with an average percentage increase above the CPM duration of 131 The heuristics that
performed the worst were the Shortest Duration +ID (159) followed by the EF+ID (146)
Table 19 Networksrsquo Classification by RU between 050 and 070 (RF = 075 N= 35)
Heuristic Average Increase Shortest Duration Longest Duration
Enhanced LF 125 628 00
ES + TF 129 371 00
LS + ID 131 514 00
ES + ID 131 343 28
LS + D + TF + ID 131 496 00
LF + ID 137 371 28
Min TF + ID 143 228 143
Longest D + ID 145 371 228
EF + ID 146 114 286
Shortest D + ID 159 86 514
When networks have a RU between 075 and 100 the heuristicsrsquo performance is poor ie the
consistency in the results for each heuristic was lower than 56 (See Table 20) More heuristics
should be tested under this scenario in order to identify a more efficient heuristic (percentage of
consistency of at least 60) The ES+TF+ID produced the shortest schedules more frequently
(555) than any other rule However it produced a higher average increase in the project duration
(147) than the ES+ID (144) The heuristics that performed the worst were the Shortest
Duration +ID (170) followed by the Min TF+ID (163)
Table 20 Networksrsquo Classification by RU between 075 and 100 (RF = 075 N= 18)
Heuristic Average Increase Shortest Duration Longest Duration
ES + ID 144 500 55
ES + TF + ID 147 555 00
Enhanced LF 148 333 55
LS + ID 150 333 55
LS + D + TF + ID 151 278 167
LF + ID 153 278 111
Longest D + ID 158 333 111
EF + ID 160 167 278
Min TF + ID 163 278 333
Shortest D + ID 170 55 500
When networks have a RU between 100 to 125 the LS+ID obtained the lowest average
percentage increase above the CPM duration (192) and the shortest schedules more frequently
(60) Additionally the LS+ID did not find any longest schedule (See Table 21) The ES+TF+ID
produced the same number of shortest schedules than the LS+ID (60) but the former produced
higher deviations from the CPM duration (197) than the LS+ID (192) Similarly the
Enhanced LF produced the same number of shortest schedules than the LS+D+TF+ID (55) but
the former produced higher deviations from the CPM duration (196) than the LS+ID (194)
Worthy of note the ES+ID only worked 45 of the time for this scenario with an average
67
percentage increase above the CPM duration of 198 The heuristics that performed the worst
were the Shortest Duration +ID (212) followed by the EF+ID (208)
Table 21 Networksrsquo Classification by RU between 100 and 125 (RF = 075 N= 20)
Heuristic Average Increase Shortest Duration Longest Duration
LS + ID 192 600 00
LS + D + TF + ID 194 550 00
LF + ID 195 450 50
Enhanced LF 196 550 100
ES + TF + ID 197 600 00
Min TF + ID 197 450 00
ES + ID 198 450 50
Longest D + ID 204 550 250
EF + ID 208 200 300
Shortest D + ID 212 200 400
Heuristics Selection
A matrix that classifies the performance of the heuristics was created based on the results obtained
in this study (see Table 22) The matrix was developed for networks with a SerialParallel Indicator
(I2) equal to 065 a Resource Strenght (RS) equal to 025 and a Network Complexity (NC) equal
to 15 (on average three successors per activity) Although the size of the network has been reported
as another influential parameter of heuristic performance it was not considered in the classification
system due to the fact that real construction projects have a significant number of activities that
are challenging to simulate and test by scholars (Boctor 1996 Zhan 1994) The two parameters
required to select a heuristic in the matrix are the Resource Factor (RF) and the Resource
Utilization factor (RU) These two resource measures can be easily simulated and tested Besides
they are calculated as a function of the number of total activities of the project
The matrix indicates the two heuristics with better performance for each of the scenarios
considered Given the variable nature of heuristics it is recommended to apply both options to
determine which one gives the best solution (shortest duration but not optimum) If the matrix is
empty it means that networks with the specified resource characteristics were not tested in this
study
The heuristic labeled as Option 1 is the one that produced the lowest increase in the project duration
and the shortest schedules more frequently The heuristic labeled as Option 2 is the second
heuristic which had the highest number of times producing the shortest schedules regardless of
the average increase in the project duration If there was a tie with respect to the number of times
producing the shortest duration (consistency rate) the heuristic that produced the lowest average
increase in the project duration was selected as Option 2 In real construction projects even one
day of difference in the completion time can significantly impact the budget
68
Table 22 Classification Matrix based on Heuristicsrsquo Performance
RU RF = 025 RF = 075
Option 1 Option 2 Option 1 Option 2
010 ndash 025 ES + TF + ID or ES + ID Enhanced LF - -
025 ndash 050 LS + D + TF + ID Enhanced LF ES + TF + ID ES + ID
050 ndash 075 - - Enhanced LF LS + IDa
075 ndash 100 - - ES + IDb ES + TF + IDb
100 ndash 125 - - LS + ID ES + TF + ID a Consistency rate ( Shortest Duration) lower than 50 b Consistency rate ( Shortest Duration) lower than 55
The LS has been reported as one of the heuristics that produces better results (lower deviations
from the CPM duration) by several authors However as shown in Table 17 the performance of
the LS is better and more consistent when the RF of the networks equals 025 and the RU ranges
from 025 to 050
Real construction projects have a significant amount of activities Therefore calculating the RU
and RF values for each activity can be time-consuming To overcome this issue practitioners could
rough estimate the degree of a project resource demand by randomly selecting 20 of the activities
to calculate these two resource parameters Table 23 shows the results obtained for two projects
after following this approach Although there is a slight difference in the RU rough estimate for
P2 (073) in comparison with the actual value (065) the estimated value (073) falls in the range
associated with the actual value (See Table 17)
Table 23 Rough Estimate of the RU and RF
Project
ID
No
Activities
No Type
Resources
RF RU
Rough Estimate Actual Rough Estimate Actual
1 49 3 077 075 112 105
2 73 2 077 075 073 065
As future research another heuristic that yields to more consistent results when the RF is equal to
075 and the RU ranges from 075 to 100 should be identified For this scenario the two heuristics
selected as Option 1 and Option 2 in the matrix (ES+ID and ES+TF+ID) produced the shortest
schedules only 55 of the time Heuristics with a higher consistency rate are preferred (at least
60) Similarly when the RU ranges from 050 to 075 the LS+ID (Option 2) only worked 50
of the time The same matrix should be developed but this time for networks with a RF equal to
050 and 1
Discussion
None of the heuristics produced the best results for all the 141 networks However the Enhanced
LF heuristic produced the shortest duration more frequently than any other heuristic (592) This
percentage is low but similar to some values obtained in previous studies For instance Davis
69
(1975) reported that the Min TF+ID heuristic found the shortest duration 60 of the times
followed by the LF+ID with a percentage of 46 The heuristic proposed by Boctor (1976) which
was the best among the other heuristics tested found the best solution 54 of the time Ulusoy
(1989) found that the WRUP and LF+ID obtained the best results for 75 of the time Otherwise
Boctor (1993) reported that only 30 of the times the best solution was found by a heuristic
In previous studies few authors have tested the performance of early CPM dates (ES and EF) as
major rules to sort activities The majority of them have focused on evaluating the efficacy of late
CPM dates such as the LS and LF In this study when evaluating the 141 networks (RF = 025 and
075) the ES+ID obtained the second-lowest average percentage increase over the CPM duration
(113) and produced the shortest schedules 585 of the times Moreover it was the only rule
that produced the lowest maximum percentage increase (291) and alongside the LF+ID
produced the lowest percentage increase over the CPM duration (03)
The results of this paper reinforce the statement that certain heuristics work better for certain type
of networks than for others Besides the LS+ID the Min TF+ID and the LF+ID have been reported
in the literature as the most effective heuristics minimizing the project duration (Kolish 1995
Ulusoy 1989 Davis 1975 Chen et al 2018) However in this study the performance of these
two heuristics (Min TF+ID and LF+ID) is poor in terms of the average percentage increase over
the CPM duration and the number of times producing the shortest and largest schedules (see Table
4) These opposing results emphasize the need for determining under which network and resource
characteristics heuristics produce better results A heuristic classification system will help
practitioners to decide which heuristic applies when mitigating the resource supply-demand
problem given the project characteristics
On the other hand the main parameter for sorting the activities significantly influences the
resulting schedule However if a tie exists the tiebreaker also influences the resulting schedule
Therefore schedulers should carefully select the tiebreaker of a heuristic not doing so may lead
to obtaining longer schedules if a tie exists The highest number of longest schedules was obtained
when the activity ID was considered as a tiebreaker of either the LS or LF
Future Research and Limitations
The eight existing heuristics tested in this study were selected based on the opportunity to apply
them using scheduling software However other heuristics such as the Resource Scheduling
Method (RSM) the Greatest Rank Positional Weight (GRPW) and the Weighted Resource
Utilization and Precedence (WRUP) should be tested under the same scenarios since they have
been reported in previous studies as priority rules with good performance
Additionally all heuristics were evaluated under a serial approach Given the differences between
the serial and parallel methods the heuristics should be tested under a parallel approach as well
This classification will provide practitioners the option of splittinginterrupting the work which
may be beneficial for some activities and may also reduce the project completion time
The matrix developed in this study is a point of departure for the development of a more complete
classification system for the industry The results of this study are limited to networks with I2=
70
065 RS = 025 NC = 150 and RF = 025 and 075 The classification system should be extended
so other common values of RF RS and NC can be included
Conclusion
This study proposed a new tiebreaker (Priority Number - Pn) that considers the duration and total
float of the activities The Pn enhanced the performance of the LF priority rule Lower deviations
from the CPM duration and a higher number of shortest schedules were obtained when the LF was
combined with Pn than when the LF was combined with the total float or activity ID The Enhanced
LF produced lower deviations than the LS when both heuristics did not get the same results This
study recommends using the Pn as a tiebreaker of the LF and either the duration or total float as a
tiebreaker of the LS
Overall the heuristics with good performance are LS Enhanced LF and ES The average increase
in the project duration obtained by these three rules compares favorably with the results obtained
by the other priority rules tested in this study The ES+ID and ES+TF have the potential of being
considered as one of the top heuristics since its performance is good and consistent for specific
project parameters Otherwise the Shortest Duration+ID and EF+ID heuristics are inappropriate
choices when attempting to minimize the project duration Both produced the largest deviations in
the networks for all the scenarios analyzed in this study
The heuristicsrsquo performance is more consistent (number of times producing the shortest schedules)
when the proportion of resource types required per activity is low (RF = 025) When the RF =
075 the rate of consistency is less than 60 This reinforces the fact that some rules may work
better for specific project characteristics than for others Therefore it is vital to identify under
which circumstances each one of the best heuristics produces good results
This study developed a matrix to help schedulers deciding which heuristic applies when mitigating
the resource supply-demand problem depending on the resource characteristics of a network (RF
and RU) Given the variable nature of heuristics the matrix indicates the two heuristics with better
performance for each of the scenarios considered As a best practice practitioners should perform
both heuristics and determine which one gives the best solution (shortest schedule) For real-life
purposes the decision of selecting a schedule with the shortest possible duration or an optimum
duration comes down to evaluating the viability of executing the schedule eg in terms of means
and methods or in terms of resource disruption
Data Availability Statement
Data generated by the authors can be found at Franco Duran (2019)
71
References
Abeyasinghe M C L Greenwood D J amp Johansen D E (January 01 2001) An efficient
method for scheduling construction projects with resource constraints International Journal of
Project Management DOIorg101016S0263-7863(00)00024-7
Alvarez-Valdes R and Tamarit JM (1989) Algoritmos heuristicos deterministas y aleatorios
en secuenciacion de proyectos con recursos limitados Questiio 13 173-191
Boctor F F (January 01 1993) Heuristics for scheduling projects with resource restrictions and
several resource-duration modes International Journal of Production Research 31 11 2547
DOIorg10108000207549308956882
Chen Z Demeulemeester E Bai D E amp Guo S (2018) Efficient priority rules for the
stochastic resource-constrained project scheduling problem European Journal of Operational
Research 270 3 957-967 DOIorg101016jejor201804025
Davis E W amp Patterson J H (April 01 1975) A Comparison of Heuristic and Optimum
Solutions in Resource-Constrained Project Scheduling Management Science 21 8 944-955
DOIorg101287mnsc218944
Demeulemeester E Vanhoucke M amp Herroelen W (January 01 2003) RanGen A Random
Network Generator for Activity-on-the-Node Networks Journal of Scheduling 6 1 17-38
DOIorg101023A1022283403119
Elliott A C amp Woodward W A (2007) Statistical analysis quick reference guidebook With
SPSS examples Thousand Oaks Calif Sage Publications DOIorg1041359781412985949
Gordon J H (January 01 1983) Heuristic methods in resource allocation International Journal
of Project Management 1 3 163-168 DOIorg1010160263-7863(83)90022-4
Franco Duran D Primavera P6 Schedules University Libraries Virginia
Tech DOIorg107294W4-5R6Z-D346
Kastor A amp Sirakoulis K (July 01 2009) The effectiveness of resource leveling tools for
Resource Constraint Project Scheduling Problem International Journal of Project
Management 27 5 493-500 DOIorg101016jijproman200808006
Kolisch R (1995) Project Scheduling under Resource Constraints - Efficient Heuristics for
Several Problem Classes Physical Heidelberg
Kolisch R (January 01 1996) Serial and parallel resource-constrained project scheduling
methods revisited Theory and computation European Journal of Operational Research 90 2
320-333 DOIorg1010160377-2217(95)00357-6
72
Marimuthu K Palaneeswaran E Benny R amp Ananthanarayanan K (July 15 2018) Resource
Unconstrained and Constrained Project Scheduling Problems and Practices in a Multi-project
Environment Advances in Civil Engineering 2018 DOIorg10115520189579273
Moder J J Phillips C R amp Davis E W (1983) Project Management with CPM PERT and
precedence diagramming (3rd ed ed) New York Van Nostrand Reinhold
Patterson J H (December 01 1973) Alternate methods of project scheduling with limited
resources Naval Research Logistics Quarterly 20 4 767-784
DOIorg101002nav3800200415
Patterson J H (March 01 1976) Project scheduling The effects of problem structure on heuristic
performance Naval Research Logistics Quarterly 23 1 95-123
DOIorg101002nav3800230110
Ulusoy G and Tzdamar L (1989) Heuristic performance and networkresource characteristics
in resource-constrained project scheduling Journal of the Operational Research Society 40 1145-
1152 DOIorg101057jors1989196
Zhan J (1994) Heuristics for scheduling resource-constrained projects in MPM
networks European Journal of Operational Research 76 1 192-205 DOIorg1010160377-
2217(94)90016-7
73
CHAPTER 4
Application of An Enhanced Resource-Constrained Critical Path Method (eRCPM) to
Non-progressed and Progressed Schedules
Abstract
The Resource-Constrained Critical Path Method (RCPM) is a method that identifies resource-
dependent activity relationships (links) when mitigating a resource-supply demand problem These
resource links allow the identification of a continuous critical path and the calculation of correct
float values Even though RCPM provides more reliable float values than traditional RCS
algorithms there are some shortcomings that must be addressed to enhance its capability and make
it more practical for real construction projects
This paper presents the application of an Enhanced RCPM (eRCPM) in non-progressed and
progressed resource-constrained schedules The eRCPM 1) performs three different serial-based
resource-constrained scheduling heuristics 2) keeps and removes specific resource links in a
progressed schedule before re-running eRCPM 3) selects a resource link configuration when
having many possible resource-driven activities and 4) selects a default schedule after evaluating
some schedule characteristics
Additionally an eRCPM system was developed and integrated with Primavera P6 The
development of the eRCPM computerized system allows the identification of a continuous critical
path in resource-constrained schedules in a practical way Besides construction professionals can
use these eRCPM schedules to perform delay analysis in scheduling software such as Primavera
P6
Keywords phantom float Primavera P6 resource overallocation resource-constrained
scheduling resource-depend activity relationships
Introduction
The baseline schedule is frequently used to track project performance Resources as a key
component of schedules must be also monitored to prevent or mitigate any extension on the project
completion time as a result of resource availability When the resource demand exceeds the supply
(overallocation) activities must be delayed until resources become available
Due to the projectsrsquo size and complexity schedulers use scheduling software such as Primavera
P6 or Microsoft Project to fix the resource conflicts of a schedule Even though the software solves
the overallocation problem applying Resource-Constrained Scheduling (RCS) algorithms the
results show incorrect total float values and a broken critical path This happens because
CPM+RCS calculations suggest that activities have float but this float does not exist ndash hence the
named Phantom Float (Franco-Duran and de la Garza 2019)
74
The Resource-Constrained Critical Path Method (RCPM) is a method that correctly calculates the
floats of activities and identifies a continuous critical path in resource-constrained schedules (Kim
and de la Garza 2003) The RCPM provides more reliable float values than traditional RCS
methods but there are some shortcomings that must be addressed to enhance its capability and
make it more practical for real construction projects This study tackles some of the flaws of the
RCPM which are described in the following section and illustrates the application of the
Enhanced RCPM (eRCPM) with two cases studies
RCPM Shortcomings
Priority Rules
The RCPM applies the Late Start (LS) heuristic Heuristics are problem-dependent so they are
likely to be better in some situations than in others Some priority rules may work well for a project
but may not work well when applied to a different project (Wiest 1963) Even if the Project
Completion Time (PCT) obtained by two or more heuristics is the same the sequence of the
activities may be different (Rivera and Duran 2004) Since each heuristic works differently and
produces different schedule outcomes the eRCPM incorporates 1) two additional heuristics (ES
and Enhanced LF) and 2) a criterion to evaluate the resulting schedules and selects one as a default
Removal of Resource Links
When the RCPM was developed the objective was to solve the issue of a broken critical path in a resource-
constrained schedule Hence Kim and de la Garza (2003) did not explore the application of the RCPM for
control purposes further ie the use of resource links when updating a schedule
The updates on a baseline schedule could change the priority order identified by the RCS heuristic
to schedule the activities when an over-allocation problem exists When re-applying the RCPM
the resource links identified before updating the project may no longer be required andor new
resource links can be identified because of the changes in the schedule The existing resource links
should be removed from the schedule because they were identified based on previous and different
conditions If the links are kept they constrain the schedule
In this regard the RCPM removes all existing resource links before re-running the method (Kim
and de la Garza 2003) The eRCPM removes only the resource links located right to the data date
each time a project is updated and the algorithm is re-applied The eRCPM keeps the resource
links located left to the data date because the project was already executed based on these activitiesrsquo
configurations
Selecting Resource-Driving Activities
One issue that arises when identifying activity resource relationships is having different possible
links configurations between activities (Kim 2003 Nisar 2013) This occurs when having many
current activities with many predecessors (see Figure 1) The difference between the different
schedules that can be generated is not only the number of resource links created but also the
number of critical activities
75
Figure 1 Multiple Schedule Alternatives Example taken from Nisar Yamamoto amp Suzuki (2013)
According to Nisar Yamamoto amp Suzuki (2013) the resource dependences should be created in
a way the total number of relationships is minimized without violating the resource constraints
The goal is to not increase the complexity of the network with a high number of resource links
The RCPM does not incorporate any criteria to identify resource-driving activities Instead the
algorithm creates all possible resource links configurations between the activities under
consideration (Kim and de la Garza 2003)
The eRCPM considers the number of resources and the duration of the activities as the main criteria
to determine a resource-driving activity These parameters were selected because they may affect
the PCT An activity that demands higher resources is more likely to delay a project This activity
may be delayed since other activities may need some of the resources of this activity Moreover
the longer the duration of the activity the greater the impact on the PCT
RCPM Prototype System
The RCPM prototype system developed by Kim and de la Garza in 2003 for Project Planner (P3)
does not work for Primavera P6 because P6 is built on a different platform than P3 At present
there is a lack of practical mechanisms to identify resource relationships in P6 project schedules
The eRCPM was integrated with Primavera P6 by developing a system that reads project
information from a P6 project performs the necessary eRCPM procedures and updates the P6
project with the corresponding resource relationships
Enhanced Resource-Constrained Critical Method (eRCPM)
This section explains each of the steps of the eRCPM (see Figure 1b) The eRCPM keeps the main
steps of the RCPM (see Figure 1a) but it incorporates more steps to address the above-mentioned
shortcomings
76
System Primavera Project Planner (P3) System Primavera P6
1 CPM
2 Serial-Based RCS
21 Forward Pass Heuristic
LS + D + TF + ID
211 Creating RLs
22 Finding
Unidentified RLs
23 Backward Pass
with RLs
3 Finding Alternative
Schedules
0 Removing all
Existing RLs
RCPM
Figure 1a RCPM Figure 1b Enhanced RCPM (eRCPM)
Figure 1 Outline of the RCPM and eRCPM
Step 0 KeepingRemoving Resource Links
The eRCPM checks the status of each activity to determine whether a Resource Link (RL) should
be removed from or kept on the schedule When having a progressed schedule with resource
relationships the RLs are kept in the schedule if 1) both activities (predecessor and successor) are
already completed and 2) the predecessor activity is completed and the successor activity is in
progress Otherwise the RLs are removed from the schedule if 1) the two activities (predecessor
and successor) have not started yet and 2) the predecessor activity is completed but the successor
activity has not started (see Figure 2)
Figure 2 Keeping and Removing Existing Resource Links before re-applying RCPM
77
Step 1 Critical Path Method (CPM)
The eRCPM performs the CPM to find the early and late dates and float values of each activity
If there is a resource overallocation problem the algorithm mitigates the resource-supply demand
problem by applying resource-constrained heuristics
Step 2 Serial-based RCS heuristics with Resource Links
The eRCPM performs three different heuristics to mitigate a resource supply-demand problem 1)
Late Start (LS) 2) Enhanced Late Finish (LF) and 3) Early Start (ES) These three heuristics were
incorporated into the algorithm because they produce better results in terms of extending the
project duration than other existing priority rules (Franco Duran and de la Garza 2020) The
heuristics are performed under a serial approach eg activities are sorted as a single group and
then scheduled one at a time
1 In the Late Start heuristic the priority is given to activities with the earliest values of Late
Start (LS) If there is a tie with respect to the LS the priority is given to the activity with
the least duration (D) If the tie persists the priority is given to the activity with the least
total float (TF) If the tie persists the priority is given to the activity with the smallest
activity number (ID)
2 In the Enhanced LF heuristic the priority is given to activities with the earliest values of
Late Finish (LF) If there is a tie with respect to the LF the priority is given to the activity
with the lowest Priority Number (Pn) The Priority Number which is a new tiebreaker that
can be incorporated with any rule is calculated based on the duration (119863119894) and total float
(119879119865119894) of each activity (see Equation 1) If there is a tie with respect to the Pn the tie is
broken by the smallest activity number (ID) (Franco Duran and de la Garza 2020)
119875119899 =
119863119894
119879119865119894
(Eq 1)
3 In the Earliest Start heuristic the priority is given to activities with the earliest values of
Early Start (ES) If there is a tie with respect to the ES the tie is broken by the smallest
activity number (ID)
Step 21 Forward Pass
Step 211 - Creating Resource Links During the performance of any of the three RCS heuristics
mentioned above if there are not enough resources to execute an activity the activity is delayed
until resources become available The resources causing the current activity delay are released
from other activity completion (Kim and de la Garza 2003) Like the RCPM the eRCPM creates
a resource link (relationship) between the postponed activity (successor) and the preceding activity
that shares the same resources (resource-driving activity)
Step 212 - Selecting Resource-Driving Activities The eRCPM considers three different cases to
identify the ldquoresource-driving activityrdquo for the delayed task when having multiple alternatives
78
Case I One Type of Resources
When having one type of resources the eRCPM selects as a resource-driving the activity with the
highest number of resources If there is a tie with respect to the number of resources the activity
with the longest duration is selected If the tie persists the activity with the smallest activity ID is
selected as a resource-driving activity
For example in Figure 3 Activity A7 is delayed because of resource unavailability (ten resources
would be needed but only eight are available) Either A4 or A11 can be the resource-driving
activity of A7 For this scenario the traditional RCPM creates two resource links one between A4
and A7 and another between A11 and A7 The eRCPM creates only one link between A4 and A7
because A4 requires a higher number of resources than A7 (R = 2 vs R = 1)
Figure 3 Example of Case I One Type of Resources
Case II Two Types of Resources and 1 Conflicting Resource
When having two types of resources and only one conflicting resource type the eRCPM selects
as a resource-driving activity the activity with the highest number of conflicting resources If there
is a tie with respect to the higher number of resources the activity with the longest duration is
selected If the tie persists the activity with the highest number of the other type of resource is
selected If the tie persists the activity with the smallest activity ID is selected
In Figure 4 Activity A11 was delayed because of the resource unavailability of R1 Activities A2
A4 and A10 are the potential resource-driving activities of A11 The traditional RCPM creates
three RLs one between A11and A2 another between A11 and A4 and another between A11 and
A10 The eRCPM creates only a link between A10 and A11 In this case although A10 and A4
have the same higher number of the conflicting resource (R1 = 3) and the same duration (D = 7
Days) A10 requires more resources type 2 (R2 =2) than A4 (R2 =0)
79
Figure 4 Example Case II Two Types of Resources and One Conflicting Resource
Case III 2 or more Conflict Resources
When having two or more types of resources and several conflicting resource types the eRCPM
algorithm selects as a resource-driving activity the activity with the highest average number of
conflicting resources If there is a tie with respect to the average number of conflicting resources
the activity with the longest duration is selected If the tie persists the activity with the smallest
activity ID is selected as a resource-driving
In Figure 5 Activity A11 was delayed because of the resource unavailability of R2 and R3
Activities A3 A7 and A8 are the potential resource-driving of A11 The traditional RCPM creates
three RLs one between A3 and A11 other between A7 and A11 and another between A8 and
A11 The eRCPM creates only one link between A8 and A11 In this case A8 has a higher average
number of the two conflicting resources than the other two activities
Figure 5 Example Case III Two or more Conflict Resources
80
Step 22 Finding Unidentified Resource Links
Like RCPM before performing the backward pass the eRCPM checks if non-critical activities
(non-zero total float) can fully use the float or if there is any resource constraint for the float period
(Kim and de la Garza 2003) If so an additional resource link is created between the conflicting
activities considering the three cases described above when having multiple possible resource-
driving activities
For example in Figure 7 when checking for unidentified RLs Activity A5 cannot be delayed
because otherwise an over-allocation arises with respect R2 (13 resources will be needed but only
ten are available) Activities A3 A8 and A9 are the potential resource-driving activities of A5
The traditional RCPM creates three RLs one between A5 and A3 other between A5 and A8 and
another between A5 and A9 The eRCPM creates only one link between A5 and A8 because A8
requires a higher amount of R2 than the other two activities
Figure 6 Example 1 Identification of additional Resource Links
In Figure 7 when checking for unidentified Activity A4 which has ldquoseven daysrdquo of float cannot
be delayed because otherwise an over-allocation arises with respect to R1 (11 resources will be
needed and there are only nine available) Activities A8 A9 and A11 are the potential resource-
driving activities of A4
Figure 7 Example 2 Identification of additional Resource Links
81
The traditional RCPM creates three RLs one between A4 - A8 other between A4 - A9 and another
between A4 -A11 The eRCPM creates only a link between A4 and A11 In this case although
A11 and A9 have the same higher number of resources the duration of A11 (D = 7 Days) is longer
than A9 (D = 4 Days)
Step 23 Backward Pass
Once all resource links are identified the eRCPM performs the CPM backward pass considering
both the technological and resource relationships By considering both types of relationships a
continuous critical path can be identified in a resource-constrained schedule
Step 3 Alternative Schedule
Like RCPM the eRCPM finds alternative schedules by looking for activities that can be scheduled
during a different period without breaching all the relationships
Step 4 Selecting a Schedule
Since the eRCPM performs three different RCS heuristics (LS Enhanced LF and ES) the
algorithm selects as a default schedule the one with the shortest duration If there is a tie between
the schedules with respect to the PCT the schedule with the smallest resource moment value (Mx)
is selected
The Minimum Moment (Mx) was chosen as a criterion to select a resulting resource-constrained
schedule because it is a good measure of resource utilization A lower value indicates a better
resource allocation eg a resource profile closer to a rectangular shape The moment of the daily
resource demands about the horizontal axis of a projectrsquos resource histogram (Mx) is calculated as
shown in Equation 2 (Harris 1978) Where 119910119894 represents the daily resource utilization When
having multiple types of resources in a schedule Mx is calculated for each resource profile and
then compared with the values of the other schedules The schedule with the highest number of
resource profiles with the lowest Mx is selected as a default schedule
119872119909 =
1
2sum 119910119894
2
119899
119894=1
(Eq 2)
For example the two schedules show in Figures 8a and 8b (LS-based and ES-based respectively)
have the same PCT (19 days) but different resource profiles Since the Mx of the resource profile
of the LS-based schedule is lower (1970) than the that of the ES-based schedule (200) the eRCPM
selects as default the LS-based schedule The resource profile of this schedule is closer to a
rectangular shape than that of the ES-based schedule and therefore it has better resource allocation
82
a LS-based Schedule b ES-based Schedule
Figure 8 Resource Profiles Calculation of Mx
If there is a tie with respect to the Mx the schedule with the lowest number of critical activities
(TF = 0) is selected as a default If the tie persists the schedule with the highest average of free
float is selected as a default The float values (TF and FF) were selected as parameters to select a
resource-constrained schedule because 1) having a schedule with less critical activities decrease
the probability of delaying the project completion time and 2) having a schedule with a higher
average time of free float gives more flexibility for delaying some activities without affecting the
start time of the successor activities
Finally if there is still a tie between the three resulting schedules (LS Enhanced LF and ES
based) the eRCPM selects the LS-based schedule as a default If the tie is between the Enhanced
LF and ES-based schedules the eRCPM selects as the default the Enhanced LF-based schedule
Enhanced RCPM (eRCPM) System
The eRCPM system was developed and integrated with Primavera P6 using the Primavera P6rsquos
API (Application Program Interface) The eRCPM prototype system handles smart relationships
multiple calendars holydays and exceptions multiple types of resources and progressed
schedules Specifically the system 1) exports a specific P6 project in an XML format 2) reads and
stores the project information from the XML file 3) performs the Enhanced RCPM 4) updates
the XML file by adding the identified resource relationships and 5) imports the file again into P6
Then the updated schedule appears in the userrsquos P6 database
The updated P6 schedule has already the resource relationships incorporated into the schedule
thus the user should only re-run CPM in P6 (schedule) to obtain the earlylate dates and float
values Primaverarsquos users can identify the resource links that were added to the schedule adding a
user-defined field created by the eRCPM system called ldquoRL Successorsrdquo The user-defined fields
are custom fields that P6 users can create to track specific project information The eRCPM system
also creates another user-defined field called ldquoPFrdquo which shows the phantom float each activity
had before adding the resource links into the schedule Finally if after comparing all three resulting
schedules (LS Enhanced LF and ES based) the program selects as default the LF-based schedule
83
P6 users can add another user-defined field called ldquoPNrdquo This column shows the Priority Number
used for each activity when applying the Enhanced LF heuristic
Primavera P6
API
P6 Database
User
Data Input
Export Project (XML)
Read XML File
Primavera
P6
Performs
Enhanced RCPM
Update XML FileImport XML File
Java Program
Figure 9 Enhanced RCPM System
eRCPM Application
This section presents the application of the eRCPM to a non-progressed (Case Study No1) and a
progressed (Case Study No2) resource-constrained schedule The eRCPM was performed by 1)
hand and the resulting schedules were drawn in fenced bar charts and 2) using the eRCPM System
For each case study the three schedules obtained after applying each heuristic (LS Enhanced LF
and ES) by hand and by the eRCPM system are shown and then compared to illustrate the process
the eRCPM follows to select a default schedule
Case Study No1 Non-Progressed Schedule
The case study schedule No1 consists of nine activities with only finish-to-start (FS) relationships
a seven-workday calendar with no holidays and exceptions and one type of resource (R) The
maximum availability of resource type R is six Figure 10 shows the network of the schedule and
Figure 11a the CPM fenced bar chart The CPM results indicated a project duration of 14 days
(Project Completion Time (PCT) Oct 20 2019) with activities C G and I as critical The eRCPM
was applied to mitigate the over-allocation problem occurring during days 7 to 11 (see Figure 11b)
Figure 10 Case Study No Project Network
84
Figure 11a CPM Fenced Bar Chart Figure 11b eRCPM Fenced Bar Chart (LS-based)
Figure 11 Case Study No1
Figure 11b shows the resulting LS-based schedule drawn in a fenced bar chart so the identified
RLs can be easily observed The PCT was extended by five days (from 14 days to 19 days) after
mitigating the resource supply-demand problem with the LS heuristic (PCT Oct 25 2019) The
sequence of the activities changed and thus the critical path Now activities C B A F D and H
are critical
Figure 12 shows the output of the program after performing the LS heuristic as part of the eRCPM
For each activity the program displays the duration early and late CPM dates (EST EFT LST
and LFT) total float (TF) free float (FF) and Phantom Float (PF) values The program also shows
the resource links identified during the application of the eRCPM For each activity either the
predecessors or successors (resource-driving activities) can be displayed As can be observed in
Figure 11 before adding the resource links into the schedule (C - B B - A A - F and F - D) four
activities had PF This means that based on traditional RCS calculations activities A B C and F
have float However this float does not exist because it cannot be used by activities due to resource
constraints
Figure 12 eRCPM Program Output (LS-based)
The eRCPM system creates resource links in P6 as Finish-to-Start relationships without lag (FS =
0) These new relationships can be identified in a P6 Project by adding the user-defined column
called ldquoRL Successorsrdquo This column indicates the successor resource-driving activity of the
85
activity being considered For example in Figure 13 a new link between activity A and F was
added to the schedule Activities D and E were already successors activities of activity A before
performing eRCPM (Technological Relationships) The eRCPM also creates a user-defined field
called ldquoPFrdquo to display the phantom float values of each activity before adding the resource links
into the schedule Once the user opens the file and runs the project P6 updates the early and late
CPM dates (EST EFT LST and LFT) as well as the float values (FF TF) of each activity As a
result a continuous critical path can be identified in the P6 resource-constrained schedule The
resulting values match the ones obtained by the eRCPM system (see Figures 12 and 13)
Figure 13 eRCPM Schedule in P6 (LS- based)
Figure 14 shows the resulting Enhanced LF-based schedule drawn in a fenced bar chart The PCT
was extended by five days (from 14 days to 17 days) after mitigating the resource supply-demand
problem with the Enhanced LF heuristic (PCT Oct 23 2019) Unlike the LS-based schedule only
three resource links were identified after applying the Enhanced LF heuristic and only four
activities are critical (B C G and I)
Figure 14 eRCPM Fenced Bar Chart (Enhanced LF-based)
Figure 15 shows the output of the program after performing the Enhanced LF heuristic as part of
the eRCPM Before adding the resource links into the schedule (B-C C-A and F-A) two activities
had PF (B and F)
86
Figure 15 eRCPM Program Output (Enhanced LF-based)
Figure 16 shows the updated project in P6 In addition to the two user-defined fields mentioned
before (RL Successors and PF) P6 users can add another user-defined column called ldquoPnrdquo This
column shows the Priority Number values used by the eRCPM to perform the Enhanced LF
heuristic The Pn values are only added to the P6 file when the default schedule selected by the
eRCPM system is the one obtained by this heuristic (Enhanced LF) After re-scheduling the
project the values displayed by P6 match with the ones obtained by the system and a continuous
critical path can be identified in the P6 resource-constrained schedule (see Figures 15 and 16)
Figure 16 eRCPM (Enhanced LF) P6 Schedule
Figure 17 shows the resulting ES-based schedule drawn in a fenced bar chart The PCT was
extended by five days (from 14 days to 19 days) after mitigating the resource supply-demand
problem with the ES heuristic (PCT Oct 25 2019) Even though the ES and LS-based schedules
have the same completion time (Oct 25 2019) the sequence of the activities differs and thus the
RLs and critical path In the ES-based schedule five RLs were identified and activities A B C
G and I are critical
87
Figure 17 eRCPM Fenced Bar Chart (ES-based)
Figure 18 shows the output of the program after performing the ES heuristic as part of the eRCPM
Before adding the resource links into the schedule four activities had phantom float (A B E and
F) Although this number of activities is the same as the number obtained in the LS-based schedule
the PF float values are higher in the ES-based schedule
Figure 18 eRCPM Program Output (ES-based)
Figure 19 shows the updated project in P6 After re-scheduling the project the values displayed
by P6 match the ones obtained by the eRCPM system and a continuous critical path can be
identified in the P6 resource-constrained schedule (see Figures 18 and 19)
88
Figure 19 eRCPM P6 Schedule (ES-based)
In summary the eRCPM system selects the LF-based schedule as default and updates the P6
project based on this heuristic output This schedule is selected because it has the shortest PCT
(Oct 23 2019) among the other two schedules (LS and ES-based) The LS and ES-based schedules
have the same PCT (Oct 25 2019) but due to the priority rules of each heuristic the sequence of
the activities differs and so the resource profile the RLs and the critical path
If the user wants to select a schedule among these two (LS and ES-based) the next parameter to
compare (after the project duration) is the Minimum Momentum (Mx) value of the resource profile
In this regard the Mx of the LS-based schedule is lower (197) than that of the ES-based (200)
This means the resource allocation of the LS-based schedule is better than that of the ES-based
(The resource profile is closer to a rectangular shape) So if a schedule with a finish date of Oct
25 is desired then it is advisable to select the LS-based schedule Figure 20 shows the results of
the comparison performed by the eRCPM system when selecting the default schedule
Figure 20 Summary Output of the eRCPM System
Case Study No 2 Progressed Schedule
The case study schedule No 2 consists of nine activities with two types of precedence relationships
(FS and SS) two types of resources (R1 and R2) and two different calendars Calendar 1 has
seven workdays per week and Calendar 2 has five workdays per week Both calendars have two
days of exceptions (non-working days) October 23rd and November 1st The maximum number of
resources available per day for R1 is six and R2 is seven Figure 21 shows the network of the
schedule and Figure 22a the CPM fenced bar chart
89
Figure 21 Case Study No 2 Network
The CPM results indicated a project duration of 23 days with activities A C I J and K as critical
As shown in Figure 22a there is an over-allocation problem for R1 during days 9 to 11 for R2
during days 10 to 11 The eRCPM was applied to mitigate this supply-demand problem After
applying the three heuristics the eRCPM system selected as default the LF-based schedule As
shown in Figure 22b after solving the resource overallocation problem the PCT was extended by
one day with activities B D E G H and K as critical Additionally five resource links were
incorporated in the schedule (B-D C-G E-G F-G and H-K) This schedule was used as a baseline
to update the project
Figure 22a CPM Fenced Bar Chart Figure 22b eRCPM Fenced Bar Chart (LF-based)
Figure 22 Fenced Bar Chart
The baseline schedule was updated at the end of week 1 (Oct 13 2019) Activities A B and D
have been completed and activity C is still in progress (see Figure 23) The resource link between
activities B and D was kept into the schedule because it is located left to the data date After
removing the resource links located right to the data date (C ndash G E ndash G F ndash G and H ndash K) the
CPM results indicate a project duration of 23 days with activities C I J and K as critical
Additionally there is an over-allocation problem during days 14 to 17 for R1 The eRCPM was
re-applied to mitigate the resource supply-demand problem in this progressed schedule
90
Figure 23 Fenced Bar Chart Schedule Updates
Figure 24 shows the resulting LS-based schedule drawn in a fenced bar chart The PCT was
extended by two days (from 23 days to 25 days) after mitigating the resource supply-demand
problem with the LS heuristic (PCT Oct 31 2019) The sequence of the activities changed and
thus the critical path and the RLs that were identified before the update Now activities G E F
H and K are critical
Figure 24 eRCPM Fenced Bar Chart (Late Start-based)
Figure 25 shows the output of the program after performing the LS heuristic as part of the eRCPM
Since this is a progressed schedule before re-running the method the program identifies and
displays the resources links that are kept in and removed from the schedule based on the Data Date
(DD) of the project As a reminder the RLs located left to the DD are kept in and the RLs located
right to the DD are removed from the schedule With this activity configuration the eRCPM is re-
applied and the system displays the new RLs identified during this process As can be observed in
Figure 25 before adding the RLs into the schedule (G - E G - F E - H and H - K) four activities
had PF (E F G and H) Most of the new RLs are different from the ones removed from the
schedule before re-running the eRCPM This highlights the importance of removing previous RLs
since they may constrain the schedule
91
Figure 25 eRCPM Program Output (LS-based)
Figure 26 shows the updated project in P6 After re-scheduling the project the values displayed
by P6 match the ones obtained by the eRCPM system and a continuous critical path can be
identified in the P6 resource-constrained schedule (see Figures 25 and 26)
Figure 26 eRCPM P6 Schedule (LS-based)
Figure 27 shows the resulting Enhanced LF-based schedule drawn in a fenced bar chart Like the
LS-based schedule the PCT was extended by two days (from 23 days to 25 days) after mitigating
the resource supply-demand problem with the Enhanced LF heuristic (PCT Oct 25 2019) Even
92
though the LS and LF-based schedules have the same finish date (Oct 25 2019) the sequence of
the activities differs and thus the RLs and critical path In the Enhanced LF-based schedule five
RLs were identified and activities C E H and K are critical
Figure 27 eRCPM (Enhanced Late Finish) Fenced Bar Chart
Figure 28 shows the output of the program after performing the Enhanced LF heuristic as part of
the eRCPM Before adding the resource links into the schedule five activities had PF (C E F G
and H) Since the sequence of the activities changed the RLs identified after re-applying the
eRCPM are different from the ones the schedule had before the update and which were removed
before re-running the method
Figure 28 eRCPM (Enhanced LF) Program Output
Figure 29 shows the updated project in P6 After re-scheduling the project the values displayed
by P6 match the ones obtained by the eRCPM system and a continuous critical path can be
identified in the P6 resource-constrained schedule (see Figures 28 and 29)
93
Figure 29 eRCPM (Enhanced LF) P6 Schedule
Figure 30 shows the resulting ES-based schedule drawn in a fenced bar chart The PCT was
extended by six days (from 23 days to 29 days) after mitigating the resource supply-demand
problem with the ES heuristic (PCT Nov 4 2019) In this schedule activities C E I J and K are
critical
Figure 30 eRCPM Fenced Bar Chart (Early Start-based)
Figure 31 shows the output of the program after performing the ES heuristic as part of the eRCPM
Before adding the resource links into the schedule (C - E F - G E - I H - K) five activities had
PF (C E F G and H)
94
Figure 31 eRCPM (ES Sort) Program Output
Figure 32 shows the updated project in P6 After re-scheduling the project the values displayed
by P6 match the ones obtained by the eRCPM system and a continuous critical path can be
identified in the P6 resource-constrained schedule (see Figures 31 and 32)
Figure 32 eRCPM (ES Sort) P6 Schedule
In summary the eRCPM system selects the Enhanced LF-based schedule as default and updates
the P6 project based on this heuristic output This schedule was selected by the system because
95
even though the LF and LS-based schedules have the same finish date (Oct 31 2019) the
Enhanced LF-based schedule has lower values of Mx for the two types of resources (1198721199091 = 189
1198721199092 = 645) than that of the LS-based schedule (1198721199091 = 216 1198721199092 = 665) Since this a progressed
schedule the Mx is calculated after the data date
Worthy of note after the data date the Enhanced LF-based schedule has a fewer number of critical
activities than the LS-based schedule (4 vs 5) but a higher number of RLs (5 vs 4) The Enhanced
LF-based was selected as a default because due to the sequence of the activities the resource
allocation is better than that of the LS-based schedule Figure 33 shows the results of the
comparison performed by the eRCPM system when selecting the default schedule
Figure 33 Summary Output of the eRCPM System
Future Research and Limitations
Due to the nature of each heuristic schedulers and project managers should expect to obtain
different resource-constrained schedules The eRCPM performs three different heuristics under a
serial approach - activities are sorted as a single group and then schedule one at a time The
incorporation of another well-known RCS method such as the parallel method in the algorithm
will provide schedulers more flexibility selecting the schedule that better meets the project
requirements and conditions Under the parallel approach the activity sequence is determined and
updated at the start of a specific period (Moder et al 1983)
Otherwise the three parameters defined in the eRCPM to identify resource-driving activities when
having several concurrent activities with several predecessor activities were not incorporated in
the eRCPM system So additional work should be carried out to add these criteria to the system
Additionally a dynamic scenario must be further explored when determining if the total float
values of noncritical activities can be used during the whole period (identification of additional
resource links) This scenario occurs when two or more activities are analyzed at once instead of
just one When using the available float of only one activity an overallocation problem may not
exist However if two or more activities with float are delayed at the same time an overallocation
may exist and resource links must be added to the schedule
For example in Figure 34 if activity A9 is delayed more than five days there is not an over-
allocation but if A8 is delayed more than seven days at the same time than A9 an overallocation
problem arises regarding R1 (ten resources would be needed and there are only nine available)
The scenario is the same with any possible combination of the non-critical activities (A9 A8 A11)
being scheduled in parallel on day 17 In order to determine if additional RLs should be added into
the schedule as a result of the changes made this study recommends re-applying the eRCPM each
time an activity is delayed
96
Figure 34 Dynamic scenario for identifying resource links
Conclusions
Traditional Resource-Constrained Scheduling techniques fail to provide correct float values and a
continuous critical path in resource-constrained schedules The lack of resource relationships in a
resource-constrained schedule leads to the calculation of wrong late startfinish dates and to the
creation of non-existing floats (phantom float) Therefore all activities must be considered as
influential in the project completion time
Primavera P6 a scheduling software frequently used by the construction industry is not equipped
to identify and create resource links when performing an RCS technique This paper presents the
application of an Enhanced Resource Critical Path Method (eRCPM) in non-progressed and
progressed resource-constrained schedules which was integrated with Primavera P6
The development of the eRCPM computerized system allows the removal of phantom float and
identification of a continuous critical path in P6 resource-constrained schedules The eRCPM
addresses the fact the activity sequence of a resource-constrained schedule may change after a
progress update The eRCPM system incorporates functionality to keep and remove specific
resource relationships of a progressed schedule This functionally allows the application of the
Time Impact Analysis (TIA) methodology for the evaluation of delays Since this is a
contemporaneous analysis each time a delay is inserted into the schedule specific resource
relationships will be kept removed and identified
Additionally the incorporation of three different heuristics into the eRCPM provides more
alternative and flexible schedules that could meet better project requirements Moreover the
system selects as default the schedule with a shorter duration or with better resource allocation
97
References
Franco-Duran D M amp de la Garza J M (July 01 2019) Phantom float in commercial
scheduling software Automation in Construction 103 291-299
DOIorg101016jautcon201903014
Franco-Duran D M amp de la Garza J M (November 01 2019) Review of Resource-Constrained
Scheduling Algorithms Journal of Construction Engineering and Management 145 11)
DOIorg101061(ASCE)CO1943-78620001698
Franco-Duran D M amp de la Garza J M (February 12 2020) Performance of Resource-
Constrained Scheduling Heuristics Journal of Construction Engineering and Management 146
(4) pp 1-12 DOIorg101061(ASCE)CO1943-78620001804
Harris R B 1978 Precedence and Arrow Networking Techniques for Construction Hoboken
NJ Wiley
Kim K and de la Garza J M (2003) A New Approach to Resource-Constrained Scheduling
Fourth Joint International Symposium on Information Technology in Civil Engineering November
15-16 2003 | Nashville Tennessee United States DOIorg10106140704(2003)48
Kim K and de la Garza J M (2003) Phantom Float Journal of Construction Engineering and
Management 129 5 507 DOIorg101061(ASCE)0733-9364(2003)1295(507)
KPMG (2017) Make it or Break it Remaining governance people and technology in the
construction industry Global Construction Survey 2017 Sl KPMG
Moder J J Phillips C R amp Davis E W (1983) Project Management with CPM PERT and precedence
diagramming (3rd ed ed) New York Van Nostrand Reinhold
Nisar S A Yamamoto Koshi amp Suzuki K (January 01 2013) Resource-dependent Critical
Path Method for Identifying the Critical Path and the ldquoReal Floatsrdquo in Resource-Constrained
Project Scheduling Construction and Management special Issue Construction Management
Committee Japan Society of Civil Engineers 69 4 97-107
Rivera F A amp Duran A (January 01 2004) Critical clouds and critical sets in resource-
constrained projects International Journal of Project Management 22 6 489-497
DOIorg101016jijproman200311004
Wiest J D (1964) Some Properties of Schedules for Large Projects with Limited Resources
Operation Research 12(3) 395-418 DOIorg101287opre123395
98
CONCLUSION
RCS methodologies solve the resource conflicts but create phantom float in the schedules ndash a float
that does not really exist After testing Primavera P6 versions (P6 v832 and P6 v161) the
software still creates phantom float in resource-constrained schedules because it does not apply
any algorithm to remove it The software correctly determines the activitiesrsquo earliest dates that
satisfy the resource limitations but they calculate total float based on a ldquoTime Contextrdquo (LF ndash EF
andor LS ndash ES) ignoring the presence of resource constraints Hence the floats calculated by the
software cannot be trusted or used as traditional definitions suggest ie the amount of time an
activity can be delayed without affecting the project completion time
Professionals should recognize the presence of phantom float in resource-constrained schedules
because it may lead them to make decisions based on unreliable schedules Non-critical activities
may be considered resource critical if they fail to release the resources needed by a critical activity
on time The actual float values may be shorter than calculated during RCS or may be altogether
non-existent This makes impossible the identification of the critical path and thus the anticipation
of the impact of a delaying event in the project completion time
In the last years several algorithms have been developed to identify the critical path in resource-
constrained schedules Most of the algorithms identify resource dependences but some of them
still create phantom float in a schedule because they do not identify all the necessary resource
links Some algorithms also create unnecessary resource relationships andor remove technological
relationships from the schedule Furthermore most of the algorithms do not provide a mechanism
or criterion to select a resource links configuration among multiple alternatives and neither to select
a schedule when having multiple options Finally none of the algorithms consider the dynamic
feature of resource dependences
This study tackled the flaws of the Resource Critical Path Method (RCPM) regarding the removal
of resource links selection of resource-driving activities selection of a default schedule when
having alternative schedules and the lack of a prototype system for Primavera P6
Contributions to the Body of Knowledge
This study has contributed to the body of knowledge by improving an RCS related scheduling
technique so it can be more practical for real construction projects
The Enhanced RCPM (eRCPM) addresses the fact the activity sequence of a resource-constrained
schedule may change after a progress update and the eRCPM system incorporates functionality to
keep and remove specific resource relationships of a progressed schedule This functionally allows
the application of the Time Impact Analysis (TIA) methodology for the evaluation of delays Since
this is a contemporaneous analysis each time a delay is inserted into the schedule specific resource
relationships will be kept removed and identified Additionally the incorporation of three
different heuristics into the eRCPM provides more alternative and flexible schedules that could
meet better project requirements Moreover the system selects as default the schedule with the
shortest duration or with better resource allocation Other major contributions are as follows
99
Objective No 1
Chapter 3
A new tiebreaker (Priority Number) that enhances the performance of the LF heuristic The
results show that the Priority Number as a tiebreaker of the Late Finish leads to obtain
schedules with lower deviations from the CPM duration and a higher number of shortest
schedules than with traditional tiebreakers
A classification system that indicates the two heuristics with the best performance for
specific resource network characteristics This classification will help practitioners to
decide which heuristic applies when mitigating the resource supply-demand problem given
the project characteristics
142 different schedules created in Primavera P6 v161 are available for use to evaluate and
classify the performance of Resource-Constrained Scheduling (RCS) heuristics
Objective No 2
Chapter 2
Recommendations on the RCS-related methods that can be used by industry professionals
A system to guide practitioners in the selection process of an RCS-related algorithm based
on their common features (heuristic) constraints (removal of logic links) and project
characteristics (resources and calendars)
Chapter 4
An Enhanced RCPM (eRCPM) that can be applied for delay analysis
Objective No 3
Chapter 4
An eRCPM computerized system that removes phantom float and identifies a continuous
critical path in P6 resource-constrained schedules The prototype system handles smart
relationships multiple calendars holidays ad exceptions multiple types of resources and
progressed schedules
100
Future Research
Objective No 1 (Chapter 3)
RCS Heuristics
The eight existing heuristics tested in this study were selected based on the opportunity to
apply them using scheduling software However other heuristics such as the Resource
Scheduling Method (RSM) the Greatest Rank Positional Weight (GRPW) and the
Weighted Resource Utilization and Precedence (WRUP) should be tested under the same
scenarios since they have been reported in previous studies as priority rules with good
performance
All heuristics were evaluated under a serial approach Given the differences between the
serial and parallel methods the heuristics should be tested under a parallel approach as
well This classification will provide practitioners the option of splittinginterrupting the
work which may be beneficial for some activities and may also reduce the project
completion time
The matrix developed in this study to classify heuristicsrsquo performance is a point of
departure for the development of a more complete classification system for the industry
The results of this study are limited to networks with I2= 065 RS = 025 NC = 150 and
RF = 025 and 075 Therefore the classification system should be extended so other
common values of RF RS and NC can be included
Objective No 2 (Chapter 4)
Enhanced RCPM (eRCPM)
The eRCPM performs three different heuristics under a serial approach - activities are
sorted as a single group and then scheduled one at a time The incorporation of another
well-known RCS method such as the parallel method in the algorithm will provide
schedulers more flexibility selecting the schedule that better meets the project requirements
and conditions
A dynamic scenario must be further explored when determining if the total float values of
noncritical activities can be used during the whole period (identification of additional
resource links) This scenario occurs when two or more activities are analyzed at once
instead of just one When using the available float of only one activity an overallocation
problem may not exist However if two or more activities with float are delayed at the
same time an overallocation may exist and resource links must be added to the schedule
101
Objective No 3 (Chapter 4)
Enhanced RCPM System
The three parameters defined in the eRCPM to identify resource-driving activities when
having several concurrent activities with several predecessor activities were not
incorporated in the eRCPM system Additional work should be carried out to add these
criteria to the system
102
REFERENCES
Abeyasinghe M C L Greenwood D J amp Johansen D E (2001) An efficient method for
scheduling construction projects with resource constraints International Journal of Project
Management 19(1) 29-45 DOIorg101016S0263-7863(00)00024-7
Baki M A (1998) CPM scheduling and its use in todays construction industry Project Management
Journal 29(1) 7ndash9 Retrieved from httpswwwpmiorglearninglibrarycritical-path-method-
scheduling-construction-industry-2069 (Accessed December 6 2018)
Bowers J A (1995) Criticality in Resource-Constrained Networks Journal of the Operational
Research Soc 46 80-91 DOIorg101057jors19959
Braimah N (2013) Construction Delay Analysis TechniquesmdashA Review of Application Issues
and Improvement Needs Buildings 3 506-531 DOI103390buildings3030506
Davis E W amp Patterson J H (April 01 1975) A Comparison of Heuristic and Optimum Solutions in
Resource-Constrained Project Scheduling Management Science 21 8 944-955
de la Garza J M and Franco-Duran D M (2017 December 20) CPM Benefits in Estimating Bidding
Reported in Survey (B Buckley Ed) Retrieved from Engineering News-Record
httpswwwenrcomarticles43666-cpm-benefits-in-estimating-bidding-reported-in-survey (Accessed December 6 2018)
Fondahl J W (1991) The Development of the Construction Engineer Past Progress and Future
Problems Journal of Construction Engineering and Management 117(3) 380-392
DOIorg101061(ASCE)0733-9364(1991)1173(380)
Franco-Duran D M amp de la Garza J M (July 01 2019) Phantom float in commercial
scheduling software Automation in Construction 103 291-299
DOIorg101016jautcon201903014
Franco-Duran D Primavera P6 Schedules University Libraries Virginia
Tech DOIorg107294W4-5R6Z-D346
Franco-Duran D M amp de la Garza J M (November 01 2019) Review of Resource-Constrained
Scheduling Algorithms Journal of Construction Engineering and Management 145 11)
DOIorg101061(ASCE)CO1943-78620001698
Franco-Duran D M amp de la Garza J M (February 12 2020) Performance of Resource-
Constrained Scheduling Heuristics Journal of Construction Engineering and Management 146
(4) pp 1-12 DOIorg101061(ASCE)CO1943-78620001804
Ibbs W amp Nguyen L D (2007) Schedule Analysis under the Effect of Resource
Allocation Journal of Construction Engineering and Management 133 2 131-138
DOIorg101061(ASCE)0733-9364(2007)1332(131)
103
Kastor A amp Sirakoulis K (2009) The effectiveness of resource leveling tools for Resource
Constraint Project Scheduling Problem International Journal of Project Management 27(5)
493-500 DOIorg101016jijproman200808006
Kim K amp de la Garza J M (2003) Phantom Float Journal of Construction Engineering and
Management 129 (5) 507-517 DOIorg101061(ASCE)0733-9364(2003)1295(507)
Lu M amp Li H (2003) Resource-Activity Critical-Path Method for Construction Planning
Journal of Construction Engineering and Management 129(4) 412-420
DOIorg101061(ASCE)0733-9364(2003)1294(412)
Nisar S A Yamamoto Koshi amp Suzuki K (2013) Resource-Dependent Critical Path Method
for Identifying the Critical Path and the ldquoReal Floatsrdquo in Resource-Constrained Project
Scheduling Journal of Japan Society of Civil Engineers 69(4) 97-107
DOIorg102208jscejcm69I_97
Pantouvakis JP amp Manoliadis OG (2006) A practical approach to resource-constrained project
scheduling Operational Research An International Journal 6(3) 299-309
DOIorg101007BF02941258
Raz T amp Marshall B (1996) Effect of resource constraints on float calculations in project
networks International Journal of Project Management 14(4) 241-248 DOIorg1010160263-
7863(95)00090-9
Rivera F A amp Duran A (2004) Critical clouds and critical sets in resource-constrained
projects International Journal of Project Management 22(6) 489-497
DOIorg101016jijproman200311004
Ulusoy G and Ozdamar L (1989) Heuristic performance and networkresource characteristics
in resource-constrained project scheduling Journal of the Operational Research Society 40
1145-1152 DOIorg101057jors1989196
Wiest J D (1964) Some Properties of Schedules for Large Projects with Limited Resources
Operation Research 12(3) 395-418 DOIorg101287opre123395
Woodworth B M and Shanahan S (1988) Identifying the critical sequence in a resource-
constrained project International Journal of Project Management 6(2) 89-96
DOIorg1010160263-7863(88)90030-0

1
INTRODUCTION
This study 1) developed an Enhanced Late Finish (LF) heuristic for scheduling activities
under resource constraints in which the project duration compares favorably with the
results of other existing heuristics under specific scenarios (Objective 1) 2) enhanced the
Resource-Constrained Critical Path Method (eRCPM) (Objective 2) and 3) developed an
eRCPM computerized system (Objective 3)
To meet these objectives this study first illustrated in Chapter 1 the presence of phantom
float in Primaverarsquos P6 v161 and Microsoftrsquos Project v2016 schedules This section
highlights the need of incorporating an algorithm that correctly identifies a critical path in
resource-constrained schedules and that users of P6 and MS Project should recognize that
the calculation of total float by the software relies on a time-based context ignoring the
presence of resource constraints
Then this study reviewed existing RCS related algorithms with the purpose of identifying
the shortcomings that must be addressed so they can be applied for delay analysis In this
regard Chapter 2 shows the performance of eight RCS-related algorithms discusses
potential solutions to the identified shortcomings provides recommendations on the
algorithms that can be used by industry professionals and proposes a system to facilitate
the selection of an algorithm based on their common features constraints and project
characteristics
Subsequently to achieve Objective 1 this study first analyzed the influence of different
tiebreakers that are usually incorporated in RCS heuristics In this regard Chapter 3
describes a new tiebreaker (Priority Number - PN) which improves the performance of the
Late Finish heuristic Additionally this section shows the performance of the Enhanced LF
heuristic compared to the other eight existing RCS heuristics and describes a heuristicsrsquo
performance classification system to help schedulers deciding which heuristic applies
when mitigating the resource supply-demand problem
Finally to achieve Objective No2 and Objective No 3 this study addressed the following
flaws of the existing RCPM number of RCS heuristics removal of resource links in
progressed schedules identification of resource-driving activities selection of a default
schedule and lack of a computerized system In this regard Chapter 4 describes the
Enhanced RCPM (eRCPM) and shows its application in non-progressed and progressed
resource-constrained schedules throughout the prototype system of the algorithm that was
developed and integrated with Primavera P6
Finally the main contributions to the body of knowledge and limitations of this study as
well as future research can be found in the conclusions section
2
CHAPTER 1
Phantom Float in Commercial Scheduling Software1
Abstract
On a regular basis construction professionals use scheduling software to resource load the
schedules without paying attention to the resulting critical path Current scheduling
software fix the resource supply-demand problem by performing a Resource-Constrained
Scheduling (RCS) technique but they report incorrect total float values and a broken
critical path
RCS calculations suggest that activities have float but much of this float does not exist
(phantom float) Phantom float is created in resource-constrained schedules because the
existing RCS methodologies neglect the resource relationships that arise between activities
when competing for the same but unavailable resources This paper illustrates the presence
of phantom float in Primaverarsquos P6 and Microsoftrsquos Project schedules After removing
phantom float from the schedule non-critical activities may become resource critical and
the actual float may be shorter than calculated or may be altogether non-existent
Users of P6 and MS Project should recognize that the calculation of total float by the
software relies on a time-based context (LF ndash EF andor LS ndash ES) ignoring the presence
of resource constraints Therefore the float reported cannot be trusted or used to mitigate
delaying events like the traditional time-based context definition of total float suggests
Currently research is being carried out in order to remove phantom float from P6 and
Microsoft Project schedules
Keywords Phantom Float Resource-Constrained Schedules Scheduling Software
Introduction
Since its emergence in the late 1950s the Critical Path Method (CPM) has been widely
applied in the construction industry The results of the four surveys taken by the
Engineering New-Recordrsquos (ENR) Top 400 contractors in 1970 1987 2003 and 2017
show that on average 93 of the contractors responding apply CPM on their projects
(Davis 1974 Tavakoli and Riachi 1990 Kelleher 2004 de la Garza and Franco-Duran
2017) CPM is considered a useful tool to plan and to coordinate project work (Baki 1998
Liberatore Pollack-Johnson Smith 2001) The results of a survey taken by 240 project
management professionals of the Project Management Institute (PMI) in 2001 show that
89 of the construction responders use CPM for project planning and 72 for project
control (Liberatore Pollack-Johnson and Smith 2001)
1 Franco-Duran D M amp de la Garza J M (July 01 2019) Phantom float in commercial scheduling
software Automation in Construction 103 291-299 DOIorg101016jautcon201903014
3
Professionals are heavy users of the Critical Path Method to schedule and control projects
Nevertheless CPM neglects the resource project allocations and constraints which is a
common feature among most of construction and engineering projects (Wiest 1964
Woodworth and Shanahan 1988 Lu and Li 2003 Pantouvakis and Manoliadis 2006
Kastor and Sirakoulis 2009) Most projects have a limited amount of resources available
that usually are shared by several activities Because oftentimes resource demands exceed
the maximum number of resources available several Resource-Constrained Scheduling
(RCS) techniques have been introduced to mitigate the resource supply-demand problem
(Woodworth and Shanahan 1988 Lu and Li 2003 Pantouvakis and Manoliadis 2006)
Despite RCS techniques do help project managers to solve the resource conflicts in project
schedules RCS usage in the industry has been quite moderate The two surveys taken by
the ENRrsquos Top 400 Contractors in 1987 and 2003 show that only 16 and 35
respectively of the responders use RCS techniques as advanced methodologies in their
projects (Tavakoli and Riachi 1990 Kelleher 2004) In 2001 Liberatore Pollack-
Johnson and Smith (2001) reported that over 50 of construction professionals use RCS
techniques for project planning and about 44 of the responders use RCS techniques for
project control
Project Management Software (PMS) which incorporate CPM and RCS methods has
become an essential tool for planning and control projects However at present the use of
scheduling software in the construction industry has not been systematically reported The
few studies found in the literature agree that Primaveratrade is the most frequently used
software for construction professionals followed by Microsoft (MS) Projecttrade (Liberatore
Pollack-Johnson and Smith 2001 Galloway 2006) The Liberatore surveyrsquos results show
that 51 of the construction responders use Primavera and 24 of them use Microsoft
Project (Liberatore Pollack-Johnson and Smith 2001) Additionally the results of the
ENRrsquos Top 400 Contractors survey in 2003 show that 78 of the responders use Primavera
and 35 use Microsoft Project (Kelleher 2004) In 2005 an online survey sent to 430
stakeholders involved in construction indicates that Primavera was the specified software
for their projects From an owner and contractor perspective on average over 60 used
Primavera and only 20 Microsoft Project (Galloway 2006)
Although Primavera P6 and MS Project fix the resource supply-demand problem by
performing specific RCS methods these techniques create phantom float in each
softwarersquos schedule RCS techniques overlook the resources relationships between
activities that compete for the same but unavailable resources RCS calculations suggest
that activities have float but much of this float does not exist hence the name of phantom
float (Kim and de la Garza 2003) The aim of this paper is to illustrate the presence of
phantom float in Primaverarsquos P6 v161 and Microsoftrsquos Project v2016 schedules
4
Background
Resource-Constrained Scheduling (RCS)
In resource-constrained schedules when resources are not available to complete a specific
task selected activities are delayed until the completion of the more crucial tasks that
employ the same type of resources (Boyle 2016) This process is governed by two steps
The first step is to set activity priorities according to specific rules The second is to
schedule activities in the order determined subject to logic precedence and resource
availability The criterion to assign activity priorities depends on the heuristic chosen to
solve the resource conflicts
Two of the most well-known methods employed in RCS are the serial method and the
parallel method The serial method sorts all activities as a single group and then schedules
one activity at a time If there are insufficient resources to start an activity the activity is
delayed until resources become available (Moder Phillips and Davis 1983) The primary
heuristic or priority rule to schedule activities is the Late Start Time (LS) Activities with
an early LS are scheduled first In cases when there is a tie with respect to the LS the higher
priority is given to the activity with the shorter duration and total float respectively If the
tie persists then the activity with the smaller number ID is selected (Kim and de la Garza
2003)
The parallel method selects a group of activities whose predecessors were already all
scheduled Activities are eligible to be scheduled if the activity Early Start Time (ES) is
less than or equal to the period of analysis Then from this Eligible Activity Set (EAS)
activities are scheduled based on the total float values (Kastor and Sirakoulis 2009)
Higher priority is given to the activity with the shorter total float If there is a tie with
respect to the total float the activity with the shorter duration is selected to be scheduled
If there are not enough resources to start an activity activities with lower priority are then
examined If the ES of an activity is delayed due to resource unavailability the ES must be
increased to the following period and a new rank for the EAS is defined (Moder Phillips
and Davis 1983) This process should be repeated until all activities are scheduled
Each commercial scheduling software uses a specific RCS method For instance Primavera
P6 applies the serial method and MS Project the parallel method Therefore schedulers and
project managers can expect to obtain different resource-constrained schedules with each
software RCS methods provide good but not optimal solutions (Wiest 1964 Lu and Li
2003 Pantouvakis and Manoliadis 2006) As a rule-based some heuristics may perform
better for some project schedules than for others (Moder Phillips and Davis 1983)
Phantom Float
RCS techniques mitigate the resource-supply problem but they fail to identify the correct
project critical path (Woodworth and Shanahan 1988 Bowers 1995) RCS methodologies
do not consider the resource dependencies that arise when activities are delayed due to
resource unavailability (Woodworth and Shanahan 1988 Kim and de la Garza 2005
5
Boyle 2016) The RCS calculations suggest that activities have float but this float might
not exist at all (Fondahl 1991) Kim and de la Garza (2003) labeled this float as phantom
float Hence the critical path is broken and all the activities must be considered critical
(Kim 2003) This weakness was first noticed by Fondahl (1991) In his study Fondahl
(1991) states that in a resource-constrained schedule the concepts of total float and critical
path are no longer satisfied Non-critical activities may be considered resource critical if
they fail to release the resources needed by a critical activity on time (Fondahl 1991 Lu
and Li (2003)
To provide correct float values and a continuous critical path some authors modified
existing RCS methods andor developed new methods These enhanced algorithms
consider not only the technological relationships but also the resource relationships
between activities in the schedule (Kim and de la Garza 2003 Kim and de la Garza 2005)
Once the resource relationships or Resources Links (RLs) are added to the schedule and
the backward pass is performed a continuous critical path can be obtained The priority
rules to schedule activities differ between each method as well as the process of identifying
the RLs Therefore different resource-constrained schedules with no phantom float can be
obtained when applying any of the methodologies described below
The algorithm proposed by Woodworth and Shanahan (1988) which is based on the
parallel method identifies the critical path of a resource-constrained schedule by creating
resource links (RLs) In this method during the forward pass a label is given to each
activity with the purpose of recording the resource being used and the usage order in a
resource pool The activities that have used the resource are also recorded During the
backward pass a search is made in the pool to find the immediate predecessor of the current
activity by considering the logical and resource dependencies If the Early Start (ES) of the
predecessor activity and the Early Finish (EF) of the current activity are equal and
activities are not technologically connected a Resource Link (RL) is created ((Woodworth
and Shanahan 1988 Kim and de la Garza 2005)
Like Woodworth and Shanahan (1988) Bowers (1995) proposed an algorithm based on
the parallel method that identifies the critical path of a resource-constrained schedule In
this case the RLs are identified during the forward pass by considering the resource usage
of each activity Bowers (1995) The RLs are checked and validated by examining the
history of resource availability during the backward pass Nonetheless as mentioned by
Kim and de la Garza (2005) Bowers (1995) did not provide detailed information about
how the RLs should be created
Kim and de la Garza (2003) developed the Resource-Constrained Critical Path (RCPM) to
provide a more realistic resource-constrained schedule by eliminating phantom float The
algorithm which is based on the serial method consists of five steps as shown in Figure 1
The first step is to perform CPM Then while the serial method is performed in the second
step RLs are identified and added to the schedule if an activity is delayed due to a resource
limit In the third step the backward pass is performed considering both the technological
and resource relationships that were identified during the forward pass The next step
determines if the total float of the noncritical activities can be used during the whole period
6
(ie if there is still phantom float) If the float cannot be used the corresponding RLs are
added to the schedule After this procedure the final schedule is obtained As a final step
the algorithm identifies alternative schedules looking for activities that can be scheduled
during another period without breaching all the relationships (Kim and de la Garza 2003
Kim and de la Garza 2005)
Figure 1 RCPM steps
While the RCPM algorithm was introduced by Kim and de la Garza (2005) Lu and Li
(2003) developed the Resource-Activity Critical-Path Method (RACPM) as a serial
heuristic method for resource-constrained scheduling The work content which is the
relative weight of each activity with respect to the time and resource usage is the primary
criterion to select an activity when activities are competing for constrained resources
Limited resources are first assigned to activities with higher work content since these
activities may affect the project completion time
If there is a tie with respect to the work content the activity with a larger number of
resources or longer duration is scheduled first (Lu and Li 2003) If an activity needs
various quantities of the same type of resource the priority is given to the resource that is
available to perform the activity at that time (Ready-to-Serve Time ndashRST) The RST is the
time when resources are ready to work If there is a tie with respect to RST resources are
randomly chosen The activity that first uses the same resource unit of the current or
predecessor activity is considered as a resource-constrained successor activity (Kim and de
la Garza 2003) Lu and Lirsquos method creates redundant RLs because the links are identified
based on the resource requirements and work content neglecting the technological
relationships of the original CPM (Lu and Li 2003 Kim and de la Garza 2005)
Scheduling Software
In 2003 Kim and de la Garza reported that when resource demands exceed the supply and
users of Primavera Project Plannertrade (known as P3) performed RCS three things
happened 1) P3 fixed the resource supply-demand problem 2) P3 broke the Critical Path
and 3) P3 reported incorrect total float values because phantom float was created when
RCS was performed In order to fix these issues Kim and de la Garza [15] developed an
application that incorporates the RCPM The system reads project information directly
from a P3 project performs RCPM and then updates the P3 schedule The RCPM
application removes phantom float from P3 schedules but it does not remove phantom
float from P6 schedules because P6 is built on a different platform than P3
Over the last few years Boyle Project Consulting (BPC) and Ron Winter Consulting LLC
have developed their own software to overcome the weakness of current software when
7
dealing with resource-constrained schedules These two developments fix the RCS
techniquesrsquo shortcomings by identifying resource relationships of P6 and MS Project
schedules respectively However the programs do not apply an algorithm to systematically
identify and to add the RLs in the schedule They search the activities that were postponed
by the RCS method and create a relationship between the delayed task and the activities
that caused the delay This process does not identify all the RLs of the schedule
After testing Primavera P6 versions (P6 v832 and P6 v161) and MS Project v2016 both
software still creates phantom float in a resource-constrained schedule because they do not
apply any algorithm to remove phantom float This paper illustrates the presence of
phantom float in Primaverarsquos P6 v161 and MS Projectrsquos v2016 schedules
Methodology
Case of Study
To illustrate the presence of phantom float in Primaverarsquos P6 and MS Projectrsquos schedules
a warehouse project was used as a case of study (Fondahl 1991) The project consists of
31 activities with finish-to-start relationships and three types of resources carpenters (R1)
ironworkers (R2) and unskilled labor (R3) The maximum number of resources available
for each type of resource is four The activity calendar reflects a seven-day workweek The
project schedule was built on Primavera P6 v161 and MS Project v2016
Research Approach
The RCPM system developed by Kim and de la Garza (2005) was used to remove phantom
float from the P6 v161 schedule Since this RCPM application only reads and updates data
from a P3 file several steps were carried out to convert the P6 v161 file to a P3 format
(see Figure 2) Because a P6 v161 file cannot be directly exported to P3 this study also
used P6 v832 as an intermediary This process is very impractical since the user should
have installed P3 v31 and P6 v832 on a computer with an XP operating system (which is
no longer supported by Microsoft) However this approach was followed because the
RCPM system to remove phantom float from P6 andor MS Project schedules is still under
development
The warehouse project schedule was first created in P6 v161 and CPM and RCS were
performed This file was exported to P6 v832 and thereafter exported to P3 v31 With the
schedule in P3 the RCPM system identified the RLs removed phantom float and updated
the P3 schedule This schedule without phantom float was uploaded into P6 v161 by
performing the same process but in reverse (see Figure 2)
8
Figure 2 Process to remove phantom float on P6 v161 schedule
The RCPM system developed by Kim and de la Garza does not work for MS Project
Therefore phantom float was removed from this software schedule performing RCPM by
hand The RLs were identified while the forward pass of the parallel method was performed
and each of the non-critical activities was checked afterward to identify additional RLs
The resource relationships were added to the MS Project schedule manually to obtain the
real total float values and the correct critical path
Results
CPM and RCS in P6 v161
Once CPM was performed in P6 the project duration was 27 days An over-allocation
problem was identified for R1 during days 5 ndash 8 and 22 Since R1 exceeds the maximum
number of resources available (4) the serial method was performed in P6 to overcome this
supply-demand problem P6 allows the user to select several and different priority rules to
perform the serial method For this case of study the Late Start heuristic was selected
Figure 3 shows the project CPM schedule in P6 v161
Figure 3 CPM schedule in P6 v161
Figure 4 shows the schedule after the serial method was performed in P6 The project
duration was increased by three days from 27 days to 30 days Although the
supplydemand problem was fixed the critical path reported in Figure 4 as well as the total
float values are incorrect The critical path is broken because RCS techniques do not track
the activities that were shifted due to a resource limitation It can be seen in Figure 4 that
9
only the last two activities are critical according to P6 v161 The remaining activities are
labeled as non-critical with phantom float
Figure 4 RCS schedule in P6 v161
CPM and RCS in MS Project v2016
Once CPM was performed in MS Project v2016 the project duration was 27 days There
is also an over-allocation problem for R1 during days 5 ndash 8 and 22 Figure 5 shows the
project CPM schedule in MS Project Figure 6 shows the schedule after the parallel method
was performed in MS Project The project duration was also increased by three days from
27 to 30 days Like P6 the supplydemand problem was fixed but the critical path reported
in Figure 6 as well as the total float values are incorrect It can be seen in Figure 6 that
only five activities are critical and the remaining activities are labeled as non-critical with
phantom float
Figure 5 CPM schedule in MS Project v2016
Several activities in MS Project start later than those in P6 because the priority rules to
schedule activities applied by the serial and parallel methods differ (Table 1) MS Project
delayed activities with a greater total float As a result some activities are critical in MS
Project and not in P6
10
Figure 6 RCS schedule in MS Project v2016
Table 1 Activities start time in MS Project and P6 v161 after RCS was performed
Activities
Start Time
MS Project
Parallel
Method
P6 v161
Serial
Method
A4 Day 15 Day 9
A7 Day 20 Day 19
A8 Day 17 Day 16
A20 Day 16 Day 15
A22 Day 18 Day 16
A24 Day 22 Day 19
A27 Day 24 Day 21
Phantom Float
The following example gives an idea of what phantom float means Assume that Activity
A4 requires two carpenters to be executed and Activity A5 four carpenters (max = 4)
According to RCS results in P6 A4 has 14 days of float which means that A4 can be
delayed 14 days without affecting the project completion time (Figure 7a) However each
time that the ldquoapparently available floatrdquo of the A4 is used (activity was delayed by one
day) there is an over-allocation problem because this is not the real float of A4 (Figure
7b) In this case a link should be created between A4 and A5 (Figure 7c) The carpenters
will only be available to perform A5 once A4 is completed Otherwise six carpenters
would be needed to perform A4 and A5 in parallel and only four of them are available for
this project After performing the backward pass with the RLs added to the schedule it
turns out that instead of having 14 days of float the total float of A4 is zero
11
Figure 7 Example of phantom float and identification of resource links
Phantom Float in P6 v161
Fig 8 shows the presence of phantom float in P6 v161 According to the RCS output
Activity A4 has 13 days of float In theory project managers should be able to use this
float whenever they need it Nevertheless once the float of this activity is used (A4 was
delayed one day) there is an over-allocation problem again If the whole float of Activity
A4 is used in P6 each time the resource demands exceed the maximum number of
resources available This over-allocation arises because there is phantom float in the P6
schedule
Figure 8 Presence of phantom float in P6 v161
Phantom Float in MS Project v2016
Fig9 shows the presence of phantom float in MS Project v2016 According to the RCS
output Activity A4 has one day of float Like P6 once the float of Activity A4 is used in
MS Project there is a demand-supply problem This over-allocation arises because there is
phantom float in the MS Project schedule
12
Figure 9 Presence of phantom float in MS Project v2016
The schedule with no phantom float for each software is shown in Figure10 (P6 v161) and
Figure11 (MS Project v2016) After removing phantom float the resources are still
consistent with availability the float values are correct as well as the critical path
Figure 10 P6 v161 schedule with phantom float removed
Figure 11 MS Project schedule with phantom float removed
13
Table 2 shows a comparison of the P6 v161 and MS Project v2016 schedules after RCPM
was performed About 87 and 84 of the activities in the P6 v161 and MS Project v2016
schedules had phantom float after RCS Most of the non-critical activities became resource
critical in both schedules
The presence of phantom float in resource-constrained schedules makes impossible the
identification of a continuous critical path The critical path is lost when activities are
delayed due to resource unavailability (Wiest 1964) As a result all activities should be
assumed as critical and as influential of the project completion time (Lu and Li 2003)
Additionally the impact of a delaying event in the project duration cannot be anticipated
in schedules with phantom float Any reduction or increase in an activity duration cannot
be noticed since the critical path is broken Hence phantom float may lead to untrustworthy
results when performing delay analysis The parties involved may not be totally responsible
for the apportioned delays (Ibbs and Nguyen 2007)
Table 2 Comparison of P6 v161 and MS Project v2016 schedules after removing
phantom float
Software RCS
Method
Duration
(Days)
No Critical
Activities
before
removing PF
No
Activities
with PF
No RL
Created
No Critical
Activities
after
removing
PF
P6 v161 Serial 30 2 27 13 21
MS
Project
v2016
Parallel 30 5 26 11 25
Table 3 shows the float values obtained after removing phantom float from the P6 v161
and MS Project v2016 schedules Depending on the RCS method used to mitigate the
resource supply-problem when performing the RCPM different outcomes can be obtained
for the same project The activities sequence differs in both schedules and so the RLs and
the phantom float values
Table 3 RCPM output for the P6 v2016 and MS v2016 project schedules
Primavera P6 v161 Microsoft Project v2016
After
RCS
After
RCPM
Phantom
Float
Resource
Links
After
RCS
After
RCPM
Phantom
Float
Resource
Links
01 3 0 3 - 0 0 0 -
02 3 0 3 - 0 0 0 -
03 2 0 2 29 2 0 2 29
04 14 0 14 05 6 0 6 08
05 8 0 8 - 3 0 3 -
06 3 0 3 - 3 0 3 -
07 6 1 5 23 5 0 5 23
14
08 6 1 5 0724 5 0 5 07 24
09 3 0 3 04 3 0 3 -
10 8 5 3 - 8 5 3 -
11 3 0 3 - 3 0 3 -
12 3 0 3 05 3 0 3 05
13 3 0 3 - 3 0 3 -
14 5 0 5 - 3 0 3 -
15 3 0 3 - 3 0 3 -
16 8 0 8 17 8 0 8 -
17 3 0 3 - 3 0 3 -
18 8 2 6 08 8 0 8 04 19
19 3 0 3 08 3 0 3 -
20 8 3 5 - 6 1 5 -
21 3 0 3 - 3 0 3 -
22 8 3 5 - 6 1 5 -
23 3 0 3 - 3 0 3 -
24 6 1 5 23 5 0 5 23
25 3 0 3 03 3 0 3 03
26 3 3 0 - 3 3 3 -
27 6 5 1 - 5 4 1 -
28 3 3 0 - 3 3 0 -
29 1 0 1 30 1 0 1 30
30 0 0 0 - 0 0 0 -
31 0 0 0 - 0 0 0 - Successor Activities
Discussion
In time-constrained scheduling unlimited resources are assumed Under this scenario the
traditional definition of total float is valid ie the amount of time an activity can be
delayed without affecting the project completion time The resulting critical path allows 1)
to identify critical and near-critical activities and 2) to anticipate the effect of a delay or
change in a project schedule
Conversely in resource-constrained scheduling (RCS) there is limited resource
availability in a project The resource supply-demand problem is addressed by considering
both the logical relationships among the activities and the availability of resources at any
given point in time RCS algorithms first prioritize the order of activities then schedule
them as early as possible subject to existing logical relationships and resource availability
When resources are not available RCS algorithms postpone the start time of the activities
until the resources required become available In consequence the intended project
completion date may be extended Indeed it is well documented in the literature that RCS
algorithms do not guarantee that the original project completion date will be met
Unlike time-constrained schedules in resource-constrained schedules the concepts of total
float and critical path lose their significance (Wiest 1964 Fondahl 1991 Bowers 1995
15
Raz and Marshall 1996 Rivera and Duran 2004) That is the total float is now constrained
by both forward and backward CPM calculations as well as resource availability which is
not the case in time-constrained schedules where the total float is only constrained by
forward and backward CPM calculations
To date Primavera P6 continues to be plagued by the same issues pointed out by Kim and
de la Garza in 2003 when P3 was available (Kim and de la Garza 2003) That is in
resource-constrained schedules Primavera P6 calculates the total float assuming a time-
constrained schedule as opposed to a resource-constrained schedule Primavera P6
correctly determines the activitiesrsquo earliest dates that satisfy the resource limitations but it
calculates total float based on a ldquoTime Contextrdquo (LF ndash EF andor LS ndash ES) ignoring the
presence of resource constraints As illustrated in this paper and in these circumstances
the total float is no longer the amount of time an activity can be delayed without affecting
the project completion time The combination of resource-constrained schedules with total
float calculated on a time-context basis makes impossible the anticipation of the impact of
a delaying event in the project completion time
Scheduling software developers such as Oracle and Microsoft have not progressed in
removing phantom float from resource-constrained schedules Therefore it is the userrsquos
responsibility to recognize that the calculation of total float by the software relies on a time-
based context and hence the total float reported cannot be trusted andor used to mitigate
delaying events like the traditional time-based context definition of total float suggests
Conclusion
Project management software has become an essential tool for planning and control
projects Primavera P6 and Microsoft (MS) Project are two of the most frequently used
scheduling software in the construction industry Although these programs help users to
develop the project plan and to report the project status they do not appropriately support
the decision process when dealing with resource project allocations and constraints In
order to mitigate the resource supply-demand problem Resource-Constrained Scheduling
(RCS) techniques have been incorporated in Primavera P6 and MS Project
RCS methodologies solve the resource conflicts but create phantom float in the schedules
ndasha float that does not really exist RCS methods overlook the resourcesrsquo relationships
between activities that compete for the same but unavailable resources As a result the
critical path is broken In the last years several algorithms have been developed to identify
the critical path in a resource-constrained schedule However some of them identify
unnecessary resource links andor remove some technological relationships from the
schedule The redundant resource links increase the network complexity and the removal
of technological relationships jeopardizes the updating process of the schedule since the
logical sequence of the project may be lost
After testing Primavera P6 versions (P6 v832 and P6 v161) and MS Project v2016 both
software packages still create phantom float in resource-constrained schedules because
16
they do not apply any algorithm to remove phantom float The software correctly
determines the activitiesrsquo earliest dates that satisfy the resource limitations but they
calculate total float based on a ldquoTime Contextrdquo (LF ndash EF andor LS ndash ES) ignoring the
presence of resource constraints Hence the floats calculated by the software cannot be
trusted or used as traditional definitions suggest ie the amount of time an activity can be
delayed without affecting the project completion time
On a regular basis professionals use commercial available software to resource load the
schedules without paying attention to the resulting critical path and float values However
they should recognize the presence of phantom float in resource-constrained schedules
because it may lead them to make decisions based on unreliable schedules Non-critical
activities may be considered resource critical if they fail to release the resources needed by
a critical activity on time The actual float values may be shorter than calculated during
RCS or may be altogether non-existent (Fondahl 1991) This makes impossible the
identification of the critical path and thus the anticipation of the impact of a delaying event
in the project completion time The incorporation of an enhanced Resource Constraint
Critical Path (RCPM) in a system to solve the RCSrsquo drawbacks in Primavera P6 and MS
Project is being explored at Virginia Tech
References
Baki M A (1998) CPM scheduling and its use in todays construction industry Project
Management Journal 29(1) 7ndash9 Retrieved from
httpswwwpmiorglearninglibrarycritical-path-method-scheduling-construction-
industry-2069 (Accessed December 6 2018)
Bowers J A (1995) Criticality in Resource-Constrained Networks Journal of the
Operational Research Society 46 80-91 DOIorg101057jors19959
Boyle T M (2016) BCP Logic Filter for Microsoft Project Retrieved from Charlotte
NC httpwwwboyleprojectconsultingcomWeb20FilesBPCLogicFilter-
Intro20R2pdf (Accessed December 6 2018)
Davis E W (1974) CPM Use in Top 400 Construction Firms Journal of the Construction
Division 100 (1) 39-49 Retrieved from
httpscedbasceorgCEDBsearchrecordjspdockey=0021563 (Accessed December 6
2018)
de la Garza J M and Franco-Duran D M (2017 December 20) CPM Benefits in
Estimating Bidding Reported in Survey (B Buckley Ed) Retrieved from Engineering
News-Record httpswwwenrcomarticles43666-cpm-benefits-in-estimating-bidding-
reported-in-survey (Accessed December 6 2018)
17
Fondahl J W (1991) The Development of the Construction Engineer Past Progress and
Future Problems Journal of Construction Engineering and Management 117(3) 380-392
DOIorg101061(ASCE)0733-9364(1991)1173(380)
Galloway P D (2006) Survey of the Construction Industry Relative to the Use of CPM
Scheduling for Construction Projects Journal of Construction Engineering and
Management 132(7) 697 - 711 DOIorg101061(ASCE)0733-9364(2006)1327(697)
Ibbs W and Nguyen L D (2007) Schedule Analysis under the Effect of Resource
Allocation Journal of Construction Engineering and Management 133 2 131-138
DOIorg101061(ASCE)0733-9364(2007)1332(131)
Kastor A and Sirakoulis K (2009) The effectiveness of resource leveling tools for
Resource Constraint Project Scheduling Problem International Journal of Project
Management 27 493ndash500 DOIorg101016jijproman200808006
Kelleher A H (2004) An Investigation of the Expanding Role of the Critical Path Method
by ENRs Top 400 Contractors Virginia Tech Blacksburg VA Retrieved from
httpsvtechworkslibvteduhandle109199889 (Accessed December 6 2018)
Kim K (2003) A Resource-constrained CPM (RCPM) Scheduling and Control Technique
with Multiple Calendars Virginia Tech Blacksburg Virginia Retrieved from
httpsvtechworkslibvteduhandle1091928139 (Accessed December 6 2018)
Kim K and de la Garza J M (2003) Phantom Float Journal of Construction
Engineering and Management 129(5) 507-517 DOIorg101061(ASCE)0733-
9364(2003)1295(507)
Kim K and de la Garza J M (2005) Evaluation of the Resource-Constrained Critical
Path Method Algorithms Journal of Construction Engineering and Management 131(5)
522-532 DOIorg101061(ASCE)0733-9364(2005)1315(522)
Kim K and de la Garza J M (2005) A New Approach to Resource-Constrained
Scheduling Towards a Vision for Information Technology in Civil Engineering 1-6
Reston VA American Society of Civil Engineers DOIorg10106140704(2003)48
Liberatore M J Pollack-Johnson B and Smith C A (2001) Project Management in
Construction Software use and Research Directions Journal of Construction Engineering
and Management 127(2) 101-107 DOIorg101061(ASCE)0733-9364(2001)1272(101)
Lu M and Li H (2003) Resource-Activity Critical-Path Method for Construction
Planning Journal of Construction Engineering and Management 129(4) 412-420
DOIorg101061(ASCE)0733-9364(2003)1294(412)
18
Moder J J Phillips C R and Davis E W (1983) Project Management with CPM
PERT and precedence diagramming (3rd ed ed) New York Van Nostrand Reinhold
ISBN 780442254155
Pantouvakis J-P and Manoliadis O G (2006) A Practical Approach to Resource-
Constrained Project Scheduling Operational Research An International Journal 6(3)
299-309 DOIorg101007BF02941258
Raz T and Marshall B (1996) Effect of resource constraints on float calculations in
project networks International Journal of Project Management 14(4) 241-248
DOIorg1010160263-7863(95)00090-9
Rivera F A and Duran A (2004) Critical clouds and critical sets in resource-constrained
projects International Journal of Project Management 22(6) 489-497
DOIorg101016jijproman200311004
Tavakoli A and Riachi R (1990) CPM Use in ENR Top 400 Contractors Journal of
Management in Engineering 6(3) 282-295 DOIorg101061(ASCE)9742-
597X(1990)63(282)
Wiest J D (1964) Some Properties of Schedules for Large Projects with Limited
Resources Operation Research 12(3) 395-418 DOIorg101287opre123395
Woodworth B M and Shanahan S (1988) Identifying the critical sequence in a
resource-constrained project International Journal of Project Management 6(2) 89-96
DOIorg1010160263-7863(88)90030-0
19
CHAPTER 2
Review of Resource-Constrained Scheduling Algorithms2
Abstract
On a regular basis project managers concentrate their efforts on critical and near-critical
activities However the concepts of total float and critical path lose their significance after
applying resource-constrained scheduling (RCS) techniques RCS techniques mitigate the
resource supply-demand problem but break the critical path As a result several algorithms
have been developed to identify a continuous critical path in resource-constrained
schedules
This study reviews and evaluates the performance of eight RCS related algorithms with the
purpose of identifying the shortcomings that must be addressed so they can be applied for
delay analysis The review shows that a systematic procedure is needed to 1) incorporate
and handle dynamic resource links when the schedule is updated and 2) select a potential
resource link configuration Addressing these limitations will make the algorithms more
practical for real construction and engineering projects and will allow a more realistic delay
analysis since schedules will reflect the real conditions of the project (resource loaded)
This study 1) discusses potential solutions to the shortcomings of the existing algorithms
2) provides recommendations on the methods that can be used by industry professionals
and 3) proposes a system to facilitate the selection of an algorithm based on their common
features (heuristic) constraints (removal of logic links) and project characteristics
(resources and calendars)
Keywords Critical Path Delay Analysis Phantom Float Resource-Constrained
Schedules Resource Relationships
Introduction
The Critical Path Method (CPM) is a useful tool to plan and control the work of a project
(Baki 1998 de la Garza and Franco-Duran 2017) In fact about 97 of the Engineering
News-Recordrsquo (ENR) Top 400 contractors indicated that CPM is a valid management tool
(de la Garza and Franco-Duran 2017) Over half of the contractors also indicated that CPM
does not have major disadvantages (de la Garza and Franco-Duran 2017) However CPM
does not consider resource project allocations and constraints
Instead CPM assumes that unlimited resources will be available at any time when required
to execute project activities (Wiest 1963 Woodworth and Shanahan 1988 Lu and Li
2 Franco-Duran D M amp de la Garza J M (November 01 2019) Review of Resource-Constrained
Scheduling Algorithms Journal of Construction Engineering and Management 145 11)
DOIorg101061(ASCE)CO1943-78620001698
20
2003 Pantouvakis and Manoliadis 2006 Kastor and Sirakoulis 2009 Nisar et al 2013)
This assumption is unrealistic because activities require a specific amount of resources to
be executed and projects have a certain number of resources available to complete
activities which constraints the schedule in terms of resources (Resource-Constrained
Schedules)
Oftentimes the resource demand exceeds the maximum number of resources available for
the project (Woodworth and Shanahan 1988 Lu and Li 2003 Pantouvakis and
Manoliadis 2006) To mitigate this resource-supply demand problem Resource-
Constrained Scheduling (RCS) techniques which are based on priority rules postpone the
start time of some activities when the units of resources required to complete them are not
available (Abeyasinghe et al 2001 Lu and Li 2003)
RCS techniques solve the resource conflicts but they create phantom float in the schedule
(a float that does not exist) ie each time an activity uses this apparent float there is a
resource violation in the schedule (Kim and de la Garza 2003) RCS techniques neglect
the resource relationships between activities that compete for the same but limited
resources (Fondahl 1991) As a result the critical path is broken and all activities must be
considered critical The lack of a continuous critical path makes impossible the anticipation
of the impact of a delaying event in the project completion time (Woodworth amp Shanahan
1988 Bowers 1995 Kim 2009)
Several algorithms have been developed to address the shortcomings of RCS methods
Some of these algorithms provide correct float values and a continuous critical path
because they consider not only the technological relationships but also the resource
relationships between activities In 2005 Kim and de la Garza compared the performance
of the Resource Critical Path Method (RCPM) with four RCS related algorithms
At present CPM is frequently used for delay analysis and courts accept CPM as a reliable
tool to perform this analysis Indeed one of the main reasons noted by 100 out of 133 ENR
Top 400 contractors for using the CPM is to perform schedule impact and claim analysis
(de la Garza and Franco-Duran 2017) Because the existing delay methodologies are based
on CPM schedules the resource load and constraints are relevant aspects often disregarded
during the application of a delay analysis technique (Ibbs and Nguyen 2007 Braimah
2013) These factors may influence the outcome of the analysis since the project
completion time can be affected by resource availability Up to date few studies have been
published about how to perform a delay analysis considering resource-constrained
schedules without phantom float
As an extension of the work published by Kim and de la Garza (2005) the present study
reviews eight RCS related algorithms with the purpose of identifying the shortcomings that
must be addressed so they can be applied for delay analysis (Woodworth and Shanahan
1988 Bowers 1995 Kim and de la Garza 2003 Lu and Li 2003 Abeyasinghe et al
2001 Rivera and Duran 2004 Pantouvakis and Manoliadis 2006 and Nisar et al 2013)
Four out of the eight algorithms were not considered by Kim and de la Garza (2005)
Additionally this paper evaluates the algorithmsrsquo performance to provide some
21
recommendations on the methods that can be used by industry professionals The
performance is measured in terms of four indicators 1) the percentage increase of project
duration above the CPM length the percentage increase of the network complexity 3) the
percentage of activities with free float and 4) the percentage of critical activities
Methodology
The performance of the Resource-Constrained Critical Path Method (RCPM) developed
by Kim and de la Garza in 2003 was compared with that of seven RCS related algorithms
Initially the RCPM was developed under a serial approach This study performed the
RCPM under the serial and parallel methods
In the RCPM serial-based activities are sorted in ascending order according to the Late
Start Time (LS) If there is a tie with respect to the LS the priority is given to the activity
with the least duration (D) If the tie persists the activity with the least Total Float (TF) is
scheduled first If there is still a tie with respect to the TF the tie is broken by the smallest
activity number (ID) In the RCPM parallel-based activities are sorted in ascending order
according to the Early Start Time (ES) If there is a tie with respect to the ES the priority
is given to the activity with the least LS If the tie persists the activity with the least D is
scheduled first If there is still a tie with respect to the D the tie is broken by the smallest
activity ID
The examples provided by Woodworth and Shanahan (1988) Bowers (1995)
Abeyasinghe et al (2001) Lu and Li (2003) Rivera and Duran (2004) Pantouvakis and
Manoliadis (2006) and Nisar et al (2013) were used to generate the RCPM schedules
(serial and parallel-based)
In the serial approach the activitiesrsquo sequence is defined before scheduling the project
(Moder et al 1983 Abeyasinghe et al 2001 Lu and Li 2003) All activities are sorted as
a single group and then scheduled one at a time (Moder et al 1983) In the parallel
approach the activitiesrsquo sequence is defined and updated at the start of each day
(Abeyasinghe et al 2001 Lu and Li 2003) The RCPM is briefly described as follows
(Kim and de la Garza (2003) Kim (2003)
1 Apply the Late Start heuristic under the serial approach If an activity is delayed
create a resource link between the postponed activity and the preceding activity that
shares the same resources
2 Perform the backward pass considering the technological and resource
relationships
3 Determine if the total float values of noncritical activities can be used during the
whole period If not create the corresponding resource link
4 Find alternative schedules by looking for activities that can be scheduled during a
different period without breaching the technological and resource relationships
22
Depending on the heuristicsrsquo priority rules different results can be obtained for the same
project in terms of duration the number of resource links and critical activities These
parameters were considered to measure the algorithmsrsquo performance by calculating the
percentage increase of project duration above the CPM length (Equation 1) the percentage
increase of network complexity (Equation 2) the percentage of activities with free float
(Equation 3) and the percentage of critical activities (Equation 4) These performance
indicators are practical measures that be calculated after the application of any algorithm
119868119899119888119903119890119886119904119890 119863119906119903119886119905119894119900119899 = 119875119903119900119895119890119888119905 119863119906119903119886119905119894119900119899 minus 119862119875119872 119871119890119899119892119905ℎ
119862119875119872 119871119890119899119892119905ℎ 119909 100 (Eq 1)
119868119899119888119903119890119886119904119890 119873119862 =119873119862119877119871 minus 119873119862
119873119862119909 100 119873119862 =
sum 119879119877119894119895119873119894
119873 (Eq 2)
119860119888119905119894119907119894119905119894119890119904 119865119865 =sum 119873119865119865
119873119894
119873119909 100 (Eq 3)
119862119903119894119905119894119888119886119897 119860119888119905119894119907119894119905119894119890119904 = sum 119873119879119865=0
119873119894
119873119909 100 (Eq 4)
Where NC is the network complexity including only the technological relationships from
the CPM schedule TRij are the non-redundant technological relationships NCRL is the
network complexity including technological and resource relationships N is the total
number of activities NFF is the number of activities with Free Float (FF) and NTF=0 is the
number of activities with Total Float (TF) equals zero
The percentage increase of project duration above the critical path length has been used by
several authors to compare the efficacy of RCS heuristics (Patterson 1973 Davis and
Patterson 1976 Patterson 1976 Gordon 1983 Alvarez-Valdez and Tamarit 1989
Ulusoy and Ozdamar 1989) This measure represents the delay generated by the resource
unavailability because of the heuristic employed (Patterson 1973) According to previous
studies the heuristics with a better performance increase the project duration on average
by 37 (Boctor 1996)
Some algorithms identify redundant or unnecessary resource links These additional links
do not affect the float calculations but they increase the computational time and the
complexity of the network The percentage increase of the network complexity is
calculated in terms of the average number of precedence relationships per activity after
adding the resource links to the schedule
The percentage of activities with free float and the percentage of critical activities are
measures of schedule flexibility Project managers may find beneficial to have some float
in the schedule in order to mitigate potential delaying events The greater the percentage
23
of activities with free float the greater the number of activities that can start late without
affecting the start of its successor activities On the other hand the lower the number of
critical activities the lower the probability to cause delays to the project
Algorithms Review
This section describes and compares the algorithms developed by Woodworth and
Shanahan (1988) Bowers (1995) Abeyasinghe et al (2001) Kim and de la Garza (2003)
Lu and Li (2003) Rivera and Duran (2004) Pantouvakis and Manoliadis (2006) and Nisar
et al (2013) Table 1 shows a summary of these eight algorithms
These RCS related algorithms were developed with the aim of providing project managers
a tool to 1) correctly schedule and identify critical activities with respect to time and
resource allocation and 2) correctly calculate the total float of each activity under resource
constraints (Woodworth and Shanahan 1988) In practice the algorithms have been
implemented as mechanisms to 1) prioritize and re-examine critical activities and 2) control
the project (Abeyasinghe et al 2001)
24
Table 1 Characteristics of the algorithms
Algorithm
Features
Woodworth Bowers Abeyasinghe Kim Lu Rivera Pantouvakis Nisar et al
1988 1995 2001 2003 2003 2004 2006 2013
RCS Method Parallel Parallel Serial Serial Serial Any Serial Any
Heuristic Min Slack Min LS Companion
Activities
LS + D +
TF
Work
Content NS LS
Ranked
Positional
Weighted
Identify Critical
Path Yes Yes Yes Yes Yes No Yes Yes
Keep
Technological
Relationships
Yes Yes No Yes No Yes No No
Split Allowed Yes NS No No No NS No No
Multiple
Resources Yes Yes Yes Yes Yes Yes Yes No
Multiple
Calendars NS NS NS Yes No No No NS
Create Phantom
Float No No Yes No No Yes No No
Identify RLs Yes Yes Yes Yes Yes No Yes Yes
Phase where RLs
are created
Backward
Pass
Forward amp
After
Backward
Pass
Forward
Pass
Forward amp
After
Backward
Pass
After
Forward
Pass
NA Forward
Pass
Forward amp
Backward
Pass
Unnecessary
RLs Yes Yes No No Yes NA Yes No
Dynamic RLs No No No No No No No No
NA Not Apply
25
Woodworth and Shanahan (1988)
Woodworth and Shanahanrsquos algorithm identifies critical resources the time of resource critically
and a critical sequence According to Woodworth and Shanahan a critical sequence consists of
activities that share technological and resource relationships and takes the longest time to be
completed The algorithm is briefly described as follows
1 Perform the Minimum Slack heuristic under the parallel method approach
2 Record a label for each activity the resource ID and the order in which each resource is
used during the forward pass In addition record in a resource pool the ID of the activities
that use the resources
3 Search the resource usage history and the activitiesrsquo order to find the immediate
predecessor of the current activity during the backward pass Create a resource link if the
Early-Start Time (ES) of the predecessor activity and the Early-Finish Time (EF) of the
current activity are equal and they are not technologically connected
4 Calculate the technologicalresource slack (Total Float) as the difference between the ES
and EF of each activity once all activities are connected
Comparison
The schedule provided in Woodworth and Shanahanrsquos study has 15 activities (including a start
activity) and 17 logical relationships (NC = 113) The project requires two types of resources (RA
and RB) and the maximum resources available per type is one unit The CPM duration is 31 days
(see Figure 1)
Figure 1 Network Diagram (Kim and de la Garza 2005)
The project duration was increased by 13 days (from 31 to 44 days) after mitigating the resource
supply-demand problem (see Figure 2) Although Woodworth and Shanahanrsquos algorithm creates
resource-induced discontinuities in the schedule (resource links) the authors did not provide
further details on how to create these links when an activity requires multiple types of resources
or on how to handle activities with no resource requirements in the resource pool (Kim and de la
Garza 2005)
26
Figure 2 Woodworth and Shanahanrsquos Schedule (Woodworth and Shanahan 1988)
The RCPM schedules under the serial and parallel approaches are shown in Figure 3 The main
difference between the two schedules is the activitiesrsquo sequence which leads to a different resource
link configuration Specifically the sequence of activities A5-10 A7-9 and A9-10
Figure 3a Serial-Based Schedule
Figure 3b Parallel-Based Schedule
Figure 3 RCPM Results for Woodworth and Shanahanrsquos Example
27
All three schedules have a continuous critical sequence and they do not have phantom float
Although Woodworth and Shanahanrsquos algorithm provides a shorter duration (44 days) and the
schedule has fewer critical activities (53) the algorithm increases the network complexity by
101 (see Table 2) The RCPM serial-based schedule is more flexible than the RCPM parallel-
based schedule in terms of the number of activities with free float but it has more critical activities
and creates more resource links Both algorithms increased the project duration by more than 37
Table 2 Comparison with Woodworth and Shanahanrsquos Result
Authors
RCS
Method Duration
(Days)
Resource
Links
Increase
Duration
Increase
NC
Critical
Activities
Activities
with FF
Woodworth
and
Shanahan
Parallel
(ES +
TF)
44 8 42 101 53 13
Kim and de
la Garza
Serial
(LS) 46 5 48 76 67 20
Parallel
(ES +
LS)
45 4 45 68 60 13
Bowers (1995)
Bowersrsquo algorithm is similar to that proposed by Woodworth and Shanahan (1988) The main
difference between the two algorithms is the phase where resource links are identified and created
in the schedule While in Woodworth and Shanahanrsquos algorithm resource links are created during
the backward pass in Bowersrsquo algorithm resource links are created during the forward pass
Bowersrsquo algorithm is briefly described as follows
1 Apply the Minimum Latest Start heuristic under the parallel approach (This rule is
equivalent to the Minimum Slack heuristic)
2 Identify and create resource links during the forward pass considering the resource usage
of each activity
3 Perform the backward pass considering the technological and resource links
Comparison
Bowersrsquo schedule has 11 activities and 12 logical relationships (NC = 109) The project requires
two types of resources (RA and RB) and the maximum resources available per type is one unit for
RA and two units for RB (see Figure 4) The CPM duration is 86 days
28
Figure 4 Bowersrsquo Network Diagram Modified from (Bowers 2005)
According to Bowersrsquo result the project duration was increased by 15 days (from 86 to 101 days)
after solving the resource conflicts (see Figure 5) Bowersrsquo algorithm assumes that resource
allocation does not change over time (Kim and de la Garza 2005) This assumption which is
unrealistic in todayrsquos projects neglects the possibility of schedule changes in terms of resource
availability Besides Bowers did not explain whether unidentified or additional resource links are
added to the schedule during or after the backward pass For instance the resource link between
Activities A6 and Activity A5 cannot be identified during the forward pass (see Figure 5)
Figure 5 Bowersrsquo Result (Bowers 2005)
Otherwise both RCPM schedules are equal The serial method generated the same sequence of
activities as that when the parallel method was applied (see Figure 6) These two RCPM schedules
match with the schedule obtained by Bowers (see Table 3)
Figure 6 RCPM Serial and Parallel-Based Schedule
29
Table 3 Comparison with Bowersrsquo Result
Authors
RCS
Method Duration
(Days)
Resource
Links
Increase
Duration
Increase
NC
Critical
Activities
Activities
with FF
Bowers Parallel 101 4 17 33 64 18
Kim and
de la
Garza
Serial amp
Parallel 101 4 17 33 64 18
Abeyasinghe Greenwood and Johansen (2001)
The algorithm proposed by Abeyasinghe et al is briefly described as follows
1 Perform CPM and create the Gantt chart of the project based on early dates
2 Draw the link-structure of the project This structure is a combination of the various logic
paths of the project network Vertical lines and right-handed arrows represent activity
relationships
3 Manipulate the link-structure to eliminate the resource conflicts while ensuring a minimum
project duration The structure is compressed according to some rules defined by the
authors
4 Identify possible critical paths The longest path becomes the only critical path
Comparison
Abeyasinghe et al network has 11 activities and 10 logical relationships (NC =111) The project
requires one type of resource (R) with maximum availability of five units The CPM duration is
19 days (see Figure 7) The project duration was increased by nine days (from 19 to 28 days) after
mitigating the over-allocation problem (see Figure 8)
Figure 7 Network of Abeyasinghe et al Study (Abeyasinghe et al 2001)
30
Although Abeyasinghe et al schedule has a shorter duration than the RCPM schedule there is a
resource availability violation for the total float periods of Activity B As reported by Figure 8b
Activity B has 25 days of float Nonetheless if this float is used during days 11 to 20 or during
days 27 to 28 (ie Activity B is delayed) there is an over-allocation problem In both instances
six resources would be required and there are only five resources available for this project
Therefore this schedule has phantom float This resource violation occurs because the algorithm
removed the technological relationship between Activity B and Activity G (see Figure 8a)
Figure 8a Network Diagram
Figure 8b Gantt Chart
Figure 8 Abeyasinghe et al Result (Abeyasinghe et al 2001)
As presented in Table 4 the complexity of Abeyasinghe et al schedule did not increase after
adding the resource links in the network Instead the network complexity decreased because the
algorithm removed some technological relationships (NC is negative) Although the removal of
these technological relationships does not affect the float calculations it jeopardizes the updating
process of the schedule because the logic sequence of the project is lost
For this example both RCPM schedules are equal (see Figure 9) Even though the RCPM duration
is 32 higher than that obtained by Abeyasinghe et al algorithm the RCPM schedule does not
have phantom float
Table 4 Comparison with Abeyasinghe et al Result
Authors
RCS
Method Duration
(Days)
Resource
Links
Increase
Duration
Increase
NC
Critical
Activities
Activities
with FF
Abeyasinghe
et al
Parallel
28 6 47 -26 67 -
Kim and de
la Garza
Serial amp
Parallel 34 4 79 15 44 33
31
Figure 9 RCPM Serial and Parallel-Based Schedule
Rivera and Duran (2004)
Rivera and Duran introduced the concepts of critical set and critical cloud to identify critical
activities in a resource-constrained schedule A critical sequence connects critical clouds andor
critical tasks A critical cloud includes all possible critical sets A critical set is a group of activities
that simultaneously constrain the project progress and impacts the project completion time if all
the activities of the set are delayed This set of activities is critical during a specific period A
critical activity is a critical cloud with a critical set of only one task As shown in Figure 10b a
color code identifies critical clouds with only one activity a critical set or more than one critical
set
Comparison
Rivera and Duranrsquos schedule has 15 activities and 19 logical relationships (NC = 127) The project
requires one type of resource (R) with maximum availability of four units The CPM duration is
18 days (see Figure 10a) The project duration was increased by five days (from 18 to 23 days)
after mitigating the resource supply-demand problem (see Figure 10b)
Figure 10a Network Diagram
32
Figure 10b Algorithmrsquos Result
Figure 10 Rivera and Duranrsquos Schedule (Rivera and Duran 2004)
Rivera and Duranrsquos algorithm does not create resource links between activities As a result the
schedule lacks a continuous critical sequence Additionally critical activities do not have a zero
total float and some activities have phantom float (Activity E and Activity M) Neither the free
float values nor the total float values of the activities in Rivera and Duranrsquos schedule can be
correctly computed due to the lack of resource links
The RCPM schedules under the serial and parallel approaches are shown in Figure 11 These two
schedules do not have phantom float The main difference between the two schedules is the start
time of Activity M Activity M starts earlier in the parallel-based schedule than in the serial-based
schedule The early start of Activity M decreases the number of resource links required in the
schedule Thus the RCPM parallel-based schedule provides a better activitiesrsquo configuration in
terms of duration network complexity critical activities and activities with free float (see Table
5)
Table 5 Comparison with Rivera and Duranrsquos Result
Authors
RCS
Method Duration
(Days)
Resource
Links
Increase
Duration
Increase
NC
Critical
Activities
Activities
FF
Rivera
and
Duran
NS 23 No 28 0 53 -
Kim
and de
la
Garza
Serial
(LS) 22 8 22 42 40 7
Parallel
(ES +
LS)
21 5 17 26 33 20
Note NS = Not Specified
33
Figure 11a Serial-Based Schedule
Figure 11b Parallel-Based Schedule
Figure 11 RCPM Results for Rivera and Duranrsquos Example
Lu and Li (2003)
Lu and Li (2003) developed the Resource-Activity Critical-Path Method as a serial based approach
in which the Work Content (WC) is the primary criterion to schedule activities The work content
is the relative weight of each activity with respect to time and resource usage The work content is
calculated as the number of resources multiplied by the activity duration Limited resources are
first assigned to activities with higher work content since these activities may affect the project
completion time Lu and Lirsquos algorithm is briefly described as follows
1 Determine the status of each activity as CAN-DO TO DO or DONE Update this status
each time that an activity is scheduled Then calculate the work content of each activity
34
2 Sort the CAN-DO activities in descending order according to their work content If there
is a tie with respect to the work content schedule the activity with a larger number of
resources or longer duration first
3 Determine and update the time when resources are ready to work (Ready to Serve Time -
RST) Allocate the number of resources needed for the current activity based on the RST
4 Determine the Early Start Time (ES) of each activity considering the maximum date
between the Early Finish Time (EF) of its predecessors and the RST of its resources
5 Calculate the idle time of resources before being allocated to an activity as the difference
between the ES of the current activity and the RST of the participating resources Check if
the resources allocated to the current activity can be allocated to another CAN-DO activity
6 Replace the RST of the resources participating in the current activity with the EF of the
current activity Repeat the previous steps until all activities are completed
7 Identify the resource-constrained successor activities ie the first activity that uses the
same resource of the current or predecessor activity Then create the corresponding links
between the activities
8 Perform the backward pass considering the technological and resource relationships
Lu and Lirsquos algorithm requires a lot of in-between work (additional networks andor tables) to
handle the interaction and allocation of resources This turns out to be impractical when applying
it to real projects (Pantouvakis and Manoliadis 2006) Besides the use of the work content as a
priority rule generates different results for the same project when having activities with multiple
types of resource requirements Under this scenario the user should determine which type of
resource is more important and based on that criterion calculate the work content
Besides Lu and Li did not specify how to schedule activities with no resource requirement These
activities do not affect the schedule by holding up resources but they are necessary to keep the
logic sequence of a project Activities with no resource requirements should not have the least
priority to be scheduled (WC = 0) On the other hand when there is a resource-dependency
between activities that are also technologically connected the resource relationship takes
precedence over the logical relationship ie some technological relationships are removed from
the schedule
Pantouvakis and Manoliadis (2006)
Pantouvakis and Manoliadisrsquo algorithm is briefly described as follows
1 Apply any RCS method to mitigate the resource supply-demand problem
2 Identify the resource dependencies that exist between the activities from the resource
histogram A resource dependence exists if an activity uses part or all the resources of its
predecessor activity
3 Re-draw the network considering not only the logical relationships but also the resource
relationships Review the schedule to determine if the project can be logically performed
If not reconsider the resource limits and perform the algorithm a second time
4 Perform the CPM in the final network to obtain the total float values
5 Pantouvakis and Manoliadisrsquo algorithm assumes that resource requirements do not change
over time Besides since the algorithm is based on the resource-leveled histogram the user
35
should identify the resource dependencies between activities by inspection This process is
prone to errors when having large networks
Nisar Yakamamoto and Suzuki (2013)
Nisar et al proposed the Resource-Dependent Critical Path Method which 1) identifies different
types of resource dependencies 2) determines alternative schedules and 3) optimizes the number
of resource links when having multiple alternatives to create them for a specific activity The
algorithm is described as follows
1 Perform the forward and backward pass of any RCS method (Nisar et al applied the
Ranked Positional Weighted method)
2 Perform the backward pass of the selected RCS method
21 Reverse the original schedule (ie the predecessor activities become the successorrsquos
activities and vice-versa) Then perform the CPM forward pass
22 Calculate the Constrained Latest Finish (CLF) time for each activity of the reverse
schedule obtained in Step 21 (CLF = Project Duration ndash Early Start Time) Perform
the RCS a second time and obtain the reverse RCS schedule
23 Calculate the CLF time for the reverse RCS schedule of Step 22
3 Determine resource dependencies
31 Create a strict resource precedence relationship when the start time of a current activity
is delayed by the same time that its predecessor activity is delayed
32 Create a flexible resource precedence relationship when the predecessor activity is
delayed more than one day and if it affects the start time of the current activity
33 Minimize the total number of resource relationships without violating any resource
constraint
4 Remove redundant relationships from the schedule
The two main limitations of Nisar et al algorithm are 1) multiple types of resources cannot be
considered and 2) technological relationships with lags cannot be included in the schedule In
addition the authors did not provide a reasonable argument that supports the development of
reverse CPM and RCS schedules These several in-between steps of the algorithm are impractical
for practitioners
Case Study
Ahuja et al schedule was used by Lu and Li (2003) Pantouvakis and Manoliadis (2006) and
Nisar et al (2013) to illustrate their proposed algorithms The schedule has 11 activities and 14
logical relationships (NC = 127) The project requires one type of resource (R) and the maximum
resource availability is six units The CPM duration is 14 days (see Figure 12)
36
Figure 12a Network Diagram
Figure 12b Bar Chart
Figure 12 Ahuja et al Schedule (Pantouvakis and Manoliadis 2006)
Comparison
According to Lu and Lirsquos result the project duration was increased by six days (from 14 to 20
days) after solving the resource conflicts (see Figure 13) Lu and Lirsquos algorithm created
unnecessary resource links because the links were added after performing the forward pass If the
resource links would have been created during the forward pass the link between Activity E and
Activity F would not have been necessary At that time the link between Activity G and Activity
F would have been already created Moreover the resource link between Activity E and Activity
F is not required because if Activity E is delayed there is not an over-allocation problem (see
Figure 13) The same scenario occurs for the link between Activity H and Activity I
Figure 13 Lu and Lirsquos Result Kim and de la Garza (2005)
37
Similar to Lu and Lirsquos result Pantouvakis and Manoliadisrsquo algorithm increased the project duration
by six days (see Figure 14b) However the algorithm removed some technological relationships
from the schedule For example the logical relationships between Activity B and Activity F
Activity C and Activity G Activity E and Activity I and Activity G and Activity I (see Figure 12a
and Figure 14a) These technological relationships were removed from the network because they
become redundant once the resource links are added to the schedule
Furthermore Pantouvakis and Manoliadisrsquo algorithm creates unnecessary resource links For
example the resource link between Activity H and Activity I is not needed Activity H can be
delayed four days without exceeding the maximum number of resources available in the project
which is six (see Figure 14b)
Figure 14a Network Diagram with Resource Links
Figure 14b Bar Chart
Figure 14 Pantouvakis and Manoliadisrsquos Result (Pantouvakis and Manoliadis 2006)
In Pantouvakis and Manoliadisrsquo schedule there are three possible resource driver activities for the
delayed task (F) (see Figure 15a) As a result two different resource links configurations can be
created If Activity D and Activity E are selected as resource drivers of Activity F two resource
links should be created in the schedule (see Figure 15b) Otherwise if Activity G is selected as the
resource driver of Activity F only one resource link is needed in the schedule (see Figure 15c)
Most of the existing algorithms do not have a criterion to select a possible resource link
configuration or to identify a resource driver activity when having several alternatives
38
Figure 15a Possible Resource Drivers of Activity F (D E and G)
Figure 15b Alternative No 1 Figure 1c Alternative No 2
Figure 15 Multiple Resource Links Configurations
According to Nisar et al result the project duration was increased by three days (from 14 to 17
days) after mitigating the resource supply-demand problem The algorithm only increased the
project duration by 21 Nisar et al algorithm provides a better schedule than the other three
authorsrsquo algorithms in terms of duration network complexity critical activities and activities with
free float Nevertheless the mechanism proposed by the authors to remove redundant relationships
removes technological links For instance the logical relationship between Activity B and Activity
G no longer exists (see Figure 16a) Because an optimization function minimizes the total number
of resource relationships without violating the resource constraints Nisar et al algorithm is not
totally rule-based
Both RCPM schedules (serial and parallel-based) are equal (see Figure 16b) The RCPM schedule
provides a better activitiesrsquo configuration than that of Lu and Li and Pantouvakis and Manoliadisrsquo
schedules in terms of duration network complexity critical activities and activities with free float
(see Table 6)
39
Figure 16a Nisar et al Result
Figure 16b RCPM Serial and Parallel-Based Schedule
Figure 16 Nisar et al (2013) and RCPM Results
Table 6 Comparison with Lu and Li Pantouvakis and Manoliadis and Nisar et al Results
Authors RCS
Method
Duration
(Days)
Resource
Links
Increase
Duration
Increase
NC
Critical
Activities
Activities
FF
Lu and Li Serial
(WC) 20 5 43 36 64 9
Pantouvakis Serial
(LS) 20 5 43 36 55 9
Nisar RPW 17 3 21 21 36 27
Kim and de
la Garza
Serial
Parallel 19 4 36 29 55 18
Note RPW Ranked Positional Weighted
40
Shortcomings of Existing RCS Related Algorithms
This section describes the three main shortcomings of the RCPM developed by Kim and de la
Garza (2003) which apply to the other algorithms reviewed in this study
Unidentified Resource Links in Multiple Calendars
When an activity is delayed and scheduled during the non-working days of its predecessor the
RCPM does not identify the corresponding resource links (Kim 2003) For example in Figure
17a Activity A is delayed one day to resolve the over-allocation problem on Day 2 The algorithm
mitigates the resource-demand problem but the two necessary resource links are not identified
(see Figure 17b) As shown in Figure 17c a resource link is needed between Activity B and
Activity A and another between Activity A and Activity B This link ensures that Activity A is not
delayed for more than three days Otherwise there would be an over-allocation problem
Figure 17a Initial Scenario
Figure 17b Unidentified Resource Links Scenario
Figure 17c Potential Solution
Figure 17 Unidentified Resource Links in the RCPM
A proposed solution to this issue is to create two different activities (B1 and B2) that represent the
activity that is scheduled between non-working days (B) (see Figure 17c) This alternative may
increase the complexity of the network and algorithm by adding more activities resource links
and in-between steps Further research is needed to determine how to handle these resource
relationships and additional activities when the schedule must be updated
41
Lack of Dynamic Resource Links
By the time the eight algorithms were developed the main concern was to solve the problem of a
broken critical path in a resource-constrained schedule For that reason the majority of the authors
did not explore the use of resource links to update the schedule or to perform a delay analysis
During the control phase of a project an update or a delay event may change the priority order
designated by the RCS heuristic to schedule the activities Thus the resource links identified
before the update may no longer be required andor new resource links can be identified after the
update The initial resource links should be removed from the schedule before updating the
schedule because they were identified based on previous or different project conditions Keeping
the resource links during the update constrains the schedule For that reason the resource links
have the feature of being temporal or dynamic Kim (2009) considered resource links for updating
the schedule but the author did not remove the resource links from the schedule each time that the
RCPM was re-applied
The incorporation of dynamic resource links in an algorithm does not create analytical challenges
if the data date of the update is known By knowing the data date of the update the algorithm will
remove only the resource links located right of the data date Even though the resource links
located right of the data date should be removed each time that an algorithm is re-applied the
resource links located left of the data date should remain on the schedule In that way after all
activities have been completed the as-built schedule will have a continuous critical path with no
phantom float
Several of the algorithms reviewed in this paper remove some technological relationships from the
schedule because these relationships become redundant after adding the resource links to the
network This process jeopardizes the updating process Due to the resource links should be
removed before updating or performing a Time Impact Analysis the logic sequence of the project
will be lost if there is no record of the logical relationships that were removed The challenge of
incorporating dynamic resource links in the schedule is knowing how to handle and keep track of
the links that have been created removed andor updated since each time the schedule is updated
the sequence of the activities may change
Selection of a Resource Links Configuration
The major problem when identifying the resource relationships in the schedule is the fact that
multiple alternatives for creating resource links between activities may exist when many current
activities have many predecessor activities Hence multiple and different schedules can be
generated for the same project (Kim 2003 Nisar et al 2013) The difference between the multiple
schedules that can be generated is not only the number of resource links created but also the critical
path So the question that arises is which schedule should be considered as the baseline
Despite Abeyasinghe et al (2001) mentioning that solving resource-constrained problems with
optimization tools is impractical in large projects due to the significant number of variables and
constraints involved this mathematical mechanism could be effective when having multiple
resource links configurations According to Nisar Yamamoto amp Suzuki (2013) the resource links
42
should be created in a way that the total number of relationships is minimized without violating
the resource constraints Nisar Yamamoto amp Suzuki (2013) proposed a function to find the
optimal resource links between activities The main goal is to not increase the complexity of the
network Further research is needed to determine the effectiveness of this approach under different
project characteristics and constraints An important factor to consider in the analysis is the
algorithmrsquos running time
On the other hand Bowers (1995) suggested that when having identical parallel activities it is the
project managerrsquos responsibility to determine the activity with higher priority Another alternative
that also keeps the algorithms rule-based is to establish and test a criterion to select one of the
multiple resource links configurations For instance the resource driver activity could be the
predecessor activity with the highest number of resources In a resource-constrained schedule this
activity is more likely to delay the project due to the high demand for resources that it requires If
this activity is delayed more activities could be delayed because they would need the resources
that the resource driver activity is using Several parameters should be tested in order to establish
a rule that provides good solutions in most of the cases These are schedules with a lower number
of resource links to avoid a complex network Current research is being carried out to determine
which priority rules may be considered for selecting a potential resource link configuration This
rule will be included in an enhanced RCPM algorithm
A criterion to select among alternative schedules should be also determined For instance 1) the
schedule with the lowest number of resource links since it may be less complex in terms of number
of relationships 2) the schedule with the lowest percentage of critical activities since the
probability to cause delays to the project is lower 3) the schedule with the highest percentage of
activities with free float since it is more flexible or 4) the schedule with the fewest resource idle
time Further research should be performed to determine which criterion is the most appropriate
Discussion
Delay Analysis
The limited amount of resources allocated to projects demands the use of resource-loaded
schedules for delay analysis (Braimah 2013) As stated by Ibbs and Nguyen (2007) ldquoperforming
a schedule analysis without considering resource allocations may increase the ownerrsquos or
contractorrsquos risk of assuming delay responsibility which is not his or her faultrdquo
The main issue when incorporating resources in a delay analysis is the fact that the RCS existing
algorithms do not incorporate and handle dynamic resource links This leads to untrusted results
because the schedule does not reflect the real conditions of the project Therefore the parties
involved may not be totally responsible for the apportioned delays (Ibbs amp Nguyen 2007)
Besides the algorithms do not allow activities to be interrupted which is a common scenario when
having a delay event
Another issue when incorporating resources in the analysis is the selection of a heuristic to solve
the resource conflicts As demonstrated by Nguyen and Ibbs (2008) the sequence of activities may
43
be altered each time that the network is re-scheduled because of a project update The updates may
change the priority rank assigned to each activity when performing an RCS heuristic and as a
result different results can be obtained for the same delay scenario (Kim 2009)
Performance of Existing RCS Related Algorithms
These heuristics provide ldquogoodrdquo but not optimal solutions (Wiest 1963 Lu and Li 2003
Pantouvakis and Manoliadis 2006) Some rules may work well for a project but may not work
well when they are applied to a different project (Wiest 1963) Based on the results of this
research which are limited to small networks the methods proposed by Nisar et al (2013) and
Kim and de la Garza (2003) provide good solutions in terms of time In most of the cases the
average increase in the project duration was lower than 37 when the RCPM was applied
Nisarrsquos algorithm generates schedules with lower complexity in terms of relationships because it
incorporates a function that minimizes the number of resource links created in the schedule
Nevertheless the algorithm removes some technological relationships from the schedule after
identifying the resource links It is suggested to keep track of the technological relationships that
are removed from the schedule Otherwise the logical sequence of the project will be lost when
updating the schedule or performing a delay analysis
Unlike Nisarrsquos algorithm Kimrsquos algorithm does not have any mechanism to optimize the number
of resource links created in the schedule but it does not remove the logical relationships from the
schedule Additionally RCPM is practical and easy to understand In this regard Nisarrsquos algorithm
requires a lot of in-between steps and the authors defined two types of resource relationships (strict
and flexible) that may be not practical for professionals Worthy of note none of the algorithms
consider the dynamic feature of resource links Therefore using these methods is not
recommended for updating the schedule or for applying a Time Impact Analysis unless they
incorporate and handle dynamic resource links
The RCS related algorithms reviewed in this paper were tested by the corresponding authors in
one or two hypotheticalreal-life projects Therefore it is not possible to develop a method of
selection based on the algorithmsrsquo performance However the indicators used in this study to
evaluate algorithm performance can help practitioners decide which method selects to mitigate the
resource supply-demand problem without generating phantom float in the schedule Algorithms
with a percentage of increase in the project duration smaller than 40 are preferred (Boctor 1976
Woodworth and Shanahan 1988) If there are several algorithms that meet this criterion the
percentage of critical activities can be used as a tiebreaker Having float in the schedule may be
beneficial when addressing potential delaying events Because most of the algorithms were tested
in small networks (20 ndash 30 activities) further investigation is required to test the performance of
the RCS related algorithms in real-life and large projects
Based on the features of each algorithm (heuristic) constraints (removal of logic links) and project
characteristics (resources and calendars) a system was developed to guide practitioners in the
selection process of an algorithm (see Figure 18)
44
Figure 18 Guide to select an Algorithm
Conclusion
On a regular basis project managers concentrate their efforts on critical and near-critical activities
However the concepts of total float and critical path lose their significance after applying resource-
constrained scheduling (RCS) methodologies (Fondahl 1961 Wiest 1964 Bowers 1995 Raz
and Marshall 1996 Rivera and Duran 2004) RCS techniques mitigate the resource supply-
demand problem but create phantom float in the schedules (ie a float that does not exist)
Therefore several algorithms have been developed to provide correct float values and a continuous
critical path in resource-constrained schedules This study reviews and evaluates the performance
of eight RCS related algorithms with the purpose of identifying the shortcomings that must be
addressed so they can be applied for delay analysis
Most of the algorithms identify resource dependences but some of them still create phantom float
in the schedule because they do not identify all the necessary resource links Some algorithms also
create unnecessary resource relationships andor remove technological relationships from the
schedule Furthermore most of the algorithms do not provide a mechanism or criterion to select a
resource links configuration among multiple alternatives and neither to select a schedule when
having multiple options Finally none of the algorithms consider the dynamic feature of resource
dependences These limitations should be addressed to make the algorithms more practical for real
construction and engineering projects
This study 1) discusses potential solutions to the shortcomings of the existing algorithms 2)
provides recommendations on the methods that can be used by industry professionals and 3)
45
proposes a system to facilitate the selection of an algorithm based on their common features
(heuristic) constraints (removal of logic links) and project characteristics (resources and
calendars) The algorithms proposed by Kim and de la Garza (2003) and Nisar et al (2013)
provide good solutions in terms of time However as presented in the discussion section there are
points to consider when applying any of these RCS related techniques
Future Research
The eight algorithms reviewed in this paper lack features for their use in delay analysis Activities
cannot be interrupted which is a common scenario when having non-working days or delaying
events In addition none of the algorithms handle dynamic resource relationships Resource links
should be removed before updating the schedule because they were created based on previous
project conditions The initial conditions may not prevail after the update Therefore a systematic
procedure is needed to incorporate and handle dynamic resource links in the algorithms when 1)
there are schedule changes 2) resource utilization changes and 3) different delay methodologies
are applied Addressing these limitations will allow a more realistic delay analysis since schedules
will reflect the real conditions of the project
Otherwise the manual identification and creation of resource links are a time consuming and error-
prone process in large and complex projects At present commercial scheduling software such as
Primavera P6 and Microsoft Project create phantom float in resource-constrained schedules
because they do not incorporate an algorithm to identify the resource relationships between the
activities Since the major scheduling software developers such as Oracle and Microsoft do not
seem to be interested in moving forward to remove phantom float from resource-constrained
schedules a system that incorporates an algorithm to remove phantom float from P6 and Microsoft
Project schedules is needed The development of a computerized system will allow the removal
in a practical way of phantom float from resource-constrained schedules
Currently research is being carried out in order to develop an enhanced RCPM-based algorithm
that addresses the shortcomings of the existing algorithms so it can properly apply for delay
analysis and project controls The enhanced RCPM algorithm will be computerized in a system
integrated with Primavera P6
References
Abeyasinghe M C L Greenwood D J amp Johansen D E (2001) An efficient method for
scheduling construction projects with resource constraints International Journal of Project
Management 19(1) 29-45 DOIorg101016S0263-7863(00)00024-7
Ahuja H Dozzi SP and AbouRizk SM (1994) Project management techniques in planning
and controlling construction projects 2nd edition Wiley New York
Alvarez-Valdes R and Tamarit JM (1989b) Algoritmos heuristicos deterministas y aleatorios
en secuenciacion de proyectos con recursos limitados Q~estiio 13 173-191
46
Baki M A (1998) CPM scheduling and its use in todays construction industry Project
Management Journal 29(1) 7ndash9 DOIorg101057jors19959
Boctor F F (April 01 1996) A new and efficient heuristic for scheduling projects with resource
restrictions and multiple execution modes European Journal of Operational Research 90 2 349-
361 DOIorg10108000207549308956882
Bowers J A (1995) Criticality in Resource-Constrained Networks Journal of the Operational
Research Soc 46 80-91 DOIorg101057jors19959
Braimah N (2013) Construction Delay Analysis TechniquesmdashA Review of Application Issues
and Improvement Needs Buildings 3 506-531 DOI103390buildings3030506
Davis E W amp Patterson J H (April 01 1975) A Comparison of Heuristic and Optimum
Solutions in Resource-Constrained Project Scheduling Management Science 21 8 944-955
de la Garza J M amp Franco-Duran D M (2017) CPM Benefits in Estimating Bidding Reported
in Survey (B Buckley Ed) httpswwwenrcomarticles43666-cpm-benefits-in-estimating-
bidding-reported-in-survey
Fondahl J W (1991) The Development of the Construction Engineer Past Progress and Future
Problems Journal of Construction Engineering and Management 117(3) 380-392
DOIorg101061(ASCE)0733-9364(1991)1173(380)
Gordon J H (January 01 1983) Heuristic methods in resource allocation International Journal
of Project Management 1 3 163-168 DOIorg1010160263-7863(83)90022-4
Ibbs W amp Nguyen L D (2007) Schedule Analysis under the Effect of Resource
Allocation Journal of Construction Engineering and Management 133 2 131-138
DOIorg101061(ASCE)0733-9364(2007)1332(131)
Kastor A amp Sirakoulis K (2009) The effectiveness of resource leveling tools for Resource
Constraint Project Scheduling Problem International Journal of Project Management 27(5) 493-
500 DOIorg101016jijproman200808006
Kim K (2003) A Resource-constrained CPM (RCPM) Scheduling and Control Technique with
Multiple Calendars (Doctor of Philosophy Dissertation) Department of Civil and Environmental
Engineering Virginia Tech Blacksburg Virginia
Kim K amp de la Garza J M (2003) Phantom Float Journal of Construction Engineering and
Management 129 (5) 507-517 DOIorg101061(ASCE)0733-9364(2003)1295(507)
Kim K amp de la Garza J M (2005) Evaluation of the Resource-Constrained Critical Path Method
Algorithms Journal of Construction Engineering and Management 131(5) 522-532
DOIorg101061(ASCE)0733-9364(2005)1315(522)
47
Kim K (2009) Delay Analysis in Resource-constrained Schedules Canadian Journal of Civil
Engineering 36 295-303 DOIorg101139L08-121
Lu M amp Li H (2003) Resource-Activity Critical-Path Method for Construction Planning
Journal of Construction Engineering and Management 129(4) 412-420
DOIorg101061(ASCE)0733-9364(2003)1294(412)
Moder J J Phillips C R amp Davis E W (1983) Project Management with CPM PERT and
precedence diagramming (3rd ed ed) New York Van Nostrand Reinhold
Nisar S A Yamamoto Koshi amp Suzuki K (2013) Resource-Dependent Critical Path Method
for Identifying the Critical Path and the ldquoReal Floatsrdquo in Resource-Constrained Project
Scheduling Journal of Japan Society of Civil Engineers 69(4) 97-107
DOIorg102208jscejcm69I_97
Nguyen L D amp Ibbs W (2008) FLORA New forensic schedule analysis technique Journal of
Construction Engineering and Management 134 7 483-491 DOIabs101061(ASCE)0733-
9364(2008)1347(483)
Pantouvakis JP amp Manoliadis OG (2006) A practical approach to resource-constrained project
scheduling Operational Research An International Journal 6(3) 299-309
DOIorg101007BF02941258
Patterson J H (1973) Alternate methods of project scheduling with limited resources Naval
Research Logistics Quarterly 20(4) 767-784 DOIorg101002nav3800200415
Patterson J H (March 01 1976) Project scheduling The effects of problem structure on heuristic
performance Naval Research Logistics Quarterly 23 1 95-123
Raz T amp Marshall B (1996) Effect of resource constraints on float calculations in project
networks International Journal of Project Management 14(4) 241-248 DOIorg1010160263-
7863(95)00090-9
Rivera F A amp Duran A (2004) Critical clouds and critical sets in resource-constrained
projects International Journal of Project Management 22(6) 489-497
DOIorg101016jijproman200311004
Ulusoy G and Ozdamar L (1989) Heuristic performance and networkresource characteristics
in resource-constrained project scheduling Journal of the Operational Research Society 40 1145-
1152 DOIorg101057jors1989196
Wiest J D (1964) Some Properties of Schedules for Large Projects with Limited Resources
Operation Research 12(3) 395-418 DOI101287opre123395
48
Woodworth B M amp Shanahan S (1988) Identifying the critical sequence in a resource-
constrained project International Journal of Project Management 6 (2) 89-96
DOIorg1010160263-7863(88)900
49
CHAPTER 3
Performance of Resource-Constrained Scheduling Heuristics3
Abstract
Over the years the study of Resource-Constrained Scheduling heuristics has focused on testing
different sets of priority rules without paying attention to the conditions under which each heuristic
produces better results Although some authors have recommended the use of specific heuristics
over any other rule these recommendations are general and do not encompass all possible project
characteristics in terms of resources and network topology Without a guidance system schedulers
must try several combinations of rules until they find one that compares favorably (shortest
duration) with the results of the other priority rules
This study proposes a new tiebreaker (Priority Number) that enhances the performance of an
existing heuristic and classifies the heuristicsrsquo performance based on specific project
characteristics The results show that the Priority Number as a tiebreaker of the Late Finish leads
to obtain schedules with lower deviations from the CPM duration and a higher number of shortest
schedules than with traditional tiebreakers
The proposed classification system indicates the two heuristics with the best performance for
specific resource network characteristics This classification will help practitioners to decide which
heuristic applies when mitigating the resource supply-demand problem given the project
characteristics
Keywords Heuristics Resource-Constrained Scheduling Tiebreaker
Introduction
Resources are included in a schedule to better represent the actual conditions of a project Under
such a scenario several activities may require the same group of resources to be completed These
activities cannot be executed at the same time unless the supply of resources would be increased
Otherwise a resource supply-demand problem (over-allocation) will arise in the schedule
In a resource-constrained schedule the initial project completion time may be extended due to
some activities that need to be delayed solving the resource over-allocation The decision of
delaying some activities and scheduling others immediately is subjected to logic precedence and
priority rules (heuristic)
3 Franco-Duran D M amp de la Garza J M (February 12 2020) Performance of Resource-Constrained Scheduling
Heuristics Journal of Construction Engineering and Management 146 (4) pp 1-12
DOIorg101061(ASCE)CO1943-78620001804
50
As rules of thumb heuristics may work better for some project characteristics than for others
(Davis 1975 Ulusoy 1989 Abetasinghe et al 2001) Previous findings suggest that heuristic
performance is poor when 1) the proportion of resources required per activity to the resources
available is high (Davis 1975) 2) activities require several types of resources (Kolish 1995) 3)
a network is highly constrained (Kolish 1995 Chen et al 2018) 4) a network has a high number
of activities (Boctor 1976 Zhan 1994) and 5) the complexity of a network which is the average
number of successors relationships per activity is around 15 to 21 (medium-high) (Davis 1975
Alvarez and Tamarit 1989 Kolish 1995)
Additionally some authors have recommended the use of specific heuristics over any other rule
For example Patterson (1976) recommended using the Minimum Total Float (TF) and Late Finish
(LF) in networks with a high average free float per activity and in networks with a high variation
in the activity duration Chen et al (2018) recommended using the LF in highly resource-
constrained networks and using the Late Start (LS) in slightly constrained networks Although
these recommendations may be useful for practitioners they are general and do not encompass all
possible project characteristics in terms of resources and network topology
Heuristics have been incorporated in commercial scheduling software like Primavera P6 and
Microsoft Project (Marimuthu et al 2018) For instance Primavera users can employ any
combination of the 26 rules listed by the software as resource-constrained priorities or any other
rule defined by the user However without a classification system that helps users to decide which
heuristic applies when mitigating the resource over-allocation problem schedulers must try several
combinations of rules until they find one that compares favorably (shortest duration) with the
results of the other priority rules
So far the study of Resource-Constrained Scheduling (RCS) heuristics has focused on testing
different sets of priority rules without paying attention to the conditions under which each heuristic
produces better results ie shorter durations A preliminary analysis showed that the performance
of existing heuristics is not consistent when networks have more than 50 activities and activities
require several types of resources For a sample of 18 networks the percentage of times that eight
existing heuristics produced the shortest schedules ranged from 11 to 39 These low numbers
highlight the need to develop a heuristic or enhancing an existing one that produces better results
under these project characteristics
The aim of this study is to 1) propose a new tiebreaker that enhances the performance of an existing
heuristic under specific project parameters 2) analyze the influence of different tiebreakers in the
resulting schedules and 3) classify the heuristicsrsquo performance based on explicit resource and
network characteristics
Theoretical Background
Heuristics have two main components the scheduling method and priority rules The scheduling
method determines the way activities are scheduled either under a serial or parallel approach
Under a serial approach activities are sorted and then scheduled one at a time Under a parallel
51
approach the activitiesrsquo sequence is determined and updated at the beginning of a specific period
ie activities are scheduled by intervals of time (Moder et al 1983)
Priority rules are criteria that establish the order to sequence activities A set of priority rules is
known as a heuristic Rules are based on information regarding activities (duration) network
(successorspredecessors) Critical Path Method (CPM) calculations (earlylate dates and float
values) and resource demand Although the first criterion of the set of priority rules (major sort
parameter) has a significant effect on the resulting schedule a minimum of two parameters is
needed for any heuristic so ties can be solved (Gordon 1974) The rule that breaks a tie ie when
two or more activities have the same value of a parameter is called tiebreaker Existing priority
rules incorporate as a tiebreaker (second sort parameter) either the ID number the duration or
total float of the activities These parameters or any other should be carefully selected since they
may have an impact on the calculated project completion time if a tie for the major sort parameter
exists
Heuristics have been tested employing different types of networks Typically networks are
generated from topological structure and resource parameters The topological structure
parameters are the number of activities the Network Complexity (NC) and the serialparallel
indicator (I2) Networks with 30 activities are considered as small size problems and networks
with more than 120 activities as large size problems (Gordon 1983) The complexity of a network
(NC) denotes the average number of successors relationships per activity It is calculated as the
ratio between the number of successor relations and the number of total activities of a project The
SerialParallel Indicator (I2) defines how close a network is to a serial or parallel chain of activities
(Kolisch 1996) This indicator ranges from zero to one If I2 = 0 activities are scheduled under
a parallel approach ie there are no precedence relationships between activities If I2 = 1
activities are serial-based scheduled (chain of activities)
Otherwise the resource parameters are the number of type of resources the Resource Strength
(RS) the Resource Factor (RF) and the Resource Utilization (RU) The Resource Utilization
factor (RU) indicates the proportion of resource requirements per activity relative to the number
of resources available The Resource Strength (RS) measures the proportion of resource demand
and availability of a network ie how constrained a network is in terms of resources considering
the maximum availability of resources The Resource Factor (RF) indicates the proportion of
resource types required per activity ie the average number of resource types needed to execute
activities Both indicators (RS and RF) range from zero to one If RS = 0 at least one activity
demands all the resource capacity Conversely if RS = 1 resources are not over-allocated If RF =1 each activity demands at least some amount of each type of resource Contrariwise if RF = 0
activities do not demand any amount of any resource
The percentage increase above the CPM duration has been used by several authors to compare and
evaluate the efficacy of several RCS related heuristics when the optimum duration of the network
is not calculated (Patterson 1973 Patterson 1976 Gordon 1986 Ulusoy and Ozdamar 1989
Boctor 1993 Kolisch 1996 Boctor 1996 Kastor and Sirakoulis 2009) The percentage increase
above the CPM duration represents the delay generated by the resource unavailability because of
the heuristic employed The lower the percentage the better the performance
52
The most tested priority rules reported in the literature are Late Finish (LF) Min Slack (Least Total
Float or Min TF) the shortest processing time (SPT or Shortest Duration) Late Start (LS) Greatest
Rank Positional Weight (GRPW) Greatest Resource Utilization (GRU) and Resource Scheduling
Method (RSM) (Davis 1975 Boctor 1976 Patterson 1976 Gordon 1983 Kolish 1995 Alvarez
and Tamarit 1989)
Newly Developed Tiebreaker Priority Number (Pn)
Before developing the new tiebreaker a pilot study was carried out to evaluate the performance of
different priority rules as tiebreakers of the Late Start (LS) and Late Finish (LF) These CPM late
dates were selected as major sort parameters to test the tiebreakers because previous studies have
found that either the LS or LF provides good results mitigating a resource supply-demand problem
(Alvarez and Tamarit 1989 Boctor 1993 Gordon 1994 Kolish 1995 Kolish 1996 Abetasinghe
et al 2001 Kastor and Sirakoulis 2009)
The parameters considered as potential tiebreakers were the number of resources required per
activity Resource Utilization (RU) Duration (D) Total Float (TF) Free Float (FF) and the
number of successor activities Based on the results of this preliminary analysis this study
proposed a new tiebreaker labeled Priority Number (Pn) The Priority Number which is a
composite rule considers the Duration (D) and Total Float (TF) of each activity A composite rule
combines different factorsparameters in one measure The Priority Number is calculated as shown
in Equation 1
Pni =Di
TFi (Eq 1)
In Equation 1 Pni is the priority number of activity i Di is the duration of the activity i and TFi
is the total float of activity i If TFi = 0 TFi is assumed to be equal to 095 This assumption was
made to avoid a division by zero and to differentiate between a critical activity (TF = 0) and a
near-critical activity (TF = 1) A number close to zero was not selected to avoid significant high
numbers of the Pn Due to the Pn does not exist as a priority rule in Primavera P6 the Pn values
were computed separately and then assigned to each activity using the activity codes function of
P6
The duration and total float were considered as appropriate parameters of the Pn due to the
influence they may have extending the project completion time The duration is the expected
amount of time an activity will be delayed if another activity is scheduled first Furthermore if the
delayed task is critical (TF = 0) the activity duration may be the time that the project could be
extended The greater the duration the greater the impact on the project completion time On the
other hand the CPM total float indicates how critical activities were before taking into
consideration the resources Although the CPM float values will change after mitigating the
resource-supply demand problem most of the critical and near-critical activities in CPM may be
still critical after applying an RCS heuristic
53
Enhanced LF Heuristic
Activities must be scheduled subject to precedence or logical relationships This study considered
the Late Finish (LF) as the major rule to sort the activities and used the Priority Number (Pn) as a
tiebreaker The Enhanced LF heuristic is described below
1 Sort activities by earliest Late Finish (LF)
2 If there is a tie with respect to the LF the priority is given to activities with the lowest
Priority Number (Pn) The preliminary analysis showed that shorter schedules are obtained
more frequently when the priority is given to activities with a lower Pn than a higher
number
3 If there is a tie with respect to the Pn the tie is broken by the smallest activity number (ID)
Methodology
This study generated 142 different networks to evaluate and classify the performance of RCS
heuristics The networks were created using the generator program RanGen developed by
Demeulemeester Vanhoucke and Herroelen (2003) The programrsquos output (a text file with a
Patterson Format structure) was converted to a Primavera P6 format (Franco Duran 2019)
RanGen considers two types of input parameters to construct random networks 1) the networksrsquo
topology and 2) the networksrsquo resource characteristics
Topological Structure
The topological structure of a network is determined by the SerialParallel Indicator (I2) and the
number of activities The 142 generated networks were limited in size to between 30 and 90
activities with an average of 64 activities per network Their complexity ranges from 140 to 165
with an average value of 150 ie three immediate successors per activity RanGen assigned
durations between one and ten units of time to activities The average activity duration of the
networks is five units of time
To resemble a network with parallel and serial activities I2 was defined as 065 (see Figure 1b)
Figure 1 shows the structure of a network of 12 activities when I2 = 020 (parallel-based) I2 =065 (serial and parallel-based combination) and I2 = 10 (serial-based)
Figure 1a Network with I2 =
02 (Parallel-Based)
Figure 1b Network with I2 = 065 (serial and parallel-
based combination)
54
Figure 1c Network with I2 = 10 (Serial-Based)
Figure 1 Network Topologies
Resource Measures
The number of types of resources the Resource Strength (RS) and the Resource Factor (RF) were
the three resource-related parameters defined in RanGen to construct networks The 142 networks
have single or multiple resource requirements with a maximum of three types of resources per
project All resource types are subjected to fixed resource availabilities which were randomly
assigned by RanGen and were constant over the project duration The resource maximum
availability per type varies between 10 and 16 units
In this study the RS was defined as 025 to guarantee an over-allocation scenario in each of the
generated networks Because heuristic performance decreases when the RF is close to 1 most of
the generated networks of this study (N = 112) have a RF equal to 075 (Kolish 1995) Few
networks have a RF equal to 025 (N = 30) Figure 2 shows the resource profiles of a network
with a RF equal to 025 and 075 respectively When RF = 025 activities need less of the resource
type(s) to be executed (see Figure 2a) and when RF = 075 activities need more of the resource
type(s) to be executed (see Figure 2b)
Figure 2a Resource Profile when RF = 025 Figure 2b Resource Profile when RF = 075
Figure 2 Resource profiles when RF = 025 and RF = 075 for a network with I2 = 065 and
RS = 025
The Resource Utilization factor (RU) was calculated as shown in Equation (2) where rk is the
amount of resources of type k required by an activity i and Rk is the maximum amount of resources
55
of type k required by the activity i An example of how the RU factor is calculated for an activity
and a project is provided in Table 1
RUi = sumrk
RkK
(Eq 2)
Table 1 Sample Calculation of RU
ID R1 R2 R3
Resource Utilization (RU) Resource
Availability Max 12 Max 11 Max 13
A1 5 7 1 RUA1 = (512) + (711) + (113) = 113
A2 0 4 8 RUA2 = (411) + (813) = 098
Project RU = (113 + 098)2 = 105
The RU factor of the 30 networks with a RF = 025 ranges from 010 to 050 and that of the 112
networks with a RF = 075 ranges from 025 to 15 Table 2 shows a summary of the
characteristics of the 142 generated networks All networks have in common a I2 = 065 and a
RS = 025
Table 2 Sample Characteristics (N = 142 Networks)
Resource Factor (RF) 025 075 025 and 075
No Networks 30 112 142
No Activities 30 - 80 30 ndash 90 30 ndash 90
Network Complexity (NC) 140 ndash 165 140 - 162 140 ndash 165
No Type of Resources 1 - 3 1 - 3 1 - 3
Resource Utilization (RU) 012 ndash 046 028 ndash 134 012 ndash 134
Performance Criteria
Eight existing priority rules were considered to evaluate and compare the performance of the
Enhanced LF heuristic proposed in this study These heuristics were selected based on the
opportunity to perform each of them in Primavera P6 Primavera allows the user to select specific
parameters as priority rules and combined them as preferred when mitigating the resource supply-
demand problem in a schedule The eight heuristics are described below In all cases ties were
broken by the smallest activity number (ID)
Minimum Total Float (Min Slack) Priority is given to activities with the lowest Total Float
(TF) (Davis and Patterson 1975 Patterson 1976)
Shortest Duration Priority is given to activities with the shortest duration (D) (Davis and
Patterson 1975 Patterson 1976)
Longest Duration Priority is given to activities with the longest duration (D) (Davis and
Patterson 1975)
56
Minimum Late Finish Priority is given to activities with the earliest values of Late Finish
(LF) (Davis and Patterson 1975)
Minimum Late Start Priority is given to activities with the earliest values of Late Start
(LS)
Late Start Sort Priority is given to activities with the earliest values of Late Start (LS) If
there is a tie with respect to the LS priority is given to the activity with the least duration
(D) If the tie persists priority is given to the activity with the least total float (TF)
Earliest Start Time Priority is given to activities with the earliest values of Early Start
(ES)
Earliest Finish Time Priority is given to activities with the earliest values of Early Finish
(EF)
The eight existing heuristics plus the Enhanced LF heuristic were applied to the 142 generated
networks using Primavera P6 All heuristics were tested under a serial approach (P6 default
method) The CPM duration was considered as the benchmark to compare the durations obtained
with each heuristic The percentage increase in the project duration (after applying RCS) with
respect to the CPM duration was considered as an indicator to measure the performance of the
heuristics The indicator was calculated as the difference (time units) between the heuristic
duration and the CPM duration as a percentage of the CPM duration
Furthermore the performance of each heuristic relative to one another was assessed considering
the number of times each heuristic produces the shortest and longest schedules The number of
times producing the shortest duration was considered as a consistent measure of a heuristic
performance Based on the results of previous studies and given the variable nature of heuristics
a consistency rate of at least 60 is preferred Ideally heuristics with good performance will have
1) a lower percentage of deviation in the project duration 2) a higher percentage of times
producing the shortest duration (not optimum) and 3) a lower percentage of times producing the
largest duration
The performance of the heuristics was also evaluated in terms of the Resource Factor (RF) and
Resource Utilization (RU) of the networks To this end networks were classified according to the
RF and RU values shown in Table 3 These values have been commonly used in literature to
compare heuristicsrsquo performance (Ulusoy 1989) One network with a RF = 075 was excluded
from the analysis because its RU (134) did not fit the last range considered in the classification
system (10 ndash 125) As a result the final sample of this study consists of 141 networks
Table 3 Networksrsquo Classification by RF and RU
N =
14
1
RF = 025
N = 30
RU 010 - 025 N = 12
RU 025 - 050 N = 18
RF = 075
N = 111
RU 025 - 050 N = 38
RU 050 - 075 N = 35
RU 075 - 100 N = 18
RU 100 - 125 N = 20
57
Statistical Analysis
The sample size of this study was selected to guarantee a power greater than 090 in the non-
parametric tests performed The power represents the probability of rejecting the Null Hypothesis
(H0) when the Alternative Hypothesis (Ha) is true The higher the power the lower the chance of
having a Type Error II (Failing to reject Ho when it is false) and the better the probability of finding
a difference between the two groups of analysis (Elliot 2007)
Due to the similarity in the results among the heuristics the Sign Test was performed to ascertain
whether the Enhanced LF heuristic produced better results than a specific existing heuristic when
there was not a tie in the results Each time the test compared the differences in the increase of
project duration obtained by the Enhanced LF heuristic and an existing heuristic (microd) (see Equation
3) By excluding the number of times both heuristics produce the same result (tie) it is possible to
statistically determine whether the Enhanced LF heuristic outperformed a specific existing
heuristic
microd = micro₁ minus micro₂ (Eq 3)
In Equation 3 microd is the difference in the average increase between the two paired heuristics micro₁ is
the mean of the average percentage increase of project duration above the CPM duration obtained
by an existing heuristic j and micro₂ is the mean of the average percentage increase of project duration
above the CPM duration obtained by the Enhanced LF heuristic
Positive differences will occur if the existing heuristic (j) produces higher deviations from the
CPM duration than the Enhanced LF heuristic Conversely negative differences will occur if the
existing heuristic (j) produces lower deviations from the CPM duration than the Enhanced LF
heuristic The difference (microd) will be equal to zero if both heuristics obtained the same results (tie)
The hypothesis being examined by the Sign test are
H0 The probability of a positive difference is equal to the probability of a negative
difference
Ha The probability of a positive difference is greater than the probability of a negative
difference
If the Alternative Hypothesis (Ha) is accepted (p le 005) it is more likely to find lower durations
with the Enhanced LF heuristic than with a specific existing heuristic when the two paired
heuristics do not find the same solution All the statistical tests were performed at a confidence
level α = 005
The Sign Test was applied because it is not possible to assume that the differences in the increase
of duration by the two heuristics analyzed each time have an approximately normal distribution
The results of the Anderson-Darling goodness of fit test indicated the data (microd) do not follow a
normal distribution (for all cases AD between 5 and 10 p le 005) Additionally as it is expected
in a paired-sample test the data are related to each other
58
Results
The heuristicsrsquo performance was first analyzed by considering all networks of the sample as a
single group ie networks with a RF equal to 025 and 075 (see Table 4) Table 5 shows the
results of the average percentage increase over the CPM duration after applying the eight existing
heuristics and the Enhanced LF in each of the 141 networks and the percentage of times each
heuristic produced the shortest and longest durations
Table 4 Networksrsquo Classification (N = 141)
N
= 1
41
RF = 025
N = 30
RU 010 - 025 N = 12
RU 025 - 050 N = 18
RF = 075
N = 111
RU 025 - 050 N = 38
RU 050 - 075 N = 35
RU 075 - 100 N = 18
RU 100 - 125 N = 20
Although the Enhanced LF heuristic produced the lowest average increase above the CPM duration
(112 ) there is not enough statistical evidence to conclude that it is significantly better than the
following three heuristics with the lowest average increase in the duration (ES+ID LS+ID and
LS+D+TF+ID) The slight difference in the average percentage increase among the top four
heuristics is because when the Enhanced LF did not produce the shortest duration it produced the
second shortest duration
Table 5 Results N = 141 RF = 025 and 075
Heuristic Average
Increase
Minimum
()
Maximum
()
Shortest
Duration
Longest
Duration
Enhanced LF 112 13 313 592 56
ES + ID 113 03 291 585 35
LS + ID 114 11 327 577 21
LS + D + TF + ID 114 11 327 563 35
LF + ID 117 03 327 472 63
Min TF + ID 121 16 327 415 155
Longest D + ID 123 16 327 437 218
EF + ID 125 11 313 268 268
Shortest D + ID 134 11 312 190 486
The heuristics that performed the worst were the Shortest Duration+ID followed by the EF+ID
They produced the largest deviations in the networks (134 and 125 respectively) Previous
studies also have found that the Shortest Duration+ID produced the worst results (Davis 1975)
The Sign Test results indicate that there is enough statistical evidence to conclude that the
Enhanced LF heuristic produced significantly lower deviations than the LF+ID Min TF+ID
Longest Duration + ID EF+ID and Shortest Duration+ID heuristics For all cases p-value = 0001
(see Table 6) Although there is not sufficient statistical evidence to ascertain that the Enhanced
59
LF outperformed the other top three heuristics the Enhanced LF produced lower durations
(positive differences microd) more frequently than the LS+D+TF+ID (43 vs 37) and the LS+ID (44 vs
40) when there was not a tie in the results When the Enhanced LF was compared with the ES+ID
the later produced one shorter schedule more than the former (40 vs 41)
Table 6 Sign Test Results N = 141 RF = 025 and 075
Comparison No Ties No Positive
Differencesa Z-value p-value
LF + ID
Enhanced
LF
69 50 - 318 0001
Longest D + ID 44 68 - 385 0001
Min TF + ID 47 69 - 443 0001
EF + ID 47 75 - 567 0001
Shortest D + ID 38 97 - 886 0001
LS + D + TF + ID 61 43 - 055 0288
LS + ID 57 44 - 032 0372
ES + ID 60 40 000 0500 a Number of times the Percentage Increase over the CPM of an existing heuristic was higher than
that obtained by the Enhanced LF
Tiebreaker Influence
Figure 3 shows a comparison of the percentage increase over the CPM duration and the number
of times a heuristic produced the shortest and longest schedules when different tiebreakers were
considered as second sort parameters of the LF and LS rules
Figure 3a Late Finish (LF) with different Tie
Breakers
Figure 3b Late Start (LF) with different Tie
Breakers
Figure 3 Influence of a Tiebreaker in the LS and LF rules (N = 141 RF = 025 and RF = 075)
As can be observed in Figure 3a the performance of the LF was better when it was combined with
the Priority Number (Pn) rather than with the activity ID or TF ie the average percentage increase
over the CPM duration was lower with the Pn (112) and shortest schedules were obtained more
frequently (592) Unlike the LF+ID and LF+Pn (Enhanced LF) the LF+TF did not generate
schedules with the longest duration
60
The Sign Test results indicate that the LF rule leads to better results when it is combined with the
Pn (p = 0001) than with the activity ID (p = 0187) Specifically the LF+Pn (Enhanced LF)
produced 28 shorter schedules more than the LF+ID when both heuristics did not get the same
results (ties = 69) Otherwise the Sign Test did not find enough statistical evidence to assert that
the Pn yields to a better performance than the TF when used as a tiebreaker of the LF (see Table
7 p = 0187) Noteworthy when there was not a tie in the results the LF+Pn (Enhanced LF)
produced 9 shorter schedules more than the LF+TF
Table 7 Sign Test Results (N =141 RF = 025 and RF = 075)
Comparison No Ties No Positive
Differences Z-value p-value
LF + TF Enhanced
LF
60 45a -088 0187
LF + ID 69 50a - 318 0001
LS + TF LS + D + TF +ID
130 6b - 0254
LS + ID 132 3b - 0254 a Number of times the Percentage Increase over the CPM of either the LF+TF and LF+ID was
higher than that obtained by the Enhanced LF
b Number of times the Percentage Increase over the CPM of either the LS+TF or LS+ID was higher
than that obtained by the LS+D+TF+ID
The LS rule produced almost the same results whether it is combined with the TF D or activity
ID (see Figure 3b) For all three instances the average percentage increase in the CPM duration
was about 114 This consistency can be corroborated by the number of times each pair of
heuristics obtained the same networksrsquo duration In the case of the LS+ID vs LS+D+TF+ID it
happened 132 times and in the case of LS+TF vs LS+D+TF+ID it occurred 130 times
Due to the similarity in the results the Sign Test did not find any significant difference between
the three tiebreakers used for the LS For all cases the p = 0254 (see Table 7) There is only a
slight difference in the number of times each LS heuristic produced the shortest and longest
schedules The LS+ID produced 577 shortest schedules meanwhile the other two LS rules
produced 563 schedules Unlike the LS+ID and LS+D+TF+ID the LS+TF did not generate
schedules with the longest duration
Classification by RF = 025
The sample networks were classified by RF equal to 025 (see Table 8) Table 9 shows the
summary of the average percentage increase over the CPM duration the percentage of times each
heuristic produced the shortest and longest duration for the 30 networks with RF = 025
The LS+D+TF+ID heuristic produced the lowest average increase above the CPM duration (45)
and the ES+ID produced the shortest schedules more frequently than any other heuristic (933)
Although the Enhanced LF and the LS+D+TF+ID heuristics found the shortest duration the same
number of times (900) the LS+D+TF+ID heuristic produced a lower increase in the project
duration (see Table 9) Overall the top four heuristics (LS+D+TF+ID ES+ID Enhanced LF and
61
LS+ID) 1) had a lower average percentage increase above the CPM duration 2) found the shortest
duration more frequently and 3) found the worst duration (longest duration) less frequently
Table 8 Networksrsquo Classification by RF = 025
N =
14
1
RF = 025
N = 30
RU 010 - 025 N = 12
RU 025 - 050 N = 18
RF = 075
N = 111
RU 025 - 050 N = 38
RU 050 - 075 N = 35
RU 075 - 100 N = 18
RU 100 - 125 N = 20
Table 9 Results RF = 025 and N = 30
Heuristic Average
Increase
Minimum
()
Maximum
()
Shortest
Duration
Longest
Duration
LS + D + TF + ID 45 04 118 900 00
ES + ID 46 04 125 933 33
Enhanced LF 46 04 146 900 67
LS + ID 47 04 139 867 00
LF + ID 50 04 146 733 100
Min TF + ID 52 04 153 733 167
Longest D + ID 52 04 132 633 200
EF + ID 53 14 132 600 267
Shortest D + ID 60 14 183 400 467
The heuristics that performed the worst were the Shortest Duration +ID (60) followed by the
EF+ID (53) Due to the high consistency of the results among the top heuristics (900) the
Sign Test only found evidence to indicate that the Enhanced LF heuristic produces significantly
lower deviations than the EF+ID and Shortest Duration +ID (see Table 10) Worthy of note the
Enhanced LF produced lower durations (positive differences microd) more frequently than the Longest
Duration +ID (9 vs 3) EF+ID (9 vs 1) LF+ID (6 vs 2) and Min TF+ID (7 vs 2) when there was
not a tie in the results When the Enhanced LF was compared with the ES+ID and LS+D+TF+ID
both heuristics produced one shorter schedule more than the Enhanced LF
Table 10 Sign Test Results RF = 025 and N = 30
Comparison No Ties No Positive
Differencesa p-value
LF + ID
Enhanced
LF
22 6 0145
Longest D + ID 18 9 0073
Min TF + ID 21 7 0090
EF + ID 20 9 0011
Shortest D + ID 14 15 0001
LS + D + TF + ID 25 2 0500
ES + ID 25 2 0500
62
LS + ID 24 3 0656 a Number of times the Percentage Increase over the CPM of an existing heuristic was higher than
that obtained by the Enhanced LF
Classification by Resource Utilization (RU)
Table 12 and Table 13 show a comparison of the percentage increase over the CPM duration and
the number of times each heuristic produced the shortest and longest schedules when 30 networks
with RF = 025 were classified according to the RU factor (see Table 11)
Table 11 Networksrsquo Classification by RF = 025 and RU
N =
141
RF = 025
N = 30
RU 010 - 025 N = 12
RU 025 - 050 N = 18
RF = 075
N = 111
RU 025 - 050 N = 38
RU 050 - 075 N = 35
RU 075 - 100 N = 18
RU 100 - 125 N = 20
When networks have a RU between 010 and 025 either the ES+TF+ID or ES+ID rules obtained
the best results Both heuristics produced the lowest average percentage increase above the CPM
duration (33) and found the shortest durations all the time (See Table 12) Although four
heuristics found the second-lowest deviation from the CPM duration (34) the Enhanced LF
heuristic obtained the highest number of shortest schedules (916) The heuristics that performed
worst were the Shortest Duration +ID (59) followed by the EF+ID (46) Worthy of note half
of the schedules obtained by the Shortest Duration +ID have the longest duration
Table 12 Networksrsquo Classification by RU between 010 and 025 (RF = 025 N = 30)
Heuristic Average Increase Shortest
Duration
Longest
Duration
ES + TF + ID 33 1000 00
ES + ID 33 1000 00
Enhanced LF 34 916 83
LF + ID 34 833 00
LS + ID 34 833 00
LS + D + TF + ID 34 833 00
Min TF + ID 37 750 00
Longest D + ID 39 666 166
EF + ID 46 583 166
Shortest D + ID 59 416 500
When networks have a RU between 025 and 050 the LS+D+TF+ID obtained the lowest average
percentage increase above the CPM duration (53) and the shortest schedules more frequently
(940) (See Table 13) Under this scenario the LS+D+TF+ID did not find any longest schedule
63
The Enhanced LF was the second heuristic with the highest number of times producing shortest
schedules (889) The heuristics that performed the worst were the Min TF+ID followed by the
Shortest Duration +ID (62) Despite the Min TF+ID produced a significant number of schedules
with the shortest duration (722) it obtained the highest average percentage increase in the
project duration In other words the Min TF+ID produced higher deviations from the CPM
duration than the other rules when it did not work
Table 13 Networksrsquo Classification by RU between 025 and 050 (RF = 025 N = 30)
Heuristic Average Increase Shortest Duration Longest Duration
LS + D + TF + ID 53 940 00
ES + TF + ID 54 833 00
Enhanced LF 55 889 56
ES + ID 56 833 56
LS + ID 56 833 00
EF + ID 58 611 278
LF + ID 60 667 167
Longest D + ID 60 611 222
Shortest D + ID 62 389 444
Min TF + ID 62 722 278
Classification by RF = 075
The sample networks were classified by a RF equal to 075 (see Table 14) Table 15 shows the
summary of the average percentage increase over the CPM duration the percentage of times each
heuristic produced the shortest and longest duration for the 111 networks of the sample with a
RF = 075
Table 14 Networksrsquo Classification by RF = 075
N =
141
RF = 025
N = 30
RU 010 - 025 N = 12
RU 025 - 050 N = 18
RF = 075
N = 111
RU 025 - 050 N = 38
RU 050 - 075 N = 35
RU 075 - 100 N = 18
RU 100 - 125 N = 20
The Enhanced LF produced the lowest average increase above the CPM duration (128) and the
shortest schedules more frequently than any other heuristic (509) Overall the top three
heuristics (Enhanced LF LS+ID and ES+ID) 1) had a lower average percentage increase above
the CPM duration 2) found the shortest duration more frequently and 3) found the worst (longest)
duration less frequently (see Table 15) The heuristic that performed the worst was the Shortest
Duration +ID (152)
64
Table 15 Results N = 111 and RF = 075
Heuristic Average
Increase
Minimum
()
Maximum
()
Shortest
Duration
Longest
Duration
Enhanced LF 128 12 302 509 54
LS + ID 130 11 291 500 27
ES + ID 130 03 291 482 45
LS + D + TF + ID 130 11 291 473 45
LF + ID 134 03 302 402 71
Min TF + ID 138 12 291 330 152
Longest D + ID 141 12 323 384 214
EF + ID 143 11 312 188 268
Shortest D + ID 152 11 312 134 482
The influence of a tiebreaker in the LF and LS rules can be also noticed in Table 15 The Pn as a
tiebreaker of the LF leads to a lower average percentage increase in the project duration (128)
and a higher number of schedules with the shortest duration (509) than the activity ID as a
tiebreaker of the LF On the other hand the LS produced lower deviations from the CPM duration
and the shortest schedules more frequently when it was combined with the activity ID rather than
with the duration and total float
When networks have a RF equal to 075 the performance of the heuristics is not as consistent as
it is when networks have a RF equal to 025 When the RF = 075 the best heuristic (Enhanced
LF) found the shortest durations 509 of the time (see Table 15) When RF = 025 the best
heuristic (LS+D+TF+ID) found the shortest durations 900 of the time (see Table 9)
The Enhanced LF outperformed the LF+ID Min TF+ID Longest Duration +ID EF+ID and
Shortest Duration +ID heuristics For all cases the p-values were lower than 0001 (See Table 16)
The Sign Test did not find enough evidence to conclude that the Enhanced LF produces
significantly lower deviations than the LS andor ES heuristics (p gt 020) However the
Enhanced LF produced lower durations (positive differences -microd) more frequently than the
LS+D+TF+ID (41 vs 34) and LS+ID (41 vs 37) Otherwise the ES+ID and the Enhanced LF
produced the same number of shortest schedules (38)
Table 16 Sign Test Results N = 111 and RF = 075
Comparison No Ties No Positive
Differencesa Z-value p-value
LF + ID
Enhanced
LF
47 44 -287 0002
Longest D + ID 26 59 -347 0001
Min TF + ID 26 62 -412 0001
EF + ID 27 66 -512 0001
Shortest D + ID 24 82 -814 0001
LS + D + TF + ID 36 41 -069 0244
ES + ID 35 38 000 0546
LS + ID 33 41 -034 0367
65
Classification by Resource Utilization (RU)
Tables 18 - 20 show the percentage increase over the CPM duration and the number of times each
heuristic produced the shortest and longest schedules when the 111 networks with RF = 075 were
classified by RU (see Table 17) As stated by Davis 1975 the heuristic performance is affected by
the RU The greater the proportion of resource requirement per activity relative to the amount
available the greater the increase in the project duration after mitigating the resource supply-
demand problem
Table 17 Networksrsquo Classification by RF = 075 and RU
N =
14
1
RF = 025
N = 30
RU 010 - 025 N = 12
RU 025 - 050 N = 18
RF = 075
N = 111
RU 025 - 050 N = 38
RU 050 - 075 N = 35
RU 075 - 100 N = 18
RU 100 - 125 N = 20
When networks have a RU between 025 and 050 the ES+TF+ID produced the lowest average
percentage increase in the project duration (84) (See Table 18) The ES+TF+ID followed by
ES+ID produced the shortest schedules more frequently than any other rule (684 and 631
respectively) The LS+ID and LS+D+TF+ID produced the same number of schedules with the
shortest duration but the LS+ID produced a lower increase in the duration than the LS+D+TF+ID
The heuristics that performed the worst were the Shortest Duration +ID (107) followed by the
EF+ID (96)
Table 18 Networksrsquo Classification by RU between 025 and 050 (RF = 075 N= 38)
Heuristic Average Increase Shortest Duration Longest Duration
ES + TF + ID 84 684 00
LS + ID 85 526 26
LS + D + TF + ID 86 526 26
ES + ID 86 631 53
Enhanced LF 87 474 79
LF + ID 89 474 79
Min TF + ID 91 394 132
Longest D + ID 95 316 211
EF + ID 96 263 211
Shortest D + ID 107 184 500
When networks have a RU between 050 and 075 the Enhanced LF obtained the lowest average
percentage increase above the CPM duration (125) and the shortest schedules more frequently
(628) Under this scenario the Enhanced LF did not find any longest schedule (See Table 19)
The LS+ID was the second heuristic with the highest number of times producing shortest schedules
(514) The ES+TF+ID produced the second-lowest average increase in the duration (129) but
it only worked 371 of the time The ES+ID only worked 343 of the time for this scenario
66
with an average percentage increase above the CPM duration of 131 The heuristics that
performed the worst were the Shortest Duration +ID (159) followed by the EF+ID (146)
Table 19 Networksrsquo Classification by RU between 050 and 070 (RF = 075 N= 35)
Heuristic Average Increase Shortest Duration Longest Duration
Enhanced LF 125 628 00
ES + TF 129 371 00
LS + ID 131 514 00
ES + ID 131 343 28
LS + D + TF + ID 131 496 00
LF + ID 137 371 28
Min TF + ID 143 228 143
Longest D + ID 145 371 228
EF + ID 146 114 286
Shortest D + ID 159 86 514
When networks have a RU between 075 and 100 the heuristicsrsquo performance is poor ie the
consistency in the results for each heuristic was lower than 56 (See Table 20) More heuristics
should be tested under this scenario in order to identify a more efficient heuristic (percentage of
consistency of at least 60) The ES+TF+ID produced the shortest schedules more frequently
(555) than any other rule However it produced a higher average increase in the project duration
(147) than the ES+ID (144) The heuristics that performed the worst were the Shortest
Duration +ID (170) followed by the Min TF+ID (163)
Table 20 Networksrsquo Classification by RU between 075 and 100 (RF = 075 N= 18)
Heuristic Average Increase Shortest Duration Longest Duration
ES + ID 144 500 55
ES + TF + ID 147 555 00
Enhanced LF 148 333 55
LS + ID 150 333 55
LS + D + TF + ID 151 278 167
LF + ID 153 278 111
Longest D + ID 158 333 111
EF + ID 160 167 278
Min TF + ID 163 278 333
Shortest D + ID 170 55 500
When networks have a RU between 100 to 125 the LS+ID obtained the lowest average
percentage increase above the CPM duration (192) and the shortest schedules more frequently
(60) Additionally the LS+ID did not find any longest schedule (See Table 21) The ES+TF+ID
produced the same number of shortest schedules than the LS+ID (60) but the former produced
higher deviations from the CPM duration (197) than the LS+ID (192) Similarly the
Enhanced LF produced the same number of shortest schedules than the LS+D+TF+ID (55) but
the former produced higher deviations from the CPM duration (196) than the LS+ID (194)
Worthy of note the ES+ID only worked 45 of the time for this scenario with an average
67
percentage increase above the CPM duration of 198 The heuristics that performed the worst
were the Shortest Duration +ID (212) followed by the EF+ID (208)
Table 21 Networksrsquo Classification by RU between 100 and 125 (RF = 075 N= 20)
Heuristic Average Increase Shortest Duration Longest Duration
LS + ID 192 600 00
LS + D + TF + ID 194 550 00
LF + ID 195 450 50
Enhanced LF 196 550 100
ES + TF + ID 197 600 00
Min TF + ID 197 450 00
ES + ID 198 450 50
Longest D + ID 204 550 250
EF + ID 208 200 300
Shortest D + ID 212 200 400
Heuristics Selection
A matrix that classifies the performance of the heuristics was created based on the results obtained
in this study (see Table 22) The matrix was developed for networks with a SerialParallel Indicator
(I2) equal to 065 a Resource Strenght (RS) equal to 025 and a Network Complexity (NC) equal
to 15 (on average three successors per activity) Although the size of the network has been reported
as another influential parameter of heuristic performance it was not considered in the classification
system due to the fact that real construction projects have a significant number of activities that
are challenging to simulate and test by scholars (Boctor 1996 Zhan 1994) The two parameters
required to select a heuristic in the matrix are the Resource Factor (RF) and the Resource
Utilization factor (RU) These two resource measures can be easily simulated and tested Besides
they are calculated as a function of the number of total activities of the project
The matrix indicates the two heuristics with better performance for each of the scenarios
considered Given the variable nature of heuristics it is recommended to apply both options to
determine which one gives the best solution (shortest duration but not optimum) If the matrix is
empty it means that networks with the specified resource characteristics were not tested in this
study
The heuristic labeled as Option 1 is the one that produced the lowest increase in the project duration
and the shortest schedules more frequently The heuristic labeled as Option 2 is the second
heuristic which had the highest number of times producing the shortest schedules regardless of
the average increase in the project duration If there was a tie with respect to the number of times
producing the shortest duration (consistency rate) the heuristic that produced the lowest average
increase in the project duration was selected as Option 2 In real construction projects even one
day of difference in the completion time can significantly impact the budget
68
Table 22 Classification Matrix based on Heuristicsrsquo Performance
RU RF = 025 RF = 075
Option 1 Option 2 Option 1 Option 2
010 ndash 025 ES + TF + ID or ES + ID Enhanced LF - -
025 ndash 050 LS + D + TF + ID Enhanced LF ES + TF + ID ES + ID
050 ndash 075 - - Enhanced LF LS + IDa
075 ndash 100 - - ES + IDb ES + TF + IDb
100 ndash 125 - - LS + ID ES + TF + ID a Consistency rate ( Shortest Duration) lower than 50 b Consistency rate ( Shortest Duration) lower than 55
The LS has been reported as one of the heuristics that produces better results (lower deviations
from the CPM duration) by several authors However as shown in Table 17 the performance of
the LS is better and more consistent when the RF of the networks equals 025 and the RU ranges
from 025 to 050
Real construction projects have a significant amount of activities Therefore calculating the RU
and RF values for each activity can be time-consuming To overcome this issue practitioners could
rough estimate the degree of a project resource demand by randomly selecting 20 of the activities
to calculate these two resource parameters Table 23 shows the results obtained for two projects
after following this approach Although there is a slight difference in the RU rough estimate for
P2 (073) in comparison with the actual value (065) the estimated value (073) falls in the range
associated with the actual value (See Table 17)
Table 23 Rough Estimate of the RU and RF
Project
ID
No
Activities
No Type
Resources
RF RU
Rough Estimate Actual Rough Estimate Actual
1 49 3 077 075 112 105
2 73 2 077 075 073 065
As future research another heuristic that yields to more consistent results when the RF is equal to
075 and the RU ranges from 075 to 100 should be identified For this scenario the two heuristics
selected as Option 1 and Option 2 in the matrix (ES+ID and ES+TF+ID) produced the shortest
schedules only 55 of the time Heuristics with a higher consistency rate are preferred (at least
60) Similarly when the RU ranges from 050 to 075 the LS+ID (Option 2) only worked 50
of the time The same matrix should be developed but this time for networks with a RF equal to
050 and 1
Discussion
None of the heuristics produced the best results for all the 141 networks However the Enhanced
LF heuristic produced the shortest duration more frequently than any other heuristic (592) This
percentage is low but similar to some values obtained in previous studies For instance Davis
69
(1975) reported that the Min TF+ID heuristic found the shortest duration 60 of the times
followed by the LF+ID with a percentage of 46 The heuristic proposed by Boctor (1976) which
was the best among the other heuristics tested found the best solution 54 of the time Ulusoy
(1989) found that the WRUP and LF+ID obtained the best results for 75 of the time Otherwise
Boctor (1993) reported that only 30 of the times the best solution was found by a heuristic
In previous studies few authors have tested the performance of early CPM dates (ES and EF) as
major rules to sort activities The majority of them have focused on evaluating the efficacy of late
CPM dates such as the LS and LF In this study when evaluating the 141 networks (RF = 025 and
075) the ES+ID obtained the second-lowest average percentage increase over the CPM duration
(113) and produced the shortest schedules 585 of the times Moreover it was the only rule
that produced the lowest maximum percentage increase (291) and alongside the LF+ID
produced the lowest percentage increase over the CPM duration (03)
The results of this paper reinforce the statement that certain heuristics work better for certain type
of networks than for others Besides the LS+ID the Min TF+ID and the LF+ID have been reported
in the literature as the most effective heuristics minimizing the project duration (Kolish 1995
Ulusoy 1989 Davis 1975 Chen et al 2018) However in this study the performance of these
two heuristics (Min TF+ID and LF+ID) is poor in terms of the average percentage increase over
the CPM duration and the number of times producing the shortest and largest schedules (see Table
4) These opposing results emphasize the need for determining under which network and resource
characteristics heuristics produce better results A heuristic classification system will help
practitioners to decide which heuristic applies when mitigating the resource supply-demand
problem given the project characteristics
On the other hand the main parameter for sorting the activities significantly influences the
resulting schedule However if a tie exists the tiebreaker also influences the resulting schedule
Therefore schedulers should carefully select the tiebreaker of a heuristic not doing so may lead
to obtaining longer schedules if a tie exists The highest number of longest schedules was obtained
when the activity ID was considered as a tiebreaker of either the LS or LF
Future Research and Limitations
The eight existing heuristics tested in this study were selected based on the opportunity to apply
them using scheduling software However other heuristics such as the Resource Scheduling
Method (RSM) the Greatest Rank Positional Weight (GRPW) and the Weighted Resource
Utilization and Precedence (WRUP) should be tested under the same scenarios since they have
been reported in previous studies as priority rules with good performance
Additionally all heuristics were evaluated under a serial approach Given the differences between
the serial and parallel methods the heuristics should be tested under a parallel approach as well
This classification will provide practitioners the option of splittinginterrupting the work which
may be beneficial for some activities and may also reduce the project completion time
The matrix developed in this study is a point of departure for the development of a more complete
classification system for the industry The results of this study are limited to networks with I2=
70
065 RS = 025 NC = 150 and RF = 025 and 075 The classification system should be extended
so other common values of RF RS and NC can be included
Conclusion
This study proposed a new tiebreaker (Priority Number - Pn) that considers the duration and total
float of the activities The Pn enhanced the performance of the LF priority rule Lower deviations
from the CPM duration and a higher number of shortest schedules were obtained when the LF was
combined with Pn than when the LF was combined with the total float or activity ID The Enhanced
LF produced lower deviations than the LS when both heuristics did not get the same results This
study recommends using the Pn as a tiebreaker of the LF and either the duration or total float as a
tiebreaker of the LS
Overall the heuristics with good performance are LS Enhanced LF and ES The average increase
in the project duration obtained by these three rules compares favorably with the results obtained
by the other priority rules tested in this study The ES+ID and ES+TF have the potential of being
considered as one of the top heuristics since its performance is good and consistent for specific
project parameters Otherwise the Shortest Duration+ID and EF+ID heuristics are inappropriate
choices when attempting to minimize the project duration Both produced the largest deviations in
the networks for all the scenarios analyzed in this study
The heuristicsrsquo performance is more consistent (number of times producing the shortest schedules)
when the proportion of resource types required per activity is low (RF = 025) When the RF =
075 the rate of consistency is less than 60 This reinforces the fact that some rules may work
better for specific project characteristics than for others Therefore it is vital to identify under
which circumstances each one of the best heuristics produces good results
This study developed a matrix to help schedulers deciding which heuristic applies when mitigating
the resource supply-demand problem depending on the resource characteristics of a network (RF
and RU) Given the variable nature of heuristics the matrix indicates the two heuristics with better
performance for each of the scenarios considered As a best practice practitioners should perform
both heuristics and determine which one gives the best solution (shortest schedule) For real-life
purposes the decision of selecting a schedule with the shortest possible duration or an optimum
duration comes down to evaluating the viability of executing the schedule eg in terms of means
and methods or in terms of resource disruption
Data Availability Statement
Data generated by the authors can be found at Franco Duran (2019)
71
References
Abeyasinghe M C L Greenwood D J amp Johansen D E (January 01 2001) An efficient
method for scheduling construction projects with resource constraints International Journal of
Project Management DOIorg101016S0263-7863(00)00024-7
Alvarez-Valdes R and Tamarit JM (1989) Algoritmos heuristicos deterministas y aleatorios
en secuenciacion de proyectos con recursos limitados Questiio 13 173-191
Boctor F F (January 01 1993) Heuristics for scheduling projects with resource restrictions and
several resource-duration modes International Journal of Production Research 31 11 2547
DOIorg10108000207549308956882
Chen Z Demeulemeester E Bai D E amp Guo S (2018) Efficient priority rules for the
stochastic resource-constrained project scheduling problem European Journal of Operational
Research 270 3 957-967 DOIorg101016jejor201804025
Davis E W amp Patterson J H (April 01 1975) A Comparison of Heuristic and Optimum
Solutions in Resource-Constrained Project Scheduling Management Science 21 8 944-955
DOIorg101287mnsc218944
Demeulemeester E Vanhoucke M amp Herroelen W (January 01 2003) RanGen A Random
Network Generator for Activity-on-the-Node Networks Journal of Scheduling 6 1 17-38
DOIorg101023A1022283403119
Elliott A C amp Woodward W A (2007) Statistical analysis quick reference guidebook With
SPSS examples Thousand Oaks Calif Sage Publications DOIorg1041359781412985949
Gordon J H (January 01 1983) Heuristic methods in resource allocation International Journal
of Project Management 1 3 163-168 DOIorg1010160263-7863(83)90022-4
Franco Duran D Primavera P6 Schedules University Libraries Virginia
Tech DOIorg107294W4-5R6Z-D346
Kastor A amp Sirakoulis K (July 01 2009) The effectiveness of resource leveling tools for
Resource Constraint Project Scheduling Problem International Journal of Project
Management 27 5 493-500 DOIorg101016jijproman200808006
Kolisch R (1995) Project Scheduling under Resource Constraints - Efficient Heuristics for
Several Problem Classes Physical Heidelberg
Kolisch R (January 01 1996) Serial and parallel resource-constrained project scheduling
methods revisited Theory and computation European Journal of Operational Research 90 2
320-333 DOIorg1010160377-2217(95)00357-6
72
Marimuthu K Palaneeswaran E Benny R amp Ananthanarayanan K (July 15 2018) Resource
Unconstrained and Constrained Project Scheduling Problems and Practices in a Multi-project
Environment Advances in Civil Engineering 2018 DOIorg10115520189579273
Moder J J Phillips C R amp Davis E W (1983) Project Management with CPM PERT and
precedence diagramming (3rd ed ed) New York Van Nostrand Reinhold
Patterson J H (December 01 1973) Alternate methods of project scheduling with limited
resources Naval Research Logistics Quarterly 20 4 767-784
DOIorg101002nav3800200415
Patterson J H (March 01 1976) Project scheduling The effects of problem structure on heuristic
performance Naval Research Logistics Quarterly 23 1 95-123
DOIorg101002nav3800230110
Ulusoy G and Tzdamar L (1989) Heuristic performance and networkresource characteristics
in resource-constrained project scheduling Journal of the Operational Research Society 40 1145-
1152 DOIorg101057jors1989196
Zhan J (1994) Heuristics for scheduling resource-constrained projects in MPM
networks European Journal of Operational Research 76 1 192-205 DOIorg1010160377-
2217(94)90016-7
73
CHAPTER 4
Application of An Enhanced Resource-Constrained Critical Path Method (eRCPM) to
Non-progressed and Progressed Schedules
Abstract
The Resource-Constrained Critical Path Method (RCPM) is a method that identifies resource-
dependent activity relationships (links) when mitigating a resource-supply demand problem These
resource links allow the identification of a continuous critical path and the calculation of correct
float values Even though RCPM provides more reliable float values than traditional RCS
algorithms there are some shortcomings that must be addressed to enhance its capability and make
it more practical for real construction projects
This paper presents the application of an Enhanced RCPM (eRCPM) in non-progressed and
progressed resource-constrained schedules The eRCPM 1) performs three different serial-based
resource-constrained scheduling heuristics 2) keeps and removes specific resource links in a
progressed schedule before re-running eRCPM 3) selects a resource link configuration when
having many possible resource-driven activities and 4) selects a default schedule after evaluating
some schedule characteristics
Additionally an eRCPM system was developed and integrated with Primavera P6 The
development of the eRCPM computerized system allows the identification of a continuous critical
path in resource-constrained schedules in a practical way Besides construction professionals can
use these eRCPM schedules to perform delay analysis in scheduling software such as Primavera
P6
Keywords phantom float Primavera P6 resource overallocation resource-constrained
scheduling resource-depend activity relationships
Introduction
The baseline schedule is frequently used to track project performance Resources as a key
component of schedules must be also monitored to prevent or mitigate any extension on the project
completion time as a result of resource availability When the resource demand exceeds the supply
(overallocation) activities must be delayed until resources become available
Due to the projectsrsquo size and complexity schedulers use scheduling software such as Primavera
P6 or Microsoft Project to fix the resource conflicts of a schedule Even though the software solves
the overallocation problem applying Resource-Constrained Scheduling (RCS) algorithms the
results show incorrect total float values and a broken critical path This happens because
CPM+RCS calculations suggest that activities have float but this float does not exist ndash hence the
named Phantom Float (Franco-Duran and de la Garza 2019)
74
The Resource-Constrained Critical Path Method (RCPM) is a method that correctly calculates the
floats of activities and identifies a continuous critical path in resource-constrained schedules (Kim
and de la Garza 2003) The RCPM provides more reliable float values than traditional RCS
methods but there are some shortcomings that must be addressed to enhance its capability and
make it more practical for real construction projects This study tackles some of the flaws of the
RCPM which are described in the following section and illustrates the application of the
Enhanced RCPM (eRCPM) with two cases studies
RCPM Shortcomings
Priority Rules
The RCPM applies the Late Start (LS) heuristic Heuristics are problem-dependent so they are
likely to be better in some situations than in others Some priority rules may work well for a project
but may not work well when applied to a different project (Wiest 1963) Even if the Project
Completion Time (PCT) obtained by two or more heuristics is the same the sequence of the
activities may be different (Rivera and Duran 2004) Since each heuristic works differently and
produces different schedule outcomes the eRCPM incorporates 1) two additional heuristics (ES
and Enhanced LF) and 2) a criterion to evaluate the resulting schedules and selects one as a default
Removal of Resource Links
When the RCPM was developed the objective was to solve the issue of a broken critical path in a resource-
constrained schedule Hence Kim and de la Garza (2003) did not explore the application of the RCPM for
control purposes further ie the use of resource links when updating a schedule
The updates on a baseline schedule could change the priority order identified by the RCS heuristic
to schedule the activities when an over-allocation problem exists When re-applying the RCPM
the resource links identified before updating the project may no longer be required andor new
resource links can be identified because of the changes in the schedule The existing resource links
should be removed from the schedule because they were identified based on previous and different
conditions If the links are kept they constrain the schedule
In this regard the RCPM removes all existing resource links before re-running the method (Kim
and de la Garza 2003) The eRCPM removes only the resource links located right to the data date
each time a project is updated and the algorithm is re-applied The eRCPM keeps the resource
links located left to the data date because the project was already executed based on these activitiesrsquo
configurations
Selecting Resource-Driving Activities
One issue that arises when identifying activity resource relationships is having different possible
links configurations between activities (Kim 2003 Nisar 2013) This occurs when having many
current activities with many predecessors (see Figure 1) The difference between the different
schedules that can be generated is not only the number of resource links created but also the
number of critical activities
75
Figure 1 Multiple Schedule Alternatives Example taken from Nisar Yamamoto amp Suzuki (2013)
According to Nisar Yamamoto amp Suzuki (2013) the resource dependences should be created in
a way the total number of relationships is minimized without violating the resource constraints
The goal is to not increase the complexity of the network with a high number of resource links
The RCPM does not incorporate any criteria to identify resource-driving activities Instead the
algorithm creates all possible resource links configurations between the activities under
consideration (Kim and de la Garza 2003)
The eRCPM considers the number of resources and the duration of the activities as the main criteria
to determine a resource-driving activity These parameters were selected because they may affect
the PCT An activity that demands higher resources is more likely to delay a project This activity
may be delayed since other activities may need some of the resources of this activity Moreover
the longer the duration of the activity the greater the impact on the PCT
RCPM Prototype System
The RCPM prototype system developed by Kim and de la Garza in 2003 for Project Planner (P3)
does not work for Primavera P6 because P6 is built on a different platform than P3 At present
there is a lack of practical mechanisms to identify resource relationships in P6 project schedules
The eRCPM was integrated with Primavera P6 by developing a system that reads project
information from a P6 project performs the necessary eRCPM procedures and updates the P6
project with the corresponding resource relationships
Enhanced Resource-Constrained Critical Method (eRCPM)
This section explains each of the steps of the eRCPM (see Figure 1b) The eRCPM keeps the main
steps of the RCPM (see Figure 1a) but it incorporates more steps to address the above-mentioned
shortcomings
76
System Primavera Project Planner (P3) System Primavera P6
1 CPM
2 Serial-Based RCS
21 Forward Pass Heuristic
LS + D + TF + ID
211 Creating RLs
22 Finding
Unidentified RLs
23 Backward Pass
with RLs
3 Finding Alternative
Schedules
0 Removing all
Existing RLs
RCPM
Figure 1a RCPM Figure 1b Enhanced RCPM (eRCPM)
Figure 1 Outline of the RCPM and eRCPM
Step 0 KeepingRemoving Resource Links
The eRCPM checks the status of each activity to determine whether a Resource Link (RL) should
be removed from or kept on the schedule When having a progressed schedule with resource
relationships the RLs are kept in the schedule if 1) both activities (predecessor and successor) are
already completed and 2) the predecessor activity is completed and the successor activity is in
progress Otherwise the RLs are removed from the schedule if 1) the two activities (predecessor
and successor) have not started yet and 2) the predecessor activity is completed but the successor
activity has not started (see Figure 2)
Figure 2 Keeping and Removing Existing Resource Links before re-applying RCPM
77
Step 1 Critical Path Method (CPM)
The eRCPM performs the CPM to find the early and late dates and float values of each activity
If there is a resource overallocation problem the algorithm mitigates the resource-supply demand
problem by applying resource-constrained heuristics
Step 2 Serial-based RCS heuristics with Resource Links
The eRCPM performs three different heuristics to mitigate a resource supply-demand problem 1)
Late Start (LS) 2) Enhanced Late Finish (LF) and 3) Early Start (ES) These three heuristics were
incorporated into the algorithm because they produce better results in terms of extending the
project duration than other existing priority rules (Franco Duran and de la Garza 2020) The
heuristics are performed under a serial approach eg activities are sorted as a single group and
then scheduled one at a time
1 In the Late Start heuristic the priority is given to activities with the earliest values of Late
Start (LS) If there is a tie with respect to the LS the priority is given to the activity with
the least duration (D) If the tie persists the priority is given to the activity with the least
total float (TF) If the tie persists the priority is given to the activity with the smallest
activity number (ID)
2 In the Enhanced LF heuristic the priority is given to activities with the earliest values of
Late Finish (LF) If there is a tie with respect to the LF the priority is given to the activity
with the lowest Priority Number (Pn) The Priority Number which is a new tiebreaker that
can be incorporated with any rule is calculated based on the duration (119863119894) and total float
(119879119865119894) of each activity (see Equation 1) If there is a tie with respect to the Pn the tie is
broken by the smallest activity number (ID) (Franco Duran and de la Garza 2020)
119875119899 =
119863119894
119879119865119894
(Eq 1)
3 In the Earliest Start heuristic the priority is given to activities with the earliest values of
Early Start (ES) If there is a tie with respect to the ES the tie is broken by the smallest
activity number (ID)
Step 21 Forward Pass
Step 211 - Creating Resource Links During the performance of any of the three RCS heuristics
mentioned above if there are not enough resources to execute an activity the activity is delayed
until resources become available The resources causing the current activity delay are released
from other activity completion (Kim and de la Garza 2003) Like the RCPM the eRCPM creates
a resource link (relationship) between the postponed activity (successor) and the preceding activity
that shares the same resources (resource-driving activity)
Step 212 - Selecting Resource-Driving Activities The eRCPM considers three different cases to
identify the ldquoresource-driving activityrdquo for the delayed task when having multiple alternatives
78
Case I One Type of Resources
When having one type of resources the eRCPM selects as a resource-driving the activity with the
highest number of resources If there is a tie with respect to the number of resources the activity
with the longest duration is selected If the tie persists the activity with the smallest activity ID is
selected as a resource-driving activity
For example in Figure 3 Activity A7 is delayed because of resource unavailability (ten resources
would be needed but only eight are available) Either A4 or A11 can be the resource-driving
activity of A7 For this scenario the traditional RCPM creates two resource links one between A4
and A7 and another between A11 and A7 The eRCPM creates only one link between A4 and A7
because A4 requires a higher number of resources than A7 (R = 2 vs R = 1)
Figure 3 Example of Case I One Type of Resources
Case II Two Types of Resources and 1 Conflicting Resource
When having two types of resources and only one conflicting resource type the eRCPM selects
as a resource-driving activity the activity with the highest number of conflicting resources If there
is a tie with respect to the higher number of resources the activity with the longest duration is
selected If the tie persists the activity with the highest number of the other type of resource is
selected If the tie persists the activity with the smallest activity ID is selected
In Figure 4 Activity A11 was delayed because of the resource unavailability of R1 Activities A2
A4 and A10 are the potential resource-driving activities of A11 The traditional RCPM creates
three RLs one between A11and A2 another between A11 and A4 and another between A11 and
A10 The eRCPM creates only a link between A10 and A11 In this case although A10 and A4
have the same higher number of the conflicting resource (R1 = 3) and the same duration (D = 7
Days) A10 requires more resources type 2 (R2 =2) than A4 (R2 =0)
79
Figure 4 Example Case II Two Types of Resources and One Conflicting Resource
Case III 2 or more Conflict Resources
When having two or more types of resources and several conflicting resource types the eRCPM
algorithm selects as a resource-driving activity the activity with the highest average number of
conflicting resources If there is a tie with respect to the average number of conflicting resources
the activity with the longest duration is selected If the tie persists the activity with the smallest
activity ID is selected as a resource-driving
In Figure 5 Activity A11 was delayed because of the resource unavailability of R2 and R3
Activities A3 A7 and A8 are the potential resource-driving of A11 The traditional RCPM creates
three RLs one between A3 and A11 other between A7 and A11 and another between A8 and
A11 The eRCPM creates only one link between A8 and A11 In this case A8 has a higher average
number of the two conflicting resources than the other two activities
Figure 5 Example Case III Two or more Conflict Resources
80
Step 22 Finding Unidentified Resource Links
Like RCPM before performing the backward pass the eRCPM checks if non-critical activities
(non-zero total float) can fully use the float or if there is any resource constraint for the float period
(Kim and de la Garza 2003) If so an additional resource link is created between the conflicting
activities considering the three cases described above when having multiple possible resource-
driving activities
For example in Figure 7 when checking for unidentified RLs Activity A5 cannot be delayed
because otherwise an over-allocation arises with respect R2 (13 resources will be needed but only
ten are available) Activities A3 A8 and A9 are the potential resource-driving activities of A5
The traditional RCPM creates three RLs one between A5 and A3 other between A5 and A8 and
another between A5 and A9 The eRCPM creates only one link between A5 and A8 because A8
requires a higher amount of R2 than the other two activities
Figure 6 Example 1 Identification of additional Resource Links
In Figure 7 when checking for unidentified Activity A4 which has ldquoseven daysrdquo of float cannot
be delayed because otherwise an over-allocation arises with respect to R1 (11 resources will be
needed and there are only nine available) Activities A8 A9 and A11 are the potential resource-
driving activities of A4
Figure 7 Example 2 Identification of additional Resource Links
81
The traditional RCPM creates three RLs one between A4 - A8 other between A4 - A9 and another
between A4 -A11 The eRCPM creates only a link between A4 and A11 In this case although
A11 and A9 have the same higher number of resources the duration of A11 (D = 7 Days) is longer
than A9 (D = 4 Days)
Step 23 Backward Pass
Once all resource links are identified the eRCPM performs the CPM backward pass considering
both the technological and resource relationships By considering both types of relationships a
continuous critical path can be identified in a resource-constrained schedule
Step 3 Alternative Schedule
Like RCPM the eRCPM finds alternative schedules by looking for activities that can be scheduled
during a different period without breaching all the relationships
Step 4 Selecting a Schedule
Since the eRCPM performs three different RCS heuristics (LS Enhanced LF and ES) the
algorithm selects as a default schedule the one with the shortest duration If there is a tie between
the schedules with respect to the PCT the schedule with the smallest resource moment value (Mx)
is selected
The Minimum Moment (Mx) was chosen as a criterion to select a resulting resource-constrained
schedule because it is a good measure of resource utilization A lower value indicates a better
resource allocation eg a resource profile closer to a rectangular shape The moment of the daily
resource demands about the horizontal axis of a projectrsquos resource histogram (Mx) is calculated as
shown in Equation 2 (Harris 1978) Where 119910119894 represents the daily resource utilization When
having multiple types of resources in a schedule Mx is calculated for each resource profile and
then compared with the values of the other schedules The schedule with the highest number of
resource profiles with the lowest Mx is selected as a default schedule
119872119909 =
1
2sum 119910119894
2
119899
119894=1
(Eq 2)
For example the two schedules show in Figures 8a and 8b (LS-based and ES-based respectively)
have the same PCT (19 days) but different resource profiles Since the Mx of the resource profile
of the LS-based schedule is lower (1970) than the that of the ES-based schedule (200) the eRCPM
selects as default the LS-based schedule The resource profile of this schedule is closer to a
rectangular shape than that of the ES-based schedule and therefore it has better resource allocation
82
a LS-based Schedule b ES-based Schedule
Figure 8 Resource Profiles Calculation of Mx
If there is a tie with respect to the Mx the schedule with the lowest number of critical activities
(TF = 0) is selected as a default If the tie persists the schedule with the highest average of free
float is selected as a default The float values (TF and FF) were selected as parameters to select a
resource-constrained schedule because 1) having a schedule with less critical activities decrease
the probability of delaying the project completion time and 2) having a schedule with a higher
average time of free float gives more flexibility for delaying some activities without affecting the
start time of the successor activities
Finally if there is still a tie between the three resulting schedules (LS Enhanced LF and ES
based) the eRCPM selects the LS-based schedule as a default If the tie is between the Enhanced
LF and ES-based schedules the eRCPM selects as the default the Enhanced LF-based schedule
Enhanced RCPM (eRCPM) System
The eRCPM system was developed and integrated with Primavera P6 using the Primavera P6rsquos
API (Application Program Interface) The eRCPM prototype system handles smart relationships
multiple calendars holydays and exceptions multiple types of resources and progressed
schedules Specifically the system 1) exports a specific P6 project in an XML format 2) reads and
stores the project information from the XML file 3) performs the Enhanced RCPM 4) updates
the XML file by adding the identified resource relationships and 5) imports the file again into P6
Then the updated schedule appears in the userrsquos P6 database
The updated P6 schedule has already the resource relationships incorporated into the schedule
thus the user should only re-run CPM in P6 (schedule) to obtain the earlylate dates and float
values Primaverarsquos users can identify the resource links that were added to the schedule adding a
user-defined field created by the eRCPM system called ldquoRL Successorsrdquo The user-defined fields
are custom fields that P6 users can create to track specific project information The eRCPM system
also creates another user-defined field called ldquoPFrdquo which shows the phantom float each activity
had before adding the resource links into the schedule Finally if after comparing all three resulting
schedules (LS Enhanced LF and ES based) the program selects as default the LF-based schedule
83
P6 users can add another user-defined field called ldquoPNrdquo This column shows the Priority Number
used for each activity when applying the Enhanced LF heuristic
Primavera P6
API
P6 Database
User
Data Input
Export Project (XML)
Read XML File
Primavera
P6
Performs
Enhanced RCPM
Update XML FileImport XML File
Java Program
Figure 9 Enhanced RCPM System
eRCPM Application
This section presents the application of the eRCPM to a non-progressed (Case Study No1) and a
progressed (Case Study No2) resource-constrained schedule The eRCPM was performed by 1)
hand and the resulting schedules were drawn in fenced bar charts and 2) using the eRCPM System
For each case study the three schedules obtained after applying each heuristic (LS Enhanced LF
and ES) by hand and by the eRCPM system are shown and then compared to illustrate the process
the eRCPM follows to select a default schedule
Case Study No1 Non-Progressed Schedule
The case study schedule No1 consists of nine activities with only finish-to-start (FS) relationships
a seven-workday calendar with no holidays and exceptions and one type of resource (R) The
maximum availability of resource type R is six Figure 10 shows the network of the schedule and
Figure 11a the CPM fenced bar chart The CPM results indicated a project duration of 14 days
(Project Completion Time (PCT) Oct 20 2019) with activities C G and I as critical The eRCPM
was applied to mitigate the over-allocation problem occurring during days 7 to 11 (see Figure 11b)
Figure 10 Case Study No Project Network
84
Figure 11a CPM Fenced Bar Chart Figure 11b eRCPM Fenced Bar Chart (LS-based)
Figure 11 Case Study No1
Figure 11b shows the resulting LS-based schedule drawn in a fenced bar chart so the identified
RLs can be easily observed The PCT was extended by five days (from 14 days to 19 days) after
mitigating the resource supply-demand problem with the LS heuristic (PCT Oct 25 2019) The
sequence of the activities changed and thus the critical path Now activities C B A F D and H
are critical
Figure 12 shows the output of the program after performing the LS heuristic as part of the eRCPM
For each activity the program displays the duration early and late CPM dates (EST EFT LST
and LFT) total float (TF) free float (FF) and Phantom Float (PF) values The program also shows
the resource links identified during the application of the eRCPM For each activity either the
predecessors or successors (resource-driving activities) can be displayed As can be observed in
Figure 11 before adding the resource links into the schedule (C - B B - A A - F and F - D) four
activities had PF This means that based on traditional RCS calculations activities A B C and F
have float However this float does not exist because it cannot be used by activities due to resource
constraints
Figure 12 eRCPM Program Output (LS-based)
The eRCPM system creates resource links in P6 as Finish-to-Start relationships without lag (FS =
0) These new relationships can be identified in a P6 Project by adding the user-defined column
called ldquoRL Successorsrdquo This column indicates the successor resource-driving activity of the
85
activity being considered For example in Figure 13 a new link between activity A and F was
added to the schedule Activities D and E were already successors activities of activity A before
performing eRCPM (Technological Relationships) The eRCPM also creates a user-defined field
called ldquoPFrdquo to display the phantom float values of each activity before adding the resource links
into the schedule Once the user opens the file and runs the project P6 updates the early and late
CPM dates (EST EFT LST and LFT) as well as the float values (FF TF) of each activity As a
result a continuous critical path can be identified in the P6 resource-constrained schedule The
resulting values match the ones obtained by the eRCPM system (see Figures 12 and 13)
Figure 13 eRCPM Schedule in P6 (LS- based)
Figure 14 shows the resulting Enhanced LF-based schedule drawn in a fenced bar chart The PCT
was extended by five days (from 14 days to 17 days) after mitigating the resource supply-demand
problem with the Enhanced LF heuristic (PCT Oct 23 2019) Unlike the LS-based schedule only
three resource links were identified after applying the Enhanced LF heuristic and only four
activities are critical (B C G and I)
Figure 14 eRCPM Fenced Bar Chart (Enhanced LF-based)
Figure 15 shows the output of the program after performing the Enhanced LF heuristic as part of
the eRCPM Before adding the resource links into the schedule (B-C C-A and F-A) two activities
had PF (B and F)
86
Figure 15 eRCPM Program Output (Enhanced LF-based)
Figure 16 shows the updated project in P6 In addition to the two user-defined fields mentioned
before (RL Successors and PF) P6 users can add another user-defined column called ldquoPnrdquo This
column shows the Priority Number values used by the eRCPM to perform the Enhanced LF
heuristic The Pn values are only added to the P6 file when the default schedule selected by the
eRCPM system is the one obtained by this heuristic (Enhanced LF) After re-scheduling the
project the values displayed by P6 match with the ones obtained by the system and a continuous
critical path can be identified in the P6 resource-constrained schedule (see Figures 15 and 16)
Figure 16 eRCPM (Enhanced LF) P6 Schedule
Figure 17 shows the resulting ES-based schedule drawn in a fenced bar chart The PCT was
extended by five days (from 14 days to 19 days) after mitigating the resource supply-demand
problem with the ES heuristic (PCT Oct 25 2019) Even though the ES and LS-based schedules
have the same completion time (Oct 25 2019) the sequence of the activities differs and thus the
RLs and critical path In the ES-based schedule five RLs were identified and activities A B C
G and I are critical
87
Figure 17 eRCPM Fenced Bar Chart (ES-based)
Figure 18 shows the output of the program after performing the ES heuristic as part of the eRCPM
Before adding the resource links into the schedule four activities had phantom float (A B E and
F) Although this number of activities is the same as the number obtained in the LS-based schedule
the PF float values are higher in the ES-based schedule
Figure 18 eRCPM Program Output (ES-based)
Figure 19 shows the updated project in P6 After re-scheduling the project the values displayed
by P6 match the ones obtained by the eRCPM system and a continuous critical path can be
identified in the P6 resource-constrained schedule (see Figures 18 and 19)
88
Figure 19 eRCPM P6 Schedule (ES-based)
In summary the eRCPM system selects the LF-based schedule as default and updates the P6
project based on this heuristic output This schedule is selected because it has the shortest PCT
(Oct 23 2019) among the other two schedules (LS and ES-based) The LS and ES-based schedules
have the same PCT (Oct 25 2019) but due to the priority rules of each heuristic the sequence of
the activities differs and so the resource profile the RLs and the critical path
If the user wants to select a schedule among these two (LS and ES-based) the next parameter to
compare (after the project duration) is the Minimum Momentum (Mx) value of the resource profile
In this regard the Mx of the LS-based schedule is lower (197) than that of the ES-based (200)
This means the resource allocation of the LS-based schedule is better than that of the ES-based
(The resource profile is closer to a rectangular shape) So if a schedule with a finish date of Oct
25 is desired then it is advisable to select the LS-based schedule Figure 20 shows the results of
the comparison performed by the eRCPM system when selecting the default schedule
Figure 20 Summary Output of the eRCPM System
Case Study No 2 Progressed Schedule
The case study schedule No 2 consists of nine activities with two types of precedence relationships
(FS and SS) two types of resources (R1 and R2) and two different calendars Calendar 1 has
seven workdays per week and Calendar 2 has five workdays per week Both calendars have two
days of exceptions (non-working days) October 23rd and November 1st The maximum number of
resources available per day for R1 is six and R2 is seven Figure 21 shows the network of the
schedule and Figure 22a the CPM fenced bar chart
89
Figure 21 Case Study No 2 Network
The CPM results indicated a project duration of 23 days with activities A C I J and K as critical
As shown in Figure 22a there is an over-allocation problem for R1 during days 9 to 11 for R2
during days 10 to 11 The eRCPM was applied to mitigate this supply-demand problem After
applying the three heuristics the eRCPM system selected as default the LF-based schedule As
shown in Figure 22b after solving the resource overallocation problem the PCT was extended by
one day with activities B D E G H and K as critical Additionally five resource links were
incorporated in the schedule (B-D C-G E-G F-G and H-K) This schedule was used as a baseline
to update the project
Figure 22a CPM Fenced Bar Chart Figure 22b eRCPM Fenced Bar Chart (LF-based)
Figure 22 Fenced Bar Chart
The baseline schedule was updated at the end of week 1 (Oct 13 2019) Activities A B and D
have been completed and activity C is still in progress (see Figure 23) The resource link between
activities B and D was kept into the schedule because it is located left to the data date After
removing the resource links located right to the data date (C ndash G E ndash G F ndash G and H ndash K) the
CPM results indicate a project duration of 23 days with activities C I J and K as critical
Additionally there is an over-allocation problem during days 14 to 17 for R1 The eRCPM was
re-applied to mitigate the resource supply-demand problem in this progressed schedule
90
Figure 23 Fenced Bar Chart Schedule Updates
Figure 24 shows the resulting LS-based schedule drawn in a fenced bar chart The PCT was
extended by two days (from 23 days to 25 days) after mitigating the resource supply-demand
problem with the LS heuristic (PCT Oct 31 2019) The sequence of the activities changed and
thus the critical path and the RLs that were identified before the update Now activities G E F
H and K are critical
Figure 24 eRCPM Fenced Bar Chart (Late Start-based)
Figure 25 shows the output of the program after performing the LS heuristic as part of the eRCPM
Since this is a progressed schedule before re-running the method the program identifies and
displays the resources links that are kept in and removed from the schedule based on the Data Date
(DD) of the project As a reminder the RLs located left to the DD are kept in and the RLs located
right to the DD are removed from the schedule With this activity configuration the eRCPM is re-
applied and the system displays the new RLs identified during this process As can be observed in
Figure 25 before adding the RLs into the schedule (G - E G - F E - H and H - K) four activities
had PF (E F G and H) Most of the new RLs are different from the ones removed from the
schedule before re-running the eRCPM This highlights the importance of removing previous RLs
since they may constrain the schedule
91
Figure 25 eRCPM Program Output (LS-based)
Figure 26 shows the updated project in P6 After re-scheduling the project the values displayed
by P6 match the ones obtained by the eRCPM system and a continuous critical path can be
identified in the P6 resource-constrained schedule (see Figures 25 and 26)
Figure 26 eRCPM P6 Schedule (LS-based)
Figure 27 shows the resulting Enhanced LF-based schedule drawn in a fenced bar chart Like the
LS-based schedule the PCT was extended by two days (from 23 days to 25 days) after mitigating
the resource supply-demand problem with the Enhanced LF heuristic (PCT Oct 25 2019) Even
92
though the LS and LF-based schedules have the same finish date (Oct 25 2019) the sequence of
the activities differs and thus the RLs and critical path In the Enhanced LF-based schedule five
RLs were identified and activities C E H and K are critical
Figure 27 eRCPM (Enhanced Late Finish) Fenced Bar Chart
Figure 28 shows the output of the program after performing the Enhanced LF heuristic as part of
the eRCPM Before adding the resource links into the schedule five activities had PF (C E F G
and H) Since the sequence of the activities changed the RLs identified after re-applying the
eRCPM are different from the ones the schedule had before the update and which were removed
before re-running the method
Figure 28 eRCPM (Enhanced LF) Program Output
Figure 29 shows the updated project in P6 After re-scheduling the project the values displayed
by P6 match the ones obtained by the eRCPM system and a continuous critical path can be
identified in the P6 resource-constrained schedule (see Figures 28 and 29)
93
Figure 29 eRCPM (Enhanced LF) P6 Schedule
Figure 30 shows the resulting ES-based schedule drawn in a fenced bar chart The PCT was
extended by six days (from 23 days to 29 days) after mitigating the resource supply-demand
problem with the ES heuristic (PCT Nov 4 2019) In this schedule activities C E I J and K are
critical
Figure 30 eRCPM Fenced Bar Chart (Early Start-based)
Figure 31 shows the output of the program after performing the ES heuristic as part of the eRCPM
Before adding the resource links into the schedule (C - E F - G E - I H - K) five activities had
PF (C E F G and H)
94
Figure 31 eRCPM (ES Sort) Program Output
Figure 32 shows the updated project in P6 After re-scheduling the project the values displayed
by P6 match the ones obtained by the eRCPM system and a continuous critical path can be
identified in the P6 resource-constrained schedule (see Figures 31 and 32)
Figure 32 eRCPM (ES Sort) P6 Schedule
In summary the eRCPM system selects the Enhanced LF-based schedule as default and updates
the P6 project based on this heuristic output This schedule was selected by the system because
95
even though the LF and LS-based schedules have the same finish date (Oct 31 2019) the
Enhanced LF-based schedule has lower values of Mx for the two types of resources (1198721199091 = 189
1198721199092 = 645) than that of the LS-based schedule (1198721199091 = 216 1198721199092 = 665) Since this a progressed
schedule the Mx is calculated after the data date
Worthy of note after the data date the Enhanced LF-based schedule has a fewer number of critical
activities than the LS-based schedule (4 vs 5) but a higher number of RLs (5 vs 4) The Enhanced
LF-based was selected as a default because due to the sequence of the activities the resource
allocation is better than that of the LS-based schedule Figure 33 shows the results of the
comparison performed by the eRCPM system when selecting the default schedule
Figure 33 Summary Output of the eRCPM System
Future Research and Limitations
Due to the nature of each heuristic schedulers and project managers should expect to obtain
different resource-constrained schedules The eRCPM performs three different heuristics under a
serial approach - activities are sorted as a single group and then schedule one at a time The
incorporation of another well-known RCS method such as the parallel method in the algorithm
will provide schedulers more flexibility selecting the schedule that better meets the project
requirements and conditions Under the parallel approach the activity sequence is determined and
updated at the start of a specific period (Moder et al 1983)
Otherwise the three parameters defined in the eRCPM to identify resource-driving activities when
having several concurrent activities with several predecessor activities were not incorporated in
the eRCPM system So additional work should be carried out to add these criteria to the system
Additionally a dynamic scenario must be further explored when determining if the total float
values of noncritical activities can be used during the whole period (identification of additional
resource links) This scenario occurs when two or more activities are analyzed at once instead of
just one When using the available float of only one activity an overallocation problem may not
exist However if two or more activities with float are delayed at the same time an overallocation
may exist and resource links must be added to the schedule
For example in Figure 34 if activity A9 is delayed more than five days there is not an over-
allocation but if A8 is delayed more than seven days at the same time than A9 an overallocation
problem arises regarding R1 (ten resources would be needed and there are only nine available)
The scenario is the same with any possible combination of the non-critical activities (A9 A8 A11)
being scheduled in parallel on day 17 In order to determine if additional RLs should be added into
the schedule as a result of the changes made this study recommends re-applying the eRCPM each
time an activity is delayed
96
Figure 34 Dynamic scenario for identifying resource links
Conclusions
Traditional Resource-Constrained Scheduling techniques fail to provide correct float values and a
continuous critical path in resource-constrained schedules The lack of resource relationships in a
resource-constrained schedule leads to the calculation of wrong late startfinish dates and to the
creation of non-existing floats (phantom float) Therefore all activities must be considered as
influential in the project completion time
Primavera P6 a scheduling software frequently used by the construction industry is not equipped
to identify and create resource links when performing an RCS technique This paper presents the
application of an Enhanced Resource Critical Path Method (eRCPM) in non-progressed and
progressed resource-constrained schedules which was integrated with Primavera P6
The development of the eRCPM computerized system allows the removal of phantom float and
identification of a continuous critical path in P6 resource-constrained schedules The eRCPM
addresses the fact the activity sequence of a resource-constrained schedule may change after a
progress update The eRCPM system incorporates functionality to keep and remove specific
resource relationships of a progressed schedule This functionally allows the application of the
Time Impact Analysis (TIA) methodology for the evaluation of delays Since this is a
contemporaneous analysis each time a delay is inserted into the schedule specific resource
relationships will be kept removed and identified
Additionally the incorporation of three different heuristics into the eRCPM provides more
alternative and flexible schedules that could meet better project requirements Moreover the
system selects as default the schedule with a shorter duration or with better resource allocation
97
References
Franco-Duran D M amp de la Garza J M (July 01 2019) Phantom float in commercial
scheduling software Automation in Construction 103 291-299
DOIorg101016jautcon201903014
Franco-Duran D M amp de la Garza J M (November 01 2019) Review of Resource-Constrained
Scheduling Algorithms Journal of Construction Engineering and Management 145 11)
DOIorg101061(ASCE)CO1943-78620001698
Franco-Duran D M amp de la Garza J M (February 12 2020) Performance of Resource-
Constrained Scheduling Heuristics Journal of Construction Engineering and Management 146
(4) pp 1-12 DOIorg101061(ASCE)CO1943-78620001804
Harris R B 1978 Precedence and Arrow Networking Techniques for Construction Hoboken
NJ Wiley
Kim K and de la Garza J M (2003) A New Approach to Resource-Constrained Scheduling
Fourth Joint International Symposium on Information Technology in Civil Engineering November
15-16 2003 | Nashville Tennessee United States DOIorg10106140704(2003)48
Kim K and de la Garza J M (2003) Phantom Float Journal of Construction Engineering and
Management 129 5 507 DOIorg101061(ASCE)0733-9364(2003)1295(507)
KPMG (2017) Make it or Break it Remaining governance people and technology in the
construction industry Global Construction Survey 2017 Sl KPMG
Moder J J Phillips C R amp Davis E W (1983) Project Management with CPM PERT and precedence
diagramming (3rd ed ed) New York Van Nostrand Reinhold
Nisar S A Yamamoto Koshi amp Suzuki K (January 01 2013) Resource-dependent Critical
Path Method for Identifying the Critical Path and the ldquoReal Floatsrdquo in Resource-Constrained
Project Scheduling Construction and Management special Issue Construction Management
Committee Japan Society of Civil Engineers 69 4 97-107
Rivera F A amp Duran A (January 01 2004) Critical clouds and critical sets in resource-
constrained projects International Journal of Project Management 22 6 489-497
DOIorg101016jijproman200311004
Wiest J D (1964) Some Properties of Schedules for Large Projects with Limited Resources
Operation Research 12(3) 395-418 DOIorg101287opre123395
98
CONCLUSION
RCS methodologies solve the resource conflicts but create phantom float in the schedules ndash a float
that does not really exist After testing Primavera P6 versions (P6 v832 and P6 v161) the
software still creates phantom float in resource-constrained schedules because it does not apply
any algorithm to remove it The software correctly determines the activitiesrsquo earliest dates that
satisfy the resource limitations but they calculate total float based on a ldquoTime Contextrdquo (LF ndash EF
andor LS ndash ES) ignoring the presence of resource constraints Hence the floats calculated by the
software cannot be trusted or used as traditional definitions suggest ie the amount of time an
activity can be delayed without affecting the project completion time
Professionals should recognize the presence of phantom float in resource-constrained schedules
because it may lead them to make decisions based on unreliable schedules Non-critical activities
may be considered resource critical if they fail to release the resources needed by a critical activity
on time The actual float values may be shorter than calculated during RCS or may be altogether
non-existent This makes impossible the identification of the critical path and thus the anticipation
of the impact of a delaying event in the project completion time
In the last years several algorithms have been developed to identify the critical path in resource-
constrained schedules Most of the algorithms identify resource dependences but some of them
still create phantom float in a schedule because they do not identify all the necessary resource
links Some algorithms also create unnecessary resource relationships andor remove technological
relationships from the schedule Furthermore most of the algorithms do not provide a mechanism
or criterion to select a resource links configuration among multiple alternatives and neither to select
a schedule when having multiple options Finally none of the algorithms consider the dynamic
feature of resource dependences
This study tackled the flaws of the Resource Critical Path Method (RCPM) regarding the removal
of resource links selection of resource-driving activities selection of a default schedule when
having alternative schedules and the lack of a prototype system for Primavera P6
Contributions to the Body of Knowledge
This study has contributed to the body of knowledge by improving an RCS related scheduling
technique so it can be more practical for real construction projects
The Enhanced RCPM (eRCPM) addresses the fact the activity sequence of a resource-constrained
schedule may change after a progress update and the eRCPM system incorporates functionality to
keep and remove specific resource relationships of a progressed schedule This functionally allows
the application of the Time Impact Analysis (TIA) methodology for the evaluation of delays Since
this is a contemporaneous analysis each time a delay is inserted into the schedule specific resource
relationships will be kept removed and identified Additionally the incorporation of three
different heuristics into the eRCPM provides more alternative and flexible schedules that could
meet better project requirements Moreover the system selects as default the schedule with the
shortest duration or with better resource allocation Other major contributions are as follows
99
Objective No 1
Chapter 3
A new tiebreaker (Priority Number) that enhances the performance of the LF heuristic The
results show that the Priority Number as a tiebreaker of the Late Finish leads to obtain
schedules with lower deviations from the CPM duration and a higher number of shortest
schedules than with traditional tiebreakers
A classification system that indicates the two heuristics with the best performance for
specific resource network characteristics This classification will help practitioners to
decide which heuristic applies when mitigating the resource supply-demand problem given
the project characteristics
142 different schedules created in Primavera P6 v161 are available for use to evaluate and
classify the performance of Resource-Constrained Scheduling (RCS) heuristics
Objective No 2
Chapter 2
Recommendations on the RCS-related methods that can be used by industry professionals
A system to guide practitioners in the selection process of an RCS-related algorithm based
on their common features (heuristic) constraints (removal of logic links) and project
characteristics (resources and calendars)
Chapter 4
An Enhanced RCPM (eRCPM) that can be applied for delay analysis
Objective No 3
Chapter 4
An eRCPM computerized system that removes phantom float and identifies a continuous
critical path in P6 resource-constrained schedules The prototype system handles smart
relationships multiple calendars holidays ad exceptions multiple types of resources and
progressed schedules
100
Future Research
Objective No 1 (Chapter 3)
RCS Heuristics
The eight existing heuristics tested in this study were selected based on the opportunity to
apply them using scheduling software However other heuristics such as the Resource
Scheduling Method (RSM) the Greatest Rank Positional Weight (GRPW) and the
Weighted Resource Utilization and Precedence (WRUP) should be tested under the same
scenarios since they have been reported in previous studies as priority rules with good
performance
All heuristics were evaluated under a serial approach Given the differences between the
serial and parallel methods the heuristics should be tested under a parallel approach as
well This classification will provide practitioners the option of splittinginterrupting the
work which may be beneficial for some activities and may also reduce the project
completion time
The matrix developed in this study to classify heuristicsrsquo performance is a point of
departure for the development of a more complete classification system for the industry
The results of this study are limited to networks with I2= 065 RS = 025 NC = 150 and
RF = 025 and 075 Therefore the classification system should be extended so other
common values of RF RS and NC can be included
Objective No 2 (Chapter 4)
Enhanced RCPM (eRCPM)
The eRCPM performs three different heuristics under a serial approach - activities are
sorted as a single group and then scheduled one at a time The incorporation of another
well-known RCS method such as the parallel method in the algorithm will provide
schedulers more flexibility selecting the schedule that better meets the project requirements
and conditions
A dynamic scenario must be further explored when determining if the total float values of
noncritical activities can be used during the whole period (identification of additional
resource links) This scenario occurs when two or more activities are analyzed at once
instead of just one When using the available float of only one activity an overallocation
problem may not exist However if two or more activities with float are delayed at the
same time an overallocation may exist and resource links must be added to the schedule
101
Objective No 3 (Chapter 4)
Enhanced RCPM System
The three parameters defined in the eRCPM to identify resource-driving activities when
having several concurrent activities with several predecessor activities were not
incorporated in the eRCPM system Additional work should be carried out to add these
criteria to the system
102
REFERENCES
Abeyasinghe M C L Greenwood D J amp Johansen D E (2001) An efficient method for
scheduling construction projects with resource constraints International Journal of Project
Management 19(1) 29-45 DOIorg101016S0263-7863(00)00024-7
Baki M A (1998) CPM scheduling and its use in todays construction industry Project Management
Journal 29(1) 7ndash9 Retrieved from httpswwwpmiorglearninglibrarycritical-path-method-
scheduling-construction-industry-2069 (Accessed December 6 2018)
Bowers J A (1995) Criticality in Resource-Constrained Networks Journal of the Operational
Research Soc 46 80-91 DOIorg101057jors19959
Braimah N (2013) Construction Delay Analysis TechniquesmdashA Review of Application Issues
and Improvement Needs Buildings 3 506-531 DOI103390buildings3030506
Davis E W amp Patterson J H (April 01 1975) A Comparison of Heuristic and Optimum Solutions in
Resource-Constrained Project Scheduling Management Science 21 8 944-955
de la Garza J M and Franco-Duran D M (2017 December 20) CPM Benefits in Estimating Bidding
Reported in Survey (B Buckley Ed) Retrieved from Engineering News-Record
httpswwwenrcomarticles43666-cpm-benefits-in-estimating-bidding-reported-in-survey (Accessed December 6 2018)
Fondahl J W (1991) The Development of the Construction Engineer Past Progress and Future
Problems Journal of Construction Engineering and Management 117(3) 380-392
DOIorg101061(ASCE)0733-9364(1991)1173(380)
Franco-Duran D M amp de la Garza J M (July 01 2019) Phantom float in commercial
scheduling software Automation in Construction 103 291-299
DOIorg101016jautcon201903014
Franco-Duran D Primavera P6 Schedules University Libraries Virginia
Tech DOIorg107294W4-5R6Z-D346
Franco-Duran D M amp de la Garza J M (November 01 2019) Review of Resource-Constrained
Scheduling Algorithms Journal of Construction Engineering and Management 145 11)
DOIorg101061(ASCE)CO1943-78620001698
Franco-Duran D M amp de la Garza J M (February 12 2020) Performance of Resource-
Constrained Scheduling Heuristics Journal of Construction Engineering and Management 146
(4) pp 1-12 DOIorg101061(ASCE)CO1943-78620001804
Ibbs W amp Nguyen L D (2007) Schedule Analysis under the Effect of Resource
Allocation Journal of Construction Engineering and Management 133 2 131-138
DOIorg101061(ASCE)0733-9364(2007)1332(131)
103
Kastor A amp Sirakoulis K (2009) The effectiveness of resource leveling tools for Resource
Constraint Project Scheduling Problem International Journal of Project Management 27(5)
493-500 DOIorg101016jijproman200808006
Kim K amp de la Garza J M (2003) Phantom Float Journal of Construction Engineering and
Management 129 (5) 507-517 DOIorg101061(ASCE)0733-9364(2003)1295(507)
Lu M amp Li H (2003) Resource-Activity Critical-Path Method for Construction Planning
Journal of Construction Engineering and Management 129(4) 412-420
DOIorg101061(ASCE)0733-9364(2003)1294(412)
Nisar S A Yamamoto Koshi amp Suzuki K (2013) Resource-Dependent Critical Path Method
for Identifying the Critical Path and the ldquoReal Floatsrdquo in Resource-Constrained Project
Scheduling Journal of Japan Society of Civil Engineers 69(4) 97-107
DOIorg102208jscejcm69I_97
Pantouvakis JP amp Manoliadis OG (2006) A practical approach to resource-constrained project
scheduling Operational Research An International Journal 6(3) 299-309
DOIorg101007BF02941258
Raz T amp Marshall B (1996) Effect of resource constraints on float calculations in project
networks International Journal of Project Management 14(4) 241-248 DOIorg1010160263-
7863(95)00090-9
Rivera F A amp Duran A (2004) Critical clouds and critical sets in resource-constrained
projects International Journal of Project Management 22(6) 489-497
DOIorg101016jijproman200311004
Ulusoy G and Ozdamar L (1989) Heuristic performance and networkresource characteristics
in resource-constrained project scheduling Journal of the Operational Research Society 40
1145-1152 DOIorg101057jors1989196
Wiest J D (1964) Some Properties of Schedules for Large Projects with Limited Resources
Operation Research 12(3) 395-418 DOIorg101287opre123395
Woodworth B M and Shanahan S (1988) Identifying the critical sequence in a resource-
constrained project International Journal of Project Management 6(2) 89-96
DOIorg1010160263-7863(88)90030-0
2
CHAPTER 1
Phantom Float in Commercial Scheduling Software1
Abstract
On a regular basis construction professionals use scheduling software to resource load the
schedules without paying attention to the resulting critical path Current scheduling
software fix the resource supply-demand problem by performing a Resource-Constrained
Scheduling (RCS) technique but they report incorrect total float values and a broken
critical path
RCS calculations suggest that activities have float but much of this float does not exist
(phantom float) Phantom float is created in resource-constrained schedules because the
existing RCS methodologies neglect the resource relationships that arise between activities
when competing for the same but unavailable resources This paper illustrates the presence
of phantom float in Primaverarsquos P6 and Microsoftrsquos Project schedules After removing
phantom float from the schedule non-critical activities may become resource critical and
the actual float may be shorter than calculated or may be altogether non-existent
Users of P6 and MS Project should recognize that the calculation of total float by the
software relies on a time-based context (LF ndash EF andor LS ndash ES) ignoring the presence
of resource constraints Therefore the float reported cannot be trusted or used to mitigate
delaying events like the traditional time-based context definition of total float suggests
Currently research is being carried out in order to remove phantom float from P6 and
Microsoft Project schedules
Keywords Phantom Float Resource-Constrained Schedules Scheduling Software
Introduction
Since its emergence in the late 1950s the Critical Path Method (CPM) has been widely
applied in the construction industry The results of the four surveys taken by the
Engineering New-Recordrsquos (ENR) Top 400 contractors in 1970 1987 2003 and 2017
show that on average 93 of the contractors responding apply CPM on their projects
(Davis 1974 Tavakoli and Riachi 1990 Kelleher 2004 de la Garza and Franco-Duran
2017) CPM is considered a useful tool to plan and to coordinate project work (Baki 1998
Liberatore Pollack-Johnson Smith 2001) The results of a survey taken by 240 project
management professionals of the Project Management Institute (PMI) in 2001 show that
89 of the construction responders use CPM for project planning and 72 for project
control (Liberatore Pollack-Johnson and Smith 2001)
1 Franco-Duran D M amp de la Garza J M (July 01 2019) Phantom float in commercial scheduling
software Automation in Construction 103 291-299 DOIorg101016jautcon201903014
3
Professionals are heavy users of the Critical Path Method to schedule and control projects
Nevertheless CPM neglects the resource project allocations and constraints which is a
common feature among most of construction and engineering projects (Wiest 1964
Woodworth and Shanahan 1988 Lu and Li 2003 Pantouvakis and Manoliadis 2006
Kastor and Sirakoulis 2009) Most projects have a limited amount of resources available
that usually are shared by several activities Because oftentimes resource demands exceed
the maximum number of resources available several Resource-Constrained Scheduling
(RCS) techniques have been introduced to mitigate the resource supply-demand problem
(Woodworth and Shanahan 1988 Lu and Li 2003 Pantouvakis and Manoliadis 2006)
Despite RCS techniques do help project managers to solve the resource conflicts in project
schedules RCS usage in the industry has been quite moderate The two surveys taken by
the ENRrsquos Top 400 Contractors in 1987 and 2003 show that only 16 and 35
respectively of the responders use RCS techniques as advanced methodologies in their
projects (Tavakoli and Riachi 1990 Kelleher 2004) In 2001 Liberatore Pollack-
Johnson and Smith (2001) reported that over 50 of construction professionals use RCS
techniques for project planning and about 44 of the responders use RCS techniques for
project control
Project Management Software (PMS) which incorporate CPM and RCS methods has
become an essential tool for planning and control projects However at present the use of
scheduling software in the construction industry has not been systematically reported The
few studies found in the literature agree that Primaveratrade is the most frequently used
software for construction professionals followed by Microsoft (MS) Projecttrade (Liberatore
Pollack-Johnson and Smith 2001 Galloway 2006) The Liberatore surveyrsquos results show
that 51 of the construction responders use Primavera and 24 of them use Microsoft
Project (Liberatore Pollack-Johnson and Smith 2001) Additionally the results of the
ENRrsquos Top 400 Contractors survey in 2003 show that 78 of the responders use Primavera
and 35 use Microsoft Project (Kelleher 2004) In 2005 an online survey sent to 430
stakeholders involved in construction indicates that Primavera was the specified software
for their projects From an owner and contractor perspective on average over 60 used
Primavera and only 20 Microsoft Project (Galloway 2006)
Although Primavera P6 and MS Project fix the resource supply-demand problem by
performing specific RCS methods these techniques create phantom float in each
softwarersquos schedule RCS techniques overlook the resources relationships between
activities that compete for the same but unavailable resources RCS calculations suggest
that activities have float but much of this float does not exist hence the name of phantom
float (Kim and de la Garza 2003) The aim of this paper is to illustrate the presence of
phantom float in Primaverarsquos P6 v161 and Microsoftrsquos Project v2016 schedules
4
Background
Resource-Constrained Scheduling (RCS)
In resource-constrained schedules when resources are not available to complete a specific
task selected activities are delayed until the completion of the more crucial tasks that
employ the same type of resources (Boyle 2016) This process is governed by two steps
The first step is to set activity priorities according to specific rules The second is to
schedule activities in the order determined subject to logic precedence and resource
availability The criterion to assign activity priorities depends on the heuristic chosen to
solve the resource conflicts
Two of the most well-known methods employed in RCS are the serial method and the
parallel method The serial method sorts all activities as a single group and then schedules
one activity at a time If there are insufficient resources to start an activity the activity is
delayed until resources become available (Moder Phillips and Davis 1983) The primary
heuristic or priority rule to schedule activities is the Late Start Time (LS) Activities with
an early LS are scheduled first In cases when there is a tie with respect to the LS the higher
priority is given to the activity with the shorter duration and total float respectively If the
tie persists then the activity with the smaller number ID is selected (Kim and de la Garza
2003)
The parallel method selects a group of activities whose predecessors were already all
scheduled Activities are eligible to be scheduled if the activity Early Start Time (ES) is
less than or equal to the period of analysis Then from this Eligible Activity Set (EAS)
activities are scheduled based on the total float values (Kastor and Sirakoulis 2009)
Higher priority is given to the activity with the shorter total float If there is a tie with
respect to the total float the activity with the shorter duration is selected to be scheduled
If there are not enough resources to start an activity activities with lower priority are then
examined If the ES of an activity is delayed due to resource unavailability the ES must be
increased to the following period and a new rank for the EAS is defined (Moder Phillips
and Davis 1983) This process should be repeated until all activities are scheduled
Each commercial scheduling software uses a specific RCS method For instance Primavera
P6 applies the serial method and MS Project the parallel method Therefore schedulers and
project managers can expect to obtain different resource-constrained schedules with each
software RCS methods provide good but not optimal solutions (Wiest 1964 Lu and Li
2003 Pantouvakis and Manoliadis 2006) As a rule-based some heuristics may perform
better for some project schedules than for others (Moder Phillips and Davis 1983)
Phantom Float
RCS techniques mitigate the resource-supply problem but they fail to identify the correct
project critical path (Woodworth and Shanahan 1988 Bowers 1995) RCS methodologies
do not consider the resource dependencies that arise when activities are delayed due to
resource unavailability (Woodworth and Shanahan 1988 Kim and de la Garza 2005
5
Boyle 2016) The RCS calculations suggest that activities have float but this float might
not exist at all (Fondahl 1991) Kim and de la Garza (2003) labeled this float as phantom
float Hence the critical path is broken and all the activities must be considered critical
(Kim 2003) This weakness was first noticed by Fondahl (1991) In his study Fondahl
(1991) states that in a resource-constrained schedule the concepts of total float and critical
path are no longer satisfied Non-critical activities may be considered resource critical if
they fail to release the resources needed by a critical activity on time (Fondahl 1991 Lu
and Li (2003)
To provide correct float values and a continuous critical path some authors modified
existing RCS methods andor developed new methods These enhanced algorithms
consider not only the technological relationships but also the resource relationships
between activities in the schedule (Kim and de la Garza 2003 Kim and de la Garza 2005)
Once the resource relationships or Resources Links (RLs) are added to the schedule and
the backward pass is performed a continuous critical path can be obtained The priority
rules to schedule activities differ between each method as well as the process of identifying
the RLs Therefore different resource-constrained schedules with no phantom float can be
obtained when applying any of the methodologies described below
The algorithm proposed by Woodworth and Shanahan (1988) which is based on the
parallel method identifies the critical path of a resource-constrained schedule by creating
resource links (RLs) In this method during the forward pass a label is given to each
activity with the purpose of recording the resource being used and the usage order in a
resource pool The activities that have used the resource are also recorded During the
backward pass a search is made in the pool to find the immediate predecessor of the current
activity by considering the logical and resource dependencies If the Early Start (ES) of the
predecessor activity and the Early Finish (EF) of the current activity are equal and
activities are not technologically connected a Resource Link (RL) is created ((Woodworth
and Shanahan 1988 Kim and de la Garza 2005)
Like Woodworth and Shanahan (1988) Bowers (1995) proposed an algorithm based on
the parallel method that identifies the critical path of a resource-constrained schedule In
this case the RLs are identified during the forward pass by considering the resource usage
of each activity Bowers (1995) The RLs are checked and validated by examining the
history of resource availability during the backward pass Nonetheless as mentioned by
Kim and de la Garza (2005) Bowers (1995) did not provide detailed information about
how the RLs should be created
Kim and de la Garza (2003) developed the Resource-Constrained Critical Path (RCPM) to
provide a more realistic resource-constrained schedule by eliminating phantom float The
algorithm which is based on the serial method consists of five steps as shown in Figure 1
The first step is to perform CPM Then while the serial method is performed in the second
step RLs are identified and added to the schedule if an activity is delayed due to a resource
limit In the third step the backward pass is performed considering both the technological
and resource relationships that were identified during the forward pass The next step
determines if the total float of the noncritical activities can be used during the whole period
6
(ie if there is still phantom float) If the float cannot be used the corresponding RLs are
added to the schedule After this procedure the final schedule is obtained As a final step
the algorithm identifies alternative schedules looking for activities that can be scheduled
during another period without breaching all the relationships (Kim and de la Garza 2003
Kim and de la Garza 2005)
Figure 1 RCPM steps
While the RCPM algorithm was introduced by Kim and de la Garza (2005) Lu and Li
(2003) developed the Resource-Activity Critical-Path Method (RACPM) as a serial
heuristic method for resource-constrained scheduling The work content which is the
relative weight of each activity with respect to the time and resource usage is the primary
criterion to select an activity when activities are competing for constrained resources
Limited resources are first assigned to activities with higher work content since these
activities may affect the project completion time
If there is a tie with respect to the work content the activity with a larger number of
resources or longer duration is scheduled first (Lu and Li 2003) If an activity needs
various quantities of the same type of resource the priority is given to the resource that is
available to perform the activity at that time (Ready-to-Serve Time ndashRST) The RST is the
time when resources are ready to work If there is a tie with respect to RST resources are
randomly chosen The activity that first uses the same resource unit of the current or
predecessor activity is considered as a resource-constrained successor activity (Kim and de
la Garza 2003) Lu and Lirsquos method creates redundant RLs because the links are identified
based on the resource requirements and work content neglecting the technological
relationships of the original CPM (Lu and Li 2003 Kim and de la Garza 2005)
Scheduling Software
In 2003 Kim and de la Garza reported that when resource demands exceed the supply and
users of Primavera Project Plannertrade (known as P3) performed RCS three things
happened 1) P3 fixed the resource supply-demand problem 2) P3 broke the Critical Path
and 3) P3 reported incorrect total float values because phantom float was created when
RCS was performed In order to fix these issues Kim and de la Garza [15] developed an
application that incorporates the RCPM The system reads project information directly
from a P3 project performs RCPM and then updates the P3 schedule The RCPM
application removes phantom float from P3 schedules but it does not remove phantom
float from P6 schedules because P6 is built on a different platform than P3
Over the last few years Boyle Project Consulting (BPC) and Ron Winter Consulting LLC
have developed their own software to overcome the weakness of current software when
7
dealing with resource-constrained schedules These two developments fix the RCS
techniquesrsquo shortcomings by identifying resource relationships of P6 and MS Project
schedules respectively However the programs do not apply an algorithm to systematically
identify and to add the RLs in the schedule They search the activities that were postponed
by the RCS method and create a relationship between the delayed task and the activities
that caused the delay This process does not identify all the RLs of the schedule
After testing Primavera P6 versions (P6 v832 and P6 v161) and MS Project v2016 both
software still creates phantom float in a resource-constrained schedule because they do not
apply any algorithm to remove phantom float This paper illustrates the presence of
phantom float in Primaverarsquos P6 v161 and MS Projectrsquos v2016 schedules
Methodology
Case of Study
To illustrate the presence of phantom float in Primaverarsquos P6 and MS Projectrsquos schedules
a warehouse project was used as a case of study (Fondahl 1991) The project consists of
31 activities with finish-to-start relationships and three types of resources carpenters (R1)
ironworkers (R2) and unskilled labor (R3) The maximum number of resources available
for each type of resource is four The activity calendar reflects a seven-day workweek The
project schedule was built on Primavera P6 v161 and MS Project v2016
Research Approach
The RCPM system developed by Kim and de la Garza (2005) was used to remove phantom
float from the P6 v161 schedule Since this RCPM application only reads and updates data
from a P3 file several steps were carried out to convert the P6 v161 file to a P3 format
(see Figure 2) Because a P6 v161 file cannot be directly exported to P3 this study also
used P6 v832 as an intermediary This process is very impractical since the user should
have installed P3 v31 and P6 v832 on a computer with an XP operating system (which is
no longer supported by Microsoft) However this approach was followed because the
RCPM system to remove phantom float from P6 andor MS Project schedules is still under
development
The warehouse project schedule was first created in P6 v161 and CPM and RCS were
performed This file was exported to P6 v832 and thereafter exported to P3 v31 With the
schedule in P3 the RCPM system identified the RLs removed phantom float and updated
the P3 schedule This schedule without phantom float was uploaded into P6 v161 by
performing the same process but in reverse (see Figure 2)
8
Figure 2 Process to remove phantom float on P6 v161 schedule
The RCPM system developed by Kim and de la Garza does not work for MS Project
Therefore phantom float was removed from this software schedule performing RCPM by
hand The RLs were identified while the forward pass of the parallel method was performed
and each of the non-critical activities was checked afterward to identify additional RLs
The resource relationships were added to the MS Project schedule manually to obtain the
real total float values and the correct critical path
Results
CPM and RCS in P6 v161
Once CPM was performed in P6 the project duration was 27 days An over-allocation
problem was identified for R1 during days 5 ndash 8 and 22 Since R1 exceeds the maximum
number of resources available (4) the serial method was performed in P6 to overcome this
supply-demand problem P6 allows the user to select several and different priority rules to
perform the serial method For this case of study the Late Start heuristic was selected
Figure 3 shows the project CPM schedule in P6 v161
Figure 3 CPM schedule in P6 v161
Figure 4 shows the schedule after the serial method was performed in P6 The project
duration was increased by three days from 27 days to 30 days Although the
supplydemand problem was fixed the critical path reported in Figure 4 as well as the total
float values are incorrect The critical path is broken because RCS techniques do not track
the activities that were shifted due to a resource limitation It can be seen in Figure 4 that
9
only the last two activities are critical according to P6 v161 The remaining activities are
labeled as non-critical with phantom float
Figure 4 RCS schedule in P6 v161
CPM and RCS in MS Project v2016
Once CPM was performed in MS Project v2016 the project duration was 27 days There
is also an over-allocation problem for R1 during days 5 ndash 8 and 22 Figure 5 shows the
project CPM schedule in MS Project Figure 6 shows the schedule after the parallel method
was performed in MS Project The project duration was also increased by three days from
27 to 30 days Like P6 the supplydemand problem was fixed but the critical path reported
in Figure 6 as well as the total float values are incorrect It can be seen in Figure 6 that
only five activities are critical and the remaining activities are labeled as non-critical with
phantom float
Figure 5 CPM schedule in MS Project v2016
Several activities in MS Project start later than those in P6 because the priority rules to
schedule activities applied by the serial and parallel methods differ (Table 1) MS Project
delayed activities with a greater total float As a result some activities are critical in MS
Project and not in P6
10
Figure 6 RCS schedule in MS Project v2016
Table 1 Activities start time in MS Project and P6 v161 after RCS was performed
Activities
Start Time
MS Project
Parallel
Method
P6 v161
Serial
Method
A4 Day 15 Day 9
A7 Day 20 Day 19
A8 Day 17 Day 16
A20 Day 16 Day 15
A22 Day 18 Day 16
A24 Day 22 Day 19
A27 Day 24 Day 21
Phantom Float
The following example gives an idea of what phantom float means Assume that Activity
A4 requires two carpenters to be executed and Activity A5 four carpenters (max = 4)
According to RCS results in P6 A4 has 14 days of float which means that A4 can be
delayed 14 days without affecting the project completion time (Figure 7a) However each
time that the ldquoapparently available floatrdquo of the A4 is used (activity was delayed by one
day) there is an over-allocation problem because this is not the real float of A4 (Figure
7b) In this case a link should be created between A4 and A5 (Figure 7c) The carpenters
will only be available to perform A5 once A4 is completed Otherwise six carpenters
would be needed to perform A4 and A5 in parallel and only four of them are available for
this project After performing the backward pass with the RLs added to the schedule it
turns out that instead of having 14 days of float the total float of A4 is zero
11
Figure 7 Example of phantom float and identification of resource links
Phantom Float in P6 v161
Fig 8 shows the presence of phantom float in P6 v161 According to the RCS output
Activity A4 has 13 days of float In theory project managers should be able to use this
float whenever they need it Nevertheless once the float of this activity is used (A4 was
delayed one day) there is an over-allocation problem again If the whole float of Activity
A4 is used in P6 each time the resource demands exceed the maximum number of
resources available This over-allocation arises because there is phantom float in the P6
schedule
Figure 8 Presence of phantom float in P6 v161
Phantom Float in MS Project v2016
Fig9 shows the presence of phantom float in MS Project v2016 According to the RCS
output Activity A4 has one day of float Like P6 once the float of Activity A4 is used in
MS Project there is a demand-supply problem This over-allocation arises because there is
phantom float in the MS Project schedule
12
Figure 9 Presence of phantom float in MS Project v2016
The schedule with no phantom float for each software is shown in Figure10 (P6 v161) and
Figure11 (MS Project v2016) After removing phantom float the resources are still
consistent with availability the float values are correct as well as the critical path
Figure 10 P6 v161 schedule with phantom float removed
Figure 11 MS Project schedule with phantom float removed
13
Table 2 shows a comparison of the P6 v161 and MS Project v2016 schedules after RCPM
was performed About 87 and 84 of the activities in the P6 v161 and MS Project v2016
schedules had phantom float after RCS Most of the non-critical activities became resource
critical in both schedules
The presence of phantom float in resource-constrained schedules makes impossible the
identification of a continuous critical path The critical path is lost when activities are
delayed due to resource unavailability (Wiest 1964) As a result all activities should be
assumed as critical and as influential of the project completion time (Lu and Li 2003)
Additionally the impact of a delaying event in the project duration cannot be anticipated
in schedules with phantom float Any reduction or increase in an activity duration cannot
be noticed since the critical path is broken Hence phantom float may lead to untrustworthy
results when performing delay analysis The parties involved may not be totally responsible
for the apportioned delays (Ibbs and Nguyen 2007)
Table 2 Comparison of P6 v161 and MS Project v2016 schedules after removing
phantom float
Software RCS
Method
Duration
(Days)
No Critical
Activities
before
removing PF
No
Activities
with PF
No RL
Created
No Critical
Activities
after
removing
PF
P6 v161 Serial 30 2 27 13 21
MS
Project
v2016
Parallel 30 5 26 11 25
Table 3 shows the float values obtained after removing phantom float from the P6 v161
and MS Project v2016 schedules Depending on the RCS method used to mitigate the
resource supply-problem when performing the RCPM different outcomes can be obtained
for the same project The activities sequence differs in both schedules and so the RLs and
the phantom float values
Table 3 RCPM output for the P6 v2016 and MS v2016 project schedules
Primavera P6 v161 Microsoft Project v2016
After
RCS
After
RCPM
Phantom
Float
Resource
Links
After
RCS
After
RCPM
Phantom
Float
Resource
Links
01 3 0 3 - 0 0 0 -
02 3 0 3 - 0 0 0 -
03 2 0 2 29 2 0 2 29
04 14 0 14 05 6 0 6 08
05 8 0 8 - 3 0 3 -
06 3 0 3 - 3 0 3 -
07 6 1 5 23 5 0 5 23
14
08 6 1 5 0724 5 0 5 07 24
09 3 0 3 04 3 0 3 -
10 8 5 3 - 8 5 3 -
11 3 0 3 - 3 0 3 -
12 3 0 3 05 3 0 3 05
13 3 0 3 - 3 0 3 -
14 5 0 5 - 3 0 3 -
15 3 0 3 - 3 0 3 -
16 8 0 8 17 8 0 8 -
17 3 0 3 - 3 0 3 -
18 8 2 6 08 8 0 8 04 19
19 3 0 3 08 3 0 3 -
20 8 3 5 - 6 1 5 -
21 3 0 3 - 3 0 3 -
22 8 3 5 - 6 1 5 -
23 3 0 3 - 3 0 3 -
24 6 1 5 23 5 0 5 23
25 3 0 3 03 3 0 3 03
26 3 3 0 - 3 3 3 -
27 6 5 1 - 5 4 1 -
28 3 3 0 - 3 3 0 -
29 1 0 1 30 1 0 1 30
30 0 0 0 - 0 0 0 -
31 0 0 0 - 0 0 0 - Successor Activities
Discussion
In time-constrained scheduling unlimited resources are assumed Under this scenario the
traditional definition of total float is valid ie the amount of time an activity can be
delayed without affecting the project completion time The resulting critical path allows 1)
to identify critical and near-critical activities and 2) to anticipate the effect of a delay or
change in a project schedule
Conversely in resource-constrained scheduling (RCS) there is limited resource
availability in a project The resource supply-demand problem is addressed by considering
both the logical relationships among the activities and the availability of resources at any
given point in time RCS algorithms first prioritize the order of activities then schedule
them as early as possible subject to existing logical relationships and resource availability
When resources are not available RCS algorithms postpone the start time of the activities
until the resources required become available In consequence the intended project
completion date may be extended Indeed it is well documented in the literature that RCS
algorithms do not guarantee that the original project completion date will be met
Unlike time-constrained schedules in resource-constrained schedules the concepts of total
float and critical path lose their significance (Wiest 1964 Fondahl 1991 Bowers 1995
15
Raz and Marshall 1996 Rivera and Duran 2004) That is the total float is now constrained
by both forward and backward CPM calculations as well as resource availability which is
not the case in time-constrained schedules where the total float is only constrained by
forward and backward CPM calculations
To date Primavera P6 continues to be plagued by the same issues pointed out by Kim and
de la Garza in 2003 when P3 was available (Kim and de la Garza 2003) That is in
resource-constrained schedules Primavera P6 calculates the total float assuming a time-
constrained schedule as opposed to a resource-constrained schedule Primavera P6
correctly determines the activitiesrsquo earliest dates that satisfy the resource limitations but it
calculates total float based on a ldquoTime Contextrdquo (LF ndash EF andor LS ndash ES) ignoring the
presence of resource constraints As illustrated in this paper and in these circumstances
the total float is no longer the amount of time an activity can be delayed without affecting
the project completion time The combination of resource-constrained schedules with total
float calculated on a time-context basis makes impossible the anticipation of the impact of
a delaying event in the project completion time
Scheduling software developers such as Oracle and Microsoft have not progressed in
removing phantom float from resource-constrained schedules Therefore it is the userrsquos
responsibility to recognize that the calculation of total float by the software relies on a time-
based context and hence the total float reported cannot be trusted andor used to mitigate
delaying events like the traditional time-based context definition of total float suggests
Conclusion
Project management software has become an essential tool for planning and control
projects Primavera P6 and Microsoft (MS) Project are two of the most frequently used
scheduling software in the construction industry Although these programs help users to
develop the project plan and to report the project status they do not appropriately support
the decision process when dealing with resource project allocations and constraints In
order to mitigate the resource supply-demand problem Resource-Constrained Scheduling
(RCS) techniques have been incorporated in Primavera P6 and MS Project
RCS methodologies solve the resource conflicts but create phantom float in the schedules
ndasha float that does not really exist RCS methods overlook the resourcesrsquo relationships
between activities that compete for the same but unavailable resources As a result the
critical path is broken In the last years several algorithms have been developed to identify
the critical path in a resource-constrained schedule However some of them identify
unnecessary resource links andor remove some technological relationships from the
schedule The redundant resource links increase the network complexity and the removal
of technological relationships jeopardizes the updating process of the schedule since the
logical sequence of the project may be lost
After testing Primavera P6 versions (P6 v832 and P6 v161) and MS Project v2016 both
software packages still create phantom float in resource-constrained schedules because
16
they do not apply any algorithm to remove phantom float The software correctly
determines the activitiesrsquo earliest dates that satisfy the resource limitations but they
calculate total float based on a ldquoTime Contextrdquo (LF ndash EF andor LS ndash ES) ignoring the
presence of resource constraints Hence the floats calculated by the software cannot be
trusted or used as traditional definitions suggest ie the amount of time an activity can be
delayed without affecting the project completion time
On a regular basis professionals use commercial available software to resource load the
schedules without paying attention to the resulting critical path and float values However
they should recognize the presence of phantom float in resource-constrained schedules
because it may lead them to make decisions based on unreliable schedules Non-critical
activities may be considered resource critical if they fail to release the resources needed by
a critical activity on time The actual float values may be shorter than calculated during
RCS or may be altogether non-existent (Fondahl 1991) This makes impossible the
identification of the critical path and thus the anticipation of the impact of a delaying event
in the project completion time The incorporation of an enhanced Resource Constraint
Critical Path (RCPM) in a system to solve the RCSrsquo drawbacks in Primavera P6 and MS
Project is being explored at Virginia Tech
References
Baki M A (1998) CPM scheduling and its use in todays construction industry Project
Management Journal 29(1) 7ndash9 Retrieved from
httpswwwpmiorglearninglibrarycritical-path-method-scheduling-construction-
industry-2069 (Accessed December 6 2018)
Bowers J A (1995) Criticality in Resource-Constrained Networks Journal of the
Operational Research Society 46 80-91 DOIorg101057jors19959
Boyle T M (2016) BCP Logic Filter for Microsoft Project Retrieved from Charlotte
NC httpwwwboyleprojectconsultingcomWeb20FilesBPCLogicFilter-
Intro20R2pdf (Accessed December 6 2018)
Davis E W (1974) CPM Use in Top 400 Construction Firms Journal of the Construction
Division 100 (1) 39-49 Retrieved from
httpscedbasceorgCEDBsearchrecordjspdockey=0021563 (Accessed December 6
2018)
de la Garza J M and Franco-Duran D M (2017 December 20) CPM Benefits in
Estimating Bidding Reported in Survey (B Buckley Ed) Retrieved from Engineering
News-Record httpswwwenrcomarticles43666-cpm-benefits-in-estimating-bidding-
reported-in-survey (Accessed December 6 2018)
17
Fondahl J W (1991) The Development of the Construction Engineer Past Progress and
Future Problems Journal of Construction Engineering and Management 117(3) 380-392
DOIorg101061(ASCE)0733-9364(1991)1173(380)
Galloway P D (2006) Survey of the Construction Industry Relative to the Use of CPM
Scheduling for Construction Projects Journal of Construction Engineering and
Management 132(7) 697 - 711 DOIorg101061(ASCE)0733-9364(2006)1327(697)
Ibbs W and Nguyen L D (2007) Schedule Analysis under the Effect of Resource
Allocation Journal of Construction Engineering and Management 133 2 131-138
DOIorg101061(ASCE)0733-9364(2007)1332(131)
Kastor A and Sirakoulis K (2009) The effectiveness of resource leveling tools for
Resource Constraint Project Scheduling Problem International Journal of Project
Management 27 493ndash500 DOIorg101016jijproman200808006
Kelleher A H (2004) An Investigation of the Expanding Role of the Critical Path Method
by ENRs Top 400 Contractors Virginia Tech Blacksburg VA Retrieved from
httpsvtechworkslibvteduhandle109199889 (Accessed December 6 2018)
Kim K (2003) A Resource-constrained CPM (RCPM) Scheduling and Control Technique
with Multiple Calendars Virginia Tech Blacksburg Virginia Retrieved from
httpsvtechworkslibvteduhandle1091928139 (Accessed December 6 2018)
Kim K and de la Garza J M (2003) Phantom Float Journal of Construction
Engineering and Management 129(5) 507-517 DOIorg101061(ASCE)0733-
9364(2003)1295(507)
Kim K and de la Garza J M (2005) Evaluation of the Resource-Constrained Critical
Path Method Algorithms Journal of Construction Engineering and Management 131(5)
522-532 DOIorg101061(ASCE)0733-9364(2005)1315(522)
Kim K and de la Garza J M (2005) A New Approach to Resource-Constrained
Scheduling Towards a Vision for Information Technology in Civil Engineering 1-6
Reston VA American Society of Civil Engineers DOIorg10106140704(2003)48
Liberatore M J Pollack-Johnson B and Smith C A (2001) Project Management in
Construction Software use and Research Directions Journal of Construction Engineering
and Management 127(2) 101-107 DOIorg101061(ASCE)0733-9364(2001)1272(101)
Lu M and Li H (2003) Resource-Activity Critical-Path Method for Construction
Planning Journal of Construction Engineering and Management 129(4) 412-420
DOIorg101061(ASCE)0733-9364(2003)1294(412)
18
Moder J J Phillips C R and Davis E W (1983) Project Management with CPM
PERT and precedence diagramming (3rd ed ed) New York Van Nostrand Reinhold
ISBN 780442254155
Pantouvakis J-P and Manoliadis O G (2006) A Practical Approach to Resource-
Constrained Project Scheduling Operational Research An International Journal 6(3)
299-309 DOIorg101007BF02941258
Raz T and Marshall B (1996) Effect of resource constraints on float calculations in
project networks International Journal of Project Management 14(4) 241-248
DOIorg1010160263-7863(95)00090-9
Rivera F A and Duran A (2004) Critical clouds and critical sets in resource-constrained
projects International Journal of Project Management 22(6) 489-497
DOIorg101016jijproman200311004
Tavakoli A and Riachi R (1990) CPM Use in ENR Top 400 Contractors Journal of
Management in Engineering 6(3) 282-295 DOIorg101061(ASCE)9742-
597X(1990)63(282)
Wiest J D (1964) Some Properties of Schedules for Large Projects with Limited
Resources Operation Research 12(3) 395-418 DOIorg101287opre123395
Woodworth B M and Shanahan S (1988) Identifying the critical sequence in a
resource-constrained project International Journal of Project Management 6(2) 89-96
DOIorg1010160263-7863(88)90030-0
19
CHAPTER 2
Review of Resource-Constrained Scheduling Algorithms2
Abstract
On a regular basis project managers concentrate their efforts on critical and near-critical
activities However the concepts of total float and critical path lose their significance after
applying resource-constrained scheduling (RCS) techniques RCS techniques mitigate the
resource supply-demand problem but break the critical path As a result several algorithms
have been developed to identify a continuous critical path in resource-constrained
schedules
This study reviews and evaluates the performance of eight RCS related algorithms with the
purpose of identifying the shortcomings that must be addressed so they can be applied for
delay analysis The review shows that a systematic procedure is needed to 1) incorporate
and handle dynamic resource links when the schedule is updated and 2) select a potential
resource link configuration Addressing these limitations will make the algorithms more
practical for real construction and engineering projects and will allow a more realistic delay
analysis since schedules will reflect the real conditions of the project (resource loaded)
This study 1) discusses potential solutions to the shortcomings of the existing algorithms
2) provides recommendations on the methods that can be used by industry professionals
and 3) proposes a system to facilitate the selection of an algorithm based on their common
features (heuristic) constraints (removal of logic links) and project characteristics
(resources and calendars)
Keywords Critical Path Delay Analysis Phantom Float Resource-Constrained
Schedules Resource Relationships
Introduction
The Critical Path Method (CPM) is a useful tool to plan and control the work of a project
(Baki 1998 de la Garza and Franco-Duran 2017) In fact about 97 of the Engineering
News-Recordrsquo (ENR) Top 400 contractors indicated that CPM is a valid management tool
(de la Garza and Franco-Duran 2017) Over half of the contractors also indicated that CPM
does not have major disadvantages (de la Garza and Franco-Duran 2017) However CPM
does not consider resource project allocations and constraints
Instead CPM assumes that unlimited resources will be available at any time when required
to execute project activities (Wiest 1963 Woodworth and Shanahan 1988 Lu and Li
2 Franco-Duran D M amp de la Garza J M (November 01 2019) Review of Resource-Constrained
Scheduling Algorithms Journal of Construction Engineering and Management 145 11)
DOIorg101061(ASCE)CO1943-78620001698
20
2003 Pantouvakis and Manoliadis 2006 Kastor and Sirakoulis 2009 Nisar et al 2013)
This assumption is unrealistic because activities require a specific amount of resources to
be executed and projects have a certain number of resources available to complete
activities which constraints the schedule in terms of resources (Resource-Constrained
Schedules)
Oftentimes the resource demand exceeds the maximum number of resources available for
the project (Woodworth and Shanahan 1988 Lu and Li 2003 Pantouvakis and
Manoliadis 2006) To mitigate this resource-supply demand problem Resource-
Constrained Scheduling (RCS) techniques which are based on priority rules postpone the
start time of some activities when the units of resources required to complete them are not
available (Abeyasinghe et al 2001 Lu and Li 2003)
RCS techniques solve the resource conflicts but they create phantom float in the schedule
(a float that does not exist) ie each time an activity uses this apparent float there is a
resource violation in the schedule (Kim and de la Garza 2003) RCS techniques neglect
the resource relationships between activities that compete for the same but limited
resources (Fondahl 1991) As a result the critical path is broken and all activities must be
considered critical The lack of a continuous critical path makes impossible the anticipation
of the impact of a delaying event in the project completion time (Woodworth amp Shanahan
1988 Bowers 1995 Kim 2009)
Several algorithms have been developed to address the shortcomings of RCS methods
Some of these algorithms provide correct float values and a continuous critical path
because they consider not only the technological relationships but also the resource
relationships between activities In 2005 Kim and de la Garza compared the performance
of the Resource Critical Path Method (RCPM) with four RCS related algorithms
At present CPM is frequently used for delay analysis and courts accept CPM as a reliable
tool to perform this analysis Indeed one of the main reasons noted by 100 out of 133 ENR
Top 400 contractors for using the CPM is to perform schedule impact and claim analysis
(de la Garza and Franco-Duran 2017) Because the existing delay methodologies are based
on CPM schedules the resource load and constraints are relevant aspects often disregarded
during the application of a delay analysis technique (Ibbs and Nguyen 2007 Braimah
2013) These factors may influence the outcome of the analysis since the project
completion time can be affected by resource availability Up to date few studies have been
published about how to perform a delay analysis considering resource-constrained
schedules without phantom float
As an extension of the work published by Kim and de la Garza (2005) the present study
reviews eight RCS related algorithms with the purpose of identifying the shortcomings that
must be addressed so they can be applied for delay analysis (Woodworth and Shanahan
1988 Bowers 1995 Kim and de la Garza 2003 Lu and Li 2003 Abeyasinghe et al
2001 Rivera and Duran 2004 Pantouvakis and Manoliadis 2006 and Nisar et al 2013)
Four out of the eight algorithms were not considered by Kim and de la Garza (2005)
Additionally this paper evaluates the algorithmsrsquo performance to provide some
21
recommendations on the methods that can be used by industry professionals The
performance is measured in terms of four indicators 1) the percentage increase of project
duration above the CPM length the percentage increase of the network complexity 3) the
percentage of activities with free float and 4) the percentage of critical activities
Methodology
The performance of the Resource-Constrained Critical Path Method (RCPM) developed
by Kim and de la Garza in 2003 was compared with that of seven RCS related algorithms
Initially the RCPM was developed under a serial approach This study performed the
RCPM under the serial and parallel methods
In the RCPM serial-based activities are sorted in ascending order according to the Late
Start Time (LS) If there is a tie with respect to the LS the priority is given to the activity
with the least duration (D) If the tie persists the activity with the least Total Float (TF) is
scheduled first If there is still a tie with respect to the TF the tie is broken by the smallest
activity number (ID) In the RCPM parallel-based activities are sorted in ascending order
according to the Early Start Time (ES) If there is a tie with respect to the ES the priority
is given to the activity with the least LS If the tie persists the activity with the least D is
scheduled first If there is still a tie with respect to the D the tie is broken by the smallest
activity ID
The examples provided by Woodworth and Shanahan (1988) Bowers (1995)
Abeyasinghe et al (2001) Lu and Li (2003) Rivera and Duran (2004) Pantouvakis and
Manoliadis (2006) and Nisar et al (2013) were used to generate the RCPM schedules
(serial and parallel-based)
In the serial approach the activitiesrsquo sequence is defined before scheduling the project
(Moder et al 1983 Abeyasinghe et al 2001 Lu and Li 2003) All activities are sorted as
a single group and then scheduled one at a time (Moder et al 1983) In the parallel
approach the activitiesrsquo sequence is defined and updated at the start of each day
(Abeyasinghe et al 2001 Lu and Li 2003) The RCPM is briefly described as follows
(Kim and de la Garza (2003) Kim (2003)
1 Apply the Late Start heuristic under the serial approach If an activity is delayed
create a resource link between the postponed activity and the preceding activity that
shares the same resources
2 Perform the backward pass considering the technological and resource
relationships
3 Determine if the total float values of noncritical activities can be used during the
whole period If not create the corresponding resource link
4 Find alternative schedules by looking for activities that can be scheduled during a
different period without breaching the technological and resource relationships
22
Depending on the heuristicsrsquo priority rules different results can be obtained for the same
project in terms of duration the number of resource links and critical activities These
parameters were considered to measure the algorithmsrsquo performance by calculating the
percentage increase of project duration above the CPM length (Equation 1) the percentage
increase of network complexity (Equation 2) the percentage of activities with free float
(Equation 3) and the percentage of critical activities (Equation 4) These performance
indicators are practical measures that be calculated after the application of any algorithm
119868119899119888119903119890119886119904119890 119863119906119903119886119905119894119900119899 = 119875119903119900119895119890119888119905 119863119906119903119886119905119894119900119899 minus 119862119875119872 119871119890119899119892119905ℎ
119862119875119872 119871119890119899119892119905ℎ 119909 100 (Eq 1)
119868119899119888119903119890119886119904119890 119873119862 =119873119862119877119871 minus 119873119862
119873119862119909 100 119873119862 =
sum 119879119877119894119895119873119894
119873 (Eq 2)
119860119888119905119894119907119894119905119894119890119904 119865119865 =sum 119873119865119865
119873119894
119873119909 100 (Eq 3)
119862119903119894119905119894119888119886119897 119860119888119905119894119907119894119905119894119890119904 = sum 119873119879119865=0
119873119894
119873119909 100 (Eq 4)
Where NC is the network complexity including only the technological relationships from
the CPM schedule TRij are the non-redundant technological relationships NCRL is the
network complexity including technological and resource relationships N is the total
number of activities NFF is the number of activities with Free Float (FF) and NTF=0 is the
number of activities with Total Float (TF) equals zero
The percentage increase of project duration above the critical path length has been used by
several authors to compare the efficacy of RCS heuristics (Patterson 1973 Davis and
Patterson 1976 Patterson 1976 Gordon 1983 Alvarez-Valdez and Tamarit 1989
Ulusoy and Ozdamar 1989) This measure represents the delay generated by the resource
unavailability because of the heuristic employed (Patterson 1973) According to previous
studies the heuristics with a better performance increase the project duration on average
by 37 (Boctor 1996)
Some algorithms identify redundant or unnecessary resource links These additional links
do not affect the float calculations but they increase the computational time and the
complexity of the network The percentage increase of the network complexity is
calculated in terms of the average number of precedence relationships per activity after
adding the resource links to the schedule
The percentage of activities with free float and the percentage of critical activities are
measures of schedule flexibility Project managers may find beneficial to have some float
in the schedule in order to mitigate potential delaying events The greater the percentage
23
of activities with free float the greater the number of activities that can start late without
affecting the start of its successor activities On the other hand the lower the number of
critical activities the lower the probability to cause delays to the project
Algorithms Review
This section describes and compares the algorithms developed by Woodworth and
Shanahan (1988) Bowers (1995) Abeyasinghe et al (2001) Kim and de la Garza (2003)
Lu and Li (2003) Rivera and Duran (2004) Pantouvakis and Manoliadis (2006) and Nisar
et al (2013) Table 1 shows a summary of these eight algorithms
These RCS related algorithms were developed with the aim of providing project managers
a tool to 1) correctly schedule and identify critical activities with respect to time and
resource allocation and 2) correctly calculate the total float of each activity under resource
constraints (Woodworth and Shanahan 1988) In practice the algorithms have been
implemented as mechanisms to 1) prioritize and re-examine critical activities and 2) control
the project (Abeyasinghe et al 2001)
24
Table 1 Characteristics of the algorithms
Algorithm
Features
Woodworth Bowers Abeyasinghe Kim Lu Rivera Pantouvakis Nisar et al
1988 1995 2001 2003 2003 2004 2006 2013
RCS Method Parallel Parallel Serial Serial Serial Any Serial Any
Heuristic Min Slack Min LS Companion
Activities
LS + D +
TF
Work
Content NS LS
Ranked
Positional
Weighted
Identify Critical
Path Yes Yes Yes Yes Yes No Yes Yes
Keep
Technological
Relationships
Yes Yes No Yes No Yes No No
Split Allowed Yes NS No No No NS No No
Multiple
Resources Yes Yes Yes Yes Yes Yes Yes No
Multiple
Calendars NS NS NS Yes No No No NS
Create Phantom
Float No No Yes No No Yes No No
Identify RLs Yes Yes Yes Yes Yes No Yes Yes
Phase where RLs
are created
Backward
Pass
Forward amp
After
Backward
Pass
Forward
Pass
Forward amp
After
Backward
Pass
After
Forward
Pass
NA Forward
Pass
Forward amp
Backward
Pass
Unnecessary
RLs Yes Yes No No Yes NA Yes No
Dynamic RLs No No No No No No No No
NA Not Apply
25
Woodworth and Shanahan (1988)
Woodworth and Shanahanrsquos algorithm identifies critical resources the time of resource critically
and a critical sequence According to Woodworth and Shanahan a critical sequence consists of
activities that share technological and resource relationships and takes the longest time to be
completed The algorithm is briefly described as follows
1 Perform the Minimum Slack heuristic under the parallel method approach
2 Record a label for each activity the resource ID and the order in which each resource is
used during the forward pass In addition record in a resource pool the ID of the activities
that use the resources
3 Search the resource usage history and the activitiesrsquo order to find the immediate
predecessor of the current activity during the backward pass Create a resource link if the
Early-Start Time (ES) of the predecessor activity and the Early-Finish Time (EF) of the
current activity are equal and they are not technologically connected
4 Calculate the technologicalresource slack (Total Float) as the difference between the ES
and EF of each activity once all activities are connected
Comparison
The schedule provided in Woodworth and Shanahanrsquos study has 15 activities (including a start
activity) and 17 logical relationships (NC = 113) The project requires two types of resources (RA
and RB) and the maximum resources available per type is one unit The CPM duration is 31 days
(see Figure 1)
Figure 1 Network Diagram (Kim and de la Garza 2005)
The project duration was increased by 13 days (from 31 to 44 days) after mitigating the resource
supply-demand problem (see Figure 2) Although Woodworth and Shanahanrsquos algorithm creates
resource-induced discontinuities in the schedule (resource links) the authors did not provide
further details on how to create these links when an activity requires multiple types of resources
or on how to handle activities with no resource requirements in the resource pool (Kim and de la
Garza 2005)
26
Figure 2 Woodworth and Shanahanrsquos Schedule (Woodworth and Shanahan 1988)
The RCPM schedules under the serial and parallel approaches are shown in Figure 3 The main
difference between the two schedules is the activitiesrsquo sequence which leads to a different resource
link configuration Specifically the sequence of activities A5-10 A7-9 and A9-10
Figure 3a Serial-Based Schedule
Figure 3b Parallel-Based Schedule
Figure 3 RCPM Results for Woodworth and Shanahanrsquos Example
27
All three schedules have a continuous critical sequence and they do not have phantom float
Although Woodworth and Shanahanrsquos algorithm provides a shorter duration (44 days) and the
schedule has fewer critical activities (53) the algorithm increases the network complexity by
101 (see Table 2) The RCPM serial-based schedule is more flexible than the RCPM parallel-
based schedule in terms of the number of activities with free float but it has more critical activities
and creates more resource links Both algorithms increased the project duration by more than 37
Table 2 Comparison with Woodworth and Shanahanrsquos Result
Authors
RCS
Method Duration
(Days)
Resource
Links
Increase
Duration
Increase
NC
Critical
Activities
Activities
with FF
Woodworth
and
Shanahan
Parallel
(ES +
TF)
44 8 42 101 53 13
Kim and de
la Garza
Serial
(LS) 46 5 48 76 67 20
Parallel
(ES +
LS)
45 4 45 68 60 13
Bowers (1995)
Bowersrsquo algorithm is similar to that proposed by Woodworth and Shanahan (1988) The main
difference between the two algorithms is the phase where resource links are identified and created
in the schedule While in Woodworth and Shanahanrsquos algorithm resource links are created during
the backward pass in Bowersrsquo algorithm resource links are created during the forward pass
Bowersrsquo algorithm is briefly described as follows
1 Apply the Minimum Latest Start heuristic under the parallel approach (This rule is
equivalent to the Minimum Slack heuristic)
2 Identify and create resource links during the forward pass considering the resource usage
of each activity
3 Perform the backward pass considering the technological and resource links
Comparison
Bowersrsquo schedule has 11 activities and 12 logical relationships (NC = 109) The project requires
two types of resources (RA and RB) and the maximum resources available per type is one unit for
RA and two units for RB (see Figure 4) The CPM duration is 86 days
28
Figure 4 Bowersrsquo Network Diagram Modified from (Bowers 2005)
According to Bowersrsquo result the project duration was increased by 15 days (from 86 to 101 days)
after solving the resource conflicts (see Figure 5) Bowersrsquo algorithm assumes that resource
allocation does not change over time (Kim and de la Garza 2005) This assumption which is
unrealistic in todayrsquos projects neglects the possibility of schedule changes in terms of resource
availability Besides Bowers did not explain whether unidentified or additional resource links are
added to the schedule during or after the backward pass For instance the resource link between
Activities A6 and Activity A5 cannot be identified during the forward pass (see Figure 5)
Figure 5 Bowersrsquo Result (Bowers 2005)
Otherwise both RCPM schedules are equal The serial method generated the same sequence of
activities as that when the parallel method was applied (see Figure 6) These two RCPM schedules
match with the schedule obtained by Bowers (see Table 3)
Figure 6 RCPM Serial and Parallel-Based Schedule
29
Table 3 Comparison with Bowersrsquo Result
Authors
RCS
Method Duration
(Days)
Resource
Links
Increase
Duration
Increase
NC
Critical
Activities
Activities
with FF
Bowers Parallel 101 4 17 33 64 18
Kim and
de la
Garza
Serial amp
Parallel 101 4 17 33 64 18
Abeyasinghe Greenwood and Johansen (2001)
The algorithm proposed by Abeyasinghe et al is briefly described as follows
1 Perform CPM and create the Gantt chart of the project based on early dates
2 Draw the link-structure of the project This structure is a combination of the various logic
paths of the project network Vertical lines and right-handed arrows represent activity
relationships
3 Manipulate the link-structure to eliminate the resource conflicts while ensuring a minimum
project duration The structure is compressed according to some rules defined by the
authors
4 Identify possible critical paths The longest path becomes the only critical path
Comparison
Abeyasinghe et al network has 11 activities and 10 logical relationships (NC =111) The project
requires one type of resource (R) with maximum availability of five units The CPM duration is
19 days (see Figure 7) The project duration was increased by nine days (from 19 to 28 days) after
mitigating the over-allocation problem (see Figure 8)
Figure 7 Network of Abeyasinghe et al Study (Abeyasinghe et al 2001)
30
Although Abeyasinghe et al schedule has a shorter duration than the RCPM schedule there is a
resource availability violation for the total float periods of Activity B As reported by Figure 8b
Activity B has 25 days of float Nonetheless if this float is used during days 11 to 20 or during
days 27 to 28 (ie Activity B is delayed) there is an over-allocation problem In both instances
six resources would be required and there are only five resources available for this project
Therefore this schedule has phantom float This resource violation occurs because the algorithm
removed the technological relationship between Activity B and Activity G (see Figure 8a)
Figure 8a Network Diagram
Figure 8b Gantt Chart
Figure 8 Abeyasinghe et al Result (Abeyasinghe et al 2001)
As presented in Table 4 the complexity of Abeyasinghe et al schedule did not increase after
adding the resource links in the network Instead the network complexity decreased because the
algorithm removed some technological relationships (NC is negative) Although the removal of
these technological relationships does not affect the float calculations it jeopardizes the updating
process of the schedule because the logic sequence of the project is lost
For this example both RCPM schedules are equal (see Figure 9) Even though the RCPM duration
is 32 higher than that obtained by Abeyasinghe et al algorithm the RCPM schedule does not
have phantom float
Table 4 Comparison with Abeyasinghe et al Result
Authors
RCS
Method Duration
(Days)
Resource
Links
Increase
Duration
Increase
NC
Critical
Activities
Activities
with FF
Abeyasinghe
et al
Parallel
28 6 47 -26 67 -
Kim and de
la Garza
Serial amp
Parallel 34 4 79 15 44 33
31
Figure 9 RCPM Serial and Parallel-Based Schedule
Rivera and Duran (2004)
Rivera and Duran introduced the concepts of critical set and critical cloud to identify critical
activities in a resource-constrained schedule A critical sequence connects critical clouds andor
critical tasks A critical cloud includes all possible critical sets A critical set is a group of activities
that simultaneously constrain the project progress and impacts the project completion time if all
the activities of the set are delayed This set of activities is critical during a specific period A
critical activity is a critical cloud with a critical set of only one task As shown in Figure 10b a
color code identifies critical clouds with only one activity a critical set or more than one critical
set
Comparison
Rivera and Duranrsquos schedule has 15 activities and 19 logical relationships (NC = 127) The project
requires one type of resource (R) with maximum availability of four units The CPM duration is
18 days (see Figure 10a) The project duration was increased by five days (from 18 to 23 days)
after mitigating the resource supply-demand problem (see Figure 10b)
Figure 10a Network Diagram
32
Figure 10b Algorithmrsquos Result
Figure 10 Rivera and Duranrsquos Schedule (Rivera and Duran 2004)
Rivera and Duranrsquos algorithm does not create resource links between activities As a result the
schedule lacks a continuous critical sequence Additionally critical activities do not have a zero
total float and some activities have phantom float (Activity E and Activity M) Neither the free
float values nor the total float values of the activities in Rivera and Duranrsquos schedule can be
correctly computed due to the lack of resource links
The RCPM schedules under the serial and parallel approaches are shown in Figure 11 These two
schedules do not have phantom float The main difference between the two schedules is the start
time of Activity M Activity M starts earlier in the parallel-based schedule than in the serial-based
schedule The early start of Activity M decreases the number of resource links required in the
schedule Thus the RCPM parallel-based schedule provides a better activitiesrsquo configuration in
terms of duration network complexity critical activities and activities with free float (see Table
5)
Table 5 Comparison with Rivera and Duranrsquos Result
Authors
RCS
Method Duration
(Days)
Resource
Links
Increase
Duration
Increase
NC
Critical
Activities
Activities
FF
Rivera
and
Duran
NS 23 No 28 0 53 -
Kim
and de
la
Garza
Serial
(LS) 22 8 22 42 40 7
Parallel
(ES +
LS)
21 5 17 26 33 20
Note NS = Not Specified
33
Figure 11a Serial-Based Schedule
Figure 11b Parallel-Based Schedule
Figure 11 RCPM Results for Rivera and Duranrsquos Example
Lu and Li (2003)
Lu and Li (2003) developed the Resource-Activity Critical-Path Method as a serial based approach
in which the Work Content (WC) is the primary criterion to schedule activities The work content
is the relative weight of each activity with respect to time and resource usage The work content is
calculated as the number of resources multiplied by the activity duration Limited resources are
first assigned to activities with higher work content since these activities may affect the project
completion time Lu and Lirsquos algorithm is briefly described as follows
1 Determine the status of each activity as CAN-DO TO DO or DONE Update this status
each time that an activity is scheduled Then calculate the work content of each activity
34
2 Sort the CAN-DO activities in descending order according to their work content If there
is a tie with respect to the work content schedule the activity with a larger number of
resources or longer duration first
3 Determine and update the time when resources are ready to work (Ready to Serve Time -
RST) Allocate the number of resources needed for the current activity based on the RST
4 Determine the Early Start Time (ES) of each activity considering the maximum date
between the Early Finish Time (EF) of its predecessors and the RST of its resources
5 Calculate the idle time of resources before being allocated to an activity as the difference
between the ES of the current activity and the RST of the participating resources Check if
the resources allocated to the current activity can be allocated to another CAN-DO activity
6 Replace the RST of the resources participating in the current activity with the EF of the
current activity Repeat the previous steps until all activities are completed
7 Identify the resource-constrained successor activities ie the first activity that uses the
same resource of the current or predecessor activity Then create the corresponding links
between the activities
8 Perform the backward pass considering the technological and resource relationships
Lu and Lirsquos algorithm requires a lot of in-between work (additional networks andor tables) to
handle the interaction and allocation of resources This turns out to be impractical when applying
it to real projects (Pantouvakis and Manoliadis 2006) Besides the use of the work content as a
priority rule generates different results for the same project when having activities with multiple
types of resource requirements Under this scenario the user should determine which type of
resource is more important and based on that criterion calculate the work content
Besides Lu and Li did not specify how to schedule activities with no resource requirement These
activities do not affect the schedule by holding up resources but they are necessary to keep the
logic sequence of a project Activities with no resource requirements should not have the least
priority to be scheduled (WC = 0) On the other hand when there is a resource-dependency
between activities that are also technologically connected the resource relationship takes
precedence over the logical relationship ie some technological relationships are removed from
the schedule
Pantouvakis and Manoliadis (2006)
Pantouvakis and Manoliadisrsquo algorithm is briefly described as follows
1 Apply any RCS method to mitigate the resource supply-demand problem
2 Identify the resource dependencies that exist between the activities from the resource
histogram A resource dependence exists if an activity uses part or all the resources of its
predecessor activity
3 Re-draw the network considering not only the logical relationships but also the resource
relationships Review the schedule to determine if the project can be logically performed
If not reconsider the resource limits and perform the algorithm a second time
4 Perform the CPM in the final network to obtain the total float values
5 Pantouvakis and Manoliadisrsquo algorithm assumes that resource requirements do not change
over time Besides since the algorithm is based on the resource-leveled histogram the user
35
should identify the resource dependencies between activities by inspection This process is
prone to errors when having large networks
Nisar Yakamamoto and Suzuki (2013)
Nisar et al proposed the Resource-Dependent Critical Path Method which 1) identifies different
types of resource dependencies 2) determines alternative schedules and 3) optimizes the number
of resource links when having multiple alternatives to create them for a specific activity The
algorithm is described as follows
1 Perform the forward and backward pass of any RCS method (Nisar et al applied the
Ranked Positional Weighted method)
2 Perform the backward pass of the selected RCS method
21 Reverse the original schedule (ie the predecessor activities become the successorrsquos
activities and vice-versa) Then perform the CPM forward pass
22 Calculate the Constrained Latest Finish (CLF) time for each activity of the reverse
schedule obtained in Step 21 (CLF = Project Duration ndash Early Start Time) Perform
the RCS a second time and obtain the reverse RCS schedule
23 Calculate the CLF time for the reverse RCS schedule of Step 22
3 Determine resource dependencies
31 Create a strict resource precedence relationship when the start time of a current activity
is delayed by the same time that its predecessor activity is delayed
32 Create a flexible resource precedence relationship when the predecessor activity is
delayed more than one day and if it affects the start time of the current activity
33 Minimize the total number of resource relationships without violating any resource
constraint
4 Remove redundant relationships from the schedule
The two main limitations of Nisar et al algorithm are 1) multiple types of resources cannot be
considered and 2) technological relationships with lags cannot be included in the schedule In
addition the authors did not provide a reasonable argument that supports the development of
reverse CPM and RCS schedules These several in-between steps of the algorithm are impractical
for practitioners
Case Study
Ahuja et al schedule was used by Lu and Li (2003) Pantouvakis and Manoliadis (2006) and
Nisar et al (2013) to illustrate their proposed algorithms The schedule has 11 activities and 14
logical relationships (NC = 127) The project requires one type of resource (R) and the maximum
resource availability is six units The CPM duration is 14 days (see Figure 12)
36
Figure 12a Network Diagram
Figure 12b Bar Chart
Figure 12 Ahuja et al Schedule (Pantouvakis and Manoliadis 2006)
Comparison
According to Lu and Lirsquos result the project duration was increased by six days (from 14 to 20
days) after solving the resource conflicts (see Figure 13) Lu and Lirsquos algorithm created
unnecessary resource links because the links were added after performing the forward pass If the
resource links would have been created during the forward pass the link between Activity E and
Activity F would not have been necessary At that time the link between Activity G and Activity
F would have been already created Moreover the resource link between Activity E and Activity
F is not required because if Activity E is delayed there is not an over-allocation problem (see
Figure 13) The same scenario occurs for the link between Activity H and Activity I
Figure 13 Lu and Lirsquos Result Kim and de la Garza (2005)
37
Similar to Lu and Lirsquos result Pantouvakis and Manoliadisrsquo algorithm increased the project duration
by six days (see Figure 14b) However the algorithm removed some technological relationships
from the schedule For example the logical relationships between Activity B and Activity F
Activity C and Activity G Activity E and Activity I and Activity G and Activity I (see Figure 12a
and Figure 14a) These technological relationships were removed from the network because they
become redundant once the resource links are added to the schedule
Furthermore Pantouvakis and Manoliadisrsquo algorithm creates unnecessary resource links For
example the resource link between Activity H and Activity I is not needed Activity H can be
delayed four days without exceeding the maximum number of resources available in the project
which is six (see Figure 14b)
Figure 14a Network Diagram with Resource Links
Figure 14b Bar Chart
Figure 14 Pantouvakis and Manoliadisrsquos Result (Pantouvakis and Manoliadis 2006)
In Pantouvakis and Manoliadisrsquo schedule there are three possible resource driver activities for the
delayed task (F) (see Figure 15a) As a result two different resource links configurations can be
created If Activity D and Activity E are selected as resource drivers of Activity F two resource
links should be created in the schedule (see Figure 15b) Otherwise if Activity G is selected as the
resource driver of Activity F only one resource link is needed in the schedule (see Figure 15c)
Most of the existing algorithms do not have a criterion to select a possible resource link
configuration or to identify a resource driver activity when having several alternatives
38
Figure 15a Possible Resource Drivers of Activity F (D E and G)
Figure 15b Alternative No 1 Figure 1c Alternative No 2
Figure 15 Multiple Resource Links Configurations
According to Nisar et al result the project duration was increased by three days (from 14 to 17
days) after mitigating the resource supply-demand problem The algorithm only increased the
project duration by 21 Nisar et al algorithm provides a better schedule than the other three
authorsrsquo algorithms in terms of duration network complexity critical activities and activities with
free float Nevertheless the mechanism proposed by the authors to remove redundant relationships
removes technological links For instance the logical relationship between Activity B and Activity
G no longer exists (see Figure 16a) Because an optimization function minimizes the total number
of resource relationships without violating the resource constraints Nisar et al algorithm is not
totally rule-based
Both RCPM schedules (serial and parallel-based) are equal (see Figure 16b) The RCPM schedule
provides a better activitiesrsquo configuration than that of Lu and Li and Pantouvakis and Manoliadisrsquo
schedules in terms of duration network complexity critical activities and activities with free float
(see Table 6)
39
Figure 16a Nisar et al Result
Figure 16b RCPM Serial and Parallel-Based Schedule
Figure 16 Nisar et al (2013) and RCPM Results
Table 6 Comparison with Lu and Li Pantouvakis and Manoliadis and Nisar et al Results
Authors RCS
Method
Duration
(Days)
Resource
Links
Increase
Duration
Increase
NC
Critical
Activities
Activities
FF
Lu and Li Serial
(WC) 20 5 43 36 64 9
Pantouvakis Serial
(LS) 20 5 43 36 55 9
Nisar RPW 17 3 21 21 36 27
Kim and de
la Garza
Serial
Parallel 19 4 36 29 55 18
Note RPW Ranked Positional Weighted
40
Shortcomings of Existing RCS Related Algorithms
This section describes the three main shortcomings of the RCPM developed by Kim and de la
Garza (2003) which apply to the other algorithms reviewed in this study
Unidentified Resource Links in Multiple Calendars
When an activity is delayed and scheduled during the non-working days of its predecessor the
RCPM does not identify the corresponding resource links (Kim 2003) For example in Figure
17a Activity A is delayed one day to resolve the over-allocation problem on Day 2 The algorithm
mitigates the resource-demand problem but the two necessary resource links are not identified
(see Figure 17b) As shown in Figure 17c a resource link is needed between Activity B and
Activity A and another between Activity A and Activity B This link ensures that Activity A is not
delayed for more than three days Otherwise there would be an over-allocation problem
Figure 17a Initial Scenario
Figure 17b Unidentified Resource Links Scenario
Figure 17c Potential Solution
Figure 17 Unidentified Resource Links in the RCPM
A proposed solution to this issue is to create two different activities (B1 and B2) that represent the
activity that is scheduled between non-working days (B) (see Figure 17c) This alternative may
increase the complexity of the network and algorithm by adding more activities resource links
and in-between steps Further research is needed to determine how to handle these resource
relationships and additional activities when the schedule must be updated
41
Lack of Dynamic Resource Links
By the time the eight algorithms were developed the main concern was to solve the problem of a
broken critical path in a resource-constrained schedule For that reason the majority of the authors
did not explore the use of resource links to update the schedule or to perform a delay analysis
During the control phase of a project an update or a delay event may change the priority order
designated by the RCS heuristic to schedule the activities Thus the resource links identified
before the update may no longer be required andor new resource links can be identified after the
update The initial resource links should be removed from the schedule before updating the
schedule because they were identified based on previous or different project conditions Keeping
the resource links during the update constrains the schedule For that reason the resource links
have the feature of being temporal or dynamic Kim (2009) considered resource links for updating
the schedule but the author did not remove the resource links from the schedule each time that the
RCPM was re-applied
The incorporation of dynamic resource links in an algorithm does not create analytical challenges
if the data date of the update is known By knowing the data date of the update the algorithm will
remove only the resource links located right of the data date Even though the resource links
located right of the data date should be removed each time that an algorithm is re-applied the
resource links located left of the data date should remain on the schedule In that way after all
activities have been completed the as-built schedule will have a continuous critical path with no
phantom float
Several of the algorithms reviewed in this paper remove some technological relationships from the
schedule because these relationships become redundant after adding the resource links to the
network This process jeopardizes the updating process Due to the resource links should be
removed before updating or performing a Time Impact Analysis the logic sequence of the project
will be lost if there is no record of the logical relationships that were removed The challenge of
incorporating dynamic resource links in the schedule is knowing how to handle and keep track of
the links that have been created removed andor updated since each time the schedule is updated
the sequence of the activities may change
Selection of a Resource Links Configuration
The major problem when identifying the resource relationships in the schedule is the fact that
multiple alternatives for creating resource links between activities may exist when many current
activities have many predecessor activities Hence multiple and different schedules can be
generated for the same project (Kim 2003 Nisar et al 2013) The difference between the multiple
schedules that can be generated is not only the number of resource links created but also the critical
path So the question that arises is which schedule should be considered as the baseline
Despite Abeyasinghe et al (2001) mentioning that solving resource-constrained problems with
optimization tools is impractical in large projects due to the significant number of variables and
constraints involved this mathematical mechanism could be effective when having multiple
resource links configurations According to Nisar Yamamoto amp Suzuki (2013) the resource links
42
should be created in a way that the total number of relationships is minimized without violating
the resource constraints Nisar Yamamoto amp Suzuki (2013) proposed a function to find the
optimal resource links between activities The main goal is to not increase the complexity of the
network Further research is needed to determine the effectiveness of this approach under different
project characteristics and constraints An important factor to consider in the analysis is the
algorithmrsquos running time
On the other hand Bowers (1995) suggested that when having identical parallel activities it is the
project managerrsquos responsibility to determine the activity with higher priority Another alternative
that also keeps the algorithms rule-based is to establish and test a criterion to select one of the
multiple resource links configurations For instance the resource driver activity could be the
predecessor activity with the highest number of resources In a resource-constrained schedule this
activity is more likely to delay the project due to the high demand for resources that it requires If
this activity is delayed more activities could be delayed because they would need the resources
that the resource driver activity is using Several parameters should be tested in order to establish
a rule that provides good solutions in most of the cases These are schedules with a lower number
of resource links to avoid a complex network Current research is being carried out to determine
which priority rules may be considered for selecting a potential resource link configuration This
rule will be included in an enhanced RCPM algorithm
A criterion to select among alternative schedules should be also determined For instance 1) the
schedule with the lowest number of resource links since it may be less complex in terms of number
of relationships 2) the schedule with the lowest percentage of critical activities since the
probability to cause delays to the project is lower 3) the schedule with the highest percentage of
activities with free float since it is more flexible or 4) the schedule with the fewest resource idle
time Further research should be performed to determine which criterion is the most appropriate
Discussion
Delay Analysis
The limited amount of resources allocated to projects demands the use of resource-loaded
schedules for delay analysis (Braimah 2013) As stated by Ibbs and Nguyen (2007) ldquoperforming
a schedule analysis without considering resource allocations may increase the ownerrsquos or
contractorrsquos risk of assuming delay responsibility which is not his or her faultrdquo
The main issue when incorporating resources in a delay analysis is the fact that the RCS existing
algorithms do not incorporate and handle dynamic resource links This leads to untrusted results
because the schedule does not reflect the real conditions of the project Therefore the parties
involved may not be totally responsible for the apportioned delays (Ibbs amp Nguyen 2007)
Besides the algorithms do not allow activities to be interrupted which is a common scenario when
having a delay event
Another issue when incorporating resources in the analysis is the selection of a heuristic to solve
the resource conflicts As demonstrated by Nguyen and Ibbs (2008) the sequence of activities may
43
be altered each time that the network is re-scheduled because of a project update The updates may
change the priority rank assigned to each activity when performing an RCS heuristic and as a
result different results can be obtained for the same delay scenario (Kim 2009)
Performance of Existing RCS Related Algorithms
These heuristics provide ldquogoodrdquo but not optimal solutions (Wiest 1963 Lu and Li 2003
Pantouvakis and Manoliadis 2006) Some rules may work well for a project but may not work
well when they are applied to a different project (Wiest 1963) Based on the results of this
research which are limited to small networks the methods proposed by Nisar et al (2013) and
Kim and de la Garza (2003) provide good solutions in terms of time In most of the cases the
average increase in the project duration was lower than 37 when the RCPM was applied
Nisarrsquos algorithm generates schedules with lower complexity in terms of relationships because it
incorporates a function that minimizes the number of resource links created in the schedule
Nevertheless the algorithm removes some technological relationships from the schedule after
identifying the resource links It is suggested to keep track of the technological relationships that
are removed from the schedule Otherwise the logical sequence of the project will be lost when
updating the schedule or performing a delay analysis
Unlike Nisarrsquos algorithm Kimrsquos algorithm does not have any mechanism to optimize the number
of resource links created in the schedule but it does not remove the logical relationships from the
schedule Additionally RCPM is practical and easy to understand In this regard Nisarrsquos algorithm
requires a lot of in-between steps and the authors defined two types of resource relationships (strict
and flexible) that may be not practical for professionals Worthy of note none of the algorithms
consider the dynamic feature of resource links Therefore using these methods is not
recommended for updating the schedule or for applying a Time Impact Analysis unless they
incorporate and handle dynamic resource links
The RCS related algorithms reviewed in this paper were tested by the corresponding authors in
one or two hypotheticalreal-life projects Therefore it is not possible to develop a method of
selection based on the algorithmsrsquo performance However the indicators used in this study to
evaluate algorithm performance can help practitioners decide which method selects to mitigate the
resource supply-demand problem without generating phantom float in the schedule Algorithms
with a percentage of increase in the project duration smaller than 40 are preferred (Boctor 1976
Woodworth and Shanahan 1988) If there are several algorithms that meet this criterion the
percentage of critical activities can be used as a tiebreaker Having float in the schedule may be
beneficial when addressing potential delaying events Because most of the algorithms were tested
in small networks (20 ndash 30 activities) further investigation is required to test the performance of
the RCS related algorithms in real-life and large projects
Based on the features of each algorithm (heuristic) constraints (removal of logic links) and project
characteristics (resources and calendars) a system was developed to guide practitioners in the
selection process of an algorithm (see Figure 18)
44
Figure 18 Guide to select an Algorithm
Conclusion
On a regular basis project managers concentrate their efforts on critical and near-critical activities
However the concepts of total float and critical path lose their significance after applying resource-
constrained scheduling (RCS) methodologies (Fondahl 1961 Wiest 1964 Bowers 1995 Raz
and Marshall 1996 Rivera and Duran 2004) RCS techniques mitigate the resource supply-
demand problem but create phantom float in the schedules (ie a float that does not exist)
Therefore several algorithms have been developed to provide correct float values and a continuous
critical path in resource-constrained schedules This study reviews and evaluates the performance
of eight RCS related algorithms with the purpose of identifying the shortcomings that must be
addressed so they can be applied for delay analysis
Most of the algorithms identify resource dependences but some of them still create phantom float
in the schedule because they do not identify all the necessary resource links Some algorithms also
create unnecessary resource relationships andor remove technological relationships from the
schedule Furthermore most of the algorithms do not provide a mechanism or criterion to select a
resource links configuration among multiple alternatives and neither to select a schedule when
having multiple options Finally none of the algorithms consider the dynamic feature of resource
dependences These limitations should be addressed to make the algorithms more practical for real
construction and engineering projects
This study 1) discusses potential solutions to the shortcomings of the existing algorithms 2)
provides recommendations on the methods that can be used by industry professionals and 3)
45
proposes a system to facilitate the selection of an algorithm based on their common features
(heuristic) constraints (removal of logic links) and project characteristics (resources and
calendars) The algorithms proposed by Kim and de la Garza (2003) and Nisar et al (2013)
provide good solutions in terms of time However as presented in the discussion section there are
points to consider when applying any of these RCS related techniques
Future Research
The eight algorithms reviewed in this paper lack features for their use in delay analysis Activities
cannot be interrupted which is a common scenario when having non-working days or delaying
events In addition none of the algorithms handle dynamic resource relationships Resource links
should be removed before updating the schedule because they were created based on previous
project conditions The initial conditions may not prevail after the update Therefore a systematic
procedure is needed to incorporate and handle dynamic resource links in the algorithms when 1)
there are schedule changes 2) resource utilization changes and 3) different delay methodologies
are applied Addressing these limitations will allow a more realistic delay analysis since schedules
will reflect the real conditions of the project
Otherwise the manual identification and creation of resource links are a time consuming and error-
prone process in large and complex projects At present commercial scheduling software such as
Primavera P6 and Microsoft Project create phantom float in resource-constrained schedules
because they do not incorporate an algorithm to identify the resource relationships between the
activities Since the major scheduling software developers such as Oracle and Microsoft do not
seem to be interested in moving forward to remove phantom float from resource-constrained
schedules a system that incorporates an algorithm to remove phantom float from P6 and Microsoft
Project schedules is needed The development of a computerized system will allow the removal
in a practical way of phantom float from resource-constrained schedules
Currently research is being carried out in order to develop an enhanced RCPM-based algorithm
that addresses the shortcomings of the existing algorithms so it can properly apply for delay
analysis and project controls The enhanced RCPM algorithm will be computerized in a system
integrated with Primavera P6
References
Abeyasinghe M C L Greenwood D J amp Johansen D E (2001) An efficient method for
scheduling construction projects with resource constraints International Journal of Project
Management 19(1) 29-45 DOIorg101016S0263-7863(00)00024-7
Ahuja H Dozzi SP and AbouRizk SM (1994) Project management techniques in planning
and controlling construction projects 2nd edition Wiley New York
Alvarez-Valdes R and Tamarit JM (1989b) Algoritmos heuristicos deterministas y aleatorios
en secuenciacion de proyectos con recursos limitados Q~estiio 13 173-191
46
Baki M A (1998) CPM scheduling and its use in todays construction industry Project
Management Journal 29(1) 7ndash9 DOIorg101057jors19959
Boctor F F (April 01 1996) A new and efficient heuristic for scheduling projects with resource
restrictions and multiple execution modes European Journal of Operational Research 90 2 349-
361 DOIorg10108000207549308956882
Bowers J A (1995) Criticality in Resource-Constrained Networks Journal of the Operational
Research Soc 46 80-91 DOIorg101057jors19959
Braimah N (2013) Construction Delay Analysis TechniquesmdashA Review of Application Issues
and Improvement Needs Buildings 3 506-531 DOI103390buildings3030506
Davis E W amp Patterson J H (April 01 1975) A Comparison of Heuristic and Optimum
Solutions in Resource-Constrained Project Scheduling Management Science 21 8 944-955
de la Garza J M amp Franco-Duran D M (2017) CPM Benefits in Estimating Bidding Reported
in Survey (B Buckley Ed) httpswwwenrcomarticles43666-cpm-benefits-in-estimating-
bidding-reported-in-survey
Fondahl J W (1991) The Development of the Construction Engineer Past Progress and Future
Problems Journal of Construction Engineering and Management 117(3) 380-392
DOIorg101061(ASCE)0733-9364(1991)1173(380)
Gordon J H (January 01 1983) Heuristic methods in resource allocation International Journal
of Project Management 1 3 163-168 DOIorg1010160263-7863(83)90022-4
Ibbs W amp Nguyen L D (2007) Schedule Analysis under the Effect of Resource
Allocation Journal of Construction Engineering and Management 133 2 131-138
DOIorg101061(ASCE)0733-9364(2007)1332(131)
Kastor A amp Sirakoulis K (2009) The effectiveness of resource leveling tools for Resource
Constraint Project Scheduling Problem International Journal of Project Management 27(5) 493-
500 DOIorg101016jijproman200808006
Kim K (2003) A Resource-constrained CPM (RCPM) Scheduling and Control Technique with
Multiple Calendars (Doctor of Philosophy Dissertation) Department of Civil and Environmental
Engineering Virginia Tech Blacksburg Virginia
Kim K amp de la Garza J M (2003) Phantom Float Journal of Construction Engineering and
Management 129 (5) 507-517 DOIorg101061(ASCE)0733-9364(2003)1295(507)
Kim K amp de la Garza J M (2005) Evaluation of the Resource-Constrained Critical Path Method
Algorithms Journal of Construction Engineering and Management 131(5) 522-532
DOIorg101061(ASCE)0733-9364(2005)1315(522)
47
Kim K (2009) Delay Analysis in Resource-constrained Schedules Canadian Journal of Civil
Engineering 36 295-303 DOIorg101139L08-121
Lu M amp Li H (2003) Resource-Activity Critical-Path Method for Construction Planning
Journal of Construction Engineering and Management 129(4) 412-420
DOIorg101061(ASCE)0733-9364(2003)1294(412)
Moder J J Phillips C R amp Davis E W (1983) Project Management with CPM PERT and
precedence diagramming (3rd ed ed) New York Van Nostrand Reinhold
Nisar S A Yamamoto Koshi amp Suzuki K (2013) Resource-Dependent Critical Path Method
for Identifying the Critical Path and the ldquoReal Floatsrdquo in Resource-Constrained Project
Scheduling Journal of Japan Society of Civil Engineers 69(4) 97-107
DOIorg102208jscejcm69I_97
Nguyen L D amp Ibbs W (2008) FLORA New forensic schedule analysis technique Journal of
Construction Engineering and Management 134 7 483-491 DOIabs101061(ASCE)0733-
9364(2008)1347(483)
Pantouvakis JP amp Manoliadis OG (2006) A practical approach to resource-constrained project
scheduling Operational Research An International Journal 6(3) 299-309
DOIorg101007BF02941258
Patterson J H (1973) Alternate methods of project scheduling with limited resources Naval
Research Logistics Quarterly 20(4) 767-784 DOIorg101002nav3800200415
Patterson J H (March 01 1976) Project scheduling The effects of problem structure on heuristic
performance Naval Research Logistics Quarterly 23 1 95-123
Raz T amp Marshall B (1996) Effect of resource constraints on float calculations in project
networks International Journal of Project Management 14(4) 241-248 DOIorg1010160263-
7863(95)00090-9
Rivera F A amp Duran A (2004) Critical clouds and critical sets in resource-constrained
projects International Journal of Project Management 22(6) 489-497
DOIorg101016jijproman200311004
Ulusoy G and Ozdamar L (1989) Heuristic performance and networkresource characteristics
in resource-constrained project scheduling Journal of the Operational Research Society 40 1145-
1152 DOIorg101057jors1989196
Wiest J D (1964) Some Properties of Schedules for Large Projects with Limited Resources
Operation Research 12(3) 395-418 DOI101287opre123395
48
Woodworth B M amp Shanahan S (1988) Identifying the critical sequence in a resource-
constrained project International Journal of Project Management 6 (2) 89-96
DOIorg1010160263-7863(88)900
49
CHAPTER 3
Performance of Resource-Constrained Scheduling Heuristics3
Abstract
Over the years the study of Resource-Constrained Scheduling heuristics has focused on testing
different sets of priority rules without paying attention to the conditions under which each heuristic
produces better results Although some authors have recommended the use of specific heuristics
over any other rule these recommendations are general and do not encompass all possible project
characteristics in terms of resources and network topology Without a guidance system schedulers
must try several combinations of rules until they find one that compares favorably (shortest
duration) with the results of the other priority rules
This study proposes a new tiebreaker (Priority Number) that enhances the performance of an
existing heuristic and classifies the heuristicsrsquo performance based on specific project
characteristics The results show that the Priority Number as a tiebreaker of the Late Finish leads
to obtain schedules with lower deviations from the CPM duration and a higher number of shortest
schedules than with traditional tiebreakers
The proposed classification system indicates the two heuristics with the best performance for
specific resource network characteristics This classification will help practitioners to decide which
heuristic applies when mitigating the resource supply-demand problem given the project
characteristics
Keywords Heuristics Resource-Constrained Scheduling Tiebreaker
Introduction
Resources are included in a schedule to better represent the actual conditions of a project Under
such a scenario several activities may require the same group of resources to be completed These
activities cannot be executed at the same time unless the supply of resources would be increased
Otherwise a resource supply-demand problem (over-allocation) will arise in the schedule
In a resource-constrained schedule the initial project completion time may be extended due to
some activities that need to be delayed solving the resource over-allocation The decision of
delaying some activities and scheduling others immediately is subjected to logic precedence and
priority rules (heuristic)
3 Franco-Duran D M amp de la Garza J M (February 12 2020) Performance of Resource-Constrained Scheduling
Heuristics Journal of Construction Engineering and Management 146 (4) pp 1-12
DOIorg101061(ASCE)CO1943-78620001804
50
As rules of thumb heuristics may work better for some project characteristics than for others
(Davis 1975 Ulusoy 1989 Abetasinghe et al 2001) Previous findings suggest that heuristic
performance is poor when 1) the proportion of resources required per activity to the resources
available is high (Davis 1975) 2) activities require several types of resources (Kolish 1995) 3)
a network is highly constrained (Kolish 1995 Chen et al 2018) 4) a network has a high number
of activities (Boctor 1976 Zhan 1994) and 5) the complexity of a network which is the average
number of successors relationships per activity is around 15 to 21 (medium-high) (Davis 1975
Alvarez and Tamarit 1989 Kolish 1995)
Additionally some authors have recommended the use of specific heuristics over any other rule
For example Patterson (1976) recommended using the Minimum Total Float (TF) and Late Finish
(LF) in networks with a high average free float per activity and in networks with a high variation
in the activity duration Chen et al (2018) recommended using the LF in highly resource-
constrained networks and using the Late Start (LS) in slightly constrained networks Although
these recommendations may be useful for practitioners they are general and do not encompass all
possible project characteristics in terms of resources and network topology
Heuristics have been incorporated in commercial scheduling software like Primavera P6 and
Microsoft Project (Marimuthu et al 2018) For instance Primavera users can employ any
combination of the 26 rules listed by the software as resource-constrained priorities or any other
rule defined by the user However without a classification system that helps users to decide which
heuristic applies when mitigating the resource over-allocation problem schedulers must try several
combinations of rules until they find one that compares favorably (shortest duration) with the
results of the other priority rules
So far the study of Resource-Constrained Scheduling (RCS) heuristics has focused on testing
different sets of priority rules without paying attention to the conditions under which each heuristic
produces better results ie shorter durations A preliminary analysis showed that the performance
of existing heuristics is not consistent when networks have more than 50 activities and activities
require several types of resources For a sample of 18 networks the percentage of times that eight
existing heuristics produced the shortest schedules ranged from 11 to 39 These low numbers
highlight the need to develop a heuristic or enhancing an existing one that produces better results
under these project characteristics
The aim of this study is to 1) propose a new tiebreaker that enhances the performance of an existing
heuristic under specific project parameters 2) analyze the influence of different tiebreakers in the
resulting schedules and 3) classify the heuristicsrsquo performance based on explicit resource and
network characteristics
Theoretical Background
Heuristics have two main components the scheduling method and priority rules The scheduling
method determines the way activities are scheduled either under a serial or parallel approach
Under a serial approach activities are sorted and then scheduled one at a time Under a parallel
51
approach the activitiesrsquo sequence is determined and updated at the beginning of a specific period
ie activities are scheduled by intervals of time (Moder et al 1983)
Priority rules are criteria that establish the order to sequence activities A set of priority rules is
known as a heuristic Rules are based on information regarding activities (duration) network
(successorspredecessors) Critical Path Method (CPM) calculations (earlylate dates and float
values) and resource demand Although the first criterion of the set of priority rules (major sort
parameter) has a significant effect on the resulting schedule a minimum of two parameters is
needed for any heuristic so ties can be solved (Gordon 1974) The rule that breaks a tie ie when
two or more activities have the same value of a parameter is called tiebreaker Existing priority
rules incorporate as a tiebreaker (second sort parameter) either the ID number the duration or
total float of the activities These parameters or any other should be carefully selected since they
may have an impact on the calculated project completion time if a tie for the major sort parameter
exists
Heuristics have been tested employing different types of networks Typically networks are
generated from topological structure and resource parameters The topological structure
parameters are the number of activities the Network Complexity (NC) and the serialparallel
indicator (I2) Networks with 30 activities are considered as small size problems and networks
with more than 120 activities as large size problems (Gordon 1983) The complexity of a network
(NC) denotes the average number of successors relationships per activity It is calculated as the
ratio between the number of successor relations and the number of total activities of a project The
SerialParallel Indicator (I2) defines how close a network is to a serial or parallel chain of activities
(Kolisch 1996) This indicator ranges from zero to one If I2 = 0 activities are scheduled under
a parallel approach ie there are no precedence relationships between activities If I2 = 1
activities are serial-based scheduled (chain of activities)
Otherwise the resource parameters are the number of type of resources the Resource Strength
(RS) the Resource Factor (RF) and the Resource Utilization (RU) The Resource Utilization
factor (RU) indicates the proportion of resource requirements per activity relative to the number
of resources available The Resource Strength (RS) measures the proportion of resource demand
and availability of a network ie how constrained a network is in terms of resources considering
the maximum availability of resources The Resource Factor (RF) indicates the proportion of
resource types required per activity ie the average number of resource types needed to execute
activities Both indicators (RS and RF) range from zero to one If RS = 0 at least one activity
demands all the resource capacity Conversely if RS = 1 resources are not over-allocated If RF =1 each activity demands at least some amount of each type of resource Contrariwise if RF = 0
activities do not demand any amount of any resource
The percentage increase above the CPM duration has been used by several authors to compare and
evaluate the efficacy of several RCS related heuristics when the optimum duration of the network
is not calculated (Patterson 1973 Patterson 1976 Gordon 1986 Ulusoy and Ozdamar 1989
Boctor 1993 Kolisch 1996 Boctor 1996 Kastor and Sirakoulis 2009) The percentage increase
above the CPM duration represents the delay generated by the resource unavailability because of
the heuristic employed The lower the percentage the better the performance
52
The most tested priority rules reported in the literature are Late Finish (LF) Min Slack (Least Total
Float or Min TF) the shortest processing time (SPT or Shortest Duration) Late Start (LS) Greatest
Rank Positional Weight (GRPW) Greatest Resource Utilization (GRU) and Resource Scheduling
Method (RSM) (Davis 1975 Boctor 1976 Patterson 1976 Gordon 1983 Kolish 1995 Alvarez
and Tamarit 1989)
Newly Developed Tiebreaker Priority Number (Pn)
Before developing the new tiebreaker a pilot study was carried out to evaluate the performance of
different priority rules as tiebreakers of the Late Start (LS) and Late Finish (LF) These CPM late
dates were selected as major sort parameters to test the tiebreakers because previous studies have
found that either the LS or LF provides good results mitigating a resource supply-demand problem
(Alvarez and Tamarit 1989 Boctor 1993 Gordon 1994 Kolish 1995 Kolish 1996 Abetasinghe
et al 2001 Kastor and Sirakoulis 2009)
The parameters considered as potential tiebreakers were the number of resources required per
activity Resource Utilization (RU) Duration (D) Total Float (TF) Free Float (FF) and the
number of successor activities Based on the results of this preliminary analysis this study
proposed a new tiebreaker labeled Priority Number (Pn) The Priority Number which is a
composite rule considers the Duration (D) and Total Float (TF) of each activity A composite rule
combines different factorsparameters in one measure The Priority Number is calculated as shown
in Equation 1
Pni =Di
TFi (Eq 1)
In Equation 1 Pni is the priority number of activity i Di is the duration of the activity i and TFi
is the total float of activity i If TFi = 0 TFi is assumed to be equal to 095 This assumption was
made to avoid a division by zero and to differentiate between a critical activity (TF = 0) and a
near-critical activity (TF = 1) A number close to zero was not selected to avoid significant high
numbers of the Pn Due to the Pn does not exist as a priority rule in Primavera P6 the Pn values
were computed separately and then assigned to each activity using the activity codes function of
P6
The duration and total float were considered as appropriate parameters of the Pn due to the
influence they may have extending the project completion time The duration is the expected
amount of time an activity will be delayed if another activity is scheduled first Furthermore if the
delayed task is critical (TF = 0) the activity duration may be the time that the project could be
extended The greater the duration the greater the impact on the project completion time On the
other hand the CPM total float indicates how critical activities were before taking into
consideration the resources Although the CPM float values will change after mitigating the
resource-supply demand problem most of the critical and near-critical activities in CPM may be
still critical after applying an RCS heuristic
53
Enhanced LF Heuristic
Activities must be scheduled subject to precedence or logical relationships This study considered
the Late Finish (LF) as the major rule to sort the activities and used the Priority Number (Pn) as a
tiebreaker The Enhanced LF heuristic is described below
1 Sort activities by earliest Late Finish (LF)
2 If there is a tie with respect to the LF the priority is given to activities with the lowest
Priority Number (Pn) The preliminary analysis showed that shorter schedules are obtained
more frequently when the priority is given to activities with a lower Pn than a higher
number
3 If there is a tie with respect to the Pn the tie is broken by the smallest activity number (ID)
Methodology
This study generated 142 different networks to evaluate and classify the performance of RCS
heuristics The networks were created using the generator program RanGen developed by
Demeulemeester Vanhoucke and Herroelen (2003) The programrsquos output (a text file with a
Patterson Format structure) was converted to a Primavera P6 format (Franco Duran 2019)
RanGen considers two types of input parameters to construct random networks 1) the networksrsquo
topology and 2) the networksrsquo resource characteristics
Topological Structure
The topological structure of a network is determined by the SerialParallel Indicator (I2) and the
number of activities The 142 generated networks were limited in size to between 30 and 90
activities with an average of 64 activities per network Their complexity ranges from 140 to 165
with an average value of 150 ie three immediate successors per activity RanGen assigned
durations between one and ten units of time to activities The average activity duration of the
networks is five units of time
To resemble a network with parallel and serial activities I2 was defined as 065 (see Figure 1b)
Figure 1 shows the structure of a network of 12 activities when I2 = 020 (parallel-based) I2 =065 (serial and parallel-based combination) and I2 = 10 (serial-based)
Figure 1a Network with I2 =
02 (Parallel-Based)
Figure 1b Network with I2 = 065 (serial and parallel-
based combination)
54
Figure 1c Network with I2 = 10 (Serial-Based)
Figure 1 Network Topologies
Resource Measures
The number of types of resources the Resource Strength (RS) and the Resource Factor (RF) were
the three resource-related parameters defined in RanGen to construct networks The 142 networks
have single or multiple resource requirements with a maximum of three types of resources per
project All resource types are subjected to fixed resource availabilities which were randomly
assigned by RanGen and were constant over the project duration The resource maximum
availability per type varies between 10 and 16 units
In this study the RS was defined as 025 to guarantee an over-allocation scenario in each of the
generated networks Because heuristic performance decreases when the RF is close to 1 most of
the generated networks of this study (N = 112) have a RF equal to 075 (Kolish 1995) Few
networks have a RF equal to 025 (N = 30) Figure 2 shows the resource profiles of a network
with a RF equal to 025 and 075 respectively When RF = 025 activities need less of the resource
type(s) to be executed (see Figure 2a) and when RF = 075 activities need more of the resource
type(s) to be executed (see Figure 2b)
Figure 2a Resource Profile when RF = 025 Figure 2b Resource Profile when RF = 075
Figure 2 Resource profiles when RF = 025 and RF = 075 for a network with I2 = 065 and
RS = 025
The Resource Utilization factor (RU) was calculated as shown in Equation (2) where rk is the
amount of resources of type k required by an activity i and Rk is the maximum amount of resources
55
of type k required by the activity i An example of how the RU factor is calculated for an activity
and a project is provided in Table 1
RUi = sumrk
RkK
(Eq 2)
Table 1 Sample Calculation of RU
ID R1 R2 R3
Resource Utilization (RU) Resource
Availability Max 12 Max 11 Max 13
A1 5 7 1 RUA1 = (512) + (711) + (113) = 113
A2 0 4 8 RUA2 = (411) + (813) = 098
Project RU = (113 + 098)2 = 105
The RU factor of the 30 networks with a RF = 025 ranges from 010 to 050 and that of the 112
networks with a RF = 075 ranges from 025 to 15 Table 2 shows a summary of the
characteristics of the 142 generated networks All networks have in common a I2 = 065 and a
RS = 025
Table 2 Sample Characteristics (N = 142 Networks)
Resource Factor (RF) 025 075 025 and 075
No Networks 30 112 142
No Activities 30 - 80 30 ndash 90 30 ndash 90
Network Complexity (NC) 140 ndash 165 140 - 162 140 ndash 165
No Type of Resources 1 - 3 1 - 3 1 - 3
Resource Utilization (RU) 012 ndash 046 028 ndash 134 012 ndash 134
Performance Criteria
Eight existing priority rules were considered to evaluate and compare the performance of the
Enhanced LF heuristic proposed in this study These heuristics were selected based on the
opportunity to perform each of them in Primavera P6 Primavera allows the user to select specific
parameters as priority rules and combined them as preferred when mitigating the resource supply-
demand problem in a schedule The eight heuristics are described below In all cases ties were
broken by the smallest activity number (ID)
Minimum Total Float (Min Slack) Priority is given to activities with the lowest Total Float
(TF) (Davis and Patterson 1975 Patterson 1976)
Shortest Duration Priority is given to activities with the shortest duration (D) (Davis and
Patterson 1975 Patterson 1976)
Longest Duration Priority is given to activities with the longest duration (D) (Davis and
Patterson 1975)
56
Minimum Late Finish Priority is given to activities with the earliest values of Late Finish
(LF) (Davis and Patterson 1975)
Minimum Late Start Priority is given to activities with the earliest values of Late Start
(LS)
Late Start Sort Priority is given to activities with the earliest values of Late Start (LS) If
there is a tie with respect to the LS priority is given to the activity with the least duration
(D) If the tie persists priority is given to the activity with the least total float (TF)
Earliest Start Time Priority is given to activities with the earliest values of Early Start
(ES)
Earliest Finish Time Priority is given to activities with the earliest values of Early Finish
(EF)
The eight existing heuristics plus the Enhanced LF heuristic were applied to the 142 generated
networks using Primavera P6 All heuristics were tested under a serial approach (P6 default
method) The CPM duration was considered as the benchmark to compare the durations obtained
with each heuristic The percentage increase in the project duration (after applying RCS) with
respect to the CPM duration was considered as an indicator to measure the performance of the
heuristics The indicator was calculated as the difference (time units) between the heuristic
duration and the CPM duration as a percentage of the CPM duration
Furthermore the performance of each heuristic relative to one another was assessed considering
the number of times each heuristic produces the shortest and longest schedules The number of
times producing the shortest duration was considered as a consistent measure of a heuristic
performance Based on the results of previous studies and given the variable nature of heuristics
a consistency rate of at least 60 is preferred Ideally heuristics with good performance will have
1) a lower percentage of deviation in the project duration 2) a higher percentage of times
producing the shortest duration (not optimum) and 3) a lower percentage of times producing the
largest duration
The performance of the heuristics was also evaluated in terms of the Resource Factor (RF) and
Resource Utilization (RU) of the networks To this end networks were classified according to the
RF and RU values shown in Table 3 These values have been commonly used in literature to
compare heuristicsrsquo performance (Ulusoy 1989) One network with a RF = 075 was excluded
from the analysis because its RU (134) did not fit the last range considered in the classification
system (10 ndash 125) As a result the final sample of this study consists of 141 networks
Table 3 Networksrsquo Classification by RF and RU
N =
14
1
RF = 025
N = 30
RU 010 - 025 N = 12
RU 025 - 050 N = 18
RF = 075
N = 111
RU 025 - 050 N = 38
RU 050 - 075 N = 35
RU 075 - 100 N = 18
RU 100 - 125 N = 20
57
Statistical Analysis
The sample size of this study was selected to guarantee a power greater than 090 in the non-
parametric tests performed The power represents the probability of rejecting the Null Hypothesis
(H0) when the Alternative Hypothesis (Ha) is true The higher the power the lower the chance of
having a Type Error II (Failing to reject Ho when it is false) and the better the probability of finding
a difference between the two groups of analysis (Elliot 2007)
Due to the similarity in the results among the heuristics the Sign Test was performed to ascertain
whether the Enhanced LF heuristic produced better results than a specific existing heuristic when
there was not a tie in the results Each time the test compared the differences in the increase of
project duration obtained by the Enhanced LF heuristic and an existing heuristic (microd) (see Equation
3) By excluding the number of times both heuristics produce the same result (tie) it is possible to
statistically determine whether the Enhanced LF heuristic outperformed a specific existing
heuristic
microd = micro₁ minus micro₂ (Eq 3)
In Equation 3 microd is the difference in the average increase between the two paired heuristics micro₁ is
the mean of the average percentage increase of project duration above the CPM duration obtained
by an existing heuristic j and micro₂ is the mean of the average percentage increase of project duration
above the CPM duration obtained by the Enhanced LF heuristic
Positive differences will occur if the existing heuristic (j) produces higher deviations from the
CPM duration than the Enhanced LF heuristic Conversely negative differences will occur if the
existing heuristic (j) produces lower deviations from the CPM duration than the Enhanced LF
heuristic The difference (microd) will be equal to zero if both heuristics obtained the same results (tie)
The hypothesis being examined by the Sign test are
H0 The probability of a positive difference is equal to the probability of a negative
difference
Ha The probability of a positive difference is greater than the probability of a negative
difference
If the Alternative Hypothesis (Ha) is accepted (p le 005) it is more likely to find lower durations
with the Enhanced LF heuristic than with a specific existing heuristic when the two paired
heuristics do not find the same solution All the statistical tests were performed at a confidence
level α = 005
The Sign Test was applied because it is not possible to assume that the differences in the increase
of duration by the two heuristics analyzed each time have an approximately normal distribution
The results of the Anderson-Darling goodness of fit test indicated the data (microd) do not follow a
normal distribution (for all cases AD between 5 and 10 p le 005) Additionally as it is expected
in a paired-sample test the data are related to each other
58
Results
The heuristicsrsquo performance was first analyzed by considering all networks of the sample as a
single group ie networks with a RF equal to 025 and 075 (see Table 4) Table 5 shows the
results of the average percentage increase over the CPM duration after applying the eight existing
heuristics and the Enhanced LF in each of the 141 networks and the percentage of times each
heuristic produced the shortest and longest durations
Table 4 Networksrsquo Classification (N = 141)
N
= 1
41
RF = 025
N = 30
RU 010 - 025 N = 12
RU 025 - 050 N = 18
RF = 075
N = 111
RU 025 - 050 N = 38
RU 050 - 075 N = 35
RU 075 - 100 N = 18
RU 100 - 125 N = 20
Although the Enhanced LF heuristic produced the lowest average increase above the CPM duration
(112 ) there is not enough statistical evidence to conclude that it is significantly better than the
following three heuristics with the lowest average increase in the duration (ES+ID LS+ID and
LS+D+TF+ID) The slight difference in the average percentage increase among the top four
heuristics is because when the Enhanced LF did not produce the shortest duration it produced the
second shortest duration
Table 5 Results N = 141 RF = 025 and 075
Heuristic Average
Increase
Minimum
()
Maximum
()
Shortest
Duration
Longest
Duration
Enhanced LF 112 13 313 592 56
ES + ID 113 03 291 585 35
LS + ID 114 11 327 577 21
LS + D + TF + ID 114 11 327 563 35
LF + ID 117 03 327 472 63
Min TF + ID 121 16 327 415 155
Longest D + ID 123 16 327 437 218
EF + ID 125 11 313 268 268
Shortest D + ID 134 11 312 190 486
The heuristics that performed the worst were the Shortest Duration+ID followed by the EF+ID
They produced the largest deviations in the networks (134 and 125 respectively) Previous
studies also have found that the Shortest Duration+ID produced the worst results (Davis 1975)
The Sign Test results indicate that there is enough statistical evidence to conclude that the
Enhanced LF heuristic produced significantly lower deviations than the LF+ID Min TF+ID
Longest Duration + ID EF+ID and Shortest Duration+ID heuristics For all cases p-value = 0001
(see Table 6) Although there is not sufficient statistical evidence to ascertain that the Enhanced
59
LF outperformed the other top three heuristics the Enhanced LF produced lower durations
(positive differences microd) more frequently than the LS+D+TF+ID (43 vs 37) and the LS+ID (44 vs
40) when there was not a tie in the results When the Enhanced LF was compared with the ES+ID
the later produced one shorter schedule more than the former (40 vs 41)
Table 6 Sign Test Results N = 141 RF = 025 and 075
Comparison No Ties No Positive
Differencesa Z-value p-value
LF + ID
Enhanced
LF
69 50 - 318 0001
Longest D + ID 44 68 - 385 0001
Min TF + ID 47 69 - 443 0001
EF + ID 47 75 - 567 0001
Shortest D + ID 38 97 - 886 0001
LS + D + TF + ID 61 43 - 055 0288
LS + ID 57 44 - 032 0372
ES + ID 60 40 000 0500 a Number of times the Percentage Increase over the CPM of an existing heuristic was higher than
that obtained by the Enhanced LF
Tiebreaker Influence
Figure 3 shows a comparison of the percentage increase over the CPM duration and the number
of times a heuristic produced the shortest and longest schedules when different tiebreakers were
considered as second sort parameters of the LF and LS rules
Figure 3a Late Finish (LF) with different Tie
Breakers
Figure 3b Late Start (LF) with different Tie
Breakers
Figure 3 Influence of a Tiebreaker in the LS and LF rules (N = 141 RF = 025 and RF = 075)
As can be observed in Figure 3a the performance of the LF was better when it was combined with
the Priority Number (Pn) rather than with the activity ID or TF ie the average percentage increase
over the CPM duration was lower with the Pn (112) and shortest schedules were obtained more
frequently (592) Unlike the LF+ID and LF+Pn (Enhanced LF) the LF+TF did not generate
schedules with the longest duration
60
The Sign Test results indicate that the LF rule leads to better results when it is combined with the
Pn (p = 0001) than with the activity ID (p = 0187) Specifically the LF+Pn (Enhanced LF)
produced 28 shorter schedules more than the LF+ID when both heuristics did not get the same
results (ties = 69) Otherwise the Sign Test did not find enough statistical evidence to assert that
the Pn yields to a better performance than the TF when used as a tiebreaker of the LF (see Table
7 p = 0187) Noteworthy when there was not a tie in the results the LF+Pn (Enhanced LF)
produced 9 shorter schedules more than the LF+TF
Table 7 Sign Test Results (N =141 RF = 025 and RF = 075)
Comparison No Ties No Positive
Differences Z-value p-value
LF + TF Enhanced
LF
60 45a -088 0187
LF + ID 69 50a - 318 0001
LS + TF LS + D + TF +ID
130 6b - 0254
LS + ID 132 3b - 0254 a Number of times the Percentage Increase over the CPM of either the LF+TF and LF+ID was
higher than that obtained by the Enhanced LF
b Number of times the Percentage Increase over the CPM of either the LS+TF or LS+ID was higher
than that obtained by the LS+D+TF+ID
The LS rule produced almost the same results whether it is combined with the TF D or activity
ID (see Figure 3b) For all three instances the average percentage increase in the CPM duration
was about 114 This consistency can be corroborated by the number of times each pair of
heuristics obtained the same networksrsquo duration In the case of the LS+ID vs LS+D+TF+ID it
happened 132 times and in the case of LS+TF vs LS+D+TF+ID it occurred 130 times
Due to the similarity in the results the Sign Test did not find any significant difference between
the three tiebreakers used for the LS For all cases the p = 0254 (see Table 7) There is only a
slight difference in the number of times each LS heuristic produced the shortest and longest
schedules The LS+ID produced 577 shortest schedules meanwhile the other two LS rules
produced 563 schedules Unlike the LS+ID and LS+D+TF+ID the LS+TF did not generate
schedules with the longest duration
Classification by RF = 025
The sample networks were classified by RF equal to 025 (see Table 8) Table 9 shows the
summary of the average percentage increase over the CPM duration the percentage of times each
heuristic produced the shortest and longest duration for the 30 networks with RF = 025
The LS+D+TF+ID heuristic produced the lowest average increase above the CPM duration (45)
and the ES+ID produced the shortest schedules more frequently than any other heuristic (933)
Although the Enhanced LF and the LS+D+TF+ID heuristics found the shortest duration the same
number of times (900) the LS+D+TF+ID heuristic produced a lower increase in the project
duration (see Table 9) Overall the top four heuristics (LS+D+TF+ID ES+ID Enhanced LF and
61
LS+ID) 1) had a lower average percentage increase above the CPM duration 2) found the shortest
duration more frequently and 3) found the worst duration (longest duration) less frequently
Table 8 Networksrsquo Classification by RF = 025
N =
14
1
RF = 025
N = 30
RU 010 - 025 N = 12
RU 025 - 050 N = 18
RF = 075
N = 111
RU 025 - 050 N = 38
RU 050 - 075 N = 35
RU 075 - 100 N = 18
RU 100 - 125 N = 20
Table 9 Results RF = 025 and N = 30
Heuristic Average
Increase
Minimum
()
Maximum
()
Shortest
Duration
Longest
Duration
LS + D + TF + ID 45 04 118 900 00
ES + ID 46 04 125 933 33
Enhanced LF 46 04 146 900 67
LS + ID 47 04 139 867 00
LF + ID 50 04 146 733 100
Min TF + ID 52 04 153 733 167
Longest D + ID 52 04 132 633 200
EF + ID 53 14 132 600 267
Shortest D + ID 60 14 183 400 467
The heuristics that performed the worst were the Shortest Duration +ID (60) followed by the
EF+ID (53) Due to the high consistency of the results among the top heuristics (900) the
Sign Test only found evidence to indicate that the Enhanced LF heuristic produces significantly
lower deviations than the EF+ID and Shortest Duration +ID (see Table 10) Worthy of note the
Enhanced LF produced lower durations (positive differences microd) more frequently than the Longest
Duration +ID (9 vs 3) EF+ID (9 vs 1) LF+ID (6 vs 2) and Min TF+ID (7 vs 2) when there was
not a tie in the results When the Enhanced LF was compared with the ES+ID and LS+D+TF+ID
both heuristics produced one shorter schedule more than the Enhanced LF
Table 10 Sign Test Results RF = 025 and N = 30
Comparison No Ties No Positive
Differencesa p-value
LF + ID
Enhanced
LF
22 6 0145
Longest D + ID 18 9 0073
Min TF + ID 21 7 0090
EF + ID 20 9 0011
Shortest D + ID 14 15 0001
LS + D + TF + ID 25 2 0500
ES + ID 25 2 0500
62
LS + ID 24 3 0656 a Number of times the Percentage Increase over the CPM of an existing heuristic was higher than
that obtained by the Enhanced LF
Classification by Resource Utilization (RU)
Table 12 and Table 13 show a comparison of the percentage increase over the CPM duration and
the number of times each heuristic produced the shortest and longest schedules when 30 networks
with RF = 025 were classified according to the RU factor (see Table 11)
Table 11 Networksrsquo Classification by RF = 025 and RU
N =
141
RF = 025
N = 30
RU 010 - 025 N = 12
RU 025 - 050 N = 18
RF = 075
N = 111
RU 025 - 050 N = 38
RU 050 - 075 N = 35
RU 075 - 100 N = 18
RU 100 - 125 N = 20
When networks have a RU between 010 and 025 either the ES+TF+ID or ES+ID rules obtained
the best results Both heuristics produced the lowest average percentage increase above the CPM
duration (33) and found the shortest durations all the time (See Table 12) Although four
heuristics found the second-lowest deviation from the CPM duration (34) the Enhanced LF
heuristic obtained the highest number of shortest schedules (916) The heuristics that performed
worst were the Shortest Duration +ID (59) followed by the EF+ID (46) Worthy of note half
of the schedules obtained by the Shortest Duration +ID have the longest duration
Table 12 Networksrsquo Classification by RU between 010 and 025 (RF = 025 N = 30)
Heuristic Average Increase Shortest
Duration
Longest
Duration
ES + TF + ID 33 1000 00
ES + ID 33 1000 00
Enhanced LF 34 916 83
LF + ID 34 833 00
LS + ID 34 833 00
LS + D + TF + ID 34 833 00
Min TF + ID 37 750 00
Longest D + ID 39 666 166
EF + ID 46 583 166
Shortest D + ID 59 416 500
When networks have a RU between 025 and 050 the LS+D+TF+ID obtained the lowest average
percentage increase above the CPM duration (53) and the shortest schedules more frequently
(940) (See Table 13) Under this scenario the LS+D+TF+ID did not find any longest schedule
63
The Enhanced LF was the second heuristic with the highest number of times producing shortest
schedules (889) The heuristics that performed the worst were the Min TF+ID followed by the
Shortest Duration +ID (62) Despite the Min TF+ID produced a significant number of schedules
with the shortest duration (722) it obtained the highest average percentage increase in the
project duration In other words the Min TF+ID produced higher deviations from the CPM
duration than the other rules when it did not work
Table 13 Networksrsquo Classification by RU between 025 and 050 (RF = 025 N = 30)
Heuristic Average Increase Shortest Duration Longest Duration
LS + D + TF + ID 53 940 00
ES + TF + ID 54 833 00
Enhanced LF 55 889 56
ES + ID 56 833 56
LS + ID 56 833 00
EF + ID 58 611 278
LF + ID 60 667 167
Longest D + ID 60 611 222
Shortest D + ID 62 389 444
Min TF + ID 62 722 278
Classification by RF = 075
The sample networks were classified by a RF equal to 075 (see Table 14) Table 15 shows the
summary of the average percentage increase over the CPM duration the percentage of times each
heuristic produced the shortest and longest duration for the 111 networks of the sample with a
RF = 075
Table 14 Networksrsquo Classification by RF = 075
N =
141
RF = 025
N = 30
RU 010 - 025 N = 12
RU 025 - 050 N = 18
RF = 075
N = 111
RU 025 - 050 N = 38
RU 050 - 075 N = 35
RU 075 - 100 N = 18
RU 100 - 125 N = 20
The Enhanced LF produced the lowest average increase above the CPM duration (128) and the
shortest schedules more frequently than any other heuristic (509) Overall the top three
heuristics (Enhanced LF LS+ID and ES+ID) 1) had a lower average percentage increase above
the CPM duration 2) found the shortest duration more frequently and 3) found the worst (longest)
duration less frequently (see Table 15) The heuristic that performed the worst was the Shortest
Duration +ID (152)
64
Table 15 Results N = 111 and RF = 075
Heuristic Average
Increase
Minimum
()
Maximum
()
Shortest
Duration
Longest
Duration
Enhanced LF 128 12 302 509 54
LS + ID 130 11 291 500 27
ES + ID 130 03 291 482 45
LS + D + TF + ID 130 11 291 473 45
LF + ID 134 03 302 402 71
Min TF + ID 138 12 291 330 152
Longest D + ID 141 12 323 384 214
EF + ID 143 11 312 188 268
Shortest D + ID 152 11 312 134 482
The influence of a tiebreaker in the LF and LS rules can be also noticed in Table 15 The Pn as a
tiebreaker of the LF leads to a lower average percentage increase in the project duration (128)
and a higher number of schedules with the shortest duration (509) than the activity ID as a
tiebreaker of the LF On the other hand the LS produced lower deviations from the CPM duration
and the shortest schedules more frequently when it was combined with the activity ID rather than
with the duration and total float
When networks have a RF equal to 075 the performance of the heuristics is not as consistent as
it is when networks have a RF equal to 025 When the RF = 075 the best heuristic (Enhanced
LF) found the shortest durations 509 of the time (see Table 15) When RF = 025 the best
heuristic (LS+D+TF+ID) found the shortest durations 900 of the time (see Table 9)
The Enhanced LF outperformed the LF+ID Min TF+ID Longest Duration +ID EF+ID and
Shortest Duration +ID heuristics For all cases the p-values were lower than 0001 (See Table 16)
The Sign Test did not find enough evidence to conclude that the Enhanced LF produces
significantly lower deviations than the LS andor ES heuristics (p gt 020) However the
Enhanced LF produced lower durations (positive differences -microd) more frequently than the
LS+D+TF+ID (41 vs 34) and LS+ID (41 vs 37) Otherwise the ES+ID and the Enhanced LF
produced the same number of shortest schedules (38)
Table 16 Sign Test Results N = 111 and RF = 075
Comparison No Ties No Positive
Differencesa Z-value p-value
LF + ID
Enhanced
LF
47 44 -287 0002
Longest D + ID 26 59 -347 0001
Min TF + ID 26 62 -412 0001
EF + ID 27 66 -512 0001
Shortest D + ID 24 82 -814 0001
LS + D + TF + ID 36 41 -069 0244
ES + ID 35 38 000 0546
LS + ID 33 41 -034 0367
65
Classification by Resource Utilization (RU)
Tables 18 - 20 show the percentage increase over the CPM duration and the number of times each
heuristic produced the shortest and longest schedules when the 111 networks with RF = 075 were
classified by RU (see Table 17) As stated by Davis 1975 the heuristic performance is affected by
the RU The greater the proportion of resource requirement per activity relative to the amount
available the greater the increase in the project duration after mitigating the resource supply-
demand problem
Table 17 Networksrsquo Classification by RF = 075 and RU
N =
14
1
RF = 025
N = 30
RU 010 - 025 N = 12
RU 025 - 050 N = 18
RF = 075
N = 111
RU 025 - 050 N = 38
RU 050 - 075 N = 35
RU 075 - 100 N = 18
RU 100 - 125 N = 20
When networks have a RU between 025 and 050 the ES+TF+ID produced the lowest average
percentage increase in the project duration (84) (See Table 18) The ES+TF+ID followed by
ES+ID produced the shortest schedules more frequently than any other rule (684 and 631
respectively) The LS+ID and LS+D+TF+ID produced the same number of schedules with the
shortest duration but the LS+ID produced a lower increase in the duration than the LS+D+TF+ID
The heuristics that performed the worst were the Shortest Duration +ID (107) followed by the
EF+ID (96)
Table 18 Networksrsquo Classification by RU between 025 and 050 (RF = 075 N= 38)
Heuristic Average Increase Shortest Duration Longest Duration
ES + TF + ID 84 684 00
LS + ID 85 526 26
LS + D + TF + ID 86 526 26
ES + ID 86 631 53
Enhanced LF 87 474 79
LF + ID 89 474 79
Min TF + ID 91 394 132
Longest D + ID 95 316 211
EF + ID 96 263 211
Shortest D + ID 107 184 500
When networks have a RU between 050 and 075 the Enhanced LF obtained the lowest average
percentage increase above the CPM duration (125) and the shortest schedules more frequently
(628) Under this scenario the Enhanced LF did not find any longest schedule (See Table 19)
The LS+ID was the second heuristic with the highest number of times producing shortest schedules
(514) The ES+TF+ID produced the second-lowest average increase in the duration (129) but
it only worked 371 of the time The ES+ID only worked 343 of the time for this scenario
66
with an average percentage increase above the CPM duration of 131 The heuristics that
performed the worst were the Shortest Duration +ID (159) followed by the EF+ID (146)
Table 19 Networksrsquo Classification by RU between 050 and 070 (RF = 075 N= 35)
Heuristic Average Increase Shortest Duration Longest Duration
Enhanced LF 125 628 00
ES + TF 129 371 00
LS + ID 131 514 00
ES + ID 131 343 28
LS + D + TF + ID 131 496 00
LF + ID 137 371 28
Min TF + ID 143 228 143
Longest D + ID 145 371 228
EF + ID 146 114 286
Shortest D + ID 159 86 514
When networks have a RU between 075 and 100 the heuristicsrsquo performance is poor ie the
consistency in the results for each heuristic was lower than 56 (See Table 20) More heuristics
should be tested under this scenario in order to identify a more efficient heuristic (percentage of
consistency of at least 60) The ES+TF+ID produced the shortest schedules more frequently
(555) than any other rule However it produced a higher average increase in the project duration
(147) than the ES+ID (144) The heuristics that performed the worst were the Shortest
Duration +ID (170) followed by the Min TF+ID (163)
Table 20 Networksrsquo Classification by RU between 075 and 100 (RF = 075 N= 18)
Heuristic Average Increase Shortest Duration Longest Duration
ES + ID 144 500 55
ES + TF + ID 147 555 00
Enhanced LF 148 333 55
LS + ID 150 333 55
LS + D + TF + ID 151 278 167
LF + ID 153 278 111
Longest D + ID 158 333 111
EF + ID 160 167 278
Min TF + ID 163 278 333
Shortest D + ID 170 55 500
When networks have a RU between 100 to 125 the LS+ID obtained the lowest average
percentage increase above the CPM duration (192) and the shortest schedules more frequently
(60) Additionally the LS+ID did not find any longest schedule (See Table 21) The ES+TF+ID
produced the same number of shortest schedules than the LS+ID (60) but the former produced
higher deviations from the CPM duration (197) than the LS+ID (192) Similarly the
Enhanced LF produced the same number of shortest schedules than the LS+D+TF+ID (55) but
the former produced higher deviations from the CPM duration (196) than the LS+ID (194)
Worthy of note the ES+ID only worked 45 of the time for this scenario with an average
67
percentage increase above the CPM duration of 198 The heuristics that performed the worst
were the Shortest Duration +ID (212) followed by the EF+ID (208)
Table 21 Networksrsquo Classification by RU between 100 and 125 (RF = 075 N= 20)
Heuristic Average Increase Shortest Duration Longest Duration
LS + ID 192 600 00
LS + D + TF + ID 194 550 00
LF + ID 195 450 50
Enhanced LF 196 550 100
ES + TF + ID 197 600 00
Min TF + ID 197 450 00
ES + ID 198 450 50
Longest D + ID 204 550 250
EF + ID 208 200 300
Shortest D + ID 212 200 400
Heuristics Selection
A matrix that classifies the performance of the heuristics was created based on the results obtained
in this study (see Table 22) The matrix was developed for networks with a SerialParallel Indicator
(I2) equal to 065 a Resource Strenght (RS) equal to 025 and a Network Complexity (NC) equal
to 15 (on average three successors per activity) Although the size of the network has been reported
as another influential parameter of heuristic performance it was not considered in the classification
system due to the fact that real construction projects have a significant number of activities that
are challenging to simulate and test by scholars (Boctor 1996 Zhan 1994) The two parameters
required to select a heuristic in the matrix are the Resource Factor (RF) and the Resource
Utilization factor (RU) These two resource measures can be easily simulated and tested Besides
they are calculated as a function of the number of total activities of the project
The matrix indicates the two heuristics with better performance for each of the scenarios
considered Given the variable nature of heuristics it is recommended to apply both options to
determine which one gives the best solution (shortest duration but not optimum) If the matrix is
empty it means that networks with the specified resource characteristics were not tested in this
study
The heuristic labeled as Option 1 is the one that produced the lowest increase in the project duration
and the shortest schedules more frequently The heuristic labeled as Option 2 is the second
heuristic which had the highest number of times producing the shortest schedules regardless of
the average increase in the project duration If there was a tie with respect to the number of times
producing the shortest duration (consistency rate) the heuristic that produced the lowest average
increase in the project duration was selected as Option 2 In real construction projects even one
day of difference in the completion time can significantly impact the budget
68
Table 22 Classification Matrix based on Heuristicsrsquo Performance
RU RF = 025 RF = 075
Option 1 Option 2 Option 1 Option 2
010 ndash 025 ES + TF + ID or ES + ID Enhanced LF - -
025 ndash 050 LS + D + TF + ID Enhanced LF ES + TF + ID ES + ID
050 ndash 075 - - Enhanced LF LS + IDa
075 ndash 100 - - ES + IDb ES + TF + IDb
100 ndash 125 - - LS + ID ES + TF + ID a Consistency rate ( Shortest Duration) lower than 50 b Consistency rate ( Shortest Duration) lower than 55
The LS has been reported as one of the heuristics that produces better results (lower deviations
from the CPM duration) by several authors However as shown in Table 17 the performance of
the LS is better and more consistent when the RF of the networks equals 025 and the RU ranges
from 025 to 050
Real construction projects have a significant amount of activities Therefore calculating the RU
and RF values for each activity can be time-consuming To overcome this issue practitioners could
rough estimate the degree of a project resource demand by randomly selecting 20 of the activities
to calculate these two resource parameters Table 23 shows the results obtained for two projects
after following this approach Although there is a slight difference in the RU rough estimate for
P2 (073) in comparison with the actual value (065) the estimated value (073) falls in the range
associated with the actual value (See Table 17)
Table 23 Rough Estimate of the RU and RF
Project
ID
No
Activities
No Type
Resources
RF RU
Rough Estimate Actual Rough Estimate Actual
1 49 3 077 075 112 105
2 73 2 077 075 073 065
As future research another heuristic that yields to more consistent results when the RF is equal to
075 and the RU ranges from 075 to 100 should be identified For this scenario the two heuristics
selected as Option 1 and Option 2 in the matrix (ES+ID and ES+TF+ID) produced the shortest
schedules only 55 of the time Heuristics with a higher consistency rate are preferred (at least
60) Similarly when the RU ranges from 050 to 075 the LS+ID (Option 2) only worked 50
of the time The same matrix should be developed but this time for networks with a RF equal to
050 and 1
Discussion
None of the heuristics produced the best results for all the 141 networks However the Enhanced
LF heuristic produced the shortest duration more frequently than any other heuristic (592) This
percentage is low but similar to some values obtained in previous studies For instance Davis
69
(1975) reported that the Min TF+ID heuristic found the shortest duration 60 of the times
followed by the LF+ID with a percentage of 46 The heuristic proposed by Boctor (1976) which
was the best among the other heuristics tested found the best solution 54 of the time Ulusoy
(1989) found that the WRUP and LF+ID obtained the best results for 75 of the time Otherwise
Boctor (1993) reported that only 30 of the times the best solution was found by a heuristic
In previous studies few authors have tested the performance of early CPM dates (ES and EF) as
major rules to sort activities The majority of them have focused on evaluating the efficacy of late
CPM dates such as the LS and LF In this study when evaluating the 141 networks (RF = 025 and
075) the ES+ID obtained the second-lowest average percentage increase over the CPM duration
(113) and produced the shortest schedules 585 of the times Moreover it was the only rule
that produced the lowest maximum percentage increase (291) and alongside the LF+ID
produced the lowest percentage increase over the CPM duration (03)
The results of this paper reinforce the statement that certain heuristics work better for certain type
of networks than for others Besides the LS+ID the Min TF+ID and the LF+ID have been reported
in the literature as the most effective heuristics minimizing the project duration (Kolish 1995
Ulusoy 1989 Davis 1975 Chen et al 2018) However in this study the performance of these
two heuristics (Min TF+ID and LF+ID) is poor in terms of the average percentage increase over
the CPM duration and the number of times producing the shortest and largest schedules (see Table
4) These opposing results emphasize the need for determining under which network and resource
characteristics heuristics produce better results A heuristic classification system will help
practitioners to decide which heuristic applies when mitigating the resource supply-demand
problem given the project characteristics
On the other hand the main parameter for sorting the activities significantly influences the
resulting schedule However if a tie exists the tiebreaker also influences the resulting schedule
Therefore schedulers should carefully select the tiebreaker of a heuristic not doing so may lead
to obtaining longer schedules if a tie exists The highest number of longest schedules was obtained
when the activity ID was considered as a tiebreaker of either the LS or LF
Future Research and Limitations
The eight existing heuristics tested in this study were selected based on the opportunity to apply
them using scheduling software However other heuristics such as the Resource Scheduling
Method (RSM) the Greatest Rank Positional Weight (GRPW) and the Weighted Resource
Utilization and Precedence (WRUP) should be tested under the same scenarios since they have
been reported in previous studies as priority rules with good performance
Additionally all heuristics were evaluated under a serial approach Given the differences between
the serial and parallel methods the heuristics should be tested under a parallel approach as well
This classification will provide practitioners the option of splittinginterrupting the work which
may be beneficial for some activities and may also reduce the project completion time
The matrix developed in this study is a point of departure for the development of a more complete
classification system for the industry The results of this study are limited to networks with I2=
70
065 RS = 025 NC = 150 and RF = 025 and 075 The classification system should be extended
so other common values of RF RS and NC can be included
Conclusion
This study proposed a new tiebreaker (Priority Number - Pn) that considers the duration and total
float of the activities The Pn enhanced the performance of the LF priority rule Lower deviations
from the CPM duration and a higher number of shortest schedules were obtained when the LF was
combined with Pn than when the LF was combined with the total float or activity ID The Enhanced
LF produced lower deviations than the LS when both heuristics did not get the same results This
study recommends using the Pn as a tiebreaker of the LF and either the duration or total float as a
tiebreaker of the LS
Overall the heuristics with good performance are LS Enhanced LF and ES The average increase
in the project duration obtained by these three rules compares favorably with the results obtained
by the other priority rules tested in this study The ES+ID and ES+TF have the potential of being
considered as one of the top heuristics since its performance is good and consistent for specific
project parameters Otherwise the Shortest Duration+ID and EF+ID heuristics are inappropriate
choices when attempting to minimize the project duration Both produced the largest deviations in
the networks for all the scenarios analyzed in this study
The heuristicsrsquo performance is more consistent (number of times producing the shortest schedules)
when the proportion of resource types required per activity is low (RF = 025) When the RF =
075 the rate of consistency is less than 60 This reinforces the fact that some rules may work
better for specific project characteristics than for others Therefore it is vital to identify under
which circumstances each one of the best heuristics produces good results
This study developed a matrix to help schedulers deciding which heuristic applies when mitigating
the resource supply-demand problem depending on the resource characteristics of a network (RF
and RU) Given the variable nature of heuristics the matrix indicates the two heuristics with better
performance for each of the scenarios considered As a best practice practitioners should perform
both heuristics and determine which one gives the best solution (shortest schedule) For real-life
purposes the decision of selecting a schedule with the shortest possible duration or an optimum
duration comes down to evaluating the viability of executing the schedule eg in terms of means
and methods or in terms of resource disruption
Data Availability Statement
Data generated by the authors can be found at Franco Duran (2019)
71
References
Abeyasinghe M C L Greenwood D J amp Johansen D E (January 01 2001) An efficient
method for scheduling construction projects with resource constraints International Journal of
Project Management DOIorg101016S0263-7863(00)00024-7
Alvarez-Valdes R and Tamarit JM (1989) Algoritmos heuristicos deterministas y aleatorios
en secuenciacion de proyectos con recursos limitados Questiio 13 173-191
Boctor F F (January 01 1993) Heuristics for scheduling projects with resource restrictions and
several resource-duration modes International Journal of Production Research 31 11 2547
DOIorg10108000207549308956882
Chen Z Demeulemeester E Bai D E amp Guo S (2018) Efficient priority rules for the
stochastic resource-constrained project scheduling problem European Journal of Operational
Research 270 3 957-967 DOIorg101016jejor201804025
Davis E W amp Patterson J H (April 01 1975) A Comparison of Heuristic and Optimum
Solutions in Resource-Constrained Project Scheduling Management Science 21 8 944-955
DOIorg101287mnsc218944
Demeulemeester E Vanhoucke M amp Herroelen W (January 01 2003) RanGen A Random
Network Generator for Activity-on-the-Node Networks Journal of Scheduling 6 1 17-38
DOIorg101023A1022283403119
Elliott A C amp Woodward W A (2007) Statistical analysis quick reference guidebook With
SPSS examples Thousand Oaks Calif Sage Publications DOIorg1041359781412985949
Gordon J H (January 01 1983) Heuristic methods in resource allocation International Journal
of Project Management 1 3 163-168 DOIorg1010160263-7863(83)90022-4
Franco Duran D Primavera P6 Schedules University Libraries Virginia
Tech DOIorg107294W4-5R6Z-D346
Kastor A amp Sirakoulis K (July 01 2009) The effectiveness of resource leveling tools for
Resource Constraint Project Scheduling Problem International Journal of Project
Management 27 5 493-500 DOIorg101016jijproman200808006
Kolisch R (1995) Project Scheduling under Resource Constraints - Efficient Heuristics for
Several Problem Classes Physical Heidelberg
Kolisch R (January 01 1996) Serial and parallel resource-constrained project scheduling
methods revisited Theory and computation European Journal of Operational Research 90 2
320-333 DOIorg1010160377-2217(95)00357-6
72
Marimuthu K Palaneeswaran E Benny R amp Ananthanarayanan K (July 15 2018) Resource
Unconstrained and Constrained Project Scheduling Problems and Practices in a Multi-project
Environment Advances in Civil Engineering 2018 DOIorg10115520189579273
Moder J J Phillips C R amp Davis E W (1983) Project Management with CPM PERT and
precedence diagramming (3rd ed ed) New York Van Nostrand Reinhold
Patterson J H (December 01 1973) Alternate methods of project scheduling with limited
resources Naval Research Logistics Quarterly 20 4 767-784
DOIorg101002nav3800200415
Patterson J H (March 01 1976) Project scheduling The effects of problem structure on heuristic
performance Naval Research Logistics Quarterly 23 1 95-123
DOIorg101002nav3800230110
Ulusoy G and Tzdamar L (1989) Heuristic performance and networkresource characteristics
in resource-constrained project scheduling Journal of the Operational Research Society 40 1145-
1152 DOIorg101057jors1989196
Zhan J (1994) Heuristics for scheduling resource-constrained projects in MPM
networks European Journal of Operational Research 76 1 192-205 DOIorg1010160377-
2217(94)90016-7
73
CHAPTER 4
Application of An Enhanced Resource-Constrained Critical Path Method (eRCPM) to
Non-progressed and Progressed Schedules
Abstract
The Resource-Constrained Critical Path Method (RCPM) is a method that identifies resource-
dependent activity relationships (links) when mitigating a resource-supply demand problem These
resource links allow the identification of a continuous critical path and the calculation of correct
float values Even though RCPM provides more reliable float values than traditional RCS
algorithms there are some shortcomings that must be addressed to enhance its capability and make
it more practical for real construction projects
This paper presents the application of an Enhanced RCPM (eRCPM) in non-progressed and
progressed resource-constrained schedules The eRCPM 1) performs three different serial-based
resource-constrained scheduling heuristics 2) keeps and removes specific resource links in a
progressed schedule before re-running eRCPM 3) selects a resource link configuration when
having many possible resource-driven activities and 4) selects a default schedule after evaluating
some schedule characteristics
Additionally an eRCPM system was developed and integrated with Primavera P6 The
development of the eRCPM computerized system allows the identification of a continuous critical
path in resource-constrained schedules in a practical way Besides construction professionals can
use these eRCPM schedules to perform delay analysis in scheduling software such as Primavera
P6
Keywords phantom float Primavera P6 resource overallocation resource-constrained
scheduling resource-depend activity relationships
Introduction
The baseline schedule is frequently used to track project performance Resources as a key
component of schedules must be also monitored to prevent or mitigate any extension on the project
completion time as a result of resource availability When the resource demand exceeds the supply
(overallocation) activities must be delayed until resources become available
Due to the projectsrsquo size and complexity schedulers use scheduling software such as Primavera
P6 or Microsoft Project to fix the resource conflicts of a schedule Even though the software solves
the overallocation problem applying Resource-Constrained Scheduling (RCS) algorithms the
results show incorrect total float values and a broken critical path This happens because
CPM+RCS calculations suggest that activities have float but this float does not exist ndash hence the
named Phantom Float (Franco-Duran and de la Garza 2019)
74
The Resource-Constrained Critical Path Method (RCPM) is a method that correctly calculates the
floats of activities and identifies a continuous critical path in resource-constrained schedules (Kim
and de la Garza 2003) The RCPM provides more reliable float values than traditional RCS
methods but there are some shortcomings that must be addressed to enhance its capability and
make it more practical for real construction projects This study tackles some of the flaws of the
RCPM which are described in the following section and illustrates the application of the
Enhanced RCPM (eRCPM) with two cases studies
RCPM Shortcomings
Priority Rules
The RCPM applies the Late Start (LS) heuristic Heuristics are problem-dependent so they are
likely to be better in some situations than in others Some priority rules may work well for a project
but may not work well when applied to a different project (Wiest 1963) Even if the Project
Completion Time (PCT) obtained by two or more heuristics is the same the sequence of the
activities may be different (Rivera and Duran 2004) Since each heuristic works differently and
produces different schedule outcomes the eRCPM incorporates 1) two additional heuristics (ES
and Enhanced LF) and 2) a criterion to evaluate the resulting schedules and selects one as a default
Removal of Resource Links
When the RCPM was developed the objective was to solve the issue of a broken critical path in a resource-
constrained schedule Hence Kim and de la Garza (2003) did not explore the application of the RCPM for
control purposes further ie the use of resource links when updating a schedule
The updates on a baseline schedule could change the priority order identified by the RCS heuristic
to schedule the activities when an over-allocation problem exists When re-applying the RCPM
the resource links identified before updating the project may no longer be required andor new
resource links can be identified because of the changes in the schedule The existing resource links
should be removed from the schedule because they were identified based on previous and different
conditions If the links are kept they constrain the schedule
In this regard the RCPM removes all existing resource links before re-running the method (Kim
and de la Garza 2003) The eRCPM removes only the resource links located right to the data date
each time a project is updated and the algorithm is re-applied The eRCPM keeps the resource
links located left to the data date because the project was already executed based on these activitiesrsquo
configurations
Selecting Resource-Driving Activities
One issue that arises when identifying activity resource relationships is having different possible
links configurations between activities (Kim 2003 Nisar 2013) This occurs when having many
current activities with many predecessors (see Figure 1) The difference between the different
schedules that can be generated is not only the number of resource links created but also the
number of critical activities
75
Figure 1 Multiple Schedule Alternatives Example taken from Nisar Yamamoto amp Suzuki (2013)
According to Nisar Yamamoto amp Suzuki (2013) the resource dependences should be created in
a way the total number of relationships is minimized without violating the resource constraints
The goal is to not increase the complexity of the network with a high number of resource links
The RCPM does not incorporate any criteria to identify resource-driving activities Instead the
algorithm creates all possible resource links configurations between the activities under
consideration (Kim and de la Garza 2003)
The eRCPM considers the number of resources and the duration of the activities as the main criteria
to determine a resource-driving activity These parameters were selected because they may affect
the PCT An activity that demands higher resources is more likely to delay a project This activity
may be delayed since other activities may need some of the resources of this activity Moreover
the longer the duration of the activity the greater the impact on the PCT
RCPM Prototype System
The RCPM prototype system developed by Kim and de la Garza in 2003 for Project Planner (P3)
does not work for Primavera P6 because P6 is built on a different platform than P3 At present
there is a lack of practical mechanisms to identify resource relationships in P6 project schedules
The eRCPM was integrated with Primavera P6 by developing a system that reads project
information from a P6 project performs the necessary eRCPM procedures and updates the P6
project with the corresponding resource relationships
Enhanced Resource-Constrained Critical Method (eRCPM)
This section explains each of the steps of the eRCPM (see Figure 1b) The eRCPM keeps the main
steps of the RCPM (see Figure 1a) but it incorporates more steps to address the above-mentioned
shortcomings
76
System Primavera Project Planner (P3) System Primavera P6
1 CPM
2 Serial-Based RCS
21 Forward Pass Heuristic
LS + D + TF + ID
211 Creating RLs
22 Finding
Unidentified RLs
23 Backward Pass
with RLs
3 Finding Alternative
Schedules
0 Removing all
Existing RLs
RCPM
Figure 1a RCPM Figure 1b Enhanced RCPM (eRCPM)
Figure 1 Outline of the RCPM and eRCPM
Step 0 KeepingRemoving Resource Links
The eRCPM checks the status of each activity to determine whether a Resource Link (RL) should
be removed from or kept on the schedule When having a progressed schedule with resource
relationships the RLs are kept in the schedule if 1) both activities (predecessor and successor) are
already completed and 2) the predecessor activity is completed and the successor activity is in
progress Otherwise the RLs are removed from the schedule if 1) the two activities (predecessor
and successor) have not started yet and 2) the predecessor activity is completed but the successor
activity has not started (see Figure 2)
Figure 2 Keeping and Removing Existing Resource Links before re-applying RCPM
77
Step 1 Critical Path Method (CPM)
The eRCPM performs the CPM to find the early and late dates and float values of each activity
If there is a resource overallocation problem the algorithm mitigates the resource-supply demand
problem by applying resource-constrained heuristics
Step 2 Serial-based RCS heuristics with Resource Links
The eRCPM performs three different heuristics to mitigate a resource supply-demand problem 1)
Late Start (LS) 2) Enhanced Late Finish (LF) and 3) Early Start (ES) These three heuristics were
incorporated into the algorithm because they produce better results in terms of extending the
project duration than other existing priority rules (Franco Duran and de la Garza 2020) The
heuristics are performed under a serial approach eg activities are sorted as a single group and
then scheduled one at a time
1 In the Late Start heuristic the priority is given to activities with the earliest values of Late
Start (LS) If there is a tie with respect to the LS the priority is given to the activity with
the least duration (D) If the tie persists the priority is given to the activity with the least
total float (TF) If the tie persists the priority is given to the activity with the smallest
activity number (ID)
2 In the Enhanced LF heuristic the priority is given to activities with the earliest values of
Late Finish (LF) If there is a tie with respect to the LF the priority is given to the activity
with the lowest Priority Number (Pn) The Priority Number which is a new tiebreaker that
can be incorporated with any rule is calculated based on the duration (119863119894) and total float
(119879119865119894) of each activity (see Equation 1) If there is a tie with respect to the Pn the tie is
broken by the smallest activity number (ID) (Franco Duran and de la Garza 2020)
119875119899 =
119863119894
119879119865119894
(Eq 1)
3 In the Earliest Start heuristic the priority is given to activities with the earliest values of
Early Start (ES) If there is a tie with respect to the ES the tie is broken by the smallest
activity number (ID)
Step 21 Forward Pass
Step 211 - Creating Resource Links During the performance of any of the three RCS heuristics
mentioned above if there are not enough resources to execute an activity the activity is delayed
until resources become available The resources causing the current activity delay are released
from other activity completion (Kim and de la Garza 2003) Like the RCPM the eRCPM creates
a resource link (relationship) between the postponed activity (successor) and the preceding activity
that shares the same resources (resource-driving activity)
Step 212 - Selecting Resource-Driving Activities The eRCPM considers three different cases to
identify the ldquoresource-driving activityrdquo for the delayed task when having multiple alternatives
78
Case I One Type of Resources
When having one type of resources the eRCPM selects as a resource-driving the activity with the
highest number of resources If there is a tie with respect to the number of resources the activity
with the longest duration is selected If the tie persists the activity with the smallest activity ID is
selected as a resource-driving activity
For example in Figure 3 Activity A7 is delayed because of resource unavailability (ten resources
would be needed but only eight are available) Either A4 or A11 can be the resource-driving
activity of A7 For this scenario the traditional RCPM creates two resource links one between A4
and A7 and another between A11 and A7 The eRCPM creates only one link between A4 and A7
because A4 requires a higher number of resources than A7 (R = 2 vs R = 1)
Figure 3 Example of Case I One Type of Resources
Case II Two Types of Resources and 1 Conflicting Resource
When having two types of resources and only one conflicting resource type the eRCPM selects
as a resource-driving activity the activity with the highest number of conflicting resources If there
is a tie with respect to the higher number of resources the activity with the longest duration is
selected If the tie persists the activity with the highest number of the other type of resource is
selected If the tie persists the activity with the smallest activity ID is selected
In Figure 4 Activity A11 was delayed because of the resource unavailability of R1 Activities A2
A4 and A10 are the potential resource-driving activities of A11 The traditional RCPM creates
three RLs one between A11and A2 another between A11 and A4 and another between A11 and
A10 The eRCPM creates only a link between A10 and A11 In this case although A10 and A4
have the same higher number of the conflicting resource (R1 = 3) and the same duration (D = 7
Days) A10 requires more resources type 2 (R2 =2) than A4 (R2 =0)
79
Figure 4 Example Case II Two Types of Resources and One Conflicting Resource
Case III 2 or more Conflict Resources
When having two or more types of resources and several conflicting resource types the eRCPM
algorithm selects as a resource-driving activity the activity with the highest average number of
conflicting resources If there is a tie with respect to the average number of conflicting resources
the activity with the longest duration is selected If the tie persists the activity with the smallest
activity ID is selected as a resource-driving
In Figure 5 Activity A11 was delayed because of the resource unavailability of R2 and R3
Activities A3 A7 and A8 are the potential resource-driving of A11 The traditional RCPM creates
three RLs one between A3 and A11 other between A7 and A11 and another between A8 and
A11 The eRCPM creates only one link between A8 and A11 In this case A8 has a higher average
number of the two conflicting resources than the other two activities
Figure 5 Example Case III Two or more Conflict Resources
80
Step 22 Finding Unidentified Resource Links
Like RCPM before performing the backward pass the eRCPM checks if non-critical activities
(non-zero total float) can fully use the float or if there is any resource constraint for the float period
(Kim and de la Garza 2003) If so an additional resource link is created between the conflicting
activities considering the three cases described above when having multiple possible resource-
driving activities
For example in Figure 7 when checking for unidentified RLs Activity A5 cannot be delayed
because otherwise an over-allocation arises with respect R2 (13 resources will be needed but only
ten are available) Activities A3 A8 and A9 are the potential resource-driving activities of A5
The traditional RCPM creates three RLs one between A5 and A3 other between A5 and A8 and
another between A5 and A9 The eRCPM creates only one link between A5 and A8 because A8
requires a higher amount of R2 than the other two activities
Figure 6 Example 1 Identification of additional Resource Links
In Figure 7 when checking for unidentified Activity A4 which has ldquoseven daysrdquo of float cannot
be delayed because otherwise an over-allocation arises with respect to R1 (11 resources will be
needed and there are only nine available) Activities A8 A9 and A11 are the potential resource-
driving activities of A4
Figure 7 Example 2 Identification of additional Resource Links
81
The traditional RCPM creates three RLs one between A4 - A8 other between A4 - A9 and another
between A4 -A11 The eRCPM creates only a link between A4 and A11 In this case although
A11 and A9 have the same higher number of resources the duration of A11 (D = 7 Days) is longer
than A9 (D = 4 Days)
Step 23 Backward Pass
Once all resource links are identified the eRCPM performs the CPM backward pass considering
both the technological and resource relationships By considering both types of relationships a
continuous critical path can be identified in a resource-constrained schedule
Step 3 Alternative Schedule
Like RCPM the eRCPM finds alternative schedules by looking for activities that can be scheduled
during a different period without breaching all the relationships
Step 4 Selecting a Schedule
Since the eRCPM performs three different RCS heuristics (LS Enhanced LF and ES) the
algorithm selects as a default schedule the one with the shortest duration If there is a tie between
the schedules with respect to the PCT the schedule with the smallest resource moment value (Mx)
is selected
The Minimum Moment (Mx) was chosen as a criterion to select a resulting resource-constrained
schedule because it is a good measure of resource utilization A lower value indicates a better
resource allocation eg a resource profile closer to a rectangular shape The moment of the daily
resource demands about the horizontal axis of a projectrsquos resource histogram (Mx) is calculated as
shown in Equation 2 (Harris 1978) Where 119910119894 represents the daily resource utilization When
having multiple types of resources in a schedule Mx is calculated for each resource profile and
then compared with the values of the other schedules The schedule with the highest number of
resource profiles with the lowest Mx is selected as a default schedule
119872119909 =
1
2sum 119910119894
2
119899
119894=1
(Eq 2)
For example the two schedules show in Figures 8a and 8b (LS-based and ES-based respectively)
have the same PCT (19 days) but different resource profiles Since the Mx of the resource profile
of the LS-based schedule is lower (1970) than the that of the ES-based schedule (200) the eRCPM
selects as default the LS-based schedule The resource profile of this schedule is closer to a
rectangular shape than that of the ES-based schedule and therefore it has better resource allocation
82
a LS-based Schedule b ES-based Schedule
Figure 8 Resource Profiles Calculation of Mx
If there is a tie with respect to the Mx the schedule with the lowest number of critical activities
(TF = 0) is selected as a default If the tie persists the schedule with the highest average of free
float is selected as a default The float values (TF and FF) were selected as parameters to select a
resource-constrained schedule because 1) having a schedule with less critical activities decrease
the probability of delaying the project completion time and 2) having a schedule with a higher
average time of free float gives more flexibility for delaying some activities without affecting the
start time of the successor activities
Finally if there is still a tie between the three resulting schedules (LS Enhanced LF and ES
based) the eRCPM selects the LS-based schedule as a default If the tie is between the Enhanced
LF and ES-based schedules the eRCPM selects as the default the Enhanced LF-based schedule
Enhanced RCPM (eRCPM) System
The eRCPM system was developed and integrated with Primavera P6 using the Primavera P6rsquos
API (Application Program Interface) The eRCPM prototype system handles smart relationships
multiple calendars holydays and exceptions multiple types of resources and progressed
schedules Specifically the system 1) exports a specific P6 project in an XML format 2) reads and
stores the project information from the XML file 3) performs the Enhanced RCPM 4) updates
the XML file by adding the identified resource relationships and 5) imports the file again into P6
Then the updated schedule appears in the userrsquos P6 database
The updated P6 schedule has already the resource relationships incorporated into the schedule
thus the user should only re-run CPM in P6 (schedule) to obtain the earlylate dates and float
values Primaverarsquos users can identify the resource links that were added to the schedule adding a
user-defined field created by the eRCPM system called ldquoRL Successorsrdquo The user-defined fields
are custom fields that P6 users can create to track specific project information The eRCPM system
also creates another user-defined field called ldquoPFrdquo which shows the phantom float each activity
had before adding the resource links into the schedule Finally if after comparing all three resulting
schedules (LS Enhanced LF and ES based) the program selects as default the LF-based schedule
83
P6 users can add another user-defined field called ldquoPNrdquo This column shows the Priority Number
used for each activity when applying the Enhanced LF heuristic
Primavera P6
API
P6 Database
User
Data Input
Export Project (XML)
Read XML File
Primavera
P6
Performs
Enhanced RCPM
Update XML FileImport XML File
Java Program
Figure 9 Enhanced RCPM System
eRCPM Application
This section presents the application of the eRCPM to a non-progressed (Case Study No1) and a
progressed (Case Study No2) resource-constrained schedule The eRCPM was performed by 1)
hand and the resulting schedules were drawn in fenced bar charts and 2) using the eRCPM System
For each case study the three schedules obtained after applying each heuristic (LS Enhanced LF
and ES) by hand and by the eRCPM system are shown and then compared to illustrate the process
the eRCPM follows to select a default schedule
Case Study No1 Non-Progressed Schedule
The case study schedule No1 consists of nine activities with only finish-to-start (FS) relationships
a seven-workday calendar with no holidays and exceptions and one type of resource (R) The
maximum availability of resource type R is six Figure 10 shows the network of the schedule and
Figure 11a the CPM fenced bar chart The CPM results indicated a project duration of 14 days
(Project Completion Time (PCT) Oct 20 2019) with activities C G and I as critical The eRCPM
was applied to mitigate the over-allocation problem occurring during days 7 to 11 (see Figure 11b)
Figure 10 Case Study No Project Network
84
Figure 11a CPM Fenced Bar Chart Figure 11b eRCPM Fenced Bar Chart (LS-based)
Figure 11 Case Study No1
Figure 11b shows the resulting LS-based schedule drawn in a fenced bar chart so the identified
RLs can be easily observed The PCT was extended by five days (from 14 days to 19 days) after
mitigating the resource supply-demand problem with the LS heuristic (PCT Oct 25 2019) The
sequence of the activities changed and thus the critical path Now activities C B A F D and H
are critical
Figure 12 shows the output of the program after performing the LS heuristic as part of the eRCPM
For each activity the program displays the duration early and late CPM dates (EST EFT LST
and LFT) total float (TF) free float (FF) and Phantom Float (PF) values The program also shows
the resource links identified during the application of the eRCPM For each activity either the
predecessors or successors (resource-driving activities) can be displayed As can be observed in
Figure 11 before adding the resource links into the schedule (C - B B - A A - F and F - D) four
activities had PF This means that based on traditional RCS calculations activities A B C and F
have float However this float does not exist because it cannot be used by activities due to resource
constraints
Figure 12 eRCPM Program Output (LS-based)
The eRCPM system creates resource links in P6 as Finish-to-Start relationships without lag (FS =
0) These new relationships can be identified in a P6 Project by adding the user-defined column
called ldquoRL Successorsrdquo This column indicates the successor resource-driving activity of the
85
activity being considered For example in Figure 13 a new link between activity A and F was
added to the schedule Activities D and E were already successors activities of activity A before
performing eRCPM (Technological Relationships) The eRCPM also creates a user-defined field
called ldquoPFrdquo to display the phantom float values of each activity before adding the resource links
into the schedule Once the user opens the file and runs the project P6 updates the early and late
CPM dates (EST EFT LST and LFT) as well as the float values (FF TF) of each activity As a
result a continuous critical path can be identified in the P6 resource-constrained schedule The
resulting values match the ones obtained by the eRCPM system (see Figures 12 and 13)
Figure 13 eRCPM Schedule in P6 (LS- based)
Figure 14 shows the resulting Enhanced LF-based schedule drawn in a fenced bar chart The PCT
was extended by five days (from 14 days to 17 days) after mitigating the resource supply-demand
problem with the Enhanced LF heuristic (PCT Oct 23 2019) Unlike the LS-based schedule only
three resource links were identified after applying the Enhanced LF heuristic and only four
activities are critical (B C G and I)
Figure 14 eRCPM Fenced Bar Chart (Enhanced LF-based)
Figure 15 shows the output of the program after performing the Enhanced LF heuristic as part of
the eRCPM Before adding the resource links into the schedule (B-C C-A and F-A) two activities
had PF (B and F)
86
Figure 15 eRCPM Program Output (Enhanced LF-based)
Figure 16 shows the updated project in P6 In addition to the two user-defined fields mentioned
before (RL Successors and PF) P6 users can add another user-defined column called ldquoPnrdquo This
column shows the Priority Number values used by the eRCPM to perform the Enhanced LF
heuristic The Pn values are only added to the P6 file when the default schedule selected by the
eRCPM system is the one obtained by this heuristic (Enhanced LF) After re-scheduling the
project the values displayed by P6 match with the ones obtained by the system and a continuous
critical path can be identified in the P6 resource-constrained schedule (see Figures 15 and 16)
Figure 16 eRCPM (Enhanced LF) P6 Schedule
Figure 17 shows the resulting ES-based schedule drawn in a fenced bar chart The PCT was
extended by five days (from 14 days to 19 days) after mitigating the resource supply-demand
problem with the ES heuristic (PCT Oct 25 2019) Even though the ES and LS-based schedules
have the same completion time (Oct 25 2019) the sequence of the activities differs and thus the
RLs and critical path In the ES-based schedule five RLs were identified and activities A B C
G and I are critical
87
Figure 17 eRCPM Fenced Bar Chart (ES-based)
Figure 18 shows the output of the program after performing the ES heuristic as part of the eRCPM
Before adding the resource links into the schedule four activities had phantom float (A B E and
F) Although this number of activities is the same as the number obtained in the LS-based schedule
the PF float values are higher in the ES-based schedule
Figure 18 eRCPM Program Output (ES-based)
Figure 19 shows the updated project in P6 After re-scheduling the project the values displayed
by P6 match the ones obtained by the eRCPM system and a continuous critical path can be
identified in the P6 resource-constrained schedule (see Figures 18 and 19)
88
Figure 19 eRCPM P6 Schedule (ES-based)
In summary the eRCPM system selects the LF-based schedule as default and updates the P6
project based on this heuristic output This schedule is selected because it has the shortest PCT
(Oct 23 2019) among the other two schedules (LS and ES-based) The LS and ES-based schedules
have the same PCT (Oct 25 2019) but due to the priority rules of each heuristic the sequence of
the activities differs and so the resource profile the RLs and the critical path
If the user wants to select a schedule among these two (LS and ES-based) the next parameter to
compare (after the project duration) is the Minimum Momentum (Mx) value of the resource profile
In this regard the Mx of the LS-based schedule is lower (197) than that of the ES-based (200)
This means the resource allocation of the LS-based schedule is better than that of the ES-based
(The resource profile is closer to a rectangular shape) So if a schedule with a finish date of Oct
25 is desired then it is advisable to select the LS-based schedule Figure 20 shows the results of
the comparison performed by the eRCPM system when selecting the default schedule
Figure 20 Summary Output of the eRCPM System
Case Study No 2 Progressed Schedule
The case study schedule No 2 consists of nine activities with two types of precedence relationships
(FS and SS) two types of resources (R1 and R2) and two different calendars Calendar 1 has
seven workdays per week and Calendar 2 has five workdays per week Both calendars have two
days of exceptions (non-working days) October 23rd and November 1st The maximum number of
resources available per day for R1 is six and R2 is seven Figure 21 shows the network of the
schedule and Figure 22a the CPM fenced bar chart
89
Figure 21 Case Study No 2 Network
The CPM results indicated a project duration of 23 days with activities A C I J and K as critical
As shown in Figure 22a there is an over-allocation problem for R1 during days 9 to 11 for R2
during days 10 to 11 The eRCPM was applied to mitigate this supply-demand problem After
applying the three heuristics the eRCPM system selected as default the LF-based schedule As
shown in Figure 22b after solving the resource overallocation problem the PCT was extended by
one day with activities B D E G H and K as critical Additionally five resource links were
incorporated in the schedule (B-D C-G E-G F-G and H-K) This schedule was used as a baseline
to update the project
Figure 22a CPM Fenced Bar Chart Figure 22b eRCPM Fenced Bar Chart (LF-based)
Figure 22 Fenced Bar Chart
The baseline schedule was updated at the end of week 1 (Oct 13 2019) Activities A B and D
have been completed and activity C is still in progress (see Figure 23) The resource link between
activities B and D was kept into the schedule because it is located left to the data date After
removing the resource links located right to the data date (C ndash G E ndash G F ndash G and H ndash K) the
CPM results indicate a project duration of 23 days with activities C I J and K as critical
Additionally there is an over-allocation problem during days 14 to 17 for R1 The eRCPM was
re-applied to mitigate the resource supply-demand problem in this progressed schedule
90
Figure 23 Fenced Bar Chart Schedule Updates
Figure 24 shows the resulting LS-based schedule drawn in a fenced bar chart The PCT was
extended by two days (from 23 days to 25 days) after mitigating the resource supply-demand
problem with the LS heuristic (PCT Oct 31 2019) The sequence of the activities changed and
thus the critical path and the RLs that were identified before the update Now activities G E F
H and K are critical
Figure 24 eRCPM Fenced Bar Chart (Late Start-based)
Figure 25 shows the output of the program after performing the LS heuristic as part of the eRCPM
Since this is a progressed schedule before re-running the method the program identifies and
displays the resources links that are kept in and removed from the schedule based on the Data Date
(DD) of the project As a reminder the RLs located left to the DD are kept in and the RLs located
right to the DD are removed from the schedule With this activity configuration the eRCPM is re-
applied and the system displays the new RLs identified during this process As can be observed in
Figure 25 before adding the RLs into the schedule (G - E G - F E - H and H - K) four activities
had PF (E F G and H) Most of the new RLs are different from the ones removed from the
schedule before re-running the eRCPM This highlights the importance of removing previous RLs
since they may constrain the schedule
91
Figure 25 eRCPM Program Output (LS-based)
Figure 26 shows the updated project in P6 After re-scheduling the project the values displayed
by P6 match the ones obtained by the eRCPM system and a continuous critical path can be
identified in the P6 resource-constrained schedule (see Figures 25 and 26)
Figure 26 eRCPM P6 Schedule (LS-based)
Figure 27 shows the resulting Enhanced LF-based schedule drawn in a fenced bar chart Like the
LS-based schedule the PCT was extended by two days (from 23 days to 25 days) after mitigating
the resource supply-demand problem with the Enhanced LF heuristic (PCT Oct 25 2019) Even
92
though the LS and LF-based schedules have the same finish date (Oct 25 2019) the sequence of
the activities differs and thus the RLs and critical path In the Enhanced LF-based schedule five
RLs were identified and activities C E H and K are critical
Figure 27 eRCPM (Enhanced Late Finish) Fenced Bar Chart
Figure 28 shows the output of the program after performing the Enhanced LF heuristic as part of
the eRCPM Before adding the resource links into the schedule five activities had PF (C E F G
and H) Since the sequence of the activities changed the RLs identified after re-applying the
eRCPM are different from the ones the schedule had before the update and which were removed
before re-running the method
Figure 28 eRCPM (Enhanced LF) Program Output
Figure 29 shows the updated project in P6 After re-scheduling the project the values displayed
by P6 match the ones obtained by the eRCPM system and a continuous critical path can be
identified in the P6 resource-constrained schedule (see Figures 28 and 29)
93
Figure 29 eRCPM (Enhanced LF) P6 Schedule
Figure 30 shows the resulting ES-based schedule drawn in a fenced bar chart The PCT was
extended by six days (from 23 days to 29 days) after mitigating the resource supply-demand
problem with the ES heuristic (PCT Nov 4 2019) In this schedule activities C E I J and K are
critical
Figure 30 eRCPM Fenced Bar Chart (Early Start-based)
Figure 31 shows the output of the program after performing the ES heuristic as part of the eRCPM
Before adding the resource links into the schedule (C - E F - G E - I H - K) five activities had
PF (C E F G and H)
94
Figure 31 eRCPM (ES Sort) Program Output
Figure 32 shows the updated project in P6 After re-scheduling the project the values displayed
by P6 match the ones obtained by the eRCPM system and a continuous critical path can be
identified in the P6 resource-constrained schedule (see Figures 31 and 32)
Figure 32 eRCPM (ES Sort) P6 Schedule
In summary the eRCPM system selects the Enhanced LF-based schedule as default and updates
the P6 project based on this heuristic output This schedule was selected by the system because
95
even though the LF and LS-based schedules have the same finish date (Oct 31 2019) the
Enhanced LF-based schedule has lower values of Mx for the two types of resources (1198721199091 = 189
1198721199092 = 645) than that of the LS-based schedule (1198721199091 = 216 1198721199092 = 665) Since this a progressed
schedule the Mx is calculated after the data date
Worthy of note after the data date the Enhanced LF-based schedule has a fewer number of critical
activities than the LS-based schedule (4 vs 5) but a higher number of RLs (5 vs 4) The Enhanced
LF-based was selected as a default because due to the sequence of the activities the resource
allocation is better than that of the LS-based schedule Figure 33 shows the results of the
comparison performed by the eRCPM system when selecting the default schedule
Figure 33 Summary Output of the eRCPM System
Future Research and Limitations
Due to the nature of each heuristic schedulers and project managers should expect to obtain
different resource-constrained schedules The eRCPM performs three different heuristics under a
serial approach - activities are sorted as a single group and then schedule one at a time The
incorporation of another well-known RCS method such as the parallel method in the algorithm
will provide schedulers more flexibility selecting the schedule that better meets the project
requirements and conditions Under the parallel approach the activity sequence is determined and
updated at the start of a specific period (Moder et al 1983)
Otherwise the three parameters defined in the eRCPM to identify resource-driving activities when
having several concurrent activities with several predecessor activities were not incorporated in
the eRCPM system So additional work should be carried out to add these criteria to the system
Additionally a dynamic scenario must be further explored when determining if the total float
values of noncritical activities can be used during the whole period (identification of additional
resource links) This scenario occurs when two or more activities are analyzed at once instead of
just one When using the available float of only one activity an overallocation problem may not
exist However if two or more activities with float are delayed at the same time an overallocation
may exist and resource links must be added to the schedule
For example in Figure 34 if activity A9 is delayed more than five days there is not an over-
allocation but if A8 is delayed more than seven days at the same time than A9 an overallocation
problem arises regarding R1 (ten resources would be needed and there are only nine available)
The scenario is the same with any possible combination of the non-critical activities (A9 A8 A11)
being scheduled in parallel on day 17 In order to determine if additional RLs should be added into
the schedule as a result of the changes made this study recommends re-applying the eRCPM each
time an activity is delayed
96
Figure 34 Dynamic scenario for identifying resource links
Conclusions
Traditional Resource-Constrained Scheduling techniques fail to provide correct float values and a
continuous critical path in resource-constrained schedules The lack of resource relationships in a
resource-constrained schedule leads to the calculation of wrong late startfinish dates and to the
creation of non-existing floats (phantom float) Therefore all activities must be considered as
influential in the project completion time
Primavera P6 a scheduling software frequently used by the construction industry is not equipped
to identify and create resource links when performing an RCS technique This paper presents the
application of an Enhanced Resource Critical Path Method (eRCPM) in non-progressed and
progressed resource-constrained schedules which was integrated with Primavera P6
The development of the eRCPM computerized system allows the removal of phantom float and
identification of a continuous critical path in P6 resource-constrained schedules The eRCPM
addresses the fact the activity sequence of a resource-constrained schedule may change after a
progress update The eRCPM system incorporates functionality to keep and remove specific
resource relationships of a progressed schedule This functionally allows the application of the
Time Impact Analysis (TIA) methodology for the evaluation of delays Since this is a
contemporaneous analysis each time a delay is inserted into the schedule specific resource
relationships will be kept removed and identified
Additionally the incorporation of three different heuristics into the eRCPM provides more
alternative and flexible schedules that could meet better project requirements Moreover the
system selects as default the schedule with a shorter duration or with better resource allocation
97
References
Franco-Duran D M amp de la Garza J M (July 01 2019) Phantom float in commercial
scheduling software Automation in Construction 103 291-299
DOIorg101016jautcon201903014
Franco-Duran D M amp de la Garza J M (November 01 2019) Review of Resource-Constrained
Scheduling Algorithms Journal of Construction Engineering and Management 145 11)
DOIorg101061(ASCE)CO1943-78620001698
Franco-Duran D M amp de la Garza J M (February 12 2020) Performance of Resource-
Constrained Scheduling Heuristics Journal of Construction Engineering and Management 146
(4) pp 1-12 DOIorg101061(ASCE)CO1943-78620001804
Harris R B 1978 Precedence and Arrow Networking Techniques for Construction Hoboken
NJ Wiley
Kim K and de la Garza J M (2003) A New Approach to Resource-Constrained Scheduling
Fourth Joint International Symposium on Information Technology in Civil Engineering November
15-16 2003 | Nashville Tennessee United States DOIorg10106140704(2003)48
Kim K and de la Garza J M (2003) Phantom Float Journal of Construction Engineering and
Management 129 5 507 DOIorg101061(ASCE)0733-9364(2003)1295(507)
KPMG (2017) Make it or Break it Remaining governance people and technology in the
construction industry Global Construction Survey 2017 Sl KPMG
Moder J J Phillips C R amp Davis E W (1983) Project Management with CPM PERT and precedence
diagramming (3rd ed ed) New York Van Nostrand Reinhold
Nisar S A Yamamoto Koshi amp Suzuki K (January 01 2013) Resource-dependent Critical
Path Method for Identifying the Critical Path and the ldquoReal Floatsrdquo in Resource-Constrained
Project Scheduling Construction and Management special Issue Construction Management
Committee Japan Society of Civil Engineers 69 4 97-107
Rivera F A amp Duran A (January 01 2004) Critical clouds and critical sets in resource-
constrained projects International Journal of Project Management 22 6 489-497
DOIorg101016jijproman200311004
Wiest J D (1964) Some Properties of Schedules for Large Projects with Limited Resources
Operation Research 12(3) 395-418 DOIorg101287opre123395
98
CONCLUSION
RCS methodologies solve the resource conflicts but create phantom float in the schedules ndash a float
that does not really exist After testing Primavera P6 versions (P6 v832 and P6 v161) the
software still creates phantom float in resource-constrained schedules because it does not apply
any algorithm to remove it The software correctly determines the activitiesrsquo earliest dates that
satisfy the resource limitations but they calculate total float based on a ldquoTime Contextrdquo (LF ndash EF
andor LS ndash ES) ignoring the presence of resource constraints Hence the floats calculated by the
software cannot be trusted or used as traditional definitions suggest ie the amount of time an
activity can be delayed without affecting the project completion time
Professionals should recognize the presence of phantom float in resource-constrained schedules
because it may lead them to make decisions based on unreliable schedules Non-critical activities
may be considered resource critical if they fail to release the resources needed by a critical activity
on time The actual float values may be shorter than calculated during RCS or may be altogether
non-existent This makes impossible the identification of the critical path and thus the anticipation
of the impact of a delaying event in the project completion time
In the last years several algorithms have been developed to identify the critical path in resource-
constrained schedules Most of the algorithms identify resource dependences but some of them
still create phantom float in a schedule because they do not identify all the necessary resource
links Some algorithms also create unnecessary resource relationships andor remove technological
relationships from the schedule Furthermore most of the algorithms do not provide a mechanism
or criterion to select a resource links configuration among multiple alternatives and neither to select
a schedule when having multiple options Finally none of the algorithms consider the dynamic
feature of resource dependences
This study tackled the flaws of the Resource Critical Path Method (RCPM) regarding the removal
of resource links selection of resource-driving activities selection of a default schedule when
having alternative schedules and the lack of a prototype system for Primavera P6
Contributions to the Body of Knowledge
This study has contributed to the body of knowledge by improving an RCS related scheduling
technique so it can be more practical for real construction projects
The Enhanced RCPM (eRCPM) addresses the fact the activity sequence of a resource-constrained
schedule may change after a progress update and the eRCPM system incorporates functionality to
keep and remove specific resource relationships of a progressed schedule This functionally allows
the application of the Time Impact Analysis (TIA) methodology for the evaluation of delays Since
this is a contemporaneous analysis each time a delay is inserted into the schedule specific resource
relationships will be kept removed and identified Additionally the incorporation of three
different heuristics into the eRCPM provides more alternative and flexible schedules that could
meet better project requirements Moreover the system selects as default the schedule with the
shortest duration or with better resource allocation Other major contributions are as follows
99
Objective No 1
Chapter 3
A new tiebreaker (Priority Number) that enhances the performance of the LF heuristic The
results show that the Priority Number as a tiebreaker of the Late Finish leads to obtain
schedules with lower deviations from the CPM duration and a higher number of shortest
schedules than with traditional tiebreakers
A classification system that indicates the two heuristics with the best performance for
specific resource network characteristics This classification will help practitioners to
decide which heuristic applies when mitigating the resource supply-demand problem given
the project characteristics
142 different schedules created in Primavera P6 v161 are available for use to evaluate and
classify the performance of Resource-Constrained Scheduling (RCS) heuristics
Objective No 2
Chapter 2
Recommendations on the RCS-related methods that can be used by industry professionals
A system to guide practitioners in the selection process of an RCS-related algorithm based
on their common features (heuristic) constraints (removal of logic links) and project
characteristics (resources and calendars)
Chapter 4
An Enhanced RCPM (eRCPM) that can be applied for delay analysis
Objective No 3
Chapter 4
An eRCPM computerized system that removes phantom float and identifies a continuous
critical path in P6 resource-constrained schedules The prototype system handles smart
relationships multiple calendars holidays ad exceptions multiple types of resources and
progressed schedules
100
Future Research
Objective No 1 (Chapter 3)
RCS Heuristics
The eight existing heuristics tested in this study were selected based on the opportunity to
apply them using scheduling software However other heuristics such as the Resource
Scheduling Method (RSM) the Greatest Rank Positional Weight (GRPW) and the
Weighted Resource Utilization and Precedence (WRUP) should be tested under the same
scenarios since they have been reported in previous studies as priority rules with good
performance
All heuristics were evaluated under a serial approach Given the differences between the
serial and parallel methods the heuristics should be tested under a parallel approach as
well This classification will provide practitioners the option of splittinginterrupting the
work which may be beneficial for some activities and may also reduce the project
completion time
The matrix developed in this study to classify heuristicsrsquo performance is a point of
departure for the development of a more complete classification system for the industry
The results of this study are limited to networks with I2= 065 RS = 025 NC = 150 and
RF = 025 and 075 Therefore the classification system should be extended so other
common values of RF RS and NC can be included
Objective No 2 (Chapter 4)
Enhanced RCPM (eRCPM)
The eRCPM performs three different heuristics under a serial approach - activities are
sorted as a single group and then scheduled one at a time The incorporation of another
well-known RCS method such as the parallel method in the algorithm will provide
schedulers more flexibility selecting the schedule that better meets the project requirements
and conditions
A dynamic scenario must be further explored when determining if the total float values of
noncritical activities can be used during the whole period (identification of additional
resource links) This scenario occurs when two or more activities are analyzed at once
instead of just one When using the available float of only one activity an overallocation
problem may not exist However if two or more activities with float are delayed at the
same time an overallocation may exist and resource links must be added to the schedule
101
Objective No 3 (Chapter 4)
Enhanced RCPM System
The three parameters defined in the eRCPM to identify resource-driving activities when
having several concurrent activities with several predecessor activities were not
incorporated in the eRCPM system Additional work should be carried out to add these
criteria to the system
102
REFERENCES
Abeyasinghe M C L Greenwood D J amp Johansen D E (2001) An efficient method for
scheduling construction projects with resource constraints International Journal of Project
Management 19(1) 29-45 DOIorg101016S0263-7863(00)00024-7
Baki M A (1998) CPM scheduling and its use in todays construction industry Project Management
Journal 29(1) 7ndash9 Retrieved from httpswwwpmiorglearninglibrarycritical-path-method-
scheduling-construction-industry-2069 (Accessed December 6 2018)
Bowers J A (1995) Criticality in Resource-Constrained Networks Journal of the Operational
Research Soc 46 80-91 DOIorg101057jors19959
Braimah N (2013) Construction Delay Analysis TechniquesmdashA Review of Application Issues
and Improvement Needs Buildings 3 506-531 DOI103390buildings3030506
Davis E W amp Patterson J H (April 01 1975) A Comparison of Heuristic and Optimum Solutions in
Resource-Constrained Project Scheduling Management Science 21 8 944-955
de la Garza J M and Franco-Duran D M (2017 December 20) CPM Benefits in Estimating Bidding
Reported in Survey (B Buckley Ed) Retrieved from Engineering News-Record
httpswwwenrcomarticles43666-cpm-benefits-in-estimating-bidding-reported-in-survey (Accessed December 6 2018)
Fondahl J W (1991) The Development of the Construction Engineer Past Progress and Future
Problems Journal of Construction Engineering and Management 117(3) 380-392
DOIorg101061(ASCE)0733-9364(1991)1173(380)
Franco-Duran D M amp de la Garza J M (July 01 2019) Phantom float in commercial
scheduling software Automation in Construction 103 291-299
DOIorg101016jautcon201903014
Franco-Duran D Primavera P6 Schedules University Libraries Virginia
Tech DOIorg107294W4-5R6Z-D346
Franco-Duran D M amp de la Garza J M (November 01 2019) Review of Resource-Constrained
Scheduling Algorithms Journal of Construction Engineering and Management 145 11)
DOIorg101061(ASCE)CO1943-78620001698
Franco-Duran D M amp de la Garza J M (February 12 2020) Performance of Resource-
Constrained Scheduling Heuristics Journal of Construction Engineering and Management 146
(4) pp 1-12 DOIorg101061(ASCE)CO1943-78620001804
Ibbs W amp Nguyen L D (2007) Schedule Analysis under the Effect of Resource
Allocation Journal of Construction Engineering and Management 133 2 131-138
DOIorg101061(ASCE)0733-9364(2007)1332(131)
103
Kastor A amp Sirakoulis K (2009) The effectiveness of resource leveling tools for Resource
Constraint Project Scheduling Problem International Journal of Project Management 27(5)
493-500 DOIorg101016jijproman200808006
Kim K amp de la Garza J M (2003) Phantom Float Journal of Construction Engineering and
Management 129 (5) 507-517 DOIorg101061(ASCE)0733-9364(2003)1295(507)
Lu M amp Li H (2003) Resource-Activity Critical-Path Method for Construction Planning
Journal of Construction Engineering and Management 129(4) 412-420
DOIorg101061(ASCE)0733-9364(2003)1294(412)
Nisar S A Yamamoto Koshi amp Suzuki K (2013) Resource-Dependent Critical Path Method
for Identifying the Critical Path and the ldquoReal Floatsrdquo in Resource-Constrained Project
Scheduling Journal of Japan Society of Civil Engineers 69(4) 97-107
DOIorg102208jscejcm69I_97
Pantouvakis JP amp Manoliadis OG (2006) A practical approach to resource-constrained project
scheduling Operational Research An International Journal 6(3) 299-309
DOIorg101007BF02941258
Raz T amp Marshall B (1996) Effect of resource constraints on float calculations in project
networks International Journal of Project Management 14(4) 241-248 DOIorg1010160263-
7863(95)00090-9
Rivera F A amp Duran A (2004) Critical clouds and critical sets in resource-constrained
projects International Journal of Project Management 22(6) 489-497
DOIorg101016jijproman200311004
Ulusoy G and Ozdamar L (1989) Heuristic performance and networkresource characteristics
in resource-constrained project scheduling Journal of the Operational Research Society 40
1145-1152 DOIorg101057jors1989196
Wiest J D (1964) Some Properties of Schedules for Large Projects with Limited Resources
Operation Research 12(3) 395-418 DOIorg101287opre123395
Woodworth B M and Shanahan S (1988) Identifying the critical sequence in a resource-
constrained project International Journal of Project Management 6(2) 89-96
DOIorg1010160263-7863(88)90030-0