an enhanced secure deep learning algorithm for fraud
TRANSCRIPT

Research ArticleAn Enhanced Secure Deep Learning Algorithm for FraudDetection in Wireless Communication
Sumaya Sanober ,1 Izhar Alam ,2 Sagar Pande ,2 Farrukh Arslan ,3
Kantilal Pitambar Rane ,4 Bhupesh Kumar Singh ,5 Aditya Khamparia ,6
and Mohammad Shabaz 5,7
1Computer Science and Engineering, Prince Sattam Bin Abdul Aziz University, Saudi Arabia Wadi Aldwassir2Computer Science and Engineering, Lovely Professional University, Punjab, India3School of Electrical and Computer Engineering, Purdue University, USA4KCEs COEM JALGAON, India5Arba Minch University, Ethiopia6Babasaheb Bhimrao Ambedkar University, Lucknow, India7Department of Computer Science Engineering, Chitkara University, India
Correspondence should be addressed to Sumaya Sanober; [email protected], Sagar Pande; [email protected],and Mohammad Shabaz; [email protected]
Received 9 July 2021; Revised 20 July 2021; Accepted 26 July 2021; Published 15 August 2021
Academic Editor: VIMAL SHANMUGANATHAN
Copyright © 2021 Sumaya Sanober et al. This is an open access article distributed under the Creative Commons AttributionLicense, which permits unrestricted use, distribution, and reproduction in any medium, provided the original work isproperly cited.
In today’s era of technology, especially in the Internet commerce and banking, the transactions done by the Mastercards have beenincreasing rapidly. The card becomes the highly useable equipment for Internet shopping. Such demanding and inflation ratecauses a considerable damage and enhancement in fraud cases also. It is very much necessary to stop the fraud transactionsbecause it impacts on financial conditions over time the anomaly detection is having some important application to detect thefraud detection. A novel framework which integrates Spark with a deep learning approach is proposed in this work. This workalso implements different machine learning techniques for detection of fraudulent like random forest, SVM, logistic regression,decision tree, and KNN. Comparative analysis is done by using various parameters. More than 96% accuracy was obtained forboth training and testing datasets. The existing system like Cardwatch, web service-based fraud detection, needs labelled data forboth genuine and fraudulent transactions. New frauds cannot be found in these existing techniques. The dataset which is usedcontains transaction made by credit cards in September 2013 by cardholders of Europe. The dataset contains the transactionsoccurred in 2 days, in which there are 492 fraud transactions out of 284,807 which is 0.172% of all transaction.
1. Introduction
Credit card fraud might be a significant issue which requirespayment card as Mastercard as illegal supply of money intransactions. Fraud is illegal because of getting funds andgoods. The objective of such unlawful transaction might beurging items without paying and also obtain an unauthorizedfund from an account. Identifying such fraud might be atroublesome and must risk the company as well as businessorganizations. Within the world of Fraud Detection System(FDS) [1], investigators are not prepared to examine each
transactions. Here, the Fraud Detection System monitors allof the authorized transactions and alerts the foremost dis-trustful one. Investigator verifies these alerts and also pro-vides FDS with responses in case the transaction wasauthorized and fraudulent. Verifying all of the alerts eachday might be a time intensive and dear process. Hence, inves-tigator is in a place to confirm just a number of alerts eachday. The rest of the transactions stay unchecked until clientidentifies them and reports them to be a fraud. Also, the tech-niques employed for fraud, and consequently, the cardholderpaying behavior changes over time. This particular alteration
HindawiWireless Communications and Mobile ComputingVolume 2021, Article ID 6079582, 14 pageshttps://doi.org/10.1155/2021/6079582

in Mastercard transaction is called as idea drift [1, 2].Thus, usually, it is hard to notice the Mastercard fraud.Machine learning is taken into consideration collectivelyof the foremost profitable method for fraud identification.Classification is used by it and also regression strategy forknowing fraud in Mastercard. The machine learning algo-rithms are split into 2 kinds, supervised [3] along withunsupervised [4] learning algorithm. Supervised learningalgorithm uses labeled transactions for instructing the clas-sifier whereas unsupervised mastering algorithm uses coe-val’s analysis that groups customers in line with theprofile of theirs and identifies fraud supported clientsspending behavior.
Many learning algorithms are offered for fraud detectionin Mastercard that features neural networks, logistic regres-sion (LR), Naive Bayes (NB), Support Vector Machines(SVM), decision tree (DT), and K-nearest neighbors (KNN)as well as random forest (RF). This paper examines the func-tionality of above algorithms supported the ability of theirs toclassify whether the transaction was authorized, and fraudu-lent next compares them. The comparison is created utilizingperformance measure accuracy, precision, and specificity.The end result proved that random forest algorithm showedimproved precision and accuracy than some other methods.Further the obtained accuracy was improved by using deepAutoencoder.
The following are the main contributions in this paper:
(i) Novel deep learning framework is implementedusing Spark for financial fraudulent detections
(ii) Comparative analysis is performed with proposeddeep architecture using various machine learningalgorithms
(iii) Performance factors like accuracy, specificity, andprecision are used for comparing their perfor-mance measures
(iv) The importance of feature selection techniques isdiscussed and explored with five differenttechniques
(v) A stacked-based novel approach for feature selec-tion is proposed
(vi) Comparative analysis is performed with proposeddeep architecture using various machine learningalgorithms
(vii) Novel deep learning framework is implementedusing Spark for financial fraudulent detections
(viii) Performance factors like accuracy, specificity, andprecision are used for comparing their perfor-mance measures
The paper is organized as follows: review of the relatedpapers has been done in the literature review section, andnext section proposed the methodology where discussionon the dataset is provided along with its description. Furthersection is of result analysis where comparison of all the algo-
rithms is done by using the performance factor. The experi-ment is performed on a system having the configuration of8 gigabytes of RAM, Intel i5 8th generation quad-core pro-cessor with 1.6GHz clock speed. In the last section, the con-clusion and future scope are explained.
2. Literature Survey
Various papers were reviewed and are discussed as follows.Altiti [1] states that the fast evolution of technology all
around the world is more often using cards as compared tocash in their day to day life. The Mastercard becomes thehighly useable equipment for Internet shopping. Thisincrease in use causes a considerable damage and fraud casesalso. It is very much necessary to stop the fraud transactionsbecause it impacts on financial conditions over time theanomaly detection is having some important application todetect the fraud detection. This paper is mainly focused onchecking if the transaction is legal or fraud. They presentmodels like “Bidirectional Long short-term memory(BiLSTM)” and “Bidirectional Gated recurrent unit(BiGRU).” They also apply deep learning and MachineLearning algorithms. But their model shows much betterresults than the machine learning classifiers which is91.37% score.
Makki et al. [2] describe that in today’s era of technologyespecially in the Internet commerce and banking, the trans-actions by the Mastercards have been increasing rapidly.The Mastercard becomes the highly useable equipment forInternet shopping. This increase in use causes a considerabledamage and fraud cases also. It is very much necessary tostop the fraud transactions because it impacts on financialconditions over time the anomaly detection is having someimportant application to detect the fraud detection. Thepaper mainly focused on the solution that tackles the imbal-ance problem of classification they explore the solution forfraud detection using machine learning algorithms. They alsofind the summarized results and weakness that they get usingcredit card fraud labeled dataset. They give us the conclusionthat the imbalanced classification is ineffective when the dataare highly imbalanced. In this paper, the authors found thatthe existing methods were costlier and show many falsealarms.
Ounacer et al. [3] state that in today’s era of technologyespecially in the Internet commerce and banking, the trans-actions by the Mastercards have been increasing rapidly.The Mastercard becomes the highly useable equipment forInternet shopping. This increase in use causes a considerabledamage and fraud cases also. It is very much necessary tostop the fraud transactions because it impacts on financialconditions over time the anomaly detection is having someimportant application to detect the fraud detection. Logisticregression, decision tree, SVM, and so on are someapproaches to detect anomalies. But these methods are lim-ited because they are supervised algorithms which are trainedby the labels to know whether the transactions are legitimateor not.
Benchaji et al. [4] state that in today’s era of technologyespecially in the Internet commerce and banking, the
2 Wireless Communications and Mobile Computing

transactions by theMastercards have been increasing rapidly.The Mastercard becomes the highly useable equipment forInternet shopping. This increase in use causes a consider-able damage and fraud cases also. It is very much neces-sary to stop the fraud transactions because it impacts onfinancial conditions over time the anomaly detection ishaving some important application to detect the frauddetection. The purpose of this paper is to enhance the per-formance of the classified instances in the imbalanceddataset for which they proposed the unsupervised sam-pling method based on the genetic algorithm and K-means clustering.
Dal Pozzolo et al. [5] describe that in today’s era oftechnology especially in the Internet commerce and bank-ing, the transactions by the Mastercards have beenincreasing rapidly. The Mastercard becomes the highlyuseable equipment for Internet shopping. This increasein use causes a considerable damage and fraud cases also.It is very much necessary to stop the fraud transactionsbecause it impacts on financial conditions over time theanomaly detection is having some important applicationto detect the fraud detection.
Zheng et al. [6] describe that with the increase of e-com-merce, transactions are also increasing in which some ofthem were fraud. To detect the fraud transaction, it is impor-tant to extract historical transaction records on the behaviorprofile of the users. To represent the BPs of the user, the Mar-kov chain model is popular. Whose transaction behaviors arestable, this will affect them. The Mastercard becomes thehighly useable equipment for Internet shopping. Thisincrease in use causes a considerable damage and fraud casesalso.
Venkata Suryanarayana et al. [7] address states in today’sera of technology especially in the Internet commerce andbanking, the transactions by the Mastercards have beenincreasing rapidly. The Mastercard becomes the highly use-able equipment for Internet shopping. This increase in usecauses a considerable damage and fraud cases also. It is verymuch necessary to stop the fraud transactions because itimpacts on financial conditions over time the anomaly detec-tion is having some important application to detect the frauddetection. This paper states the overall performance of LR,RF, and DT for charge card fraud detection. The 3 methodsare used for the dataset, and function is applied in the Rlanguage. The functionality of the methods is actually eval-uated for diverse variables grounded on awareness, speci-ficity, and reliability as well as error rate. The end resultdisplays of reliability for LR, RF, and DT classifier areactually 90.0, 95.5.3, and 94.3, respectively. The compara-tive results indicate that the random forest does much bet-ter compared to the logistic regression as well as decisiontree techniques.
Thennakoon et al. [8] state that in today’s era of technol-ogy especially in the Internet commerce and banking, thetransactions by the Mastercards have been increasing rap-idly. The Mastercard becomes the highly useable equip-ment for Internet shopping. This increase in use causes aconsiderable damage and fraud cases also. It is very muchnecessary to stop the fraud transactions because it impacts
on financial conditions over time the anomaly detection ishaving some important application to detect the frauddetection. Fraud transactions are one of the major finan-cial issues in the banks. There are 10 million transactionsthat are fraudulent out of 12 billion which can cause ahuge loss. So to analyze these, they have predicted thefraud transaction using isolation forest and local outlierfactor. They also calculated the no. of error and accuracyof both algorithms.
Shukur and Kurnaz [9] project that in today’s era of tech-nology especially in the Internet commerce and banking, thetransactions by the Mastercards have been increasing rap-idly. The Mastercard becomes the highly useable equip-ment for Internet shopping. This increase in use causes aconsiderable damage and fraud cases also. It is very muchnecessary to stop the fraud transactions because it impactson financial conditions over time the anomaly detection ishaving some important application to detect the frauddetection. Such issues can also be tackling with the helpof data science with the combination of machine learning.The main objective here is to find all the fraud transac-tions while increasing the accuracy. Mastercard fraudulentdetection is actually a sample of classification. With thisprocedure, centering on preprocessing datasets and analyz-ing in addition to the deployment of several anomalydetection algorithms like isolation forest algorithm as wellas local outlier factor on the PCA changed Mastercardtransaction information.
John and Naaz [10] describe that in today’s era oftechnology especially in the Internet commerce and bank-ing, the transactions by the Mastercards have beenincreasing rapidly. The Mastercard becomes the highlyuseable equipment for Internet shopping. This increasein use causes a considerable damage and fraud cases also.It is very much necessary to stop the fraud transactionsbecause it impacts on financial conditions over time theanomaly detection is having some important applicationto detect the fraud detection. Online transaction frauddetection may be the vast majority of challenging issuefor financial businesses and banks. So it is much crucialfor financial businesses and also banks to have highlyeffective fraud detection techniques to reduce the lossesof theirs as an outcome of these fee card fraud transac-tions. Different techniques are found by many researcherstill morning to be able to recognize these frauds at thesame time as to take down them. After the analysis ofthe dataset, the reliability is ninety-seven % by LOF andseventy-six % by IF.
Yu et al. [11] state that that in today’s era of technologyespecially in the Internet commerce and banking, thetransactions by the Mastercards have been increasing rap-idly. The Mastercard becomes the highly useable equip-ment for Internet shopping. This increase in use causes aconsiderable damage and fraud cases also. It is very muchnecessary to stop the fraud transactions because it impactson financial conditions over time the anomaly detection ishaving some important application to detect the frauddetection. This algorithm detects the frauds very quicklyresulting in the reduction of loss and risks.
3Wireless Communications and Mobile Computing

3. Methodology
3.1. Dataset Description. The datasets consist of card pur-chases made by European cardholders in September 2013.This dataset describes transactions that happened in 2 days,specifically where 492 frauds beyond 284,807 transactions.The dataset is highly unbalanced; most transactions accountfor 0.172 per cent of the beneficial group (frauds). Figure 1depicts the neural network architecture. The proposedframework is represented in Figure 2. Generalized block dia-gram is represented in Figure 3.
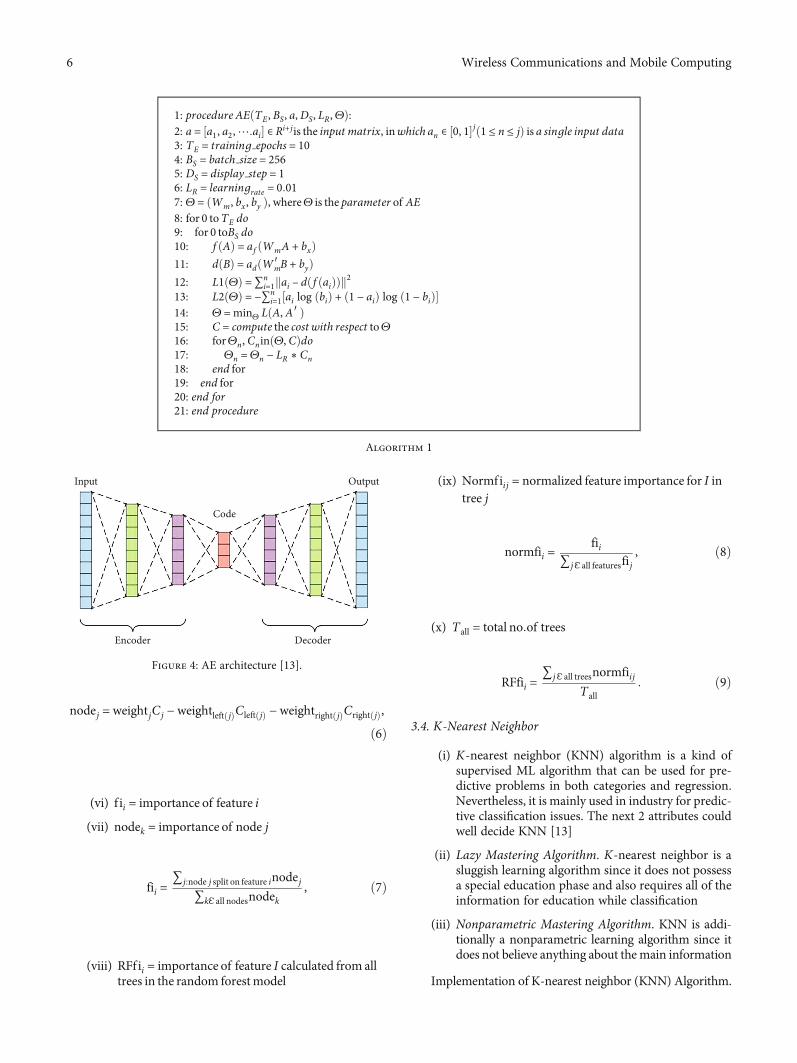
3.2. Autoencoder. AE is used to reduce input sizes to a smallerrepresentation. They will recreate it from the compresseddata if someone wants the original data. Having a similaralgorithm in machine learning, i.e., PCA, performs the sametask. AE is a class of unmonitored networks consisting of twomain networks: Encoders and Decoders. The standard Auto-encoder working can be seen in Figure 4. An AE neural net-work is an unsupervised learning algorithm which appliesback propagation and sets target values equal to the inputs;i.e., they are using BðiÞ = AðiÞ. Simply put, an AE is madeup of two parts, an encoder and a decoder. Taking intoaccount, a data model A with samples and f attributes, theencoder output B represents a reduced representation of A,and the decoder is optimized to recreate the original datasetA from the representation B of the encoder by minimizingthe gap between A and A0. The encoder is simply a functionf , which maps an input A to hidden representation B. Themethod is set out as [12].
B = f Að Þ = af WmA + bxð Þ, ð1Þ
where af is a nonlinear activation function and the AEmust do linear projection if it is an identity function. Theencoder is parameterized by a Wm matrix of weight and abias vector by bϵRn.
The decoder function d maps hidden representation Bback to a reconstruction A′ as follows:
A′ = d Bð Þ = ad Wm′ B + by� �
, ð2Þ
where ad is the activation function of the decoder, eitherthe identity (rendering linear reconstruction) or a sigmoid isusually used. Parameters of the decoder are by and matrixWm′ a bias vector. In this paper, we explore only the case ofbound weights where Wm′ =WT
m. Training an AE involvesfinding parameters like Θ = ðWm, bx, by Þ which minimizethe loss of reconstruction on the given dataset X and theobjective
Θ =minΘL A, A′� �
=minΘL A, d f Að Þð Þð Þ: ð3Þ
For linear reconstruction, the reconstruction loss (L1) is
generally from the squared error as follows:
L1 Θð Þ = 〠n
i=1ai – ai′
�� ��2 = 〠n
i=1ai – d f aið Þð Þk k2: ð4Þ
For nonlinear reconstruction, the reconstruction loss(L2) is generally from cross-entropy as follows:
L2 Θð Þ = −〠n
i=1ai log bið Þ + 1 − aið Þ log 1 − bið Þ½ �, ð5Þ
where aiϵA, ai′ϵA′, and biϵB.Apache Spark3 is a streaming-enabled Map-Reduce
implementation that distributes the computation automat-ically among the allocated resources and aggregates theresults on a distributed file system. Spark offers both adeep and machine learning database and a streaming data-base. A strong point for Spark is its ability in the sameframework to enable batch and stream analyses. The pro-posed framework is focused on Spark Streaming whichprocesses data streams in minilots that trail the order ofthe latency of the second. Although this may be consid-ered a downside in some streaming contexts, it is harmlessin quasi-real-time setting. The Spark module of the systemis written in Scala, a language that blends functional pro-gramming with object-oriented one. Scala runs atop JavaVM and is fully compliant with the Java libraries. Overall,in the process, Spark fulfills two tasks: aggregating
X11
X21
X22
X23
X24
X12
X13
X14
X15
X16
X17
X18
X19
X110
X111
X112
X31
X32
X113
X114
X115
Hidden layer(active nodes)
Output layer(active nodes)
Information flow
Input layer(passive nodes)
Figure 1: Neural network architecture [12].
4 Wireless Communications and Mobile Computing

historical transactions to perform design engineering andclassifying transactions online that return the estimatedrisk of fraud.
3.3. Random Forest (RF) Algorithm. RF is a supervised learn-ing algorithm, which can be used in addition to regression forboth groups. But it is mainly used for classification issues.Because a forest is made up of more plants and leaves, itmeans a much better forest. Likewise, the RF algorithmselects trees on knowledge samples and then collects the pre-diction from all of them and eventually selects the optimalalternative by voting. It is an ensemble strategy that is muchbetter than an individual choice tree because by averaging theend result it reduces the over fit.
The following is the implementation of random forest inscikit learn:
(i) nodej = importance of node j
(ii) weight j = weightage no:of sample reaching nodej
(iii) Cj = impurity of nodej
(iv) lef t j = child node from left split on nodej
(v) rightj = child node from right split on nodej
Spark streaming
Decisionfunction
Incomingtransaction
Deeplearning
algorithmSample dataset Customer
transactiondatabase
Computingalgorithm
output
Fraudulenttransaction
Alert the bankLegitimatetransaction
Allow transaction
Figure 2: System flow.
Dataset Data preprocessing
Feedback
Performance analysis Fraud alert Ranking of alert
Alert
Scoring rule
Figure 3: Proposed system block diagram.
5Wireless Communications and Mobile Computing
nodej = weightjCj −weightleft jð ÞCleft jð Þ −weightright jð ÞCright jð Þ,
ð6Þ
(vi) f ii = importance of feature i
(vii) nodek = importance of node j
fii =∑j:node j split on feature inodej
∑kℇ all nodesnodek, ð7Þ
(viii) RFf ii = importance of feature I calculated from alltrees in the random forestmodel
(ix) Normfiij = normalized feature importance for I intree j
normfii =fii
∑ jℇ all featuresfij, ð8Þ
(x) Tall = total no:of trees
RFfii =∑jℇ all treesnormfiij
Tall: ð9Þ
3.4. K-Nearest Neighbor
(i) K-nearest neighbor (KNN) algorithm is a kind ofsupervised ML algorithm that can be used for pre-dictive problems in both categories and regression.Nevertheless, it is mainly used in industry for predic-tive classification issues. The next 2 attributes couldwell decide KNN [13]
(ii) Lazy Mastering Algorithm. K-nearest neighbor is asluggish learning algorithm since it does not possessa special education phase and also requires all of theinformation for education while classification
(iii) Nonparametric Mastering Algorithm. KNN is addi-tionally a nonparametric learning algorithm since itdoes not believe anything about themain information
Implementation of K-nearest neighbor (KNN) Algorithm.
1: procedure AEðTE , BS, a,DS, LR,ΘÞ:2: a = ½a1, a2,⋯:ai� ∈ Ri+jis the input matrix, inwhich an ∈ ½0, 1�jð1 ≤ n ≤ jÞ is a single input data3: TE = training epochs = 104: BS = batch size = 2565: DS = display step = 16: LR = learningrate = 0:017: Θ = ðWm, bx , by Þ, whereΘ is the parameter of AE8: for 0 toTE do9: for 0 toBS do10: f ðAÞ = af ðWmA + bxÞ11: dðBÞ = adðWm′ B + byÞ12: L1ðΘÞ =∑n
i=1kai – dð f ðaiÞÞk213: L2ðΘÞ = −∑n
i=1½ai log ðbiÞ + ð1 − aiÞ log ð1 − biÞ�14: Θ =minΘ LðA, A′ Þ15: C = compute the cost with respect toΘ16: forΘn, CninðΘ, CÞdo17: Θn =Θn − LR ∗ Cn18: end for19: end for20: end for21: end procedure
Algorithm 1
Input Output
Code
Encoder Decoder
Figure 4: AE architecture [13].
6 Wireless Communications and Mobile Computing

We are able to know its working with the aid of pur-suing steps:
Step 1. For applying some algorithm, we require dataset. So,throughout the initial stage of KNN, we should load theinstruction and evaluation data.
Step 2.Next, we have to select the importance of K , i.e., prob-ably the nearest data points. K could be any integer.
Step 3. For every stage within the test information do thefollowing:
(a) Measure the gap between the training specifics of eachrow and check with the help of the strategy: Euclidean,Manhattan, or even Hamming distance. The mostoften used method to compute distance is Euclidean
d p, qð Þ =ffiffiffiffiffiffiffiffiffiffiffiffiffiffiffiffiffiffiffiffiffiffiffiffi〠n
i=1pi − qið Þ2,
sð10Þ
(b) Now, dependent on the distance worth, sort them inascending order
(c) Next, the high K rows from the sorted array are to bechosen
(d) Now, it is going to assign a course to the test stagebased on many regular categories of these rows
Step 4. End.
3.5. Decision Tree Algorithm. The supervised learning algo-rithm contains decision tree. The general purpose of utilizingdecision tree is creating a training type that will utilize to pre-dict value or class of goal variables by mastering choice regu-lations inferred from prior data (training data). Thecomprehension amount of decision tree algorithm is verysimple in contrast to some other group algorithms [14].
Implementation of Decision Tree Algorithm:
3.5.1. Gini Index (GI). It is the title of the price featurewhich is utilized to assess the binary splits in the datasetand also works together with the categorical target variable“Failure” or “Success.” The higher the importance of GI,the higher will be the homogeneity. A great GI value iszero, and worst is 0.5 (for two class problem). Gini listfor a split may be estimated with the aid of the followingsteps [14]:
0
0
5000
10000
15000
Am
ount
20000
25000
25000 50000 75000 100000Time
125000 150000 175000
Class01
Figure 5: 2D scatter plot of distribution of all the cases.
7Wireless Communications and Mobile Computing

(i) For starters, compute Gini index for subnodes byutilizing the system p2 + q2 and that is theamount of the square of likelihood for failureand success
(ii) Then, compute Gini list for split using weighted Ginirating of every node of that particular split
Classification and Regression Tree (CART) algorithmemploys Gini technique to produce binary splits.
3.5.2. Split Index. A split is simply incorporating a charac-teristic in a value and the dataset. We are able to developa split in dataset with the assistance of the following 3parts:
(i) Calculating Gini Score. We have simply talked aboutthis particular component in the prior section
(ii) Splitting a Dataset. It might be described as sepa-rating a dataset into 2 lists of rows keeping indexof a characteristic along with a split worth of thatfeature. After getting the 2 groups, right and alsoremaining, from the dataset, we are able to com-pute the importance of split by utilizing Giniscore calculated in original part. Split value isgoing to decide where the team the attribute willreside
(iii) Evaluating Almost All Splits. Next component afterfinding Gini score as well as splitting dataset is
0
25000
50000
75000
100000
Tim
e
125000
150000
175000
0
–50000 0 50000 100000Time
150000 200000
5000
10000
15000
20000
Am
ount
25000
0 5000 10000 15000Amount
20000 25000
Class01
Figure 6: Plot of all instances.
8 Wireless Communications and Mobile Computing

definitely the analysis of all splits. For this particularpurpose, for starters, we should examine each valueconnected to each feature as being a candidate split.
Next, we have to discover the absolute best split byanalyzing the price of the split. The most effectivesplit would be used as a node in the decision tree
0.0–6 –4 –2 0 2
Histogram of feature: V16
Histogram of feature: V15
4 6 8
0.1
0.2
0.3
0.4
0.5
0.0–15 –10 –5 0 5 10 15
0.1
0.2
0.3
0.4
0.5
Histogram of feature: V17
0.0–30 –20 –10 0 10
0.1
0.2
0.3
0.4
0.5
0.6
Histogram of feature: V19
0.0–8 –6 –4 –2 0 2 4 6
0.1
0.2
0.3
0.4
0.5
0.6
Histogram of feature: V18
0.0–12.5 –10.0 –7.5 –5.0 –2.5 0.0 2.5 5.0
0.1
0.2
0.3
0.4
0.5
Figure 7: V15-V19 feature histogram.
9Wireless Communications and Mobile Computing

3.6. Logistic Regression (LR). LR is a supervised learning cat-egory algorithm used to predict the likelihood of anadjustable goal. The target dynamics, or maybe dependent
component, are dichotomous; meaning, there will be only2 possible courses. In simple words, the dependent ele-ment is binary in nature to get knowledge written as
0.0–40 –20 0 20 40
Histogram of feature: V20
0.2
0.4
0.6
0.8
0.0–30 –20 –10 0 2010 30
Histogram of feature: V21
Histogram of feature: V22
0.2
0.4
0.6
0.8
1.0
1.2
1.4
0.0–30–40 –20 –10 0 2010
Histogram of feature: V23
0.2
0.4
0.6
0.8
1.0
0.00–2 –1–3 1 2 3 54
Histogram of feature: V24
0.2
0.4
0.6
0.8
1.0
1.2
0.0–10 –5 0 5 10
0.1
0.2
0.3
0.4
0.5
Figure 8: V20-V24 feature histogram.
10 Wireless Communications and Mobile Computing

0.0–10.0 –7.5 –5.0 –2.5 0.0
Histogram of feature: V25
2.5 5.0 7.5
0.10.20.30.40.50.60.70.8
0.0–3 –2 –1 0 1 2 3
Histogram of feature: V26
0.2
0.4
0.6
0.8
1.0
1.2
1.4
0.0–20 –10 0 10 20 30
Histogram of feature: V27
0.5
1.0
1.5
2.0
0.0–10 0 10 20 30
Histogram of feature: V28
0.5
1.0
1.5
2.0
2.5
0.000
0.002
0.004
0.006
0.008
0.010
0.012
0.014
0 5000 10000 15000 20000 25000
Histogram of feature: V29
Figure 9: Amount and V25-V28 feature histogram.
11Wireless Communications and Mobile Computing

theoretically one or even zero. Mathematically, PðY = 1Þ ispredicted as a characteristic of X by an LR algorithm. It isamong the simplest ML algorithms that could be used todetect spam, cancer detection, diabetes prediction, etc.,for various classification complications [14].
3.6.1. Types of LR. In general, LR suggests binary LR own-ing binary goal variables, but there could be 2 more typesof target variables which may be predicted by it. Basedupon those numbers of types, LR is split into the followingtypes:
(i) Binomial. In such a type of classification, a reliantvariable is going to have just 2 possible kinds bothone and zero
(ii) Multinomial. In such a type of category, dependentvariable should have three or maybe more potentialunordered styles or even the kinds getting no quan-titative significance
(iii) Ordinal. In such a type of category, dependent vari-able should have three or maybe more feasibleordered styles or even the kinds with a quantitativesignificance
3.6.2. LR Assumptions
(i) Before diving into the implementation of LR, weshould be conscious of the coming assumptionsabout the same
(ii) In case of binary logistic regression, the goal vari-ables should be binary constantly, and the desiredoutcome is represented by the aspect level one
(iii) Right now, there should not be some multicoli-nearity within the product; this means the inde-pendent variables should be outside of oneanother
(iv) We need to have significant variables in the model ofours
(v) We must select a big sample size for LR
3.7. Support Vector Machine. In 1960s, SVMs were firstreleased, but eventually, they have enhanced in 1990.SVMs have the unique way of theirs of setup as com-pared to various other machine learning algorithms.Recently, they are incredibly well known due to theircapability to deal with a couple of continuous and cate-gorical variables [15].
3.7.1. Working of SVM. An SVM unit is simply a representa-tion of various courses in a hyperplane in space that is multi-dimensional. The hyperplane would be created within aniterative fashion by Support Vector Machine; therefore, themistake could be lessened. The objective of Support VectorMachine is dividing the datasets into martial arts classes tolocate an optimum marginal hyperplane.
The following are important ideas in SVM:
(i) Support Vectors. Data points what are nearest to thehyperplane is called SVs. Separating line would beidentified with the aid of these data points
(ii) Hyperplane. It is a choice plane or maybe room thatis split between a pair of items having various classes
(iii) Margin. It might be described as the gap between 2lines on the closet information points of variouscourses. It may be estimated as the perpendiculardistance out of the series on the assistance vectors.Huge margin is viewed as an excellent margin, andtiny margin is as a terrible margin
The primary objective of SVM is dividing the datasetsinto classes which can be achieved inside the next 2 steps asfollows:
(i) First, SVM is going to generate hyperplanes itera-tively that segregates the classes in most effective way
(ii) Next, it is going to choose the hyperplane which sep-arates the classes properly
4. Experiment and Result Analysis
Several machine learning algorithms are analyzed for the per-formance measures in the credit card fraud detection dataset.Along with this, deep Autoencoder is implemented usingvarious training and testing split ratio. Majorly five coremachine learning algorithms, namely, RF, LR, KNN, DT,and SVM algorithm, are implemented. From Figure 5, it isclearly visible that there are frauds only on the transactionswhich have transaction amount approximately less than2500. Transactions which have transaction amount approxi-mately above 2500 have no fraud. As per with the time, the
Table 1: Machine learning comparison table on the basis ofperformance measures.
ClassifiersAccuracy
%Specificity
%Precision
%F1-score
%
Random forest 96.2 98.7 99.7 92
Logisticregression
94.7 97.9 99.6 91.7
SVM 93.8 98.4 78.2 80.2
Decision tree 90.8 91.2 91 86
KNN 94.2 97.1 41.0 50.6
Table 2: Deep learning evaluation for training dataset.
Traindata
Testdata
Traininstances
Trainfraudcases
% of trainfraudcases
Trainingaccuracy
Timeelapsed(sec)
90 10 256326 470 0.00183 0.959921 18.35
80 20 227845 417 0.00183 0.954843 17.36
70 30 199364 384 0.00193 0.957749 14.63
60 40 170884 360 0.00211 0.963300 12.54
50 50 142403 269 0.00189 0.953874 10.63
12 Wireless Communications and Mobile Computing

frauds in the transactions are evenly distributed throughouttime. Amount and time distribution can be seen inFigure 6. Feature distribution from 15 to 30 is depicted inFigures 7–9, respectively. Table 2 narrates the obtainedmachine learning results. Tables 2 and 3 provide the resultobtained by using Deep AE with various training and testingsplit ratio. Figures 10 and 11 depict fraud score distributionfor 50-50 and 60-40 split ratio, respectively. Accuracy, preci-sion, and specificity for all machine learning algorithms are
calculated as follows which is shown in Table 1:
TP = X, TN = Y , FP = P, FN =Q,
Accuracy =X + Y
X + Y + P +Q,
Precision =X
X + P,
Specificity =Y
Y + P,
F1 Score =2 ∗ Precision ∗ Recallð Þ
Precision + Recall:
ð11Þ
5. Conclusion
As in today’s era of technology, especially in the Internetcommerce and banking, the transactions by the Mastercardshave been increasing rapidly. The Mastercard becomes thehighly useable equipment for Internet shopping. Thisincrease in use causes a considerable damage and enhancesinflation rate of fraud cases also. It is very much necessaryto stop the fraud transactions because it impacts on financialconditions over time the anomaly detection is having someimportant application to detect the fraud detection. Thispaper has reviewed several algorithms to identify fraud incard transaction. Autoencoder is used to classify the alert asfraudulent or even authorized in spark environment. Next,it will aggregate every probability to discover alerts. Further,proposed model utilizes ranking approach where alert ispositioned based on priority. The model is able to resolvethe class imbalance. In today’s era, we just detect the fraudu-lent transaction, but we are not able to prevent it. Preventingfraud transaction dynamically is not easy, but it is possible.The system which proposed is design to detect fraud transac-tion, but in future by some advancement, it can became fraudprevention system.
Data Availability
The data shall be made available on request.
Conflicts of Interest
The authors declare that they have no conflicts of interest.
References
[1] O. Altiti, “Credit card fraud detection based on machine anddeep learning,” in 2020 11th International Conference on Infor-mation and Communication Systems (ICICS), pp. 204–208,Irbid, Jordan, 2020.
[2] S. Makki, Z. Assaghir, Y. Taher, R. Haque, M. S. Hacid, andH. Zeineddine, “An experimental study with imbalanced clas-sification approaches for credit card fraud detection,” IEEEAccess, vol. 7, pp. 93010–93022, 2019.
[3] S. Ounacer, H. A. El Bour, Y. Oubrahim, M. Y. Ghoumari, andM. Azzouazi, “Using Isolation Forest in anomaly detection: thecase of credit card transactions,” Periodicals of Engineering &Natural Sciences, vol. 6, no. 2, pp. 394–400, 2018.
00 50 100 150
Fraud score (mse)
Fraud score (mse) distribution for fraud cases.
200
5
10
15
20
25
30
35
Figure 10: Fraud score distribution for 50-50 split ratio.
00.0 2.5 5.0 7.5
Fraud score (mse)
Fraud score (mse) distribution for fraud cases.
20.0
2
4
6
8
10.0 12.5 15.0 17.5
Figure 11: Fraud score distribution for 60-40 split ratio.
Table 3: Deep learning evaluation for testing dataset.
Traindata
Testdata
Testinstances
Testfraudcases
% of testfraudcases
Testingaccuracy
Timeelapsed(sec)
90 10 28481 22 0.00077 0.923378 00.07
80 20 56962 75 0.00132 0.949008 00.13
70 30 85443 108 0.00126 0.939815 00.23
60 40 113923 132 0.00116 0.944843 00.32
50 50 142404 223 0.00157 0.965315 00.38
13Wireless Communications and Mobile Computing

[4] I. Benchaji, S. Douzi, and B. El Ouahidi, “Using genetic algo-rithm to improve classification of imbalanced datasets forcredit card fraud detection,” Lecture Notes in Networks & Sys-tems, vol. 66, pp. 220–229, 2019.
[5] A. Dal Pozzolo, G. Boracchi, O. Caelen, C. Alippi, andG. Bontempi, “Credit card fraud detection: a realistic modeling& a novel learning strategy,” IEEE Transactions on Neural Net-works & Learning Systems, vol. 29, no. 8, pp. 3784–3797, 2018.
[6] L. Zheng, G. Liu, C. Yan, and C. Jiang, “Transaction frauddetection based on total order relation & behavior diversity,”IEEE Transactions on Computational Social Systems, vol. 5,no. 3, pp. 796–806, 2018.
[7] S. Venkata Suryanarayana, G. N. Balaji, and G. VenkateswaraRao, “Machine learning approaches for credit card frauddetection,” International Journal of Engineering & Technology(UAE), vol. 7, no. 2, pp. 917–920, 2018.
[8] A. Thennakoon, C. Bhagyani, S. Premadasa, S. Mihiranga, andN. Kuruwitaarachchi, “Real-time credit card fraud detectionusing machine learning,” in Proceedings of the 9th Interna-tional Conference on Cloud Computing, Data Science & Engi-neering, vol. 7no. 10, pp. 488–493, Noida, India, 2019.
[9] H. A. Shukur and S. Kurnaz, “Credit card fraud detection usingmachine learning methodology,” International Journal ofComputer Science and Mobile Computing, vol. 8, no. 3,pp. 257–260, 2019.
[10] H. John and S. Naaz, “Credit card fraud detection using localoutlier factor & isolation forest,” International Journal of Com-puter Sciences and Engineering, vol. 7, no. 4, pp. 1060–1064,2019.
[11] W. F. Yu and N. Wang, “Research on credit card fraud detec-tion model based on distance sum,” in IJCAI internationaljoint conference on artificial intelligence, pp. 353–356, Hainan,China, 2009.
[12] https://towardsdatascience.com/logistic-regression-detailed-overview-46c4da4303bc.
[13] “Autoencoders tutorial : a beginner’s guide to autoencoders,”https://www.edureka.co/blog/autoencoders-tutorial/.
[14] Q. Meng, D. Catchpoole, D. Skillicom, and P. J. Kennedy,“Relational autoencoder for feature extraction,” in 2017 Inter-national Joint Conference on Neural Networks (IJCNN),pp. 364–371, Anchorage, AK, 2017.
[15] F. Carcillo, A. D. Pozzolo, Y. L. Borgne, O. Caelen, Y. Mazzer,and G. Bontempi, “SCARFF: a scalable framework for stream-ing credit card fraud detection with spark,” InformationFusion, vol. 41, pp. 182–194, 2018.
14 Wireless Communications and Mobile Computing