an evaluation of arra-funded subsidized employment programs · mara primosch edited the report, and...
TRANSCRIPT

Anne Roder and Mark Elliott Economic Mobility Corporation
September 2013
Stimulating Opportunity: An Evaluation of ARRA-Funded Subsidized
Employment Programs

The Economic Mobility Corporation (Mobility) identi!es, develops and evaluates programs and policies that enable disadvantaged individuals to acquire the education, skills and networks needed to succeed in the labor market so that they can support themselves and their families.
Board of Directors
Cynthia ShossHarry HolzerJack LitzenbergPlinio AyalaRussel PomeranzMark Elliott
MailEconomic Mobility Corporation, Inc.233 Broadway, 12th FloorNew York, NY 10279
Telephone212.280.6975
Stimulating Opportunity: An Evaluation of ARRA-Funded Subsidized Employment Programs

Stimulating Opportunity: An Evaluation of ARRA-Funded Subsidized
Employment ProgramsAnne Roder and Mark Elliott
Economic Mobility Corporation
September 2013

Funding for this evaluation was provided by the Rockefeller Foundation.
The !ndings reported herein were performed with statistical information provided by the following agencies.
California Department of Social ServicesFlorida Department of Economic OpportunityMississippi Department of Employment SecurityWisconsin Department of Children and Families
The !ndings and conclusions in this report are solely those of the authors on behalf of the Economic Mobility Corporation and should not be considered as representing the of!cial policies or positions of the funder or the agencies listed above.
Stimulating Opportunity: An Evaluation of ARRA-Funded Subsidized Employment Programs

Acknowledgments
We are grateful to the many individuals who contributed to this report by providing background
information, data, and perspective on the TANF Emergency Fund-supported subsidized employment
programs. In particular, we would like to thank the Rockefeller Foundation for its support and Abbey
Carlton for her steadfast con!dence and enthusiasm throughout the project.
Numerous state and local of!cials and program administrators in the !ve study locations not only
agreed to be part of the study but helped us arrange interviews and focus groups and provided infor-
mation about the programs, participants, and employers. In particular, we would like to thank the
following people for their time and effort: from the Mississippi Department of Employment Security,
Stan McMorris, Barbara Hicks, and Wayne Gasson; from the Wisconsin Department of Children and
Families, Angela Davis and Timothy Rupinski; from the Los Angeles Department of Public Social
Services, Luther Evans and Michael Bono; from the San Francisco Human Services Agency, Sarah
Crow and James Whelly; from the California Department of Social Services, Webb Hester; and from
the Florida Department of Economic Opportunity, Michael Lynch, Telly Buckles and Kathy Keeton. We
thank all of the local program staff members who met with us during site visits to share their experi-
ences with the subsidized employment programs. We also thank the employers who took the time to
complete the survey and share their perspectives on the programs and subsidized workers.
Several people shared their ideas about what could be learned from the experience of the TANF
Emergency Fund subsidized employment programs and provided valuable feedback on drafts of this
report. We are particularly grateful to Harry Holzer at Georgetown University, LaDonna Pavetti at the
Center on Budget and Policy Priorities, Elizabeth Lower-Basch at the Center for Law and Social Policy,
Melissa Young at the National Transitional Jobs Network at Heartland Alliance, and Dan Bloom at MDRC.
Several other people contributed to this report. At Mobility, we thank Noga O’Connor for her efforts to
work with state and local of!cials to obtain data on program participants and for her expert analysis of
the data presented in this report. Robin Spence helped with developing interview protocols, conducting
interviews and focus groups during site visits, and documenting the information gathered during these
visits for the report. Mara Primosch edited the report, and Penelope Malish designed the publication.
Stimulating Opportunity: An Evaluation of ARRA-Funded Subsidized Employment Programs

Table of Contents
1 Summary of Findings
5 Chapter 1: Introduction
13 Chapter 2: The Experience of Job Seekers Across the Five Study Sites
23 Chapter 3: Employer Experiences Across the Programs
34 Chapter 4: Job Seeker and Employer Experiences in Each of the Study Sites
92 Chapter 5: Implications and Conclusions
95 Endnotes
96 References
97 Appendix A: Methodology
101 Appendix B: Florida Back to Work Comparison Group
Figures5 Figure 1: Monthly Change in Nonfarm Employment13 Figure 2.1: Two Primary Program Models Implemented by the Study Sites14 Figure 2.2: Characteristics of the Subsidized Employment Programs at the Study Sites15 Figure 2.3: Number of People Placed in Subsidized Jobs During the EF Period15 Figure 2.4: Number of Employers that Hosted Subsidized Positions During the EF Period16 Figure 2.5: Percent of People Placed in Subsidized Jobs Who had been Unemployed for More than 26 Weeks17 Figure 2.6: Median Hourly Wages in Subsidized Jobs During the EF Period17 Figure 2.7: Average Weeks in Subsidized Employment17 Figure 2.8: Average Program Earnings During the EF Period18 Figure 2.9: Percent of Participants Employed in Unsubsidized Jobs in the Fourth Quarter Pre-Program and the
Fourth Quarter Post-Program19 Figure 2.10: Percent Employed in Unsubsidized Jobs Pre- and Post-Program among Florida Back to Work (FBTW)
Participants and Comparison Group Members20 Figure 2.11: Average Annual Earnings from Unsubsidized Employment Pre- and Post-Program among
All Participants21 Figure 2.12: Average Annual Earnings among All Florida Back to Work (FBTW) Participants and Comparison
Group Members22 Figure 2.13: Average Annual Earnings Pre- and Post-Program by Long-Term Unemployment Status22 Figure 2.14: Average Annual Earnings among Long-Term Unemployed Florida Back to Work (FBTW) Participants
and Comparison Group Members
Stimulating Opportunity: An Evaluation of ARRA-Funded Subsidized Employment Programs

23 Figure 3.1: Nearly Two-Thirds of Employers Were For-Pro!t Firms23 Figure 3.2: Just Over Half of Employers Had Fewer than 20 Employees24 Figure 3.3: Employers in A Variety of Industries Employed Subsidized Workers25 Figure 3.4: Number of Subsidized Workers Per Employer25 Figure 3.5: Number of Subsidized Workers Per Employer Across Sites25 Figure 3.6: Number of Subsidized Workers by Size of Employer26 Figure 3.7 How Much Each Factor Contributed to Employers’ Decisions to Take Part in the Program 27 Figure 3.8: The Majority of Employers Created New Positions to Bring on the Subsidized Workers28 Figure 3.9: More than 60 Percent of Employers Said the Subsidized Workers’ Performance Was the Same or
Stronger than that of Other Employees in Similar Positions30 Figure 3.10: How Employing Subsidized Workers Affected the Employers31 Figure 3.11: Employers’ Satisfaction with the Various Aspects of the Subsidized Employment Programs32 Figure 3.12: Employers’ Likelihood of Participating in Programs Offering Varying Subsidy Levels37 Figure 4.1: TSE Program Participant Characteristics38 Figure 4.2: Quarterly Employment Rates Pre- and Post-Program among TSE Participants38 Figure 4.3: Average Quarterly Earnings Pre- and Post- Program among Employed TSE Participants39 Figure 4.4: Average Annual Earnings Pre- and Post-Program among All TSE Participants40 Figure 4.5: Average Annual Earnings Pre- and Post-Program by Months Receiving TANF Prior to Program40 Figure 4.6: Average Annual Earnings Pre- and Post-Program by Long-Term Unemployment Status41 Figure 4.7: Average Annual Earnings Pre- and Post-Program by Number of Months in Subsidized Position among
EF TSE Participants42 Figure 4.8: How Much Each Factor Contributed to Employers’ Decisions to Take Part in the TSE Program43 Figure 4.9: How Employing Subsidized Workers Affected TSE Employers47 Figure 4.10: Wisconsin TJ Program Participant Characteristics48 Figure 4.11: Quarterly Employment Rates Pre- and Post-Program among TJ Participants48 Figure 4.12: Average Quarterly Earnings Pre- and Post- Program among Employed TJ Participants48 Figure 4.13: Average Annual Earnings among All TJ Participants49 Figure 4.14: Average Annual Earnings Pre- and Post-Program by Gender and Race49 Figure 4.15: Average Annual Earnings Pre- and Post-Program by Felony Status50 Figure 4.16: Average Annual Earnings Pre- and Post-Program by Long-Term Unemployment Status51 Figure 4.17: Percent Employed in the 4th Quarter Pre- and Post-Program by Number of Months in
Subsidized Position52 Figure 4.18: How Much Each Factor Contributed to Employers’ Decisions to Take Part in the TJ Program53 Figure 4.19: How Employing Subsidized Workers Affected TJ Employers 56 Figure 4.20: JobsNOW Tier 1 Participant Characteristics57 Figure 4.21: Tier 1 Subsidized Employment Duration and Earnings58 Figure 4.22: Quarterly Employment Rates Pre- and Post-Program among Tier 1 Participants58 Figure 4.23: Average Quarterly Earnings Pre- and Post- Program among Employed Tier 1 Participants58 Figure 4.24: Average Annual Earnings Pre- and Post-Program among All Tier 1 EF Participants59 Figure 4.25: Percent Employed in the 4th Quarter Pre- and Post-Program by Long-Term Unemployment Status
among Tier 1 EF Participants59 Figure 4.26: Percent Employed in the 4th Quarter Pre- and Post-Program by Target Group among Tier 1 EF
Participants59 Figure 4.27: Average Annual Earnings Pre- and Post-Program by Target Group among Tier 1 EF Participants61 Figure 4.28: JobsNOW Tier 2 Participant Characteristics62 Figure 4.29: Tier 2 Subsidized Employment Duration and Earnings
Stimulating Opportunity: An Evaluation of ARRA-Funded Subsidized Employment Programs

62 Figure 4.30: Quarterly Employment Rates Pre- and Post-Program among Tier 2 Participants63 Figure 4.31: Average Quarterly Earnings Pre- and Post- Program among Employed Tier 2 Participants63 Figure 4.32: Average Annual Earnings Pre- and Post-Program among All EF Tier 2 Participants 64 Figure 4.33: Average Annual Earnings Pre- and Post-Program by Target Group among Tier 2 EF Participants66 Figure 4.34: JobsNOW Tier 3 Participant Characteristics67 Figure 4.35: Tier 3 Subsidized Employment Duration and Earnings68 Figure 4.36: Quarterly Employment Rates Pre- and Post-Program among Tier 3 Participants68 Figure 4.37: Average Quarterly Earnings Pre- and Post- Program among Employed Tier 3 Participants68 Figure 4.38: Average Annual Earnings Pre- and Post-Program among All EF Tier 3 Participants69 Figure 4.39: Percent Employed in the 4th Quarter Pre- and Post-Program by Gender among Tier 3 EF Participants69 Figure 4.40: Average Annual Earnings Pre- and Post-Program by Gender among Tier 3 EF Participants70 Figure 4.41: Percent Employed in the 4th Quarter Pre- and Post-Program by Target Group among
Tier 3 EF Participants70 Figure 4.42: Average Annual Earnings Pre- and Post-Program by Target Group among Tier 3 EF Participants70 Figure 4.43: Percent Employed in the 4th Quarter Pre- and Post-Program by Long-Term Unemployment Status
among Tier 3 EF Participants71 Figure 4.44: Percent Employed in the 4th Quarter Pre- and Post-Program by Hourly Wage in Subsidized Job
among Tier 3 EF Participants72 Figure 4.45: How Much Each Factor Contributed to Employers’ Decisions to Take Part in the JobsNOW
Tier 3 Program 73 Figure 4.46: How Employing Subsidized Workers Affected the JobsNOW Tier 3 Employers77 Figure 4.47: Mississippi Steps Participant Characteristics79 Figure 4.48: Quarterly Employment Rates Pre- and Post-Program among Steps Participants79 Figure 4.49: Average Quarterly Earnings Pre- and Post- Program among Employed Steps Participants79 Figure 4.50: Average Annual Earnings among All Steps Participants80 Figure 4.51: Percentage Employed in the Fourth Quarter Pre- and Post-Program by Gender and Race80 Figure 4.52: Average Annual Earnings Pre- and Post-Program by Gender and Race80 Figure 4.53: Percentage Employed in the Fourth Quarter Pre- and Post-Program by Long-Term Unemployment
Status80 Figure 4.54: Average Annual Earnings Pre- and Post-Program by Long-Term Unemployment Status81 Figure 4.55: Average Annual Earnings Pre- and Post-Program by Hourly Wage in Subsidized Job82 Figure 4.56: How Much Each Factor Contributed to Employers’ Decisions to Take Part in the Steps Program 83 Figure 4.57: Steps Employers’ Views of Subsidized Workers’ Performance Compared with People Typically Hired
For Similar Positions83 Figure 4.58: How Employing Subsidized Workers Affected the Steps Employers86 Figure 4.59: Florida Back to Work Participant Characteristics88 Figure 4.60: Quarterly Employment Rates Pre- and Post-Program For Florida Back to Work (FBTW) Participants
and Comparison Group Members88 Figure 4.61: Average Quarterly Earnings Pre- and Post-Program among Employed Florida Back to Work (FBTW)
Participants and Comparison Group Members89 Figure 4.62: Average Annual Earnings among All Florida Back to Work (FBTW) Participants and Comparison
Group Members90 Figure 4.63: Average Annual Earnings Pre- and Post-Program by Race/Ethnicity90 Figure 4.64: Average Annual Earnings Pre- and Post-Program by Long-Term Unemployment Status 99 Figure A1: Final Employer Survey Sample Disposition and Response Rate101 Figure B1: Characteristics of the Florida Back to Work Participants and Comparison Group Members
H Stimulating Opportunity: An Evaluation of ARRA-Funded Subsidized Employment Programs Stimulating Opportunity: An Evaluation of ARRA-Funded Subsidized Employment Programs

I Stimulating Opportunity: An Evaluation of ARRA-Funded Subsidized Employment Programs Stimulating Opportunity: An Evaluation of ARRA-Funded Subsidized Employment Programs

Summary of Findings
In 2009, in its efforts to stimulate the economy through the American Recovery and Reinvestment Act (ARRA), Congress included funding in the Temporary Assistance to Needy Families (TANF) Emergency Fund (EF) to help states cover the costs of creating new or expanding existing subsidized employment programs. All told, 39 states and the District of Columbia received approval to spend $1.3 bil-lion of the Emergency Fund on subsidized employment programs. While the goals and structures of the TANF EF-supported subsidized employment programs varied from jurisdiction to jurisdiction, they generally sought to create job opportunities for unemployed individuals so that they could earn immediate income and build experience and skills. Many programs also sought to reduce the costs and risks to employers of hiring during a slack economy and to stimulate local economies. In a short period of time, states implemented large-scale programs, creating more than 260,000 subsidized jobs.
While the TANF EF grants expired in September 2010, the programs had strong support from employers, workers, and state and local of!cials from across the political spectrum. Several states continue to operate subsidized employment pro-grams and signi!cant new investments in the strategy have been proposed at the federal level. With support from the Rockefeller Foundation, the Economic Mobility Corporation (Mobility) conducted a retrospective study of TANF EF-supported sub-sidized employment programs in !ve locations to investigate what we could learn about workers’ and employers’ experiences to inform future policy and program design decisions. Our !ndings are based on an analysis of data provided by the states on participants’ characteristics, subsidized employment experiences, and pre-and post-program employment and earnings and a survey we conducted with participating employers.
Our report provides evidence about the effectiveness of subsidized employment programs in helping the unemployed re-enter the labor market while stimulating job growth and addressing employers’ workforce needs. It also offers lessons about how program design in"uences worker and employer outcomes. Our main !ndings about program effectiveness include the following:
Subsidized employment programs can have a signi!cant positive impact on low-income job seekers’ employment and earnings. In Florida, where we have information about the outcomes of a strong compari-son group of individuals who were eligible for but did not take part in subsidized employment, program participants experienced signi!cantly greater increases in unsubsidized employment and earnings than members of the comparison group did. Notably, participants experienced a $4,000 average increase in earnings from the year before the program to the year after the program compared to a $1,500 average increase among comparison group members.
1 Stimulating Opportunity: Summary of Findings

Participants in three of the other four study sites had similar increases in unsubsidized employment and earnings as those experienced by participants in Florida, although in these locations, we do not have employment and earnings data for comparison groups. The results show that workers participating in differ-ent types of subsidized employment programs experienced positive outcomes.
Most employers created jobs that would not have existed otherwise. Sixty-three percent of employers across the states we examined said they generated jobs that would not have existed otherwise in order to employ the subsidized workers, suggesting that subsidized employment programs can help stimulate business growth. Employers also saw bene!ts to their bottom line and were eager to participate in similar subsidized employment programs in the future.
The long-term unemployed experienced particularly large employment and earnings gains. The subsidized employment programs we studied offered particular bene!ts to job seekers who have been unemployed for more than six months. In most sites, a large part of the changes in participant earnings from the year before to the year after program participation were driven by improvements made among these long-term unemployed workers.
Programs also bene!tted participants with signi!cant barriers to employment. Individuals with signi!cant barriers to employment, including TANF recipients and those with criminal records, also experienced large increases in unsubsidized employment and earnings from the year before to the year after participating in the programs.
The !ndings also suggest some lessons for policymakers and practitioners design-ing subsidized employment programs.
The "exibility of the ARRA funding allowed for wide variations in program goals, job seeker eligibility, the lengths and depths of subsidies, and required employer commitments. While the details of the programs varied, the sites we studied implemented subsidized employment programs that followed one of two basic models. In one, subsidized workers were hired by employers, earned prevailing wages for their jobs, and did not receive support beyond assistance obtaining a subsidized job. In the other, subsidized workers were on the payroll of a third party rather than the employer where they performed the work, were paid a !xed wage, and received job readiness training and counseling to help them suc-ceed in their subsidized positions and transition to unsubsidized employment. Workers in both types of program models experienced increases in unsubsidized employment and earnings after participating in the programs.
Subsidized workers were more likely to be retained by their employers after the subsidy period ended if the programs required employers to place subsidized
2 Stimulating Opportunity: Summary of Findings

workers on their payrolls immediately, offered partial or stepped-down subsidies that required employers to begin partly covering wages soon after employment began, and set expectations that employers retain workers who perform well.
Programs that placed subsidized workers on the payroll of a third party interme-diary and required minimal commitment from the employers where the work was performed were able to serve more disadvantaged participants, including more long-term unemployed participants, TANF recipients, and individuals with crimi-nal convictions. While retention rates by the subsidized employers were lower in these programs than in programs where employers hired subsidized workers directly, participants in these programs experienced substantial increases in unsubsidized employment rates from the year before to the year after program participation, indicating that many participants found unsubsidized employment elsewhere after working in subsidized positions.
When programs did not ask employers to commit to retaining workers after the subsidy period ended, participant outcomes were better where the programs provided workers individualized assistance with obtaining unsubsidized employ-ment and subcontractors received monetary incentives for making unsubsidized placements. Post-program employment rates in such programs were also better when the hourly wages participants earned in the subsidized jobs were lower. In order to promote the transition to unsubsidized employment, when setting wage rates for subsidized jobs or limits on the wages of jobs that are eligible for sub-sidies, programs should consider whether participants can obtain unsubsidized employment at similar or better wages either on their own or with the assistance of program staff.
Across the sites, employers reported retaining 37 percent of the subsidized workers after the subsidy period ended, and the most common reasons given for not retaining workers were poor attendance and other performance issues. Program designers may need to build more supports into subsidized employment programs for workers with limited work histories to help them succeed on the job and to increase post-subsidy retention. The most common supports needed, according to employers, were child care, transportation, coaching on communica-tion skills, and computer training.
All of the sites were successful in engaging for-pro!t employers in the programs, and these employers were more likely than non-pro!ts and public agencies to retain workers after the subsidy period ended. For-pro!ts were also more willing to participate in programs that offered partial subsidies.
Non-pro!ts and public agencies may be more willing to take on workers with less work experience and education than their typical employees, providing opportuni-ties for those more disadvantaged in the labor market to gain work experience. However, they were less likely to have the resources to keep the workers on after the subsidies ended.
3 Stimulating Opportunity: Summary of Findings

In sum, the results of the comparison group analysis in Florida and the similar gains participants realized at the other study sites suggest that subsidized employ-ment can be an effective strategy for helping unemployed, low-income individuals move into employment and increase their earnings. Unlike subsidized employment programs of the past that relied on public sector employment, the EF-supported programs engaged the private sector in creating job opportunities, and private employers realized substantial bene!ts from participating in the programs. The !ndings are particularly important for the nation’s millions of long-term unemployed workers, including those who lost jobs as a result of the economic downturn and those who face barriers to employment due to limited work histories and skills.
4 Stimulating Opportunity: Summary of Findings

Chapter 1Introduction
Despite improvements since early 2010, employment growth remains lethargic (see Figure 1.1). As a result, the U.S. economy still has not overcome the enor-mous job de!cit created during the Great Recession. As of August 2013, 11.3 mil-lion people were unemployed, and the unemployment rate remains stubbornly high.
Figure 1.1 Monthly Change in Nonfarm Employment
-1000
-800
-600
-400
-200
0
200
400
600
2008 2009 2010 2011 2012 2013
In Thousands (Seasonally Adjusted)
Source: Bureau of Labor Statistics
In August 2013, 4.3 million people had been unemployed for more than 26 weeks. These long-term unemployed job seekers represent three percent of the labor force—the greatest share since the end of the Depression. The long-term unem-ployed also represent an unusually large share of the nation’s unemployed workers. From 2007 to 2011, the fraction of the nation’s unemployed who had been out of work for more than 26 weeks increased from 18 to 44 percent (Burtless 2012) and remained at 38 percent in August 2013.1 The longer job seekers remain unem-ployed, the harder it becomes to !nd a job, and after several months of unemploy-ment they become “damaged goods” in employers’ eyes (Burtless 2012).
Findings from a recent experiment con!rmed these concerns (Ghayad 2013). Researchers at Northeastern University sent out 4,800 computer-generated
5 Stimulating Opportunity: Introduction

resumes with identical credentials— except for unemployment duration and indus-try experience. Applicants who had been out of work for more than six months were almost never contacted for an interview. Although the economy has gained steam and added jobs, employers remain reluctant to consider hiring people who have been out of work for an extended time.
For the long-term unemployed, the rami!cations can be devastating, not just in !nancial terms. Research indicates that long-term unemployment is associated with signi!cant !nancial hardship, strained personal relationships, changes in career goals, and loss of self-con!dence (Taylor et al. 2010). As Jennifer Medina reported in an article on a support group of unemployed workers in California (Medina 2012):
“Your whole life your job de!nes who you are,” said Mr. Thomas, 48, who was laid off from his position as an advertising manager in February. “All of the sudden that’s gone, and you don’t know what to take pride in anymore.”
Another example is a 55-year-old man in the support group who sent out 1,600 resumes since he lost his job in 2008 and went on ten interviews but was still job-less. When his unemployment bene!ts ran out, he went on food stamps.
As the economy continues its slow recovery in 2013, and the unemployment rate gradually declines, little attention is being paid in Congress to the millions of workers who remain unemployed, including those not counted in unemployment statistics because they have become discouraged and stopped looking for work. Indeed, at a recent hearing on long-term unemployment held by the Joint Economic Committee, just one legislator was in attendance when the session began.2 Nevertheless, the consequences for would-be workers, their families and communi-ties are severe—and warrant sensible, effective intervention.
This report examines several state and local efforts to use subsidized employment to help the unemployed re-enter the labor force while stimulating local economies and helping employers address their workforce needs. These programs served individuals who lost jobs as a result of the economic downturn as well as those who would be at a disadvantage even when the economy is good, such as long-term welfare recipi-ents, individuals with criminal records, and other low-income workers with limited work histories and skills. On the whole, the !ndings from these efforts are quite posi-tive and offer some clear lessons for both policymakers and program practitioners.
The TANF Emergency Fund and Subsidized EmploymentIn 2009, in its efforts to stimulate the economy through the American Recovery and Reinvestment Act (ARRA), Congress included $5 billion for the Temporary Assistance to Needy Families (TANF) Emergency Fund (EF) to help states cover the costs of providing more assistance to poor families, including basic assistance, non-recurrent short-term bene!ts, and subsidized employment. Overall, states
6 Stimulating Opportunity: Introduction

received approval to spend $1.3 billion of the Emergency Fund to create new or expand existing subsidized employment programs. States were given "exibility in setting the eligibility requirements for their subsidized employment programs, enabling them to serve both TANF recipients and other low-income families with children. All told, 39 states and the District of Columbia took advantage of the additional resources for subsidized employment (Pavetti et al 2011).
Subsidized employment programs provide job opportunities to unemployed indi-viduals by using public funds to pay for all or part of their wages. The strategy dates back to the 1930s when the Works Progress Administration (WPA) was created to provide income support to people unable to !nd jobs during the Great Depression. In the 1970s, the Public Sector Employment (PSE) component of the Comprehensive Employment and Training Act (CETA) provided unemployed indi-viduals positions in state and local governments. Since the 1960s, smaller scale subsidized employment programs have been targeted to welfare recipients, youth, and other groups with signi!cant barriers to employment, such as individuals with criminal convictions. These programs—commonly referred to as transitional jobs programs—differ from earlier efforts in that they seek not only to provide individu-als a work-based source of income but also skills development and supportive ser-vices to help increase their employability so that they can obtain jobs in the regular labor market. Evaluations of transitional jobs programs have found that they raise short-term employment but, in most cases, these increases are not sustained once workers leave the subsidized positions (Bloom 2010; Jacobs 2012).
While the goals and structures of the TANF EF-supported subsidized employment programs varied from jurisdiction to jurisdiction, they generally sought to create job opportunities for unemployed individuals so that they could earn immediate income and build experience and skills. Many programs also sought to reduce the costs and risks to employers of hiring during a slack economy and to stimulate local econo-mies. Despite the substantial federal investment in subsidized employment under ARRA—almost double the 2012 federal formula funding for adult workers through the Workforce Investment Act—little is known about its effects on job seekers and employers. Previous studies have described the strategies states used to implement subsidized employment programs. These studies found that states were able to implement large-scale programs in a short period of time, placing thousands of peo-ple into subsidized jobs to help them earn immediate income. Many states engaged the private, for-pro!t sector in creating subsidized employment opportunities—in con-trast to earlier programs that largely placed people in non-pro!t and public agencies. Overall, states created over 260,000 subsidized jobs, about half of which were for adults and half for youth (Pavetti et al. 2011; Farrell et al. 2011).
In 2011, the Rockefeller Foundation asked the Economic Mobility Corporation (Mobility) to investigate what more could be learned about the experiences of job seekers and employers who participated in the TANF EF-supported subsidized employment programs. While the EF grants ended in 2010, the programs had wide-spread support from employers, workers, and state and local of!cials from both
7 Stimulating Opportunity: Introduction

ends of the political spectrum. Although substantial new funding at the federal level for subsidized employment seems unlikely in the current political climate, interest at the state level remains high and several states continue to operate subsidized employment programs using TANF and state and local funding sources. This report provides evidence about the effectiveness of subsidized employment programs in helping the unemployed re-enter the labor market and stimulating busi-ness growth by helping employers address their workforce needs. It also offers les-sons about how program design in"uences worker and employer outcomes.
The StudyThe primary goal of this study was to gather information about workers’ and employers’ experiences with the subsidized employment programs in order to assess the effects of these programs and draw conclusions that will be useful to the !eld. The main research questions were:
Program Design. How did the sites structure the programs? What were the pro-gram goals, target populations, subsidy structures and lengths, administrative structures, wages paid, and training or supports provided?
Participant Experiences. What were program participants’ experiences with the subsidized employment programs? How much did they earn from subsidized employment? Were they retained by their employer after the subsidy period ended? What were their post-program employment rates and earnings? Did out-comes vary for subgroups of participants?
Employer Experiences. What were employers’ experiences with the subsidized employment programs? Why did they participate? How did participation in the program affect their businesses? What factors would in"uence whether they par-ticipate in a subsidized employment program in the future?
Site SelectionSince the TANF EF-supported programs ended more than a year earlier in September 2010, our !rst tasks were to assess what data were available about program participants and employers and gauge state of!cials’ interest in partici-pating in a study and sharing data. We focused primarily on states that continued to operate subsidized employment programs after 2010, where current of!cials would likely be more knowledgeable about program design decisions and the avail-able data and potentially more motivated to take part in a study that could inform their ongoing work. We also focused on subsidized employment programs serving adults. We chose the !ve locations included in the study based on the diversity of the program models, their geographic diversity, and their ability and willingness to share data and participate in the evaluation. The programs are:
8 Stimulating Opportunity: Introduction

The Los Angeles Transitional Subsidized Employment program (TSE), adminis-tered by the Los Angeles Department of Public Social Services (DPSS). DPSS ran TSE with EF support from April 2009 through September 2010, and it has oper-ated a modi!ed version of the program with state funding since that time.
The Wisconsin Transitional Jobs (TJ) Demonstration Program, administered by the Wisconsin Department of Children and Families with EF support and TANF block grant funding from September 2010 through the present.
The San Francisco JobsNOW program, operated by the Human Services Agency (HSA). HSA ran JobsNOW with EF support from July 2009 through September 2010, and it has operated a modi!ed version of the program with state and local funding since then. JobsNOW has three program tiers with distinct designs, and we examine each separately.
The Mississippi STEPS program, administered by the Mississippi Department of Employment Security (MDES). MDES ran STEPS 1 with EF support from January to September 2010, and a modi!ed version of the program operated from August to December 2011 using governor’s discretionary funds from the Department of Education.
The Florida Back to Work program, administered by the Agency for Workforce Innovation (now the Department of Economic Opportunity) with EF support from March to September 2010.
We focused on states that targeted a low-income population that included workers who faced barriers to employment due to long-term unemployment or a limited work history and that placed a signi!cant portion of participants with for-pro!t employ-ers. In addition to helping people earn immediate income, another goal of all of the study sites was to help people transition into unsubsidized employment. Some designed programs to encourage the subsidized employers to hire workers after the subsidy period ended, while others provided services during the subsidy period to help workers become more employable and !nd unsubsidized jobs elsewhere after the subsidized positions ended. We sought variation in how programs struc-tured the subsidies, in the skills and experience of the participants served, and in the amount of support provided to workers before, during, and after the subsidized placements. The programs also varied in terms of the administering agency and the types of agencies implementing the programs at the local level. Some of the sites changed aspects of their program models after the EF-supported programs ended, providing more opportunities to examine how outcomes varied with program design. The diversity of program models allowed us to explore how participant and employer experiences varied by program design and structure.
9 Stimulating Opportunity: Introduction

Data and MethodsTo answer the research questions, we collected the following types of information. Details about the data collection methods and analysis are included in Appendix A.
Programmatic Data on Participant Characteristics and Experiences. We col-lected individual-level data from the sites on demographic and other background characteristics of program participants, their participation in the program, and the characteristics of their subsidized positions.
State Employment and Earnings Data. We collected data on participants’ quarterly employment and earnings from each state’s Unemployment Insurance wage reporting system for the four quarters before and the four quarters after program participation.
Survey of Employers. We conducted a telephone survey with 633 employers who took part in the programs in Mississippi, Wisconsin, San Francisco, and Los Angeles to learn about their experiences with the programs, achieving a 79 per-cent response rate among the sample of employers included in the survey.3
Interviews with Program Staff, Focus Groups with Program Participants and Review of Program Materials and Documentation. We conducted interviews with key staff involved in administering the programs and providing services to partici-pants and employers. These interviews were conducted during in-person visits to Mississippi, Wisconsin, San Francisco and Los Angeles and by telephone with program administrators in Florida. We conducted focus groups with program par-ticipants in Mississippi, Wisconsin, and San Francisco to learn about their experi-ences with the programs. We also reviewed reports and other materials the sites produced regarding program implementation.
Conducting the study retrospectively meant that we were not able to dictate the study design or what data elements the participating sites collected. Using the states’ wage reporting system data, we examined change in participants’ employ-ment and earnings from the year before to the year after participating in the subsidized employment programs in all !ve study locations. We used information gathered by the programs to examine whether there were differences in the out-comes for subgroups of participants. We found that there was signi!cant variation in the types of information the sites had gathered about participants’ background characteristics and subsidized employment experiences. In some cases, the sites were able to report aggregate statistics on participants’ characteristics or pro-gram experiences but were unable to provide individual-level data. Therefore, we could not conduct many of the subgroup analyses across all !ve study sites. The retrospective nature of the study also meant that we did not observe the imple-mentation of the programs and cannot address how the quality and consistency of program implementation in"uenced participants’ or employers’ outcomes.
10 Stimulating Opportunity: Introduction

While this analysis enabled us to assess whether individuals experienced improve-ments after participating in the subsidized employment programs, an important question in evaluating program effectiveness is whether changes observed over time can be attributed to the programs. Some changes might be expected even in the absence of an intervention. People seeking assistance from workforce develop-ment programs are often at a low point in terms of their employment and earnings. In a voluntary program in particular, one might expect that some job seekers will !nd employment on their own, and that employment rates will increase regardless of the intervention.
To address this issue, evaluations sometimes compare the outcomes of program participants to those of a similar group of people who did not take part in the inter-vention. In four of the study sites we did not have data for a comparison group to assess how much of the change would have occurred without the subsidized employ-ment programs. However, of!cials in Florida provided us with employment and earn-ings data for a group of 16,204 individuals who were seeking assistance with !nding a job and deemed eligible for the Back to Work program but were not placed in subsi-dized jobs.4 These job seekers were nearly identical to the Back to Work participants in terms of their demographic characteristics, levels of education, recent employment experience and target group (that is, TANF-eligible versus other low-income job seek-ers).5 It is possible that there are unmeasured differences between the two groups that may have in"uenced their post-program outcomes. But the similarities in their backgrounds and the fact that both groups were motivated to !nd work make the non-participants’ outcomes a strong indicator of what may have happened to the Back to Work participants in the absence of the program.
This ReportIn this report, we present our !ndings regarding the experiences of employers and job seekers in subsidized employment programs.
In Chapter 2, we provide an overview of the programs and examine the experi-ences of job seekers across the !ve study sites. For all of the sites, we present changes in participants’ employment and earnings from the year before to the year after participating in the subsidized employment programs. For Florida, we also present data on how participants’ outcomes compared to a comparison group of individuals who were deemed eligible for the program but did not participate, in order to assess the impact of the subsidized employment program beyond any changes that may have occurred even in the absence of the intervention.
In Chapter 3, we present the experiences of employers who took part in the sub-sidized employment programs across the four study sites where we conducted the survey, including their reasons for participating, how program participation affected their businesses, whether they retained the subsidized workers, and under what circumstances they would participate in future programs.
11 Stimulating Opportunity: Introduction

In Chapter 4, we report on the experiences of each of the study sites, including program goals, target populations, administrative structures, subsidy structures, and types of assistance provided to job seekers, as well as the experiences of the job seekers and employers who participated in each program. The !rst four programs we present followed the intermediary model and the last three imple-mented the direct hire model.
In Chapter 5, we present our conclusions regarding the effects of subsidized employment programs on job seekers and employers and the implications of the !ndings for future program design.
12 Stimulating Opportunity: Introduction

Chapter 2The Experiences of Job Seekers
The TANF Emergency Funds provided states considerable "exibility in designing their subsidized employment programs. There was signi!cant variation across the !ve study sites in the population targeted, the subsidy structure and length, and the wages paid and supports provided to program participants. While the details varied, the programs in the study generally followed one of two models (see Figure 2.1). In the !rst type, the intermediary model, the participants were on the payroll of a third party intermediary while they worked at host employer sites. The intermediary was either the agency operating the subsidized employment program or an agency with which it contracted. The subsidized positions were at for-pro!t, non-pro!t, and public agencies. In this model, the only commitment required of employers was to provide supervision to the subsidized workers. The employers were not expected to hire the subsidized workers after the subsidy ended, although some subcontractors in Wisconsin encouraged employers to do so if they had the resources and the work-ers performed well. By not requiring employers to place subsidized workers on their payrolls, these programs were able to create opportunities for individuals with limited work histories or other barriers to employment, such as a criminal record or long-term welfare receipt, that may have made employers reluctant to give them a chance.
Figure 2.1 Two Primary Program Models Implemented by the Study Sites
Intermediary Direct Hire
Florida, Mississippi, San Francisco Tier 3
There are no wage or payroll costs to employers, only the cost of supervising the workers
Workers earn a !xed wage set by the administering agency
Built-in supports for participants before, during, and/or after the subsidized placement
Los Angeles, Wisconsin, San Francisco Tiers 1 and 2
Employers receive a full or partial subsidy of the wages paid, payroll costs, and supervision costs
Workers earn the prevailing wage in the region for the occupation
Supports for participants not built into program
Participants are on the payroll of a third party intermediary while working at host employer sites
Participants are on the payroll of the employer where they perform the work of their subsidized position
13 Stimulating Opportunity: The Experiences of Job Seekers

For the most part, subsidized workers in these programs earned a !xed wage determined by the administering agency (see Figure 2.2). Another common charac-teristic of these programs was the support they provided to participants, including classes on job readiness skills and job search techniques, counseling on personal and workplace issues while in the subsidized position, and assistance obtaining an unsubsidized job after the subsidy period ended. Two of the programs in this group provided payments to subcontractors for helping participants successfully transition to unsubsidized employment.
Figure 2.2 Characteristics of the Subsidized Employment Programs at the Study Sites
Intermediary Model Direct Hire Model
Los Angeles Wisconsin San Francisco Tier 1
San Francisco Tier 2
San Francisco Tier 3
Florida Mississippi
Whose payroll Third party:public subcontractor
Third party: 17 for-pro!t, non-pro!t, and public subcontractors
Third party:non-pro!t subcontractors
Third party: City and County of San Francisco
Employers Employers Employers
Subsidy level No cost to employer other than supervision
No cost to employer other than supervision
No cost to employer other than supervision
No cost to employer other than supervision
EF: 100% of wagesPost-EF: $5,000
80% to 95% of wages
Declining from 100%, 75%, 50%, to 25% of wages
Subsidy duration EF: 6-12 monthsPost-EF: 4 months
Up to 1,040 hours, about 6 months
6 months EF: 12 monthsPost-EF: most 6 months, some 12
EF: Up to 12 monthsPost-EF: Up to 5 months
Up to 12 months EF: 6 monthsPost-EF: 4 months
Types of employers For-pro!ts, non-pro!ts and public agencies
For-pro!ts, non-pro!ts and public agencies
Non-pro!ts Public agencies For-pro!ts, non-pro!ts and public agencies
For-pro!ts, non-pro!ts and public agencies
For-pro!ts, non-pro!ts and some public agencies
Employer commitment
Not expected to hire after subsidy
Some encouraged and some not expected to hire after subsidy
Not expected to hire after subsidy
Not expected to hire after subsidy
Encouraged to hire after subsidy
For-pro!ts asked to commit to hire, non-pro!ts encouraged
All asked to commit to hire after subsidy
Wage paid to workers
EF: $10.00/hourPost-EF: $8.00/hour
Minimum wage of $7.25 an hour
$11.03 an hour EF: $12.21/hourPost-EF: $12.39/hour
Prevailing wage for occupation
Prevailing wage for occupation
Prevailing wage for occupation
Supportive services Job coaching; child care and transportation through TANF
Job readiness workshops, job coaching, work supports, referrals
Counseling on workplace/personal issues, child care, transportation
Counseling on workplace/personal issues, child care, transportation, job readiness classes
No built in supports; TANF and GA clients eligible for work supports
No built in supports; TANF clients eligible for work supports
No built in supports; clients could apply for work supports
Target population (job seekers)
TANF recipients primarily, some dislocated workers
Income <150% of poverty and child under 18, not UI eligible or TANF recipients
EF: Income <200% of poverty and child under 18Post-EF: TANF and GA recipients
EF: Income <200% of poverty and child under 18Post-EF: TANF and GA recipients
EF: Income <200% of poverty and child under 18Post-EF: TANF and GA recipients
Income <200% of poverty and has child under18, TANF eligible
Income <250% of poverty and has child under 18, TANF and SNAP recipients
14 Stimulating Opportunity: The Experiences of Job Seekers

In the second type, the direct hire model, participants were hired by for-pro!t, non-pro!t, and public employers. These employers were required to put the subsidized workers on their payrolls at the start of the subsidy period and were reimbursed for all or part of the costs associated with employing them. Reimbursement lev-els and the types of costs for which reimbursements could be obtained varied by location (see Figure 2.2). The three programs of this type encouraged employers to retain workers after the subsidy period ended. Two asked employers to com-mit upfront to retaining workers who performed well. In this model, the subsidized workers earned the prevailing wages in the region for the occupations in which they were placed. There were no built-in support services for participants outside of assistance with obtaining a subsidized position. However, if the subsidized posi-tions did not turn into unsubsidized jobs, participants could return to the agencies operating the programs to use the resources generally available to help job seek-ers !nd jobs. With the EF support, these programs served a broad range of low-income job seekers that included recently unemployed individuals as well as TANF recipients and the long-term unemployed.
The Programs Were Successful in Creating Subsidized Employment Opportunities for Individuals Struggling in the Labor MarketThe study sites started their EF-supported subsidized employment programs in 2009 and early 2010 when national unemployment rates were at their peak—at or near 10 percent—and on average unemployed individuals were out of work for more than 30 weeks. The sites set ambitious goals for placing large numbers of people into subsi-dized jobs, which required political support and campaigns to recruit employers and get the word out to job seekers. As shown in !gures 2.3 and 2.4, with the EF support, the !ve programs were able to place more than 26,000 people into subsidized jobs with nearly 4,800 employers.
FL MS SF LA WI
Figure 2.3 Number of People Placed in Subsidized Jobs During the EF Period
0
2,000
4,000
6,000
8,000
10,000
12,000
5,588
3,228
4,127
10,719
2,963
FL MS SF LA WI
Figure 2.4 Number of Employers that Hosted Subsidized Positions During the EF Period
0
300
600
900
1200
1,500
,1,039
900
650
1,403
760
15 Stimulating Opportunity: The Experiences of Job Seekers

The programs served diverse populations. In four of the !ve sites, at least two-thirds of the participants were women. The one exception was Wisconsin, where TANF recipients were not eligible for the program and nearly two-thirds (63 percent) of the participants were men. In Wisconsin and Mississippi, two-thirds of participants were African American as were 42 percent in Florida and San Francisco. San Francisco also served signi!cant numbers of Asian and Hispanic job seekers, who made up 22 percent and 18 percent of participants, respectively. In Florida and the San Francisco Tier 2 and 3 programs, more than 60 percent of participants were age 30 or older, while in the other programs about half of participants were under age 30.
The programs were able to place workers who were struggling in the labor market in subsidized positions to help them earn immediate income. Across the sites, between 46 and 82 percent of the subsidized workers had been unemployed for more than 26 weeks when they entered the program (see Figure 2.5).6 In Los Angeles, individuals receiving TANF accounted for 89 percent of participants in the EF program. On average, these participants had been receiving TANF for 33 months. In Wisconsin, 39 percent of all participants and 52 percent of male partici-pants had felony convictions.
FL MS SF LA WI
Figure 2.5 Percent of People Placed in Subsidized Jobs Who Had Been Unemployed for More than 26 Weeks
0%
20%
40%
60%
80%
100%
82%
51%46%
73%
62%
Workers Earned Substantial Income from the Subsidized PositionsAs noted earlier, the two program models took different approaches to setting wages in the subsidized positions. In the programs where subsidized workers were on the payroll of a third party (shaded green in Figure 2.6), the participants earned a !xed hourly wage. Wisconsin set the wage at the state minimum. Los Angeles and San Francisco set wages above their minimums, which were $8.00 an hour in Los Angeles and $9.79 in San Francisco in 2009. In the three programs where
16 Stimulating Opportunity: The Experiences of Job Seekers

participants were on the employers’ payrolls (shaded red in Figure 2.6), workers earned the prevailing wages in the region for the jobs they obtained, ranging from a median of $7.55 an hour in Mississippi to $15.00 an hour in San Francisco.
The expected length of the subsidy periods varied across the study sites from six months to a year. With the EF grant period and the subsidized jobs expiring on September 30, 2010, the subsidy period was cut short for many participants, particularly those in Florida and Mississippi where the programs operated for less than a year.7 The actual length of time in the subsidized positions varied from an average of 13 weeks in Mississippi to 37 weeks in San Francisco’s Tier 2 public sector trainee program (see Figure 2.7). Total program earnings varied within the two program structures depending on participants’ wages and hours worked and the length of the subsidy periods (see Figure 2.8).8
LA WI FLSFTier 1
SFTier 2
SF Tier 3
MS
Figure 2.6 Median Hourly Wages in Subsidized Jobs During the EF Period
$0.00
$2.00
$4.00
$6.00
$8.00
$10.00
$12.00
$14.00
$16.00
$12.21
$11.03
$7.25
$10.00
$15.00
$7.55
$11.00
SFTier 3
MSSFTier 2
SFTier 1
WILA
Figure 2.7 Average Weeks in Subsidized Employment
0
5
10
15
20
25
30
35
40
28
37
16
2729
13
MSSFTier 3
SFTier 2
SFTier 1
LA
Figure 2.8 Average Program Earnings During theEF Period
$0
$5,000
$10,000
$15,000
$20,000
$25,000
$20,161
$4,050
$7,329
$10,728
$18,270
17 Stimulating Opportunity: The Experiences of Job Seekers

Participants in Most Study Sites Experienced Signi!cant Increases in Unsubsidized Employment in the Year After Participating in the Subsidized Employment ProgramParticipants in four of the !ve study sites experienced a substantial increase in unsubsidized employment from the year before to the year after participating in the subsidized employment programs. To be eligible for the programs, all of the participants had to be unemployed at the time that they entered the programs. We examined whether participants sustained employment during the four quar-ters after participating in the program and whether they experienced increases in employment from the four quarters before the program. Participants in Florida, Mississippi, Los Angeles, and Wisconsin experienced a 13 to 17 percentage point increase in unsubsidized employment starting from the fourth quarter before pro-gram participation to the fourth quarter after participation ended (see Figure 2.9). In San Francisco, outcomes varied across the program tiers; employment rates increased slightly over time only in the Tier 1 community jobs program.
SFTier 2
SFTier 1
WILA MS FLSFTier 3
Figure 2.9 Percent of Participants Employed in Unsubsidized Jobs in the Fourth Quarter Pre-Program and the Fourth Quarter Post-Program
0%
20%
40%
60%
80%
100%
Intermediary Model
Q Q4 Pre-Program
Q Q4 Post-Program
Direct Hire Model
Q Q4 Pre-Program
Q Q4 Post-Program
42%
24%28% 29%
23%
44%
58%
49%
62%
17% 17%
25%25%
40%
Both pre- and post-program employment rates were highest in Florida and Mississippi, where employers were required to take subsidized workers onto their payrolls and asked to commit to retaining the workers. These two programs reported higher retention rates by the subsidized employers in the quarter after the subsidy period ended—41 percent in Florida and 47 percent in Mississippi, compared to 16 percent in Wisconsin and about 18 percent in Los Angeles. Los Angeles and Wisconsin, where subsidized workers were not on employers’ payrolls, served a higher percentage of
18 Stimulating Opportunity: The Experiences of Job Seekers

people who were unemployed in the four quarters pre-program. While in these locations the subsidized employers retained smaller percentages of participants, employment rates still increased substantially, indicating that individuals found jobs elsewhere.
As described in the introduction, Florida of!cials provided us data not only for pro-gram participants but also for a comparison group of individuals who were eligible for the program but did not obtain subsidized jobs before the program expired. As seen in !gures 2.10 and 2.12, the two groups were similar in terms of their employ-ment rates and earnings in the year prior to the start of the program. In fact, non-participants were slightly more likely than participants to be employed and had slightly greater earnings pre-program, supporting the argument that post-program differences are not due to pre-program advantages among participants. Figure 2.10 shows that both the Back to Work participants and the comparison group of non-participants had higher employment rates in each quarter in the year after the pro-gram than in the year before. However, the percentage of Back to Work participants who were employed in each quarter post-program was higher than the percentage of comparison group members who were employed at statistically signi!cant levels.
Q4 Pre Q3 Pre Q2 Pre Q1 Pre Q1 Post Q2 Post Q3 Post Q4 Post
Figure 2.10 Percent Employed in Unsubsidized Jobs Pre- and Post-Program among Florida Back to Work (FBTW) Participants and Comparison Group Members
0%
20%
40%
60%
80%
100%
FBTW
Q Pre-Program
Q Post-Program
Comparison Group
Q Pre-Program
Q Post-Program
48%44% 43% 45%
41% 42%39% 41%
75%
52%
59% 59% 58%53% 53%52%
19 Stimulating Opportunity: The Experiences of Job Seekers

Participants Experienced Signi!cant Increases in Earnings From the Year Before to the Year After Program ParticipationParticipants in all of the study sites experienced substantial increases in annual earnings from the year before to the year after participation in the subsidized employment programs (see Figure 2.11).9 In Florida, Mississippi, Wisconsin, and
Los Angeles, the increase in earnings was due both to the increase in the per-centage of participants who were employed and increases in the amounts earned among those working. In San Francisco, even though the percentage of people employed did not increase in two of the tiers and rose only slightly in one tier, earn-ings among the individuals who worked increased substantially, so that earnings for the group as a whole increased. Participants in Florida and Mississippi had the highest earnings both pre- and post-program, but participants in both types of pro-gram models experienced considerable increases in annual earnings.
The comparison group analysis in Florida reveals that Back to Work participants had signi!cantly greater increases in annual earnings than did members of the comparison group of non-participants. Back to Work participants’ earnings increased by nearly $4,000 from the year before to the year after the program operated (see Figure 2.12). Comparatively, earnings among the comparison group members increased by $1,478. In the year following the end of the program, Back to Work participants earned nearly $2,000 more than the comparison group mem-bers. While the results are not as de!nitive as in a random control trial because there may be unmeasured differences between the groups that in"uence their
SFTier 2
SFTier 1
WILA MS FLSFTier 3
Figure 2.11 Average Annual Earnings from Unsubsidized Employment Pre- and Post-Program among All Participants
$0
$2,000
$4,000
$6,000
$8,000
$10,000
$12,000
Intermediary Model
Q Year Before Program
Q Year After Program
Direct Hire Model
Q Year Before Program
Q Year After Program
$11,511
$2,082
$5,325
$1,966
$5,276
$2,187
$5,476
$3,080
$4,671
$7,562
$6,483
$2,045
$4,369
$10,032
20 Stimulating Opportunity: The Experiences of Job Seekers

Long-Term Unemployed Individuals Experienced Substantial Employment and Earnings Gains After Participating in Subsidized EmploymentAcross four of the !ve study sites, participants who were among the long-term unemployed when they entered the program experienced substantial gains in employment and earnings in the year after program participation. As illustrated in !gure 2.13, while post-program earnings were generally higher for participants who entered the program with more recent work experience, the overall change in participants’ annual earnings over time was largely driven by the long-term unem-ployed in both the intermediary and direct hire program models. In Florida, long-term unemployed individuals who participated in subsidized employment earned on average $2,254 more than those in the comparison group in the year following the program (see Figure 2.14).
In sum, the programs in the study placed large numbers of unemployed individu-als into subsidized employment opportunities, helping them earn immediate income and accumulate work experience. Participants in most sites experi-enced substantial increases in employment and earnings from the year before to the year after program participation. In Florida, program participants realized
Year Before Program
Year After Program
$0
$2,000
$4,000
$6,000
$8,000
$10,000
$12,000
Figure 2.12 Average Annual Earnings among All Florida Back to Work (FBTW) Participants and Comparison Group Members
FBTW
Q Pre-Program
Q Post-Program
Comparison Group
Q Pre-Program
Q Post-Program
$11,511
$8,113$7,562
$9,591
outcomes, they strongly suggest that Florida’s subsidized employment model was an effective strategy for helping unemployed, low-income individuals move into employment and increase their earnings at a time when the state’s economy con-tinued to struggle to recover from the recession.
21 Stimulating Opportunity: The Experiences of Job Seekers

signi!cantly greater increases in employment and earnings than did individuals in a comparison group of people who were eligible for the program but did not participate. The evidence suggests that subsidized employment programs can bene!t job seekers struggling to !nd work, particularly the long-term unemployed. In Chapter 4, we look more closely at the !ve individual sites and further explore how the outcomes varied across participant subgroups and by differences in their subsidized employment experiences.
Figure 2.13 Average Annual Earnings Pre- and Post-Program by Long-Term Unemployment Status
WILA MS
Q Year Before Program
Q Year After Program
Long-Term Unemployed
Not Long-Term Unemployed
Not Long-Term Unemployed
Not Long-Term Unemployed
Long-Term Unemployed
Long-Term Unemployed
$0
$2,000
$4,000
$6,000
$8,000
$10,000
$12,000
$4,491
$494
$7,641
$6,499
$4,490
$322
$6,573
$4,683
$8,040
$934
$11,812
$10,204
FBTW Comparison Group$0
$2,000
$4,000
$6,000
$8,000
$10,000
Figure 2.14 Average Annual Earnings among Long-Term Unemployed Florida Back to Work (FBTW) Participants and Comparison Group Members
Q Year Before Program
Q Year After Program
$1,332
$9,781
$1,308
$7,527
22 Stimulating Opportunity: The Experiences of Job Seekers

Chapter 3Employer Experiences
For the most part, the employers in the survey had participated in the subsidized employment programs during the year prior to the survey, from July 2011 through July 2012. Some employers in Mississippi, San Francisco, and Los Angeles had participated in the earlier EF-supported versions of the programs as well. In San Francisco, only Tier 3 employers, those in the private sector who took workers onto their payrolls, were included in the survey.
Two-Thirds of Employers Were For-Pro!t Firms and Just Over Half Had Fewer Than Twenty EmployeesAcross the study sites, about two-thirds of the 633 employers interviewed were for-pro!t !rms (see Figure 3.1). The two programs that provided a partial subsidy to employers who brought workers onto their own payroll, San Francisco and Mississippi, served a higher percentage of for-pro!t employers (79 percent to 89 percent) than the sites with fully subsidized wages, Los Angeles and Wisconsin. Los Angeles was the only program where the majority of employers (59 percent) were non-pro!t !rms. Just over half of the employers had fewer than 20 employ-ees at the location that took part in the subsidized employment program (see Figure 3.2). Mississippi served the highest percentage of employers with 50 or more employees (44 percent).
Public Agency 4%
Private Non-Pro!t Firm 30%
Private For-Pro!t Firm
66%
Figure 3.1 Nearly Two-Thirds of Employers Were For-Pro!t Firms
Less than 5 24%
5 to 915%
50 or More27%
20 to 4916%
10 to 1917%
Figure 3.2 Just over Half of Employers Had Fewer than 20 Employees
23 Stimulating Opportunity: Employer Experiences

Employers from a wide range of industries participated in the subsidized employ-ment programs (see Figure 3.3). The top three industries in terms of both numbers of employers and subsidized workers employed, were social services, manufactur-ing, and wholesale and retail trade. Los Angeles had the greatest percentage of employers in the social services industry (37 percent) while Mississippi had the greatest percentage in manufacturing (36 percent). Most employers in the social services and educational services industries were non-pro!ts or public agencies, while most employers in the other industries were for-pro!t !rms.
Professional/Scienti!c/Technical
SocialServices
Manufacturing Wholesale and Retail Trade
Leisure/Hospitality
Finance/Insurance/Real Estate
Construction Administrative/Remediation
Health Care EducationalServices
Government Utilities/Transportation
Figure 3.3 Employers in a Variety of Industries Employed Subsidized Workers
0%
5%
10%
15%
20%18%
14%
12%
10%
6% 6% 6% 6%5% 5%
3%2%
Just Over Half of Firms Had Three or More Subsidized WorkersEmployers in the survey reported employing a total of 4,680 subsidized workers. Forty-!ve percent of employers had one or two subsidized workers (see Figure 3.4). The median number was three. While there were differences in the number of sub-sidized workers placed with each employer across the programs (see Figure 3.5), these differences do not appear to correlate with a program structure or subsidy level. Of the two programs where workers were on third party payrolls and wages were subsidized 100 percent, one had the highest percentage of employers with ten or more subsidized workers (35 percent in Los Angeles) while the other had the lowest percentage (12 percent in Wisconsin).
For-pro!t !rms accounted for just over half (54 percent) of the subsidized work-ers placed. Non-pro!t !rms and government agencies were slightly more likely than for-pro!t !rms to employ ten or more subsidized workers (21 percent ver-sus 17 percent). The median number of subsidized workers employed was three among for-pro!t !rms and four for non-pro!ts and government agencies. Although larger establishments of 50 or more employees made up just over a quarter of
24 Stimulating Opportunity: Employer Experiences

the sample, they employed 60 percent of the subsidized workers reported in the survey. As shown in !gure 3.6, the number of subsidized workers employers had increased with the size of the establishment. Employers in the wholesale and retail trades, social services, educational services, and manufacturing industries employed a greater number of subsidized workers per !rm than did employers in other industries.
1: 27%
2: 18%3 to 9: 36%
10 to 19: 10%
20 to 177: 9%
Figure 3.4 Number of Subsidized Workers Per Employer
MS SF LAWI
Figure 3.5 Number of Subsidized Workers Per Employer Across Sites
0%
20%
40%
60%
80%
100%
Q 1 or 2 Q 3 to 9 Q 10 or More
12% 13%
41%
45%
35%
43%
23%
36%
27%
37%
30%
59%
Less than 10 10 to 49 50 or More
Figure 3.6 Number of Subsidized Workers by Size of Employer
0%
20%
40%
60%
80%
100%
Size of Employer
Q 1 or 2 Q 3 to 9 Q 10 or More
62%
32%
6%
38%
47%
14%18%
33%
48%
25 Stimulating Opportunity: Employer Experiences

Primary Reasons Employers Participated Were to Help People Struggling to Find Work and the Opportunity for Free or Low-Cost LaborWhen asked how much various factors contributed to employer decisions to take part in the subsidized employment program, the most important factors cited were the desire to help those struggling to !nd work and the opportunity for free or low-cost labor (see Figure 3.7). Employers in the two programs where subsidized workers were on the payroll of a third party, Los Angeles and Wisconsin, were more likely to say that the opportunity to try out an employee before committing fully con-tributed a lot to their decisions (56 and 48 percent, respectively, compared to 36 percent in Mississippi and 40 percent in San Francisco). Non-pro!t employers were more likely to say that the desire to help people struggling to !nd work contributed heavily to their decisions.
Figure 3.7 How Much Each Factor Contributed to Employers' Decisions to Take Part in the Program
Q A Lot Q Some
A Desire to Help People Struggling to Find Work
The Opportunity for Free or Low-Cost Labor
The Opportunity to Try Out an Employee
The Opportunity to Grow or Sustain Operations
The Opportunity to Get Assistance with Recruiting
A Positive Experience with the Agency in the Past
0% 20% 40% 60% 80% 100%
62%
45%
44%
38%
41%
24%
34%
32%
27%
18%
66% 25%
Nearly Two-Thirds of Employers Created New Positions to Bring on the Subsidized WorkersThe subsidized employment programs we studied pursued a variety of goals. Some programs, particularly when the EF grants were available, sought to use the subsidy to persuade employers to create new positions. Other programs sought to in"uence employer hiring, using the subsidy to encourage employers to try individuals whom they might not otherwise consider due to limited recent work histories or education. A major-ity of the employers we interviewed (63 percent) said when they !rst began working with the program they created new positions in order to employ the subsidized work-ers. As shown in !gure 3.8, some employers had no hiring plans but created positions, some hired more people than they otherwise would have, and others had a need but no resources to hire before the subsidy was available. Just over a third said they were planning to hire, and the program allowed them to !ll available positions.
26 Stimulating Opportunity: Employer Experiences

Non-pro!ts and government agencies were more likely than for-pro!t !rms to create new positions in order to provide opportunities for subsidized workers (81 percent versus 55 percent). Small establishments with fewer than ten employees were more likely to create new positions than larger establishments with 50 or more employees (72 percent compared to 55 percent). In Los Angeles, where most sur-veyed employers were non-pro!ts or government agencies, and wages were fully subsidized, the highest percentage of employers (75 percent) said they created new positions to bring on the subsidized workers. In San Francisco, where the post-EF program targeted employers who were hiring and provided partial wage subsi-dies, the lowest percentage of employers said they created new positions, although more than half did so (54 percent).
Figure 3.8 The Majority of Employers Created New Positions to Bring on the Subsidized Workers
3%
14%
18%
31%
34%
■ The business did not have any immediate hiring plans, but took advantage of the program to !ll a new position
■ The business was already planning to hire and the program allowed it to hire more people than it otherwise would have
■ The business would have liked to hire, but didn’t have the resources to do so before the program
■ The business was already planning to hire and the program allowed it to !ll available positions
■ The business did not have any immediate hiring plans, but the subsidized worker replaced someone who would have left anyway
Q Created New Positions Q Filled Existing Positions
A Majority of Employers Said Subsidized Workers Had Less Work Experience Than Those Typically Hired for Similar Positions, but Job Performance Was About the Same or BetterAs noted above, some subsidized employment programs sought to use the subsidy to persuade employers to hire workers they might not typically consider, such as individuals unemployed for long periods. We asked employers how the subsidized workers compared to people they would normally hire for similar positions. Just over half (53 percent) said the subsidized workers had less work experience than other employees in similar positions. Employers were less likely to perceive differ-ences in worker education and race. Just over half (56 percent) said the subsidized workers had about the same education as other employees, and two-thirds said the subsidized workers were as likely as other employees to be from a minority racial or ethnic group. Signi!cant differences existed in how subgroups of employers viewed subsidized workers as compared to employees in similar positions.
27 Stimulating Opportunity: Employer Experiences

Non-pro!t employers were more likely than for-pro!t employers to say subsidized workers had less education and work experience than their other employees.
Small employers with fewer than ten employees were also more likely to say sub-sidized workers had less education than their other employees.
Mississippi employers were much more likely than employers in other sites to say subsidized workers had about the same or more education (87 percent ver-sus 53 percent elsewhere) and about the same or more work experience (68 percent versus 40 percent elsewhere) as their other employees. San Francisco employers were the most likely to say subsidized workers were more likely to be from a minority racial or ethnic group than their other workers (35 percent) while Mississippi employers were the least likely to say so (19 percent).
When asked how the subsidized workers’ on-the-job performance compared to that of people they would typically hire for similar positions, 61 percent said the subsidized workers’ occupational skills were about the same or stronger than those of other employees in similar positions (see Figure 3.9). Two-thirds said the subsidized workers were as or more dependable than other employees in terms of attendance and punctuality. There were no signi!cant differences in for-pro!t and non-pro!t employers’ perceptions of the subsidized workers’ on-the-job perfor-mance. Mississippi employers were substantially more likely than those in other sites to say subsidized workers’ occupational skills and dependability were about the same or stronger than those of their other workers.
Figure 3.9 More than 60 Percent of Employers Said the Subsidized Workers' Performance Was the Same or Stronger than that of Other Employees in Similar Positions
Q Stronger Q About the Same Q Weaker
0% 20% 40% 60% 80% 100%
15% 46% 39%
20% 48% 32%Dependability, Including Attendance and
Punctuality
Occupational Skill Level
Across the Sites, Employers Reported Retaining 37 Percent of Subsidized Workers After the Subsidy Period EndedWhile the subsidized employment programs we studied did not require employers to hire workers after the subsidy ended, some encouraged it if the workers performed well. Others did not expect employers to hire the workers but viewed the subsidy period as a chance for workers to build experience and skills that would help them obtain employment elsewhere. In the two sites where workers were on the employer payrolls and employers received partial or step-down subsidies, San Francisco and Mississippi, just over 70 percent of employers said there was an expectation that
28 Stimulating Opportunity: Employer Experiences

they would retain the workers after the subsidy period ended. In the two sites where workers were on third party payrolls with 100 percent subsidies, Los Angeles and Wisconsin, just under half of the participating employers said there was an expecta-tion that they would hire the workers directly once the subsidy period ended.
Across all of the programs, about three-quarters of the employers (76 percent) reported that they retained at least one of the subsidized workers after the subsidy period ended. However, most subsidized workers were not retained. Across the sites, employers reported retaining 37 percent of the subsidized workers after the subsidy period ended. There were some signi!cant differences in retention across subgroups of employers.
The percentage of subsidized workers retained was greater in the two locations where the workers were on the employer payrolls from the start of the subsidy period (41 percent in San Francisco and 54 percent in Mississippi) than in the two sites where workers were on the payroll of a third party (27 percent in Los Angeles and Wisconsin).
For-pro!t employers were more likely than non-pro!ts or government agencies to retain any workers (81 percent versus 68 percent). For-pro!t !rms also retained a somewhat higher percentage of their subsidized workers than non-pro!ts or government agencies (43 percent versus 35 percent).
Small establishments of fewer than !ve employees were less likely to retain at least one subsidized worker than establishments with !ve or more employees (65 percent versus 80 percent).
Employers with ten or more subsidized workers retained a smaller percentage (31 percent) than employers with only one or two subsidized workers (55 percent).
When asked how important various factors were in their decisions not to hire or retain subsidized workers, the most important factors employers cited were that the workers did not perform well enough in their jobs and that they had poor attendance. Employers in the two locations that provided a 100 percent subsidy, Los Angeles and Wisconsin, were more likely to say that not having the !nancial resources to keep the workers was a very important reason for not retaining them (56 and 34 percent, respectively, compared to 18 percent in Mississippi and San Francisco). In the two sites where workers were on employer payrolls and a partial subsidy was provided, San Francisco and Mississippi, employers were more likely to say that workers’ job performance was a very important reason for not retaining them (67 and 61 percent, respectively, compared to 36 percent in Los Angeles and 43 percent in Wisconsin). Non-pro!ts and government agencies were more likely to say they lacked the !nancial resources to keep the workers, while for-pro!ts were more likely to say that they did not hire or retain workers because they did not perform well enough. The reasons for not retaining workers were similar across employers of different sizes, although larger employers were somewhat more likely to say poor attendance was an important reason.
29 Stimulating Opportunity: Employer Experiences

Employers Cited Multiple Bene!ts to Participating in the Subsidized Employment ProgramsMost employers (83 percent) said they realized savings as a result of taking part in the subsidized employment program. We asked employers whether employing subsidized workers had a positive, negative, or no effect on various aspects of their business operations. Across the board, a large majority of employers said they experienced multiple bene!ts from participating in the program (see Figure 3.10). Employers noted that the program allowed them to increase their workforces and !ll positions they had been unable to !ll. This allowed many employers to serve more customers or expand the services they offered. Employers said the program helped their company work more effectively because having the subsidized workers reduced the workload for other employees, enabling them to better focus on spe-ci!c tasks and meet deadlines. About two-thirds of employers said the program had a positive effect on their ability to recruit quali!ed workers.
Non-pro!t !rms were somewhat more likely than for-pro!t !rms to say the program had a positive effect on the number of workers they employed, productivity and employees’ satisfaction with their workloads, but responses were highly posi-tive within both groups. For the most part, the reported bene!ts did not vary by employer size, as both large and small establishments realized savings and other bene!ts from program participation. The one exception was that establishments with fewer than 50 employees were somewhat more likely to say the program had a positive effect on customer satisfaction.
Figure 3.10 How Employing Subsidized Workers Affected the Employers
Q Had a Very Positive Effect Q Had a Somewhat Positive Effect
Productivity
The Number of Workers the Business Employs
Business Pro!ts/ Service Levels
Employees’ Satisfaction with Their Workload
Customer Satisfaction
The Ability to Recruit Quali!ed Workers
0% 20% 40% 60% 80% 100%
38%
33%
35%
37%
27%
39%
43%
38%
34%
41%
37% 42%
30 Stimulating Opportunity: Employer Experiences

Most Employers Expressed High Levels of Satisfaction with the Program and Said They would Be Very Likely to Participate in a Subsidized Employment Program in the FutureAbout three-quarters of employers (76 percent) said they would be very likely to participate if the subsidized employment program continues or is offered again in the future, and another 15 percent said they would be somewhat likely to do so. The majority of employers expressed a high level of satisfaction with com-munication from the program staff and the process of hiring subsidized workers (see Figure 3.11). The aspect on which employer responses varied the most was the quality of the workers the programs provided. Overall, 38 percent of employ-ers said they were very satis!ed with the quality of the candidates and another 39 percent were somewhat satis!ed. Non-pro!ts and government agencies were more likely than for-pro!t employers to say they were very satis!ed with the qual-ity of the candidates (47 percent versus 34 percent). Employers in Mississippi and Los Angeles were more likely to say they were very satis!ed with the qual-ity of the workers (53 and 41 percent, respectively, compared to 32 percent in Wisconsin and 26 percent in San Francisco). Employers in Mississippi and Los Angeles were also more likely to say they would be very likely to participate in the program in the future (88 and 86 percent, respectively, compared to 66 percent in Wisconsin and 65 percent in San Francisco).
Employers with negative comments about the programs generally reported that the workers lacked basic employment skills and needed more support or training to stay on the job. When asked what supports would have been most helpful to the workers while they were in the subsidized positions, the four most common employer responses, chosen by at least a quarter of the employers, were child care, transportation, coaching on communication skills, and computer training.
Figure 3.11 Employers' Satisfaction with the Various Aspects of the Subsidized Employment Programs
Q Very Satis!ed Q Somewhat Satis!ed
Communication with the Program Staff
The Speed of Reimbursement for Wages Paid
The Process of Hiring a Subsidized Worker
The Support the Program Provided Workers
The Reporting Requirements
The Quality of the Candidates the Program Sent
0% 20% 40% 60% 80% 100%
62%
59%
59%
54%
38%
27%
32%
28%
33%
39%
77% 14%
31 Stimulating Opportunity: Employer Experiences

Most Employers Would Be Willing to Take Part in a Program That Offered a Partial SubsidyOne important question for the !eld is how program design in"uences employer decisions to participate in a subsidized employment program, such as the level of subsidy required to convince employers to participate. While the survey results revealed that employer willingness to participate in programs of varying design is greatly in"uenced by their past experiences, some useful lessons resulted from their responses. As shown in !gure 3.12, most employers (94 percent) said they would be very or somewhat likely to participate in a program that covered 100 per-cent of worker wages for six months. The percentage of employers who said they would likely participate declined as the subsidy levels decreased to 75 percent and 50 percent, but most indicated that they would participate in a program with a par-tial subsidy that lasted six months. Fewer than half of employers said they would be very or somewhat likely to take part in a program that subsidized 50 percent of worker wages for three months.
Figure 3.12 Employers' Likelihood of Participating in Programs Offering Varying Subsidy Levels
Q Very Likely Q Somewhat Likely
Subsidy Covers 100% of Workers’ Wages for 6 Months
Subsidy Covers 75% of Workers’ Wages for 6 Months
Subsidy Covers 50% of Workers’ Wages for 6 Months
Subsidy Covers 100% of Workers’ Wages for 3 Months
A Program Where Subsidized Workers are on the Business’s Payroll from Day One
0% 20% 40% 60% 80% 100%
60%
33%
19%
41%
25%
29%
26%
26%
84% 10%
While for-pro!t and non-pro!t employers were equally likely to say they would take part in a program with a 100-percent subsidy for six months, once the subsidy falls below 100 percent, non-pro!ts are substantially less likely to participate than for-pro!ts. For instance, 73 percent of the for-pro!t employers said they would be very or somewhat likely to take part in a program with a 50-percent subsidy for six months compared to only 40 percent of non-pro!ts. Larger employers of 50 or more employees were more likely than smaller employers to be very or somewhat likely to take part in a program where the subsidy covered 50 percent of wages for either six or three months.
Two-thirds of employers said they would be very or somewhat likely to take part in a program where subsidized workers are on their payroll from the beginning. It should be emphasized that this varied signi!cantly by whether employers had
32 Stimulating Opportunity: Employer Experiences
already participated in such a program. Most employers in the two sites where subsidized workers were on the employer payrolls (94 percent in Mississippi and 80 percent in San Francisco) said they would be likely to participate in a similar program again. However, in the two sites where subsidized workers were on third-party payrolls, fewer than half of employers (46 to 48 percent) said they would likely take part in a program where workers were on their payrolls from day one. For-pro!t employers were more likely than non-pro!ts and public agencies to be willing to take part in a program where workers are on their payrolls from the !rst day (77 percent versus 49 percent).
In sum, the !ndings indicate that employers of varying sizes and from a range of industries valued the opportunities presented by the subsidized employment pro-grams. A majority of employers reported that they experienced multiple bene!ts from participating in the programs and were eager to take part in similar programs in the future. Nearly two-thirds created new positions to bring on subsidized work-ers. Three-quarters retained at least one of their subsidized workers after the subsidy period ended, although overall they reported retaining 37 percent of the workers. Non-pro!t !rms were more likely to be motivated to participate by the desire to help people struggling to !nd work. They brought on a greater number of workers per !rm and were more likely to take workers with less work experience and education than the people they typically hired for similar positions. However, non-pro!ts were more likely to say they did not have the resources to retain subsi-dized workers after the subsidy period ended. For-pro!t !rms retained a greater per-centage of the subsidized workers after the subsidy period ended and were more willing to take part in subsidized employment programs with partial subsidies.
33 Stimulating Opportunity: Employer Experiences

Chapter 4Job Seeker and Employer Experiences in Each of the Study Sites
We next turn to the experiences of job seekers and employers in each of the !ve study locations. The !rst four programs presented, in Los Angeles, Wisconsin, San Francisco’s Tier 1 Community Jobs program and the San Francisco Tier 2 Public Sector Trainee program, implemented the intermediary model described in the introduction. The last three programs, San Francisco’s Tier 3 Wage Subsidy pro-gram and those in Mississippi and Florida, implemented the direct hire model in which employers were required to place subsidized workers on their payrolls from the start of the subsidy period.
The Los Angeles Transitional Subsidized Employment (TSE) Program
The Los Angeles Department of Public Social Services (DPSS) administers the Transitional Subsidized Employment (TSE) Program. The county had been running a subsidized employment program for about six years prior to the EF program, serv-ing about 500 people per year. With the EF money, DPSS sought to substantially expand the program by placing 10,000 people into jobs. The program’s goals were, !rst, to help more people earn immediate income through subsidized employment opportunities and, second, to get workers into unsubsidized jobs after the subsidy period ended. With $149.9 million of Emergency Funds, the TSE program placed 10,719 people into subsidized jobs from April 2009 through September 2010. After the EF money ended, DPSS continued to operate a subsidized employment program using funds from the county’s CalWORKs single allocation and through state funds that reimbursed the county for wages employers paid to subsidized workers. From January to June 2011, the post-EF TSE program placed more than 1,500 people into subsidized positions.10
Program DesignDPSS contracted with the South Bay Workforce Investment Board (WIB), which man-aged the county’s existing subsidized employment program, to manage the TSE program. During the EF period, the South Bay WIB subcontracted with the county’s 44 WorkSource Centers and four private agencies to operate the TSE program. The WorkSource Centers provide workforce development services under the Workforce Investment Act to job seekers and employers. Post-EF, with the number of clients served scaled down, 14 WorkSource Centers continued to operate the program.
Eligibility. TSE targeted TANF recipients. The program was not offered to those just applying for TANF. Individuals could have been in sanction status due to
34 Stimulating Opportunity: Job Seeker and Employer Experiences in Each of the Study Sites

noncompliance with program requirements and resolved the sanction by participat-ing. During EF, the program also served some dislocated workers, non-custodial par-ents, and people in a layoff aversion program, but these groups accounted for only 11 percent of subsidized placements. In the post-EF program, the change in funding source allowed the county to serve those who exceeded their TANF time limit.
Job preparation or training services. The participants were recruited from the regional Greater Avenues for Independence (GAIN) program of!ces, which provide employment-related services to TANF recipients. Participants took part in a four-week job club program run by the Los Angeles County Of!ce of Education Services, through which they received assistance with applying for jobs, including access to computers. Those who did not secure unsubsidized employment completed an assessment at the end of job club and staff determined whether they would ben-e!t from subsidized employment. During EF, most clients who completed job club without !nding work were referred to subsidized employment. Clients were then referred to the WorkSource Centers and screened to see if they were a good !t for a subsidized position.
Subsidy structure and employer of record. During EF and in the post-EF work experi-ence program, the South Bay WIB acted as the employer of record for all TSE partici-pants, and DPSS reimbursed it for 100 percent of the wages it paid to the subsidized workers and workers’ compensation coverage. During EF through September 2011, the workers were placed in subsidized employment opportunities at other non-pro!ts, for-pro!t !rms and public agencies. Starting in October 2011, only non-pro!t and pub-lic agencies could participate in the work experience program.
During EF, the county required employers to match the subsidy amount in the form of time spent supervising and training workers. The number of supervisors available determined how many subsidized workers an employer could have. The subsidized positions could be newly created or existing open positions. Employers in the TSE program were not expected to retain subsidized workers, although they could choose to do so. If employers did not plan to retain a worker, they were expected to allow the worker to take time off to search for a job near the end of the subsidy period.
In October 2011, DPSS started operating a second subsidized employment program track called on-the-job training (OJT). In the OJT program, workers were placed in subsidized positions at for-pro!t employers. The South Bay WIB acted as the employer of record for the !rst two months of the subsidy period, and DPSS reimbursed it for 100 percent of wages paid. In the last four months of the subsidy period, the employers were expected to take workers onto their payrolls and received partial subsidies toward the workers’ wages. If a subsidized worker worked 32 hours or more per week, the employer was reimbursed $550 per month (equivalent to 50 percent of the minimum wage for 32 hours per week).
35 Stimulating Opportunity: Job Seeker and Employer Experiences in Each of the Study Sites

For positions offering between 20 and 31 hours per week, the employer was reim-bursed $350 per month (equivalent to 50 percent of the minimum wage for 20 hours per week).
Employer recruitment. The county recruited non-pro!t and public employers that had previously participated in its subsidized work experience program. However, to ramp up to 10,000 positions, the county expanded the program to serve for-pro!t employers as well. The county launched a major marketing campaign to reach out to employers and invite them to information sessions about the program. It also accessed databases of non-pro!t entities, such as one maintained by the United Way, to identify potential employers who could bene!t from the program. The South Bay WIB maintained a database of employers with subsidized employment oppor-tunities that the WorkSource Centers could access. The centers were also respon-sible for developing relationships with other entities to create additional subsidized positions.
Support during the subsidy period. The WorkSource Centers were expected to provide job coaching to participants once they were in subsidized positions. The program required participants to go to the centers to pick up their paychecks once every two weeks. Center staff encouraged workers to use center resources to look for a job and provided job leads. The GAIN program provided child care, transporta-tion, clothing and tools, as needed, as did some of the centers. The program did not seek feedback from the employers during EF, but post-EF employers were asked to write comments about the subsidized workers on their timesheets, which the WorkSource Center staff reviewed.
Assistance securing unsubsidized employment. The WorkSource Centers were expected to provide assistance with obtaining unsubsidized employment at the end of the subsidy period. During the last couple months of the EF period, workers were allowed to conduct job search activities for up to 16 hours a month and still get paid for that time. Job developers assisted with job searches, and the centers received a $400 bonus for each unsubsidized job placement that lasted for at least six months.
Characteristics of the TSE Program ParticipantsMost participants in the TSE work experience program were female, and 55 percent were under age 30 (see Figure 4.1).11 As in San Francisco, a large majority of par-ticipants were among the long-term unemployed when they entered the program. The post-EF program had a higher percentage of long-term unemployed participants than the EF program (89 percent versus 73 percent).
36 Stimulating Opportunity: Job Seeker and Employer Experiences in Each of the Study Sites

Figure 4.1 TSE Program Participant Characteristics
EF Post-EF
Gender
Female 79% 82%
Male 21% 18%
Age
Under 30 55% 55%
30 to 39 26% 26%
40 to 49 15% 15%
50 and over 4% 4%
Long-term unemployed 73% 89%
Average annual earnings in the year before program entry
$2,082 $1,943
The TSE Program Subsidized JobsDuring EF and the post-EF period covered by our analysis, TSE participants were placed in subsidized positions with non-pro!t, public and for pro!t employers. During EF, participants were paid $10.00 an hour in their subsidized jobs, which were expected to last at least six months, although some lasted up to a year. Nearly half of EF placements (47 percent) were with for-pro!t !rms, 28 percent were with public agencies, and a quarter were with non-pro!t !rms. During the post-EF period, the hourly wage was $8.00 an hour and the duration of the subsidy period was four months. Participants in the EF program earned a total of $6,057, on average, from their subsidized positions, while participants in the post-EF pro-gram earned an average of $2,973.
Post-Program Employment and EarningsTurning to the state data on program participants’ employment and earnings, we found that the percentages of both EF and post-EF participants who were employed in the four quarters after program participation were greater than the percentages employed in any of the four quarters before the program (see Figure 4.2). Post-program employment rates among participants in the post-EF program were greater than those of participants in the EF program.
Average earnings among participants who were working increased between the year before and the year after program participation (see Figure 4.3). Although employ-ment rates were lower among EF participants than among post-EF participants, aver-age earnings among those who worked were greater among the EF participants.
37 Stimulating Opportunity: Job Seeker and Employer Experiences in Each of the Study Sites
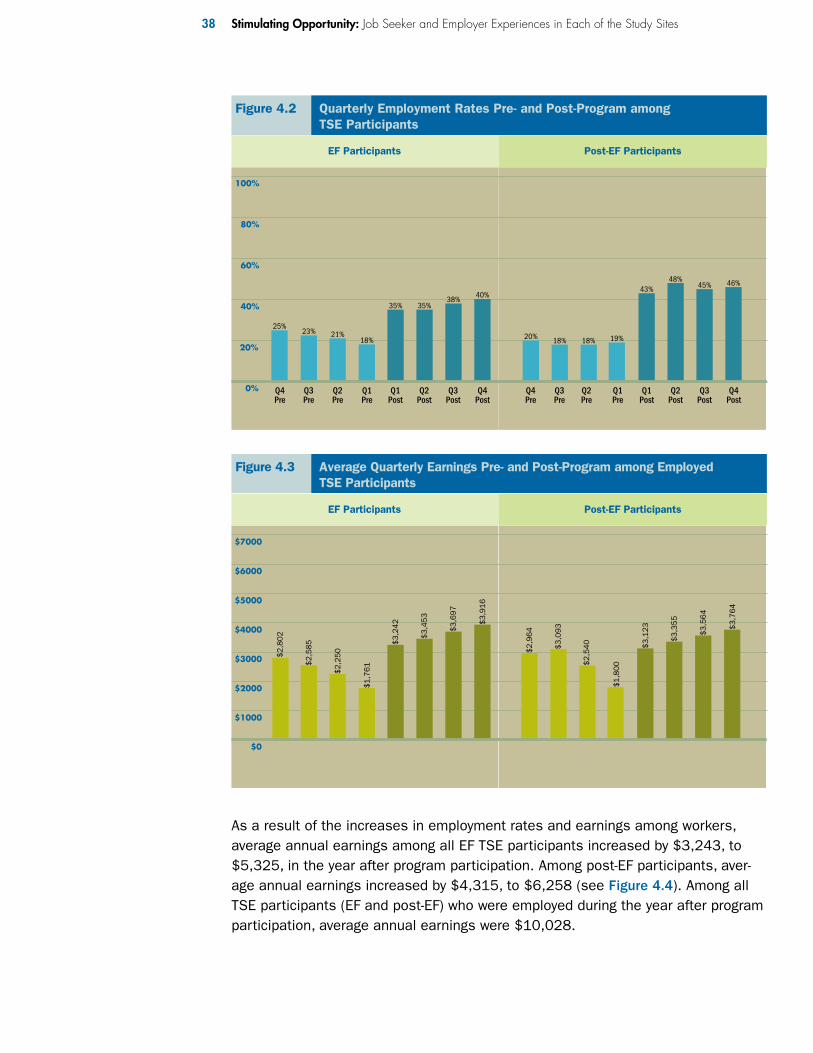
As a result of the increases in employment rates and earnings among workers, average annual earnings among all EF TSE participants increased by $3,243, to $5,325, in the year after program participation. Among post-EF participants, aver-age annual earnings increased by $4,315, to $6,258 (see Figure 4.4). Among all TSE participants (EF and post-EF) who were employed during the year after program participation, average annual earnings were $10,028.
Q4 Pre
Q3 Pre
Q2 Pre
Q1 Pre
Q1 Post
Q2 Post
Q3 Post
Q4 Post
Q1 Post
Q2 Post
Q3 Post
Q4 Post
Q4 Pre
Q3 Pre
Q2 Pre
Q1 Pre
Figure 4.2 Quarterly Employment Rates Pre- and Post-Program among TSE Participants
0%
20%
40%
60%
80%
100%
EF Participants Post-EF Participants
23% 21%18%
35% 35%38% 40%
18% 19%
43%48%
45% 46%
20% 18%
25%
Q4 Pre
Q3 Pre
Q2 Pre
Q1 Pre
Q1 Post
Q2 Post
Q3 Post
Q4 Post
Q1 Post
Q2 Post
Q3 Post
Q4 Post
Q4 Pre
Q3 Pre
Q2 Pre
Q1 Pre
Figure 4.3 Average Quarterly Earnings Pre- and Post-Program among Employed TSE Participants
$0
$1000
$2000
$3000
$4000
$5000
$6000
$7000
EF Participants Post-EF Participants
$2,8
02
$2,5
85
$2,2
50
$1,7
61
$3,2
42
$3,4
53
$3,6
97
$3,9
16
$2,9
64
$3,0
93
$2,5
40
$1,8
00
$3,1
23
$3,3
55
$3,5
64
$3,7
64
38 Stimulating Opportunity: Job Seeker and Employer Experiences in Each of the Study Sites

Outcomes for TSE Program Participant SubgroupsWe examined differences in outcomes among subgroups of participants and found no signi!cant differences in the changes male and female participants experienced in employment and earnings. Participants who were under age 50 were more likely to be employed in the fourth quarter post-program than those who were age 50 or older. In the post-EF program only, those under age 50 were also more likely to experience a greater change in annual earnings after participating in the program. As !gure 4.5 shows, participants who had been receiving TANF for shorter periods of time when they started the program experienced signi!cantly greater increases in annual earnings after participating in the TSE program.
Among the EF participants who were among the long-term unemployed at the time of program entry, 35 percent were employed in the fourth quarter after pro-gram participation, compared to 55 percent of participants who had more recent work experience. The difference in fourth quarter post-program employment rates between the long-term unemployed and those with more recent work experience was similar among the post-EF participants. While post-program annual earnings were lower for the long-term unemployed than for participants who had more recent work histories, both groups experienced substantial increases in earnings (see Figure 4.6).
EF Participants Post-EF Participants$0
$1000
$2000
$3000
$4000
$5000
$6000
$7000
$8000
Figure 4.4 Average Annual Earnings Pre- and Post-Program among All TSE Participants
Q Year Before Program Q Year After Program
$1,943
$5,325
$2,082
$6,258
39 Stimulating Opportunity: Job Seeker and Employer Experiences in Each of the Study Sites

Figure 4.5 Average Annual Earnings Pre- and Post-Program by Months Receiving TANF Prior to Program
Less than 18
18 to 30 31 to 43 44 or More
Less than 18
18 to 30 31 to 43 44 or More
$0
$2,000
$4,000
$6,000
$8,000
$10,000
$12,000
Q Year Before Program Q Year After Program
EF Participants Post-EF Participants
$9,801
$3,428
$2,590
$6,966
$1,823
$4,789
$1,487
$2,586$3,218
$10,421
$2,351
$1,500$957
$5,913
$3,757
$6,304
Figure 4.6 Average Annual Earnings Pre- and Post-Program by Long-Term Unemployment Status
Long-Term Unemployed
Not Long-Term Unemployed
Long-Term Unemployed
Not Long-Term Unemployed
$0
$2000
$4000
$6000
$8000
$10,000
Q Year Before Program Q Year After Program
EF Participants Post-EF Participants
$4,491
$494
$6,499
$7,641
$334
$5,177
$6,460
$9,290
40 Stimulating Opportunity: Job Seeker and Employer Experiences in Each of the Study Sites

Differences in Outcomes by Program ExperienceAs noted earlier, the subsidized positions during the EF program were expected to last at least six months and some lasted up to a year. Participants who stayed in their subsidized positions for a longer period of time had greater annual earnings post-program and experienced greater increases in annual earnings, but only up to a point. Those who were in their subsidized positions for nine or more months had lower annual earnings and a smaller change than those who were in the positions for six to nine months (see Figure 4.7). In the post-EF program, in which subsidized positions were expected to last for four months, the change in earnings did not vary signi!cantly by the length of time participants were in their subsidized positions.
Figure 4.7 Average Annual Earnings Pre- and Post-Program by Number of Months in SubsidizedPosition among TSE EF Participants
Up to 3 Between 3 and 6
Between 6 and 9
9 or more$0
$2000
$4000
$6000
$8000
Q Year Before Program Q Year After Program
$4,127
$1,956$2,164
$5,280
$2,232
$6,184
$1,978
$5,717
Employer Experiences with the TSE ProgramWe conducted the survey with 131 employers who participated in the TSE program from July 2011 through June 2012, some of whom had also participated in earlier versions of the program. Los Angeles was the only location in the study where the majority of employers (59 percent) were non-pro!t agencies. Just over one-third (35 percent) were for-pro!t !rms and 7 percent were government agencies. More than one-third of employers (37 percent) were in the social services industry. The next two most common industries were !nance, insurance, and real estate (12 percent) and educational services (8 percent). Just over half of employers (54 percent) had fewer than 20 employees; 30 percent had 50 or more.
41 Stimulating Opportunity: Job Seeker and Employer Experiences in Each of the Study Sites

Los Angeles had the most employers with ten or more subsidized workers (35 percent) of any of the !ve study locations. Another 43 percent of Los Angeles employers had three to nine subsidized workers, and only 23 percent had one or two. Non-pro!t employers had a median of seven subsidized workers compared to three among for-pro!t !rms. Nearly all of the employers said that the desire to help people struggling to !nd work contributed “a lot” or “some” to their decisions to take part in the program (see Figure 4.8). Like in Wisconsin (the other site that subsidized 100 percent of wages and did not require employers to place subsi-dized workers on their payrolls), the other most common factors in the decision to participate in TSE were the opportunity for free or low-cost labor and the chance to try out an employee before making a commitment. Three-quarters of the employers in Los Angeles created new positions to bring on subsidized workers—as opposed to !lling existing positions—the highest percentage across the !ve study sites.
Figure 4.8 How Much Each Factor Contributed to Employers' Decisions to Take Part in the TSE Program
Q A Lot Q Some
A Desire to Help People Struggling to Find Work
The Opportunity for Free or Low-Cost Labor
The Opportunity to Try Out an Employee
The Opportunity to Grow or Sustain Operations
A Positive Experience with the Agency in the Past
The Opportunity to Get Assistance with Recruiting
0% 20% 40% 60% 80% 100%
63%
57%
52%
47%
37%
23%
26%
25%
24%
28%
78% 16%
When asked to compare the subsidized workers to those they would normally hire for similar positions, 70 percent said the subsidized workers had less work experience and 59 percent said they had less education than the people they typically hire. Most (71 percent) said the subsidized workers were about as likely to be from a minority racial or ethnic group as other employees in similar positions. Asked how subsidized workers’ job performance compared to that of employees usually hired for similar positions, about half (51 percent) said the subsidized workers’ occupational skills were weaker but 66 percent said the subsidized workers were as dependable or more dependable than other workers in terms of attendance and punctuality.
Three-quarters of the employers interviewed said they hired at least one subsidized worker after the subsidy period ended. Overall, employers reported hiring 27 per-cent of the subsidized workers after the subsidy period ended. For-pro!t employers were more likely than non-pro!ts to hire at least one subsidized worker, and they hired a higher percentage of the workers (40 percent versus 24 percent). Smaller
42 Stimulating Opportunity: Job Seeker and Employer Experiences in Each of the Study Sites

employers (with fewer than !ve employees) were less likely than larger employers to hire at least one of the subsidized workers. When asked how important vari-ous factors were in decisions not to hire subsidized workers, more than half (56 percent) said that not having the !nancial resources to keep the workers was very important—the highest percentage across the !ve study sites. The next most com-mon reasons were that workers did not perform well enough in their jobs (36 per-cent) or had poor attendance (34 percent).
Employers realized a number of bene!ts from participating in the subsidized employment program (see Figure 4.9). Most (87 percent) said the program had a very or somewhat positive effect on productivity. Los Angeles had the highest per-centage of employers across the study sites who said the program had a very posi-tive effect on employees’ satisfaction with their workloads. Nearly three-quarters (72 percent) of employers said they realized savings as a result of taking part in the program. Employers expressed high levels of satisfaction with various aspects of the program. After Mississippi, employers in Los Angeles were more likely than those in other locations to say they were very satis!ed with the quality of the candi-dates the program sent. Most employers (86 percent) said they would be very likely to participate in the program again; another nine percent said they would be some-what likely to do so.
Figure 4.9 How Employing Subsidized Workers Affected TSE Employers
Q Had a Very Positive Effect Q Had a Somewhat Positive Effect
Productivity
Business Pro!ts/Service Levels
The Number of Workers the Business Employs
Employees’ Satisfaction with their Workload
Customer Satisfaction
The Ability to Recruit Quali!ed Workers
0% 20% 40% 60% 80% 100%
41%
45%
44%
46%
33%
43%
38%
37%
32%
44%
49% 38%
43 Stimulating Opportunity: Job Seeker and Employer Experiences in Each of the Study Sites

ConclusionsLos Angeles was successful in reaching its target of placing 10,000 people into subsidized employment opportunities. The keys to reaching this goal included having the requisite political support, employing an extensive outreach campaign to get employers on board, and using of the county’s full network of Workforce Centers to implement the program.
The county relied more on non-pro!t employers than the other sites in the study. While this likely helped the county reach its goal in terms of subsidized place-ments, these types of employers were less likely to have the !nancial resources to hire workers once the subsidy period ended.
Despite the low retention rates by subsidized employers, participants experi-enced signi!cant increases in employment rates from the year before to the year after program participation, suggesting that many participants found unsubsi-dized employment elsewhere after working in subsidized positions.
The program almost exclusively targeted TANF recipients. Those who had been receiving TANF for less than 18 months when they started the TSE program expe-rienced greater increases in employment and earnings than those who had been receiving TANF for a longer period of time. The latter group may require more sup-ports or training to achieve similar success levels.
Most participants in Los Angeles were among the long-term unemployed. While this group had lower post-program earnings than participants who had more recent work experience, the long-term unemployed experienced signi!cant gains in employment and earnings after participating in the program.
Participants in the post-EF program had better post-program employment out-comes than those in the EF program, despite the fact that they were more likely to be among the long-term unemployed at program entry. This may partly re"ect improvements in the economy at the time the participants exited the program. The !ndings also support some observations made by program administrators.
For the post-EF program, the subsidy period was shortened from 12 months to four months, and the pay rate was reduced from $10.00 to $8.00 an hour. Program administrators viewed the longer subsidy period and higher pay rate as hindrances in the transition to unsubsidized employment. Participants were less likely to continue to look for unsubsidized employment when the subsidy period was lengthy. Additionally, the $10.00 hourly pay rate was more than many participants could earn in the competitive labor market but they became reluctant to take jobs that paid less.
The large number of people served during the EF period made it dif!cult for WorkSource Centers to help many participants move into unsubsidized employment. With smaller numbers, the staff could provide more individual-ized job development assistance.
44 Stimulating Opportunity: Job Seeker and Employer Experiences in Each of the Study Sites

The Wisconsin Transitional Jobs (TJ) Program
Wisconsin’s Department of Children and Families administers the Transitional Jobs (TJ) Demonstration Project. Initially the state drew down the Emergency Funds for short-term, non-recurring bene!ts, which enabled it to use other TANF funds to sup-port transitional jobs programs beyond the September 30, 2010 deadline. The TJ program was launched in September 2010 and extended through June 2013, with total funding of $28 million. The program goals were to generate immediate income for unemployed individuals, to help them build job skills, get a work reference, and move into unsubsidized employment, and to create jobs for small businesses that otherwise could not afford to take on new workers.
Program DesignWisconsin’s strategy for implementing the TJ program was to encourage experi-mentation. As such, it funded 17 contractors across the state to operate TJ pro-grams, prescribed a few core program elements, and then allowed contractors "exibility regarding the rest of the design. The TJ contractors were a mix of public agencies, non-pro!ts, and for-pro!t organizations, including seven agencies that administer Wisconsin Works (W2)—the state’s TANF program, four workforce invest-ment boards, two community action agencies, and four non-pro!ts with a history of providing employment services. The state required each contractor to develop programs with these elements: eligibility determination, orientation, subsidized employment and assistance with securing unsubsidized employment. Statewide, the average cost per subsidized placement was $7,913.
Eligibility. The TJ program targeted unemployed populations who were likely not being served through other programs. To be eligible for the TJ program, individu-als had to be out of work for at least four weeks, with incomes below 150 percent of the federal poverty line. Individuals could not be receiving W-2 bene!ts. They also could not be eligible for or receiving unemployment insurance bene!ts. SNAP (Supplemental Nutrition Assistance Program) recipients were eligible. The program served people ages 21 to 64. Those age 25 or older had to be a parent or primary relative caregiver to at least one child under age 18.
Job preparation or training services. The TJ contractors conducted required ori-entations prior to subsidized job placements, during which they assessed partici-pants’ skills, interests and need for supports, developed employment plans, and arranged for any supports either through outside referrals or use of program funds, for items such as uniforms, driver’s licenses, and public transportation. The con-tractors had "exibility in designing the orientations, which typically ranged from a few days to two weeks. The programs paid participants a stipend equal to the mini-mum wage for the number of hours they attended. The programs we visited took different approaches to the orientation period. Two offered two-week orientations that included instruction on workplace norms, resume writing, and job search skills.
45 Stimulating Opportunity: Job Seeker and Employer Experiences in Each of the Study Sites

Another offered a two-day orientation focused on the rules and regulations of the program, expectations on the job, and how to !ll out timesheets—similar to a new employee orientation.
Subsidy structure and employer of record. Each contractor arranged subsidized employment opportunities at host employer sites or employed subsidized workers themselves. One contractor employed all of its subsidized workers, but most con-tractors primarily placed workers in subsidized positions at host employer sites. The contractors, or their subcontractors, served as the employers of record rather than the host sites. The contractors were responsible for paying the workers as well as paying the employer shares of Social Security and Medicare taxes, workers’ compensation insurance, and unemployment insurance. The state then reimbursed the contractors for these expenses. The only commitment required from the host employers during the subsidy period was to provide work and supervise the work-ers. While employers were encouraged to hire workers who performed well after the subsidy period ended, they were not required to do so.
Support during the subsidy period. Contractors were expected to provide reten-tion services to participants during the subsidy phase. These services included mediation between host employers and participants if problems arose, provision of employment supports such as transportation or assistance purchasing uniforms or tools, and referrals to outside organizations able to help participants address barri-ers to employment. Some contractors referred participants to other programs that they operated internally. For example, one contractor we visited referred workers to an internal program that provided assistance with child support issues. Contractors could also offer bonuses to participants at various points in their employment. For example, one contractor offered $100 once workers were at their subsidized jobs for 25 days, $150 at 90 days, and $200 at six months. Workers who obtained unsubsidized employment were eligible to receive $100 at 60 days of employment and $150 at six months.
Assistance securing unsubsidized employment. The TJ contractors were expected to assist participants with obtaining unsubsidized employment with their host employers or elsewhere after the subsidy period ended. The contractors were required to provide at least three months of job search assistance and six months of retention support once a participant secured an unsubsidized job.
Characteristics of the TJ Program ParticipantsFrom September 2010 through August 2012, the Wisconsin TJ program placed 2,963 people into subsidized jobs. Our analysis focuses on the 801 participants who !nished the program by June 2011, for whom we have a year of post-program out-come information. Wisconsin was the only state in this study that did not serve TANF recipients and where the majority of participants (63 percent) were men. In a state where African Americans account for only six percent of the population, two-thirds of program participants were African American. Nearly half (49 percent) were under
46 Stimulating Opportunity: Job Seeker and Employer Experiences in Each of the Study Sites

the age of 30 (see Figure 4.10). About one-third (34 percent) were non-custodial par-ents, and 39 percent were convicted felons. A higher percentage of participants in Wisconsin (62 percent) were among the long-term unemployed when they enrolled in the program than those in Florida and Mississippi. Annual earnings among all TJ par-ticipants were only $1,966 during the year prior to starting the program.
Figure 4.10 Wisconsin TJ Program Participant Characteristics
Gender
Female 37%
Male 63%
Race
White 23%
African American/Black 66%
Other 5%
Hispanic 6%
Age
Under 30 49%
30 to 39 31%
40 to 49 16%
50 and over 4%
Noncustodial parent 34%
Felony conviction 39%
Long-term unemployed 62%
Average annual earnings in the year before program entry $1,966
The TJ Program Subsidized JobsThe TJ contractors placed participants with for-pro!t, non-pro!t and public employ-ers. Participants in the TJ program were paid the minimum wage—$7.25 an hour—in their subsidized jobs. Employers could choose to supplement the wage if they wanted to pay the workers more, but program staff reported that this was not common.12 Participants could work in subsidized jobs for up to 1,040 hours—the equivalent of six months on a full-time schedule.
Most participants (91 percent) worked in one subsidized position. The average time in a subsidized job was four months. About half of participants (52 percent) were in a subsidized position for three months or less, and 13 percent held a sub-sidized position for more than six months. About half (52 percent) were placed in subsidized jobs with non-pro!t agencies, 44 percent with for-pro!t !rms, and 4 percent with government agencies. Nineteen percent of participants worked in sub-sidized positions at the contractor operating the TJ program.
47 Stimulating Opportunity: Job Seeker and Employer Experiences in Each of the Study Sites

Post-Program Employment and Earnings
Q4 Pre
Q3 Pre
Q2 Pre
Q1 Pre
Q1 Post
Q2 Post
Q3 Post
Q4 Post
Figure 4.11 Quarterly Employment Rates Pre- and Post-Program among TJ Participants
0%
20%
40%
60%
80%
100%
26% 28% 26%
53%
45%
52%
42%
25%
Our analysis of state wage record data reveals that a greater percentage of TJ par-ticipants were employed during the four quarters after program participation than in the four quarters before. Just over half (53 percent) continued to be employed in the !rst quarter after leaving the program (see Figure 4.11). While the percent employed dropped to 42 percent by the fourth quarter after the program, this rep-resents a 14- to 17-percentage point increase over the percent employed in any of the four quarters prior to program participation. According to information reported by the TJ contractors, only 16 percent of participants were hired by their host employers. Therefore, most of those working post-program found jobs elsewhere.
Average quarterly earnings among participants who were working increased between the year before and the year after program participation. Earnings among the employed were greater in each of the four quarters after program participation than in any of the four quarters before the program (see Figure 4.12).
Due to the increases in employment rates and earnings among workers, average annual earnings among all TJ participants increased by $3,300, to $5,276, in the year after program participation (see Figure 4.13). Average annual earnings in the year after the program among those who were working were $7,614.
Outcomes for TJ Program Participant SubgroupsMale participants experienced greater increases in earnings than female par-ticipants from the year before to the year after participating in the program, and White participants experienced greater increases in employment and earnings than Black participants. White participants were also more likely to be hired by their host employers than were Black participants. As shown in
Q4 Pre
Q3 Pre
Q2 Pre
Q1 Pre
Q1 Post
Q2 Post
Q3 Post
Q4 Post
Figure 4.12 Average Quarterly Earnings Pre- and Post- Program among Employed TJ Participants
$0
$1000
$2000
$3000
$4000
$2,145
$1,893 $1,814$1,647
$2,464
$2,988 $2,896
$3,173
Year BeforeProgram
Year AfterProgram
Figure 4.13Average Annual Earnings Pre- and Post- Program among All TJ Participants
$0
$1000
$2000
$3000
$4000
$5000
$6000
$1,966
$5,296
48 Stimulating Opportunity: Job Seeker and Employer Experiences in Each of the Study Sites

!gure 4.14, all of the race/gender subgroups experienced increases in annual earnings in the year after the program. White men (who accounted for only 13 per-cent of program participants) experienced the greatest change in annual earnings.
Overall, participants with felony convictions experienced changes in employment rates and earnings between the year before and the year after the program similar to those without felonies. However, this differed for men and women. Male felons had smaller increases in employment and earnings than their non-felon counter-parts, while female felons experienced greater increases in employment and earn-ings than women without felony convictions (see Figure 4.15).
Black FemaleBlack Male White FemaleWhite Male
Figure 4.14 Average Annual Earnings Pre- and Post-Program by Gender and Race
$0
$2000
$4000
$6000
$8000
Q Year Before Program Q Year After Program
$4,949
$7,062
$4,260
$5,664
$1,427
$2,033$2,384 $2,548
Female FelonMale Felon FemaleNon-Felon
Male Non-Felon
Figure 4.15 Average Annual Earnings Pre- and Post-Program by Felony Status
$0
$2000
$4000
$6000
$8000
Q Year Before Program Q Year After Program
$4,126
$7,400
$5,664
$4,992
$985
$2,437
$1,716
$2,668
Among the 62 percent of participants who were unemployed for more than two quarters at the time of program entry (the long-term unemployed), 36 percent were employed in the fourth quarter after program participation, compared to 52 percent of participants who had more recent work experience when they came to the program. Average annual earnings among the long-term unemployed increased from $322 in the year prior to the program to $4,490 in the year after the program. While post-program earnings were lower for the long-term unemployed than for participants who had more recent work histories, the long-term unemployed experi-enced greater increases in earnings over time (see Figure 4.16). We found no sig-ni!cant differences in employment outcomes by participants’ age, household size, or whether or not they were noncustodial parents.
49 Stimulating Opportunity: Job Seeker and Employer Experiences in Each of the Study Sites

Differences in Outcomes by Program ExperienceParticipants placed with for-pro!t !rms for their subsidized positions experienced greater increases in employment rates and earnings from the year before to the year after program participation than those who worked at non-pro!t or govern-ment agencies, after accounting for differences in participant characteristics. Participants who worked at for-pro!t host employers were slightly more likely to be hired by them (18 percent versus 15 percent of those working at non-pro!ts or public agencies). However, the differences in retention rates by the type of host employer do not account for the differences in post-program employment rates between participants who worked for for-pro!t !rms and those who worked for non-pro!t or government agencies. Therefore, some of the differences are because these participants were more likely to !nd employment elsewhere after the subsidy period ended. This may be due to unmeasured differences in the pre-program skills or abilities of participants whose subsidized positions were with for-pro!t employ-ers versus non-pro!t or public employers. It is also possible that the subsidized positions with for-pro!t employers better prepared workers for employment in the unsubsidized labor market.
Participants who stayed in their subsidized positions longer had greater increases in annual earnings from the year before to the year after the program. Participants who were in their subsidized positions for four to six months experienced the great-est increases in employment between the fourth quarter before and the fourth quarter after program participation (see Figure 4.17). Participants who stayed in the subsidized positions for seven to nine months also had higher post-program employment rates, but the change from the fourth quarter pre-program was less.
Long-Term Unemployed$0
$1000
$2000
$3000
$4000
$5000
$6000
$7000
$8000
Figure 4.16 Average Annual Earnings Pre- and Post-Program by Long-Term Unemployment Status
Not Long-Term Unemployed
Q Year Before Program Q Year After Program
$4,683$4,490
$322
$6,573
50 Stimulating Opportunity: Job Seeker and Employer Experiences in Each of the Study Sites

Employer Experiences with the TJ ProgramAbout 760 employers participated in the subsidized employment program between September 2010 and June 2012. We interviewed a sample of 300 from across the state.13 Sixty-three percent of the employers interviewed were for-pro!t !rms, 31 percent were non-pro!ts, and six percent were government agencies. The top indus-tries represented were social services (18 percent), manufacturing (14 percent), and wholesale and retail trade (12 percent). Sixty-three percent of employers had fewer than 20 employees.
More than half (59 percent) of the employers had one or two subsidized workers; only 12 percent had ten or more. When asked how much various factors contributed to their decisions to participate in the program, the most common factors employ-ers cited were the desire to help people struggling to !nd work, the opportunity for free or low-cost labor, and the chance to try out an employee before committing (see Figure 4.18). Nearly two-thirds (66 percent) of employers created new positions to employ the subsidized workers. The other 34 percent !lled available positions.
When asked to compare subsidized workers to those they would typically hire for similar positions, just over half of the employers (56 percent) said the subsidized workers had less work experience and nearly half (48 percent) said they had less education. When asked to compare the subsidized workers’ job performance to that of employees they generally hired for similar positions, about half (51 percent) said the subsidized workers’ occupational skills were weaker, but 58 percent said the subsidized workers were as or more dependable than other workers in terms of attendance and punctuality.
7 to 9Up to 3 4 to 6
Figure 4.17 Percent Employed in the 4th Quarter Pre- and Post-Program by Number of Months in Subsidized Position
0%
20%
40%
60%
80%
100%
Q Q4 Pre-Program Q Q4 Post-Program
24%
38%
23%
47%
36%
48%
51 Stimulating Opportunity: Job Seeker and Employer Experiences in Each of the Study Sites

Sixty percent of the employers interviewed said they hired at least one subsidized worker after the subsidy period ended. Overall, employers reported hiring 27 per-cent of the subsidized workers after the subsidy period ended. For-pro!t !rms were more likely to hire at least one worker, and they hired a higher percentage of the subsidized workers than non-pro!t or government agencies (39 percent versus 19 percent). Employers with fewer than !ve employees were less likely than larger employers to hire at least one worker. When asked how important various factors were in their decisions not to hire subsidized workers, the most important factors employers cited were that the workers did not perform well enough (43 percent) or had poor attendance (41 percent), and that the employer lacked suf!cient !nancial resources to keep them on (34 percent).
More than three-quarters of employers (79 percent) said they realized savings as a result of taking part in the program. More than two-thirds said the program had either a very or somewhat positive effect on productivity and employees’ satis-faction with their workload (see Figure 4.19). Nearly two-thirds of employers (66 percent) said they would be very likely to participate if the subsidized employment program continued or is offered again in the future; 24 percent said they would be somewhat likely to do so. Employers expressed high levels of satisfaction with most aspects of the program—72 percent were very satis!ed with the communica-tion from program staff. However, only about one-third (32 percent) said they were very satis!ed with the quality of the candidates the programs sent; another 44 per-cent said they were somewhat satis!ed.
Figure 4.18 How Much Each Factor Contributed to Employers' Decisions to Take Part in the TJ Program
Q A Lot Q Some
A Desire to Help People Struggling to Find Work
The Opportunity for Free or Low-Cost Labor
The Opportunity to Try Out an Employee
The Opportunity to Grow or Sustain Operations
The Opportunity to Get Assistance with Recruiting
A Positive Experience with the Agency in the Past
0% 20% 40% 60% 80% 100%
61%
48%
34%
33%
34%
24%
35%
36%
24%
15%
66% 23%
52 Stimulating Opportunity: Job Seeker and Employer Experiences in Each of the Study Sites

ConclusionsThe TJ program successfully reached populations disadvantaged in the labor market. Forty-eight percent of subsidized workers were Black men, 39 percent had felony convictions, and 62 percent were among the long-term unemployed when they enrolled in the program. These groups experienced signi!cant increases in employment and earnings in the year after program participation.
As a whole, individuals with felony convictions were as likely as their non-felon counterparts to be hired by their host employers, and they had similar increases in employment and earnings in the year after the program. However, this varied between men and women, with male felons faring less well than their non-felon counterparts.
Employers realized a number of bene!ts from participating in the TJ program, including savings and increased productivity. However, TJ program employers were the least likely of any at the study sites to hire workers after the subsidy period ended.
Program staff noted that because the subsidized jobs paid the minimum wage of $7.25 an hour and program eligibility criteria excluded TANF recipients and indi-viduals eligible for unemployment compensation, most people attracted to the program had limited work histories and few skills. Given the barriers to employ-ment the participants faced, staff would have preferred to offer more support, training and individualized attention than they were able to given the available resources and the large number of people they were expected to place in subsi-dized positions.
Figure 4.19 How Employing Subsidized Workers Affected TJ Employers
Q Had a Very Positive Effect Q Had a Somewhat Positive Effect
Productivity
Employees’ Satisfaction with their Workload
The Number of Workers the Business Employs
Business Pro!ts/Service Levels
Customer Satisfaction
The Ability to Recruit Quali!ed Workers
0% 20% 40% 60% 80% 100%
29%
23%
18%
27%
19%
41%
43%
48%
38%
36%
29% 46%
53 Stimulating Opportunity: Job Seeker and Employer Experiences in Each of the Study Sites

Individuals with subsidized positions at for-pro!t !rms were somewhat more likely to be hired after the subsidy ended and had greater increases in employ-ment and earnings in the year after the program. This is consistent with the survey !nding that for-pro!t employers were more likely than non-pro!ts to retain workers after the subsidy ended. This may partly re"ect differences in program design across the TJ contractors. Some placed individuals primarily with private sector !rms and encouraged employers to use the subsidy as a trial period prior to making hiring decisions. Others placed groups of workers in subsidized posi-tions mainly at non-pro!ts or public agencies to help them gain work experience, but these employers were not expected to hire all of the workers.
The San Francisco JobsNOW Program
The San Francisco Human Services Agency (HSA), which administers the TANF, gen-eral assistance, food stamp, and other bene!t programs, operates the JobsNOW program. The !rst JobsNOW program was funded with an EF award of $55 million. The program had strong support from Mayor Gavin Newsom, and HSA administra-tors aggressively designed a program that fully subsidized private sector positions that paid prevailing wages and public sector positions that paid above the city’s minimum wage. County administrators came to see subsidized employment as the centerpiece of its welfare-to-work program. After the EF program expired, the county continued the JobsNOW program with funding from the state and county general assistance funds, which totaled $11.4 million in !scal year 2012. The county con-tinued to run the program in 2013.
The goals and eligibility criteria of JobsNOW have changed over time. During the EF period, JobsNOW operated as a stimulus program to move unemployed people into jobs, infuse money into the economy, and help small businesses. The goal was to get money into people’s pockets with limited provisions for whether workers would be hired at the end of the subsidy period. The EF program was open to all adults with children and incomes within 200 percent of the federal poverty line in the prior 30 days. These criteria allowed HSA to reach out to a broad segment of the unem-ployed population. When the EF program expired, JobsNOW became a welfare-to-work program with a greater emphasis on identifying opportunities that could lead to permanent employment to help TANF and general assistance recipients become self-suf!cient.
When JobsNOW began, HSA expanded its role from a welfare agency to one that sought to meet the needs of small employers. The agency created the position of business account representative to recruit and interact with private sector employ-ers. During the EF period, to recruit low-income job seekers other than the agency’s TANF clients to participate in the program, HSA placed ads on buses and bill-boards, worked with community-based agencies and the Employment Development Department, and set up a phone hotline for job seekers who were not on public assistance to !nd out if they were eligible for the program.
54 Stimulating Opportunity: Job Seeker and Employer Experiences in Each of the Study Sites
As noted in the introduction, JobsNOW had three tiers: Tier 1. the community jobs program in which participants worked at non-pro!ts; Tier 2. the public sector trainee program; and Tier 3. the wage subsidy program in which placements were made in the private sector. By operating multiple tiers, the program sought to serve all unemployed individuals who !t the eligibility criteria, regardless of job readi-ness or prior work experience. The program had loose criteria, based on months in the labor market and skills, for assessing whether clients had low, middle, or high marketability and which tier may be most appropriate for them. However, the staff did not assign individuals to the tiers. All clients were expected to interview with public and private employers at the weekly hiring events HSA hosted for subsidized employment opportunities and to search for unsubsidized employment. Therefore, the market determined which tier they were in, depending on whether they were hired in the wage subsidy or public sector tiers or in an unsubsidized job. Those who were not hired would participate in the Tier 1 community jobs program. Given the differences in program structures across the tiers, we discuss each tier and the experiences of its participants separately.
Tier 1 Community Jobs ProgramOf San Francisco’s three program tiers, the Tier 1 Community Jobs Program (CJP) pro-vided the most supportive environment for individuals with the lowest levels of labor market experience. The goal of the program was to give clients an opportunity to get hands-on work experience as well as something to add to their resumes. CJP differed from Tiers 2 and 3 because once clients were assigned to CJP, all placement and support services were provided by non-pro!t agencies with which HSA subcontracted.
Program DesignSubsidy structure and employer of record. The non-pro!t subcontractors acted as the employers of record during the subsidy period and received reimbursements from HSA for wages paid to participants. During the EF program and the !rst year of the post-EF program, Goodwill was the subcontractor and placed participants in subsidized positions both internally and externally with other non-pro!ts. Starting in July 2011, two non-pro!t agencies—Arriba Juntos and Young Community Developers—operated the program and placed participants with other non-pro!t agencies in the community. The CJP positions were temporary internships, and the non-pro!t agencies where the subsidized employees worked were not expected to retain workers after the subsidy period ended.
Support before or during the subsidy period. Prior to placement in subsidized posi-tions, the contractors helped participants with resumes, completed assessment tests, and did mock interviews. During the subsidy period, counselors helped par-ticipants with anything from housing issues to problems with a co-worker, mental health counseling, and dealing with stress and domestic violence. Counselors vis-ited host sites to check on the participants and get feedback from supervisors on
55 Stimulating Opportunity: Job Seeker and Employer Experiences in Each of the Study Sites

participants’ progress. Participants received public transit passes and child care assistance, if needed, during the entire six-month subsidy period. Welfare-to-work clients were also eligible for funds for tools or uniforms, as needed.
Assistance securing unsubsidized employment. The contractors operating the program provided participants classes to prepare for the job search process and improve their basic skills as well as assistance with searching for unsubsidized jobs near the end of the subsidy period.
Characteristics of the JobsNOW Tier 1 ParticipantsFrom July 2009 through September 2010, the EF program period, San Francisco placed about 800 adults into subsidized employment opportunities through the Tier 1 CJP program. Post-EF, from October 2010 through June 2011, the city placed about 300 adults into CJP positions. CJP was targeted to individuals with limited work experience and education. Most of the participants were TANF (CalWORKs) recipients and about three-quarters were female (see Figure 4.20). While African Americans make up six percent of San Francisco’s population, more than 40 percent of the Tier 1 participants were African American. The primary difference between the partici-pants served in the EF and post-EF programs was that the EF program served some low-income job seekers who were not receiving cash assistance, and the post-EF program served some general assistance recipients. Otherwise, participants were similar in terms of race, age, and pre-program employment.
Figure 4.20 JobsNOW Tier 1 Participant Characteristics
EF Post-EF
Program
TANF (CalWORKs) 80% 86%
General Assistance 0% 15%
Up to 200% of the federal poverty line 20% 0%
Gender
Female 77% 77%
Male 23% 23%
Race
White 6% 3%
Black 46% 42%
Hispanic 16% 24%
Asian 28% 24%
Other 5% 8%
Age
Under 30 44% 42%
30 to 39 29% 30%
40 to 49 22% 21%
50 and over 5% 8%
Long-term unemployed 79% 79%
Average annual earnings in the year before program entry
$2,187 $2,064
56 Stimulating Opportunity: Job Seeker and Employer Experiences in Each of the Study Sites
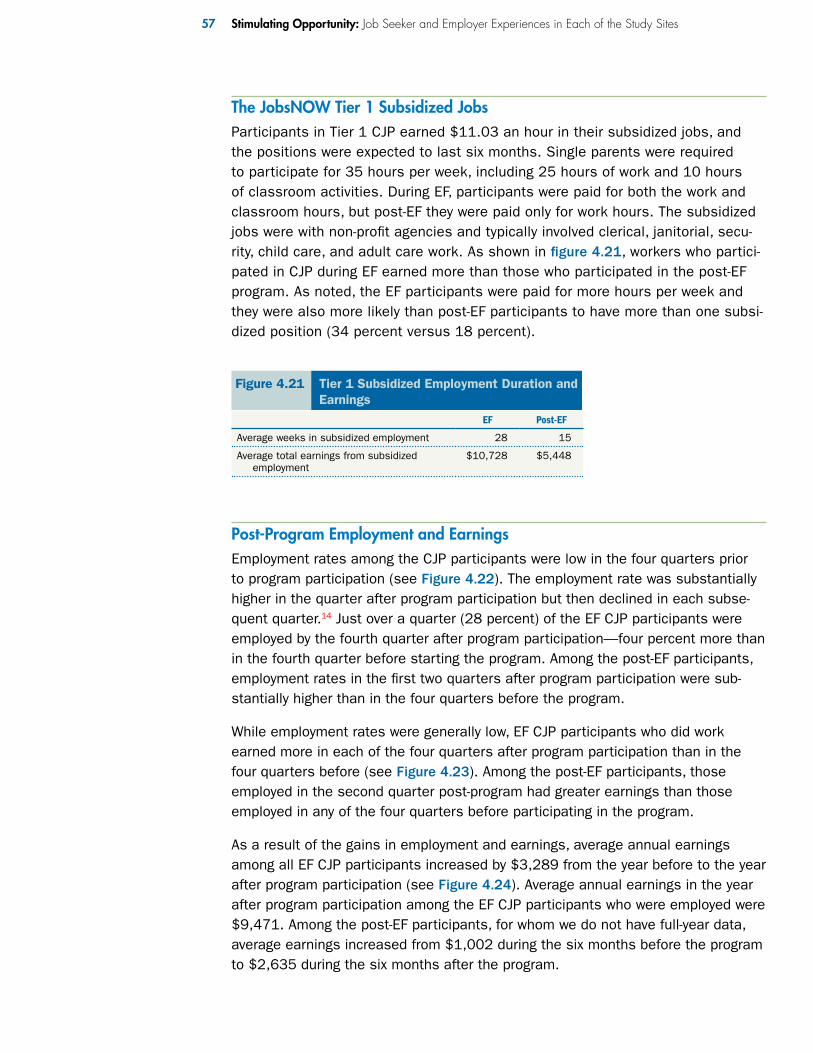
The JobsNOW Tier 1 Subsidized JobsParticipants in Tier 1 CJP earned $11.03 an hour in their subsidized jobs, and the positions were expected to last six months. Single parents were required to participate for 35 hours per week, including 25 hours of work and 10 hours of classroom activities. During EF, participants were paid for both the work and classroom hours, but post-EF they were paid only for work hours. The subsidized jobs were with non-pro!t agencies and typically involved clerical, janitorial, secu-rity, child care, and adult care work. As shown in !gure 4.21, workers who partici-pated in CJP during EF earned more than those who participated in the post-EF program. As noted, the EF participants were paid for more hours per week and they were also more likely than post-EF participants to have more than one subsi-dized position (34 percent versus 18 percent).
Figure 4.21 Tier 1 Subsidized Employment Duration and Earnings
EF Post-EF
Average weeks in subsidized employment 28 15
Average total earnings from subsidized employment
$10,728 $5,448
Post-Program Employment and EarningsEmployment rates among the CJP participants were low in the four quarters prior to program participation (see Figure 4.22). The employment rate was substantially higher in the quarter after program participation but then declined in each subse-quent quarter.14 Just over a quarter (28 percent) of the EF CJP participants were employed by the fourth quarter after program participation—four percent more than in the fourth quarter before starting the program. Among the post-EF participants, employment rates in the !rst two quarters after program participation were sub-stantially higher than in the four quarters before the program.
While employment rates were generally low, EF CJP participants who did work earned more in each of the four quarters after program participation than in the four quarters before (see Figure 4.23). Among the post-EF participants, those employed in the second quarter post-program had greater earnings than those employed in any of the four quarters before participating in the program.
As a result of the gains in employment and earnings, average annual earnings among all EF CJP participants increased by $3,289 from the year before to the year after program participation (see Figure 4.24). Average annual earnings in the year after program participation among the EF CJP participants who were employed were $9,471. Among the post-EF participants, for whom we do not have full-year data, average earnings increased from $1,002 during the six months before the program to $2,635 during the six months after the program.
57 Stimulating Opportunity: Job Seeker and Employer Experiences in Each of the Study Sites

Outcomes for JobsNOW Tier 1 Participant SubgroupsWe examined whether outcomes varied for subgroups of participants in the EF pro-gram and found no signi!cant differences by participants’ gender or age. Hispanic participants, who made up 16 percent of the EF Tier 1 participants, had greater increases in post-program employment rates and annual earnings than Black or Asian participants. Participants who were among the long-term unemployed at pro-gram entry were less likely than those who had worked recently to be employed
Q4 Pre
Q3 Pre
Q2 Pre
Q1 Pre
Q1 Post
Q2 Post
Q3 Post
Q4 Post
Q1 Post
Q2 Post
Q4 Pre
Q3 Pre
Q2 Pre
Q1 Pre
Figure 4.22 Quarterly Employment Rates Pre- and Post-Program among Tier 1 Participants
0%
20%
40%
60%
80%
100%
EF Tier 1 Participants Post-EF Tier 1 Participants
21%18%
10%
50%
34%30% 28%
14%17% 17% 16%
41%
34%
24%
Q4 Pre
Q3 Pre
Q2 Pre
Q1 Pre
Q1 Post
Q2 Post
Q3 Post
Q4 Post
Q1 Post
Q2 Post
Q4 Pre
Q3 Pre
Q2 Pre
Q1 Pre
Figure 4.23 Average Quarterly Earnings Pre- and Post-Program among EmployedTier 1 Participants
$0
$1000
$2000
$3000
$4000
$5000
$6000
$7000
EF Tier 1 Participants Post-EF Tier 1 Participants
$3,0
61
$3,1
09
$2,9
46
$2,6
16
$3,4
63 $3,8
72
$4,0
87
$4,2
28
$3,4
30
$3,5
60
$3,2
40
$2,7
25 $3,1
57
$3,9
56
Year BeforeProgram
Year AfterProgram
Figure 4.24Average Annual Earnings Pre- and Post- Program among All Tier 1 Participants
$0
$1000
$2000
$3000
$4000
$5000
$6000
$1,966
$5,296
58 Stimulating Opportunity: Job Seeker and Employer Experiences in Each of the Study Sites

four quarters after the participating in the program. However, employment rates did increase among the long-term unemployed from the fourth quarter before to the fourth quarter after the program, whereas they declined among those who had worked more recently when they came to the program (see Figure 4.25). Post-program annual earnings were lower among the long-term unemployed than among
those who had worked more recently ($4,454 versus $9,412), but the long-term unemployed experienced a greater change in annual earnings from the year before to the year after program participation ($3,927 versus $834).
Finally, participants who were receiving TANF when they entered the program experienced greater increases in employment and annual earnings than did low-income participants15 who were not receiving TANF. As shown in !gure 4.26, employment rates increased from the fourth quarter before to the fourth quarter after the program among TANF recipients but decreased among low-income individuals who were not receiving TANF, while most of the earnings gains were among those who were receiving TANF when they entered the pro-gram (see Figure 4.27).
Long-Term Unemployed Not Long-Term Unemployed0%
20%
40%
60%
80%
100%
Figure 4.25 Percent Employed in the 4th Quarter Pre- and Post-Program by Long-Term Unemployment Status among Tier 1 EF Participants
Q Q4 Pre-Program Q Q4 Post-Program
24%
58%
15%
45%
Up to 200% of FPL TANF0%
20%
40%
60%
80%
100%
Figure 4.26 Percent Employed in the 4th Quarter Pre- and Post-Program by Target Group among
Tier 1 EF Participants
Q Q4 Pre-Program Q Q4 Post-Program
8%
27%
14%
35%
Up to 200% of FPL TANF$0
$1000
$2000
$3000
$4000
$5000
$6000
$7000
$8000
Figure 4.27 Average Annual Earnings Pre- and Post-Program by Target Group amongTier 1 EF Participants
Q Year Before Program Q Year After Program
$2,560
$1,639
$1,060
$6,704
59 Stimulating Opportunity: Job Seeker and Employer Experiences in Each of the Study Sites

JobsNOW Tier 2 Public Sector Trainee ProgramThe public sector trainee (PST) tier was targeted to individuals who had some work experience but could bene!t from on-the-job training to prepare for work either with city agencies or elsewhere.
Program DesignSubsidy structure and employer of record. Subsidized workers were employed by the City and County of San Francisco and placed in subsidized positions at vari-ous city government agencies, including human services, public works, parks, and transportation. The PST program paid 100 percent of subsidized workers’ wages. The city agencies where individuals performed the work committed to training and coaching the workers. When they requested an employee, they were required to specify what skills participants would gain on the job. The agencies also agreed to let clients attend training and go on job interviews. The city agencies were not expected to hire the subsidized workers after the subsidy period ended, although they could choose to do so.
Support before or during the subsidy period. HSA staff provided participants coun-seling throughout the subsidy period and made referrals to the department’s social worker as needed for issues such as domestic violence and mental health counsel-ing. The staff did site visits approximately once a month, meeting with participants and supervisors to discuss progress and deal with any problems that arose. Staff ensured that participants were doing the types of work and learning the skills detailed in job descriptions. TANF recipients could continue to receive child care and transportation assistance, food stamps, and medical assistance. Participants working outdoors received work boots, safety gear, and raincoats. While employed in subsidized positions, workers had the option to take classes on professional work habits, such as appropriate dress, attitude, and attendance, as well as job search preparation, such as writing resumes and cover letters.
Assistance securing unsubsidized employment. JobsNOW program staff provided participants job leads for unsubsidized positions. During the subsidy period, partici-pants were paid for time spent going on job interviews and attending job fairs dur-ing the workday.
Characteristics of the JobsNOW Tier 2 ParticipantsDuring the EF program, from July 2009 through September 2010, San Francisco placed about 700 adults into subsidized positions in the PST program. Post-EF, from October 2010 through June 2011, the city placed about 120 adults into PST-subsidized jobs. Nearly two-thirds (63 percent) of the participants in the EF pro-gram were low-income job seekers who were not receiving cash assistance, while most participants in the post-EF program were TANF recipients (see Figure 4.28). Nearly half of the EF participants were male compared to one-third of the post-EF
60 Stimulating Opportunity: Job Seeker and Employer Experiences in Each of the Study Sites

participants. About three-quarters of participants in both groups were among the long-term unemployed when they entered the program, although the EF participants had somewhat higher annual earnings than the post-EF participants in the year before the program.
Figure 4.28 JobsNOW Tier 2 Participant Characteristics
EF Post-EF
Program
TANF (CalWORKs) 43% 84%
General Assistance 0% 16%
Up to 200% of the federal poverty line 57% 0%
Gender
Female 54% 68%
Male 47% 32%
Race
White 3% 10%
African American/Black 61% 52%
Hispanic 16% 21%
Asian 15% 13%
Other 5% 5%
Age16
Under 30 36% —
30 to 39 34% —
40 to 49 25% —
50 and over 5% —
Long-term unemployed 77% 73%
Average annual earnings in the year before program entry
$3,080 $1,789
The JobsNOW Tier 2 Subsidized JobsThe PST participants in the EF program were paid an hourly wage of $12.21; post-EF it was $12.39. Participants worked up to 40 hours per week during EF and 32 hours per week post-EF. During EF, the PST positions were expected to last a year. Most post-EF positions were six months long, with the exception of the Department of Public Works positions, which lasted a year. The jobs varied from street clean-ing, landscaping, and maintenance to administrative support and social service positions. PST participants in the EF program had average total earnings from their subsidized positions of $18,270. As one would expect with the shortening of the subsidy period and reduction in hours, average total earnings were lower in the post-EF program (see Figure 4.29).
61 Stimulating Opportunity: Job Seeker and Employer Experiences in Each of the Study Sites

Figure 4.29 Tier 2 Subsidized Employment Duration and Earnings
EF Post-EF
Average weeks in subsidized employment 37 20
Average total earnings from subsidized employment
$18,270 $7,632
Post-Program Employment and EarningsAs shown in !gure 4.30, the percent of EF PST participants who were employed increased temporarily in the !rst quarter after program participation, but in each subsequent quarter dropped to levels lower than the employment rates in the third and fourth quarters pre-program. Among the post-EF participants, the percent employed was greater in the two quarters after program participation than in the four quarters before.
Q4 Pre
Q3 Pre
Q2 Pre
Q1 Pre
Q1 Post
Q2 Post
Q3 Post
Q4 Post
Q1 Post
Q2 Post
Q4 Pre
Q3 Pre
Q2 Pre
Q1 Pre
Figure 4.30 Quarterly Employment Rates Pre- and Post-Program among Tier 2 Participants
0%
20%
40%
60%
80%
100%
EF Tier 2 Participants Post-EF Tier 2 Participants
27%21%
14%
41%
22% 22% 23%20% 21%
24%
18%
37%41%
29%
Among the EF PST participants who were working, average earnings increased in the second through fourth quarters after the program and were signi!cantly higher than average earnings prior to program participation (see Figure 4.31). Among the post-EF participants, average earnings among those working in the !rst two quar-ters after program participation were substantially greater than workers’ earnings in the four quarters pre-program.
As a result of the short-term increase in employment during the !rst quarter post-program and the increase in earnings among individuals who were working, average annual earnings among all EF PST participants increased by $1,591 from the year before to the year after program participation (see Figure 4.32). Average annual
62 Stimulating Opportunity: Job Seeker and Employer Experiences in Each of the Study Sites
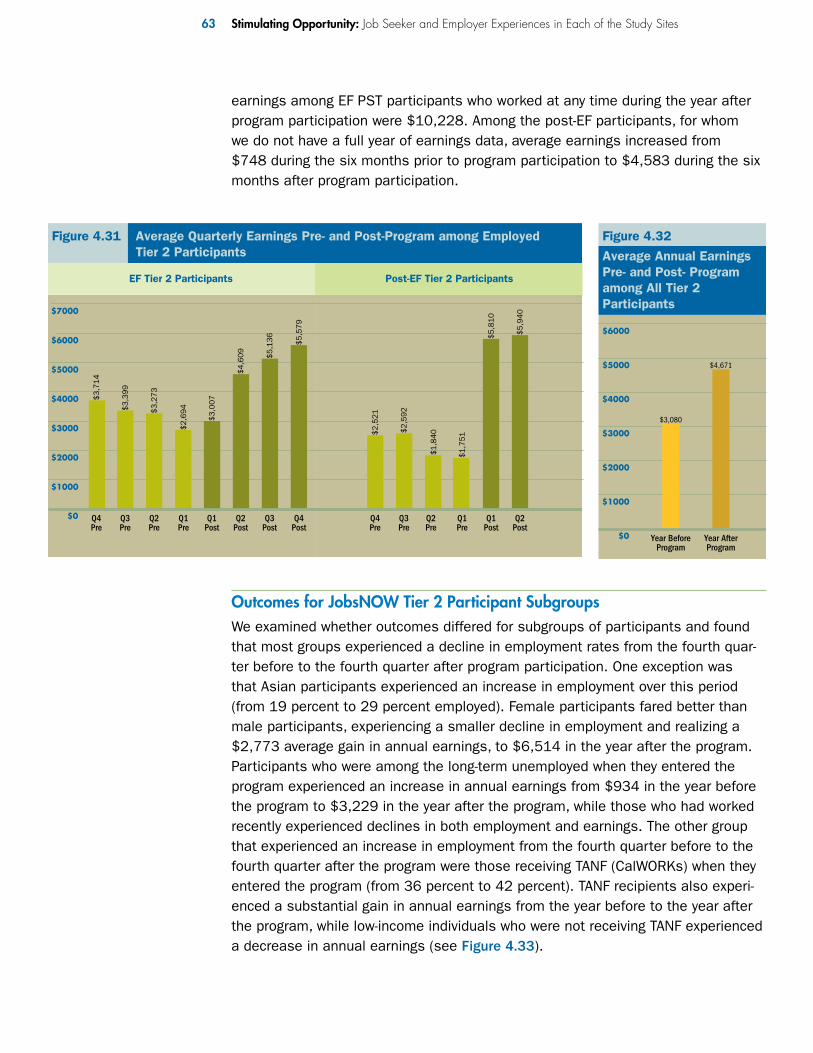
earnings among EF PST participants who worked at any time during the year after program participation were $10,228. Among the post-EF participants, for whom we do not have a full year of earnings data, average earnings increased from $748 during the six months prior to program participation to $4,583 during the six months after program participation.
Q4 Pre
Q3 Pre
Q2 Pre
Q1 Pre
Q1 Post
Q2 Post
Q3 Post
Q4 Post
Q1 Post
Q2 Post
Q4 Pre
Q3 Pre
Q2 Pre
Q1 Pre
Figure 4.31 Average Quarterly Earnings Pre- and Post-Program among EmployedTier 2 Participants
$0
$1000
$2000
$3000
$4000
$5000
$6000
$7000
EF Tier 2 Participants Post-EF Tier 2 Participants
$3,7
14
$3,3
99
$3,2
73
$2,6
94
$3,0
07
$4,6
09 $5,1
36 $5,5
79
$2,5
21
$2,5
92
$1,8
40
$1,7
51
$5,8
10
$5,9
40
Year BeforeProgram
Year AfterProgram
Figure 4.32Average Annual Earnings Pre- and Post- Program among All Tier 2 Participants
$0
$1000
$2000
$3000
$4000
$5000
$6000
$3,080
$4,671
Outcomes for JobsNOW Tier 2 Participant SubgroupsWe examined whether outcomes differed for subgroups of participants and found that most groups experienced a decline in employment rates from the fourth quar-ter before to the fourth quarter after program participation. One exception was that Asian participants experienced an increase in employment over this period (from 19 percent to 29 percent employed). Female participants fared better than male participants, experiencing a smaller decline in employment and realizing a $2,773 average gain in annual earnings, to $6,514 in the year after the program. Participants who were among the long-term unemployed when they entered the program experienced an increase in annual earnings from $934 in the year before the program to $3,229 in the year after the program, while those who had worked recently experienced declines in both employment and earnings. The other group that experienced an increase in employment from the fourth quarter before to the fourth quarter after the program were those receiving TANF (CalWORKs) when they entered the program (from 36 percent to 42 percent). TANF recipients also experi-enced a substantial gain in annual earnings from the year before to the year after the program, while low-income individuals who were not receiving TANF experienced a decrease in annual earnings (see Figure 4.33).
63 Stimulating Opportunity: Job Seeker and Employer Experiences in Each of the Study Sites

JobsNOW Tier 3 Wage Subsidy ProgramThe Tier 3 wage subsidy program was targeted to individuals with marketable skills and experience who were out of work for some time and needed help reentering the labor force.
Program DesignSubsidy structure and employer of record. In Tier 3, subsidized workers were on employer payrolls from the start. Under this EF program tier, employers received reimbursement for the full wages paid, up to an annual salary of $75,000. The subsidy period was capped at one year. Employers covered the cost of payroll taxes and workers’ compensation. Post-EF, the city capped the subsidy amount at $5,000. In JobsNOW 2, the subsidy covered the !rst $5,000 in wages employers paid. In JobsNOW 3, the subsidy covered $1,000 of wages per month for up to !ve months.
Employer recruitment. To recruit employers, JobsNOW staff members developed relationships with the city’s of!ce for small business services, the chamber of commerce, and merchant associations and worked with job developers at commu-nity non-pro!t agencies to promote the subsidies. Post-EF, staff gave participants vouchers to share with employers, letting them know they could be reimbursed for up to $5,000 if they hired the workers. The program targeted small businesses in a variety of sectors. During EF, staff targeted employers throughout the Bay Area; post-EF they focused on San Francisco employers within reach of the communities in which clients lived. Staff members did not develop jobs for individuals but sought to recruit a pool of employers with jobs that generally matched participants’ skills.
TANFUp to 200% of FPL$0
$2000
$4000
$6000
$8000
$10,000
Figure 4.33 Average Annual Earnings Pre- and Post-Program by Target Group among Tier 2 EF Participants
Q Year Before Program Q Year After Program
$4,148
$2,158$2,544
$9,120
64 Stimulating Opportunity: Job Seeker and Employer Experiences in Each of the Study Sites

During EF, when employers received 100 percent wage reimbursements, staff described JobsNOW as a stimulus program and encouraged employers to cre-ate positions when they were not planning to hire or were hesitant to do so. The program encouraged employers to hire participants if they were able to when the subsidy ended but did not require a commitment to hiring. Post-EF, with the more limited subsidy, staff targeted employers who were already hiring and used the sub-sidy to try to in"uence the workers they hired.
Support before or during the subsidy period. The wage subsidy tier did not have speci!c supports built into the design once participants were on the job. TANF clients were eligible for childcare assistance and bus passes during the subsidy period, and general assistance clients were eligible for assistance with transporta-tion, tools or work clothes.
Assistance securing unsubsidized employment. Program staff sent participants information about job openings for unsubsidized positions and invited them to attend employment workshops offered by the agency.
Characteristics of the JobsNOW Tier 3 ParticipantsFrom July 2009 through September 2010, the EF program period, San Francisco placed about 1,800 adults into subsidized employment opportunities in the Tier 3 program. From October 2010 through June 2011, the post-EF period covered in this section, the city placed about 120 adults into subsidized jobs in Tier 3.17 During the EF program, just over three-quarters (78 percent) of the wage subsidy participants were low-income job seekers not receiving cash assistance (see Figure 4.34). In the post-EF program, participants were primarily divided between TANF and general assistance recipients. Participants were divided about evenly between women and men. The Tier 3 participants as a group were older than those Tiers 1 and 2 (68 percent were between the ages of 30 and 49). Although Tier 3 targeted more marketable individuals, most participants (84 to 86 percent) were among the long-term unemployed when they entered the program. Across the board, the JobsNOW program served more long-term unemployed participants than any other site in the study.
65 Stimulating Opportunity: Job Seeker and Employer Experiences in Each of the Study Sites

Figure 4.34 JobsNOW Tier 3 Participant Characteristics
EF Post-EF
Program
TANF (CalWORKs) 21% 44%
General Assistance 0% 46%
Up to 200% of the federal poverty line 79% 9%
Gender
Female 53% 49%
Male 47% 51%
Race
White 18% 14%
African American/Black 33% 43%
Hispanic 19% 19%
Asian 23% 15%
Other 8% 9%
Age18
Under 30 24% -
30 to 39 38% -
40 to 49 30% -
50 and over 8% -
Long-term unemployed 86% 84%
Average annual earnings in the year before program entry
$2,045 $1,430
The JobsNOW Tier 3 Subsidized JobsParticipants in the wage subsidy tier were placed in competitive positions with for-pro!t and non-pro!t employers. Participants worked in a variety of industries, the most common of which were construction (16 percent), administrative support (13 percent), retail trade (10 percent), and accommodations and food service (10 per-cent). Participants received the prevailing wage for the positions in which they were placed. The program required that employers pay at least the minimum wage, which was $9.79 when the EF program began in 2009.
The EF Tier 3 participants worked an average of 38 hours per week and earned an average of $18.08 an hour in their subsidized jobs; the median hourly wage was $15.00. During the EF program, the Tier 3 subsidized jobs could last up to one year. The post-EF Tier 3 participants worked an average of 35 hours per week and earned an average wage of $12.89 an hour in their subsidized jobs; the median wage was $12.00 an hour. In the post-EF program, the subsidized jobs could last up to !ve months.
The differences in hourly wages between the EF and post-EF programs may be due in part to differences in participants’ education, for which we do not have complete data. Staff noted that they were able to serve a wider range of job seekers during the EF program, including some with advanced degrees and signi!cant, although not recent, employment experience. Another factor was likely the structure of the
66 Stimulating Opportunity: Job Seeker and Employer Experiences in Each of the Study Sites

subsidy itself. As noted earlier, the EF program provided a 100 percent wage sub-sidy to employers for positions paying up to $75,000 annually. The post-EF program provided a partial wage subsidy to employers of $1,000 per month. As shown in !gure 4.35, participants in the EF program had average earnings of $20,161 from their subsidized jobs; the post-EF program participants earned $8,004, on average.
Figure 4.35 Tier 3 Subsidized Employment Duration and Earnings
EF Post-EF
Average weeks in subsidized employment 29 16
Average total earnings from subsidized employment
$20,161 $8,004
In the EF program, there were signi!cant differences in the hourly wages earned across subgroups of participants. Men earned higher hourly wages in their sub-sidized jobs than women ($19.98 versus $16.37). White workers earned higher hourly wages than workers in other racial or ethnic groups ($24.05 versus $16.79). Participants receiving TANF when they entered the program earned less than low-income workers who were not receiving TANF ($14.81 versus $18.99 hourly). Participants who were among the long-term unemployed at program entry earned higher hourly wages than those who had more recent work experience ($18.60 ver-sus $14.75). Education data are only available for participants who were low-income but not receiving TANF upon program entry. For this group, people with a bachelor’s or higher college degree earned signi!cantly higher hourly wages in their subsidized positions than those without a college degree ($24.92 versus $17.34).
Post-Program Employment and EarningsAs shown in !gure 4.36, pre- and post-program employment rates among the EF Tier 3 participants are low. Participants made some short-term gains in the !rst quarter post-program when 22 percent were employed, but employment rates dropped in subsequent quarters to 17 percent, the same percentage of people employed in the fourth quarter prior to program participation.
The post-EF participants fared better in terms of employment rates. In the post-EF program, in which employers received partial wage subsidies, just under one-third of participants were employed in the two quarters after program participation (see Figure 4.36). While the employment rates are low, they are more than twice the per-centage that were employed in any of the four quarters pre-program.
Average earnings among the Tier 3 participants who were employed were greater in the quarters following program participation than in the four quarters before the program (see Figure 4.37). Among the EF participants, while the employment rates in the second through fourth quarters post-program remained steady, earnings con-tinued to increase.
67 Stimulating Opportunity: Job Seeker and Employer Experiences in Each of the Study Sites

As a result of the slightly higher employment rates in the four quarters after pro-gram participation and the higher earnings among those who were working, aver-age annual earnings among all EF Tier 3 participants increased by $2,324 from the year before to the year after program participation (see Figure 4.38). Among the post-EF participants, for whom we only have data for the six months after program participation, average earnings increased from $677 during the six months before the program to $2,938 during the six months after the program. Among the EF Tier 3 participants who were employed at any time during the year after the program, average annual earnings were $17,197, a $8,213 increase over the annual earn-ings of individuals who were employed during the year before the program.
Q4 Pre
Q3 Pre
Q2 Pre
Q1 Pre
Q1 Post
Q2 Post
Q3 Post
Q4 Post
Q1 Post
Q2 Post
Q4 Pre
Q3 Pre
Q2 Pre
Q1 Pre
Figure 4.36 Quarterly Employment Rates Pre- and Post-Program among Tier 3 Participants
0%
20%
40%
60%
80%
100%
EF Tier 3 Participants Post-EF Tier 3 Participants
14% 12%8%
22%18% 18% 17%
12% 13% 13%10%
30% 31%
17%
Q4 Pre
Q3 Pre
Q2 Pre
Q1 Pre
Q1 Post
Q2 Post
Q3 Post
Q4 Post
Q1 Post
Q2 Post
Q4 Pre
Q3 Pre
Q2 Pre
Q1 Pre
Figure 4.37 Average Quarterly Earnings Pre- and Post-Program among EmployedTier 3 Participants
$0
$1000
$2000
$3000
$4000
$5000
$6000
$7000
EF Tier 3 Participants Post-EF Tier 3 Participants
$4,4
75
$4,0
87
$3,8
04
$3,3
85
$5,7
60
$5,4
97
$5,6
49 $6,2
94
$2,9
58
$3,1
57
$2,9
90
$2,8
86
$4,7
25
$4,8
88
Year BeforeProgram
Year AfterProgram
Figure 4.38Average Annual Earnings Pre- and Post- Program among All Tier 3 Participants
$0
$1000
$2000
$3000
$4000
$5000
$6000
$2,045
$4,369
68 Stimulating Opportunity: Job Seeker and Employer Experiences in Each of the Study Sites

Outcomes for JobsNOW Tier 3 Participant SubgroupsWe examined differences in the post-program outcomes of participant subgroups and found some signi!cant variations.19 Female participants were more likely than male participants to be employed both before and after the program (see Figure 4.39). Employment rates increased slightly for women and decreased slightly for men.
Female participants also experienced a substantially greater increase in annual earn-ings from the year before to the year after the program, despite the fact that men earned more from their subsidized jobs while in the program (see Figure 4.40). There were no differences in outcomes by race or ethnicity once participants’ pre-pro-gram characteristics were taken into account. Participants who were under age 30 had greater increases in employment and annual earnings than those who were age 30 and older.
Men Women0%
20%
40%
60%
80%
100%
Figure 4.39 Percent Employed in the 4th Quarter Pre- and Post-Program by Gender among Tier 3 EF Participants
Q Q4 Pre-Program Q Q4 Post-Program
7%
24%
9%
26%
Men Women$0
$1000
$2000
$3000
$4000
$5000
$6000
$7000
$8000
Figure 4.40 Average Annual Earnings Pre- and Post-Program by Gender among Tier 3 EF Participants
Q Year Before Program Q Year After Program
$2,930
$1,921
$1,066
$6,582
Individuals who were TANF recipients when they enrolled in JobsNOW—making up only 20 percent of EF Tier 3 participants—had much greater increases in employ-ment rates and annual earnings than non-TANF recipients, who quali!ed for the pro-gram based on having income at or below 200 percent of the federal poverty level (see Figures 4.41 and 4.42).
Finally, neither individuals who were among the long-term unemployed at program entry nor those who had worked recently experienced signi!cant gains in employ-ment from the fourth quarter before to the fourth quarter after participating in JobsNOW (see Figure 4.43). Those who had worked recently before program entry, accounting for only 22 percent of the EF Tier 3 participants, were much more likely to be working four quarters before and after program participation.
69 Stimulating Opportunity: Job Seeker and Employer Experiences in Each of the Study Sites

Differences in Outcomes by JobsNOW Tier 3 Program ExperienceParticipants earning more than $15.00 an hour in their subsidized jobs experi-enced a decrease in employment between the fourth quarter before and fourth quarter after participating in JobsNOW, whereas those who earned less experi-enced slight increases (see Figure 4.44). Total earnings from subsidized employ-ment were also negatively associated with post-program employment rates and the change in annual earnings.
Up to 200% of FPL TANF0%
20%
40%
60%
80%
100%
Figure 4.41 Percent Employed in the 4th Quarter Pre- and Post-Program by Target Group among Tier 3 EF Participants
Q Q4 Pre-Program Q Q4 Post-Program
9%
34%
12%
49%
Up to 200% of FPL TANF$0
$4,000
$8,000
$12,000
$16,000
Figure 4.42 Average Annual Earnings Pre- and Post-Program by Target Group among Tier 3 EF Participants
Q Year Before Program Q Year After Program
$4,680
$2,267$1,350
$12,774
Long-Term Unemployed Not Long-Term Unemployed0%
20%
40%
60%
80%
100%
Figure 4.43 Percent Employed in the 4th Quarter Pre- and Post-Program by Long-Term Unemployment Status among Tier 3 EF Participants
Q Q4 Pre-Program Q Q4 Post-Program
11%
62%
10%
61%
70 Stimulating Opportunity: Job Seeker and Employer Experiences in Each of the Study Sites

Employer Experiences with the JobsNOW Tier 3 ProgramWe conducted the survey with 98 employers who had taken part in the post-EF Tier 3 wage subsidy program between July 2011 and June 2012, some of whom may also have taken part in earlier versions of JobsNOW. These employers were all required to place subsidized workers on their payrolls at the start of the subsidy period and received reimbursements of $1,000 per month for up to !ve months for the wages paid to workers. More than three-quarters of the employers (79 per-cent) were for-pro!t !rms. Employers from a variety of industries participated, the most common of which were wholesale and retail trade (15 percent), leisure and hospitality (14 percent), and construction (12 percent). The program targeted small employers; 59 percent had fewer than 20 employees.
Nearly half (45 percent) of the employers had one or two subsidized workers; another 41 percent had three to nine workers. The most common factors that con-tributed to employers’ decisions to participate in the program were the desire to help people struggling to !nd work and the opportunity for free or low-cost labor for a few months (see Figure 4.45). Just over half (54 percent) created new positions to bring on the subsidized workers, rather than !lling existing positions, when they !rst started participating in the program. This represents the lowest percentage across the four study sites where we completed the survey. Staff members stated that, for the post-EF program in which employers were offered partial subsidies, they targeted employers with existing openings and sought to in"uence the workers hired for these positions.
Figure 4.44 Percent Employed in the 4th Quarter Pre- and Post-Program by Hourly Wage in Subsidized Job among Tier 3 EF Participants
Up to $12.00 $12.01 to $15.00
$15.01 to$22.00
More than $22.00
0%
20%
40%
60%
80%
100%
Q Q4 Pre-Program Q Q4 Post-Program
21%18%
27%23%
15%19%
6%9%
71 Stimulating Opportunity: Job Seeker and Employer Experiences in Each of the Study Sites

When asked to compare the subsidized workers to people they typically hired for similar positions, just over half (54 percent) said they had less work experience but a similar amount of education (59 percent). Most (59 percent) also said the subsi-dized workers were as likely as others to be from a minority racial or ethnic group, although San Francisco had the highest percentage of employers across the four sites that said the subsidized workers were more likely to be from a minority group (35 percent). When asked how subsidized workers’ performance compared to that of other workers in similar positions, the employers were fairly evenly divided between those who said the subsidized workers’ occupational skill level (46 per-cent) and dependability (44 percent) were about the same as other workers and those who said the subsidized workers were weaker in these areas (42 percent of employers for both occupational skill level and dependability).
Three-quarters of the employers interviewed said they retained at least one of the subsidized workers after the subsidy period ended. Overall, employers reported retaining 41 percent of all of the subsidized workers after the subsidy ended. San Francisco was the only study site in which non-pro!t employers retained a higher percentage of subsidized workers (48 percent) than for-pro!t employers (39 per-cent). Smaller employers with fewer than 20 employees were less likely than larger employers to retain any subsidized workers. When asked what factors in"uenced their decisions not to retain some subsidized workers, two-thirds of employers said not performing well enough in their jobs was a very important reason. Few (17 per-cent) said that not having the !nancial resources to retain the workers was a very important reason.
Most employers (86 percent) said they realized savings as a result of participat-ing in the program. More than two-thirds (72 percent) said the program had a very or somewhat positive effect on the number of workers the business employs (see Figure 4.46). Most employers (71 percent) were very satis!ed with the
Figure 4.45 How Much Each Factor Contributed to Employers' Decisions to Take Part in the JobsNOW Tier 3 Program
Q A Lot Q Some
A Desire to Help People Struggling to Find Work
The Opportunity for Free or Low-Cost Labor
The Opportunity to Try Out an Employee
The Opportunity to Grow or Sustain Operations
A Positive Experience with the Agency in the Past
The Opportunity to Get Assistance with Recruiting
0% 20% 40% 60% 80% 100%
48%
40%
39%
39%
38%
33%
29%
36%
20%
28%
59% 33%
72 Stimulating Opportunity: Job Seeker and Employer Experiences in Each of the Study Sites
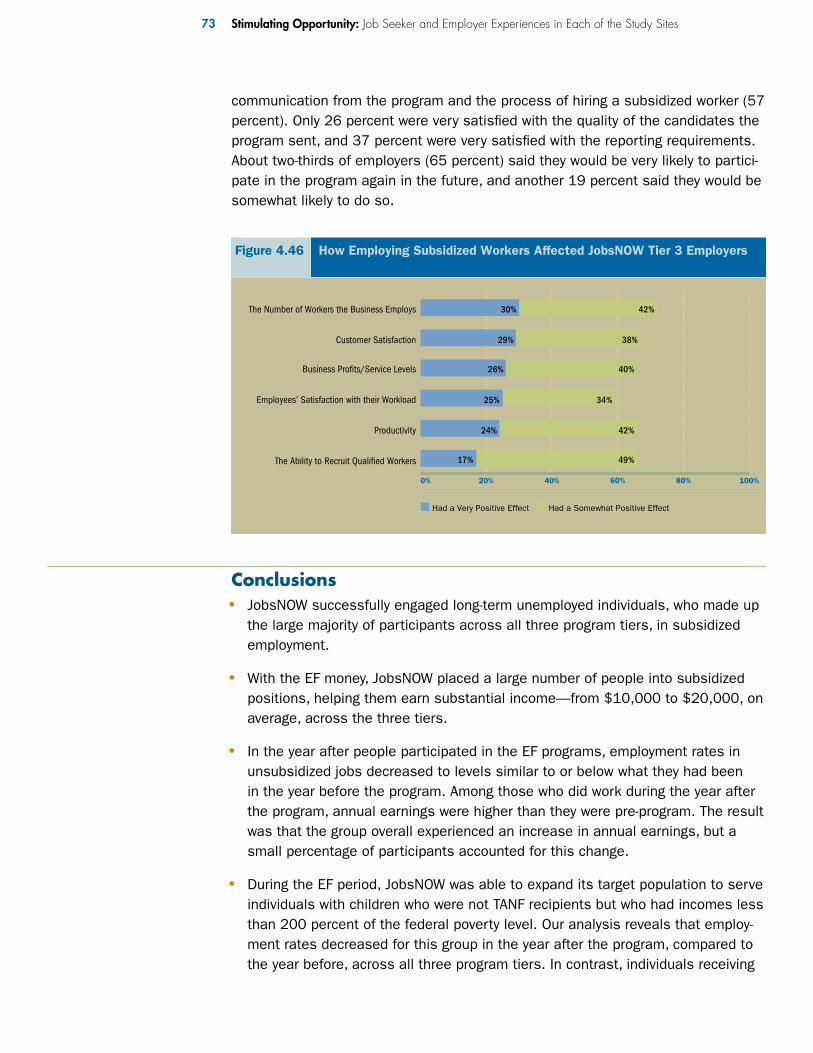
communication from the program and the process of hiring a subsidized worker (57 percent). Only 26 percent were very satis!ed with the quality of the candidates the program sent, and 37 percent were very satis!ed with the reporting requirements. About two-thirds of employers (65 percent) said they would be very likely to partici-pate in the program again in the future, and another 19 percent said they would be somewhat likely to do so.
Figure 4.46 How Employing Subsidized Workers Affected JobsNOW Tier 3 Employers
Q Had a Very Positive Effect Q Had a Somewhat Positive Effect
The Number of Workers the Business Employs
Customer Satisfaction
Business Pro!ts/Service Levels
Employees’ Satisfaction with their Workload
Productivity
The Ability to Recruit Quali!ed Workers
0% 20% 40% 60% 80% 100%
29%
26%
25%
24%
17%
38%
40%
34%
42%
49%
30% 42%
ConclusionsJobsNOW successfully engaged long-term unemployed individuals, who made up the large majority of participants across all three program tiers, in subsidized employment.
With the EF money, JobsNOW placed a large number of people into subsidized positions, helping them earn substantial income—from $10,000 to $20,000, on average, across the three tiers.
In the year after people participated in the EF programs, employment rates in unsubsidized jobs decreased to levels similar to or below what they had been in the year before the program. Among those who did work during the year after the program, annual earnings were higher than they were pre-program. The result was that the group overall experienced an increase in annual earnings, but a small percentage of participants accounted for this change.
During the EF period, JobsNOW was able to expand its target population to serve individuals with children who were not TANF recipients but who had incomes less than 200 percent of the federal poverty level. Our analysis reveals that employ-ment rates decreased for this group in the year after the program, compared to the year before, across all three program tiers. In contrast, individuals receiving
73 Stimulating Opportunity: Job Seeker and Employer Experiences in Each of the Study Sites

TANF when they entered the program experienced increases in employment rates and annual earnings from the year before to the year after program participation across all three tiers.
The non-TANF participants were more likely than the TANF participants to be among the long-term unemployed when they entered the program. However, the differences in outcomes between the TANF and non-TANF groups remained after accounting for differences in their pre-program employment rates and earnings. Data on education levels are only available for the non-TANF group. These data show that the change in employment rates did not vary by level of education; both those with a high school diploma or less and those with college degrees experienced declines in employment.
Among those who were long-term unemployed at program entry—the majority of program participants—post-program employment rates remained low. Among those with recent work experience, employment rates declined over time. The long-term unemployed fared better than those with recent work experience in the more supportive program tiers, Tier 1 and Tier 2.
In the EF-period Tier 3 program, where participants earned prevailing wages in their subsidized jobs, those with higher hourly wages in their subsidized jobs experienced decreases in employment rates from the fourth quarter before to the fourth quarter after the program while those with lower hourly wages in their subsidized jobs experienced slight increases. Total program earnings were also negatively associated with both post-program employment rates and annual earnings. It is possible that workers who earned more during the program had dif!culty obtaining unsubsidized jobs at equivalent wages after the subsidy ended and were reluctant to take jobs that paid less.
Across all three tiers, participants in the post-EF programs generally had higher employment rates in the !rst two quarters after the program than in the quarters before. In the Tier 3 program, the post-EF participants fared better in the !rst two quarters post-program than the EF participants. This difference may be related to improvements in the economy when the participants exited the program. The average annual unemployment rate in 2010, when most EF participants would have exited the program, was 9.6 percent, compared to 8.6 percent in 2011, when the post-EF participants in the study would have exited the program.
Programmatic changes may have also contributed to the differences between the Tier 3 EF and post-EF participants. The post-EF program was targeted to a more traditional population for HSA—TANF recipients as well as general assistance recipients. Program earnings were lower in the post-EF programs and the subsidy periods were shorter, lending support to the idea raised in other study sites that longer subsidy periods and higher earnings from subsidized employment may make the transition to unsubsidized employment more dif!cult, at least when the workers are not retained by their subsidized employers. Data on retention are
74 Stimulating Opportunity: Job Seeker and Employer Experiences in Each of the Study Sites

not available, but the post-program employment rates for the EF-period programs suggest that the employers did not retain most workers after the subsidy ended. For the Tier 3 program, the employer survey results suggest that retention was greater in the post-EF program, when a partial subsidy was provided for up to !ve months, rather than a full subsidy for up to a year.
On the other hand, when the goal was to help a large number of people who had struggled in the labor market gain employment and increase their incomes, the full subsidy over a longer period of time succeeded. The results suggest that translating the experience gained in subsidized work to unsubsidized employ-ment can be dif!cult for many. More individualized support to help participants make this transition may be needed, particularly when a program serves those with a wide range of employment experience, education, and skills.
The Mississippi STEPS Program
Mississippi STEPS (Subsidized Transitional Employment Program and Services) was launched with considerable fanfare in September 2009 by then-Governor Haley Barbour. Barbour had made workforce development a priority in his administra-tion, re-organizing several departments and bringing them more closely under his control. STEPS was spearheaded by the Mississippi Department of Employment Security (MDES), and state of!cials emphasized the importance of meeting employ-ers’ needs while providing job seekers employment opportunities and transfer-able work skills. After several months spent acquiring program approval, STEPS launched in January 2010. Although STEPS started with $52 million in funding, it was only able to draw down $22 million before the stimulus program ended in September 2010. Enthusiasm for STEPS led Mississippi to operate a second $3 million program with Department of Education ARRA governor’s discretionary funds from August to December 2011.
The governor led a major marketing effort, speaking at conferences, appearing in television and radio spots, and promoting the initiative on billboards throughout the state. Although he expressed reservations about the federal stimulus program,20 Barbour saw an opportunity to use the ARRA funds to bolster the Mississippi economy:
“Mississippi STEPS is unique in that it is a program speci!cally designed to bene!t both the employee and employer,” Governor Barbour said. “The STEPS program will provide much-needed aid during this recession by enabling businesses to hire new workers, thus enhancing the economic engines of our local communities.”21
Program DesignState of!cials in Jackson designed STEPS and allowed little local variation. The state’s four regional workforce investment of!ces oversaw the program, and it
75 Stimulating Opportunity: Job Seeker and Employer Experiences in Each of the Study Sites

operated through the 54 Workforce Investment Network (WIN) Job Centers located throughout the state. The local Job Center staff recruited unemployed job seekers as well as local employers. The Job Centers also worked with their counterparts from the Mississippi Department of Human Services (MDHS) to identify appropriate TANF and SNAP candidates.
Eligibility. During the EF program, STEPS was open to individuals who had at least one child under 18 at home and whose total family income was at or below 250 percent of the federal poverty guidelines. This included TANF and SNAP recipients, who were priority populations for the program, as well as individuals who applied for the program through the WIN Job Centers. In addition, individuals could be referred to the Job Centers by participating employers interested in hiring them, through a process termed “reverse referrals.” If these candidates met the program criteria, the centers approved the placements and their employers were eligible for wage subsidies. STEPS II lifted the income limits and the requirement that partici-pants have a child under age 18.
Subsidy structure and employer of record. The STEPS program provided employ-ers subsidies for the wages of eligible participants hired under the program using a step-down formula. Employers were subsidized for 100 percent of wages for the !rst two months, 75 percent for the third month, 50 percent for the fourth and !fth months and 25 percent for the !nal month of the program. Employers were required to put participants on their payrolls at the start of the subsidy period. STEPS II provided a similar program structure, albeit with a shorter four-month sub-sidy period. The state emphasized the importance of continued employment after the subsidy period ended from the beginning.
Employer recruitment. The WIN Job Centers had extensive experience working with employers to hire subsidized workers through aggressive use of on-the-job train-ing funds (OJT). This experience facilitated the launch of STEPS since the centers had extensive employer contacts, and both center staff and employers were famil-iar with using subsidies to reduce the cost of new hires. One important feature of STEPS implementation was that the centers used temporary staff to work with employers to ensure submission of accurate invoices for the wage subsidies.
Support before or during the subsidy period. The STEPS program focused on immediate placement of eligible job seekers into subsidized positions. STEPS did not provide additional supports or training before or during the subsidy period. Participants who were TANF recipients could access the supports for which they were eligible through MDHS, and eligible job seekers could access other resources available through the job centers.
Assistance securing unsubsidized employment. Participants did not receive assis-tance with !nding an unsubsidized job as part of the STEPS program, but they could return to the Job Centers to access other services if their subsidized place-ments did not turn into unsubsidized employment after the subsidy ended.
76 Stimulating Opportunity: Job Seeker and Employer Experiences in Each of the Study Sites

Characteristics of the STEPS ParticipantsFrom January to September 2010, the Mississippi STEPS program placed 3,228 adults into subsidized positions.22 According to program of!cials, 40 percent of the individuals placed in subsidized jobs were SNAP recipients and 12 percent were TANF recipients. Three quarters of participants were women and just under half were under age 30 (see Figure 4.47). Two-thirds of participants were African American, compared to 37 percent of the state’s population. The largest group served was African American women, who accounted for more than half (55 per-cent) of all participants. Twenty percent of participants had not completed their high school education—a !gure similar to the statewide rate—and 51 percent had obtained a high school diploma but had no post-secondary education. Just under half of participants (46 percent) were among the long-term unemployed at the time of program entry. The average annual income among all participants in the year before the program began was $6,483. The highest pre-program incomes were found among White, male, and older participants.
Figure 4.47 Mississippi STEPS Participant Characteristics
Gender
Female 75%
Male 25%
Race
White 32%
African American/Black 67%
Other 1%
Age
Under 30 45%
30 to 39 36%
40 to 49 16%
50 and over 3%
Highest education level
Less than high school diploma 20%
High school diploma/GED 51%
Some college 21%
AA or other PSE certi!cate 5%
BA and graduate degrees 4%
Long-term unemployed 46%
Average annual earnings in the year before program entry $6,483
The STEPS Subsidized JobsThe STEPS program placed participants with for-pro!t !rms, non-pro!ts and public hospitals. Federal, state, and local public agencies were not eligible for the wage subsidies. The program prioritized small businesses with 25 or fewer employees but, given the substantial budget for STEPS, in practice most employers were accepted into the program. No more than half of an employer’s workforce could
77 Stimulating Opportunity: Job Seeker and Employer Experiences in Each of the Study Sites

participate at one time in the STEPS program. Certain occupations, including those dependent on commissions and those deemed by the state to be “illegal or con-troversial in nature,” including adult entertainment or bartending, were ineligible. The three largest industries in which participants were placed were manufacturing (a quarter of all placements), accommodations and food services (19 percent), and retail trade (15 percent). A little over half of subsidized positions were in busi-nesses of fewer than 50 employees, with approximately 43 percent in establish-ments with fewer than 20 workers.
STEPS participants received the prevailing wages for the positions in which they were placed, with no cap on hourly wages paid. The program required that the posi-tions provide at least 30 hours of work per week, and the positions could not be temporary or seasonal. Participants earned hourly wages of $8.80, on average, in their subsidized jobs; the median hourly wage was $7.55. Male participants earned higher hourly wages than female participants ($10.60 versus $8.21) and White participants earned higher hourly wages than others ($10.12 versus $8.20). The difference in hourly wages between White and African American participants was driven in part by educational differences. While high school graduates averaged $8.59 an hour, college graduates averaged $12.61, and White participants were more likely to have a college degree. The long-term unemployed earned slightly lower hourly wages in their subsidized jobs, on average, than participants who had been employed recently ($8.60 versus $8.96).
The subsidy period in the STEPS program was expected to last six months. However, since program funding ended on September 30, 2010, many of the posi-tions were much shorter. On average, participants were in their subsidized jobs for 13 weeks. Participants earned an average of $4,050 in their subsidized positions; median earnings from STEPS positions were $3,421.
Post-Program Employment and EarningsThe step-down structure of the subsidy in the STEPS program was intended to encourage employers to retain workers after the subsidy period ended. However, they were not required to do so. As shown in !gure 4.48, the percentage of STEPS participants employed in the four quarters after the program ended was substan-tially greater than in the four quarters before they enrolled. While the employment rate fell somewhat after the !rst post-program quarter, by the fourth quarter after the program 62 percent of participants were employed—13 percent more than in any quarter during the year prior to the start of the STEPS program. According to an analysis conducted by the state, subsidized employers retained 47 percent of par-ticipants in the quarter after the subsidy period ended.
Earnings among participants who were working also increased over time. Average earnings among the employed were greater in each quarter during the year after the program ended than in the four quarters prior to the program (see Figure 4.49).
78 Stimulating Opportunity: Job Seeker and Employer Experiences in Each of the Study Sites

As a result of the increases in employment rates and earnings, average annual earnings among all STEPS participants increased by $3,549 from the year before to the year after the program, to $10,032 (see Figure 4.50). Among participants employed at any time during the year after the program, average annual earnings were $11,913, a 34 percent increase over the annual earnings of individuals who were employed during the year before the program.
Outcomes for STEPS Participant SubgroupsOur analysis of the outcomes of participant subgroups revealed that employment rates in the fourth quarter post-program were higher among Black men than White men and among Black women than White women (see Figure 4.51). These out-comes stand in stark contrast to the staggering unemployment rates of Blacks in Mississippi, which averaged 18 percent in 2010—triple the rate for White Mississippi workers.23 White participants had higher earnings in the years before and after the program but the change in earnings over time was similar among White and Black men and among White and Black women (see Figure 4.52). Male participants were more likely to be employed than female participants in the fourth quarter post-program, and they experienced signi!cantly greater increases in earn-ings from the year before to the year after the program. White workers were more likely than Black workers to be retained by their subsidized employers in the quar-ter after the program, but there were no differences in retention between male and female participants.
The 46 percent of participants who were among the long-term unemployed when they entered the STEPS program realized signi!cant gains in the year after par-ticipating in the program. Participants who had recent work experience when they entered the program were more likely than those who were long-term unemployed to be working in the fourth quarter post-program. However, as shown in !gure 4.53,
Q4 Pre
Q3 Pre
Q2 Pre
Q1 Pre
Q1 Post
Q2 Post
Q3 Post
Q4 Post
Figure 4.48 Quarterly Employment Rates Pre- and Post-Program among STEPS Participants
0%
20%
40%
60%
80%
100%
48% 46%43%
72%
66%63% 62%
49%
Q4 Pre
Q3 Pre
Q2 Pre
Q1 Pre
Q1 Post
Q2 Post
Q3 Post
Q4 Post
Figure 4.49 Average Quarterly Earnings Pre- and Post- Program among Employed STEPS Participants
$0
$1000
$2000
$3000
$4000
$5000
$3,433 $3,457
$3,097
$2,739
$3,760$3,545
$3,895$4,125
Year BeforeProgram
Year AfterProgram
Figure 4.50Average Annual Earnings Pre- and Post- Program among All STEPS Participants
$0
$2000
$4000
$6000
$8000
$10,000
$12,000
$6,483
$10,032
79 Stimulating Opportunity: Job Seeker and Employer Experiences in Each of the Study Sites

Figure 4.51 Percent Employed in the Fourth Quarter Pre- and Post-Program by Gender and Race
White Male Black Male White Female Black Female0%
20%
40%
60%
80%
100%
Q Q4 Pre-Program Q Q4 Post-Program
68%
50%
71%
48%
56%51% 49%
62%
White FemaleWhite Male Black FemaleBlack Male
Figure 4.52 Average Annual Earnings Pre- and Post-Program by Gender and Race
$0
$5000
$10,000
$15,000
$20,000
Q Year Before Program Q Year After Program
$17,667
$14,666
$9,918
$7,657
$10,473
$7,365
$5,833$4,690
the percent employed among those who had recent work experience decreased slightly from the fourth quarter before the program to the fourth quarter after, while it increased by 30 percentage points among the long-term unemployed. Long-term unemployed participants were also more likely than those with recent work experi-ence to be retained by their subsidized employers.
The annual earnings of the long-term unemployed increased substantially from $934 in the year prior to the program to $8,040 in the year after the program (see Figure 4.54). While the post-program earnings of the long-term unemployed
Long-Term Unemployed Not Long-Term Unemployed0%
20%
40%
60%
80%
100%
Figure 4.53 Percent Employed in the 4th Quarter Pre- and Post-Program by Long-Term Unemployment Status
Q Q4 Pre-Program Q Q4 Post-Program
54%
70%
24%
68%
$0
$2000
$4000
$6000
$8000
$10,000
$12,000
$14,000
Figure 4.54 Average Annual Earnings Pre- and Post-Program by Long-Term Unemployment Status
Long-Term Unemployed Not Long-Term Unemployed
Q Year Before Program Q Year After Program
$10,204
$8,040
$934
$11,812
80 Stimulating Opportunity: Job Seeker and Employer Experiences in Each of the Study Sites

were lower than those of participants who had more recent work experience at pro-gram entry, the change in participants’ annual earnings over time was largely driven by the long-term unemployed.
We found that employment rates and earnings increased with participants’ educa-tion levels both before and after program participation. Participants with an associ-ate’s degree or other post-secondary certi!cate experienced the greatest increase in annual earnings. Interestingly, there were no differences in whether participants were retained by their subsidized employer by education level. For the most part, there were no signi!cant differences in outcomes by age group with the exception that workers age 50 or older had a greater increase in annual earnings than work-ers under age 30.
Differences in Outcomes by STEPS Program ExperienceWe found that participants’ post-program employment outcomes varied by their experiences in the subsidized positions in multiple ways:
Participants with subsidized positions at employers with 100 or more employees were more likely than those at smaller employers to be retained by the employers after the subsidy period ended. Participants with subsidized positions at employ-ers with less than 10 employees experienced smaller increases in annual earn-ings post-program than those who had subsidized positions at larger employers.
The longer participants remained in their subsidized positions, the more likely they were to be retained by their subsidized employer and to experience greater increases in employment rates and annual earnings from the year before to the year after pro-gram participation.
Participants earning higher hourly wages in their subsidized positions were more likely to be retained by their subsidized employers in the quarter after the program and had greater increases in annual earnings from the year before to the year after pro-gram participation (see Figure 4.55).
$9.01 to $29.00$7.25 or less $7.26 to $9.00
Figure 4.55 Average Annual Earnings Pre- and Post-Program by Hourly Wage in Subsidized Job
$0
$5000
$10,000
$15,000
$20,000
Q Year Before Program Q Year After Program
$6,516
$9,037
$17,576
$3,993
$5,382
$10,112
81 Stimulating Opportunity: Job Seeker and Employer Experiences in Each of the Study Sites

Employer Experiences with the STEPS ProgramNearly 1,000 employers participated in one or both of the STEPS programs. We interviewed a sample of 104 employers. Eighty-eight percent had participated in STEPS I and 53 percent had participated in STEPS II (41 percent had participated in both). Nearly all (88 percent) of the employers interviewed in Mississippi were for-pro!t !rms. The employers were largely concentrated in one of four sectors: manufacturing (36 percent), wholesale and retail trade (14 percent), hospitality and leisure (11 percent) and social services (11 percent). While 42 percent of employ-ers had fewer than 20 employees, Mississippi had the highest percentage of employers with 50 or more employees among the study sites (44 percent).
Nearly two-thirds of the employers (63 percent) had three or more subsidized work-ers. Employers cited many reasons for deciding to participate in STEPS, with the opportunity for free or low-cost labor and the desire to help people struggling to !nd work the most common (see Figure 4.56). Remarkably, nearly 60 percent cited a positive experience they had had with the agency operating the program, perhaps re"ecting Mississippi’s extensive work with employers using on-the-job training funds prior to STEPS. Sixty percent of employers created new positions in order to employ the subsidized workers. The other 40 percent !lled available positions.
Figure 4.56 How Much Each Factor Contributed to Employers' Decisions to Take Part in the STEPS Program
Q A Lot Q Some
The Opportunity for Free or Low-Cost Labor
A Desire to Help People Struggling to Find Work
The Opportunity to Try Out an Employee
The Opportunity to Grow or Sustain Operations
The Opportunity to Get Assistance with Recruiting
A Positive Experience with the Agency in the Past
0% 20% 40% 60% 80% 100%
60%
37%
52%
44%
45%
26%
45%
29%
29%
14%
75% 16%
Overall, Mississippi employers reported that subsidized employees were quite simi-lar to those typically hired in terms of education, work experience, and racial back-grounds. Notably, over 80 percent of employers said that the subsidized workers were equally or more skilled than their usual hires and were just as dependable, if not more so (see Figure 4.57). Almost all (93 percent) of the employers interviewed said they retained at least one subsidized worker after the subsidy period ended.
82 Stimulating Opportunity: Job Seeker and Employer Experiences in Each of the Study Sites

Overall, employers reported retaining 54 percent of the subsidized workers after the subsidy ended—the highest percentage across the four study sites where we conducted the survey.
Nearly all of the employers (96 percent) said they realized savings as a result of participating in the program. More than 80 percent said the program had either a very or somewhat positive effect on productivity, business pro!ts, the number of workers they were able to employ, and employees’ satisfaction with their workload (see Figure 4.58). Employers expressed high levels of satisfaction with the com-munication from the program and the speed of reimbursement for wages paid to subsidized workers. More than half (53 percent) said they were very satis!ed with the quality of the candidates the program sent—the highest percentage across the study sites—and nearly 90 percent said they would be very likely to participate in a similar program in the future.
Figure 4.57 STEPS Employers' Views of Subsidized Workers' Performance Compared with People Typically Hired for Similar Positions
Q Stronger Q About the Same Q Weaker
Basic Skills, Such as Reading, Writing or Math
Occupational Skill Level
Dependability, including Attendance and Punctuality
Motivation and Work Effort
0% 20% 40% 60% 80% 100%
29%
60%29%
38%
58% 14%
11%
53% 9%
11% 7%82%
Figure 4.58 How Employing Subsidized Workers Affected STEPS Employers
Q Had a Very Positive Effect Q Had a Somewhat Positive Effect
Productivity
Business Pro!ts/Service Levels
The Number of Workers the Business Employs
Employees’ Satisfaction with their Workload
Customer Satisfaction
The Ability to Recruit Quali!ed Workers
0% 20% 40% 60% 80% 100%
48%
53%
42%
47%
40%
39%
32%
40%
30%
4.34%
48% 41%
83 Stimulating Opportunity: Job Seeker and Employer Experiences in Each of the Study Sites

ConclusionsDespite its relatively short duration, Mississippi’s STEPS program reached an impressive scale.
About half the subsidized workers were retained, at least initially, by their employ-ers after the subsidy ended—a higher percentage than in the other study sites.
STEPS was able to enroll many job seekers who were unemployed for a consider-able length of time (nearly half were among the long-term unemployed) and many of them experienced sustained unsubsidized employment.
STEPS participants also saw similar employment gains regardless of race, although differences in earnings remained—an important achievement given dif-ferences in unemployment rates statewide between Black and White workers.
Among the employers in the four locations where we conducted the survey, Mississippi’s were the most enthusiastic about the program. Their percep-tions may re"ect that the program was designed to meet both business and job-seeker needs, provided considerable "exibility in employer hiring (includ-ing reverse referrals where employers referred candidates they wanted to hire to WIN Job Centers to determine program eligibility), and eased the burdens caused by the complex step-down subsidy formula by providing on-site adminis-trative support from center staff.
The Florida Back to Work Program
Florida’s Back to Work program was overseen by the state’s Agency for Workforce Innovation (now the Department of Economic Opportunity), in partnership with the Department of Children and Families and the state workforce board, Workforce Florida. The state’s 24 regional workforce boards administered the program at the local level. These boards administer the Workforce Investment Act and the Wagner-Peyser Act and are also responsible for the workforce components of the state’s Temporary Assistance for Needy Families (TANF) program. The state’s goals for Back to Work were to stimulate job creation for businesses, get money into the pockets of workers and give them some job experience, and divert eligible individu-als seeking TANF bene!ts from the welfare rolls. The program period in most work-force areas was March or April through September 30, 2010. The state approved projects that proposed to create almost 14,000 subsidized job openings, although many of these were never !lled. Statewide the regional workforce boards signed 1,039 agreements with employers to host subsidized workers and placed just under 5,600 individuals into subsidized jobs.
84 Stimulating Opportunity: Job Seeker and Employer Experiences in Each of the Study Sites
Program DesignEligibility. To be eligible to participate in Back to Work, individuals had to be either current TANF recipients, applicants for TANF who were found to be eligible for bene-!ts, or job seekers with family incomes at or below 200 percent of the poverty level and a child under age 18. To identify eligible participants, regional workforce board staff combed through their existing TANF caseloads for job-ready participants. They also assessed other individuals seeking their services for eligibility and took refer-rals from community partners.
Job preparation or training services. Florida did not require boards to provide spe-ci!c pre-placement services beyond assessing individuals for eligibility. Program participants could access the services already available at their One-Stop Career Centers, such as help with resumes and other job readiness services. Overall, how-ever, the program focused on immediate placement into subsidized positions for job seekers deemed job-ready.
Subsidy structure and employer of record. Employers participating in Back to Work were required to put subsidized workers on their payrolls starting the !rst day of the subsidy period. Employers were expected to assume a portion of the costs of their subsidized workers and could count some of the costs of supervising the workers toward the subsidy amount. The subsidy levels were calculated individu-ally for each employer and ranged from 80 to 95 percent of the costs of employing workers. The program required private, for-pro!t employers to commit to retaining the employee after the subsidy period ended. Non-pro!t employers were encour-aged to retain workers but not required to commit to doing so.
Employer recruitment. The regional workforce boards took advantage of existing relationships with local employers to market Back to Work and also used the pro-gram as an opportunity to initiate relationships with new employers. They engaged partners, such as local economic development agencies, to get information out to large numbers of for-pro!t and non-pro!t employers. The state also conducted a marketing campaign to attract employers to the program.
Support during the subsidy period. The regional workforce boards followed up with employers to verify employment and process wage reimbursements, but there was no requirement at the state level for post-placement support services. Workers could apply for help with transportation or childcare from their regional workforce boards. Some boards chose to provide job coaching to participants but such ser-vices varied by board.
Assistance securing unsubsidized employment. When a subsidized position ended, program staff would attempt to place the individuals again or encourage them to access other services provided by the regional workforce boards to !nd a job.
85 Stimulating Opportunity: Job Seeker and Employer Experiences in Each of the Study Sites

Characteristics of the Florida Back to Work ParticipantsFrom late March through September 2010, the Florida Back to Work program placed 5,588 people into subsidized jobs. Just over a third (35 percent) of the indi-viduals placed in subsidized jobs were TANF recipients or eligible applicants, and 65 percent were other eligible job seekers. About two-thirds of the Back to Work participants were female and 38 percent were under age 30 (see Figure 4.59). African Americans had greater representation in the Back to Work population than in the statewide population (42 percent versus 16 percent).
Figure 4.59 Florida Back to Work Participant Characteristics
Gender
Female 68%
Male 32%
Race
White 42%
African American/Black 42%
Hispanic 6%
Other 2%
Age
Under 30 38%
30 to 39 33%
40 to 49 22%
50 and over 7%
Highest Education Level
Less than high school diploma 6%
High school diploma/GED 42%
Some college 21%
AA or other PSE certi!cate 17%
BA and graduate degrees 15%
Long-term unemployed 51%
Average annual earnings in the year before program entry $7,562
Most participants had at least a high school diploma or GED but only 15 percent had a bachelor’s or graduate degree, compared to 34 percent statewide. About half of the participants (51 percent) were among the long-term unemployed.
The Florida Back to Work Subsidized JobsThe Back to Work program placed participants with for-pro!t, non-pro!t, and public sector employers. The two most common industries in which participants were placed were administrative and support services (36 percent) and information (32 percent). The state subsidized jobs that paid up to $40,579—the average wage across the state in 2008. Florida capped the subsidy period at 12 months. However, the program only operated for about six months; therefore, the subsidized jobs were much shorter than anticipated.
86 Stimulating Opportunity: Job Seeker and Employer Experiences in Each of the Study Sites

Back to Work participants earned an average hourly wage of $11.89 in their subsi-dized jobs; the median hourly wage was $11.00.24 Hourly wages in the subsidized positions varied by participant characteristics. Male participants earned more than female participants ($12.76 versus $11.49), and White participants earned more than African American and Hispanic participants ($12.45 versus $11.20 and $11.05, respectively). Wages in the subsidized jobs increased with participants’ education levels. Participants with bachelor’s or graduate degrees earned an aver-age of $14.46 per hour, compared to $12.04 an hour among those with an associ-ate’s degree or post-secondary certi!cate and $11.36 an hour among those with a high school diploma or GED and no post-secondary education. The long-term unemployed earned hourly wages in their subsidized jobs that were similar to par-ticipants who had worked more recently ($11.81 versus $11.97).
Post-Program Employment and EarningsAs described in Chapter 2, Florida of!cials provided employment and earnings data for a group of 16,204 job seekers who were deemed eligible for the Back to Work program but never placed in subsidized jobs. These job seekers were nearly identi-cal to the Back to Work participants in terms of their demographic characteristics, levels of education, and target group (that is, TANF-eligible versus other low-income job seekers).25 The two groups were also similar in terms of employment rates and earnings in the four quarters prior to the start of the program. Given the similarities in the groups’ background characteristics and their motivations to seek employ-ment, the non-participants’ outcomes provide a strong indicator of what may have happened to the Back to Work participants in the absence of the program and, therefore, are useful for assessing the program’s impact on participants.
As shown in !gure 4.60, both the Back to Work participants and the comparison group of non-participants had higher employment rates in each quarter of the year after the program than in the year before. The percent of Back to Work participants employed in the !rst quarter after the program ended was substantially higher than the percent of non-participants employed (75 percent versus 52 percent). The per-cent of participants who were employed decreased in the second quarter after the program to 59 percent but remained greater than the percent of non-participants ZKR�ZHUH�HPSOR\HG�WKURXJK�WKH�IRXUWK�TXDUWHU�SRVW�SURJUDP�DW�VWDWLVWLFDOO\�VLJQL¿-cant levels.
Earnings among the Back to Work participants who were employed increased dur-ing each quarter after the program, surpassing their pre-program quarterly earnings by the third quarter post-program (see Figure 4.61). The earnings of employed Back to Work participants were signi!cantly greater than the earnings of non-participants in each quarter during the year after the program.
Looking at annual earnings among all participants, including those with zero earnings, Back to Work participants’ earnings increased by 52 percent between the year before and the year after the program (see Figure 4.62). Comparatively,
87 Stimulating Opportunity: Job Seeker and Employer Experiences in Each of the Study Sites

Q4 Pre Q3 Pre Q2 Pre Q1 Pre Q1 Post Q2 Post Q3 Post Q4 Post
Figure 4.60 Quarterly Employment Rates Pre- and Post-Program for Florida Back to Work (FBTW) Participants and Comparison Group Members
0%
20%
40%
60%
80%
100%
FBTW
Q Pre-Program
Q Post-Program
Comparison Group
Q Pre-Program
Q Post-Program
48%43% 45%
41% 42%39% 41%
59%
52%
59%
53%58%
53%
75%
52%
44%
Q4 Pre Q3 Pre Q2 Pre Q1 Pre Q1 Post Q2 Post Q3 Post Q4 Post
Figure 4.61 Average Quarterly Earnings Pre- and Post-Program among Employed Florida Back to Work (FBTW) Participants and Comparison Group Members
FBTW
Q Pre-Program
Q Post- Program
Comparison Group
Q Pre-Program
Q Post-Program
$0
$1000
$2000
$3000
$4000
$5000
$6000
$7000
$4,8
94
$4,8
54
$4,6
39
$4,7
38
$4,3
12
$4,4
44
$4,2
25
$4,3
75
$4,2
57
$4,0
02 $4,4
23
$4,0
26
$4,9
43
$4,4
84 $5,0
61
$4,7
11
88 Stimulating Opportunity: Job Seeker and Employer Experiences in Each of the Study Sites

non-participants’ earn-ings increased by only 18 percent. In the year after the program ended, par-ticipants earned nearly $2,000 more than non-participants. While the differences in earnings cannot de!nitively be attributed to the program, the results demonstrate that job seekers who worked in subsidized jobs through the Back to Work program had better employment and earn-ings outcomes in the year after the program than similar job seekers who did not take part in the program.
Outcomes for Florida Back to Work Participant SubgroupsWe examined differences in outcomes for subgroups of Back to Work participants and compared their outcomes to their counterparts in the non-participant group. There were no signi!cant differences in employment rates or changes in earnings between male and female Back to Work participants. Participants younger than age 50 experienced greater increases in employment and earnings than those who were age 50 or older. Participants’ pre- and post-program earnings increased with their education levels. Those with a bachelor’s degree had signi!cantly greater increases in annual earnings from the year before to the year after the program than did participants without a high school diploma. The change in earnings for participants with a high school diploma or some college was not signi!cantly differ-ent than the change for those with no high school diploma.
White participants earned more than Black participants and experienced signi!cantly greater increases in annual earnings from the year before to the year after program participation (see Figure 4.63). Hispanic participants, who accounted for only six percent of the Back to Work participants, also experienced larger increases in annual earnings than Black participants. All of the participant subgroups we examined by gender, race, age, and education had signi!cantly greater increases in employment and earnings than their counterparts in the comparison group of non-participants.
As noted earlier, half of the Florida Back to Work participants were among the long-term unemployed when they entered the program. Just over half (52 percent) of these individuals were still working four quarters after the Back to Work program
$0
$2000
$4000
$6000
$8000
$10,000
$12,000
$14,000
Figure 4.62 Average Annual Earnings Among All Florida Back to Work (FBTW) Participants and Comparison Group Members
Year Before Program Year After Program
FBTW
Q Pre-Program
Q Post-Program
Comparison Group
Q Pre-Program
Q Post-Program
$11,511
$8,113$7,562
$9,591
89 Stimulating Opportunity: Job Seeker and Employer Experiences in Each of the Study Sites

ended, compared to 45 percent of comparison group members who were long-term unemployed. The annual earnings of long-term unemployed participants increased substantially from $1,308 in the year prior to pro-gram entry to $9,781 in the year after the program ended (see Figure 4.64). On average, long-term unemployed Back to Work participants earned $2,254 more than those who did not participate in the program. While the earnings among Back to Work participants who had worked more recently decreased slightly over time, their earnings in the year after the program ended were $1,648 greater than those of the comparison group. The results suggest that the increase in annual earnings found among all participants was driven largely by increases in the earnings of the long-term unemployed participants.
Figure 4.63 Average Annual Earnings Pre- and Post-Program by Race/Ethnicity
FBTW
Q Year Before Program
Q Year After Program
Comparison Group
Q Year Before Program
Q Year After Program
BlackWhite Hispanic$0
$4000
$8000
$12,000
$16,000
$10,498
$9,243
$11,851
$13,532
$6,926$6,150
$8,229$9,002
$4,410
$2,874
$6,980
$8,816
Figure 4.64 Average Annual Earnings Pre- and Post-Program by Long-Term UnemploymentStatus
Not Long-Term UnemployedLong-Term Unemployed$0
$4000
$8000
$12,000
$16,000
FBTW
Q Pre-Program
Q Post-Program
Comparison Group
Q Pre-Program
Q Post-Program
$1,332$1,308
$7,527
$9,781
$14,908$14,058
$11,660
$13,308
90 Stimulating Opportunity: Job Seeker and Employer Experiences in Each of the Study Sites

ConclusionsThe Florida Back to Work participants experienced signi!cantly greater increases in employment and earnings than a comparison group of similar individuals who did not take part in subsidized employment. The evidence suggests that Florida’s subsidized employment model was an effective strategy for helping unemployed, low-income individuals move into employment and increase their earnings at a time when the state’s economy continued to struggle to recover from the recession. All of the participant subgroups we examined, by gender, race, age, education levels, and long-term unemployment status, fared better than their counterparts in the comparison group of non-participants. The results indicate that the program was particularly bene!cial to individuals who were among the long-term unemployed when they started the program.
91 Stimulating Opportunity: Job Seeker and Employer Experiences in Each of the Study Sites

Chapter 5Implications and Conclusions
Our evaluation demonstrates that states were quickly able to launch subsidized employment strategies that employed large numbers of unemployed workers, help-ing them earn immediate income at a time when unemployment rates were histori-cally high. The "exibility of the ARRA funding allowed for wide variations in program goals, job seeker eligibility, the lengths and depths of subsidies, and required employer commitments. The public representatives we interviewed typically were proud of the programs they created, regretful that the stimulus funds had been discontinued, and enthusiastic about the promise of subsidized employment strate-gies. The employers we surveyed felt similarly.
Our !ndings lead to the following conclusions:
Subsidized employment programs can have a signi!cant positive impact on low-income job seekers’ employment and earnings. In Florida, where we have informa-tion about the outcomes of a strong comparison group of individuals who were eligible for but did not take part in subsidized employment, program participants experienced signi!cantly greater increases in unsubsidized employment and earn-ings in the year after the program than members of the comparison group did.
Participants in three of the other four study sites had similar increases in unsubsidized employment and earnings as those experienced by participants in Florida, although in these locations, we do not have employment and earnings data for comparison groups. The results show that workers participating in differ-ent types of subsidized employment programs experienced positive outcomes.
Employers across the states we examined said they generated jobs that would not have existed otherwise, suggesting that subsidized employment programs can help stimulate business growth. Employers also saw bene!ts to their bottom line and were eager to participate in similar subsidized employment programs in the future.
The subsidized employment programs we studied offered particular bene!ts to job seekers who have been unemployed for more than six months. In most sites, a large part of the changes in participant earnings from the year before to the year after program participation were driven by improvements made among these long-term unemployed workers.
Individuals with signi!cant barriers to employment, including TANF recipients and those with criminal records, experienced large increases in unsubsidized employment and earnings from the year before to the year after participating in the programs.
92 Stimulating Opportunity: Implications and Conclusions

The !ndings also suggest some lessons for policymakers and practitioners design-ing subsidized employment programs.
While the details of the programs varied, the sites we studied implemented sub-sidized employment programs that followed one of two basic models. In one, subsidized workers were hired by employers, earned prevailing wages for their jobs, and did not receive support beyond assistance obtaining a subsidized job. In the other, subsidized workers were on the payroll of a third party rather than the employer where they performed the work, were paid a !xed wage, and received job readiness training and counseling to help them succeed in their subsidized positions and transition to unsubsidized employment. Workers in both types of program models experienced increases in unsubsidized employ-ment and earnings after participating in the programs.
Subsidized workers were more likely to be retained by their employers after the subsidy period ended if the programs required employers to place subsidized workers on their payrolls, offered partial or stepped-down subsidies that required employers to begin partly covering wages soon after employment began, and set expectations that employers retain workers who perform well.
Programs that placed subsidized workers on the payroll of a third party interme-diary and required minimal commitment from the employer where the work was performed were able to serve more disadvantaged participants, including more long-term unemployed participants, TANF recipients, and individuals with crimi-nal convictions. While retention rates by the subsidized employers were lower in these programs than in programs where employers hired subsidized workers directly, participants in these programs experienced substantial increases in unsubsidized employment rates from the year before to the year after program participation, indicating that many participants found unsubsidized employment elsewhere after working in subsidized positions.
When programs did not ask employers to commit to retaining workers after the subsidy period ended, participant outcomes were better where the programs provided workers individualized assistance with obtaining unsubsidized employ-ment and subcontractors received monetary incentives for making unsubsidized placements. Post-program employment rates in such programs were also better when the hourly wages participants earned in the subsidized jobs were lower. In order to promote the transition to unsubsidized employment, when setting wage rates for subsidized jobs or limits on the wages of jobs that are eligible for sub-sidies, programs should consider whether participants can obtain unsubsidized employment at similar or better wages either on their own or with the assistance of program staff.
Across the sites, employers reported retaining 37 percent of the subsidized workers after the subsidy period ended, and the most common reasons given for not retaining workers were poor attendance and other performance issues.
93 Stimulating Opportunity: Implications and Conclusions
Program designers may need to build more supports into subsidized employment programs for workers with limited work histories to help them succeed on the job and to increase post-subsidy retention. The most common supports needed, according to employers, were child care, transportation, coaching on communica-tion skills, and computer training.
All of the sites were successful in engaging for-pro!t employers in the programs, and these employers were more likely than non-pro!ts and public agencies to retain workers after the subsidy period ended. For-pro!ts were also more willing to participate in programs that offered partial subsidies.
Non-pro!ts and public agencies may be more willing to take on workers with less work experience and education than their typical employees, providing opportuni-ties for those more disadvantaged in the labor market to gain work experience. However, they were less likely to have the resources to keep the workers on after the subsidies ended.
In sum, the results of the comparison group analysis in Florida and the similar gains participants realized at the other study sites suggest that subsidized employ-ment can be an effective strategy for helping unemployed, low-income individuals move into employment and increase their earnings. Unlike subsidized employment programs of the past that relied on public sector employment, the EF-supported programs engaged the private sector in creating job opportunities, and private employers realized substantial bene!ts from participating in the programs. The !ndings are particularly important for the nation’s millions of long-term unemployed workers, including those who lost jobs as a result of the economic downturn and those who face barriers to employment due to limited work histories and skills. As evidence grows that these workers are still being shunned by employers due to the amount of time they have been out of work, the !ndings suggest that subsidized employment may be able to provide the boost that many need to re-enter the regu-lar labor market.
94 Stimulating Opportunity: Implications and Conclusions

Endnotes
1. Bureau of Labor Statistics, http://www.bls.gov/news.release/empsit.t12.htm.
2. See http://www.nationaljournal.com/congress/the-poorly-attended-hearing-on-one-of-the-economy-s-toughest-problems-20130424
3. We did not conduct the survey in Florida because the program ended two years earlier, raising concerns about employers’ abilities to recall information, and because the state did not keep centralized employer contact information.
4. The primary reasons non-participants were not placed in subsidized jobs included the EF program period ending before placement, their skills or interests did not match the available subsidized positions, or they found unsubsidized employment on their own.
5. See Appendix B for a complete breakdown of the characteristics of the Back to Work participants and non-participants.
6. In this report we refer to workers who had been unemployed for more than 26 weeks as the long-term unemployed. However, this de!nition differs from the government’s de!nition of long-term unemployed, which only counts individuals who were in the labor market by virtue of having looked for a job in the past four weeks and who were unem-ployed for more than 26 weeks. We do not have data on whether par-ticipants had been looking for work.
7. Wisconsin’s TJ program began in September 2010 and continued beyond the September 30, 2010 expiration of the EF programs in the other sites.
8. Data on total earnings from the subsidized positions were not avail-able at the time of our request from Wisconsin and Florida.
9. Earnings in Figure 2.11 are for the entire group of program partici-pants, including those who had zero earnings in one or both time periods.
10. Our analysis focuses on participants who were placed and !nished the program by June 2011, for whom we have four quarters of post-program employment and earnings information.
11. The OJT program is not included in the analysis of the experiences of program participants because it began too late to have information available on post-program outcomes.
12. Data on the subsidized workers’ hourly wages or earnings were not available at the time of Mobility’s request.
13. See Appendix A for a description of the employer sample selection methodology.
14. For all JobsNOW tiers, our analysis includes participants who had four quarters of post-program employment and earnings data available for the EF group and two quarters of post-program data for the post-EF group.
15. Low-income participants are those who quali!ed for the program because their income was up to 200 percent of the federal poverty line (FPL).
16. Information on age was missing from the data for a signi!cant portion of post-EF participants.
17. The JobsNOW program continued to operate after June 2011. Our analysis of post-EF program outcomes focuses on participants who exited the program by December 2011, because at least two quarters of post-program employment data are available for these participants.
18. Information on age is missing from the data for a signi!cant portion of the post-EF participants.
19. The post-EF program sample is too small to conduct the subgroup analysis.
20. See http://www.thedailydemocrat.com/index.php?option=com_content&task=view&id=3247&Itemid=2
21. See http://www.governorbarbour.com/news/2009/sep/15.9.09mississippisteps.html
22. This analysis focuses on participants in the STEPS program operated with EF money. Participants in STEPS II !nished the program too late for us to examine post-program employment and earnings outcomes.
23. See http://www.epi.org/press/news_from_epi_african_american_unemployment_rate_in_mississippi_signi!cant/.
24. Information about the length of the subsidized placements or total earnings from the subsidized jobs is not available in Florida.
25. See Appendix B for a complete breakdown of the characteristics of the Back to Work participants and nonparticipants.
95 Stimulating Opportunity: Endnotes

EndnotesReferences
Bloom, Dan. 2010. Transitional Jobs: Background, Program Models and Evaluation Evidence. New York: MDRC.
Burtless, Gary. 2012. Long-Term Unemployment: Anatomy of the Scourge. The Milken Institute Review. http://www.brookings.edu/research/articles/ 2012/07/longterm-unemployment-burtless (accessed May 22, 2013).
Farrell, Mary et al. 2011. Subsidizing Employment Opportunities for Low-Income Families: A Review of State Employment Programs Created Through the TANF Emergency Fund. New York: MDRC.
Ghayad, Rand. 2013. The Stigma Effects of Long-Term Unemployment: A Field Experiment on Labor Market Discrimination. Unpublished manuscript.
Jacobs, Erin. 2012. Returning to Work After Prison: Final Results from the Transitional Jobs Reentry Demonstration. New York: MDRC.
Medina, Jennifer. 2012. Long-Term Jobless Regroup to Fight the Odds. New York Times August 16. http://www.nytimes.com/2012/08/17/us/ unemployment-depths-seen-in-califor-nia- peer-group.html?pagewanted=all&_r=1&) (accessed May 22, 2013).
Pavetti, LaDonna et al. 2011. Creating Subsidized Employment Opportunities for Low-Income Parents: The Legacy of the TANF Emergency Fund. Washington, DC: Center on Budget and Policy Priorities.
Taylor, Paul et al. 2010. The Impact of Long-Term Unemployment: Lost Income, Lost Friends – and Loss of Self-Respect. Washington, DC: Pew Research Center.
96 Stimulating Opportunity: References

97 Stimulating Opportunity: Appendix
Appendix A: Methodology
Job Seeker DataWe obtained data about the job seekers who partici-pated in the subsidized employment programs from the state agencies that administered the programs. The agencies matched data collected by the programs on participants’ demographic characteristics and subsidized employment experiences to quarterly earn-ings data, as reported by employers to each state’s unemployment insurance system. The state quarterly earnings data covered a period from 2008 to the most recent available quarter, which in most cases was the second quarter of 2012. We limited the sample to par-ticipants who had exited the programs early enough to have at least a year of post-program quarterly earnings data available.
Data Cleaning and Creation of Analysis VariablesWe recoded the demographic and programmatic vari-ables provided by the sites so that each dataset con-formed as much as possible to the formats used by the other participating sites. This consistency enabled us to compare the variables and results across sites. We performed routine cleaning of the data, including the removal of outliers following common conventions, including ages less than 16 or more than 75 years, and hourly wages below the legal minimum wage or extremely high in relation to the wage distribution for the site. We used the variables provided by the sites to calculate the measures of interest as follows.
Using the state earnings data, we calculated total annual earnings pre- and post-program based on the four-quarter period immediately preceding pro-gram entry and the four-quarter period immediately following program departure. Program entry and program departure dates were based on the start and end dates of the subsidized positions provided by the study sites for each individual. One excep-tion was Florida, where the comparison group did
not have start and end dates, and end dates were not available for the program group. In this case, we used the four quarters of 2009 as the pre-pro-gram period and the four quarters of 2011 as the post-program period.
In Wisconsin, Los Angeles and San Francisco, some participants had more than one subsidized position. When participants had two positions that lasted more than a month with a gap of less than a year between them, we used the start date of the !rst position and the end date of the last posi-tion as the dates of program entry and departure. Participants with more than two subsidized posi-tions were excluded from the analysis.
We calculated whether participants were employed in each quarter pre- and post-program based on whether the participants had any earnings greater than zero reported for the quarter in the state earnings data.
We calculated whether a participant was among the long-term unemployed based on having no earnings reported in the two quarters immediately preceding program entry using the state earnings data.
We calculated the number of weeks in subsidized employment based on the start and end dates the programs provided for the subsidized positions. When participants had two subsidized positions, the number of weeks in subsidized employment included the time between the positions.
Subgroup AnalysisTo examine whether differences in outcomes for sub-groups of participants were statistically signi!cant, we relied on multivariate analysis, including the following:

98 Stimulating Opportunity: Appendix
One linear regression for each site, using the log of the earnings in the four quarters after program departure as the dependent variable.
Two logistic regressions for each site, with the dependent variables of employment in the !rst and fourth quarters following program departure.
For two sites, Mississippi and Wisconsin, a logistic regression with the dependent variable of reten-tion; that is, employment by the subsidy employer in the quarter immediately following program departure (after the subsidy period ended).
Our inferential models included the following indepen-dent variables, where available:
DemographicGenderRace/EthnicityAgeTotal earnings in the four quarters prior to entering the program (logged)Long-term unemployment status at the time of pro-gram entryEducation (Florida and Mississippi only)Duration of time on public assistance when joining the program (Los Angeles only)Felony conviction (Wisconsin only)Non-custodial parent (Wisconsin only)
Program-relatedDuration of time in the programHourly pay in the subsidized job or total earnings during the subsidy period (logged)Size of subsidized employer (Mississippi only)Target group—TANF recipient versus individual with children whose family income was less than 200 percent of the federal poverty line (San Francisco only)For-pro!t subsidized employer versus non-pro!t or public agency (Wisconsin only)Subsidized employer is agency operating the pro-gram (Wisconsin only)
For purposes of the regression analyses, we used the natural log of earnings and hourly wages, in order to normalize the distribution of these values, which were positively skewed. Since the natural log of zero is in!nity, we recoded those with zero earnings as one, resulting in a natural log of zero. For all of the models we used listwise exclusion of missing values, ensuring that at no point did we lose more than 10 percent of the cases for which we had earnings data. Missing cases were not replaced at any point during the analysis.
Employer SurveyAs noted in the introduction, we conducted a survey with employers who participated in the subsidized employment programs in Mississippi, Wisconsin, Los Angeles, and San Francisco. Eligible employers included those that had had at least one subsidized worker and were still in business when the survey took place between July and October 2012. Each employer in the sample represents a unique business. Where the agencies running the program employed some subsidized workers themselves, these agencies were excluded from the survey sample.
Sample SelectionWe generally targeted employers who had participated in the programs during the previous year, from July 2011 through June 2012, for whom we expected the sites would have more recent contact information, and where current employees would be more likely to have been involved with the program and to recall experi-ences with subsidized workers. Los Angeles County and San Francisco of!cials provided us with full lists of the participating employers from the previous year. In Wisconsin, due to the large number of employers that had participated in the past year, state of!cials pro-vided us with a random sample of employers across the 17 contractors running the program, oversampling from contractors that worked with a small number of employers. In Mississippi, state of!cials had local job center staff contact employers who participated during the previous two years (in STEPS 1 and 2) to inform

99 Stimulating Opportunity: Appendix
them of the study and give them the opportunity to opt out of it. The state then provided Mobility the contact information for employers who did not opt out. Given that the sample of employers in Mississippi included only those whom local job center staff were able to contact and that the employers were given the oppor-tunity to opt out, the reader should keep in mind that the Mississippi employer sample was more likely to favor employers who held positive views toward the program than in the sites that provided full lists or a random sample of all employers.
Survey AdministrationWe developed and tested the survey instrument in a pilot with 10 employers who had taken part in the Wisconsin program. During the pilot, respondents were encouraged to elaborate on their program experiences and make suggestions regarding the survey questions. Based on the results of the pilot, some items were added to the survey, some were removed, and questions were re!ned to improve clar-ity and accuracy. Mobility contracted with Research Support Services (RSS) to administer the survey. RSS hired and trained interviewers to conduct the survey by telephone between July and October 2012. The overall response rate among eligible employers was 79 percent. Figure A1 presents the sample disposition across the four sites.
Figure A1 Final Employer Survey Sample Disposition and Response Rate
MS SF LA WI All
Total employer sample received from sites
130 164 192 450 936
Ineligible-out of business 1 4 2 20 27
Ineligible-had no subsidized workers
1 23 22 35 81
Ineligible-is agency that ran the program
0 0 0 14 14
Ineligible-duplicate contact person 3 3 2 1 9
Total number of eligible employers 125 134 166 380 805
Total number of completed surveys 104 98 131 300 633
Response rate among eligible employers
83% 73% 79% 79% 79%
AnalysisThe employer survey statistics presented in this report for the four study sites combined represent the aver-age of the responses across the four sites so that each site is given equal weight, regardless of its sam-ple size. We cleaned the data to remove data entry errors and outliers. Importantly, we removed entries in which the reported number of subsidized workers was greater than 200. We report two statistics regarding the retention of subsidized workers:
The !rst is simply the percentage of employers who reported that they retained at least one subsi-dized worker after the subsidy period ended.
The second is the percentage of all subsidized workers who were retained when the subsidy period ended. We calculated this based on three questions in which we asked employers how many subsidized workers they had, how many were still in the subsidy period, if any, and how many work-ers they retained after the subsidy period ended. We divided the total number of workers that employers reported retaining after the subsidy period ended by the total number of workers who were no longer in the subsidy period. Workers who were still in the subsidy period were excluded from this calculation.
Weighting. Our analysis gives equal weight to each employer irrespective of the number of subsidized workers at each business. Another approach is to use weights based on the number of subsidized workers employers had so that those for whom greater pro-gram resources were devoted (in the form of subsidies and staff time) are given greater weight in reporting the results. In order to test the effects of weighting the sample in this way on the results, we divided the businesses into categories based on the number of subsidized workers they had and weighted each cat-egory by the group average. We performed a sensitiv-ity analysis, trying several variations of categorization by size. We then chose the one that was closest to

100 Stimulating Opportunity: Appendix
re"ecting the unaveraged weights while still refraining from using very high numbers at the top. The four !nal categories were:
1 subsidized worker (163 cases), mean: 12 to 9 subsidized workers (328 cases), mean: 3.810 to 29 subsidized workers (86 cases), mean: 15.130 to 200 subsidized workers (31 cases), mean: 63.8
As noted, employers who reported having more than the 200 subsidized workers were excluded from the analysis, due to concerns about the accuracy of the data and under the assumption that many random factors may affect the number of subsidized workers at the very high numbers, and the number of workers hired by the same businesses may be considerably lower at another time.
We re-ran our descriptive analyses with the weights in place. The weighting gave more in"uence to Mississippi and Los Angeles employers and to for-prof-its and government agencies. It affected the results in the following ways (compared to the results of the unweighted analysis):
The decision to take part in the program. Employer support increased for every category with the exception of “the opportunity for free or low-cost labor for a few months.” There was a notable increase in support for the category, “a positive experience you’ve had in the past with the agency operating the program.”Subsidized workers’ backgrounds. When asked to compare the subsidized workers to employees they normally hire for similar positions, the percentages who said the subsidized workers were less likely to be from a minority racial or ethnic group and who said the subsidized workers had more education decreased considerably.Hiring situation. In regard to their hiring situation when they started participating in the program, the percentage choosing one of the three categories indicating that new jobs were created decreased.
Retention. The percentage of employers retaining any workers increased, while the percentage of all subsidized workers retained decreased.Effect on business operations. The percentage reporting that the program had positive effects on business operations increased for each item in this series, and the percentage stating that they would participate in the program in the future, if offered, increased.

101 Stimulating Opportunity: Appendix
Appendix B: Florida Back to Work Comparison Group
As noted in the report, state of!cials in Florida pro-vided us with a comparison group of 16,204 individu-als who were deemed eligible for the Back to Work program but did not obtain a subsidized positions before the program ended. We examined demographic and pre-program employment data for this group and
found that they did not differ in signi!cant ways from the program participants when they applied for the pro-gram (see Figure B1). The one exception is that Back to Work participants were somewhat more likely to be White and less likely to be African American than the comparison group members.
Figure B1 Characteristics of the Florida Back to Work Participants and Comparison Group Members
Program Participants Comparison Group
Gender
Female 68.1% 70.5%
Male 31.9% 29.5%
Education
Less than High School Diploma 5.5% 5.6%
High School Diploma/GED 41.6% 39.3%
Some College 20.5% 20.4%
Associate’s Degree or Other Post-Secondary Certi!cate 17.4% 19.5%
Bachelor’s or Graduate Degree 15.0% 15.2%
Ethnicity
White 41.8% 31.4%
African-American 41.6% 50.4%
Other 2.2% 2.2%
Hispanic 5.5% 6.3%
Age
Under 30 38.3% 36.8%
30 to 39 32.8% 32.3%
40 to 49 21.7% 23.1%
50 and over 7.2% 7.8%
Long-term unemployed at program entry 50.9% 50.0%
