an evaluation of strategic responses to gain
TRANSCRIPT

AN EVALUATION OF STRATEGIC RESPONSES
TO GAIN COMPETITIVENESS IN CEMENT
INDUSTRY: A CASE OF SELECTED CEMENT
MANUFACTURING FIRMS IN KENYA
Amos Kipkoech Kibet, Thomas Koyier and Muturi Wachira

Journal of Strategic Management
ISSN 2520-0461(Online)
Vol.1, Issue 2 No.3, pp 46 - 67, 2017
47
AN EVALUATION OF STRATEGIC RESPONSES TO GAIN
COMPETITIVENESS IN CEMENT INDUSTRY: A CASE OF
SELECTED CEMENT MANUFACTURING FIRMS IN KENYA
1* Amos Kipkoech Kibet
1*Post graduate student, Daystar University
*Corresponding Author’s Email: [email protected]
2Thomas Koyier,
HOD, School of Business and Economics
3 Muturi Wachira
Dean, School of Business and Economics
Abstract
Purpose: The overall purpose of this study was to evaluate the strategic responses to gain
competitiveness in cement manufacturing industry.
Methodology: The study employed a descriptive research design. The population for this study
was all the employees in all the six firms currently operating in the industry. The target
population of the study was all the management staff of the three selected cement manufacturing
firms. Questionnaires were used as data collection instruments. Qualitative and quantitative
research analysis was used to analysis the data.
Results: The study findings indicated that there was high level of competition between the
cement manufacturing companies and hence the companies needed to put in place strategies to
counter the competition in order to gain competitive advantage amongst the firms. The study
results indicated that there were various strategic responses that were adopted by the cement
manufacturing companies in order to gain competitiveness. These strategies included innovation,
integration, outsourcing and diversification.
Unique contribution to theory, practice and policy: The study also recommends that the
management of the manufacturing firms should carry out a benchmarking activity against the
best players in the market as a way of improving their logistics outsourcing practices. This would
enable them to achieve undisputed performance of their supply chains
Key words: Outsourcing, performance, logistics, warehousing

Journal of Strategic Management
ISSN 2520-0461(Online)
Vol.1, Issue 2 No.3, pp 46 - 67, 2017
48
1.0INTRODUCTION
1.1 Background of the Study
Companies operating in Kenya's cement industry are inadvertently faced by a myriad of
challenges key among them increased competition exacerbated by new entrants, threat of imports
and increased capacities coupled with high production costs particularly on energy, imported
clinker and transport. Furthermore, Kenya's economic context is largely characterized by high
inflation, high interest rates and volatility in currency fluctuations (Barney, 1991).
According to Porter (1998), firms develop competitive strategies to survive and maintain a
competitive advantage in the market. In Kenya, cement companies have adopted various competitive
strategies in response to sectoral and economic pressures (Nyawira, 2010; & Otido, 2011). Bamburi
Cement Limited too has a formal strategy development process that is influenced by external and
internal situations (Mwanzia, 2009).
Porter (2008) identifies five forces that bring competition as fierce rivalry, threat to entry, threat
to substitutes, power of suppliers and power of buyers; and maintains that understanding the
forces that shape industry competition is the starting point for developing strategy. Porter argues
that if the forces are intense, no company earns attractive returns on investment and if the forces
are benign, many companies are profitable. The configuration of the five forces differs by
industry and that a company needs a separate strategy for each distinct industry.
Porter (1980) proposes three different generic strategies: cost leadership, differentiation and
focus as the approaches to deal with the five competitive forces and outperform other firms in the
industry. The study of Dess and Davis (1984) maintain that firms that pursued one of the pure
strategies of low cost, differentiation, or focus perform better than those who were stuck in the
middle. The study is consistent with Porter’s assertion that a commitment to at least one of the
generic strategies will create a defensible position for a firm.
By having a strategy, a firm can efficiently manage costs of operations, effectively execute
projects and subsequently have superior market and economic intelligence as well as achieving
competitive advantage. Barney (1991) suggests that firms obtain sustained competitive
advantages by implementing competitive strategies that exploit their internal strengths, through
responding to environmental opportunities, while neutralizing external threats and avoiding
internal weaknesses.
Businesses become successful because they possess some advantage relative to their competitors.
The two most prominent sources of competitive advantage can be found in the business cost
structure and its ability to differentiate the business from competitors (Raduan, Jegak, Haslinda
& orientations that enable a firm to sustain performance, especially in the presence of rapid
changes in market conditions (Kumar, 2011).During the last few years, the manufacturing
industry has undergone a series of changes through financial reforms, advancement of
communication and information technologies, globalization of financial services and economic
development. Those changes have had a considerable effect on efficiency, productivity change,
market structure and performance in the industry (Epetimehin, 2011).
Kim and Mcintoch (2002) assert that rapid technological change, easier entry by foreign
competitors, and the accelerating breakdown of traditional industry boundaries subject firms to
new, unpredictable competitive forces. Contemporary firms, operating in dynamic market
contexts, often deal with these contingencies by implementing strategies that permit quick
Journal of Strategic Management
ISSN 2520-0461(Online)
Vol.1, Issue 2 No.3, pp 46 - 67, 2017
49
reconfiguration and redeployment of assets to deal with environmental change. Manimala (2011)
asserted that strategic responses to environmental changes were mainly around improving quality
and productivity, reducing costs, restructuring and culture-building, rather than finding
partnerships and assistance from across the newly opened boundaries. The findings suggest that
competition does have an impact on self-improvements and that the primary impetus for strategy
making is from one’s own internal strengths than from the environment.
1.2 Statement of the Problem
On average, the cement manufacturing firms are running at about 72.5 % capacity utilization and
the industries profitability is expected to dip with average profits of below 10% compared with
15% in the past years. The pressures of costs in production due to currency depreciation and
energy costs coupled with stiff competition from local, regional and international players has
posed serious challenges to the cement industry (Juma, 2010)
In the cement sector report (http://www.sib.co.ke, 2013), the two leading firms, Bamburi
cement and EAPCC have both had their market shares reduce gradually and is projected to
maintain that level up to 2015 considering that they have been enjoying significant market share
a few years back despite their strong shareholding by Lafarge for Bamburi and Kenya
government for EAPCC (http://www.eastafricanportland.com, 2013).
In 2010, Kenya had an annual capacity of 5.1 million tons of cement and yet produced 3.7
million tons during the period translating to capacity utilization of 72.5% compared to global
capacity utilization of 80% in the same year (Joachim, 2010).The East African region has a
clinker capacity shortfall due to insufficiency of cement grade limestone deposits which will
necessitate offshore sourcing of clinker to supplement the domestic production (Cement Sector
Report, 2013)
From the foregoing discussion, there was need to understand the strategic responses adopted by
the industry players and asses the level of competition, strategic responses adopted and the
challenges that the industry has faced.
1.3 Objectives of the Study
The study was guided by the following objectives;-
1. To assess the level of competition in the cement manufacturing industry.
2. To evaluate the strategic responses adopted by the cement manufacturing firms to out-do
competition and attain sustainable competitive advantage in the industry.
3. To investigate the challenges faced in the strategic responses to gain competitiveness.
2.0LITERATURE REVIEW
2.1Theoretical Framework
2.1.1Resource Based View Theory
Resource Based-View (RBV) was developed by Penrose (1959) who suggested that a company
should be considered as a collection of physical and human resources bound together in an
organizational structure. Furthermore, Hafeez et al. (2007) classified resources as physical assets
and intellectual assets. Physical assets (i.e. plant and equipment) are easily distinguishable due to

Journal of Strategic Management
ISSN 2520-0461(Online)
Vol.1, Issue 2 No.3, pp 46 - 67, 2017
50
their tangible existence (Hafeez et al., 2007). Intellectual capital is relevant to the intangible
aspect of human resource such as employee skill, knowledge and individual competencies
(Hafeez et al., 2007). Overall, the RBV addresses two key points (Gottschalk & Solli-Sæther,
2005). First, the RBV indicates a resource should provide economic value and must be currently
scarce, difficult to imitate or copy, non-substitutable, and not readily accessible in factor markets
to create competitive advantage (McIvor, 2009). Second, resources determine firm performance
(Gottschalk & Solli-Sæther, 2005; McIvor, 2009).
Newbert (2007) categorized theoretical approaches into four types: resource heterogeneity,
organizing approach, conceptual-level, and dynamic capabilities. The resource heterogeneity
approach argues that a specific resource, capability, or core competence controlled by a firm,
affects its competitive advantage or performance. The organizing approach tends to indicate
firm-level conditions in which the effective exploitation of resources and capabilities is
implemented. Scholars utilizing the conceptual-level approach try to investigate if the attributes
of a resource identified by Barney (1991) such as value, rareness, and inimitability, can
effectively explain performance. The dynamic capabilities approach emphasizes specific
resource-level processes influencing on competitive advantage or performance, in which a
specific resource interacts with a specific dynamic capability as an independent variable
2.2 Empirical Literature Review
Diversification is one of the corporate strategies employed by firms to gain competitive
advantage. Researchers have come up with competing arguments to explain whether a related or
unrelated diversification strategy is linked to above average firm performance (Palich, Cardinal,
& Miller, 2000). According to resource based view of diversification, firms can exploit synergies
arising from resource relatedness (Chatterjee, 1986). Firms are considered to be diversified if
they are participating in more than one business. The big single business concentration is putting
all firms’ eggs in one industry basket. Firms that are strongly positioned in slow- growth industry
should use their excess liquidity to diversify. They should diversify into business which can
leverage their existing core competences.
Teece (1980) explains that multi-product firms can capture economies of scale better when the
production of two or more products depends upon the same proprietary know-how base and
when specialized indivisible asset is a common input into the production of two or more
products. Bettis, Richard & William (1981) say that strategists have to base their diversifications
decisions on the future expectations of the firm. Corporate strategists can make assessments of
whether a particular diversification move is capable of increasing shareholder value. A firm that
is interested in venturing into any form of diversification could pursue strategies of: entering new
market, related diversification, unrelated diversification, divestiture and liquidation, corporate
turnaround, retrenchment and restructuring. A firm that exploits activity-cost chain
interrelationships can capture the benefits of strategic fit to achieve performance level that is
greater than what can be earned pursuing independent strategies.
Firms seek to increase their competitive position in the market place by relying on outside
service providers for activities which they view as supplementary to their core business (Bailey
& Farrell, 2004). It is generally agreed that if outsourcing is implemented as planned, then it will
lead to lower cost operations, increased capacity and productivity and sometimes may lead to

Journal of Strategic Management
ISSN 2520-0461(Online)
Vol.1, Issue 2 No.3, pp 46 - 67, 2017
51
downsizing. Most multinational companies in the cement manufacturing industry outsource their
manufacturing activities to developing countries to take advantage of cheap labor and lower
taxation regimes existing in these countries. Outsourcing also enables a firm to concentrate on its
core competencies and hence increase productivity.
Outsourcing is carried out so that firms attain performance targets in the business using
capabilities of more capable suppliers. Today many firms have failed to develop outsourcing
strategies for their processes that allow them to compete effectively in the global economy
(Gottfredson, Puyear, & Philips, 2005). The guidelines and prescriptions on the outsourcing
decisions in the manufacturing context is the classic make-or- buy decisions (Culliton, 1956).
Effective outsourcing for an organization involves concentrating on a set of core competencies
where it can achieve pre-eminence and outsourcing other processes which are neither critical nor
profitable to the firm and retain those the firm has a distinctive capability (Quinn, 1999).
Innovation is a very important source of scale and scope of economies. According to
Schumpeter(1934) innovation gives firms temporary monopolies because they have no
competitors on the same play field until a firm duplicates the innovation or the products/service.
Research and Development (R&D) is part and parcel of innovation which enables the first
industry players to spread the fixed costs of R & D over many customers. This gives industry
pioneers a competitive edge over new entrants although the latter is likely to incur fewer costs in
its R & D because they generally put less effort to legitimize its innovation in the market.
Another innovative approach is product innovation which is different from new product because
the latter has different technology which brings out higher benefits than existing products (Tellis,
1998). Competitors are less likely to respond to the introduction of new products by large firms
than by small firms due to the fear of retaliatory behavior (Bowman, Douglas, & Hubert, 1995).
Empirical evidence suggest that responses to competitive actions tend to be reciprocal i.e.
product responses for product action and price responses for price actions (Bowman, Douglas, &
Hubert, 1995).
Firms in protected industries will lack incentives to innovate (Martin, 1998) and (Kambhampti,
1996). Most of these firms concentrate on domestic markets which are more profitable. They are
protected from international competitive exposure and therefore further erode their incentives to
innovate and become competitive internationally. Intensive competition from both local and
international arena makes firms to be innovative and efficient in their business processes.
According to Chadha (2004) free competition enhances industrial performance, efficiency and
productivity because open competitive markets demands optimal allocation of resources and
capital investments for the realization and maximization of profits, outputs, welfare and
minimization of costs. Competition compels firms to explore new ways to increase their
efficiency by extending their reach to new markets at an early stage by shifting certain
production activities to reduce costs (Ricupero, 2004).
Vertical integration is adopted by firms in order to position itself in the industry with respect to
scope, cost and product differentiation. According to Porter (1985) firms have to consider four
types of competitive scope namely, segment scope, vertical scope, geographical scope and
industry scope. The linkages between the supplier’s value chain and a firm’s value chain
enhances a firm’s competitiveness.

Journal of Strategic Management
ISSN 2520-0461(Online)
Vol.1, Issue 2 No.3, pp 46 - 67, 2017
52
Vertical integration is divided into two parts: Backward vertical integration and forward vertical
integration (Fronmueller & Reed, 1996). Firms can reduce its cost through backward vertical
integration because they can access correct information regarding supply conditions and prices.
This has enabled firms to have efficient production schedules and avoid rents on its supplies.
Forward vertical integration on the other hand can provide product differentiation advantages
that are difficult to imitate (Harrigan, 1985). This differentiation in turn reduces opportunity cost
and cost incurred due to advertising. Therefore vertical integration is the combination of
technologically distinct production processes, distribution and logistics, sales and other economic
activities within a single firm (Porter , 1987).
3.0 RESEARCH METHODOLOGY
The study employed a descriptive research design. The population for this study was all the
employees in all the six firms currently operating in the industry. The target population of the
study was all the management staff of the three selected cement manufacturing firms.
Questionnaires were used as data collection instruments. Qualitative and quantitative research
analysis was used to analysis the data.
4.0 DATA PRESENTATION, ANALYSIS AND INTERPRETATION
4.1 General Information
4.1.1Position in the Firm
The respondents were asked to indicate their positions in the company. The study findings
indicated that 17% (9) of the respondents were in top management, while 21% (11) were in
middle management and 62% (33) were in lower management. The findings imply that the
respondents were aware of the strategic responses the firms are using to gain competitive
advantage hence accurate responses.
Figure 4.1: Position in the Firm
4.1.2 Department of the Respondents
The respondents were asked to indicate the departments they worked for in the company. Table
4.21 indicates that 28.3% (15) of the respondents were from the production department, 13.2%
Top Management;
9; 17%
Middle Management;
11; 21%
Lower Management;
33; 62%

Journal of Strategic Management
ISSN 2520-0461(Online)
Vol.1, Issue 2 No.3, pp 46 - 67, 2017
53
(7) from HR administration 11.3% (6) from supply chain, 7.5% (4) from information technology
department and 5.7% (3) from finance and audit departments. The results imply that the
respondents were well spread in all departments hence the responses were not biased to one
organizational department.
Table 4.1: Department of the Respondents
Department Frequency Percent
Administration 1 1.9
Audit 3 5.7
Finance 3 5.7
HR-Admin 7 13.2
ICT 4 7.5
Legal 1 1.9
Maintenance 1 1.9
Operations 1 1.9
Procurement 3 5.7
Production 15 28.3
Research & development 3 5.7
Safety, Health & Environment 3 5.7
Strategy 2 3.8
Supply chain 6 11.3
Total 53 100
4.1.3 Years of Service in the Organization
The study findings indicate that majority of the respondents, 58% (31) had worked in the
organization for more than 5 years while 30% (16) of the respondents had been in the
organization for 3-5 years, 6% (3) of the respondents indicated that they had worked for 1-2
years another 6% (3) had worked in the organization for less than 1 year. Results are presented in
Figure 4.2.
less than one year; 3; 6%
1 to 2 year; 3; 6%
3 to 5 years; 16; 30% More than 5
years; 31; 58%
Journal of Strategic Management
ISSN 2520-0461(Online)
Vol.1, Issue 2 No.3, pp 46 - 67, 2017
54
Figure 4.2: Years of Service
4.1.4 Assessment of Competitiveness
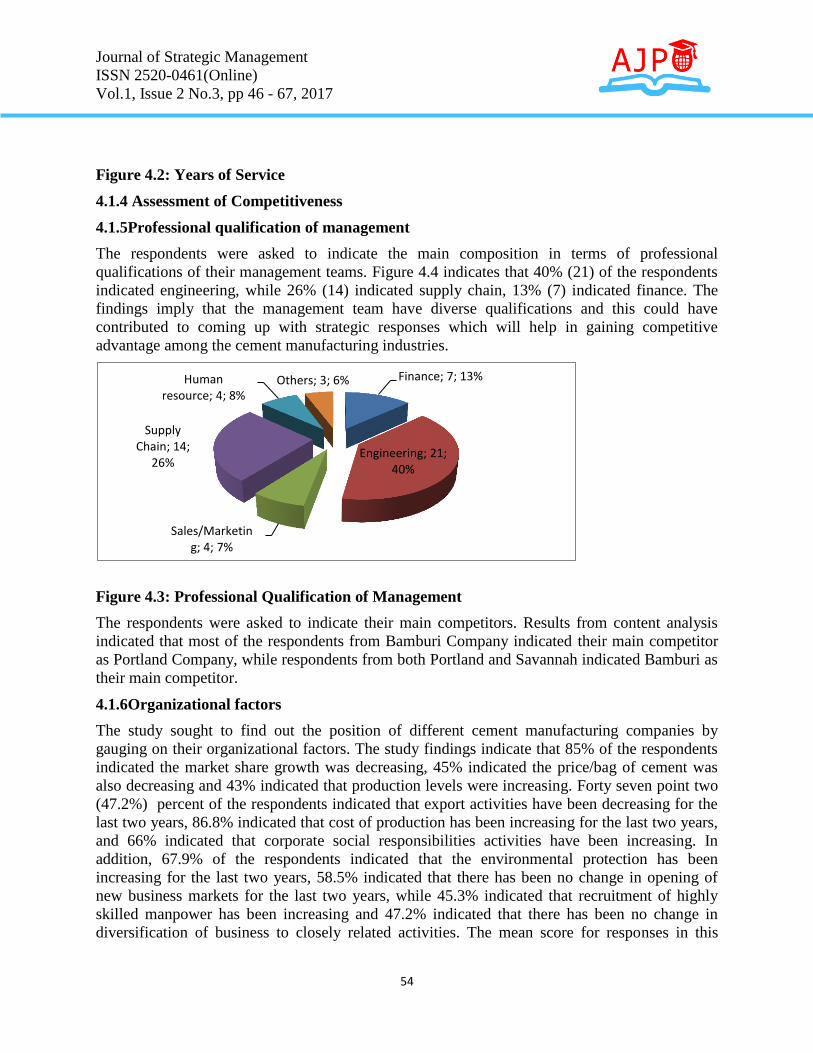
4.1.5Professional qualification of management
The respondents were asked to indicate the main composition in terms of professional
qualifications of their management teams. Figure 4.4 indicates that 40% (21) of the respondents
indicated engineering, while 26% (14) indicated supply chain, 13% (7) indicated finance. The
findings imply that the management team have diverse qualifications and this could have
contributed to coming up with strategic responses which will help in gaining competitive
advantage among the cement manufacturing industries.
Figure 4.3: Professional Qualification of Management
The respondents were asked to indicate their main competitors. Results from content analysis
indicated that most of the respondents from Bamburi Company indicated their main competitor
as Portland Company, while respondents from both Portland and Savannah indicated Bamburi as
their main competitor.
4.1.6Organizational factors
The study sought to find out the position of different cement manufacturing companies by
gauging on their organizational factors. The study findings indicate that 85% of the respondents
indicated the market share growth was decreasing, 45% indicated the price/bag of cement was
also decreasing and 43% indicated that production levels were increasing. Forty seven point two
(47.2%) percent of the respondents indicated that export activities have been decreasing for the
last two years, 86.8% indicated that cost of production has been increasing for the last two years,
and 66% indicated that corporate social responsibilities activities have been increasing. In
addition, 67.9% of the respondents indicated that the environmental protection has been
increasing for the last two years, 58.5% indicated that there has been no change in opening of
new business markets for the last two years, while 45.3% indicated that recruitment of highly
skilled manpower has been increasing and 47.2% indicated that there has been no change in
diversification of business to closely related activities. The mean score for responses in this
Finance; 7; 13%
Engineering; 21; 40%
Sales/Marketing; 4; 7%
Supply Chain; 14;
26%
Human resource; 4; 8%
Others; 3; 6%

Journal of Strategic Management
ISSN 2520-0461(Online)
Vol.1, Issue 2 No.3, pp 46 - 67, 2017
55
section was 2.17 which indicate that the competitive advantage has been decreasing which can
be explained by the increased levels of competition from other manufacturing companies.
Table 4.3: Organizational Factors
Statement
No
change
Decreasi
ng
Increasi
ng
Likert
Mean
Market share growth 7.5% 84.9% 7.5% 2
Price/bag of cement 15.1% 45.3% 39.6% 2.25
Production level 41.5% 15.1% 43.4% 2.02
Export activities 32.1% 47.2% 20.8% 1.89
Cost of production 9.4% 3.8% 86.8% 2.77
Corporate social responsibilities activities 28.3% 5.7% 66.0% 2.38
Environmental protection 17.0% 15.1% 67.9% 2.51
Opening of new business markets 58.5% 7.5% 34.0% 1.75
Recruitment of highly skilled manpower 28.3% 26.4% 45.3% 2.17
Diversification of business to closely related
activities 47.2% 11.3% 41.5% 1.94
Average 28.5% 26.2% 45.3% 2.17
Table 4.4 presents the position of different cement manufacturing companies by gauging on their
organizational factors. Descriptive results indicates that Savannah had the largest market share
growth by attracting a mean of 3.0 followed by Bamburi cement and Portland came third with a
mean of 2.31. However all the other factors Bamburi was in the lead followed by Portland and
Savannah. The findings imply that Bamburi was well established in the market in terms of
prices, production level, export activities, cost of production, corporate social responsibilities and
environmental protection since it was the first to be started in Kenya.
Table 4.4: Organizational Factors per Company
Organizational factors N Mean Std. Deviation Std.
Error
Market share growth Portland 32 2.310 0.693 0.122
Bamburi 16 2.690 0.479 0.120
Savannah 5 3.000 0.000 0.000
Total 53 2.490 0.639 0.088
Price/bag of cement Portland 32 2.470 0.621 0.110
Bamburi 16 3.000 0.000 0.000
Savannah 5 1.400 0.894 0.400
Total 53 2.530 0.696 0.096
Production level Portland 32 1.880 0.907 0.160
Bamburi 16 2.630 0.806 0.202
Savannah 5 1.400 0.548 0.245
Total 53 2.060 0.929 0.128
Journal of Strategic Management
ISSN 2520-0461(Online)
Vol.1, Issue 2 No.3, pp 46 - 67, 2017
56
Export activities Portland 32 1.970 0.782 0.138
Bamburi 16 2.630 0.619 0.155
Savannah 5 1.600 0.894 0.400
Total 53 2.130 0.810 0.111
Cost of production Portland 32 2.560 0.801 0.142
Bamburi 16 2.810 0.544 0.136
Savannah 5 2.400 0.894 0.400
Total 53 2.620 0.740 0.102
Corporate social
responsibilities activities Portland 32 2.280 0.924 0.163
Bamburi 16 2.380 0.957 0.239
Savannah 5 1.800 1.095 0.490
Total 53 2.260 0.944 0.130
Environmental protection Portland 32 2.440 0.759 0.134
Bamburi 16 3.000 0.000 0.000
Savannah 5 1.400 0.894 0.400
Total 53 2.510 0.775 0.106
Opening of new business
markets Portland 32 1.310 0.644 0.114
Bamburi 16 2.880 0.500 0.125
Savannah 5 1.200 0.447 0.200
Total 53 1.770 0.933 0.128
Recruitment of highly skilled
manpower Portland 32 2.280 0.772 0.136
Bamburi 16 2.310 0.873 0.218
Savannah 5 1.200 0.447 0.200
Total 53 2.190 0.833 0.114
Diversification of business to
closely related activities Portland 32 1.660 0.902 0.159
Bamburi 16 2.750 0.577 0.144
Savannah 5 1.200 0.447 0.200
Total 53 1.940 0.949 0.130
4.1.7Level of Competition
The study sought to find out the nature and level of competition in the cement sector. Table 4.5
shows that majority (88.6%) (47) of the respondents agreed that there was existence of cutthroat
competition in the cement industry, 66.1% (35) agreed that it is possible for a factory to close
down due to competitor aggression in the market and 81.1% (43) agreed that pricing was a key
determinant of competition in the cement sector. Eighty eight point seven (88.7%) (47) percent
of the respondents agreed that cement customers can easily swing their preferences to a
competitor due to a marginal change in price, 90.5% (48) agreed that factories are continuously
investing in modern processing technology in order to outdo their competitors in cost leadership
and 54.7% (29) agreed that employee poaching was a prevalent practice in the cement sector.
Journal of Strategic Management
ISSN 2520-0461(Online)
Vol.1, Issue 2 No.3, pp 46 - 67, 2017
57
The mean score for responses in this section was 4.0 which indicate that majority of the
respondents agreed that there has been an increase in the level of competition.
Table 4.5: Level of Competition
Statement
Strongly
disagree Disagree
Neutra
l Agree
Strongly
Agree Mean
There is existence of cutthroat
competition in the cement
industry
3.8% 3.8% 3.8% 37.7% 50.9% 4.28
It is possible for a factory to
close down due to competitor
aggression in the market
9.4% 7.5% 17.0% 47.2% 18.9% 3.58
Pricing is a key determinant of
competition in the cement
sector
0.0% 13.2% 5.7% 37.7% 43.4% 4.11
Cement customers can easily
swing their preferences to a
competitor due to a marginal
change in price
1.9% 3.8% 5.7% 41.5% 47.2% 4.28
Factories are continuously
investing in modern
processing technology in order
to outdo their competitors in
cost leadership
1.9% 1.9% 5.7% 54.7% 35.8% 4.21
Employee poaching is a
prevalent practice in the
cement sector
1.9% 13.2% 30.2% 39.6% 15.1% 3.53
Average 3.2% 7.2% 11.4% 43.1% 35.2% 4.00
Table 4.6 indicates that Bamburi Cement Company had a high level of competition with a mean
of 2.7 followed by Portland Company with a mean of 2.09 and Savannah Company was last in
facing competition.
Table 4.6: Level of Competition per Company
N Mean
Std.
Deviation
Std.
Error
Minimu
m
Maximu
m
Competiti
veness Portland 32 2.0906 0.2205 0.03898 1.7 2.4
Bamburi 16 2.7 0.1633 0.04082 2.5 3
Savannah 5 2.18 0.43818 0.19596 1.7 2.5
Total 53 2.283 0.35881 0.04929 1.7 3

Journal of Strategic Management
ISSN 2520-0461(Online)
Vol.1, Issue 2 No.3, pp 46 - 67, 2017
58
4.2Evaluation of strategic responses to attain sustainable competitive advantage
4.3 Innovation and competitiveness
The respondents were asked to indicate the effects of innovation on competitiveness of cement
manufacturing companies. The study findings on Table 4.5 indicate that majority (62.3%) (33)
agreed that innovation has successfully improved their products life cycle, 45.3% (24) agreed
that new products/brands have successfully been introduced in the market through innovation,
another 45.3% (24) agreed that innovation has addressed their customer taste in the market and
49% (26) agreed that due to innovativeness, their company products are certified as
environmental friendly. The mean score of the responses for this section was 3.26 which show
that there was more agreement than disagreement with the statements in the questionnaire.
Table 4.7: Innovation and competitiveness
Statement
Totally
disagree
Disagre
e
Undec
ided Agree
Totally
agree Mean
Innovation has successfully
improved our products life cycle. 1.9% 20.8% 15.1% 45.3% 17.0% 3.55
New products/brands have
successfully been introduced in
the market through innovation.
7.5% 35.8% 11.3% 26.4% 18.9% 3.13
Innovation has addressed our
customer taste in the market. 5.7% 35.8% 13.2% 32.1% 13.2% 3.11
Due to innovativeness, our
company products are certified as
environmental friendly.
1.9% 28.3% 20.8% 39.6% 9.4% 3.26
Average 4.3% 30.2% 15.1% 35.9% 14.6% 3.26
Table 4.8 indicates that Bamburi Cement Company had a high level of innovation with a mean
of 3.55 followed by Portland Company with a mean of 3.31 and Savannah Company was last in
innovativeness with a mean of 2.05.
Table 4.8: Innovation and competitiveness per Company
N Mean
Std.
Deviation
Std.
Error Minimum Maximum
Innovatio
n Portland 32 3.3125 1.06066 0.1875 2 5
Bamburi 16 3.5469 0.38964 0.09741 3 4
Savannah 5 2.05 0.9083 0.4062 1 3
Total 53 3.2642 0.97248 0.13358 1 5
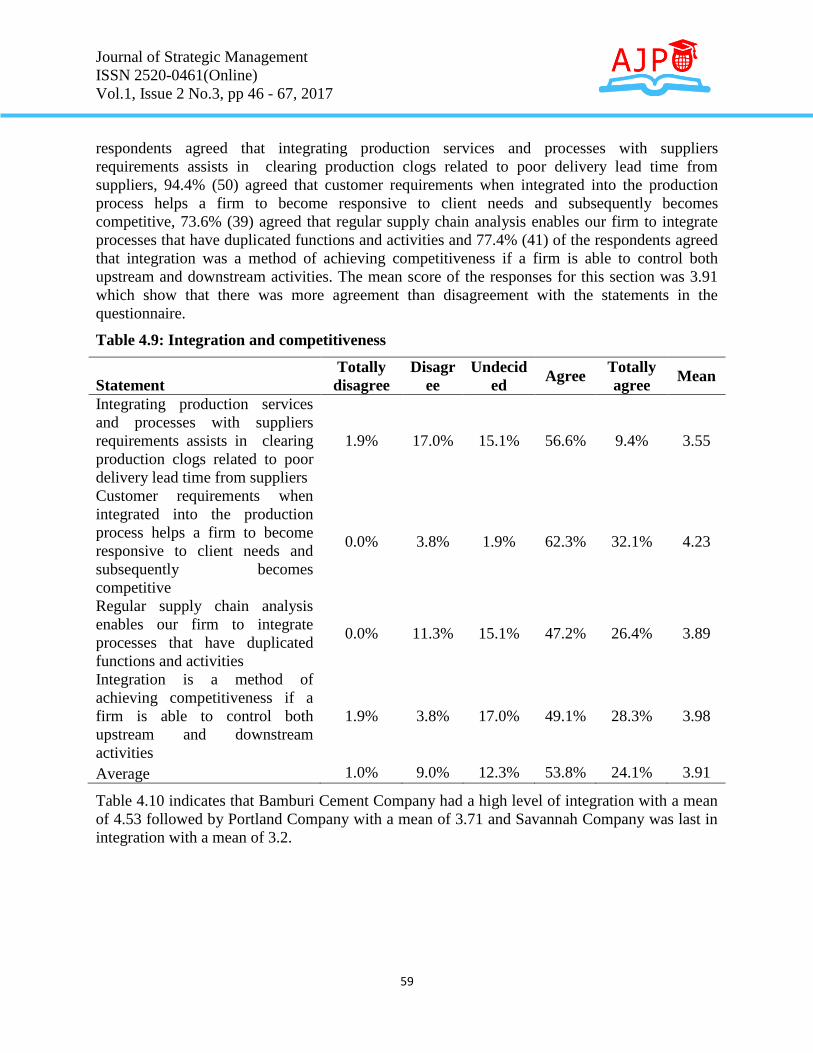
4.4 Integration and competitiveness
The respondents were asked to indicate the effect of integration on competitiveness of cement
manufacturing companies. The study findings on Table 4.6 indicates that 66% (35) of the
Journal of Strategic Management
ISSN 2520-0461(Online)
Vol.1, Issue 2 No.3, pp 46 - 67, 2017
59
respondents agreed that integrating production services and processes with suppliers
requirements assists in clearing production clogs related to poor delivery lead time from
suppliers, 94.4% (50) agreed that customer requirements when integrated into the production
process helps a firm to become responsive to client needs and subsequently becomes
competitive, 73.6% (39) agreed that regular supply chain analysis enables our firm to integrate
processes that have duplicated functions and activities and 77.4% (41) of the respondents agreed
that integration was a method of achieving competitiveness if a firm is able to control both
upstream and downstream activities. The mean score of the responses for this section was 3.91
which show that there was more agreement than disagreement with the statements in the
questionnaire.
Table 4.9: Integration and competitiveness
Statement
Totally
disagree
Disagr
ee
Undecid
ed Agree
Totally
agree Mean
Integrating production services
and processes with suppliers
requirements assists in clearing
production clogs related to poor
delivery lead time from suppliers
1.9% 17.0% 15.1% 56.6% 9.4% 3.55
Customer requirements when
integrated into the production
process helps a firm to become
responsive to client needs and
subsequently becomes
competitive
0.0% 3.8% 1.9% 62.3% 32.1% 4.23
Regular supply chain analysis
enables our firm to integrate
processes that have duplicated
functions and activities
0.0% 11.3% 15.1% 47.2% 26.4% 3.89
Integration is a method of
achieving competitiveness if a
firm is able to control both
upstream and downstream
activities
1.9% 3.8% 17.0% 49.1% 28.3% 3.98
Average 1.0% 9.0% 12.3% 53.8% 24.1% 3.91
Table 4.10 indicates that Bamburi Cement Company had a high level of integration with a mean
of 4.53 followed by Portland Company with a mean of 3.71 and Savannah Company was last in
integration with a mean of 3.2.

Journal of Strategic Management
ISSN 2520-0461(Online)
Vol.1, Issue 2 No.3, pp 46 - 67, 2017
60
Table 4.10: Integration and competitiveness per company
N Mean
Std.
Deviation
Std.
Error Minimum Maximum
Integratio
n Portland 32 3.7109 0.33062 0.05845 3 4
Bamburi 16 4.5313 0.25617 0.06404 4.25 5
Savannah 5 3.2 0.95851 0.42866 2.5 4.25
Total 53 3.9104 0.58854 0.08084 2.5 5
Outsourcing and Competitiveness
The respondents were asked to indicate the effect of outsourcing on competitiveness of cement
manufacturing companies. Table 4.7 indicates that majority (66%) (35) of the respondents
disagreed that outsourcing has reduced staffing and administrative costs related to their company
expenditures, 58.5% (31) disagreed that outsourcing some of the company services has improved
their attainment of production level/target and 56.6% (30) disagreed that outsourcing has enabled
their company access unlimited expert advice. The mean score of the responses for this section
was 2.44 which show that there was more disagreement than agreement with the statements in
the questionnaire.
Table 4.11: Outsourcing and competitiveness
Statement
Totally
disagree
Disagr
ee
Undecid
ed Agree
Totally
agree Mean
Outsourcing has reduced
staffing and administrative costs
related to our company
expenditures.
30.2% 35.8% 20.8% 5.7% 7.5% 2.25
Outsourcing some of our
company services has improved
our attainment of production
level/target.
18.9% 39.6% 15.1% 24.5% 1.9% 2.51
Outsourcing has enabled our
company access unlimited
expert advice.
18.9% 37.7% 18.9% 18.9% 5.7% 2.55
Average 22.7% 37.7% 18.3% 16.4% 5.0% 2.44
Table 4.12 indicates that Bamburi Cement Company had a high level of outsourcing its activities
with a mean of 2.79 followed by Portland Company with a mean of 2.41 and Savannah Company
was last in outsourcing with a mean of 1.4.
Table 4.12: Outsourcing and competitiveness per company
N Mean
Std.
Deviation
Std.
Error Minimum Maximum
Outsourcin
g Portland 32 2.4169 0.45622 0.08065 2 3
Journal of Strategic Management
ISSN 2520-0461(Online)
Vol.1, Issue 2 No.3, pp 46 - 67, 2017
61
Bamburi 16 2.7919 1.50526 0.37631 1 5
Savannah 5 1.4 0.43526 0.19465 1 2
Total 53 2.4342 0.96677 0.1328 1 5
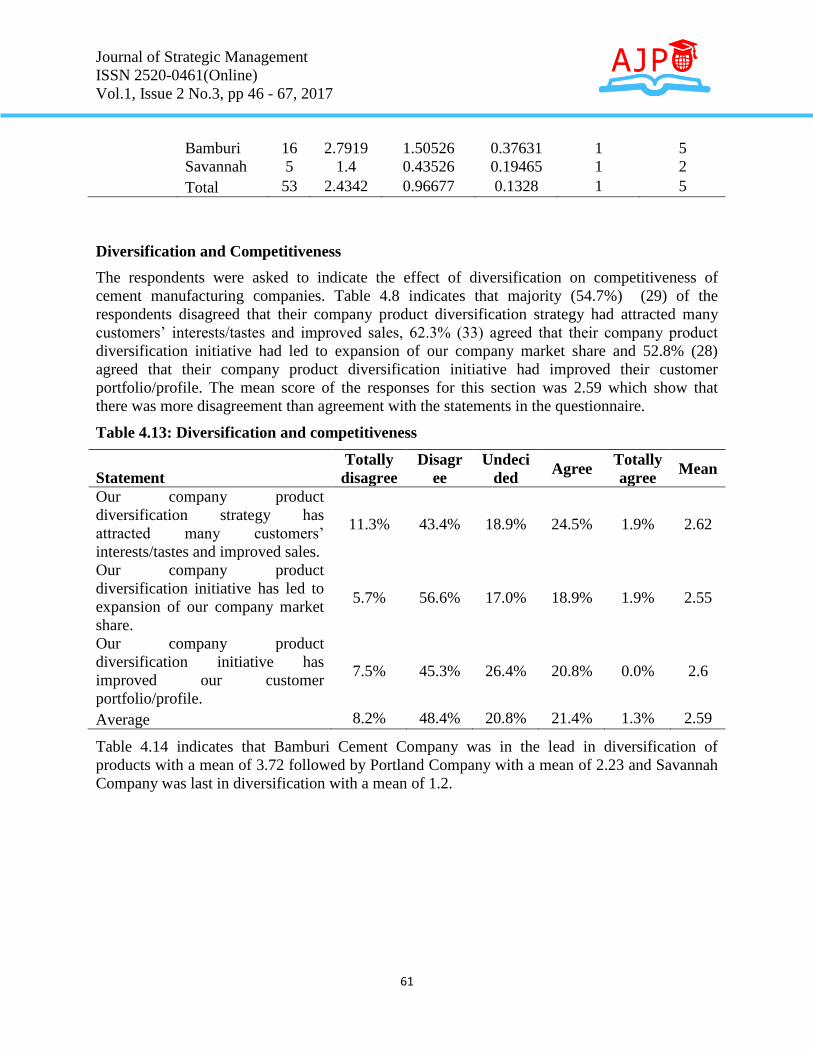
Diversification and Competitiveness
The respondents were asked to indicate the effect of diversification on competitiveness of
cement manufacturing companies. Table 4.8 indicates that majority (54.7%) (29) of the
respondents disagreed that their company product diversification strategy had attracted many
customers’ interests/tastes and improved sales, 62.3% (33) agreed that their company product
diversification initiative had led to expansion of our company market share and 52.8% (28)
agreed that their company product diversification initiative had improved their customer
portfolio/profile. The mean score of the responses for this section was 2.59 which show that
there was more disagreement than agreement with the statements in the questionnaire.
Table 4.13: Diversification and competitiveness
Statement
Totally
disagree
Disagr
ee
Undeci
ded Agree
Totally
agree Mean
Our company product
diversification strategy has
attracted many customers’
interests/tastes and improved sales.
11.3% 43.4% 18.9% 24.5% 1.9% 2.62
Our company product
diversification initiative has led to
expansion of our company market
share.
5.7% 56.6% 17.0% 18.9% 1.9% 2.55
Our company product
diversification initiative has
improved our customer
portfolio/profile.
7.5% 45.3% 26.4% 20.8% 0.0% 2.6
Average 8.2% 48.4% 20.8% 21.4% 1.3% 2.59
Table 4.14 indicates that Bamburi Cement Company was in the lead in diversification of
products with a mean of 3.72 followed by Portland Company with a mean of 2.23 and Savannah
Company was last in diversification with a mean of 1.2.
Journal of Strategic Management
ISSN 2520-0461(Online)
Vol.1, Issue 2 No.3, pp 46 - 67, 2017
62
Table 4.14: Diversification and competitiveness per company
N Mean
Std.
Deviation
Std.
Error
Minimu
m
Maximu
m
Diversificati
on Portland 32 2.2397 0.38107 0.06736 1.67 3
Bamburi 16 3.7281 0.44269 0.11067 3 4.33
Savannah 5 1.2 0.29908 0.13375 1 1.67
Total 53 2.5909 0.89991 0.12361 1 4.33
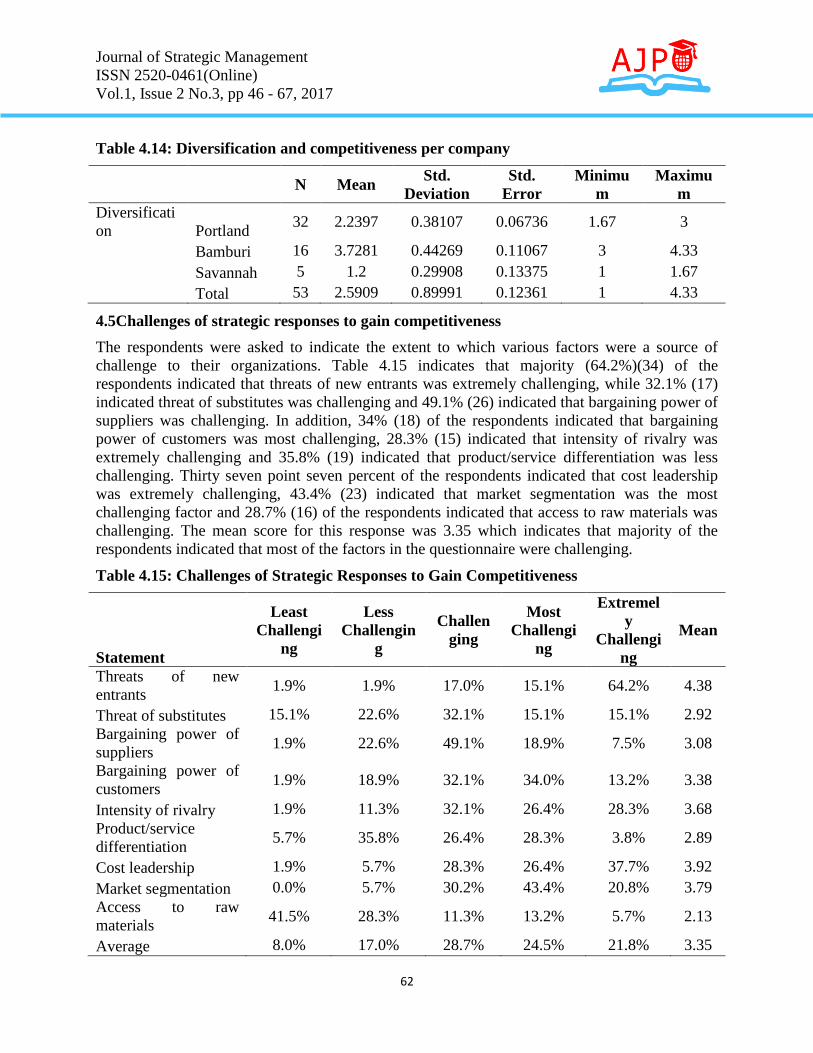
4.5Challenges of strategic responses to gain competitiveness
The respondents were asked to indicate the extent to which various factors were a source of
challenge to their organizations. Table 4.15 indicates that majority (64.2%)(34) of the
respondents indicated that threats of new entrants was extremely challenging, while 32.1% (17)
indicated threat of substitutes was challenging and 49.1% (26) indicated that bargaining power of
suppliers was challenging. In addition, 34% (18) of the respondents indicated that bargaining
power of customers was most challenging, 28.3% (15) indicated that intensity of rivalry was
extremely challenging and 35.8% (19) indicated that product/service differentiation was less
challenging. Thirty seven point seven percent of the respondents indicated that cost leadership
was extremely challenging, 43.4% (23) indicated that market segmentation was the most
challenging factor and 28.7% (16) of the respondents indicated that access to raw materials was
challenging. The mean score for this response was 3.35 which indicates that majority of the
respondents indicated that most of the factors in the questionnaire were challenging.
Table 4.15: Challenges of Strategic Responses to Gain Competitiveness
Statement
Least
Challengi
ng
Less
Challengin
g
Challen
ging
Most
Challengi
ng
Extremel
y
Challengi
ng
Mean
Threats of new
entrants 1.9% 1.9% 17.0% 15.1% 64.2% 4.38
Threat of substitutes 15.1% 22.6% 32.1% 15.1% 15.1% 2.92
Bargaining power of
suppliers 1.9% 22.6% 49.1% 18.9% 7.5% 3.08
Bargaining power of
customers 1.9% 18.9% 32.1% 34.0% 13.2% 3.38
Intensity of rivalry 1.9% 11.3% 32.1% 26.4% 28.3% 3.68
Product/service
differentiation 5.7% 35.8% 26.4% 28.3% 3.8% 2.89
Cost leadership 1.9% 5.7% 28.3% 26.4% 37.7% 3.92
Market segmentation 0.0% 5.7% 30.2% 43.4% 20.8% 3.79
Access to raw
materials 41.5% 28.3% 11.3% 13.2% 5.7% 2.13
Average 8.0% 17.0% 28.7% 24.5% 21.8% 3.35

Journal of Strategic Management
ISSN 2520-0461(Online)
Vol.1, Issue 2 No.3, pp 46 - 67, 2017
63
Results on Table 4.16 illustrates that Bamburi cement company faced the most challenges as it
attracted a mean of 3.90, followed by Portland company with a mean of 3.14 and Savannah had
little challenges as it was new in the industry with a mean of 2.88.
Table 4.16: Challenges of Strategic Responses to Gain Competitiveness per company
Company N Mean Std. Deviation Std. Error Minimum Maximum
Portland 32 3.1484 0.30759 0.05438 2.44 3.56
Bamburi 16 3.9044 0.37845 0.09461 3.67 5
Savannah 5 2.888 0.71949 0.32177 2.22 3.67
Total 53 3.3521 0.5269 0.07238 2.22 5
4.6 Correlation between Competitiveness, Innovation, Integration, Outsourcing and
4.7Diversification
Correlation results in Table 4.17 indicated that the correlation between competitiveness and
independent variables (innovation, integration, outsourcing and diversification) was positive and
significant. The results correlation between competitiveness and innovation was positive and
significant (R=0.938, p value =0.000). The results correlation between competitiveness and
integration was positive and significant (R=0. 881, p value =0.000). The results correlation
between competitiveness and outsourcing was positive and significant (R=0.968, p value
=0.000). The results correlation between competitiveness and diversification was positive and
significant (R=0.909, p value =0.000).
Table 4.17: Bivariate Correlations
Variable
competiti
veness
innovati
on
integrati
on
outsourc
ing
Diversific
ation
Competitive
ness Pearson Correlation 1
Sig. (2-tailed)
Innovation Pearson Correlation 0.938 1
Sig. (2-tailed) 0.000
Integration Pearson Correlation 0.881 0.844 1
Sig. (2-tailed) 0.000 0.000
Outsourcing Pearson Correlation 0.968 0.900 0.870 1
Sig. (2-tailed) 0.000 0.000 0.000
Diversificati
on Pearson Correlation 0.909 0.834 0.740 0.898 1
Sig. (2-tailed) 0.000 0.000 0.000 0.000
Journal of Strategic Management
ISSN 2520-0461(Online)
Vol.1, Issue 2 No.3, pp 46 - 67, 2017
64
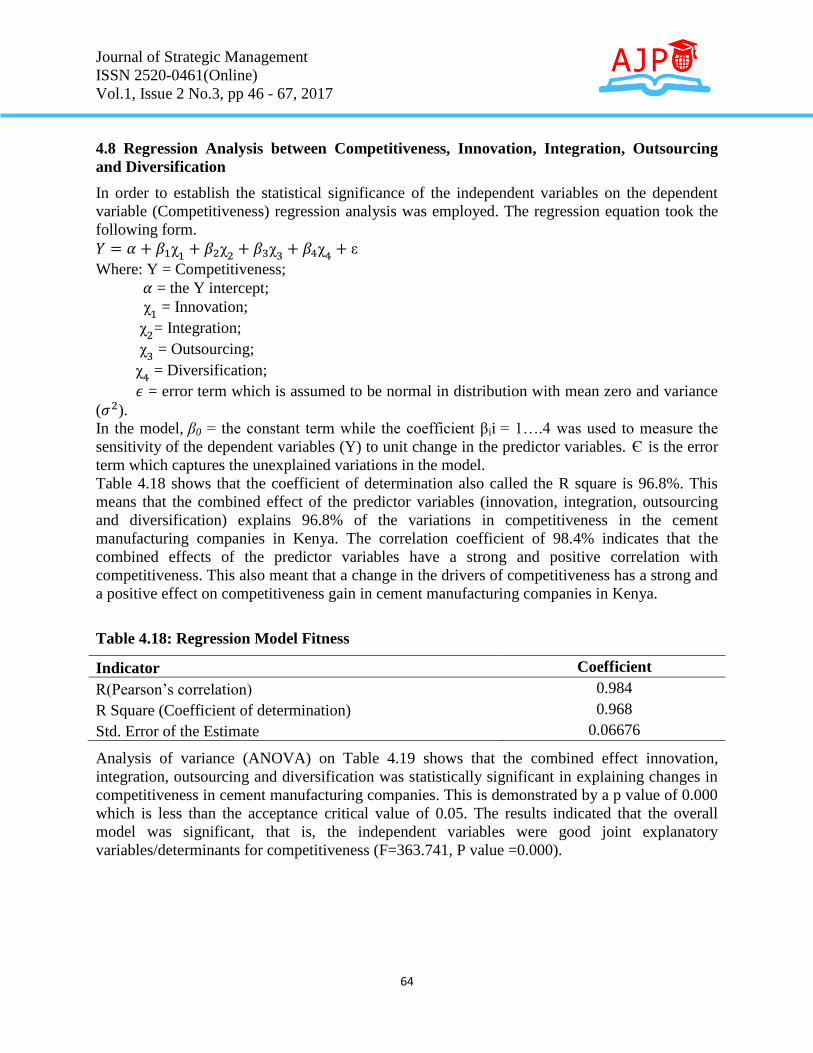
4.8 Regression Analysis between Competitiveness, Innovation, Integration, Outsourcing
and Diversification
In order to establish the statistical significance of the independent variables on the dependent
variable (Competitiveness) regression analysis was employed. The regression equation took the
following form.
Where: Y = Competitiveness;
= the Y intercept;
= Innovation;
= Integration;
= Outsourcing;
= Diversification;
= error term which is assumed to be normal in distribution with mean zero and variance
( ).
In the model, β0 = the constant term while the coefficient βii = 1….4 was used to measure the
sensitivity of the dependent variables (Y) to unit change in the predictor variables. Є is the error
term which captures the unexplained variations in the model.
Table 4.18 shows that the coefficient of determination also called the R square is 96.8%. This
means that the combined effect of the predictor variables (innovation, integration, outsourcing
and diversification) explains 96.8% of the variations in competitiveness in the cement
manufacturing companies in Kenya. The correlation coefficient of 98.4% indicates that the
combined effects of the predictor variables have a strong and positive correlation with
competitiveness. This also meant that a change in the drivers of competitiveness has a strong and
a positive effect on competitiveness gain in cement manufacturing companies in Kenya.
Table 4.18: Regression Model Fitness
Indicator Coefficient
R(Pearson’s correlation) 0.984
R Square (Coefficient of determination) 0.968
Std. Error of the Estimate 0.06676
Analysis of variance (ANOVA) on Table 4.19 shows that the combined effect innovation,
integration, outsourcing and diversification was statistically significant in explaining changes in
competitiveness in cement manufacturing companies. This is demonstrated by a p value of 0.000
which is less than the acceptance critical value of 0.05. The results indicated that the overall
model was significant, that is, the independent variables were good joint explanatory
variables/determinants for competitiveness (F=363.741, P value =0.000).

Journal of Strategic Management
ISSN 2520-0461(Online)
Vol.1, Issue 2 No.3, pp 46 - 67, 2017
65
Table 4.19: Analysis of Variance (ANOVA)
Indicator Sum of Squares df Mean Square F Sig.
Regression 6.481 4 1.62 363.471 0.000
Residual 0.214 48 0.004
Total 6.695 52
Table 4.20 displays the regression coefficients of the independent variables. The results reveal
that innovation, integration, outsourcing and diversification are statistically significant in
explaining competitiveness in cement manufacturing companies.
Regression results in Table 4.20 indicated that the relationship between innovation and
competitiveness was positive and significant (b1= 0.105, p value, 0.000). This implies that an
increase in company innovativeness by 1 unit leads to an increase in competitiveness by 0.105
units. Regression results further indicated that the relationship between integration and
competitiveness was positive and significant (b1=0.073, p value, 0.040). This implies that an
increase in company integration by 1 unit leads to improved competitiveness by 0.073 units.
Results further indicated that the relationship between outsourcing and competitiveness was
positive and significant (b1= 0.162, p value, 0.000). This implies that an increase in outsourcing
activities by 1 unit leads to an increase in competitiveness by 0.162 units. Finally the results
revealed that diversification and competitiveness had a positive and significant relationship (b1=
0.076, p value, 0.003). This implies that an increase in product diversification by 1 unit leads to
an increase in competitiveness by 0.076 units.
Table 4.20: Regression Coefficients
Variable Beta Std. Error T Sig.
Constant 1.065 0.092 11.533 0.000
Innovation 0.105 0.023 4.505 0.000
Integration 0.073 0.034 2.116 0.040
Outsourcing 0.162 0.032 5.027 0.000
Diversification 0.076 0.024 3.144 0.003
5.0 CONCLUSIONS AND RECOMMENDATIONS
5.1 Conclusions
The following can be concluded from the research findings:-
There is high level of competition between the cement manufacturing companies and hence the
companies need to put in place strategies to counter the competition in order to gain competitive
advantage amongst the companies.
It was also possible to conclude that there were various strategic responses that were adopted by
the cement manufacturing companies in order to gain competitiveness. These strategies included
innovation, integration, outsourcing and diversification. The study concluded that innovation,

Journal of Strategic Management
ISSN 2520-0461(Online)
Vol.1, Issue 2 No.3, pp 46 - 67, 2017
66
integration, outsourcing and diversification were statistically significant in explaining
competitiveness in the cement manufacturing firms.
The study further concluded that the cement manufacturing companies faced various challenges
in strategic responses implementation to gain competitiveness. This includes challenges such as
threat of new entrants, threat of substitutes, bargaining power of suppliers, bargaining power of
customers, intensity of rivalry, product/service differentiation, cost leadership, market
segmentation and access to raw materials.
5.2 Recommendations
Based on the results, findings and conclusions the following recommendations have been
deciphered. The study recommends that Managers at cement manufacturing companies can use
the results to craft strategies on which areas to improve and which areas to excel at. For instance,
the managers may highlight the toughest challenges so that they may find ways to improve on
the drivers of the weaknesses and also identify the drivers of Strengths with an intention to excel
in these areas.
It is also suggested that since the employee perceptions were that formation of strategic
responses have brought about competitive advantages, it may be important to consider investing
in the area of change management with a hope of building and enjoying further competitive
advantages. This investment would take the form of more human and financial resources
allocated to change management by adopting the new strategies.
The study further recommends that the management should put strategic policies to encourage all
the employees embrace change and don’t resist to ensure the transition is smooth thus the
management should commit itself in making the employees part of the change hence increasing
competitiveness of the cement manufacturing companies.
REFERENCES
Bailey K, & Farrell, P.F (2004), Chamberlain's Theory of Strategy, 5th
Edition, Heinman
Publishers: London.
Bowman, Douglas, & Hubert, G. (1995). Determinants of Competitive Response Time to a New
Product Introduction,. 3rd
Edition, MacGraw-Hill Publishers: London.
Chatterjee, S. (1986). Types of synergy and economic value: The impact of acquisitions on
merging and rival firms, Strategic management Journal, 7(2), 119-139. (1991).
Gottfredson, M., Puyear, R., & Philips, S. (2005). Strategic Sourcing:From periphery to the
core, 1st Edition, Pitman Publishers: London.
Juma .M.J.O. (2010), Lead from where you are, Quarterly PPOA Bulletin Volume No. 04,
Nairobi: A Publication of Non governmental organizations procurement Oversight
Authority.

Journal of Strategic Management
ISSN 2520-0461(Online)
Vol.1, Issue 2 No.3, pp 46 - 67, 2017
67
Palich, L. E., Cardinal, L. B., & Miller, C. C. (2000). Curvilinearity in the diversification on
performance linkage. An Examination over three decades research , 21 (2). 155.
Prahalad, C. K., & Hamel, G. (1990). The core Competence of the Corporation. Havard
Business Review , Vol. 68, No.3, pp. 79-91.
Teece, D. J. (1980), Economies of scope and the scope of the enterprise. Journal of Economic
Behavior and Organization , 1,223-247.