an evaluation of the impact of emotional intelligence …
TRANSCRIPT
Arabian Journal of Business and Management Review (Nigerian Chapter) , 201510Vol. 3, No.
94
AN EVALUATION OF THE IMPACT OF EMOTIONAL INTELLIGENCE ON TEAM EFFECTIVENESS AMONG IT PROFESSIONALS AT BYTES
SYSTEMS INTEGRATION (SOUTH AFRICA)
Obakeng Appolus Graduate of the Regent Business School, Durban, Republic of South Africa
Louise Niemand External Dissertation Supervisor and Academic attached to the Regent Business School, Johannesburg,
Republic of South Africa Anis Mahomed Karodia
[email protected] Professor, Senior Academic and Researcher, Regent Business School, Durban, Republic of South Africa
Abstract Emotional intelligence and team effectiveness have attracted considerable interest from many researchers recently. Teams have become a preferred method to increase efficiency and to respond quickly to technological and market changes in organisations. A considerable amount of research has been conducted to understand how to create effective teams. Research data have shown that emotions are inseparable from the workplace as they affect how team members interpersonal relations among team members. Working in teams requires skills that help individuals to recognise and manage their emotions and those of others. Many studies assert that teams need more than just technical skills to be effective. Emotional intelligence is regarded as a critical skill required in teams. Key Words: Evaluation, Impact, Emotional Intelligence, Team Effectiveness, Professionals, Integration Introduction Bytes Systems Integration (BSI) is an outsource service provider which designs, implements, services and manages customised Information and Communication Technology (ICT) services and solutions. It is a subsidiary of Bytes Technology Group, which is a subsidiary of the Altron Group. On the 01st of April 2015 the Altron Group celebrated its 50th Anniversary. In the last 50 years the Altron group grew both organically and inorganically through acquisitions. In today’s business environment, work is interdependent and thus teams have become a dominant means to getting work done (Barczak, Lassk and Mulki, 2010:332). A team is a group of individuals whose tasks are interdependent and share responsibility for outcomes, they are seen by others as an intact social entity embedded in a social system and are able to manage their relationships across organisational boundaries (Stubbs Koman and Wolff, 2008:56). According to Williams and Castro (2010:124-125), teams are an important ingredient of organisational success as they allow for rapid information exchange and increased responsiveness. BSI uses a combination of business and technical teams to provide a full range of Information Technology (IT) infrastructural services, such as service desk, end-user computing, server support, data security, network support services, data centre storage solutions and IT outsourcing, contact
Arabian Journal of Business and Management Review (Nigerian Chapter) , 201510Vol. 3, No.
95
centres, biometrics and identity life-cycle management, workforce management and cloud-based solutions. In this study, the concepts of team, team effectiveness and emotional intelligence will be explored. Aim of the study The aim of this research is to determine if team effectiveness within various Information Technology teams at Bytes Systems Integration can be influenced by emotional intelligence. Objectives of the study The objectives of the study are: To establish the dimensions of emotional intelligence To evaluate the factors that contributes to team effectiveness To measure the team emotional intelligence level in Information Technology teams at Bytes
Systems Integration To determine the impact of emotional intelligence on team effectiveness To recommend how team effectiveness can be enhanced in Information Technology teams at
Bytes Systems Integration Formation Technology teams at BSI? LITERATURE REVIEW The terms groups and teams are often used interchangeably in everyday language and literature (Mullins, 2010:307). Recent management literature has made a distinction between these two terms. Smit, de J Cronje, Brevis and Vrba (2007:312) assert that all teams are also groups, but not all groups are teams. Smit et al (2007:312) are of the view that a team is a special kind of group. With this view in mind, for the purposes of this study the two terms will be used interchangeably. Definition of a Team Over the years, various authors and researchers have come up with definitions of a team. Smit et al. (2007:314) defines a team as a small number of employees with complementary competencies who are committed to a common purpose, and are accountable for performing tasks that contribute to achieving an organisation’s goals. Lussier (2008:368) brought the aspect of shared leadership in the definition, and asserts that a team is a group of individuals with shared leadership and perform interdependent jobs with individual and group accountability, evaluation and rewards. According to Mullins (2010:307) teams occur when a group of people have a common goal and recognise that personal success is dependent on the success of others. Brown (2011:281) defines a team as a “group of individuals with complementary skills who depend upon one another to accomplish a common purpose or set of performance goals for which they hold themselves mutually accountable”. Barczak, Lassk and Mulki (2010:332) states that teams integrate talent, energy and skills (of individual members) and their collective capacity to innovate becomes greater than the sum of individual contributions. Stroh (2005:434) argues that a team is not a team unless its members depend on each other. He asserts that cooperation among team members does not necessarily qualify as teamwork, team members must put the needs of the team ahead of their own, help each other where possible, and where necessary, change the way they do their own job to improve the outcomes of the team. At the core of these definitions the following four themes stands out:
Team members work towards a common goal or purpose Team members have complementary skills and perform tasks that are interdependent Team members are committed to working collaboratively the team is held accountable collectively

Arabian Journal of Business and Management Review (Nigerian Chapter) , 201510Vol. 3, No.
96
Pollock and Zocklein (2012:1) describe a work team in today’s terms as a department within an organisation with less than 20 members. Pollock and Zocklein (2012:1) assert that it is a sub-unit of an organisation and thus it is a microcosm of the parent organisation’s elements such as people, process, technology, goals, finances, products and services, suppliers, and customers. The current BSI company profile published on the organisation’s website states that the ATS Division utilises business and technical teams to deliver Optimised Cloud Services and Support solutions, Contact Centre Optimisation and Microsoft solutions and licensing (Bytes Systems Integration, 2015). These teams mainly consist of 20 or less people/members who are working towards a common goal which is in line with the organisation’s goals. Each team follows the processes of the organisations to provide products and services to customers. Emotional Intelligence The concept of Emotional Intelligence has its roots in the 1920s and 1930s through the early works of psychometric researchers like Thorndike, Moss, Hunt and Vernon (Kunnanatt, 2008:618). Beigi and Shirmohammadi (2011:553) states that emotional intelligence received considerable attention in the workplace since the publication of Daniel Goleman’s seminal book, Emotional Intelligence in 1995. Various authors and researchers over the years have come up with definitions of what emotional intelligence is. Goleman (cited in Baloch, Saleem, Zaman and Fida, 2014:211) who is credited for pioneering emotional intelligence in the workplace defines emotional intelligence as the ability of know and control one’s own feelings accordingly. Phipps, Prieto and Ndinguri (2014:74) define emotional intelligence as “the ability to recognize one’s own feelings as well as the feelings of others and to use this awareness to motivate oneself and to manage one’s emotions and relationships”. Emotions are reactions to people or events, individuals show emotions when they are happy, angry or afraid about/of something (Robins and Timothy, 2012:51). According to Barczak et al. (2010:333) emotions are inseparable from an organization’s internal work environment, they have a great influence in teams as they are fundamental to how team members interact and work together. Robbins and Timothy (2012:58) argue that people who know their own emotions and are good at reading emotional cues are most likely to be effective. It is for this reason that the use of emotional intelligence in the workplace has become popular. According to Kulkami, Janakiram and Kumar (2009:163) knowing one's emotions and feelings as they occur, and tuning one's self to the changed situation, requires the emotional competency, emotional maturity and emotional sensitivity that is demanded on the job. They assert that in the workplace emotional intelligence is an individual’s ability to control and manage his or her moods and impulse, which direct and control one's feelings towards work and performance at work. Khan et al. (2014:1) emphasized that emotional intelligence not only deals with the emotions of the employees, but it also identifies their impact on the behavior of the employees. Emotional Intelligence Models Over the years various models of emotional intelligence have been presented by various authors. These models are mainly centred around the following three things highlighted by Robbins and Timothy (2012:58) in their definition of emotional intelligence; (1) An individual’s ability to recognise his or her own emotions when he or she experiences them, (2) An individual’s ability to identify emotions in others people and (3) An individual’s ability to manage emotional cues and information. Emotional Intelligence models are divided into two categories, the abilities models and the mixed models (Beam, 2012:4; Davies, 2011:13; Trabun, 2002:11). The abilities models define emotional

Arabian Journal of Business and Management Review (Nigerian Chapter) , 201510Vol. 3, No.
97
intelligence in terms of the following cognitive abilities that originate from childhood and continue to develop (Beigi and Shirmohammadi, 2011:553):
the ability to perceive emotions the ability to integrate emotions The ability to facilitate thought The ability to understand emotions The ability to manage emotions
The mixed models conceptualises emotional intelligence as a combination of cognitive abilities and personality traits (Beigi et al., 2011:553). The mixed models are concerned with behavioural consistency manifested in specific traits, personality types, or behaviours such as empathy, assertiveness and optimism (Davies, 2011:13). The most popular mixed models are the models developed by Daniel Goleman and Reuven Bar-On. While consensus prevail among researchers that emotional intelligence models falls into two categories, Beigi and Shirmohammadi (2011:553) brought in a third category called The Competency Model. These models assert that cognitive abilities are learned capabilities that must be developed in order to achieve high performance. These models are commonly applied in the workplace context because it perceives emotional intelligence as a skill that can be developed. Beigi and Shirmohammadi (2011:553) cites Goleman’s model which has been widely used workplace as an example. It must however be noted that Goleman’s model has been classified by some researchers as a mixed model. For the purposes of this study, emotional intelligence is perceived as a skill than can be developed and thus will be classified as a competency model. The study adopted Daniel Goleman’s model which is widely used in the workplace. The model is discussed in the next section. Goleman’s Emotional Intelligence Model Goleman’s model of emotional intelligence was created from Mayer, Salovey, and Caruso’s early model, but incorporates additional personality traits such as persistence and zeal (de Miranda, 2011:14). According to Daniel Goleman (cited in Kulkarni, Janakiram and Kumar, 2009:164) emotional intelligence has four dimensions representing the recognition and regulation of emotions in ourselves and in others. Each dimension comprises a set of emotional competencies which an individual must possess to be regarded as competent in that dimension of emotional intelligence. The competencies required for each dimension are shown in Table 2.5 below:

Arabian Journal of Business and Management Review (Nigerian Chapter) , 201510Vol. 3, No.
98
Table 2.5: Goleman’s emotional intelligence
Source: Goleman (2015:2) The four dimensions are described below and are discussed in detail in the following sections:
Self-awareness - It is the ability to read one’s own emotions and recognize their impact (Baloch, Saleem, Zaman and Fida, 2014: 214).
Self-management - It is the ability to manage one’s emotions and impulses and adapting to changing circumstances (Stubbs Koman and Wolff, 2008: 57).
Social awareness – It is the ability to sense, understand, and react to the emotions of others (Kulkarni, Janakiram and Kumar, 2009: 164).
Relationship management – The ability to inspire, influence and develop others while managing conflict (Beigi and Shirmohammadi, 2011: 213).
Self-Awareness Self-awareness is the ability of an individual to sense, articulate and reflect on their emotional state and understand how they affect their performance. It is associated with being able to (1) detect which emotion, moods, and impulses one is experiencing and (2) why are they experiencing them and (3) how do they affect others and their performance (Polychroniou, 2009:345). According to Kunnanatt (2008:620) self-aware individuals are able to read and link their feelings with what they think and how they act. Individuals with high self-awareness don’t allow their emotion to rule them; they keep them under control at all times. An example could be an individual who is able to realise that when he or she is in a state of anger, it clouds their judgement and avoids making critical decisions while in the state of anger. Luca and Tarricone (2001:368) emphasise that self-awareness is important in guiding interactions among colleagues and establishing positive and productive teamwork. Luca and Tarricone (2001:368) argue that team members need to be aware of their feelings as they may allow uncontrolled emotions to impact on the dynamics and culture of the team. Competence in this dimension of emotional intelligence is crucial for IT professionals as in their line of work they interact with fellow colleagues/team members and customers. As shown in the Goleman’s model in
Arabian Journal of Business and Management Review (Nigerian Chapter) , 201510Vol. 3, No.
99
table 2.1, competence in this dimension is critical for two other dimensions. Self-awareness forms an important building block for the Social-awareness and Self-management dimensions. Self-Management Self-Management is the ability of an individual to manage his or her own emotions and impulses to remain calm in potentially volatile situations and to maintain composure irrespective of one’s emotions (Polychroniou, 2009:345). According to Smit (2007:307) individuals with high self-awareness are effective in stressful situations and are able to deal with hostile situations without reacting. A good example is an individual who is dealing with an angry client who might be using inappropriate language and throwing false accusations, but remains calm and still talks to the client in a polite and professional manner. Kunnanatt (2008:620) states that individual’s uses self-awareness to regulate the rational and emotional operations of their minds to provide an emotionally supportive pathway for the reasoning mind to make logically correct and socially acceptable decisions and judgments. Individuals with high levels of Self-management are able to control their emotions (particularly distressing ones like anger and anxiety) and impulses; they don’t allow themselves to be too angry and avoids making impulsive decisions. Social-Awareness Social Awareness is the ability to accurately detect emotions in other people and understand how they impact on the situation of interest or concern (Bradberry, 2014). It includes the ability to sense, understand, and react to the emotions of others while comprehending social networks (de Miranda, 2011:14). Social awareness dimension has the following competencies (1) empathy, (2) service orientation and (3) organisational orientation (Beigi and Shirmohammadi, 2010:213; Smit et al., 2007:307). These competencies are discussed below:
Empathy - Book (cited in Luca and Tarricone, 2001:369) defines empathy as the “capacity to see the world from another person’s perspective”. In the context of emotional intelligence, Empathy is the ability of an individual to understand the feelings transmitted through verbal and nonverbal messages, understand the links between others’ emotions and behaviour and to provide emotional support to people when needed (Polychroniou, 2009:345). In the workplace empathy is regarded as the ability to understand and interpret colleagues’ feelings and being able to identify with their feelings on issues through understanding their perspective (Goleman cited in, Luca and Tarricone, 2001:369). According to Luca and Tarricone (2001:369) empathic team members are aware of the diversity of personalities and are more accepting of the diversity of people and the impact culture can have on interactions within a team environment. This competence is critical when dealing with a diverse workforce or client base. In a diverse workforce unnecessary animosity can prevail if managers and leaders are unable to understand and manage different dynamics that makes a group tick.
Service Orientation - Clients don’t always articulate their needs effectively, they rely on service providers to advise them of what of what they need as an expert. Service orientation is the ability to identify the client’s unstated needs (Smit et al., 2007:307). An individual who lacks empathy could be impatient with the ambiguous message coming from the client and could end up being rude and drive them away in the process.
Organisational Awareness- It is the ability to read social and political currents in organisations and teams (Smit et al., 2007:307), it is often regarded as empathy on an organizational scale (Careerevolutiongroup.com, 2012). Organisational awareness goes further than just the ability to understand the politics within an organisation or team; it includes the ability to understand they affect the people working in them.

Arabian Journal of Business and Management Review (Nigerian Chapter) , 201510Vol. 3, No.
100
Individuals with high levels of organisational awareness are able to detect crucial social networks, power relationships, guiding values, political forces and organisational norms (Careerevolutiongroup.com, 2012). On the contrary, those with low levels of organisational awareness find it difficult to get things done in the organisation and often act in ways that the organisation, team or community find inappropriate.
Relationship Management Relationship Management entails the ability to influence, guide, inspire and handle other people’s emotions while managing the conflict (de Miranda, 2011:14). It includes the identification, analysis, and management of relationships with people inside and outside of your team. It also incorporates an individual’s ability to communicate, persuade, and lead others, whilst being direct and honest without alienating people. Luca and Tarricone (2001:369) argue that relationship management skills are essential to develop positive and effective relationships among colleagues. According to Zimmerman (2013) relationship management is all about an individual’s:
Ability to get the best out of others Ability to inspire and influence them Ability to communicate and build bonds with them Ability to help them change, grow, develop, and resolve conflict.
As stated in section 2.3, Woehr et al. (2012:111) emphasise that for team effectiveness to be achieved, the internal social interactions of team members should enhance or maintain, the team’s ability to work together in the future. Competence in the relationship management dimension is critical to meet these criteria. The team’s ability to work together can be greatly enhanced when team members are able to inspire each other, build bonds, communicate and resolve conflict constructively. Emotional Intelligence in teams Naseer et al. (2011:34) argues that emotional intelligence is critical for high performance. They assert that a person who knows how to stay motivated under stress, motivate others, manage complex interpersonal relationships, his/her others and build teams which are likely to achieve better results. Abraham, (2004); Higgs, (2004); Kunnanatt, (2004); Stubb Koman and Wolff (2008) (all cited in Beigi and Shirmohammadi, 2011:553) highlights that recent research shows that emotionally intelligent employees perform more effectively individually and as team members. Vrabie (2014) states that nowadays effective teams require more than just technical skills, they require emotional intelligence too. Team Emotional Intelligence Effective teams are a rare and sought after commodity in organisations (JCA Global, 2013). JCA Global (2013) state that their research with teams show that effective teams are created by developing the emotional intelligence of the team. This brings about the concept of team emotional intelligence. JCA Global (2013) defines team emotional intelligence as “the shared behaviours, habits and attitudes that create the conditions for teams to develop co-operate, coordinate and communicate well”. Barczak, Lassk and Mulki (2010:333) state that team emotional intelligence is achieved by developing a set of norms that manage emotional processes in the team. These norms facilitate collaboration, cohesiveness and behaviours which are essential for team effectiveness (Barczak, Lassk and Mulki, 2010:333). Teams with high emotional intelligence skilfully manage and gets the most from the personalities within the team, pays attention to both task and feeling and skilfully manages emotion in the team (JCA Global, 2013). Troth (2009:33) suggests that the best way to assess a team’s emotional Intelligence level is through a summative composition of the team members’ individual emotional intelligence abilities. It is

Arabian Journal of Business and Management Review (Nigerian Chapter) , 201510Vol. 3, No.
101
recommended that a summative index (averaging) of team members’ individual emotional intelligence abilities must be created to reflect the team’s emotional intelligence abilities (Troth, 2009:33). The Impact of Emotional Intelligence on Team Effectiveness Barczak et al. (2010:333) argues that emotions have a great influence on how team members interact and work together. Luca and Tarricone (2001:368) assert that the ability to manage emotions, especially during conflict, pressure and stress facilitates and promotes positive and effective working relationships with other team members and clients. Kunnanatt (2008:616) suggest that employees with high emotional intelligence are able to brace against distracting emotions as a result the enhanced ability to recognise and manage emotions they possess. Kunnanatt (2008:616) argues that emotional intelligence produces superior performances at an individual and team level. In a study on the effect of group emotional intelligence on team effectiveness, Aslan, Ozata and Mete (2008:112) found that group emotional intelligence has a positive effect on team effectiveness. The study also revealed that self-management dimension has the most influence on team effectiveness. The study also found a positive and meaningful correlation between the social awareness dimension and team effectiveness. Jordan, Peter, Lawrence and Sandra (2009, cited in Naseer et al, 2011:34) in a recent study have highlighted that emotional Intelligence is linked to improved team behaviours and team performance. Stough, Saklofske and Parker (2009; cited in Naseer et al. 2011:34) recently found that team performance is positively and significantly influenced if a team member is able to recognise emotions of teammates. IT professionals at BSI interact with colleagues in their teams to provide services to clients. Operating in a highly technical environment where things change rapidly, conflict is almost inevitable. Conflict can be between fellow team members whose tasks are interdependent. It can also be between a team member or the whole team and the client who keeps changing the scope of the project. Tight deadlines often create tensions among team members if one is waiting upon the other to complete their tasks which impacts on theirs. Naseer et al. (2011:41) concluded in a recent study that high emotional intelligent work teams perform at a higher level than low emotionally intelligent teams. It is for this reason that managers have to pay more attention on developing emotional intelligence in their teams if they want to boost the effectiveness of their teams. Quoidbach and Hansenne (cited in Moore and Mamiseishvili, 2012:297) in their study to examine the relationship between emotional intelligence and work performance, found that one member with a low emotional intelligence score can affect their entire team, the same was found to be true for one member with a high score. It is for this reason that managers need to place more emphasis on emotional intelligence when selecting members to join a team. RESEARCH METHODOLOGY The purpose of the research plays a crucial role in determining the research design. Saunders, Lewis and Thornhill (2009:139) states that most research purposes fall within exploratory, descriptive and explanatory classification. The purpose of exploratory studies is to find out “what is happening; to seek new insights; to ask questions and to assess phenomena in a new light” (Shajahan, 2009:32). According to Robson (cited in Saunders, Lewis and Thornhill, 2009:140) the purpose of descriptive research is to portray an accurate profile of persons, events or situations. Explanatory research studies seek to establish causal relationships between variables (Saunders, Lewis and Thornhill, 2009:140). This study is evaluating the impact of emotional intelligence on team effectiveness among IT professionals. As shown in chapter 2, many researchers have written about both concepts extensively and thus the exploratory design was not suitable as much is known about these

Arabian Journal of Business and Management Review (Nigerian Chapter) , 201510Vol. 3, No.
102
concepts. The purpose of this study was mainly descriptive and explanatory. Zikmund (2003:55) states that the major purpose of descriptive research is to describe the characteristics of a population or phenomenon. One of the objectives of the study was to measure and describe the level of emotional intelligence in IT team at BSI. The study further seeks to determine if a relationship between emotional intelligence and team effectiveness exit, thus explanatory methods are required. Davis (2014:15) states that a research approach should be decided with careful consideration to ensure the validity of its findings. It must account for all factors that may affect the outcomes of the hypothesis and research questions as much as possible (Davis, 2014:15). According to Barendrecht (2010:48) the quantitative methodology is used to conduct systemic observations of the properties and relationships of the study objects. According to Kumar (2014:14), quantitative approach follows a rigid, structured and predetermined set of procedures to explore and aims to quantify the extent of variation in the phenomenon. According to Henning, Van Rensburg and Smit (2005:5) the qualitative research methodology is used to examine the qualities, characteristics, or the properties of phenomena to gain a better understanding and explanation. Kumar (2014:14) states that a qualitative methodology follows an open, flexible and unstructured approach to enquire with the aim of exploring diversity rather than to quantifying placing no or little emphasis on generalizations. Quantitative methodology presents numerical or statistical data and is used if the objective is to predict and control future outcomes, or to generalise from a sample of people to a larger population (Davis, 2014:14). On the contrary, when the objective is to explore attitudes, behaviour and experiences through methods like interviews or focus groups, qualitative methods are used (Dawson, 2002:14). This research seeks to establish if a relationship between emotional intelligence and team effectiveness exists, thus it will use a quantitative methodology. The research will measure and describe the level of emotional intelligence among IT professionals at BSI and thus it will be descriptive as well as explanatory in nature. Target Population According to Wiid and Diggines (cited in Pascoe, 2014:132) a population is defined as “a total group of people or entities (social artefacts) from whom information is required”. An important aspect to keep in mind is that all people or social artefacts in a population should share at least one specific characteristic that relates to the research question (Pascoe, 2014:132). Pascoe (2014:132) further argues that for a population to be defined appropriately population parameters have to be set. The population parameters of a study refer to the nature (people or social artefacts), size and unique characteristics of the population. In this study the nature of the population is the people. The size of the population is all IT professionals working for BSI and the unique characteristic that is shared is working at the Midrand campus of BSI. BSI has IT professionals spread across a number of campuses and at various customer sites in South Africa. According to Rassel and O’Sullivan (cited in Ramalibana, 2005:30) a population is a group which is the subject of a research interest. In this study, IT professionals at the Midrand campus of BSI were targeted. At the time of this study, the Midrand campus had around 40 IT professionals spread across different teams. Employees at customer sites were excluded from this study because of accessibility. Employees at other campuses across the country were also excluded from the study as they are mainly administrative. IT professionals at BSI mainly support customers across the country remotely and through assistance from colleagues from sister companies within the Bytes group throughout the country. Sampling While in certain instances it may be possible to collect and analyse data from the whole population, for some researches it is impossible to collect data from the whole population as a result of time

Arabian Journal of Business and Management Review (Nigerian Chapter) , 201510Vol. 3, No.
103
constraints, budget constraints and access to the target population (Saunders, Lewis and Thornhill, 2009:210). Sampling is generally used in situations where it is not possible to reach all people in the target population due to various reasons including time constraints and costs. Sampling is the process of selecting a few people (sample) from a target population to estimate or predict the prevalence of an unknown piece of information, situation or outcome regarding the bigger group (Kumar, 2014:231). Zikmund (2003:70) describes a sample as a subset of a larger population used to draw conclusions regarding the whole population. According to Bryman (2008:698) a sample is a segment of the population that is selected for research. Wegner (2012:153) argues that for a sample to produce valid and reliable results, it should be representative of the target population it was drawn from. According to Bryman and Cramer (cited in Thumbran, 2010:37) the size of the sample depends on the complexity of the population and research questions. There are two basic methods of sampling, non-probability and probability sampling methods (Wegener, 2013:153). Probability sampling methods are based on chance selection procedures. The chance or probability of each member being selected is known and is usually equal for all members of the population (Saunders et al, 2009:213). According to Wegner (2013:154) there are four probability-based sampling methods:
Simple random sampling - each member in the target population has an equal chance of being selected.
Systematic random sampling - it is used when a sampling frame exists. Sampling begins by randomly selecting the first sampling unit. Thereafter subsequent sampling units are selected at a uniform interval relative to the first sampling unit
Stratified random sampling - it is used when the population is assumed to be heterogeneous with respect to the random variable under study. The population is divided into segments, where the population members within each stratum are relatively homogenous.
Cluster random sampling - it is used where the target population can be naturally divided into clusters, where each cluster is similar in profile to every other cluster. A subset of clusters is then randomly selected for sampling.
According to Wegner (2013:154) there are four non-probability-based sampling methods: Convenience Sampling- the members are selected because they are accessible to the researcher.
Members are chosen simply because they are easy to recruit. This technique is considered the easiest, cheapest and least time consuming.
Judgment Sampling- Judgment sampling is also known as purposive sampling. In this technique subjects are selected to be part of the sample with a specific purpose in mind. With judgment sampling, the researcher believes that some subjects are more suitable for the research compared to others.
Snowball Sampling-In this sampling technique, the initial subjects is asked to identify other potential subject who also meets the criteria of the research. The disadvantage of this technique is that it is not representative of the population.
Quota Sampling- In this sampling technique, the researcher ensures equal or proportionate representation of subjects depending on which trait is considered as the basis of the quota.
There are six IT teams at the Midrand campus of BSI. Cluster sampling was chosen for this study. The population was therefore divided into six clusters; however two teams were excluded from the study. The first team was excluded because it was only transferred from one of the Altron group of companies into BSI while the study was already underway. The second team was excluded because its members are mainly based at the customer sites and rarely come to the office. IT professionals from four teams at the Midrand campus were invited to participate in the survey.

Arabian Journal of Business and Management Review (Nigerian Chapter) , 201510Vol. 3, No.
104
Limitations of the Research According to Marshall and Rossman (2011:76), a discussion of the limitations of the study demonstrates that the researcher understand that no research project is perfectly designed. As a result of the limitations of the study, it is important to carefully consider any claims about generalizability or conclusiveness of findings. This study was limited to the evaluation of the impact of emotional intelligence on team effectiveness among IT professionals at the Midrand campus of BSI. Team effectiveness has been researched by many over the years. Literature reviews have shown that there is a wide range of factors that impacts on team effectiveness. This study only focuses only on the impact of emotional intelligence. Lastly, this research targeted IT professionals at the Midrand campus only, a much wider study needs to be conducted to validate how prevalent the finding are within the company at large. DATA ANALYSIS AND INTERPRETATION OF FINDINGS Response Rate An email with a unique link to the online questionnaire was sent to 45 participants. A response rate of 82.22% was achieved as shown on Table 4.2 below: Table 4.2: Response rate Quantity Percentage Number of distributed questionnaires 45 100% Number of completed questionnaires 37 82% Number of questionnaires not completed 8 18% A total of 37 participants completed the questionnaire; eight participants did not complete the questionnaire despite being sent three reminders. Reliability test The Cronbach’s alpha reliability test was applied on the data to check for internal consistencies or inconsistencies. Tables 4.3(a) and 4.3(b) below present the results from the Cronbach’s reliability tests conducted on the data collected. Table 4.3(a): Case Processing Summary
N % Valid 37 100 Cases Excluded 0 0 Total 37 100
Table 4.3 (b) above shows that all respondents answered all questions correctly, thus no questionnaires were excluded. Table 4.3(b): Reliability Statistics
Cronbach's Alpha N of Items 0.94 55

Arabian Journal of Business and Management Review (Nigerian Chapter) , 201510Vol. 3, No.
105
Table 4.3.2(b) above indicates that a Cronbach alpha coefficient of 0.9 was archived. This indicates that questionnaire has an acceptable degree of reliability and that the items in the questionnaire have an acceptable level of inter-item consistency. Demographic Information Dillman cited in Saunders et al (2009:368) states that an opinion, behaviour and attribute are three types of data variables that can be collected through a questionnaire. Attributes are used to explore how opinions and behaviour differ between respondents as well as to check that the data collected are representative of the total population (Dillman cited in Saunders et al., 2009:368). The attribute include characteristics such as age, gender, marital status, education, occupation and income. In this section the following demographic information collected from the participants; Age, Gender, Highest Qualifications, years of service within BSI are presented. Age of Respondents This question was intended to determine the age groups of the respondents. Figure 4.4.1: Age of Respondents
Figure 4.4.1 above shows that the majority (43.24%) of the respondents fall within the age category of 30 – 39, while the minority (10.81%) falls within the category of 50 – 59 years of age. The data further shows that 21.62% of the respondents falls in the age category of 18-29 years of age, and 24.34% falls within the category of 40 – 49 years. None of the participants are 60 years or more. Gender profile of respondents This part of the questionnaire intended to determine the gender profile of the respondents. Figure 4.4.2: Gender Profile of Respondent

Arabian Journal of Business and Management Review (Nigerian Chapter) , 201510Vol. 3, No.
106
From figure 4.4.2 above, it is evident that the IT teams at BSI are male dominated, with males accounting for 78.39% of the respondents and only 21.62% are females. This could be attributed to the fact that the ICT sector has been historically a male dominated industry. Education levels of respondents This question was intended to determine the highest qualification of the respondents. Figure 4.4.3: Education levels of respondents
Figure 4.4.3 above shows that 30.30% of the respondents have matric, 42.42% have national diplomas, 24.24% have Bachelor degrees, and none of the respondents have an honours degrees and3.03% have masters’ degrees. According to Silman (cited in Moodley, 2011:47), the individuals who pursue tertiary education are perceived to be more ambitious, motivated, self-confident and teachable than their without tertiary education. Jorfi and Jorfi (2010:68) states that educated employees communicate openly and express their feelings better than those who are less educated. Respondents’ years of service This question was intended to determine the respondent’s years of experience within BSI. Figure 4.4.4: Respondents’ Years of Service
Figure 4.4.4 above, shows that 3.03% of the respondents have less than one year experience at BSI and the majority (51.35%) have between 1 to 3 years of experience. 24.24% of the respondents have between 4 to 6 years of experience, whereas 21.21% have more than 6 years. Collectively 54% of
Arabian Journal of Business and Management Review (Nigerian Chapter) , 201510Vol. 3, No.
107
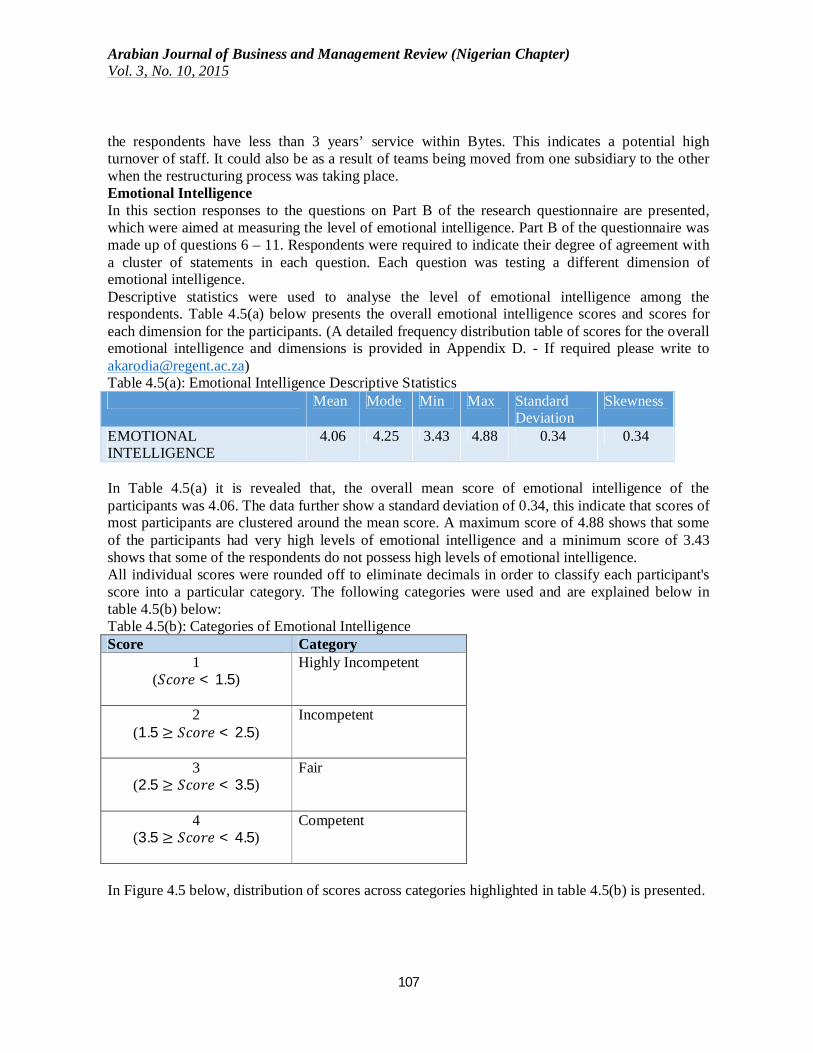
the respondents have less than 3 years’ service within Bytes. This indicates a potential high turnover of staff. It could also be as a result of teams being moved from one subsidiary to the other when the restructuring process was taking place. Emotional Intelligence In this section responses to the questions on Part B of the research questionnaire are presented, which were aimed at measuring the level of emotional intelligence. Part B of the questionnaire was made up of questions 6 – 11. Respondents were required to indicate their degree of agreement with a cluster of statements in each question. Each question was testing a different dimension of emotional intelligence. Descriptive statistics were used to analyse the level of emotional intelligence among the respondents. Table 4.5(a) below presents the overall emotional intelligence scores and scores for each dimension for the participants. (A detailed frequency distribution table of scores for the overall emotional intelligence and dimensions is provided in Appendix D. - If required please write to [email protected]) Table 4.5(a): Emotional Intelligence Descriptive Statistics Mean Mode Min Max Standard
Deviation Skewness
EMOTIONAL INTELLIGENCE
4.06 4.25 3.43 4.88 0.34 0.34
In Table 4.5(a) it is revealed that, the overall mean score of emotional intelligence of the participants was 4.06. The data further show a standard deviation of 0.34, this indicate that scores of most participants are clustered around the mean score. A maximum score of 4.88 shows that some of the participants had very high levels of emotional intelligence and a minimum score of 3.43 shows that some of the respondents do not possess high levels of emotional intelligence. All individual scores were rounded off to eliminate decimals in order to classify each participant's score into a particular category. The following categories were used and are explained below in table 4.5(b) below: Table 4.5(b): Categories of Emotional Intelligence Score Category
1 (푆푐표푟푒 < 1.5)
Highly Incompetent
2 (1.5 ≥ 푆푐표푟푒 < 2.5)
Incompetent
3 (2.5 ≥ 푆푐표푟푒 < 3.5)
Fair
4 (3.5 ≥ 푆푐표푟푒 < 4.5)
Competent
In Figure 4.5 below, distribution of scores across categories highlighted in table 4.5(b) is presented.
Arabian Journal of Business and Management Review (Nigerian Chapter) , 201510Vol. 3, No.
108
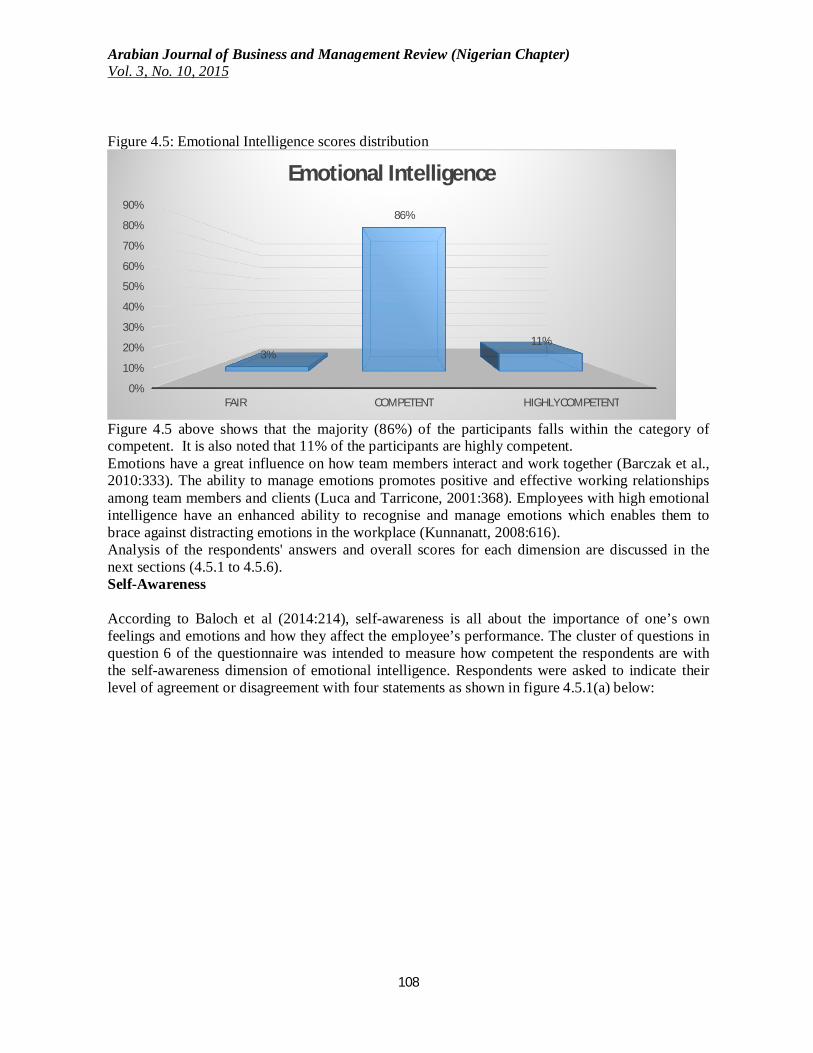
Figure 4.5: Emotional Intelligence scores distribution
Figure 4.5 above shows that the majority (86%) of the participants falls within the category of competent. It is also noted that 11% of the participants are highly competent. Emotions have a great influence on how team members interact and work together (Barczak et al., 2010:333). The ability to manage emotions promotes positive and effective working relationships among team members and clients (Luca and Tarricone, 2001:368). Employees with high emotional intelligence have an enhanced ability to recognise and manage emotions which enables them to brace against distracting emotions in the workplace (Kunnanatt, 2008:616). Analysis of the respondents' answers and overall scores for each dimension are discussed in the next sections (4.5.1 to 4.5.6). Self-Awareness According to Baloch et al (2014:214), self-awareness is all about the importance of one’s own feelings and emotions and how they affect the employee’s performance. The cluster of questions in question 6 of the questionnaire was intended to measure how competent the respondents are with the self-awareness dimension of emotional intelligence. Respondents were asked to indicate their level of agreement or disagreement with four statements as shown in figure 4.5.1(a) below:
0%
10%
20%
30%
40%
50%
60%
70%
80%
90%
FAIR COMPETENT HIGHLY COMPETENT
3%
86%
11%
Emotional Intelligence
Arabian Journal of Business and Management Review (Nigerian Chapter) , 201510Vol. 3, No.
109
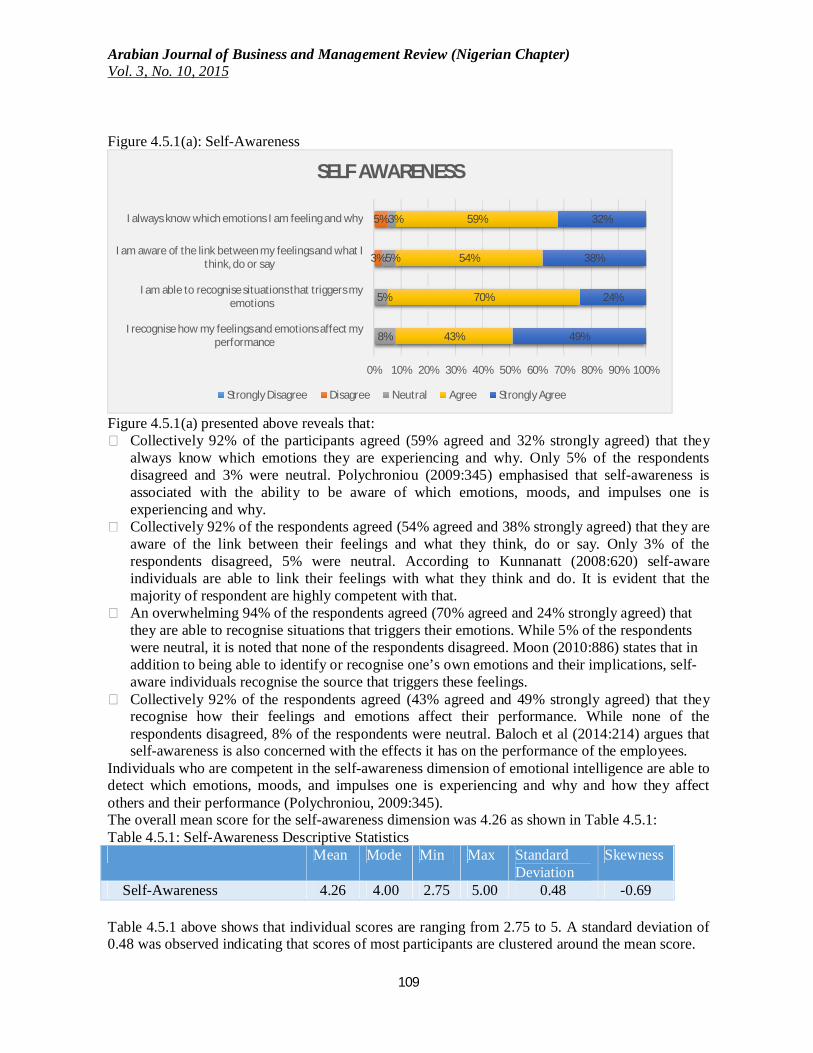
Figure 4.5.1(a): Self-Awareness
Figure 4.5.1(a) presented above reveals that:
Collectively 92% of the participants agreed (59% agreed and 32% strongly agreed) that they always know which emotions they are experiencing and why. Only 5% of the respondents disagreed and 3% were neutral. Polychroniou (2009:345) emphasised that self-awareness is associated with the ability to be aware of which emotions, moods, and impulses one is experiencing and why.
Collectively 92% of the respondents agreed (54% agreed and 38% strongly agreed) that they are aware of the link between their feelings and what they think, do or say. Only 3% of the respondents disagreed, 5% were neutral. According to Kunnanatt (2008:620) self-aware individuals are able to link their feelings with what they think and do. It is evident that the majority of respondent are highly competent with that.
An overwhelming 94% of the respondents agreed (70% agreed and 24% strongly agreed) that they are able to recognise situations that triggers their emotions. While 5% of the respondents were neutral, it is noted that none of the respondents disagreed. Moon (2010:886) states that in addition to being able to identify or recognise one’s own emotions and their implications, self-aware individuals recognise the source that triggers these feelings.
Collectively 92% of the respondents agreed (43% agreed and 49% strongly agreed) that they recognise how their feelings and emotions affect their performance. While none of the respondents disagreed, 8% of the respondents were neutral. Baloch et al (2014:214) argues that self-awareness is also concerned with the effects it has on the performance of the employees.
Individuals who are competent in the self-awareness dimension of emotional intelligence are able to detect which emotions, moods, and impulses one is experiencing and why and how they affect others and their performance (Polychroniou, 2009:345). The overall mean score for the self-awareness dimension was 4.26 as shown in Table 4.5.1: Table 4.5.1: Self-Awareness Descriptive Statistics Mean Mode Min Max Standard
Deviation Skewness
Self-Awareness 4.26 4.00 2.75 5.00 0.48 -0.69 Table 4.5.1 above shows that individual scores are ranging from 2.75 to 5. A standard deviation of 0.48 was observed indicating that scores of most participants are clustered around the mean score.
3%
5%
8%
5%
5%
3%
43%
70%
54%
59%
49%
24%
38%
32%
0% 10% 20% 30% 40% 50% 60% 70% 80% 90% 100%
I recognise how my feelings and emotions affect my performance
I am able to recognise situations that triggers my emotions
I am aware of the link between my feelings and what I think, do or say
I always know which emotions I am feeling and why
SELF AWARENESS
Strongly Disagree Disagree Neutral Agree Strongly Agree

Arabian Journal of Business and Management Review (Nigerian Chapter) , 201510Vol. 3, No.
110
Self-awareness is important to guide interactions among colleagues and establishing positive and productive teamwork (Luca and Tarricone, 2001:368). It is evident that interactions among IT team members are likely to be positive as majority are able to recognise and guide their emotions. Majority (97%) of the respondents are competent in this dimension as they have a score of 4 and above as shown in figure 4.5.1(b) below. Figure 4.5.1(b): Self-Awareness Scores Distribution
Self-Management This cluster of questions was intended to measure how competent the respondents are with the self-management dimension of emotional intelligence. Respondents were asked to indicate their level of agreement or disagreement with four statements as shown in figure 4.5.2(a) below: Figure 4.5.2(a): Self-Management
Figure 4.5.2(a) reveals that:
0%
10%
20%
30%
40%
50%
60%
HIGHLY INCOMPETENT (1)
INCOMPETENT (2) FAIR (3) COMPETENT (4) HIGHLY COMPETENT (5)
0% 0% 3%
51%46%
Self-Awareness
8%
5%
5%
3%
30%
16%
19%
24%
43%
62%
46%
54%
19%
16%
30%
19%
0% 10% 20% 30% 40% 50% 60% 70% 80% 90% 100%
When frustrated with fellow team members, I can overcome my frustration without reacting
I am able to remain calm, composed and positive in trying moments
I am able to resist the impulse to act immediately
I can manage my impulsive feelings and distressing emotions well
SELF MANAGEMENT
Strongly Disagree Disagree Neutral Agree Strongly Agree

Arabian Journal of Business and Management Review (Nigerian Chapter) , 201510Vol. 3, No.
111
Collectively 73% of the respondents agreed (54% agreed and 19% strongly agreed) that they can manage their impulsive feelings and distressing emotions well. The data shows that almost a quarter of the respondents (24%) were neutral and 3% of the respondents disagreed. Individuals who are competent in the self-management dimension of emotional intelligence are able to manage their impulsive feelings or emotions well (Kunnanatt, 2008:620; Moon, 2010:883).
Five percent (5%) of the respondents disagreed that they are able to resist the impulse to act immediately, 19% were neutral and 76% agreed (46% agreed and 30% strongly agreed). This shows that the majority of the respondents do not react to impulses, but rather take time to think before they react.
Collectively 62% (43% agreed and 19% strongly agreed) of the respondents are able to remain calm, composed and positive in trying moments. Over a quarter (30%) of the respondents responses was neutral and 8% of the respondents disagreed. According to Kunnanatt (2008:620) one of the signs of competence in self-management is the ability of an individual to remain calm, composed and positive during trying moments.
Collectively 92% of the respondents agreed (43% agreed and 49% strongly agreed) that when they are frustrated with fellow team members, they can overcome the frustration without reacting. Only 8% of the respondents were neutral and none disagreed. This shows that the working relationships among team members are likely to be positive. Luca and Tarricone (2001:369) states that being able to manage one’s emotions especially during conflict, pressure and stress promotes positive and effective working relationships with fellow team members.
Individuals who are competent in the Self-Management dimension are able to manage their emotions and impulses to remain calm in potentially volatile situations and maintain composure irrespective of the emotions they are experiencing (Polychroniou, 2009:345). The overall mean score for the self-management dimension was 3.88 as shown in table 4.5.2 below: Table 4.5.2:Self-Management Descriptive Statistics Mean Mode Min Max Standard
Deviation Skewness
Self-Management 3.88 4.00 2.25 5.00 0.63 -0.62 Table 4.5.2 above shows that individual scores ranging from 2.25 to 5. A standard deviation of 0.63 was observed indicating that scores of most participants are clustered around the mean score. Majority (87%) of the respondents are competent in this dimension as they have a score of 4 and above as shown in figure 4.5.2(b) below.

Arabian Journal of Business and Management Review (Nigerian Chapter) , 201510Vol. 3, No.
112
Figure 4.5.2(b): Self-Management Scores Distributions
Individuals with high levels of self-awareness are effective in stressful situations and are able to deal with hostile situations without reacting (Smit et al., 2007:307). Social-Awareness - Empathy This cluster of questions was intended to measure how competent the respondents are with the Empathy competency of the social-awareness dimension of emotional intelligence. Empathy is all about understanding and knowing other people’s feelings, needs and concerns (Moon, 2010:884). Respondents were asked to indicate their level of agreement or disagreement with four statements as shown in figure 4.5.3(a) below: Figure 4.5.3(a): Empathy
Figure 4.5.3(a) above shows that: Collectively 73% of the respondents agreed (43% agreed and 30% strongly agreed) that they are
sensitive to the feelings and emotions of others. Only 3% of the respondents disagreed, while 24% were neutral.
0%
10%
20%
30%
40%
50%
60%
70%
HIGHLY INCOMPETENT (1)
INCOMPETENT (2) FAIR (3) COMPETENT (4) HIGHLY COMPETENT (5)
0%5% 8%
65%
22%
Self-Management
8%
3%
27%
5%
8%
24%
51%
51%
62%
43%
14%
43%
30%
30%
0% 10% 20% 30% 40% 50% 60% 70% 80% 90% 100%
I try to understands the underlying causes for someone’s feelings, behaviour or concerns
I respect, treat with courtesy and relates well with people of diverse backgrounds
I make an effort to understand perspectives of others
I am sensitive to the feelings and emotions of others
SOCIAL AWARENESS: Empathy
Strongly Disagree Disagree Neutral Agree Strongly Agree

Arabian Journal of Business and Management Review (Nigerian Chapter) , 201510Vol. 3, No.
113
Collectively 92% of the respondents agreed (62% agreed and 30% strongly agreed) that they make an effort to understand perspectives of others. None of the respondents disagreed and 8% of the respondents were neutral. Goleman (cited in Luca and Tarricone, 2001:369) states that empathy also include being able to identify with the feelings of others by trying to understanding their perspective.
Collectively 94% of the respondents (51% agreed and 43% strongly agreed) agreed that they respect, treat with courtesy and relates well with people of diverse backgrounds. Goleman (cited in Luca and Tarricone, 2001:369) asserts that empathetic individuals cultivate rapport with people from different walks of life.
Collectively 65% of the respondents (51% agreed and 14% strongly agreed) make an effort to understand the underlying causes for someone’s feelings, behaviour or concerns. This creates an enabling environment to responds to other people’s emotions as suggested by Kunnanatt (2008:624). Only 8% of the respondents disagreed and 27% were neutral.
Individuals who are competent in the empathy aspect of the social awareness dimension understands the links between emotions of others and their behaviour and are able to provide emotional support to people when needed(Polychroniou, 2009:345). The overall mean score for the empathy aspect of the social awareness dimension was 4.07 as shown in table 4.5.3: Table 4.5.3: Empathy Descriptive Statistics Mean Mode Min Max Standard
Deviation Skewness
Empathy 4.07 4.00 3.00 5.00 0.49 -0.16 Table 4.5.3 above shows that individual scores are ranging from 3 to 5. A standard deviation of 0.49 was observed indicating that scores of most participants are clustered around the mean score. Majority (92%) of the respondents are competent in this dimension as they have a score of 4 and above as shown in figure 4.5.3(b) below. Figure 4.5.3(b): Empathy Scores Distribution
According to Luca and Tarricone (2001:369) empathic team members are aware of the diversity of personalities and are more accepting of the diversity of people and the impact culture can have on interactions within a team environment.
0%
10%
20%
30%
40%
50%
60%
70%
HIGHLY INCOMPETENT (1)
INCOMPETENT (2) FAIR (3) COMPETENT (4) HIGHLY COMPETENT (5)
0% 0%8%
68%
24%
Empathy

Arabian Journal of Business and Management Review (Nigerian Chapter) , 201510Vol. 3, No.
114
Social-Awareness – Service Orientation This cluster of questions was intended to measure how competent the respondents are with the service orientation competency of the social-awareness dimension of emotional intelligence. Service orientation is the ability to identify unstated needs and concerns of others (Moon, 2008:884). Respondents were asked to indicate their level of agreement or disagreement with four statements as shown in figure 4.5.4(a) below: Figure 4.5.4(a): Service Orientation
In Figure 4.5.4(a) above it is revealed that:
Collectively 84% of the respondents agreed (49% agreed and 35% strongly agreed) that they always try to address the unexpressed needs of the customer and 3% of the respondents disagreed while14% were neutral and.
Collectively 95% of the respondents agreed (46% agreed and 49% strongly agreed) that they act as a trusted advisor to a customer, while 5% of the respondents were neutral.
Collectively 94% of the respondents agreed (51% agreed and 43% strongly agreed) that they make an effort to understand the customer’s needs and match them with appropriate product or service. Only 5% of the respondents were neutral.
Collectively 92% of the respondents agreed (51% agreed and 41% strongly agreed) that they make an effort to see things from a customer’s perspective, 3% of the respondents disagreed, 5% were neutral.
Service orientation competency of the social awareness dimension is the ability to identify the client’s unstated needs because they don’t always articulate their needs effectively (Smit et al., 2007:307). An overwhelming majority of the respondents respondent favourably (Agree or strongly agree) to all statements. The overall mean score for the service orientation aspect of the social awareness dimension was 4.38 as shown in table 4.5.4 below: Table 4.5.4: Service Orientation Descriptive Statistics Mean Mode Min Max Standard
Deviation Skewness
Service Orientation 4.38 4.00 3.00 5.00 0.52 -0.24
3%
3%
5%
5%
5%
14%
51%
43%
46%
49%
41%
51%
49%
35%
0% 10% 20% 30% 40% 50% 60% 70% 80% 90% 100%
I make an effort to see things from a customer’s perspective
I make an effort to understand the customers’ needs and match them with an appropriate product or service
I act as a trusted advisor to a customer
I always try to address the unexpressed needs of the customer
SOCIAL AWARENESS: Service Orientation
Strongly Disagree Disagree Neutral Agree Strongly Agree

Arabian Journal of Business and Management Review (Nigerian Chapter) , 201510Vol. 3, No.
115
Table 4.5.4 above shows that individual scores are ranging from 3 to 5. A standard deviation of 0.52 was observed indicating that scores of most participants are clustered around the mean score. Majority (97 %) of the respondents are competent in this dimension as they have a score of 4 and above as shown in figure 4.5.4(b) below. Figure 4.5.4(b): Service Orientation Scores Distribution
Social-Awareness – Organisational Orientation This cluster of questions was intended to measure how competent the respondents are with the organisational awareness competency of the social-awareness dimension of emotional intelligence. Organisational orientation is the ability to read the current of emotions correctly, and understand political power relationships in groups (Goleman, cited in Moon, 2010:884). Respondents were asked to indicate their level of agreement or disagreement with four statements as shown in figure 4.5.5(a) below: Figure 4.5.5(a): Organisational Orientation
Figure 4.5.5(a) above reveals that:
0%
10%
20%
30%
40%
50%
60%
HIGHLY INCOMPETENT (1)
INCOMPETENT (2) FAIR (3) COMPETENT (4) HIGHLY COMPETENT (5)
0% 0% 3%
51%46%
Service Orientation
3%
3%3%
3%
24%
19%
27%
11%
57%
57%
54%
76%
19%
22%
14%
11%
0% 10% 20% 30% 40% 50% 60% 70% 80% 90% 100%
I can usually detect crucial social networks within the organisation
I am good at accurately reading key power relationships
I understand the political forces at work in the organisation
I have a good understanding of the forces that shape the views and actions of colleagues, customers and …
SOCIAL AWARENESS: Organisational Orientation
Strongly Disagree Disagree Neutral Agree Strongly Agree

Arabian Journal of Business and Management Review (Nigerian Chapter) , 201510Vol. 3, No.
116
Collectively 87% of the respondents agreed (76% agreed and 11% strongly agreed) that they have a good understanding of the forces that shape the views and actions of colleagues, customers and competitors. Only 3% of the respondents disagreed, 11% were neutral.
Collectively 68% of the respondents agreed (54% agreed and 14% strongly agreed) that they understand the political forces at work in the organisation. Only 6% of the respondents disagreed (3% disagreed and 3% strongly disagreed), 27% were neutral.
Collectively 79% of the respondents agreed (57% agreed and 22% strongly agreed) that they are good at accurately reading key power relationships. Only 3% of the respondents strongly disagreed, 19% were neutral.
Collectively 76% of the respondents agreed (57% agreed and 19% strongly agreed) that they can usually detect crucial social networks within the organisation. Only 24% of the respondents were neutral and
The overall mean score for the organisational orientation aspect of the social awareness dimension was 3.89 as shown in table 4.5.5 below: Table 1: Organisational Orientation Descriptive Statistics Mean Mode Min Max Standard
Deviation Skewness
Organisational Orientation 3.89 4.00 1.75 5.00 0.60 -1 Table 4.5.5 above shows that individual scores are ranging from 1.75 to 5. A standard deviation of 0.60 was observed indicating that scores of most participants are clustered around the mean score. Majority (81%) of the respondents are competent in this dimension as they have a score of 4 and above as shown in figure 4.5.5(b) below. Figure 4.5.5(b): Organisational Orientation Scores Distribution
Organisational awareness goes further than just the ability to understand the politics within an organisation or team; it includes the ability to understand they affect the people working in them. Individuals with high levels of organisational awareness are able to detect crucial social networks, power relationships, guiding values, political forces and organisational norms (Careerevolutiongroup.com, 2012). On the contrary, those with low levels of organisational awareness find it difficult to get things done in the organisation and often act in ways that the organisation, team or community find inappropriate.
0%
10%
20%
30%
40%
50%
60%
70%
HIGHLY INCOMPETENT (1)
INCOMPETENT (2) FAIR (3) COMPETENT (4) HIGHLY COMPETENT (5)
0% 3%
16%
65%
16%
Organisational Orientation

Arabian Journal of Business and Management Review (Nigerian Chapter) , 201510Vol. 3, No.
117
Relationship Management This cluster of questions was intended to measure how competent the respondents are with the relationship management dimension of emotional intelligence. Respondents were asked to indicate their level of agreement or disagreement with four statements as shown in figure 4.5.6(a) below: Figure 4.5.6(a): Relationship Management
Figure 4.5.6(a) above reveals that: Collectively 67% of the respondents agreed (51% agreed and 16% strongly agreed) that they are
able to cheer up team members when they are feeling down. Only 3% of the respondents disagreed, 30% were neutral.
Collectively 81% agreed (65% agreed and 16% strongly agreed) that they can balance a focus on task with attention to relationships. Only 19% of the respondents were neutral.
Collectively 73% of the respondents agreed (59% agreed and 14% strongly agreed) that they respect the opinion of team members even if they think they are wrong. Only 11% of the respondents disagreed (8% disagreed and 3% strongly disagreed) and 16% were neutral.
Collectively 76% of the respondents agreed (62% agreed and 14% strongly agreed) that they handle difficult people and tense situations in a diplomatic manner. Only 3% of the respondents strongly disagreed and 22% were neutral.
Relationship Management entails the ability to influence, guide, inspire and handle other people’s emotions while managing the conflict (de Miranda, 2011:14). It includes the identification, analysis, and management of relationships with people inside and outside of your team. It also incorporates an individual’s ability to communicate, persuade, and lead others, whilst being direct and honest without alienating people. Luca and Tarricone (2001:369) argue that relationship management skills are essential to develop of positive and effective relationships among colleagues. The overall mean score for the relationship management dimension was 3.84 as shown in table 4.5.6 below: Table 4.5.6: Relationship Management Descriptive Statistics Mean Mode Min Max Standard
Deviation Skewness
Relationship Management 3.84 4.00 2.75 5.00 0.52 0.18
3%
3%
8%
3%
22%
16%
19%
30%
62%
59%
65%
51%
14%
14%
16%
16%
0% 10% 20% 30% 40% 50% 60% 70% 80% 90% 100%
I handle difficult people and tense situations in a diplomatic manner
I respect the opinion of team members even if I think they are wrong
I balance a focus on task with attention to relationships
I am able to cheer up team members when they are feeling down
RELATIONSHIP MANAGEMENT
Strongly Disagree Disagree Neutral Agree Strongly Agree

Arabian Journal of Business and Management Review (Nigerian Chapter) , 201510Vol. 3, No.
118
Table 4.5.6 above shows that individual scores ranging from 2.75 to 5. A standard deviation of 0.52 was observed indicating that scores of most participants are clustered around the mean score. Majority (81%) of the respondents are competent in this dimension as they have a score of 4 and above as shown in figure 4.5.6(b) below. Figure 4.5.6(b): Relationship Management Scores Distribution
Team Effectiveness In this section responses to the questions on Part C of the research questionnaire which were aimed at evaluating the factors that affect Team Effectiveness. Part C of the questionnaire was made up of questions 12 – 20. Respondents were required to indicate their degree of agreement with a cluster of statements in each question. Each question was evaluating a different factor. Descriptive statistics were used to evaluate the factors which affect team effectiveness. A detailed frequency distribution table of scores for all factors is provided in Appendix E. All individual scores were rounded off to eliminate decimals in order to classify each participant’s score into a particular category. The following categories were used and are explained below in table 4.6 below: Table 4.6: Team Effectiveness Factors Score Categories Score Range Category
1 – 2.4 Disagree 2.5 – 3.4 Neutral 3.5 - 5 Agree
Analysis of the respondents answers and overall scores of each factor are discussed in the next sections (4.6.1 to 4.6.9). Common Purpose This cluster of questions was intended to evaluate the respondent’s opinions with regards to the common purpose in their team. Respondents were asked to indicate their level of agreement or disagreement with three statements as shown in figure 4.6.1(a) below:
0%10%20%30%40%50%60%70%
HIGHLY INCOMPETENT (1)
INCOMPETENT (2) FAIR (3) COMPETENT (4) HIGHLY COMPETENT (5)
0% 0%
19%
65%
16%
Relationship Management

Arabian Journal of Business and Management Review (Nigerian Chapter) , 201510Vol. 3, No.
119
Figure 4.6.1(a): Common Purpose
Figure 4.6.1(a) above reveals that:
Collectively 76% of the respondents agreed (46% agreed and 30% strongly agreed) that their team have a clear meaningful shared purpose. Only 3% of the respondents strongly disagreed, 22% were neutral.
Collectively 89% of the respondents agreed (54% agreed and 35% strongly agreed) that they understand their team's purpose. Only 11% of the respondents were neutral.
Collectively 76% of the respondents agreed (62% agreed and 14% strongly agreed) that there is a common sense of purpose in their team. Only 3% of the respondents strongly disagreed, 22% were neutral.
Common purpose gives a team a sense of direction (Stroh, 2005:435). Tiffan (2011:78) asserts that team members are often unable to accurately articulate the purpose of their team because they had no part in creating the purpose or it has not been regularly communicated. The overall mean score for this factor was 4.06 as shown in table 4.6.1 below: Table 4.6.1: Common Purpose Descriptive Statistics Score Mode Min Max Standard
Deviation Skewness
Common Purpose 4.06 4.00 2.00 5.00 0.73 -0.75 Table 4.6.1 above shows that individual scores from 2 to 5. A standard deviation of 0.73 was observed, indicating that scores of most participants are clustered around the mean score. Figure 4.6.1(b) below shows that majority (81%) of the respondents agree that there is a common sense of purpose in their team.
3%
3%
5% 11%
11%
22%
57%
54%
46%
24%
35%
30%
0% 10% 20% 30% 40% 50% 60% 70% 80% 90% 100%
There is a common sense of purpose in our team
I understand our team's purpose
Our team have a clear meaningful shared purpose
Common Purpose
Strongly Disagree Disagree Neutral Agree Strongly Agree

Arabian Journal of Business and Management Review (Nigerian Chapter) , 201510Vol. 3, No.
120
Figure 4.6.1(b): Common Purpose Scores Distribution
Clearly Defined Goals This cluster of questions was intended to evaluate the respondent’s opinions on whether goals are clearly defined in their teams. Respondents were asked to indicate their level of agreement or disagreement with three statements as shown in figure 4.6.2(a) below: Figure 4.6.2(a): Clearly Defined Goals
Figure 4.6.2(a) above reveals that:
Collectively 57% of the respondents agreed (41% agreed and 16% strongly agreed) that their team have clearly defined goals for this year. Only 16% of the respondents disagreed (11% disagreed and 5% strongly disagreed), 27% were neutral.
Collectively 59% of the respondents agreed (32% agreed and 27% strongly agreed) that members their team understand the team's goals. Only 10% of the respondents disagreed (5% disagreed and 5% strongly disagreed), 30% were neutral.
Collectively 62% of the respondents agreed (35% agreed and 27% strongly agreed) that they understand their team's goals for this year. Only 11% of the respondents disagreed (8% disagreed and 3% strongly disagreed), 27% were neutral.
According to Meredith Ross et al. (2008:252) clearly defined goals help the team members to be focused on the team’s objectives. Teams fail because their goals are not clearly defined (Millward et al., 2010:53). According to Khan et al. (2014:2), for a team to be effective its goals must be understood by all members.
0%
10%
20%
30%
40%
50%
60%
70%
80%
90%
DISAGREE NEUTRAL AGREE
3%
16%
81%
Common Purpose
3%
5%
5%
8%
5%
11%
27%
30%
27%
35%
32%
41%
27%
27%
16%
0% 10% 20% 30% 40% 50% 60% 70% 80% 90% 100%
I understand our team's goals for this year
Team members understand the team's goals
Our team have clearly defined goals for this year
Clearly Defined Goals
Strongly Disagree Disagree Neutral Agree Strongly Agree

Arabian Journal of Business and Management Review (Nigerian Chapter) , 201510Vol. 3, No.
121
The overall mean score for this factor was 3.66 as shown in table 4.6.2 below: Table 4.6.2: Clearly Defined Goals Descriptive Statistics Score Mode Min Max Standard
Deviation Skewness
Clearly Defined Goals 3.66 4.00 1.00 5.00 1.00 -0.61 Table 4.6.2 above shows that individual scores are ranging from 1 to 5. A standard deviation of 1 was observed, indicating that scores of most participants are clustered around the mean score. Figure 4.6.2(a) below shows that majority (57%) of the respondents agree that goals are clearly defined and understood by members in their team. Figure 4.6.2(b): Clearly Defined Goals Scores Distribution
Accountable Interdependence This cluster of questions was intended to evaluate the respondent’s opinions on whether accountable interdependence is prevalent in their team. Respondents were asked to indicate their level of agreement or disagreement with four statements as shown in figure 4.6.3(a) below: Figure 4.6.3(a): Accountable Interdependence
Figure 4.6.3(a) above reveals that:
0%
10%
20%
30%
40%
50%
60%
DISAGREE NEUTRAL AGREE
11%
32%
57%
Clearly Defined Goals
3%11%
3%
16%
16%
16%
16%
27%
27%
51%
49%
46%
46%
19%
32%
11%
11%
0% 10% 20% 30% 40% 50% 60% 70% 80% 90% 100%
Team members seek and give each other constructive feedback
Team members help one another deal with problems or resolve issues
Team members are all held accountable for the collective task performance
Team members are all held accountable by the team for performing their tasks
ACCOUNTABLE INTERDEPENDENCE
Strongly Disagree Disagree Neutral Agree Strongly Agree

Arabian Journal of Business and Management Review (Nigerian Chapter) , 201510Vol. 3, No.
122
Collectively 57% of the respondents agreed (46% agreed and 11% strongly agreed) that team members are all held accountable by the team for performing their tasks. Only 16% of the respondents disagreed, 27% were neutral.
Collectively 57% of the respondents agreed (46% agreed and 11% strongly agreed) that team members are all held accountable for the collective task performance. Only 16% of the respondents disagreed, 27% were neutral.
Collectively 81% of the respondents agreed (49% agreed and 32% strongly agreed) that team members help one another deal with problems or resolve issues. Only 3% of the respondents disagreed, 16% were neutral.
Collectively 70% of the respondents agreed (51% agreed and 19% strongly agreed) that team members seek and give each other constructive feedback. Only 14% of the respondents disagreed (11% disagreed and 3% strongly disagreed), 16% were neutral.
According to Brown (2011:281) in a team, members performs tasks which are interdependent and depend on each other to accomplish a common purpose or set of performance goals for which they hold themselves mutually accountable. Meredith et al., (2008:252) highlights that each team member must be held accountable for the output of the team. The overall mean score for this factor was 3.72 as shown in table 4.6.3 below: Table 4.6.3: Accountable Interdependence Descriptive Statistics Score Mode Min Max Standard
Deviation Skewness
Accountable Interdependence
3.72 4.00 1.00 5.00 0.93 -0.51
Table 4.6.3 above shows that individual scores are ranging from 1 to 5. A standard deviation of 0.93 was observed indicating that scores of most participants are clustered around the mean score. Figure 4.6.3(b) below shows that majority (76%) of the respondents agree that goals are clearly defined and understood by members in their team. Figure 4.6.3(b): Accountable Interdependence Scores Distribution
Role Clarity This cluster of questions was intended to evaluate the respondent’s opinions on whether the roles of team members are clarified in their team. Respondents were asked to indicate their level of agreement or disagreement with four statements as shown in figure 4.6.4(a) below:
0%10%20%30%40%50%60%70%80%
DISAGREE NEUTRAL AGREE
3%
22%
76%
Accountable Interdependence

Arabian Journal of Business and Management Review (Nigerian Chapter) , 201510Vol. 3, No.
123
Figure 4.6.4(a): Role Clarity
Figure 4.6.4(a) above reveals that:
Collectively 78% of the respondents agreed (54% agreed and 24% strongly agreed) that the roles of team members are clearly defined. Only 6% of the respondents disagreed (3% disagreed and 3% strongly disagreed), 16% were neutral. According to Adams et al. (2002:4) when the roles of team members clear, misunderstandings about task assignments are minimal.
Collectively 70% of the respondents agreed (43% agreed and 27% strongly agreed) that team members clearly understand their roles. Only 10% of the respondents disagreed (5% disagreed and 5% strongly disagreed), 19% were neutral. According to Michan and Rodger (2000:203) each individual’s roles within the team need to be clarified and understood by all members.
Collectively 68% of the respondents agreed (49% agreed and 19% strongly agreed) that team members understand one another's roles. Only 17% of the respondents disagreed (14% disagreed and 3% strongly disagreed), 16% were neutral. According to Meredith Ross et al. (2008:252) team members need to have a common understanding of each member’s role in the team to avoid misunderstandings among members.
Collectively 62% of the respondents agreed (46% agreed and 16% strongly agreed) that when a team member's role changes, effort is made to clarify it for everyone in the team. Only 13% of the respondents disagreed (8% disagreed and 5% strongly disagreed), 24% were neutral.
The overall mean score for this factor was 3.76 as shown in table 4.6.4 below: Table 4.6.4: Role Clarity Descriptive Statistics Score Mode Min Max Standard
Deviation Skewness
Role Clarity 3.76 4.00 1.50 5.00 0.84 -0.84 Table 4.6.4 above shows that individual scores are ranging from 1.5 to 5. A standard deviation of 0.84 was observed indicating that scores of most participants are clustered around the mean score. Figure 4.6.4(b) below shows that the majority (76%) of the respondents agrees that roles are clearly defined and understood by members in their team.
5%
3%
5%
3%
8%
14%
5%
3%
24%
16%
19%
16%
46%
49%
43%
54%
16%
19%
27%
24%
0% 10% 20% 30% 40% 50% 60% 70% 80% 90% 100%
When a team member's role changes, effort is made to clarify it for everyone in the team
Team members understand one another's roles
Team members clearly understand their roles
The roles of team members are clearly defined
ROLE CLARITY
Strongly Disagree Disagree Neutral Agree Strongly Agree

Arabian Journal of Business and Management Review (Nigerian Chapter) , 201510Vol. 3, No.
124
Figure 4.6.4(b): Role Clarity Scores Distribution
Team Cohesion This cluster of questions was intended to evaluate the respondent’s opinions on whether there is cohesion in their team. Respondents were asked to indicate their level of agreement or disagreement with four statements as shown in figure 4.6.5(a) below: Figure 4.6.5(a): Team Cohesion
Figure 4.6.5(a) above reveals that:
Collectively 78% of the respondents agreed (62% agreed and 16% strongly agreed) that working in their team inspires team members to do their best. Only 5% of the respondents disagreed, 16% were neutral.
Collectively 48% of the respondents agreed (32% agreed and 16% strongly agreed) that team members consider how their actions will impact others when deciding what to do. Only 21% of the respondents disagreed (16% disagreed and 5% strongly disagreed), 30% were neutral.
Collectively 81% of the respondents agreed (57% agreed and 24% strongly agreed) that working relationships in their team are positive, open and cooperative. Only 8% of the respondents disagreed (5% disagreed and 3% strongly disagreed), 11% were neutral.
0%
10%
20%
30%
40%
50%
60%
70%
DISAGREE NEUTRAL AGREE
8%
24%
68%
Role Clarity
5%
3%
5%
3%
5%
16%
5%
30%
11%
30%
16%
41%
57%
32%
62%
22%
24%
16%
16%
0% 10% 20% 30% 40% 50% 60% 70% 80% 90% 100%
We present a single message to people outside the team
Working relationships in our team are positive, open and cooperative
Team members consider how their actions will impact others when deciding what to do
Working in our team inspires team members to do their best
TEAM COHESION
Strongly Disagree Disagree Neutral Agree Strongly Agree

Arabian Journal of Business and Management Review (Nigerian Chapter) , 201510Vol. 3, No.
125
Collectively 63% of the respondents agreed (41% agreed and 22% strongly agreed) that we present a single message to people outside the team. Only 8% of the respondents disagreed (3% disagreed and 5% strongly disagreed), 30% were neutral.
The overall mean score for this factor was 3.76 as shown in table 4.6.5 below: Table 4.6.5: Team Cohesion Descriptive Statistics Score Mode Min Max Standard
Deviation Skewness
Team Cohesion 3.73 3.50 2.00 5.00 0.73 -0.63 Table 4.6.5 above shows that individual scores are ranging from 2 to 5. A standard deviation of 0.84 was observed indicating that scores of most participants are clustered around the mean score. Figure 4.6.5(b) below shows that the majority (78%) of the respondents agrees that roles are clearly defined and understood by members in their team. Figure 4.6.5(b): Team Cohesion Scores Distribution
According to Lussier et al. (2008:375-376) cohesive teams are more successful in achieving their objectives compared to the non-cohesive ones. The majority (78%) of the respondents believes that their teams are cohesive. van Woerkom and Sanders (2009:141) highlights that in cohesive teams, (1) members rarely miss work, (2) members are more trusting and cooperative and (3) less tension and hostility prevails in the team. Communication This cluster of questions was intended to evaluate the respondent’s opinions on the level of communication in their team. Respondents were asked to indicate their level of agreement or disagreement with four statements as shown in figure 4.6.6(a) below:
0%
20%
40%
60%
80%
DISAGREE NEUTRAL AGREE
8% 14%
78%
Team Cohesion
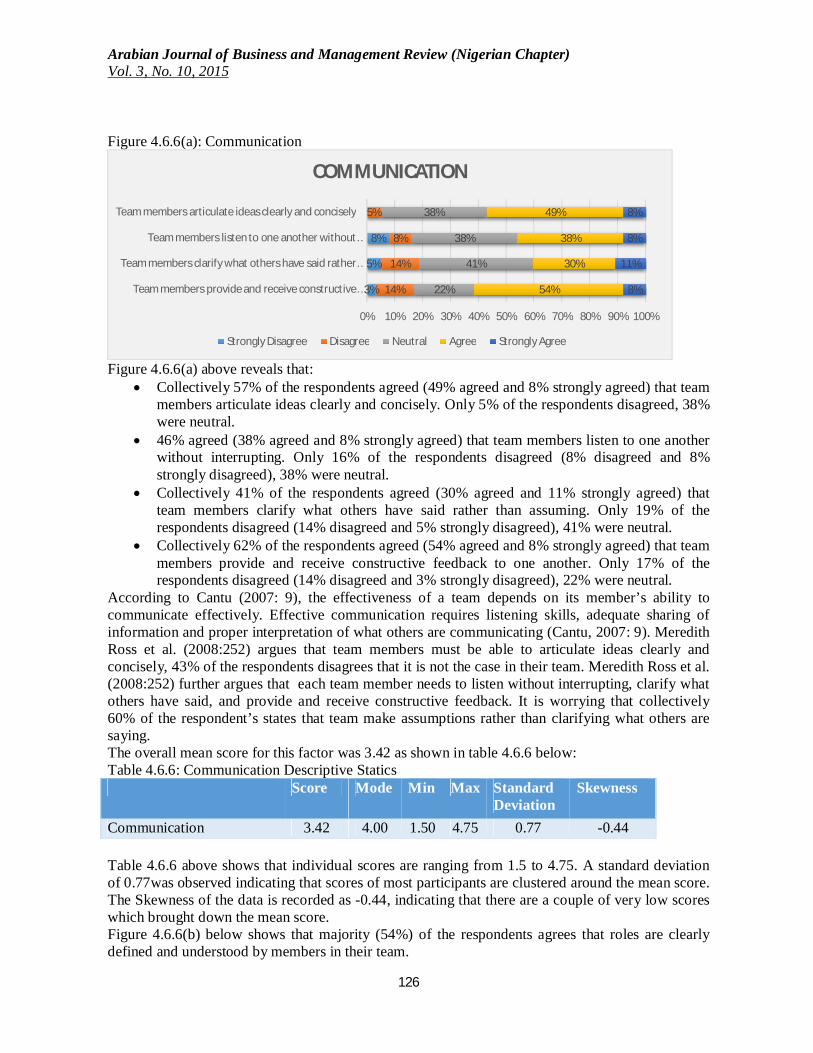
Arabian Journal of Business and Management Review (Nigerian Chapter) , 201510Vol. 3, No.
126
Figure 4.6.6(a): Communication
Figure 4.6.6(a) above reveals that:
Collectively 57% of the respondents agreed (49% agreed and 8% strongly agreed) that team members articulate ideas clearly and concisely. Only 5% of the respondents disagreed, 38% were neutral.
46% agreed (38% agreed and 8% strongly agreed) that team members listen to one another without interrupting. Only 16% of the respondents disagreed (8% disagreed and 8% strongly disagreed), 38% were neutral.
Collectively 41% of the respondents agreed (30% agreed and 11% strongly agreed) that team members clarify what others have said rather than assuming. Only 19% of the respondents disagreed (14% disagreed and 5% strongly disagreed), 41% were neutral.
Collectively 62% of the respondents agreed (54% agreed and 8% strongly agreed) that team members provide and receive constructive feedback to one another. Only 17% of the respondents disagreed (14% disagreed and 3% strongly disagreed), 22% were neutral.
According to Cantu (2007: 9), the effectiveness of a team depends on its member’s ability to communicate effectively. Effective communication requires listening skills, adequate sharing of information and proper interpretation of what others are communicating (Cantu, 2007: 9). Meredith Ross et al. (2008:252) argues that team members must be able to articulate ideas clearly and concisely, 43% of the respondents disagrees that it is not the case in their team. Meredith Ross et al. (2008:252) further argues that each team member needs to listen without interrupting, clarify what others have said, and provide and receive constructive feedback. It is worrying that collectively 60% of the respondent’s states that team make assumptions rather than clarifying what others are saying. The overall mean score for this factor was 3.42 as shown in table 4.6.6 below: Table 4.6.6: Communication Descriptive Statics Score Mode Min Max Standard
Deviation Skewness
Communication 3.42 4.00 1.50 4.75 0.77 -0.44 Table 4.6.6 above shows that individual scores are ranging from 1.5 to 4.75. A standard deviation of 0.77was observed indicating that scores of most participants are clustered around the mean score. The Skewness of the data is recorded as -0.44, indicating that there are a couple of very low scores which brought down the mean score. Figure 4.6.6(b) below shows that majority (54%) of the respondents agrees that roles are clearly defined and understood by members in their team.
3%
5%
8%
14%
14%
8%
5%
22%
41%
38%
38%
54%
30%
38%
49%
8%
11%
8%
8%
0% 10% 20% 30% 40% 50% 60% 70% 80% 90% 100%
Team members provide and receive constructive …
Team members clarify what others have said rather …
Team members listen to one another without …
Team members articulate ideas clearly and concisely
COMMUNICATION
Strongly Disagree Disagree Neutral Agree Strongly Agree
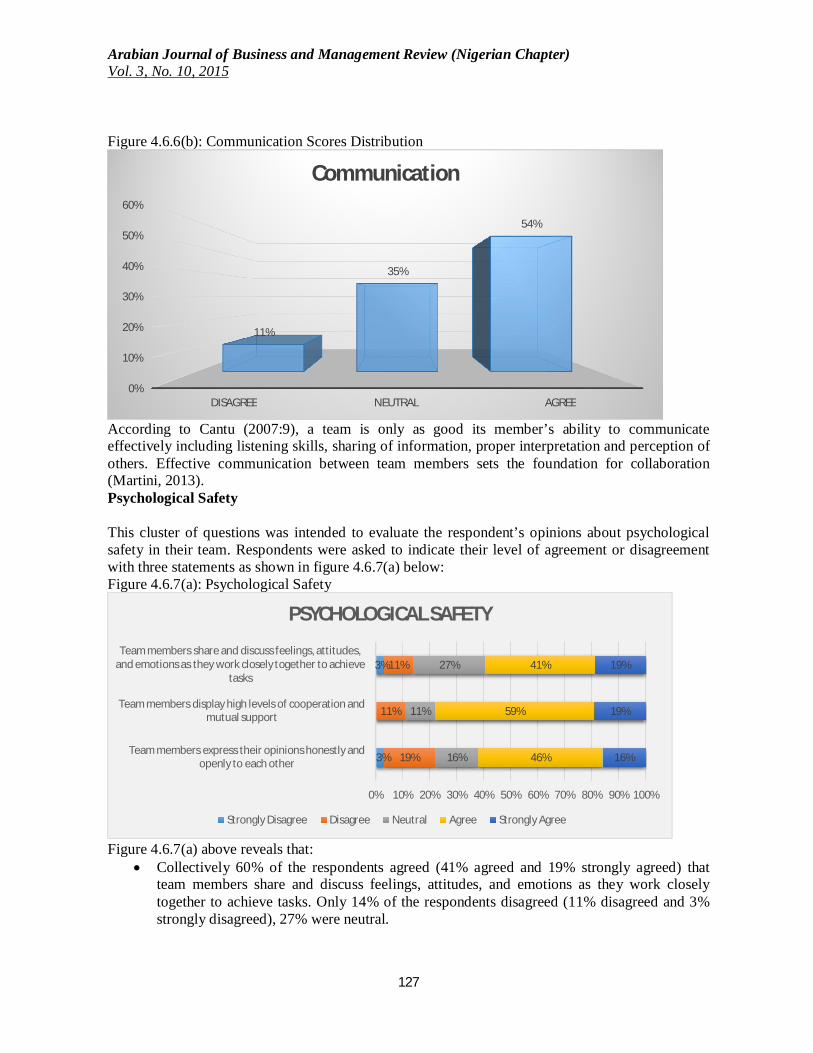
Arabian Journal of Business and Management Review (Nigerian Chapter) , 201510Vol. 3, No.
127
Figure 4.6.6(b): Communication Scores Distribution
According to Cantu (2007:9), a team is only as good its member’s ability to communicate effectively including listening skills, sharing of information, proper interpretation and perception of others. Effective communication between team members sets the foundation for collaboration (Martini, 2013). Psychological Safety This cluster of questions was intended to evaluate the respondent’s opinions about psychological safety in their team. Respondents were asked to indicate their level of agreement or disagreement with three statements as shown in figure 4.6.7(a) below: Figure 4.6.7(a): Psychological Safety
Figure 4.6.7(a) above reveals that:
Collectively 60% of the respondents agreed (41% agreed and 19% strongly agreed) that team members share and discuss feelings, attitudes, and emotions as they work closely together to achieve tasks. Only 14% of the respondents disagreed (11% disagreed and 3% strongly disagreed), 27% were neutral.
0%
10%
20%
30%
40%
50%
60%
DISAGREE NEUTRAL AGREE
11%
35%
54%
Communication
3%
3%
19%
11%
11%
16%
11%
27%
46%
59%
41%
16%
19%
19%
0% 10% 20% 30% 40% 50% 60% 70% 80% 90% 100%
Team members express their opinions honestly and openly to each other
Team members display high levels of cooperation and mutual support
Team members share and discuss feelings, attitudes, and emotions as they work closely together to achieve
tasks
PSYCHOLOGICAL SAFETY
Strongly Disagree Disagree Neutral Agree Strongly Agree

Arabian Journal of Business and Management Review (Nigerian Chapter) , 201510Vol. 3, No.
128
Collectively 78% of the respondents agreed (59% agreed and 19% strongly agreed) that team members display high levels of cooperation and mutual support. Only 11% of the respondents disagreed, 11% were neutral.
Collectively 62% of the respondents agreed (46% agreed and 16% strongly agreed) that team members express their opinions honestly and openly to each other. Only 22% of the respondents disagreed (19% disagreed and 3% strongly disagreed), 16% were neutral.
Edmondson (cited in Boon, Raes, Kyndt and Dochy, 2013: 362) asserts that when psychological safety is present in a team, members are free to seek feedback, ask questions and discuss decisions. On the contrary Kayes, Kayes and Kolb (cited in Boon et al, 2013: 362) states that the absence of psychological safety in a team leads ineffective communication and more conflict. The overall mean score for this factor was 3.67 as shown in table 4.6.7 below: Table 4.6.7: Psychological Safety Descriptive Statistics Score Mode Min Max Standard
Deviation Skewness
Psychological Safety 3.67 4.00 1.67 5.00 0.87 -0.32 Table 4.5.1 above shows that individual scores are ranging from 1.67 to 5. A standard deviation of 0.87 was observed indicating that scores of most participants are clustered around the mean score. Figure 4.6.7(b) below shows that the majority (78%) of the respondents agrees that roles are clearly defined and understood by members in their team. Figure 4.6.7(b): Communication Scores Distribution
Psychological safety within a team creates a climate characterised by interpersonal trust and mutual respect in which people are comfortable being themselves (Meredith Ross et al, 2008:252). Trust This cluster of questions was intended to evaluate the respondent’s opinions on trust in their teams. Respondents were asked to indicate their level of agreement or disagreement with two statements as shown in figure 4.6.8(a) below:
0%
10%
20%
30%
40%
50%
60%
70%
DISAGREE NEUTRAL AGREE
14%22%
65%
Psychological Safety

Arabian Journal of Business and Management Review (Nigerian Chapter) , 201510Vol. 3, No.
129
Figure 4.6.8(a): Trust
Figure 4.6.8(a) above reveals that:
Collectively 68% of the respondents agreed (38% agreed and 30% strongly agreed) that members of their team trust each other. Only 8% of the respondents disagreed, 24% were neutral. Knoll and Gill (2011:315) asserts that when team members trust each other, they feel safe and positive, which subsequently leads to higher job satisfaction. The majority of the respondents agree that team members trust each other; this indicates that overall majority of respondents experience job satisfaction.
Collectively 57% of the respondents agreed (35% agreed and 22% strongly agreed) that their team has established trust relationships with other teams. Only 11% of the respondents disagreed, 32% were neutral.
In a team environment, tasks are interdependent (West and Richardson, 2011:140). Team members are likely to be satisfied with the interdependent nature of tasks in a team environment if they trust each other (DeOrtentiis et al., 2013:537). Robbins and Judge (2012:151) assert that members of effective teams trust each other. Trust brings the confidence among team members that the intentions of all members are good (DeOrtentiis et al., 2013:52). According to Edmondson (cited in Boon et al., 2013: 362) when team members trust each other, psychological safety increases in the team. The overall mean score for this factor was 3.79 as shown in table 4.6.8 below: Table 4.6.8: Trust Descriptive Statistics Score Mode Min Max Standard
Deviation Skewness
Trust 3.79 4.00 2.00 5.00 0.86 -0.28 Table 4.6.8 above shows that individual scores are scores ranging from 2 to 5. A standard deviation of 0.86 was observed indicating that scores of most participants are clustered around the mean score. Figure 4.6.8(b) below shows that the majority (78%) of the respondents agrees that roles are clearly defined and understood by members in their team.
11%
8%
32%
24%
35%
38%
22%
30%
0% 10% 20% 30% 40% 50% 60% 70% 80% 90% 100%
Our team has established trust relationships with other teams
Members of our team trust each other
TRUST
Strongly Disagree Disagree Neutral Agree Strongly Agree
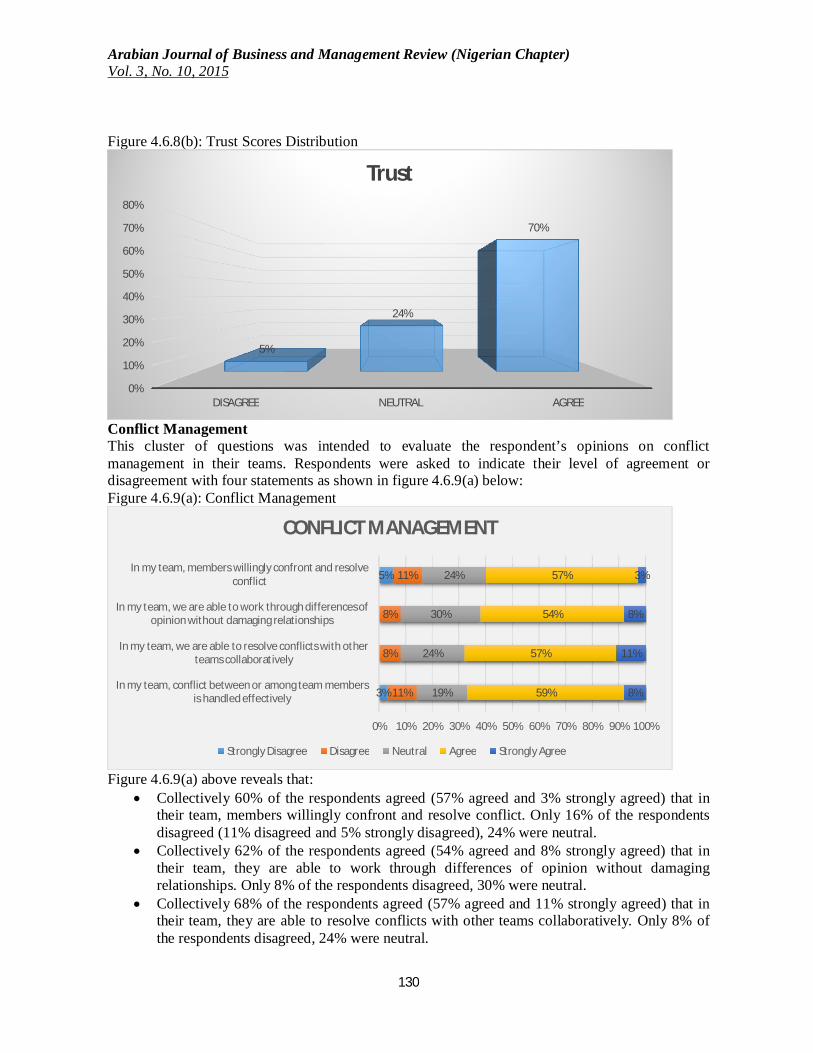
Arabian Journal of Business and Management Review (Nigerian Chapter) , 201510Vol. 3, No.
130
Figure 4.6.8(b): Trust Scores Distribution
Conflict Management This cluster of questions was intended to evaluate the respondent’s opinions on conflict management in their teams. Respondents were asked to indicate their level of agreement or disagreement with four statements as shown in figure 4.6.9(a) below: Figure 4.6.9(a): Conflict Management
Figure 4.6.9(a) above reveals that:
Collectively 60% of the respondents agreed (57% agreed and 3% strongly agreed) that in their team, members willingly confront and resolve conflict. Only 16% of the respondents disagreed (11% disagreed and 5% strongly disagreed), 24% were neutral.
Collectively 62% of the respondents agreed (54% agreed and 8% strongly agreed) that in their team, they are able to work through differences of opinion without damaging relationships. Only 8% of the respondents disagreed, 30% were neutral.
Collectively 68% of the respondents agreed (57% agreed and 11% strongly agreed) that in their team, they are able to resolve conflicts with other teams collaboratively. Only 8% of the respondents disagreed, 24% were neutral.
0%
10%
20%
30%
40%
50%
60%
70%
80%
DISAGREE NEUTRAL AGREE
5%
24%
70%
Trust
3%
5%
11%
8%
8%
11%
19%
24%
30%
24%
59%
57%
54%
57%
8%
11%
8%
3%
0% 10% 20% 30% 40% 50% 60% 70% 80% 90% 100%
In my team, conflict between or among team members is handled effectively
In my team, we are able to resolve conflicts with other teams collaboratively
In my team, we are able to work through differences of opinion without damaging relationships
In my team, members willingly confront and resolve conflict
CONFLICT MANAGEMENT
Strongly Disagree Disagree Neutral Agree Strongly Agree
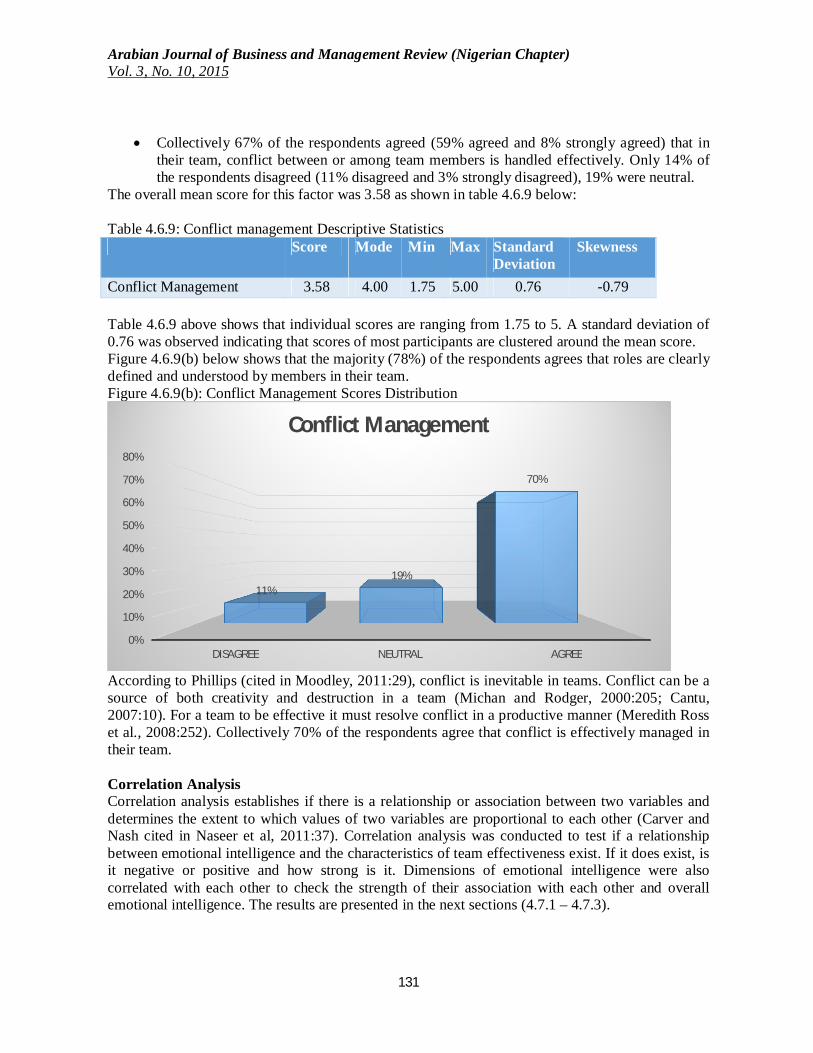
Arabian Journal of Business and Management Review (Nigerian Chapter) , 201510Vol. 3, No.
131
Collectively 67% of the respondents agreed (59% agreed and 8% strongly agreed) that in their team, conflict between or among team members is handled effectively. Only 14% of the respondents disagreed (11% disagreed and 3% strongly disagreed), 19% were neutral.
The overall mean score for this factor was 3.58 as shown in table 4.6.9 below: Table 4.6.9: Conflict management Descriptive Statistics Score Mode Min Max Standard
Deviation Skewness
Conflict Management 3.58 4.00 1.75 5.00 0.76 -0.79 Table 4.6.9 above shows that individual scores are ranging from 1.75 to 5. A standard deviation of 0.76 was observed indicating that scores of most participants are clustered around the mean score. Figure 4.6.9(b) below shows that the majority (78%) of the respondents agrees that roles are clearly defined and understood by members in their team. Figure 4.6.9(b): Conflict Management Scores Distribution
According to Phillips (cited in Moodley, 2011:29), conflict is inevitable in teams. Conflict can be a source of both creativity and destruction in a team (Michan and Rodger, 2000:205; Cantu, 2007:10). For a team to be effective it must resolve conflict in a productive manner (Meredith Ross et al., 2008:252). Collectively 70% of the respondents agree that conflict is effectively managed in their team.
Correlation Analysis Correlation analysis establishes if there is a relationship or association between two variables and determines the extent to which values of two variables are proportional to each other (Carver and Nash cited in Naseer et al, 2011:37). Correlation analysis was conducted to test if a relationship between emotional intelligence and the characteristics of team effectiveness exist. If it does exist, is it negative or positive and how strong is it. Dimensions of emotional intelligence were also correlated with each other to check the strength of their association with each other and overall emotional intelligence. The results are presented in the next sections (4.7.1 – 4.7.3).
0%
10%
20%
30%
40%
50%
60%
70%
80%
DISAGREE NEUTRAL AGREE
11%19%
70%
Conflict Management

Arabian Journal of Business and Management Review (Nigerian Chapter) , 201510Vol. 3, No.
132
Inter-correlation between Emotional Intelligence Dimensions A Pearson correlation coefficient was computed to assess the relationship between emotional intelligence and all its dimensions. Table 4.7.1 below presents the correlation matrix of emotional intelligence and its dimensions. Table 4.7.1: Inter-correlation between Emotional Intelligence Dimensions SA SM SAE SASO SAOO SOA RM EI
SA 1 0.2 0.3 0.1 0.03 0.2 0.3 0.5* SM 0.2 1 0.4* 0.3 0.01 0.3 0.3 0.6* SAE 0.3 0.4* 1 0.5* 0.3 0.7* 0.3 0.7*
SASO 0.1 0.3 0.5* 1 0.3 0.8* 0.3 0.7* SAOO 0.03 0.01 0.3 0.3 1 0.8* 0.5* 0.6* SOA 0.2 0.3 0.7* 0.8* 0.8* 1 0.5* 0.9* RM 0.3 0.3 0.3* 0.3 0.5* 0.5* 1 0.7* EI 0.5* 0.6* 0.7* 0.7* 0.6* 0.9* 0.7* 1
* p < 0.05 Table 4.7.1 presented above shows:
The empathy (r = 0.7), service orientation (r = 0.7), social awareness (0.9) and relationship management (r = 0.7) dimensions are strongly correlated with emotional intelligence. This indicates that a strong positive relationship between emotional intelligence and these dimensions exists. This means that an increase in empathy, service orientation, social awareness and relationship management competence will significantly increase an individual’s overall emotional intelligence.
The self-awareness (r = 0.5), self-management (r= 0.6) and organisational orientation (r = 0.6) dimensions are moderately correlated with emotional intelligence. This indicates that a moderate positive relationship between emotional intelligence and these dimensions exists. This means that an increase in these competencies will moderately increase an individual’s overall emotional intelligence.
The empathy (r = 0.7), service orientation (r= 0.8) and organisational orientation (r = 0.8) competencies are strongly correlated with Social-Awareness dimension. This indicates that a strong positive relationship between the social awareness dimension and these dimensions competencies. This means that an increase in these competencies will significantly increase an individual’s overall social awareness competence.
Inter-correlation between Team Effectiveness Characteristics A Pearson correlation coefficient was computed to assess the relationship between emotional intelligence and all its dimensions. Table 4.7.2 below presents the correlation matrix of factors that affect team effectiveness. Table 4.7.2: Inter-correlation between Team Effectiveness Characteristics PUR CDG AI RC TC COM PS TRU CM
PUR 1 0.5 0.5 0.6 0.8 0.4 0.6 0.7 0.4 CDG 0.5 1 0.6 0.6 0.8 0.7 0.6 0.6 0.6
AI 0.5 0.6 1 0.5 0.7 0.7 0.8 0.7 0.7 RC 0.6 0.6 0.5 1 0.7 0.5 0.6 0.6 0.5 TC 0.8 0.8 0.7 0.7 1 0.6 0.7 0.7 0.7
COM 0.4 0.7 0.7 0.5 0.6 1 0.7 0.6 0.7

Arabian Journal of Business and Management Review (Nigerian Chapter) , 201510Vol. 3, No.
133
PS 0.6 0.6 0.8 0.6 0.7 0.7 1 0.8 0.8 TRU 0.7 0.6 0.7 0.6 0.7 0.6 0.8 1 0.7 CM 0.4 0.6 0.7 0.5 0.7 0.7 0.8 0.7 1
From table 4.7.2 above, the following can be seen:
Team cohesion is strongly correlated with Common Purpose (r = 0.8), Clearly Defined Goals (r = 0.8), Accountable Interdependence (r = 0.7), Psychological Safety (r = 0.7) and Conflict Management (r = 0.7). This indicates that a strong positive relationship between team cohesion and these factors. This means that team cohesion will be significantly increased if :
o The common purpose of the team is understood by members o The goals of the team are clearly defined and understood by all members o Team members work interdependently and are collectively held accountable o Roles of each member is clarified and understood by all o Conflict is resolved timeously and effectively o A climate of psychological safety prevails in the team
Communication is strongly correlated with Clearly Defined Goals (r = 0.7), Accountable Interdependence (r = 0.7), Psychological Safety (r = 0.7) and Conflict Management (r = 0.7). This indicates that a strong positive relationship between effective communication and these factors. This means that effective communication will lead to :
o A significant increase in the understanding of team goals by members o A significant drop in conflict among members o Members being free to voice opinions without fear of being punished.
Trust is strongly correlated with Common Purpose (r = 0.8), Accountable Interdependence (r = 0.7), Psychological safety (r = 0.8) and Conflict Management (r = 0.7). This indicates that a strong positive relationship between trust and these factors. This means that when more team members trust each other it will lead to :
o Team members being more willing to work interdependently o A significant increase in the level of psychological safety in the team o Conflict will be resolved constructively.
Correlation between Emotional Intelligence Dimensions and Team Effectiveness Characteristics A Pearson correlation coefficient was computed to assess the relationship between emotional intelligence and the factors that influences team effectiveness. Table 4.7.3 below presents the correlation matrix of emotional intelligence and the factors that affect team effectiveness. Table 4.7.3: EI Dimensions and TE characteristics Correlations PUR CDG AI RC TC COM PS TRU CM SA 0.1 -0.1 0.1 0.1 0 -0.1 0.2 -0.03 0.1 SM 0.1 0.1 0.1 -0.04 0.2 -0.01 0.3 0.2 0.3 SAE 0.2 0.2 0.2 0.2 0.2 -0.04 0.3 0.2 0.3 SASO -0.1 -0.2 -0.1 0.03 -0.1 -0.1 0 0.03 -0.02 SAOO -0.04 0.1 0.2 0.1 -0.1 0.1 -0.02 0.2 0.1 SOA 0.02 0.04 0.2 0.2 0.03 -0.02 0.1 0.2 0.1 RM -0.3 -0.1 0.1 -0.1 -0.3 -0.1 -0.1 -0.2 0.1 EI -0.02 0.02 0.18 0.1 -0.01 -0.06 0.2 0.1 0.2

Arabian Journal of Business and Management Review (Nigerian Chapter) , 201510Vol. 3, No.
134
Table 4.6.3 shows that no meaningful correlations were found between emotional intelligence and any of the team effectiveness characteristics. This indicates that and increase or decrease in an individual’s emotional intelligence level will not influence their opinion of whether the factors that influences team effectiveness are prevalent in their team. Only four weak positive correlations were found between, Self-management and psychological safety (r = 0.3), Self-management and conflict management (r = 0.3), Empathy and psychological safety (r = 0.3), Empathy and conflict management (r = 0.3). The influence of these variables on each is very weak; this indicates that an n increase or drop in any will have a negligible change in the other. Conclusion In this chapter the analysis of the primary data collected from the research participants is presented. Figures and tables were used to present the analysis and responses. The analysis shows that majority of the participants have high levels of emotional intelligence. Average scores for the characteristics of team effectiveness were observed. The analysis did not show any evidence of a significant relationship between emotional intelligence and team effectiveness. CONCLUSIONS AND RECOMMENDATIONS Findings from the study The findings of the study address the objectives and research questions of the study. These findings are presented in two parts; findings from the literature review and the primary study are discussed under sections 5.3.1 and 5.3.2 respectively. Findings from the Literature Review Extensive review of relevant literature was conducted to establish:
The factors that affects team effectiveness The dimensions of emotional intelligence The impact of emotional intelligence on team effectiveness
These identified elements will be discussed in more detail below; Teams Technological and structural changes in the market environment and organisations have brought about a shift from individual responsibilities to collective responsibilities which necessitate the use of team (Ghosh et al, 2012:603). In a team environment employees do not work in an isolated and sequential fashion, they work interdependently and in parallel with one another, allowing for a more efficient and timely outcome (Cohen and Bailey, cited in West et al., 2011:136). Teams enable organisations to develop and deliver products and services in a speedy and cost effective manner (Cohen and Bailey cited in West et al., 2011:136). Team Effectiveness Team effectiveness goes beyond just meeting the customer’s expectations, it also involves the team’s ability to work together effectively in the future (Stubbs Koman and Wolff, 2008:56). Stubbs Koman and Wolff (2008:56) argues that while productivity and customer satisfaction are key for the organisation’s success, they should not be pursued at the expense of the wellbeing of the team and its members, and vice versa. Effective teams have a common purpose and shared vision which guides what they must achieve (West and Richardson, 2011:147).A Team’s common purpose is the main objective of the team

Arabian Journal of Business and Management Review (Nigerian Chapter) , 201510Vol. 3, No.
135
(Meredith Ross et al., 2008:252). Clear team objectives ensure that team member’s works toward the same goal in a collaborative manner (West and Richardson, 2011:147). Many teams fail because they do not have clear goals (Millward et al., 2010:53).Team goals must be clear, understood and communicated to all members (Khan et al., 2014:2). Unclear goals are detrimental to the team’s performance. Interdependence of tasks is a key feature of a team. It is important for all team members to have a common understanding of each member’s role in the team (Meredith Ross et al., 2008:252). Clearly defined goals help team members to realise their interdependence (West and Richardson, 2011:147). Accountable interdependence among team members generates a shared sense of security in a team (Adams et al., 2002). Team cohesion is a critical attribute of a team (McLeod and von Treuer, 2013:1).Cohesive teams are more successful in achieving their objectives compared to the non-cohesive ones(Lussier et al., 2008:375-376).Effective communication between team members sets the foundation for collaboration which is key for the team to be effective (Martini, 2013). Psychological safety within a team creates a climate characterised by interpersonal trust and mutual respect in which people are comfortable being themselves (Meredith Ross et al., 2008:252). Emotional Intelligence Emotions have a great influence in teams, they are fundamental to how team members interact and work together (Barczak et al., 2010:333).For a team to be effective it requires more than just technical skills, it require members to be emotional intelligent (Vrabie, 2014). Effective teams manage emotion in the team to get the most from the personalities within the team by paying attention to both task and feelings (JCA Global, 2013). Employees with high emotional intelligence are able to brace against distracting emotions as a result of their enhanced ability to recognise and manage emotions (Kunnanatt, 2008:616). Employees with high levels of emotional intelligence can recognise and manage emotions in a team; they can also articulate their own emotions in a controlled and thoughtful manner (West and Richardson, 2011:154). Emotionally intelligent employees perform more effectively individually and as team members (Abraham, 2004; Higgs, 2004; Kunnanatt, 2004; Stubb Koman and Wolff, 2008, all cited in Beigi and Shirmohammadi, 2011:553 and Kunnanatt, 2008:616). A team member with a low emotional intelligence can affect their entire team; the same is true for a team member with high emotional intelligence (Quoidbach and Hansenne, cited in Moore and Mamiseishvili, 2012:297). Findings from the Primary Study Team Composition The IT workforce is predominantly young and middle-aged, with almost two thirds (64.86%) being below the age of 40 years. Majority (43.24%) of them falls between 30 and 39 years. The IT teams at the Midrand campus of BSI are male dominated, 78.38% of the respondents were males. Majority of the respondents have some form of post matric qualification. Majority (43.24%) of them have a National Diploma, while 24.32% have a Bachelor’s degree. Only 2.7% of the respondents have a post graduate qualification (Master’s degree and above), whereas 29.73% have matric only. The survey results shows that majority (54.05%) of the respondents are fairly new having between 1 and 3 years’ service within BSI. The study did not determine whether this is as a result of turnover of staff or increase of headcount Emotional Intelligence The survey results show that overall IT teams at the Midrand Campus of BSI are emotionally intelligent. The overall mean score for the sample was 4.06 which indicate the team is competent with emotional intelligence. All four teams which were survey have an overall mean score of 4 and above.

Arabian Journal of Business and Management Review (Nigerian Chapter) , 201510Vol. 3, No.
136
An overwhelming majority (97%) of were found to be competent in emotional intelligence, with 11% of them very high levels of emotional intelligence. Almost half of the respondents (46%) possess very high levels of self-awareness, while overall an overwhelming majority (97%) are competent in the self-awareness dimension of emotional intelligence. Majority (87%) of the respondents were found to be competent in the self-management dimension of emotional intelligence, however 5% of them were incompetent in this dimension. An overwhelming majority (97%) of the respondent are competent in the social awareness dimension, with 22% of them having very high levels of competency in this dimension. Majority (81%) of the respondents are competent in the relationship management dimension. While the remaining 19% are not incompetent, they still have room for improvement. Team Effectiveness The survey results shows that majority of the respondents answered favourably on all nine factors of that affect team effectiveness. While the overall scores for all factors were favourable, it was found that the number of unfavourable scores were high. It some case they were more than a third. Meaningful (moderate and strong) positive correlations were found between all factors. This indicates that all these factors are interlinked and drop in one can affect all of them which will be catastrophic for the team. Communication had the highest number of unfavourable scores. Overall 46% of the scores were unfavourable with 35% of them being neutral. A closer inspection of the data shows that majority of the respondents believe that team members don’t listen to one another without interrupting and they assume things rather than clarifying with one another. Almost a third of overall scores for role clarity, clearly defined goals, psychological safety and accountable interdependence were unfavourable. If so many members do not understand their team goals, it comes as no surprise that they don’t understand their role in achieving those goals. Team members cannot hold one another accountable for the team goals if they do not understand their roles. The number of respondents who do not understand their team’s purpose is high (19%). This consequence of this is seen by a significantly high number of employees not understanding their team’s goals as team goals are aligned to the team’s purpose (reason for existence). The link between emotional intelligence and team effectiveness None of the factors that affect team effectiveness showed any meaningful correlations with emotional intelligence and its dimensions. This indicates that emotional intelligence is not does not have an impact on team effectiveness among IT teams at the BSI Midrand campus. Recommendations In the light of the findings discussed in the previous sections, recommendations to enhance team effectiveness are made. These recommendations are discussed in the next sections. Team Demographics In the light of the findings discussed in the previous sections about the team demographics, the following recommendations are made: The IT teams at the Midrand campus of BSI are male dominated. The company needs to
implement strategies to attract females into IT roles. According to the Institute of Information Technology Professionals that 56% of global ICT professional jobs are held by women, but in

Arabian Journal of Business and Management Review (Nigerian Chapter) , 201510Vol. 3, No.
137
only 20% of the ICT workforce are women (Itnewsafrica.com, 2014). The statistics further indicates that the science and technology faculties of most tertiary institutions are also dominated by female students. BSI needs as one of the market leaders in ICT industry in South Africa needs to make gender transformation a priority as required by the ICT charter.
The research shows that majority (54.05%) of the respondents are fairly new having between 1 and 3 years’ service within BSI. Statistics South Africa’s quarterly labour force survey for quarter 4 of 2014 reveals that in Gauteng an employee stays on a job for 55 months (4.5 years). Staff turnover comes with cost the company financially, as there high costs associated with training and recruitment of new employees. Majority of the employees are approaching the 4.5 years tenure, the company needs to look at implementing retention strategies. It is recommended that management implement the following:
o Financial Rewards: Management must ensure that employees’ salaries are competitive. This will eliminate the need to move for better financial rewards.
o Flexi hours: Traffic in peak hours in Gauteng is a problem. The problem gets worse when traffic lights are off due to load shedding. This makes commuting to work difficult and frustrating. Offering flexible working hours to employees will help reduce stress.
o Time off: It professionals are often required to work long hours to complete projects. Employees should be rewarded with some paid time off work in addition to their annual leave.
o Development: Management must provide training and development opportunities to provide new skills which will enable employees to grow within the organisation.
Emotional Intelligence For a team to be effective it requires more than just technical skills, it require members to be emotional intelligent (Vrabie, 2014). Beam (2012:12) highlights that emotional intelligence has an impact on teamwork. Emotional Intelligence alone does not guarantee team effectiveness; it does enrich the climate to be conducive for effectiveness. Having high levels of Emotional Intelligence in a team facilitates effective problem solving, high performance, trust, communication, and collaboration (Beam, 2012:12). The survey results shows that IT professionals at the Midrand campus of BSI are emotionally intelligent, however the high number of respondents who have unfavourable scores for communication, trust and conflict management suggests that their emotional competencies does not seem to facilitate effective communication, trust and collaboration as suggested by Beam (2012:12). It is evident that emotional intelligence abilities are not used to benefit the teams. The following recommendations are made:
A training course must be identified to enrol employees on to further develop their emotional competencies. The course must at minimum address the following topics:
o Understanding what emotional intelligence is o Understand the different emotions and how to manage them o The role and impact of emotional intelligence in the workplace o The role and impact of emotional intelligence in interpersonal and intrapersonal
relationships in a team. Emotional intelligence assessment test should form part of the recruitment process of IT
professionals. This will ensure that new employees have high emotional intelligence levels. This however should not be used to discriminate. For those who do not possess those abilities but meeting all other requirements, the test will enable management to plan a training program aimed at developing these abilities.

Arabian Journal of Business and Management Review (Nigerian Chapter) , 201510Vol. 3, No.
138
Emotional intelligence competencies must form part of the performance appraisal of IT professionals. This must however not be used as a punitive intervention but rather a developmental tool.
o Employees who successfully apply these competencies must be appropriately rewarded.
o For those who are rated low on these competencies, training must be provided to correct this.
Team Purpose and Goals The survey revealed that19% of the respondents does not know their team’s purpose. It was no surprise to find that a third of the respondents do not understand their team’s goals as team goals are aligned to the team’s purpose (reason for existence). The following are recommended to correct the situation:
All teams to have a workshop to do the following: o Communicate the purpose of the team to all team members. o Explain how the team’s purpose is aligned to the organisation’s vision
Teams should have workshops at the beginning of each year to do the following: o Formulate and communicate goals for the year which complies with the SMART
(Specific, Measurable, Achievable, Realistic and timely) principle. o Involve team members in the process of formulating the goals o Explain how these goals are linked to the employees performance contracts
Role Clarity The research results shows that while majority of the respondents agree that the roles of team members are clearly defined and that team members understand their roles and the roles of other members, the number of those that who disagree is alarming. The results further shows that the biggest challenge seems to be when a member’s role is change. It is for this reason that it is recommended that management do the following:
Performance contracts of employees should be reviewed to make sure if they are aligned to their roles
Regular communication session within teams to clarify roles of members should be held. Communication The research results show that communication within teams is a problem. The survey data identified two major issues that contribute to poor communication in the teams. Members don’t listen to one another without interrupting and they assume things rather than clarifying with one another. To address these problems, the following are recommended for management to implement:
Employees should be enrolled on an effective communication skills course. Bytes People Solutions (another subsidiary of the Bytes Technology Group) offers a wide range of courses to develop soft skills. Management should identify relevant courses to enrol team members to develop their communication skills.
Training and development plans for IT professionals must be reviewed. Management must not only focus on technical training, soft skills training must form part of annual training plans. These skills are critical for effective interpersonal relations among team member and with clients.
Trust A third of the respondents believe that members don’t trust each other in their teams. Lack of trust within a team affects other critical factors that affect team effectiveness. Factors such as team cohesion, psychological safety and conflict management are negatively impacted by lack of trust among members. DeOrtentiis et al., (2013:537), team members who trust one another will be more

Arabian Journal of Business and Management Review (Nigerian Chapter) , 201510Vol. 3, No.
139
likely to remain with their team and the organisation. It is recommended that management implement the following:
Run workshops to highlight the importance of trust among team members. The emphasis should be on how distrust among members is detrimental for the team to achieve its goals.
Conduct an anonymous survey to identify the reasons why team members don’t trust each other.
Formulate strategies to address the reasons identified. Limitations and areas of future research This study had limitations. The following areas are suggested for further research:
The study was limited to one campus of BSI, a much wider study can be conducted across the whole organisation
The study found that emotionally intelligent organisations are much more successful than those who are not. This study focused on the IT workforce only. A study that include all employees (both IT and non IT professionals) must be conducted determine how the organisation as a whole is doing.
Conclusion The literature review in chapter 2 revealed that teams require more than just technical skills to be effective. Emotional intelligence was highlighted as one of the key skills required for effectiveness in teams. The study found that the IT respondents are emotionally intelligent with some having very high levels of emotional intelligence. The survey data showed no meaningful correlations were found between emotional intelligence and any of the team effectiveness characteristics/factors. It is for this reason that the study concluded that emotional intelligence does not have an impact on the team effectiveness in IT teams at the Midrand campus of BSI. While the majority of respondents believe that these characteristics are prevalent in their team, a significantly high number of them disagreed. This indicates that the teams are not using the high emotional intelligence levels to benefit the teams. It is recommended that management needs to pay a closer attention to the characteristics of an effective team. BIBLIOGRAPHY Abraham, R. (2004). Emotional Competence as Antecedent to Performance: A Contingency Framework. Genetic, Social, and General Psychology Monographs, 130(2), pp.117-145. Adams, S., Simon, L. and Ruiz, B. (2002). A pilot study of the performance of student teams in engineering educations. In: Session 1017 of American Society for Engineering Education Annual Conference. Aggarwal, S. and Khurana, S. (2009). Research Methodology and Statistical Analysis. New Delhi: V K Enterprises. Alfreds, D. (2015). Women, diversity 'key' to SA's tech industry. [online] Fin24. Available at: http://www.fin24.com/Tech/News/Women-diversity-key-to-SAs-tech-industry-20150130 [Accessed 17 Jul. 2015]. Aslan, S., Ozata, M. and Mete, M. (2008). The Investigation of Effects of Group Emotional Intelligence on Team Effectiveness. Humanity & Social Sciences Journal, 3(2), pp.104 - 115. Aubé, C. and Rousseau, V. (2011). Interpersonal aggression and team effectiveness: The mediating role of team goal commitment. Journal of Occupational and Organizational Psychology, 84(3), pp.565-580.

Arabian Journal of Business and Management Review (Nigerian Chapter) , 201510Vol. 3, No.
140
Babbie, E. (2008). The Basics of Social Research. 5th ed. USA: Cengage Learning. Babbie, E., Mouton, J., Vorster, P. and Prozesky, B. (2007). The practice of social research. Cape Town: Oxford University Press Southern Africa. Baloch, Q., Saleem, M., Zaman, G. and Fida, A. (2014). The Impact of Emotional Intelligence on Employees’ Performance. Journal of Managerial Sciences, 8(2), pp.208 - 227. Baloch, Q., Saleem, M., Zaman, G. and Fida, A. (2014). The Impact of Emotional Intelligence on Employees’ Performance. Journal of Managerial Sciences, 8(2), pp.209 - 227. Barczak, G., Lassk, F. and Mulki, J. (2010). Antecedents of Team Creativity: An Examination of Team Emotional Intelligence, Team Trust and Collaborative Culture. Creativity and Innovation Management, 19(4), pp.332 - 345. Barendrecht, M. (2010). A Handbook for Measuring the Costs and Quality of Access to Justice. Antwerpen: Maklu & Tilburg Institute for Interdisciplinary Studies of Civil Law and Conflict Resolution Systems. Beam, M. (2012). Emotional Intelligence and Team Cohesiveness. Masters. Marshall University. Beigi, M. and Shirmohammadi, M. (2010). Training employees of a public Iranian bank on emotional intelligence competencies. Jnl Euro Industrial Training, 34(3), pp.211-225. Beigi, M. and Shirmohammadi, M. (2011). Effects of an emotional intelligence training program on service quality of bank branches. Managing Service Quality: An International Journal, 21(5), pp.552-567. Bell, J. (2004). Doing Your Research Project: A Guide for first-time researchers in Education and Social Science. 3rd ed. Mumbai. Berry, G. (2011). Enhancing Effectiveness on Virtual Teams: Understanding Why Traditional Team Skills Are Insufficient. Journal of Business Communication, 48(2), pp.186-206. Biddix, P. (2009). Instrument, Validity, Reliability. [online] Research Rundowns. Available at: https://researchrundowns.wordpress.com/quantitative-methods/instrument-validity-reliability/ [Accessed 10 May 2015]. Boon, A., Raes, E., Kyndt, E. and Dochy, F. (2013). Team learning beliefs and behaviours in response teams. Euro J of Training and Dev, 37(4), pp.357-379. Bradberry, T. (2014). Emotional Intelligence - EQ. [online] Forbes. Available at: http://www.forbes.com/sites/travisbradberry/2014/01/09/emotional-intelligence/ [Accessed 5 May 2015]. Bradberry, T. (2015). Why You Need Emotional Intelligence To Succeed. 1st ed. [eBook] pp.1 - 4. Available at: http://www.talentsmart.com/media/uploads/articles/pdfs/Why%20You%20Need%20Emotional%20Intelligence%20To%20Succeed.pdf [Accessed 5 May 2015]. Brockman, B., Rawlston, M., Jones, M. and Halstead, D. (2010). An Exploratory Model of Interpersonal Cohesiveness in New Product Development Teams. Journal of Product Innovation Management, 27(2), pp.201-219. Brown, D. (2011). An Experiential Approach To Organisational Development: International Edition. New Jersey: Pearson Education. Bryman, A. (2008). Social research methods. Oxford: Oxford University Press. BusinessDictionary.com, (2015). What is Likert scale? definition and meaning. [online] Available at: http://www.businessdictionary.com/definition/Likert-scale.html [Accessed 24 Jun. 2015]. Bytes Systems Integration, (2015). BSI COMPANY PROFILE. [online] Available at: http://www.bytes.co.za/sites/bytes_p2/files/documents/attachments/BSI%20COMPANY%20PROFILE.PDF [Accessed 24 May 2015]. Cameron, S. (2008). The MBA handbook. Harlow, England: FT Prentice Hall.

Arabian Journal of Business and Management Review (Nigerian Chapter) , 201510Vol. 3, No.
141
Cantu, C. (2007). Evaluating Team Effectiveness: Examination Of The Team Assessment Tool. Ph.D. University of North Texas. Careerevolutiongroup.com, (2012). career evolution group - articles - Tips to Increase Your Organizational Awareness. [online] Available at: http://www.careerevolutiongroup.com/articles_blog/2012/7/26/tips-to-increase-your-organizational-awareness.html [Accessed 7 May 2015]. Christie, A., Jordan, P. and Troth, A. (2015). Trust antecedents: emotional intelligence and perceptions of others. International Journal of Organizational Analysis, 23(1), pp.89-101. Clarke, N. (2010). Emotional intelligence abilities and their relationships with team processes. Team Performance Management: An International Journal, 16(1/2), pp.6-32. Coder, L., Rosenbloom, J., Ash, R. and Dupont, B. (2009). Economic and business dimensions Increasing gender diversity in the IT work force. Common. ACM, 52(5), p.25. Cohen, L., Manion, L. and Morrison, K. (2007). Research methods in education. London: Routledge. Connaway, L. and Powell, R. (2010). Basic research methods for librarians. Santa Barbara, Calif.: Libraries Unlimited. Daus, C., Dasborough, M., Jordan, P. and Ashkanasy, N. (2012). Experiencing and Managing Emotions in the Workplace. Research on Emotions in Organizations, 8, pp.375 - 399. Daus, C., Dasborough, M., Jordan, P. and Ashkanasy, N. (2015). Experiencing and Managing Emotions in the Workplace. Research on Emotion in Organizations, 8, pp.375–399. Davies, L. (2011). The Effect Of Emotional Intelligence On Virtual Team Performance. Undergraduate. The Colorado College. Davis, C. (2014). What is research? In: F. du Plooy-Cilliers, C. Davis and R. Bezuidenhout, ed., Research Matters, 1st ed. Cape Town: Juta & Company Ltd, pp.1 - 17. Dawidowicz, P. (2010). Literature reviews made easy. Charlotte, NC: Information Age Pub. De Miranda, L. (2011). The relationship between emotional intelligence and leadership effectiveness with an emphasis on corporate culture in a consumer goods organization. Masters. Graduate School of Business Leadership, University of South Africa. Delgado Piña, M., María Romero Martínez, A. and Gómez Martínez, L. (2008). Teams in organizations: a review on team effectiveness. Team Performance Management: An International Journal, 14(1/2), pp.7-21. DeOrtentiis, P., Summers, J., Ammeter, A., Douglas, C. and Ferris, G. (2013). Cohesion and satisfaction as mediators of the team trust – team effectiveness relationship. Career Dev Int, 18(5), pp.521-543. du Plooy-Cilliers, F. and Cronje, J. (2014). Quantitative Data Collection. In: F. du Plooy-Cilliers, C. Davis and R. Bezuidenhout, ed., Research Matters, 1st ed. Cape Town: Juta & Company Ltd, pp.147 - 172. Dulewicz, V. and Higgs, M. (2004). Can Emotional Intelligence be developed? The International Journal of Human Resource Management, 15(1), pp.95-111. Eccles, M., Smith, J., Tanner, M., van Belle, J. and Van der Watt, S. (2010). Collocation Impact on Team Effectiveness. SACJ, 46, pp.3 - 13. English, A. (2004). Team Performance: The Effect of Team Conscientiousness and Task Type. Small Group Research, 35(6), pp.643-665. Gardner, H. (2012). Performance Pressure as a Double-edged Sword: Enhancing Team Motivation but Undermining the Use of Team Knowledge. Administrative Science Quarterly, 57(1), pp.1-46. Ghosh, R., Shuck, B. and Petrosko, J. (2012). Emotional intelligence and organizational learning in work teams. Journal of Mgmt. Development, 31(6), pp.603-619. Glassop, L. (2002). The Organizational Benefits of Teams. Human Relations, 55(2), pp.225-249.

Arabian Journal of Business and Management Review (Nigerian Chapter) , 201510Vol. 3, No.
142
Goleman, D. (2015). An EI-Based Theory of Performance. [online] Eiconsortium.org. Available at: http://www.eiconsortium.org/reprints/ei_theory_performance.html [Accessed 12 May 2015]. Greenberg, J. and Baron, R. (2003). BEHAVIOUR IN ORGANIZATIONS - Understanding and Managing the Human Side of Work. 8th ed. New Jersey: Prentice-Hall. Harper, S. and White, C. (2013). The Impact of Member Emotional Intelligence on Psychological Safety in Work Teams. Institute of Behavioral and Applied Management, 15(1), pp.2 - 10. Hellriegel, D. and Slocum, J. (2004). Organizational behavior. Mason, Ohio: Thomson/South-Western. Henn, M., Weinstein, M. and Foard, N. (2009). A Critical Introduction to Social Research. London: Sage Publications. Henning, E., Van Rensburg, W. and Smit, B. (2005). Finding your way in qualitative research. Pretoria: Van Schaik. Higgs, M. (2004). A study of the relationship between emotional intelligence and performance in UK call centres. Journal of Managerial Psych, 19(4), pp.442-454. Howard, G. (2014). The Literature review. In: F. du Plooy-Cilliers, C. Davis and R. Bezuidenhout, ed., Research Matters, 1st ed. Cape Town: Juta & Company Ltd, pp.100 - 106. Itnewsafrica.com, (2014). South Africa’s ICT industry – lacking women at the helm | IT News Africa- Africa's Technology News Leader. [online] Available at: http://www.itnewsafrica.com/2014/04/south-africas-ict-industry-lacking-women-at-the-helm/ [Accessed 24 Jul. 2015]. Jani, A. and Vays, P. (2014). Emotional Intelligence in Team Performance. 1st ed. [eBook] pp.1 - 27. Available at: http://www.academia.edu/8406549/Emotional_Intelligence_and_Team_Performance_-_Working_Paper [Accessed 26 Apr. 2015]. JCA Global, (2013). Team EI profile. [online] Available at: http://www.jcaglobal.com/what-we-do/products/team-emotional-intelligence/ [Accessed 22 Apr. 2015]. Jones, J. and Bearley, W. (2001). Facilitating Team Development: A View from the Field. Group Facilitation: A Research and Applications Journal, 3, pp.56 - 65. Joo, B., Song, J., Lim, D. and Yoon, S. (2012). Team creativity: the effects of perceived learning culture, developmental feedback and team cohesion. International Journal of Training and Development, 16(2), pp.77-91. Jorfi, H. and Jorfi, S. (2010). Emotional Intelligence & Communication Effectiveness: (A Case Study of Education in Iran). Global Partnership Management Journal, 1(2), pp.65 - 72. Kaapanda, L. (2011). An Evaluation of Factors Determining the Selection of Mobile Telecommunications Service Providers in the Northern Region of Namibia. Masters. Regent Business School. Keyton, J. and Beck, S. (2008). Team Attributes, Processes, and Values: a Pedagogical Framework. Business Communication Quarterly, 71(4), pp.488-504. Khan, R. (2014). Quantitative data analysis. In: F. du Plooy-Cilliers, C. Davis and R. Bezuidenhout, ed., Research Matters, 1st ed. Cape Town: Juta & Company Ltd, pp.131 - 146. Khan, S., Khan, I., Akhtar, B., Khan, F., Yar, N., Khan, N., Nawaz, T. and Rauf, H. (2014). The Impact of Emotional Intelligence upon the Team Effectiveness. Research on Humanities and Social Sciences, 4(22), pp.1-7. Kothari, C. (2012). Research methodology: Methods and Techniques. 2nd ed. New Delhi: New Age International (P) Ltd. Kulkarni, P., Janakiram, B. and Kumar, D. (2009). Emotional Intelligence and Employee Performance as an Indicator for Promotion, a Study of Automobile Industry in the City of Belgaum, Karnataka, India. IJBM, 4(4).
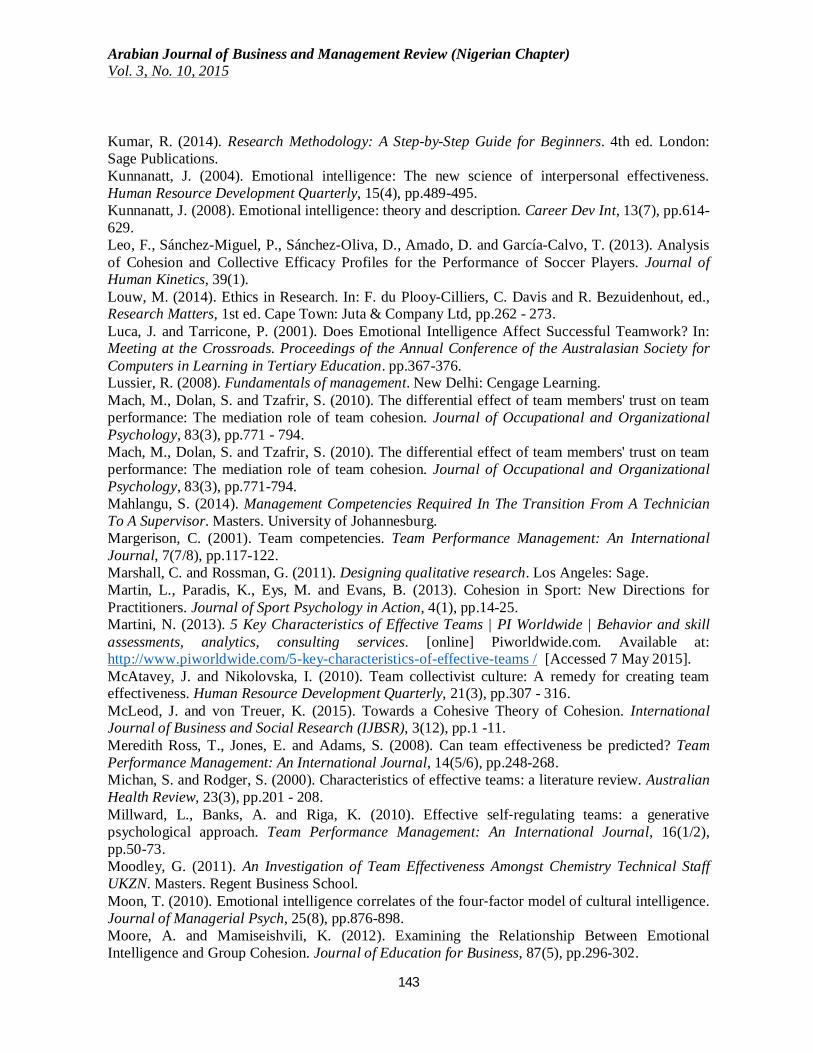
Arabian Journal of Business and Management Review (Nigerian Chapter) , 201510Vol. 3, No.
143
Kumar, R. (2014). Research Methodology: A Step-by-Step Guide for Beginners. 4th ed. London: Sage Publications. Kunnanatt, J. (2004). Emotional intelligence: The new science of interpersonal effectiveness. Human Resource Development Quarterly, 15(4), pp.489-495. Kunnanatt, J. (2008). Emotional intelligence: theory and description. Career Dev Int, 13(7), pp.614-629. Leo, F., Sánchez-Miguel, P., Sánchez-Oliva, D., Amado, D. and García-Calvo, T. (2013). Analysis of Cohesion and Collective Efficacy Profiles for the Performance of Soccer Players. Journal of Human Kinetics, 39(1). Louw, M. (2014). Ethics in Research. In: F. du Plooy-Cilliers, C. Davis and R. Bezuidenhout, ed., Research Matters, 1st ed. Cape Town: Juta & Company Ltd, pp.262 - 273. Luca, J. and Tarricone, P. (2001). Does Emotional Intelligence Affect Successful Teamwork? In: Meeting at the Crossroads. Proceedings of the Annual Conference of the Australasian Society for Computers in Learning in Tertiary Education. pp.367-376. Lussier, R. (2008). Fundamentals of management. New Delhi: Cengage Learning. Mach, M., Dolan, S. and Tzafrir, S. (2010). The differential effect of team members' trust on team performance: The mediation role of team cohesion. Journal of Occupational and Organizational Psychology, 83(3), pp.771 - 794. Mach, M., Dolan, S. and Tzafrir, S. (2010). The differential effect of team members' trust on team performance: The mediation role of team cohesion. Journal of Occupational and Organizational Psychology, 83(3), pp.771-794. Mahlangu, S. (2014). Management Competencies Required In The Transition From A Technician To A Supervisor. Masters. University of Johannesburg. Margerison, C. (2001). Team competencies. Team Performance Management: An International Journal, 7(7/8), pp.117-122. Marshall, C. and Rossman, G. (2011). Designing qualitative research. Los Angeles: Sage. Martin, L., Paradis, K., Eys, M. and Evans, B. (2013). Cohesion in Sport: New Directions for Practitioners. Journal of Sport Psychology in Action, 4(1), pp.14-25. Martini, N. (2013). 5 Key Characteristics of Effective Teams | PI Worldwide | Behavior and skill assessments, analytics, consulting services. [online] Piworldwide.com. Available at: http://www.piworldwide.com/5-key-characteristics-of-effective-teams / [Accessed 7 May 2015]. McAtavey, J. and Nikolovska, I. (2010). Team collectivist culture: A remedy for creating team effectiveness. Human Resource Development Quarterly, 21(3), pp.307 - 316. McLeod, J. and von Treuer, K. (2015). Towards a Cohesive Theory of Cohesion. International Journal of Business and Social Research (IJBSR), 3(12), pp.1 -11. Meredith Ross, T., Jones, E. and Adams, S. (2008). Can team effectiveness be predicted? Team Performance Management: An International Journal, 14(5/6), pp.248-268. Michan, S. and Rodger, S. (2000). Characteristics of effective teams: a literature review. Australian Health Review, 23(3), pp.201 - 208. Millward, L., Banks, A. and Riga, K. (2010). Effective self‐regulating teams: a generative psychological approach. Team Performance Management: An International Journal, 16(1/2), pp.50-73. Moodley, G. (2011). An Investigation of Team Effectiveness Amongst Chemistry Technical Staff UKZN. Masters. Regent Business School. Moon, T. (2010). Emotional intelligence correlates of the four‐factor model of cultural intelligence. Journal of Managerial Psych, 25(8), pp.876-898. Moore, A. and Mamiseishvili, K. (2012). Examining the Relationship Between Emotional Intelligence and Group Cohesion. Journal of Education for Business, 87(5), pp.296-302.

Arabian Journal of Business and Management Review (Nigerian Chapter) , 201510Vol. 3, No.
144
Mullins, L. (2010). Management & organisational behaviour. 9th ed. Harlow: Pearson Education. Naseer, Z., Chishti, S., Rahman, F. and Jumani, N. (2011). Impact of Emotional Intelligence on Team Performance in Higher Education Institutes. International Online Journal of Educational Sciences, 3(1), pp.30-46. Onağ, Z. and Tepeci, M. (2014). Team Effectiveness in Sport Teams: The Effects of Team Cohesion, Intra Team Communication and Team Norms on Team Member Satisfaction and Intent to Remain. Procedia - Social and Behavioral Sciences, 150, pp.420-428. Othman, A., Abdullah, H. and Ahmad, J. (2009). The Influence of Work Motivation on Emotional Intelligence and Team Effectiveness. Vision: The Journal of Business Perspective, 13(4), pp.1-14. Parayitam, S. and Dooley, R. (2007). The relationship between conflict and decision outcomes. International Journal of Conflict Management, 18(1), pp.42-73. Pascoe, G. (2014). Sampling. In: F. du Plooy-Cilliers, C. Davis and R. Bezuidenhout, ed., Research Matters, 1st ed. Cape Town: Juta & Company Ltd, pp.131 - 146. Phalane, D. (2007). An Investigation Into The Alignment Of Training Needs And The Skills Development Plan In The Office Of The Premier, Limpopo Province. Masters. University of Limpopo. Phipps, S., Prieto, L. and Ndinguri, E. (2014). Emotional Intelligence: Is it Necessary for Leader Development? Journal of Leadership, Accountability and Ethics, 11(1), pp.73 - 89. Phipps, S., Prieto, L. and Ndinguri, E. (2014). Emotional Intelligence: Is it Necessary for Leader Development? Journal of Leadership, Accountability and Ethics, 11(1), pp.73 - 89. Plowman, N. and McDonough, M. (2013). Seven Factors of Successful Teams: The Keys to Ensure High Team Performance. [online] Brighthub Project Management. Available at: http://www.brighthubpm.com/monitoring-projects/62415-seven-factors-of-effective-team-performance/ [Accessed 6 Apr. 2015]. Pollock, S. and Zocklein, S. (2012). Using Baldrige to Build Work Team Culture. The Journal for Quality & Participation, 35(1), pp.1-4. Polychroniou, P. (2009). Relationship between emotional intelligence and transformational leadership of supervisors. Team Performance Management: An International Journal, 15(7/8), pp.343-356. Radmanovic, M. (2008). The evaluation of emotional intelligence competencies from the customer’s perspective. Masters. Gordon Institute of Business Science, University of Pretoria. Ramalibana, K. (2005). An Investigation Into The Effectiveness Of The Staff Development Policies And Programmes Of The Unisa Library. Masters. University Of South Africa. Rathi, N. (2014). Impact of Emotional Intelligence and Emotional Labour on Organizational Outcomes in Service Organizations: A Conceptual Model. South Asian Journal of Management, 21(4), pp.54 -71. Robbins, S. and Timothy, A. (2012). Essentials of Organisational Behaviour: Global Edition. 11th ed. Essex: Pearson Education. Robbins, S., Judge, T., Odendaal, A. and Roodt, G. (2011). Organisational Behaviour: Global and Southern African Perspective. 13th ed. Cape Town: Pearson Education. Rozell, E. and Scroggins, W. (2010). How much is too much? The role of emotional intelligence in self-managed work team satisfaction and group processes. Team Performance Management: An International Journal, 16(1/2), pp.33-49. Saunders, M., Lewis, P. and Thornhill, A. (2009). Research methods for business students. Harlow: Financial Times Prentice Hall. Shajahan, S. (2005). Research methods for management. 4th ed. Mumbai: Jaico Publishing House. Shajahan, S. (2009). Introduction to Business Research Methods. Mumbai: Jaico Publishing House. Shajahan, S. (2011). Research Methods for Management. 4th ed. Mumbai: Jaico Publishing House.

Arabian Journal of Business and Management Review (Nigerian Chapter) , 201510Vol. 3, No.
145
Smit, P., de J Cronje, G., Brevis, T. and Vrba, M. (2010). Management Principles: A Contemporary Edition for Africa. 4th ed. Cape Town, South Africa: Juta & Co. Somech, A., Desivilya, H. and Lidogoster, H. (2009). Team conflict management and team effectiveness: the effects of task interdependence and team identification. J. Organiz. Behav., 30(3), pp.359-378. Srivastava, K. (2013). Emotional intelligence and organizational effectiveness. In Psychiatry J, 22(2), p.97. Statistics South Africa, (2015). Quarterly Labour Force Survey: Quarter 4, 2014. Pretoria: Statistics South Africa. Stroh, E. (2005). Building and Maintaining High-Performance Teams. Journal of Public Administration, 40(3.2), pp.431 - 441. Stubbs Koman, E. and Wolff, S. (2008). Emotional intelligence competencies in the team and team leader. Journal of Mgmt. Development, 27(1), pp.55-75. Sweeney, D., Williams, T. and Anderson, D. (2009). Fundamentals of business statistics. 5th ed. Ohio: South Western, Thomson Learning. Sy, T. and Côté, S. (2004). Emotional intelligence. Journal of Mgmt. Development, 23(5), pp.437-455. Thumbran, R. (2010). Utilizing Non-Financial Rewards as a Competitive Advantage in Attracting and Retaining Employees. Masters. Gordon Institute of Business Science - University of Pretoria. Tiffan, B. (2011). The Art Of Team Leadership. Physician Executive, 37(2), pp.78 - 80. Trabun, M. (2002). The Relationship Between Emotional Intelligence And Leader Performance. Masters. Naval Postgraduate School. Trochim, W. (2006). Correlation. [online] Socialresearchmethods.net. Available at: http://www.socialresearchmethods.net/kb/statcorr.php [Accessed 25 May 2015]. Trochim, W. (2006). Descriptive Statistics. [online] Socialresearchmethods.net. Available at: http://www.socialresearchmethods.net/kb/statdesc.php [Accessed 25 May 2015]. Troth, A. (2009). A model of team emotional intelligence conflict task complexity and decision making. International Journal of Organisational Behaviour, 14(1), pp.26 - 40. Turner, R. and Lloyd‐Walker, B. (2008). Emotional intelligence (EI) capabilities training: can it develop EI in project teams? International Journal of Managing Projects in Business, 1(4), pp.512-534. van der Aar, Z., Bloemer, J. and Henseler, J. (2012). Reducing employee turnover through customer contact centre job quality. The International Journal of Human Resource Management, 23(18), pp.3925-3941. van Woerkom, M. and Sanders, K. (2009). The Romance of Learning from Disagreement. The Effect of Cohesiveness and Disagreement on Knowledge Sharing Behavior and Individual Performance Within Teams. J Bus Psychology, 25(1), pp.139-149. Vennapoosa, C. (2010). Team Behavior | IT Training and Consulting – Exforsys. [online] Exforsys.com. Available at: http://www.exforsys.com/career-center/team-building/team-behavior.html [Accessed 9 May 2015]. Verma, N., Rangnekar, S. and Barua, M. (2011). 'Impact of Need Pattern on Team Effectiveness: A Study in Indian Perspective. Journal of Management & Public Policy, 3(1), pp.23 - 35. Vrabie, A. (2014). The 6 characteristics of a highly effective team - Sandglaz Blog. [online] Sandglaz Blog. Available at: http://blog.sandglaz.com/6-charactersitics-highly-effective-team/ [Accessed 7 May 2015]. Wegner, T. (2013). Applied business statistics. 3rd ed. cape Town: Juta. West, M. and Richardson, J. (2011). Work Groups and Teams. In: M. Butler and E. Rose, ed., Introduction to Organisational Behaviour, 1st ed. Mumbai: Jaico Publishing House, pp.132-155.
Arabian Journal of Business and Management Review (Nigerian Chapter) , 201510Vol. 3, No.
146
Williams, E. and Castro, S. (2010). The effects of teamwork on individual learning and perceptions of team performance. Team Performance Management: An International Journal, 16(3/4), pp.124 - 147. Woehr, D., Arciniega, L. and Poling, T. (2012). Exploring the Effects of Value Diversity on Team Effectiveness. J Bus Psychology, 28(1), pp.107-121. Zikmund, W. (2003). Business research methods. Mason, OH: Thomson/South-Western. Zimmerman, A. (2013). Part 4 - What is Emotional Intelligence? Relationship Management - Association of Information Technology Professionals. [online] Aitp.org. Available at: https://www.aitp.org/news/126699/ [Accessed 9 May 2015].