an evaluation of the npd process from a lean...
TRANSCRIPT
An evaluation of the NPD process from a lean perspective
a master thesis at Oriflame
Dan Möller and Jonathan Viklander

Copyright © Dan Möller and Jonathan Viklander
Department of Industrial Management and Logistics Faculty of Engineering at Lund University ISRN-LUTMDN/TMT--5719—SE Printed in Sweden by Media-Tryck, Lund University Lund 2011
III
Abstract
Title: An evaluation of the NPD process from a lean perspective at Oriflame Cosmetics
Authors: Dan Möller and Jonathan Viklander
Supervisors: Everth Larsson at LTH, Anders Fenger-Krog at Oriflame, and Robin Exman at Deloitte Consulting
New product development is a complex process for bringing new products to the market. While manufacturing is a very repetitive process, the new product development has to be more flexible as the same product is never developed again. Therefore the theory behind lean manufacturing is not applicable in new product development. The purpose of this study is to propose improvements to Oriflame’s new product development process from a lean perspective. This means that instead of lean manufacturing, a more dynamic development method extracted from Toyota development system is used as a theoretical framework for this thesis. This method is called lean product development.
From the theoretical base of lean product development a model has been developed to measure the lean maturity level of a company’s new product development. This model has been named “Lean product development maturity model” by the authors and consist of 13 questions (One for each principle of lean product development) that will try to cover the foundation of a lean product development process. Each question has been given 6 statements that cover different levels of maturity for each principle. The model was used by the authors to do a gap analysis on Oriflame’s new product development process to find out what level it is today and which level Oriflame should aim for in the future. The gap was found to be quite big in almost every principle and further research on how to improve the process to reach higher levels was conducted.
Oriflame’s new product development process is formed as a stage and gate process with different stages where activities are performed and gates where decisions should be made whether to go further or not with the development of the product. Oriflame has six different product categories and develops about 400 new products each year. When these products are
IV
being developed, they are divided into different process templates depending on innovation level of the formula and the packaging.
To get an understanding of the process and its problems, the authors held interviews with process managers and a comprehensive survey, in form of a questionnaire, was sent out to the people working in the process. The survey was created based on the 7 wastes and the 13 principles of lean product development. From this data collection, eleven areas of improvement were found; such as continuous improvement, employee development, and organizational learnings.
The authors then produced ten solutions to overcome the areas of improvement. Each improvement suggestion’s impact on the principles was considered to understand the benefit of the improvement. Consideration was also done on how costly in resources (such as time, people and money) it would be to implement. Three groups where made out of the ten solutions, were one group is facilitator for the rest of the solutions, one group contains important solutions and one group contains uncertain solutions. Recommendations are presented in the end of the report for Oriflame to consider.
V
Sammanfattning
Titel: En utvärdering av NPD processen från ett lean-perspektiv på Oriflame Cosmetics
Författare: Dan Möller och Jonathan Viklander
Handledare: Everth Larsson på LTH, Anders Fenger-Krog på Oriflame och Robin Exman på Deloitte Consulting
Produktutveckling är en komplex process vars syfte är att föra nya produkter till marknaden. Tillverkningsprocesser är ofta mycket repetitiva medan produktutvecklingsprocessen måste vara mer flexibel då tillvägagångssättet oftast blir produktspecifikt. Detta leder till att teorin för lean produktion inte passar för produktutveckling. Syftet med denna studie är att föreslå förbättringar för Oriflames produktutvecklingsprocess från ett lean-perspektiv. För att kunna göra detta så uteslöts teorin för lean produktion och istället användes en mer dynamisk utvecklingsmetod, som har sitt ursprung i ”Toyota development system”, som teoretiskt ramverk. Denna metod kallas för lean produktutveckling.
Med utgångspunkt i teorin om lean produktutveckling så utvecklades en modell för att mäta mognadsnivån på ett företags produktutvecklingsprocess. Denna modell kallar författarna för “Lean product development maturity model” och den består av 13 frågor (en för varje princip inom lean produktutveckling) vilka ska representera grunden för lean produktutveckling. Varje fråga har tilldelats sex stycken påståenden som vart och ett representerar olika nivåer av mognad för varje princip. Modellen användes av författarna för att genomföra en gap-analys på Oriflames produktutvecklingsprocess. Gapet bestod av vilken nivå Oriflame befinner sig på idag och vart de vill nå i framtiden. Resultatet blev stora gap inom de flesta principerna vilket ledde till att ytterligare studier genomfördes för hur processen ska kunna förbättras så att gapen krymper.
Oriflames produktutvecklingsprocess är utformad som en “stage and gate”-process vilket innebär att aktiviteter utförs under definierade ”stages” och beslut angående huruvida produktutvecklingen ska fortsätta eller avslutas tas i ”gates”. Oriflame har sex olika produktkategorier och utvecklar cirka 400 nya produkter varje år. När produktutvecklingen startar så delas
VI
produkterna in i mallar beroende på innovationsnivån på förpackningar och formulering.
För att skapa förståelse för processen och dess problem så hölls intervjuer med “Process managers” och en omfattande undersökning, i form av en enkät, gjordes på de som jobbar i processen. Undersökningen var baserad på ”7 waste” och de 13 principerna för lean produktutveckling. Från den data som samlades in identifierades 11 stycken problemområden vilka till exempel var ständiga förbättringar, personalutveckling och lärande i organisationen.
Författarna använde sedan teorin för att föreslå tio stycken förbättringar till problemområdena. Varje förbättringsförslags påverkan på principerna kontrollerades vilket gav en indikation på hur stor nyttan av förslaget var. Implementeringskostnaden av varje förbättringsförslag i form av tid, arbete och pengar togs också in för övervägande. De tio förbättringsförslagen grupperades utifrån detta in i tre grupper; förslag som krävdes för att andra förslag skulle vara genomförbara, viktiga förbättringar från teorin bakom lean produktveckling och förbättringar som har högre grad av osäkerhet. Rapportens slut består av rekommendationer som Oriflame bör överväga.
VII
List of figures
Figure 1.1 – Share of total sales per market (Viklander & Möller, 2010).......1
Figure 1.2 – Share of total sales per product group (Möller & Viklander,
2010) .......................................................................................................................2
Figure 1.3 – Report disposal (Möller & Viklander, 2010) ................................7
Figure 2.1 – Model of the practical approach used in this master thesis
(Möller & Viklander, 2010) ............................................................................... 21
Figure 3.1 – Different perspectives on NPD (Trott, 2008) ........................... 27
Figure 3.2 – The innovation diamond (Product Development Institute Inc.,
2010) .................................................................................................................... 28
Figure 3.3 – Stage-Gate® model (Cooper, 1998, p. 105) .............................. 30
Figure 3.4 – Toyotas different operations seen as one system (Holmdahl,
2010, p. 54) .......................................................................................................... 33
Figure 3.5 – 4P in Toyota production system (Liker, 2003, p. 36) ............. 36
Figure 3.6 – Millard’s seven LPD wastes (Millard, 2001) ............................ 45
Figure 3.7 – A model of Toyotas Set based concurrent engineering (Sobek
II, Ward, & Liker, 1999) ..................................................................................... 49
Figure 3.8 – PDCA – model (Wikipedia, the free encyclopedia, 2010). ..... 51
Figure 3.9 – LAMDA – model (Kennedy, Harmon, & Minnock, 2008). .... 52
Figure 3.10 – Multiple options help to understand the design space (Liker
& Morgan, 2006a, p. 284). ................................................................................ 54
Figure 3.11 – Closed-loop Lean Knowledge Management (Kennedy,
Harmon, & Minnock, 2008) ............................................................................. 61
Figure 3.12 – LPD process as described by Lars Holmdahl (Lean Product
Development På Svenska, 2010, p. 101) .......................................................... 62
Figure 3.13 – LPD’s five phases (Holmdahl, 2010, p. 102) ........................... 62
Figure 3.14 – The knowledge value flow (Holmdahl, 2010, p. 103) ............ 64
Figure 3.15 – Example of process mapping (Möller & Viklander, 2010 from
Ljungberg & Larsson, 2001) .............................................................................. 69
VIII
Figure 3.16 – A model on how to manage the process organization as
Ljungberg & Larsson describes it (Möller & Viklander, 2010 from
Ljungberg & Larsson, 2001). ............................................................................. 71
Figure 3.17 – The process enterprise maturity models enablers and
capabilities (Hammer, 2007) ............................................................................ 77
Figure 3.18 – An example from the levels in Hammers PEMM model ....... 78
Figure 3.19 – P&G’s Initiatives Diamond ........................................................ 84
Figure 3.20 – P&G’s SIMPL process ................................................................ 85
Figure 5.1 – Description of color codes used for visualization (Möller &
Viklander, 2010). ................................................................................................ 91
Figure 5.2 – NPD organization chart (Lerenius, Introduction to NPD
Process, 2010) ..................................................................................................... 94
Figure 5.3 – Management of the NPD process at Oriflame (Möller &
Viklander, 2010) ................................................................................................. 97
Figure 5.4 – The stages and gates (Möller & Viklander, 2010 from
Lerenius, 2010) ................................................................................................... 98
Figure 5.5 – Stages with activities (Möller & Viklander, 2010 from
Lerenius, 2010) ................................................................................................... 98
Figure 5.6 – The new innovation part of the process (Möller & Viklander,
2010) ................................................................................................................... 102
Figure 6.1 – Gaps sorted with the largest gap to the left (Möller &
Viklander, 2010) ............................................................................................... 107
Figure 6.2 – Spider chart - Gap analysis (Möller & Viklander, 2010) ....... 107
Figure 6.3 – The areas of improvements for the NPD process (Möller &
Viklander, 2010) ............................................................................................... 118
Figure 7.1 – NPD projects with higher innovation level .............................. 127
Figure 7.2 – Management of the NPD process at Oriflame
(Recommendation) ........................................................................................... 128
Figure 7.3 – Photo of how the visualization could look like, through using a
board and post-it notes. (Quesada Allue , 2009). ........................................ 129
Figure 7.4 – Visual planning boards (Holmdahl, 2010, p. 129) ................. 130
Figure 7.5 – Idea note – Post-it (Möller & Viklander, 2010) ...................... 131
Figure 7.6 – Idea Pick Chart (Möller & Viklander, 2010) ........................... 132
Figure 7.7 – Improvement Board (Möller & Viklander, 2010) ................... 133
Figure 8.1 – Cost vs. benefit of the improvements ....................................... 141
IX
List of tables
Table 3.1 – The traditional roles of project leaders and group managers. . 56
Table 3.2 – The “chief engineer system”-roles of project leaders and group
managers. ............................................................................................................. 57
Table 5.1 – Number of projects divided by level of innovation .................... 93
Table 5.2 – Number of employees divided by category and function ......... 94
Table 6.1 – Today state and problems for principle 1: Establish customer-
defined value to separate value added from waste ...................................... 104
Table 6.2 – Problems identified from interviews with NPD process
managers - Part 1 .............................................................................................. 105
Table 6.3 – Problems identified from interviews with NPD process
managers - Part 2 .............................................................................................. 106
Table 6.4 – List of gaps from the LPD maturity model. Sorted by size of gap
............................................................................................................................. 108
Table 6.5 – Process managers view on which principles to focus on ........ 110
Table 6.6 – Identified problems from the waste section of the survey ..... 112
Table 6.7 – Identified problems from the principles section of the survey
............................................................................................................................. 113
Table 6.8 –NPD staff view on which principles to focus on ....................... 114
Table 6.9 – Identified problems from the qualitative section of the survey
............................................................................................................................. 115
Table 6.10 – Comparison between process managers and NPD staff’s view
on which principles to focus on ...................................................................... 116
Table 7.1 – Problem areas and tools for improvements .............................. 124
Table 7.2 – Each suggestions effect on the 13 principles. ........................... 139
X
Abbreviations
ACC - Accessories
BPB - Business Process Benchmarking
BPM - Business Process Management
BPR - Business Process Re-engineering
CCPM - Critical Chain Project Management
CCS - Color Cosmetics
CE - Chief Engineer
CIS - Commonwealth of Independent States
CQI - Continues Quality Improvement
EMEA - Europe, Middle-East, Africa
FMCG - Fast Moving Consumer Goods
FRA - Fragrances
LAMDA - Look-Ask-Model-Discuss-Act
LPD - Lean Product Development
LPDMM - Lean Product Development Maturity Model
NPD - New Product Development
NVA - Non-Value Adding
PDCA - Plan-Do-Check-Act
PEMM - Process and Enterprise Maturity Model
PHC - Personal & Hair Care
PLM - Product Lifecycle Management
RNVA - Required Non-Value Adding
SBCE - Set-Based Concurrent Engineering
SIMPL - Successful Initiative Management and Product Launch
SKC - Skincare
TDS - Toyota Development System
TMS - Toyota Management System
TMSS - Toyota Marketing and Sales System
TPS - Toyota Production System
VA - Value Adding
XI
Table of Content
1. Introduction ............................................................................................... 1
1.1. Company introduction ................................................................... 1
1.2. Problem background ..................................................................... 3
1.3. Problem description ...................................................................... 4
1.4. Purpose .......................................................................................... 5
1.5. Delimitations ................................................................................. 5
In scope ........................................................................................ 5
Out of scope ................................................................................. 5
1.6. Target group .................................................................................. 6
1.7. Report disposal .............................................................................. 7
2. Methodology .............................................................................................. 9
2.1. Scientific approach ........................................................................ 9
2.1.1. Introduction ........................................................................ 9
2.1.2. Approach depending on knowledge ................................. 10
2.2. Data gathering ............................................................................ 10
2.2.1. Literature review ............................................................... 11
2.2.2. Interviews ........................................................................ 12
2.2.3. Surveys ............................................................................. 13
2.2.4. Previously gathered data ................................................. 16
2.3. Methods of analysis .................................................................... 16
2.3.1. Quantitative analysis ........................................................ 17
2.3.2. Qualitative analysis .......................................................... 17
2.4. Credibility ................................................................................... 19
2.4.1. Validity ............................................................................. 19
XII
2.4.2. Reliability ......................................................................... 19
2.4.3. Relevance ........................................................................ 20
2.5. Practical approach ...................................................................... 20
3. Theoretical framework............................................................................ 26
3.1. New product development .......................................................... 26
3.1.1. The innovation diamond .................................................. 28
3.1.2. NPD models ..................................................................... 29
3.1.3. Key performance indicator .............................................. 32
3.2. Lean ............................................................................................ 33
3.2.1. Background ...................................................................... 33
3.2.2. Toyota production system ............................................... 34
3.3. Lean product development ........................................................ 38
3.3.1. Background ...................................................................... 38
3.3.2. Waste ............................................................................... 44
3.3.3. Toyota product development system .............................. 45
3.3.4. Set-based work ................................................................ 48
3.3.5. Tools used in LPD ........................................................... 50
3.3.6. Lean product development process ................................. 61
3.3.7. Knowledge gain ............................................................... 63
3.3.8. Implementation of lean product development ............... 65
3.4. Processes .....................................................................................67
3.4.1. Identification ....................................................................67
3.4.2. Mapping .......................................................................... 68
3.4.3. Measuring the process performance ............................... 69
3.4.4. Managing the process ..................................................... 70
3.4.5. Process owner ................................................................... 72
3.4.6. Process audit .................................................................... 77
3.4.7. Process change ................................................................ 78
3.4.8. Successful process change............................................... 80
3.5. Fast moving consumer goods ..................................................... 83
XIII
3.5.1. Characteristics .................................................................. 83
3.5.2. Procter & Gamble ............................................................. 83
4. Best practice framework .......................................................................... 86
4.1. Lean product development maturity model ............................... 86
4.1.1. The model ......................................................................... 86
4.1.2. Best practice framework .................................................. 87
4.2. Survey for waste- and problem identification ............................ 90
5. Current new product development process ............................................ 91
5.1. Description of the new product development at Oriflame .......... 91
5.2. Management of the process ........................................................ 96
5.3. The stage and gate process.......................................................... 98
5.4. New innovation part of the stage and gate process .................. 102
5.5. Common problems at stages ..................................................... 103
5.6. Common problems at the gates ................................................ 103
6. Problem identification and analysis ...................................................... 104
6.1. NPD process manager’s view .................................................... 104
6.1.1. Identified problems ........................................................ 105
6.1.2. Gap analysis ................................................................... 107
6.2. Analysis of the survey ................................................................ 111
6.2.1. 7 wastes ........................................................................... 111
6.2.2. 13 principles .................................................................... 113
6.2.3. Qualitative questions ...................................................... 114
6.3. Comparison between process managers’ and the NPD staff’s opinion .............................................................................................. 116
6.4. Identified areas of improvement ............................................... 118
6.4.1. Technology ...................................................................... 119
6.4.2. Front-load the process .................................................... 119
6.4.3. Responsibilities, ownership and management ............... 119
6.4.4. Continuous improvements ............................................ 120
6.4.5. Employee development ................................................. 120
XIV
6.4.6. Push rather than pull ..................................................... 121
6.4.7. Standardization .............................................................. 121
6.4.8. Alignment ....................................................................... 122
6.4.9. Communication .............................................................. 122
6.4.10. Organizational learning ................................................ 123
6.4.11. Variations in work-load ................................................ 123
7. How to improve the new product development process ....................... 124
7.1.1. LAMDA ............................................................................ 125
7.1.2. Management and ownership .......................................... 125
7.1.3. A3-reports ....................................................................... 128
7.1.4. Visual management ........................................................ 129
7.1.5. Continuous improvements ............................................. 131
7.1.6. Knowledge database ....................................................... 134
7.1.7. Standardization ............................................................... 134
7.1.8. Employee development .................................................. 136
7.1.9. Technical solutions ......................................................... 136
7.1.10. Set-based work .............................................................. 137
7.2. Suggestion summary ................................................................. 139
8. Conclusions and recommendations ...................................................... 140
8.1. Improvement prioritization ....................................................... 140
8.2. Recommendations to Oriflame ................................................. 142
8.3. Conclusions of the master thesis ............................................... 143
8.4. Suggestions for further investigation ........................................ 144
9. List of references .................................................................................... 145
10. Appendix .............................................................................................. 151
10.1. Lean product development maturity model ............................ 151
10.2. Questionnaire for identification of problems and waste ......... 158
10.2.1. Introduction .................................................................. 158
10.2.2. Waste identification (From 7 wastes in LPD) .............. 158
XV
10.2.3. Problem identification (From 13 principles of LPD) ... 160
10.2.4. Reflections.................................................................... 165
10.2.5. Cover letter ................................................................... 165
10.3. Project room ............................................................................ 167

1
1. Introduction The Introduction chapter contains a brief description of the company and
an initialization to the problem that this master thesis is built on, which
leads to a definition of the problem itself. This chapter also explains the
purpose and delimitations of this master thesis and whom it is aimed to.
Finally an outline of the report is presented.
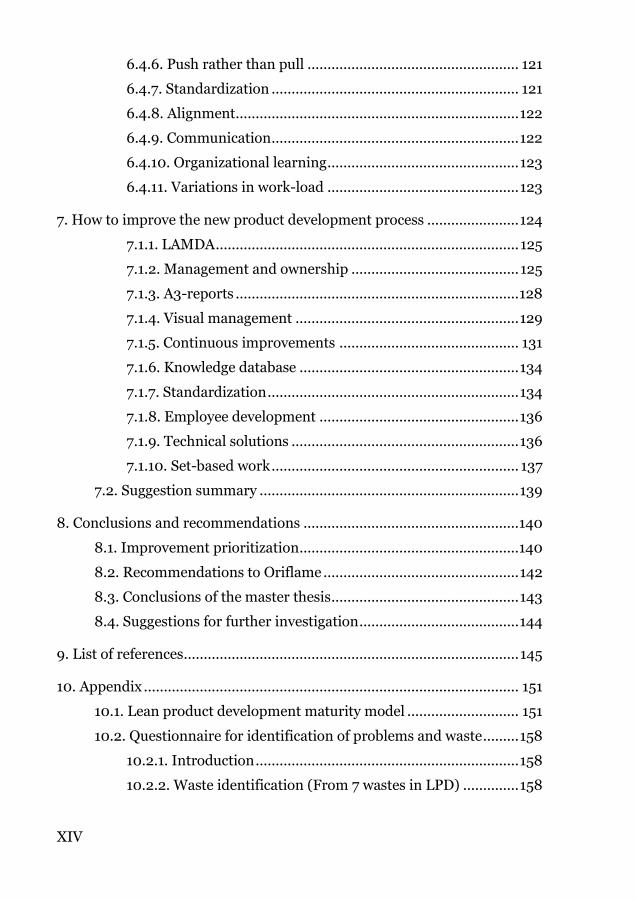
1.1. Company introduction Oriflame1 is a cosmetics company that was founded back in 1967 by two brothers, Jonas and Robert af Jochnick, and their friend Bengt Hellsten. Today Oriflame is a multi-national company with over 1.3 billion Euros in annual sales with a vision to “be the #1 Beauty Company Selling Direct”. Oriflame is present in 60 countries and is being market leader in more than half of them. Oriflame is a direct selling company which allows customers to get advice and inspiration from people they know and trust. As of today there are approximately 3.3 million consultants selling Oriflame’s products around the world (Oriflame Cosmetics, 2010).
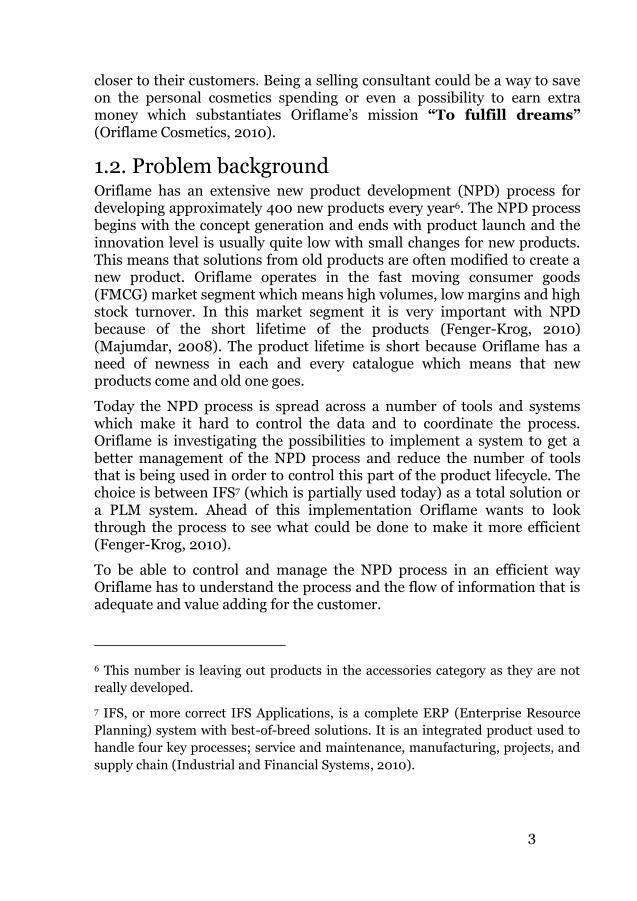
Oriflame’s divides their world-market into Latin America, EMEA2, CIS3 & Baltics, ASIA and finally Franchisees4. Oriflame has its production
1 Short for Oriflame Cosmetics S.A.
2 Europe, Middle-East, Africa
Figure 1.1 – Share of total sales per market
(Viklander & Möller, 2010)
2
situated in Ekerö/Stockholm (Sweden), Warsaw (Poland), Krasnogorsk/Moscow (Russia), Noida/New Delhi (India), and Kunshan (China). Oriflame has a global R&D center5 with more than 100 scientists (ibid) (Oriflame Cosmetics, 2010). The undoubtedly biggest market is CIS & Baltics which has 56 % of the total sales, EMEA counts for 30 % and Asia and Latin America is still very small with 9 % and 5 % but they are growing rapidly. The market distribution can be seen in Figure 1.1.
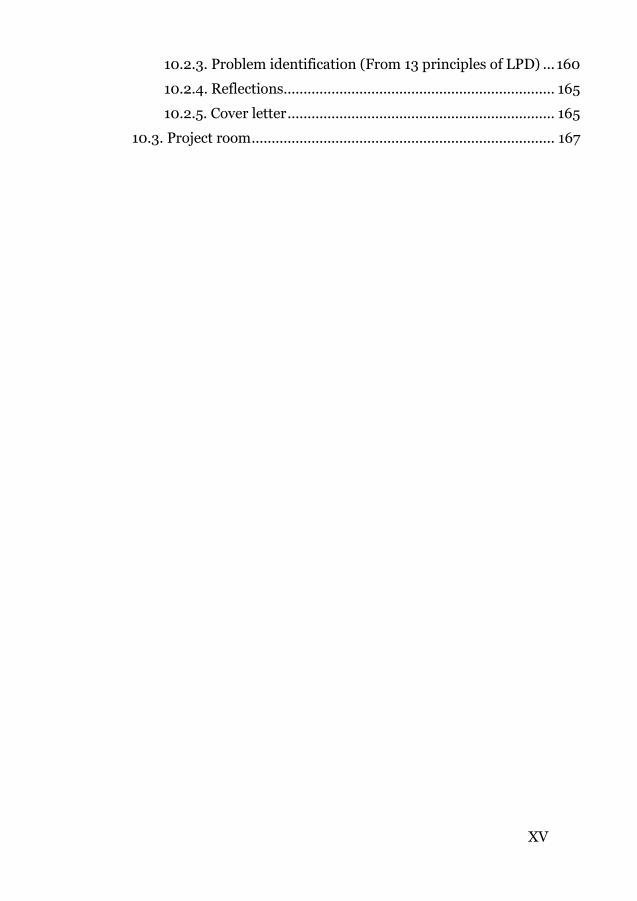
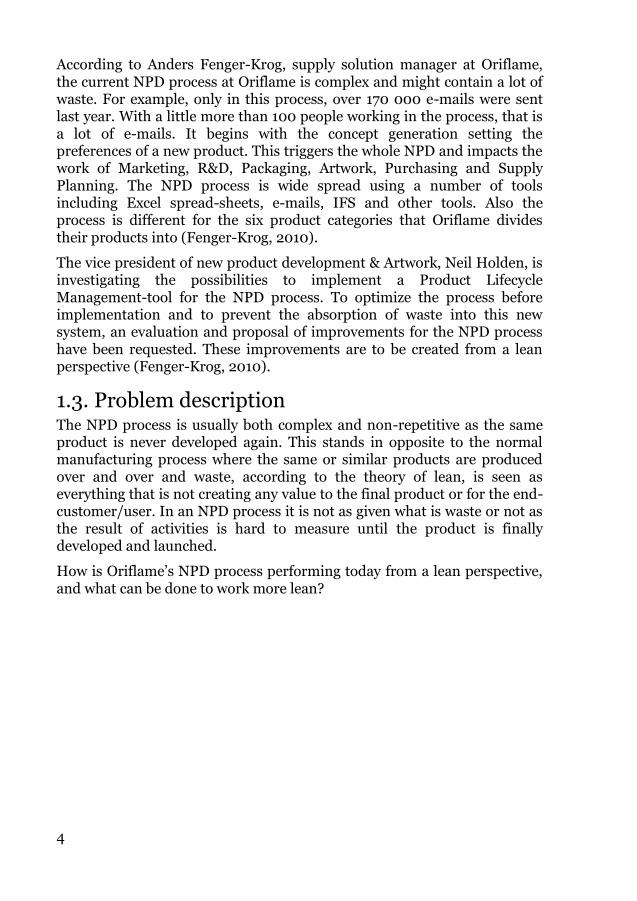
Oriflame has six different product categories; color cosmetics together with skin care being the largest in sales, 25 % each, followed by personal & hair care, 20 %, and fragrances, 19 %. The last two categories, accessories & wellness, add up to 11 % (Oriflame Cosmetics, 2010). This is visualized in Figure 1.2 below.
Oriflame’s direct selling is based on consultants selling products directly to their customers e.g. via home-parties, at the workplace or to friends and family which is different from selling through the traditional retail stores. It means that intermediaries can be cut out but also that Oriflame gets
3 Commonwealth of Independent States is a regional organization whose
participating countries are former Soviet Republics.
4 Oriflame has established itself in a few countries using the franchisee concept.
These countries include for instance UK, Switzerland, Germany, Saudi Arabia,
UAE, Nepal, Australia, Kenya, Costa Rica and more.
5 Located in Dublin
Figure 1.2 – Share of total sales per product
group (Möller & Viklander, 2010)
3
closer to their customers. Being a selling consultant could be a way to save on the personal cosmetics spending or even a possibility to earn extra money which substantiates Oriflame’s mission “To fulfill dreams” (Oriflame Cosmetics, 2010).
1.2. Problem background Oriflame has an extensive new product development (NPD) process for developing approximately 400 new products every year6. The NPD process begins with the concept generation and ends with product launch and the innovation level is usually quite low with small changes for new products. This means that solutions from old products are often modified to create a new product. Oriflame operates in the fast moving consumer goods (FMCG) market segment which means high volumes, low margins and high stock turnover. In this market segment it is very important with NPD because of the short lifetime of the products (Fenger-Krog, 2010) (Majumdar, 2008). The product lifetime is short because Oriflame has a need of newness in each and every catalogue which means that new products come and old one goes.
Today the NPD process is spread across a number of tools and systems which make it hard to control the data and to coordinate the process. Oriflame is investigating the possibilities to implement a system to get a better management of the NPD process and reduce the number of tools that is being used in order to control this part of the product lifecycle. The choice is between IFS7 (which is partially used today) as a total solution or a PLM system. Ahead of this implementation Oriflame wants to look through the process to see what could be done to make it more efficient (Fenger-Krog, 2010).
To be able to control and manage the NPD process in an efficient way Oriflame has to understand the process and the flow of information that is adequate and value adding for the customer.
6 This number is leaving out products in the accessories category as they are not
really developed.
7 IFS, or more correct IFS Applications, is a complete ERP (Enterprise Resource
Planning) system with best-of-breed solutions. It is an integrated product used to
handle four key processes; service and maintenance, manufacturing, projects, and
supply chain (Industrial and Financial Systems, 2010).
4
According to Anders Fenger-Krog, supply solution manager at Oriflame, the current NPD process at Oriflame is complex and might contain a lot of waste. For example, only in this process, over 170 000 e-mails were sent last year. With a little more than 100 people working in the process, that is a lot of e-mails. It begins with the concept generation setting the preferences of a new product. This triggers the whole NPD and impacts the work of Marketing, R&D, Packaging, Artwork, Purchasing and Supply Planning. The NPD process is wide spread using a number of tools including Excel spread-sheets, e-mails, IFS and other tools. Also the process is different for the six product categories that Oriflame divides their products into (Fenger-Krog, 2010).
The vice president of new product development & Artwork, Neil Holden, is investigating the possibilities to implement a Product Lifecycle Management-tool for the NPD process. To optimize the process before implementation and to prevent the absorption of waste into this new system, an evaluation and proposal of improvements for the NPD process have been requested. These improvements are to be created from a lean perspective (Fenger-Krog, 2010).
1.3. Problem description The NPD process is usually both complex and non-repetitive as the same product is never developed again. This stands in opposite to the normal manufacturing process where the same or similar products are produced over and over and waste, according to the theory of lean, is seen as everything that is not creating any value to the final product or for the end-customer/user. In an NPD process it is not as given what is waste or not as the result of activities is hard to measure until the product is finally developed and launched.
How is Oriflame’s NPD process performing today from a lean perspective, and what can be done to work more lean?
5
1.4. Purpose The main-purpose of this master thesis is to propose improvements to Oriflame’s NPD process from a lean perspective. This purpose can be divided into the following sub-purposes:
To create a framework that can be used for NPD process
improvements in the FMCG segment.
To evaluate Oriflame’s NPD process using “lean eyeglasses”.
To create a report that provides Oriflame with the information it
needs to better understand the NPD process, the areas that are in
need of improvement and to give Oriflame recommendations where
they can improve the process from a Lean perspective.
1.5. Delimitations Because of limited time and resources in this master thesis and to focus on the most relevant areas, delimitation has been done. To clarify what is included and what is not this information will be provided as in scope of the thesis and out of scope of the thesis.
In scope
The thesis evaluates the NPD process from the ‘concept brief’ to the ‘silver seal’ in Oriflame’s stage and gate process8. It will include five of Oriflame’s six product categories, leaving Wellness out as it is a fairly new product category.
Out of scope
The three stages ‘idea generation’, ‘produce’ and ‘launch’ in Oriflame’s stage and gate process will be excluded from the evaluation. This is as ‘idea generation’ is actually considered as belonging to another process; the innovation process, and the main product development is done ahead of ‘produce’ and ‘launch’. Neither will any extensive mapping of the processes or any deep activity specific evaluation be executed. Technical solutions will not be regarded in detail as it is not a part of the lean theory.
8 Better described in section 5.3. The stage and gate process
6
1.6. Target group This report has two main target groups. The first one is the academic group which contains students and researchers in the area of lean product development and process-based business development. The second group is the management team and the employees in the new product development group at Oriflame.
7
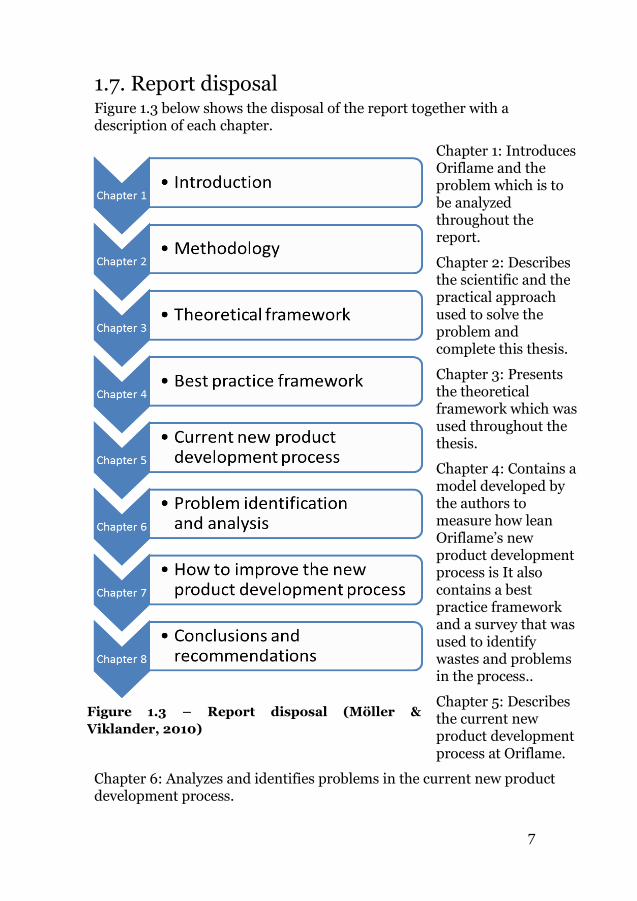
1.7. Report disposal Figure 1.3 below shows the disposal of the report together with a description of each chapter.
Chapter 1: Introduces Oriflame and the problem which is to be analyzed throughout the report.
Chapter 2: Describes the scientific and the practical approach used to solve the problem and complete this thesis.
Chapter 3: Presents the theoretical framework which was used throughout the thesis.
Chapter 4: Contains a model developed by the authors to measure how lean Oriflame’s new product development process is It also contains a best practice framework and a survey that was used to identify wastes and problems in the process..
Chapter 5: Describes the current new product development process at Oriflame.
Chapter 6: Analyzes and identifies problems in the current new product development process.
Figure 1.3 – Report disposal (Möller &
Viklander, 2010)
8
Chapter 7: Gives a number of solutions on how to make the new product development process leaner and weighting them against each other.
Chapter 8: In this chapter conclusions that were drawn throughout the thesis are presented together with recommendations and solution prioritization to Oriflame. Finally recommendations for further studies are presented.
9
2. Methodology This chapter will be a guide through the methodology used in this master
thesis. The first part discusses the scientific approach followed by
explanations on data gathering, methods of analysis and credibility which
also includes a description of how these parts was done in this thesis to
ensure a good scientific level. The second part which is built on the
decisions taken in the scientific part presents how the practical work was
done with an explanation for each phase of the thesis.
2.1. Scientific approach A thesis can get different results depending on which scientific approach is being used. In this section different methods are presented and the ones being used in the thesis is described in more detail.
2.1.1. Introduction
There are two major approaches that are commonly used in a scientific work, the first one is inductive, which means that the empiric is studied and data is collected. From that data, theory is then formed out of general and theoretical conclusions. It is commonly mentioned that the data collection should be done completely open-ended. The second one is the deductive approach which means it is based on existing theory in the subject that is verified with help from gathering of facts (Eriksson & Wiedersheim-Paul, 2006, pp. 83, 85).
There is a third approach that is called abduction. That is a method to draw conclusions on what the reasons are for an observation. This is the method to use if an effect is found and reasons for that effect is being sought and cannot be manipulated (Wallén, 1996, p. 48).
The inductive approach was used in this master thesis. A best practice model and a questionnaire were built based on literature. The model was compared to the way Oriflame works and the questionnaire identified wastes and problems in the NPD process. From the model and the questionnaire, conclusions were drawn from which proposals could be created on how to improve the process. This way of work is motivated by the fact that a lean perspective was to be used to improve the new product development process.
10
2.1.2. Approach depending on knowledge
The level of ambition in a research project is depending on the knowledge in that specific area. The literature separates four different approaches; explorative studies, descriptive studies, explanatory studies and normative studies.
Explorative studies are when the research purpose is to get basic knowledge about the problem area, i.e. what are typical cases, what needs to be studied, what are typical variables and concepts.
Descriptive studies are done to decide characteristics for the area being researched. This is where collection of data and systematization in the area is done. Also, values for variables are decided and connections are defined.
Explanatory studies explain a problem area and decides what kind of explanation is relevant (intention-issue, cause-effect, system effects, “mechanisms”, etc.)
Normative studies should end up in an action- or norm-proposal. This could be proposals on how to make a company’s production line more effective or efficient. The objective for the researcher is to show different standpoints and action plans and their consequences. If the researcher takes a standing it is important to declare these statements as they could affect the result (Wallén, 1996, pp. 46-47).
In this master thesis a normative study is used. The lean philosophy is used to evaluate the NPD process at Oriflame which should result in proposals for improvements.
2.2. Data gathering The best way to gather data is defined by the purpose of the thesis, which in this case was to create a general picture of the current situation. In this master thesis a qualitative study was used. When using a qualitative study the result will be based on the perception of the authors as interpretation of information is used rather than calculation of data. Therefore it is of necessity that the authors have a good knowledge in the subject. The result of using a qualitative study instead of a quantitative is that a deeper understanding in the subject is given instead of creating a picture out of measurements (Eriksson & Wiedersheim-Paul, 2006, p. 120).
Depending on why the data is created it can be divided into two groups, primary and secondary data. Primary data is when the data is created for the specific study while secondary data is when the data already exist in some way but can be used for the study (Eriksson & Wiedersheim-Paul, 2006, p. 120).
11
The authors of this thesis have used both primary and secondary data. By doing interviews with key people in the organization, primary qualitative data describing the way Oriflame works was created. Also secondary data in the form of structural capital9 from Oriflame was used. The authors are convinced that the use of qualitative data from many sources gives the best description of the current situation when a process involving many perspectives and people is to be described.
2.2.1. Literature review
There are many alternative ways to gather information for a master thesis and how it is done is often dependent on the type of approach that is used. When gathering information there are three criterions that should be balanced (Eriksson & Wiedersheim-Paul, 2006, pp. 86-87):
Cost
Quality
Accessibility
It is hard to gather good information at no cost in a fast and easy way. For example, quality can often be improved with increased cost.
A literature review has the strength that it is an easy and time-saving way to gather information. In this thesis, literature is defined as written material, e.g. books, articles, magazines, etc. It is of great importance to be critical about the material that is read as it is easy to manipulate text. Primarily books by recognized authors and articles from journals and magazines have been used as sources in this thesis. In some cases Internet sources have been used which is mainly when company-specific material and material only published on Internet was needed. In these cases great source skepticism was practiced to be sure that the information was reliable.
9 Competitive intelligence, formulas, information systems, patents, policies,
processes, etc., that result from the products or systems the firm has created over
time. One of the three types of intellectual capital (the other two are 'customer
capital' and 'human capital'); it does not reside in the heads of the employees and
remains with the organization even when they leave (BusinessDictionary.com,
2010).
12
2.2.2. Interviews
There is often a need to do interviews to gather information that is not documented. That means turning to people that has a better understanding in the subject being investigated. Depending on the knowledge of the interviewer, the way the interview is performed might stretch from very structured to unstructured. For example, a skilled interviewer can use an unstructured interview to really get down deep into the subject. There are different ways of interviewing (Eriksson & Wiedersheim-Paul, 2006, pp. 98-99):
Visiting interviews
Telephone interviews
Surveys
Instead of a question-based interview, the interviewer can let the interviewee do more of a talk while the interviewer is more of a sounding board. These kinds of interviews might lead to a more mutual trust and respect which could result in unexpected aspects in the subject. When having a guided interview, there is a risk of missing information because of the interviewer’s perception.
The interviews held in this thesis were only visiting interviews as this was the best way to do it, a better dialogue could be held as the discussion gets more personal when visiting the interviewee. The interviews where performed in two different ways depending on the purpose of the interview. Two interviews were held to get a better view of 1) the IBM process10 and 2) the innovation process. These interviews were structured so that the interviewee had the chance to present the process and if any questions appeared they were asked. The rest of the interviews were with the process managers for the NPD process, one at a time. These interviews were divided into two parts, the first one was a discussion about the lean maturity level of the process, the second one and was done as semi-question based, semi-talk with the authors guiding the interviewee through the process with some questions for each stage. For each interview the result was written down and reviewed and if doubts or questions remained after the interview these could be dealt with in the next interview as every interview handled the same process. All interviews were done by both
10 Integrated Business Management which is a top-management process used to
control decision making
13
authors with one doing the interview and the other one writing down the answers, to ensure better reliability in the information.
2.2.3. Surveys
There are different kinds of surveys that can be used. Questionnaires can be used to collect opinions and views from a large number of people. The questionnaire contains mainly fixed questions with fixed answer alternatives. The questionnaire can be distributed in different ways (Höst, Regnell, & Runeson, 2006, pp. 85-66):
group-questionnaire (distributed to a group)
to visitors of a certain place
to people that is especially interested
or via the computer
How the questionnaire can be used is decided by how the respondents are chosen. The respondents can be chosen from a population or a frame that is to be examined. The first step is to understand exactly what population the research is covering. From that population there are different methods of deciding the respondents (Höst, Regnell, & Runeson, 2006, pp. 86-87):
Total research: Everyone in the population
Unbound random selection: Totally random selection
Systematic selection: E.g. every N:th person in the population
Cluster selection: First decide which clusters to use then chose
which people in that cluster, which is done by random selections
Stratified selections: The clusters differ from each other and are
first separated by that characteristic. After that separation the
respondents are chosen by using another method
When doing a survey there can be losses in the response rate and in the responses. If there are people who does not respond at all that is called external loss and if someone does not respond to a certain question that is called internal loss. Losses should not be compensated by choosing new respondents as that could affect the selection and therefore the result (Höst, Regnell, & Runeson, 2006, p. 87). It is important to be careful if there is any systematic loss or if the loss is very big. This could result in a bad result of the survey (Wallén, 1996, p. 63).
The core of a questionnaire is how it is designed and there is a lot of aspects have in mind, e.g. (Höst, Regnell, & Runeson, 2006, p. 87):
14
Simple language
Short, concise questions
Unambiguous questions
One question at the time
Symmetry
Neutral options
Etc.
How the answers are designed is also important. A Likert-scale can be used to let the respondent answer to a statement. A Likert-scale is of five or seven levels and covers everything from “completely disagree” to “completely agree” if the scale is agreement (Höst, Regnell, & Runeson, 2006, p. 88).
It is also important to let a small group test the questionnaire before it is distributed to the selected group. This is done to get comments on the design of each question but also to identify if anything is unclear or wrong (Höst, Regnell, & Runeson, 2006, p. 88).
The invitation to the questionnaire should contain a cover letter. The cover letter could be sent out on a company- or school- specific paper or, if sent by e-mail, it should be sent from a company or school address. The cover letter should contain the following information (Höst, Regnell, & Runeson, 2006, pp. 88-89):
Purpose of the survey
Why the person was selected
Information that the questionnaire is voluntary
Answering policy and time limits
Confidentiality
Contact person(s)
As the NPD process at Oriflame was a large and complex process the authors chose to narrow the evaluation down. Instead of going very deep into the process and each activity of it, an analysis was done with a questionnaire that was sent out to the people working in the process. The most time-saving way to do this and to ease up the analysis of the responses, the form was created online with a tool called Google Docs11.
11 http://docs.google.com/
15
The population to be investigated is people working in the NPD process at Oriflame. This population is pre-divided in two ways like a matrix determined by the organizational structure at Oriflame. The first divider is each product category which divides the group into five different sectors with approximately 15-20 people working for each product category. The second divider is the functional group within Oriflame and the NPD process. A total research of this population was used as no easy way to select people from this population was found and the size of the population seemed manageable.
The survey contained statements that were to be answered from the interviewees’ perspective. The answers were graded on scales, one for frequency and one for agreement. The survey tool could only handle scales with up to five grades and therefore that amount was used. It is important to use a good scale so that the interviewees does not misunderstand or misinterpret the scale. (Henning, 2009)
For agreement these grades were used (Henning, 2009):
Completely disagree
Somewhat disagree
Neither agree nor disagree
Somewhat agree
Completely agree
And for frequency these grades were used (Henning, 2009):
Never
Rarely
Sometimes
Often
Always
After the survey had been created a review group was created to ensure the validity. The review group consisted of:
16
Manager at Oriflame
Employee at Oriflame who is not connected to NPD process
Manager consultant working with lean
Senior manager consultant working with lean
Professor in Engineering logistics
Each member of the review group came with inputs from their point of view and the survey was updated with these inputs in mind.
Finally the questionnaire was E-mailed to the respondents by the Vice President of New Product Development & Artwork at Oriflame who made it clear this was an important task. The E-mail contained a cover letter which can be found in 10.2.5. Cover letter.
2.2.4. Previously gathered data
Data that is previously gathered in a purpose other than for the thesis can also be used as it often contains information that is of value for the authors. This kind of secondary information needs to be validated from four different aspects (Björklund & Paulsson, 2003, p. 77).
Is the information current?
In how many different and independent sources does the
information exist?
Is the information taken from the original source?
Are the information angled in any way?
The kind of files used in this thesis is typically descriptive files, such as organization charts and PowerPoint-presentations about the company and its processes, but also more working documents such as tracker sheet12, and MS Project13 files.
2.3. Methods of analysis Different methods to analyze data can be used depending on the data that has been collected. These methods are usually divided into two main
12 Oriflame uses a spreadsheet to manage and track the progress of their projects.
13 Microsoft Project is an application for planning, following up and sometimes
reporting a project and also to visualize it as e.g. a Gantt-chart, which Oriflame
uses to plan and describe the process.
17
categories depending on the character of the data; quantitative analysis and qualitative analysis. (Höst, Regnell, & Runeson, 2006, p. 110)
2.3.1. Quantitative analysis
A quantitative analysis is used for analyzing quantitative data, which is data that is represented by numbers. Usually statistical methods are used for this and there are two main areas used to investigate the data; either to explore data to get understanding of it, or to show relations and prove or reject hypotheses.
The explorative investigation could be done through different means but the main reason is to measure and visualize the data to describe its significance. Usually this description can be done through e.g. histogram14, “box-plots”15 or xy-diagram16.
To investigate the relation between two factors the relation coefficient can be used, which describes the covariance of the two factors.
An important step in a quantitative analysis is to find and remove or correct false data. This data could be an effect of misconception, measurement error or similar reasons. A technique to identify these values is e.g. the “box-plot” where atypical values can be sorted out.
There are a lot of other tools that can be used in a quantitative analysis but it all depends on which kind of data is collected and being analyzed. (Höst, Regnell, & Runeson, 2006, pp. 110-113)
2.3.2. Qualitative analysis
There is a big difference between analyzing qualitative data and quantitative data. Qualitative data contains words and descriptions which is very hard to measure in medians and mean values. However the existence of words, concepts and descriptions is important in an analysis
14 A histogram is a graphical representation, showing a visual impression of the
distribution of data. It is an estimate of the probability distribution of a
continuous variable.
15 Also known as box-and-whisker diagram is a way of graphically depicting
groups of numerical data through their five-number summaries: the smallest
observation, lower quartile, median, upper quartile, and largest observation.
16 It is used to plot series which are described by both axes; the axis of arguments
(x) and the axis of values (y).
18
and sometimes also the frequency of them. The approach in analyzing qualitative data can be divided into four groups.
Quasi-statistic methods: Is built on the method of counting words
or groups of words in different texts. Doing this makes it possible to
compare how important the meaning of different terms is for
different people.
Template based methods: Starts with a template of key words that
are searched for in the qualitative data. The list of key words is
compiled from the theoretical framework and terminology in the
area of subject. Segments of text from the interviews are connected
to these key words through markings in the text and by placing the
key words in a matrix and comparing which interviewees or
documents that are mentioning which key words. The focus is not
on how many different sources are saying the same instead the
focus is on who said what.
Editing methods: As the template based method focused on
creating categories of subjects so does this method. The difference
is that the editing method is not built from key words. Instead it is
seeking key words in the data material. Different patterns and
contents are sought by the analyzer. An example of this method is
the grounded method.
Deepened methods: This method is not of a scientific character as it
cannot be described symmetrically. However this method is built on
the analyzer investigating the data and draws conclusions out of his
or her intuition and creativity.
How the qualitative analysis process is performed can be described schematically with four steps. Qualitative studies are often quite flexible which means these steps can be run through many times.
Data collection: This step includes interviews, observations,
transcription, archive search, etc. Everything that is done to create
a document that is possible to analyze.
Coding: How to differ important sayings or concepts from
unnecessary information that can be excluded. Often done by
connection with key words or by marking whole parts of an
interview to get the context.
Grouping: In this step different segment of text is grouped so that it
is easy to see who said what and what is said about different key
19
words. I.e. if someone has positive thoughts about something and
someone has negative thoughts, grouping enables the analysis of
this phenomenon. It might be a pattern that these persons has
completely different roles and therefore thinks in different ways.
Conclusions: Based on the grouped data it is possible to draw
conclusions
When doing a qualitative analysis it is often meaningless to seek conclusions that “80 % of the respondents are negative to this phenomenon”. These conclusions are always dependent on the population and the selection of respondents. The conclusions should also be traceable back to the source. This demands documentation of the analysis. (Höst, Regnell, & Runeson, 2006, pp. 114-116)
2.4. Credibility The credibility of a study is depending on the sources of information and knowledge. When using different sources, every one of them must be evaluated on their validity, reliability and relevance, and different sources demands different ways of evaluation (Eriksson & Wiedersheim-Paul, 2006, p. 167). The following section will present the credibility of this master thesis.
2.4.1. Validity
Validity is to only measure what is intended to measure. A more generic definition is that the measuring tool does not contain any systematic errors. This is met by concrete definitions, a good view of background factors and reason-effect relations, through a clear planning of the research (Wallén, 1996, p. 67).
The authors of this thesis have held the validity of this thesis high trough a dialog with the involved people at Oriflame. They have been given the opportunity to give feed-back to the authors on faults and misunderstandings that have appeared. The authors have also interviewed many different people and during this interview double checked that the information corresponds.
2.4.2. Reliability
This is when the measuring tool is reliable which means that if the object being measured is stable the result should be the same for every measure. The measuring tool should be free from random errors is a more generic definition. To get a higher degree of reliability control questions can be put into e.g. interviews or surveys (Björklund & Paulsson, 2003, pp. 59-60).
20
During the thesis many people, from different functions and categories at Oriflame, have answered the survey to get a high degree of reliability. The NPD process managers from all different categories have been interviewed for the same reason. The results from the interviews have been compared with the results from the survey and a discussion between the authors was held to understand the differences. Before the survey was sent out to the people in the process, it was reviewed by a test group, see 2.2.3. This review led to changes in the survey and to higher reliability. To get an even higher degree of reliability in the survey, the name of the answering person was required.
During the interviews one of the authors asked the questions and the other one wrote down the answers, after the interview the answers were reviewed by the interviewing author to reduce the number of misunderstandings.
2.4.3. Relevance
Relevance is also called internal validity. It is the logical relationship between a study and the existing theory in the area. This means that if many dimensions of a theory are measured at the same time the results of the different dimensions need to correspond with each other. An example could be that if a study of motivation and efficiency of production workers are done, the theory gives expectations of that the most motivated people also are the most efficient (Bjerke & Arbnor, 1994, p. 256).
During the construction of the maturity model and the survey the questions were discussed, between the authors, to ensure that it was relevant to the theory. A test group and the supervisors also reviewed the material before it was used to collect data from Oriflame.
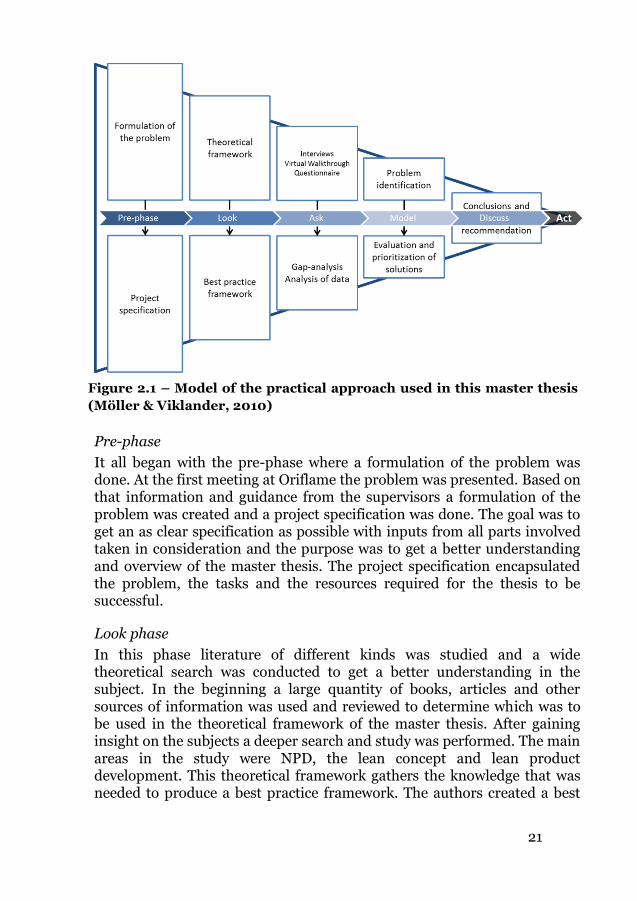
2.5. Practical approach The practical approach that has been used in this master thesis is shown below in and can be described best as a LAMDA17 model with a pre-phase for defining the project and excluding the last A, Act, as any implementation is not included as a part of this thesis. In the beginning of the thesis the perceived image of the study was wide, described by the wide part of the triangle, but as the study preceded it was narrowed down, so that specific conclusions and recommendations could be delivered at the end.
17 See “3.3.5. Tools used in LPD”
21
Pre-phase
It all began with the pre-phase where a formulation of the problem was done. At the first meeting at Oriflame the problem was presented. Based on that information and guidance from the supervisors a formulation of the problem was created and a project specification was done. The goal was to get an as clear specification as possible with inputs from all parts involved taken in consideration and the purpose was to get a better understanding and overview of the master thesis. The project specification encapsulated the problem, the tasks and the resources required for the thesis to be successful.
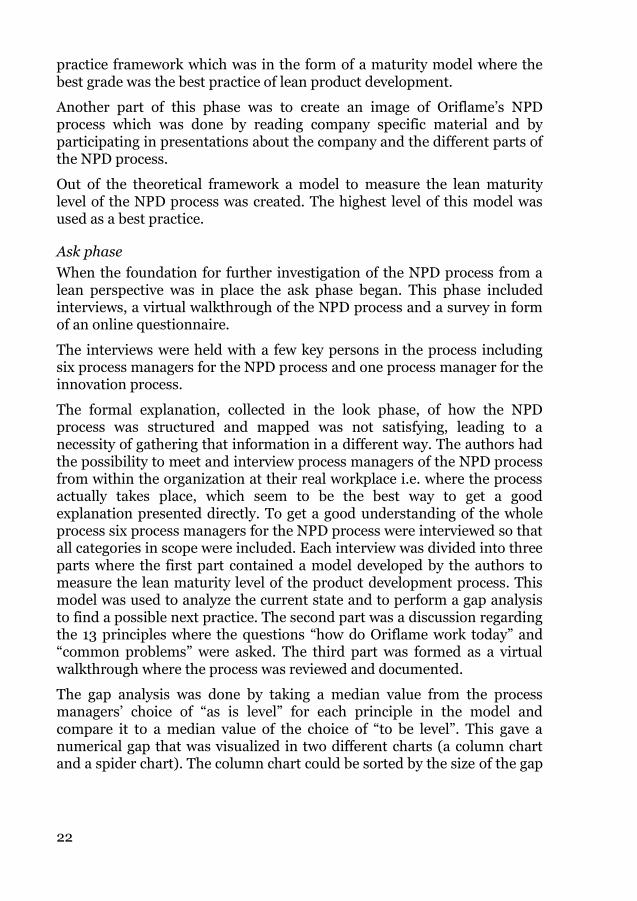
Look phase
In this phase literature of different kinds was studied and a wide theoretical search was conducted to get a better understanding in the subject. In the beginning a large quantity of books, articles and other sources of information was used and reviewed to determine which was to be used in the theoretical framework of the master thesis. After gaining insight on the subjects a deeper search and study was performed. The main areas in the study were NPD, the lean concept and lean product development. This theoretical framework gathers the knowledge that was needed to produce a best practice framework. The authors created a best
Figure 2.1 – Model of the practical approach used in this master thesis
(Möller & Viklander, 2010)
22
practice framework which was in the form of a maturity model where the best grade was the best practice of lean product development.
Another part of this phase was to create an image of Oriflame’s NPD process which was done by reading company specific material and by participating in presentations about the company and the different parts of the NPD process.
Out of the theoretical framework a model to measure the lean maturity level of the NPD process was created. The highest level of this model was used as a best practice.
Ask phase
When the foundation for further investigation of the NPD process from a lean perspective was in place the ask phase began. This phase included interviews, a virtual walkthrough of the NPD process and a survey in form of an online questionnaire.
The interviews were held with a few key persons in the process including six process managers for the NPD process and one process manager for the innovation process.
The formal explanation, collected in the look phase, of how the NPD process was structured and mapped was not satisfying, leading to a necessity of gathering that information in a different way. The authors had the possibility to meet and interview process managers of the NPD process from within the organization at their real workplace i.e. where the process actually takes place, which seem to be the best way to get a good explanation presented directly. To get a good understanding of the whole process six process managers for the NPD process were interviewed so that all categories in scope were included. Each interview was divided into three parts where the first part contained a model developed by the authors to measure the lean maturity level of the product development process. This model was used to analyze the current state and to perform a gap analysis to find a possible next practice. The second part was a discussion regarding the 13 principles where the questions “how do Oriflame work today” and “common problems” were asked. The third part was formed as a virtual walkthrough where the process was reviewed and documented.
The gap analysis was done by taking a median value from the process managers’ choice of “as is level” for each principle in the model and compare it to a median value of the choice of “to be level”. This gave a numerical gap that was visualized in two different charts (a column chart and a spider chart). The column chart could be sorted by the size of the gap
23
so that the biggest gap came first. This procedure gave a good view on which principles to focus on.
To get an understanding on what is done before the NPD process begins an interview with Oriflame’s innovation process manager was held. In this interview a brief introduction to the current innovation process was held, but also a new innovation process was presented which was inspired by lean. This new process was to be introduced for super launches18 in a near future.
As the NPD process was such a complex process the authors realized that a deep investigation on how the process worked on an activity level was not possible to perform due to time restrictions in the thesis. Therefore another way of collecting information about the work in the process was sought and the choice was to do a survey among the people working in the process. The population included all people involved in NPD from the categories in scope of the thesis.
From the data collected in the ask phase a current state could be described. This includes the current process designed as a stage and gate process, different kinds of projects divided by innovation level and significance, and some information about amount of projects and organization structure.
Model phase
The model phase was divided into two parts:
Identification of problems from a lean perspective
Identification and evaluation of possible solutions
The problem identification was done to sort out and prioritize problem areas. This was done in different ways for each collection of data.
From the interviews of the process managers, their common views were collected and stored into one table for each principle that was being investigated. This table contained information about how Oriflame works today and the problems that could be the reason for not reaching a higher level in the model. Out of this table, problem areas were listed with concrete examples for each problem area, together with an explanation on which principles this problem mainly affects.
18 See under super launches in section 5.1.
24
From the survey, three different parts were excluded. There was quantitative data from the 7 wastes section and from 13 principles section, and also qualitative data from the qualitative questions.
The quantitative data was in form of statements of frequency and agreement. These statements were transformed into grades from one to five where one indicated it was “not lean” or “a problem from a lean perspective”, and five indicated “lean” or “good from a lean perspective”. Thereafter the questions could be sorted by average values. When the questions were sorted the ones with the lowest value where looked at and from these problem areas were identified and automatically ranked as the value existed from the questions.
For the qualitative answers key words were sought for in each respondent’s answers. These key words were then translated into problem areas and ranked by number of respondents who thought similarly. When another respondent suggested a similar problem (key words matched) the rank increased and was then presented in percent of respondents (out of those who gave qualitative answers) who thought likewise. This list could then be sorted to show which problem areas that were mentioned most often.
From these different areas 11 areas of improvements were suggested by the authors. When the areas of improvement were analyzed the authors found different tools from the lean product development theory that could help solving that problem. These tools helped the authors to come up with specific improvement suggestions for Oriflame’s NPD process. These suggestions are a mix of the tools and the theory that is the foundation of lean product development. A summary of the improvement suggestions was done to see which principle each suggestion affected.
Discuss phase
The discuss phase consists of improvement prioritization, recommendations, conclusions and suggestions for further investigation. The improvements suggestions that were found in the model phase were prioritized through a discussion between the authors. This means that it was based on the experience of the authors where the cost and benefit were both approximated. The recommendations had its base in the prioritization of the improvement suggestions and the theory about lean product development implementation and process change. The authors decided on using this theory to get a more commonly supported view on what could be possible to start with. The conclusions were drawn from the authors overall view of the master thesis and the questions that has been answered along the way. To give Oriflame insight into subjects that has been discussed
25
during the master thesis but have not fitted within the limitations, a brief presentation was given about further investigations.
26
3. Theoretical framework This chapter includes the theory used in this master thesis. It begins with
theory about new product development and then introduces lean which
leads to lean product development. After that, theory about processes will
be presented and a few other important topics that are important for this
study will be briefly described. Finally characteristics about the market
segment fast moving consumer goods will be presented.
3.1. New product development The NPD process is the process for taking new products to the market and it is
often seen as the lifeblood for the company. As the global competition increases,
the consumers demand more frequent innovation and higher quality products.
To be able to create value for the customer a good working NPD process is crucial
(Monczka, Handfield, Scannell, Ragatz, & Frayer, 2000, p. 1).
Today, the life span of products decrease on the market, this means that the
product lifecycles become shorter and it is not unusual that the product
development time exceeds the product lifecycle time. Many companies today
identify product development as a process of top strategic importance
(Oosterwal, 2010).
27
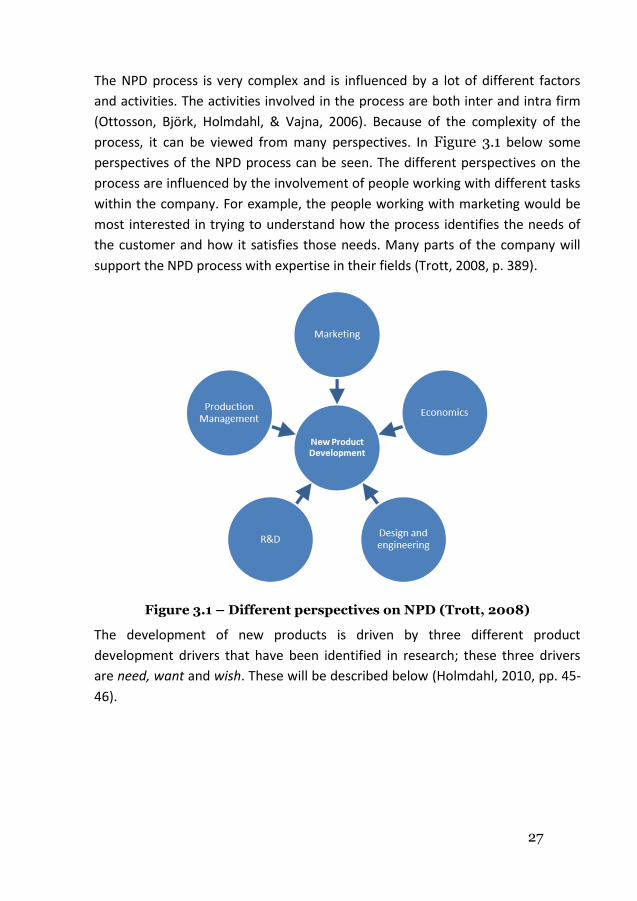
The NPD process is very complex and is influenced by a lot of different factors
and activities. The activities involved in the process are both inter and intra firm
(Ottosson, Björk, Holmdahl, & Vajna, 2006). Because of the complexity of the
process, it can be viewed from many perspectives. In Figure 3.1 below some
perspectives of the NPD process can be seen. The different perspectives on the
process are influenced by the involvement of people working with different tasks
within the company. For example, the people working with marketing would be
most interested in trying to understand how the process identifies the needs of
the customer and how it satisfies those needs. Many parts of the company will
support the NPD process with expertise in their fields (Trott, 2008, p. 389).
Figure 3.1 – Different perspectives on NPD (Trott, 2008)
The development of new products is driven by three different product
development drivers that have been identified in research; these three drivers
are need, want and wish. These will be described below (Holmdahl, 2010, pp. 45-
46).
28
Need: The product is quite common and the innovation level is low.
Want: A few examples of the product exist. It could also be a product
that is commonly used but lack properties of the new product. Medium
innovation level.
Wish: No product exists. The wish of this product often exists only in a
few peoples’ mind. The innovation level is high.
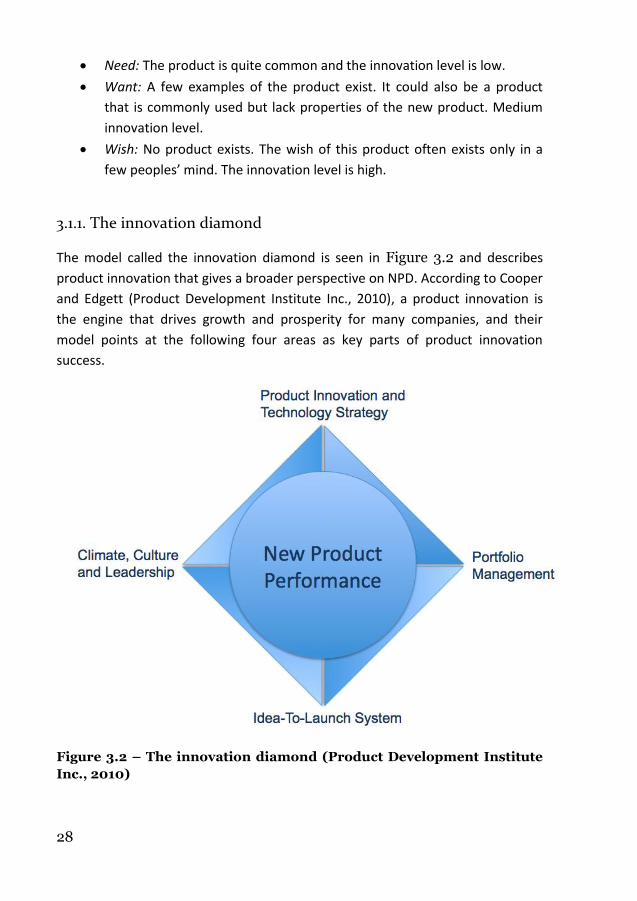
3.1.1. The innovation diamond
The model called the innovation diamond is seen in Figure 3.2 and describes
product innovation that gives a broader perspective on NPD. According to Cooper
and Edgett (Product Development Institute Inc., 2010), a product innovation is
the engine that drives growth and prosperity for many companies, and their
model points at the following four areas as key parts of product innovation
success.
Figure 3.2 – The innovation diamond (Product Development Institute
Inc., 2010)
29
1. Product innovation and technology strategy: The strategy works as a
direction guide for NPD within companies.
2. Portfolio management: It helps the business leadership team to
effectively distribute resources to the right projects; it takes both
strategic and tactical factors into calculation.
3. Idea-to-launch system: This is the NPD process. It is of great importance
that this process is of high quality if the company wants to be successful.
4. Climate, culture and leadership: Positive climate and environment are
important factors for people working in product innovation.
3.1.2. NPD models
The literature talks about many different kinds of NPD models such as Idea-To-
Launch systems or NPD processes. According to Trott (Innovation management
and new product development, 2008, pp. 407-410) it is possible to classify the
models into seven different categories, as follows.
Departmental stage-models
Activity-stage models and concurrent engineering
Cross-functional models (teams)
Decision-stage models
Conversion-process models
Response models
Network models
The most commonly mentioned models are the activity-stage and decision-stage
models. The decision-stage model is more commonly known as the stage and
gate model.
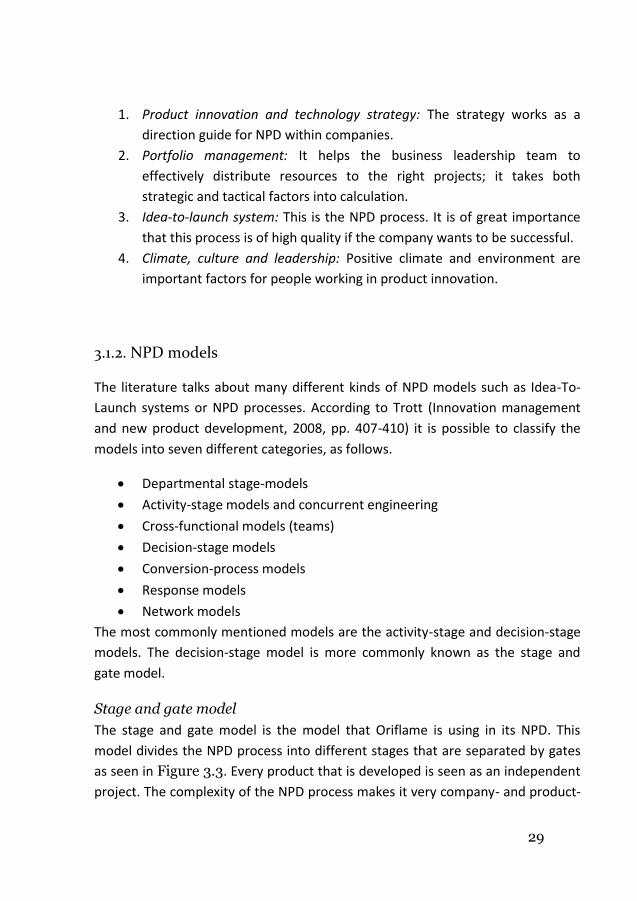
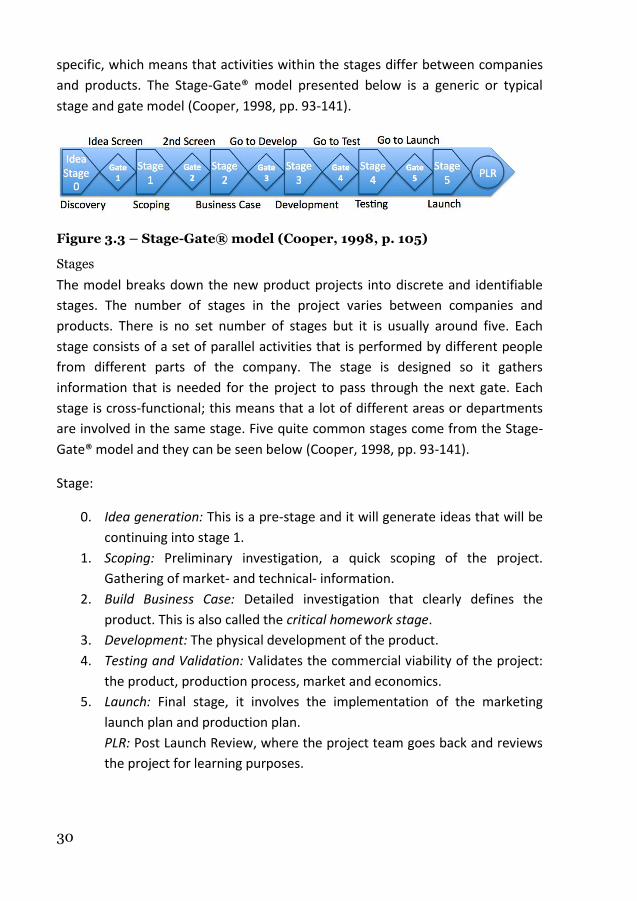
Stage and gate model
The stage and gate model is the model that Oriflame is using in its NPD. This
model divides the NPD process into different stages that are separated by gates
as seen in Figure 3.3. Every product that is developed is seen as an independent
project. The complexity of the NPD process makes it very company- and product-
30
specific, which means that activities within the stages differ between companies
and products. The Stage-Gate® model presented below is a generic or typical
stage and gate model (Cooper, 1998, pp. 93-141).
Figure 3.3 – Stage-Gate® model (Cooper, 1998, p. 105)
Stages
The model breaks down the new product projects into discrete and identifiable
stages. The number of stages in the project varies between companies and
products. There is no set number of stages but it is usually around five. Each
stage consists of a set of parallel activities that is performed by different people
from different parts of the company. The stage is designed so it gathers
information that is needed for the project to pass through the next gate. Each
stage is cross-functional; this means that a lot of different areas or departments
are involved in the same stage. Five quite common stages come from the Stage-
Gate® model and they can be seen below (Cooper, 1998, pp. 93-141).
Stage:
0. Idea generation: This is a pre-stage and it will generate ideas that will be
continuing into stage 1.
1. Scoping: Preliminary investigation, a quick scoping of the project.
Gathering of market- and technical- information.
2. Build Business Case: Detailed investigation that clearly defines the
product. This is also called the critical homework stage.
3. Development: The physical development of the product.
4. Testing and Validation: Validates the commercial viability of the project:
the product, production process, market and economics.
5. Launch: Final stage, it involves the implementation of the marketing
launch plan and production plan.
PLR: Post Launch Review, where the project team goes back and reviews
the project for learning purposes.
31
Gates
After each stage is a gate that works as a project review and decision meeting.
Project management discusses and evaluates the project and makes decisions
regarding resource allocation and possibly even termination of the project. If the
project passes the gate it will continue through to the following stage. Every gate
has gatekeepers and gatekeeping.
Gatekeepers are the management team that is the decision makers and
the resource owners. The team often consists of managers from different
levels, depending on the gate. The managers are often from different
functions within the company.
Gatekeeping is the management practice, rules, procedures and
behaviors that govern the decision-making and project facilitation. This
management practice helps the project team to move good projects
forward in a fast and effective way.
Gates have a common structure and consist of three main elements; deliverables,
criterions and outputs (Cooper, 1998, pp. 93-141).
1. Deliverables: The project teams must bring a set of deliverables, often
results of activities during the stage, to the decision point in the gate. The
deliverables should be defined for each gate; they are often decided at
the output of the previous gate.
2. Criteria: Every project is judged against a set of criterions. The criterions
are presented as a checklist with, must-meet and knockout questions.
The purpose is to eliminate projects that do not fit.
3. Outputs: The outputs are a decision and a specification of actions (as
resource allocation, deliverables and dates). The decision for every
project could be:
Go – let the project pass the gate.
Kill – terminate the project.
Hold – hold the project to later.
Recycle – go back to the stage and rework.
According to Smith and Reinertsen (Developing products in half the time, 1998, p.
165), many users of the stage and gate process are working to streamline the
process but they are primarily orientated on control rather than speed. A lot of
control then will appear in the different gates of the process. If the company
32
should focus on speed or control is depending on the type of business they are
engaged in.
3.1.3. Key performance indicator
Key performance indicators (KPI) are a measurement that indicates performance
of a company and it is instrumental in communicating to the organization what is
being valued (Björklund, Gibe, Kalling, & Setterberg, 2007, p. 9). To make sure
that a process is measured by its output it is necessary that the KPIs are defined
in a good way; it is easy to create functional silos and sub-optimizations by using
KPIs.
NPD productivity
NPD productivity is a KPI that is defined as the profit achieved from the NPD
project divided by the time and cost that was required to do the project (Cooper
& Edgett, 2005, p. 25). This is one example of a KPI that is defined to measure the
whole process’ output.
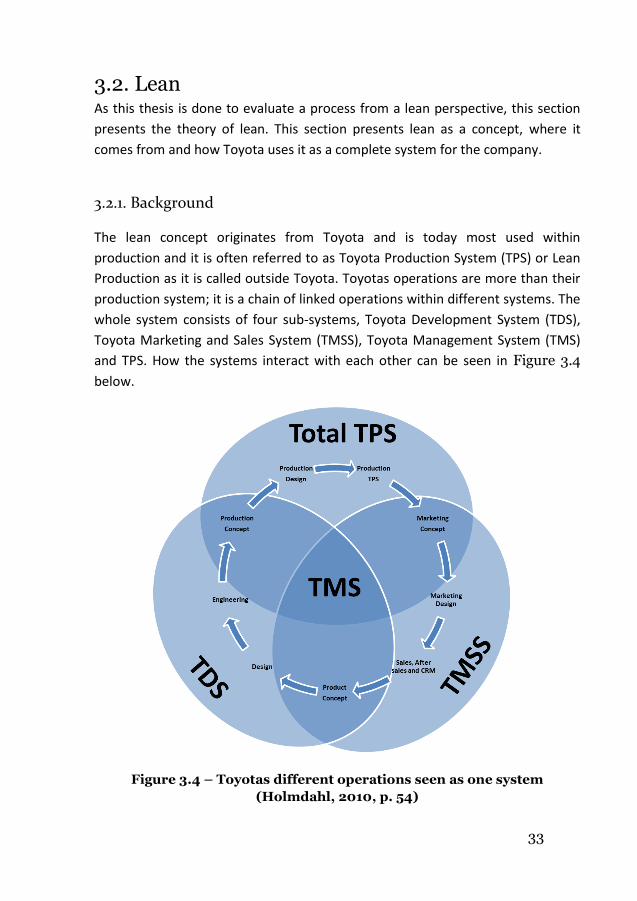
33
3.2. Lean As this thesis is done to evaluate a process from a lean perspective, this section
presents the theory of lean. This section presents lean as a concept, where it
comes from and how Toyota uses it as a complete system for the company.
3.2.1. Background
The lean concept originates from Toyota and is today most used within
production and it is often referred to as Toyota Production System (TPS) or Lean
Production as it is called outside Toyota. Toyotas operations are more than their
production system; it is a chain of linked operations within different systems. The
whole system consists of four sub-systems, Toyota Development System (TDS),
Toyota Marketing and Sales System (TMSS), Toyota Management System (TMS)
and TPS. How the systems interact with each other can be seen in Figure 3.4
below.
Figure 3.4 – Toyotas different operations seen as one system
(Holmdahl, 2010, p. 54)
34
The systems are linked together and lead by TMS, the management system. TMSS
is the system that handles the market side of Toyotas business. Toyotas product
development is handled by TDS and this is where the concept Lean Product
Development (LPD) originates from (Holmdahl, 2010, pp. 53-55). To get a better
understanding of how it all began TPS will be described.
3.2.2. Toyota production system
It all started back in 1940 when Toyota wanted to improve their productivity and
sent the chief engineer Taiichi Ohno to learn from North American mass
production. Taiichi Ohno realized that the way they produced at Ford was not
possible to implement at Toyota because of the difference in market size. He
wanted to use the same production methods but not the way they worked, and
found out that in many of the US factories the workers did not add value to the
final product and defects were repaired after the final assembly instead of being
fixed when they occurred. He went back to Japan and started to work on TPS
which later was referred to as lean manufacturing (Womack, Jones, & Roos,
1990). Since 1980s, companies throughout the world have been looking to
Toyota as a model for manufacturing. It is almost given that a company of today
needs some sort of “lean” program to be competitive. Toyota’s Product
Development System is lean in the broadest sense – customer focused,
continually improved through waste reduction, and tightly integrated with
upstream and downstream processes as part of a lean value chain (Liker &
Morgan, 2006b).
What is the secret of Toyota’s success? The incredible consistency of Toyota’s
performance is a direct result of operational excellence. Toyota has turned
operational excellence into a strategic weapon. This operational excellence is
based in part on tools and quality improvement methods made famous by Toyota
in the manufacturing world, such as just-in-time19, kaizen20 , jidoka21, and
19 JIT stands for Just-in-time and it relates to creating a flow through processes
very fast, getting the right part to the right place at the right time (Liker & Morgan,
2006b, p. 7).
35
heijunka22. These techniques helped spawn the ‘lean manufacturing’ revolution.
But tools and techniques are no secret weapons for transforming a business.
Toyota’s continued success at implementing these tools stems from a deeper
business philosophy based on its understanding of people and human motivation.
Its success is ultimately based on its ability to cultivate leadership, teams, and
culture, to devise strategy, to build supplier relationships, and to maintain a
learning organization (Liker, 2003, p. 6). Toyota Production System, or lean
manufacturing, focuses on reducing waste, muda in Japanese, in the
manufacturing process. Different kinds of waste can be identified and the chief
engineer Taiichi Ohno at Toyota has identified seven wastes (Ohno, 1988):
1. Overproduction
2. Unnecessary production
3. Inventory
4. Motion
5. Defects
6. Over-processing
7. Waiting
Womack and Jones classified activities into value adding (VA), to be continually
improved, non-value-adding (NVA), to be removed, and required non-value
adding (RNVA), which are those that are required by contract or law (Womack &
Jones, 2003). Waste can be found both in Self-evident NVA activities but also
within larger, apparently VA, activities and shows up only upon detailed
decomposition of the latter (Oppenheim, 2004).
20 Kaizen means true continuous improvements that spread throughout the
organization (ibid, p. 8).
21 Jidoka is stopping right away when a variation occurs to avoid problems
downstream the process (ibid, p. 8).
22 Heijunka means leveling and relates to leveling the work-load. When a processes
work-load is leveled there is more room for standardizing (ibid, p. 8).
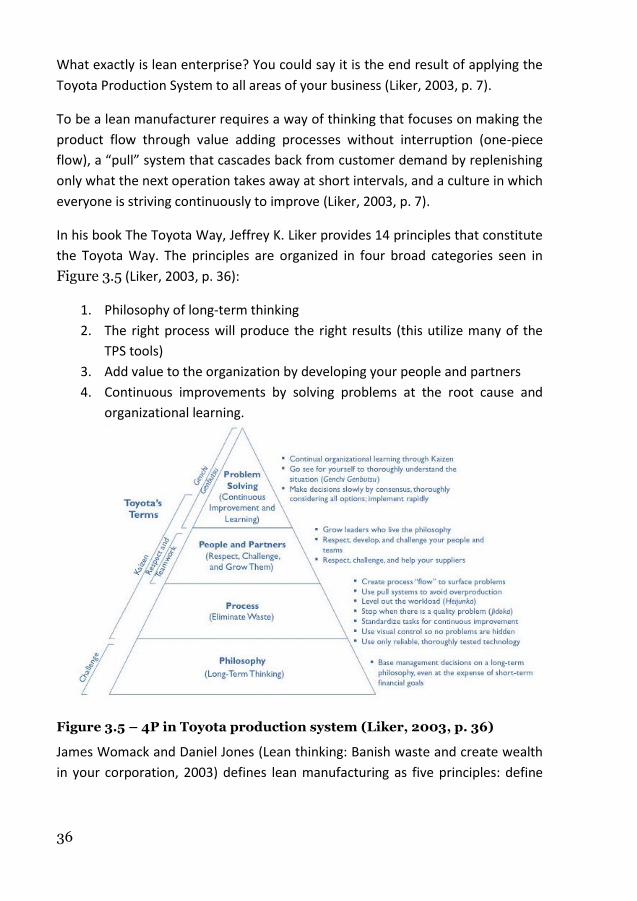
36
What exactly is lean enterprise? You could say it is the end result of applying the
Toyota Production System to all areas of your business (Liker, 2003, p. 7).
To be a lean manufacturer requires a way of thinking that focuses on making the
product flow through value adding processes without interruption (one-piece
flow), a “pull” system that cascades back from customer demand by replenishing
only what the next operation takes away at short intervals, and a culture in which
everyone is striving continuously to improve (Liker, 2003, p. 7).
In his book The Toyota Way, Jeffrey K. Liker provides 14 principles that constitute
the Toyota Way. The principles are organized in four broad categories seen in
Figure 3.5 (Liker, 2003, p. 36):
1. Philosophy of long-term thinking
2. The right process will produce the right results (this utilize many of the
TPS tools)
3. Add value to the organization by developing your people and partners
4. Continuous improvements by solving problems at the root cause and
organizational learning.
Figure 3.5 – 4P in Toyota production system (Liker, 2003, p. 36)
James Womack and Daniel Jones (Lean thinking: Banish waste and create wealth
in your corporation, 2003) defines lean manufacturing as five principles: define

37
the customer value, define the value stream, make the “flow”, “pull” from the
customer back, and strive for excellence.
38
3.3. Lean product development Lean product development (LPD) is a dynamic development method that focuses
on need based development (Holmdahl, 2010, p. 52). When lean is mentioned it
is mostly referred to as lean manufacturing or lean production. This side of lean is
what is extracted out of Toyota Production System. However, as lean product
development comes from Toyota Development System it is logic to draw the
conclusion that this theory would fit better for evaluating a product development
process.
3.3.1. Background
Already in 1990 Womack, Jones and Roos talked about Toyota’s product
development and that it is formed by teams with strong leaders that contained
all the relevant expertise (Womack, Jones, & Roos, 1990). This is a recurrent
theme in the literature of lean product development and examples as the
following are commonly seen.
To facilitate the development of products that are easy to manufacture and
assemble, an important technique is the use of cross-functional teams. These are
teams consisting of members from different functional areas in the company. The
aim is to integrate all functional aspects in the product already from the
beginning. Thus, marketing, production, and other functions participate with the
aim to provide different kinds of input in all different phases of the development
project (Karlsson & Åhlström, 1996).
One of the principles of lean product development says the following:
Deep functional expertise combined with superordinate goals and the chief
engineer system provides the balance sought by matrix organization (Liker &
Morgan, 2006a).
While product development is clearly a unique environment, the work performed
across projects is similar and can benefit from some of the same optimization
tools and methods applied to manufacturing. It is possible to manage,
standardize and continuously improve the product development process as long
as there is a solid understanding of, and allowances are made for, those
characteristics of the product development environment that are indeed unique
39
(Morgan, 2002). This leads to a book written in 2006 by Jeffrey Liker and James
Morgan where they developed a model of a lean product development system.
This was done by a huge in-depth study of Toyota’s approach in product
development. In this study they identified 13 management principles that they
consider is the foundation of a lean product development. These 13 principles
make a framework of process, people and tools-technology that can be applied to
product development (Liker & Morgan, 2006a).
These 13 principles were divided into three sub-systems: process, people and
tools which defines which part of the system they belong to. The following sub-
systems with principles were presented by Liker and Morgan.
Process
While the usual manufacturing process might be a simple repetitive process, a
product development process is more complex and less precise. Although it is
possible to standardize the process, refine it, eliminate waste and continually
reduce both lead time and cost from program to program.
1. Establish custom-defined value
The customer is always the starting point for any process. “Customer
first” creates alignment out of conflicts which means that if there is
customer focus then a conflict between e.g. a designer and a
manufacturer should not exist. They both are serving a customer and
there should not be a conflict. Adding value is the same as customer
value. Waste is what costs time, money and resources but does not add
value from the customer’s perspective.
2. Front-load the product development process
By doing things right the first time you can avoid very costly downstream
design changes that also introduces dangerous last-minute variation and
delay product introduction. This can be done by exploring a wide range of
potential problems and alternative solutions early in the process. Using
cross-functional teams early in the process to investigate alternatives for
optimal solutions enables the work on system compatibility before the
individual design completion, eliminating most of the late engineering
changes.
3. Create a leveled product development process flow
40
Lean product development requires a waste-free process to speed the
product to market. Although you may have many specific and unique
design challenges in the PD, the tasks you must perform and their
sequences usually are similar across the programs. This means you can
manage and improve the PD process much like any other process. This
can be done with tools, much like a repetitive manufacturing process,
such as value stream mapping and queuing theory, to eliminate waste
and to synchronize cross-functional activities. This does not mean to
imply the tools directly into the product development but at Toyota they
have developed a specific set of powerful tools and methods to create
leveled flow in their product development process based on principles
quite similar to those that underpin the Toyota way in manufacturing. By
driving many product development programs from concept to full-scale
production, with focus on learning, continuous improvements and
standardization, they can now predict resources needed in different
stages of a program. The need of resources looks like a bell-shaped curve
with few people in the early stages, maximum around the middle and
winding down when it is time for production launch. This means they can
assign people according to the demand and in that way level their
product development programs.
4. Utilize rigorous standardization to reduce variation and to create
flexibility and predictable outcomes
The challenge in PD is to reduce the variation in the process while still
maintaining the creativity. This is done by creating higher-level system
flexibility by standardizing lower level tasks. Toyota has three
standardization categories:
a. Design standardization is achieved through common
architecture, modularity, reusability, and shared components.
b. Process standardization is accomplished by signing products and
building foot-printed manufacturing facilities based on standard
lean manufacturing processes.
c. Standardized skill sets for the engineers, gives flexibility in
staffing and program planning and minimizes task variation.
Standardization is a way to create highly stable and predictable
outcomes with both quality and timing in an unpredictable
environment.
41
People
Driving the lean process and rigorous standardization are people who work hard
as a team to achieve common objectives. Not only with high level of skill and
discipline but also by reflecting on the process and by working to improve it. This
is an activity which happens on a continuous basis. This demands a deep
understanding in the technology they are engineering and also an intense
mentoring by identifying problems, analyzing them, developing
countermeasures, communicating and improving.
5. Develop a chief engineer system to integrate development from start to
finish
In many companies different functional departments are responsible for
different pieces of PD but nobody is responsible on an overall level. By
developing a chief engineer system you have a chief engineer who is
responsible for the project and for taking it from start to finish with the
deep expertise to make sure it is all done effectively with a high degree of
expertise. He can tell you the exact status of his project and he is also the
one who answers to any difficult decision or question. His role is not to
be the project manager but a leader and technical systems integrator.
That means he will serve as a chief technical architect instead of just
managing people and timing.
6. Organize to balance functional expertise and cross-functional integration
A difficult task in developing a high-performance PD system is striking a
balance between the essential need for functional excellence within
specific disciplines. Toyota has improved its approach to the problem
with the unofficial power of the chief engineer, module development
teams, and an Obeya23 system which enhances cross-functional
integration and provides a PD program focus. E.g. at Toyota, the
engineers report up their functional hierarchy but everybody
understands they are there to serve the customer and as the chief
engineer represents the customer he is the one everybody works for.
Module development teams are cross-functional teams that bring people
23 Japanese for big room
42
together from different functional areas around a certain development
program. Obeya is a way to improve communication between the chief
engineer and the functional managers. This is done by a meeting in “the
big room” with a senior from every functional organization at least every
other day. Visual management is used to display trend charts, schedules,
problems and countermeasures and other information which displays the
status of the project across all the functional groups.
7. Develop towering technical competence in all engineers
Technical excellence in engineering and design resources is fundamental
to lean product development. This begins with a demanding hiring
process, and continuous with designing of a career path that emphasizes
deep technical skill acquisition within a specific discipline, focusing on
mentoring of critical tactical skills that are required for engineering
excellence. Toyota pushes engineers to get their hands dirty and go
directly to see for themselves how the work is getting done and what the
problems are.
8. Fully integrate suppliers into the product development system
Companies should manage and encourage their suppliers in much the
same way they do with internal manufacturing and engineering
resources. Pre-sourcing arrangements get the suppliers on board from
the start so that they are involved from the earliest stages in concept
development. At Toyota, engineers from suppliers work full-time in
Toyota’s engineering offices as guests to cement the intimate
relationship between Toyota and its suppliers.
9. Build in Learning and Continuous Improvement
Shorter lead times create shorter learning cycles and form the basis for
continuous improvements. The ability to learn and improve itself is the
essence for a company with lean systems. In product development
Toyota has built in the mentoring system and learning events, called
Hansei24, into to development process. This creates an opportunity to
learn from every program.
10. Build a culture to support excellence and relentless improvement
24 Japanese for self-reflection
43
Building a culture that support excellence is a fundamental part of the
lean leadership and it is important that the leaders behave in a manner
consistent with the core beliefs they espouse. This goes back to believes
and values of the people in the company and are shared across managers
and working-level engineers. The core value is satisfying customers which
provides a basis for key decision-making.
Tools and technology
Doing wasteful work such as rework faster is still waste. Technology will not solve
the problems; it may even mask the problems.
11. Adapt technology to fit your people and processes
It is common that companies believe that the silver bullet technology
alone will help them to achieve high levels of performance in product
development. But, adding technology to an already bad system will do
very little to help performance, especially in the short term. Technology
is not a sustainable competitive advantage because it is so easily
repeated. That is why it is much more important to get the process and
the people system right before you start introducing advanced
technology into them.
12. Align your organization through simple, visual communication
Simple tools may be used to help align all the people working with the
project while trying to focus on their specialty. A well-known Japanese
management tool is hoshin kanri which breaks down the high-level
corporate goals into objectives at the operational level. Very simple
visual methods can be used to support this process. Toyota uses a
method called A3 report which simply is a method to visualize different
aspects on a big paper25. The concept is that this document should
communicate only the most relevant information in a simple visual
format.
13. Use powerful tools for standardization and organizational learning
25 A3 comes from the international standard (ISO) for paper sizes and is of the size
297 mm x 420 mm
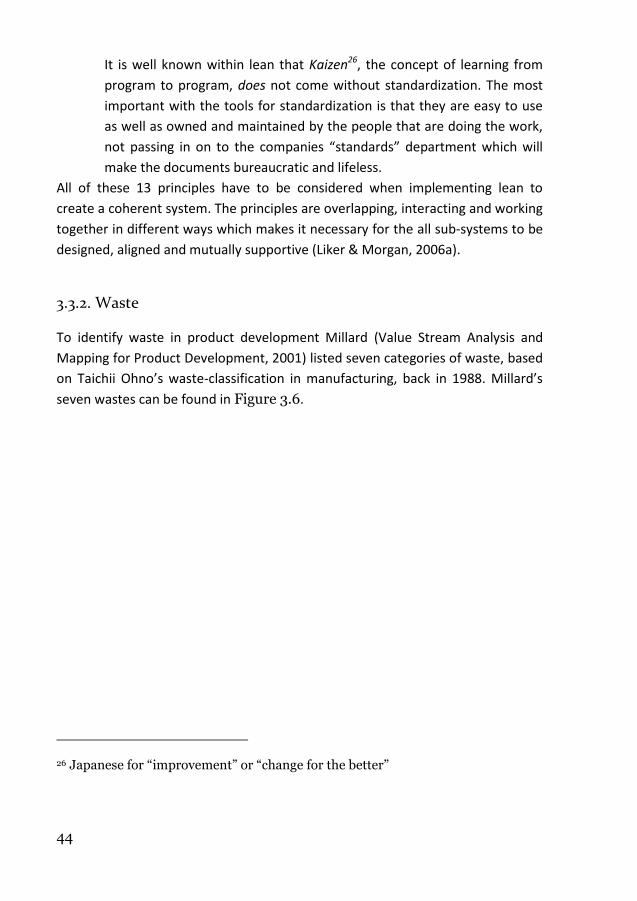
44
It is well known within lean that Kaizen26, the concept of learning from
program to program, does not come without standardization. The most
important with the tools for standardization is that they are easy to use
as well as owned and maintained by the people that are doing the work,
not passing in on to the companies “standards” department which will
make the documents bureaucratic and lifeless.
All of these 13 principles have to be considered when implementing lean to
create a coherent system. The principles are overlapping, interacting and working
together in different ways which makes it necessary for the all sub-systems to be
designed, aligned and mutually supportive (Liker & Morgan, 2006a).
3.3.2. Waste
To identify waste in product development Millard (Value Stream Analysis and
Mapping for Product Development, 2001) listed seven categories of waste, based
on Taichii Ohno’s waste-classification in manufacturing, back in 1988. Millard’s
seven wastes can be found in Figure 3.6.
26 Japanese for “improvement” or “change for the better”
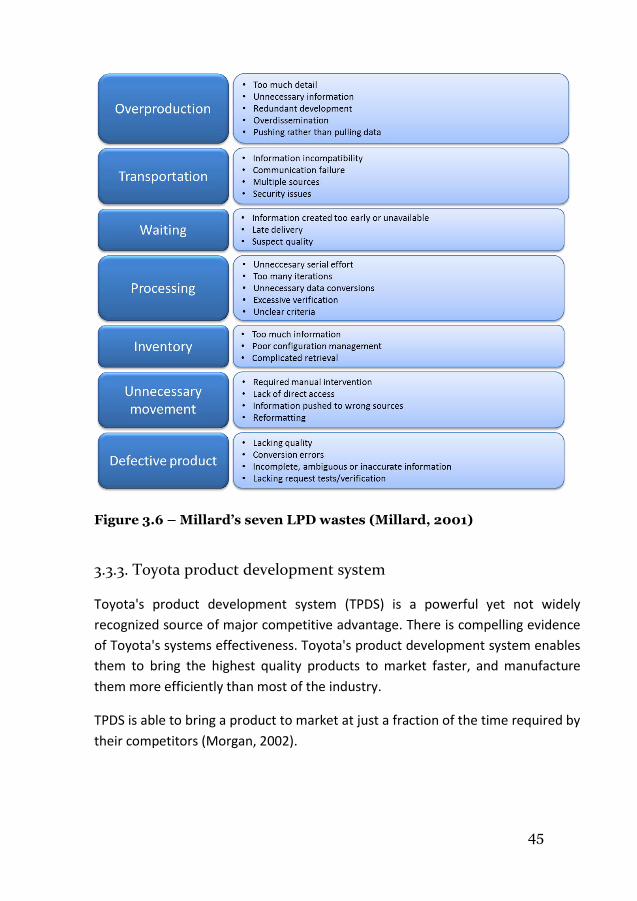
45
Figure 3.6 – Millard’s seven LPD wastes (Millard, 2001)
3.3.3. Toyota product development system
Toyota's product development system (TPDS) is a powerful yet not widely
recognized source of major competitive advantage. There is compelling evidence
of Toyota's systems effectiveness. Toyota's product development system enables
them to bring the highest quality products to market faster, and manufacture
them more efficiently than most of the industry.
TPDS is able to bring a product to market at just a fraction of the time required by
their competitors (Morgan, 2002).
46
Morgan has identified seven fundamental principles that account for Toyota’s
speed-to-market. These principles form the foundation for, and optimize,
Toyota’s product development and production systems (Morgan, 2002).
1. A holistic, systems approach to product development
The basic elements of the product development system (people,
processes, and technology) are fully integrated, aligned and designed to
be mutually supportive. Highly skilled, intelligently organized people are
the heart of the product development system. Processes are designed to
minimize waste and maximize the capability of the people who use them.
Finally, technology must be right sized, solution focused and selected to
enhance the performance of the people and the process. When these
fundamental system elements are coherent by design, they combine to
create a truly synergistic system effect. Clearly, in order to achieve this
result, other functions within the organization must also be aligned.
2. An imbedded customer first approach to product development
Truly internalizing this philosophy acts as the bond that creates a
seamless integration between both functional specialties and
fundamental system elements. The customer first philosophy results in a
deep understanding of customer defined value which is the first step in
any product development process. All system participants must
understand customer defined value from the start. Product development
must deliver a product design that both meets customer needs and is
capable of efficient manufacturing, if we expect to actually deliver this
value to the customer.
3. A front-loaded process
Early engineering rigor, problem solving and designed-in
countermeasures, along with true cross-functional participation, are keys
to maximizing the effectiveness of the product development process.
Further, by effectively segregating this inherently "noisy" phase of the
product development process from the execution phase, Toyota is able
to minimize downstream process variation that is crucial to both speed
and quality.
4. Built-in learning and continuous improvement
Learning and continuous improvement are fundamental components of
every job performed, rather than a special corporate initiative. Toyota
accomplishes this by setting increasingly rigorous performance goals for
47
every project and by holding both real-time and post-mortem learning
events (called hansai or reflection) that encourage functional specialists
to validate and update their own knowledge data bases. Learning and
continuous improvement are also embodied in a problem solving process
that creates multiple potential solutions and focuses on root cause
countermeasures designed to stop future recurrence.
5. Synchronize processes for simultaneous execution
Truly effective concurrent engineering requires that each subsequent
function maximizes the utility of the stable information available from
the previous function as it becomes available. That is to say,
development teams must do the most they can with only that portion of
the design data that is not likely to change. Otherwise, working with early
data will result in tremendous waste and actually require a longer
duration than a linear process. Each function's processes are designed to
move forward simultaneously building around stable data as it becomes
available. This practice can be referred to as simultaneous execution.
6. Use rigorous standardization to create strategic flexibility
This seeming paradox is at the heart of Toyota's quality and efficiency by
creating far more predictable quality and timing outcomes than would
otherwise be possible. This principle includes concepts and tools such as
reusability, common architecture, and standard processes. It is crucial in
driving waste out of the product development process. In fact,
standardized skills, design standards and standard processes allow for
specific program customization, broader scope of individual
responsibility, a JIT human resource strategy, flexible product
development capacities, and many other system benefits. These
standards are also crucial to downstream lean manufacturing capabilities.
7. Go to the source engineering
In this day of high tech engineering it is very tempting for engineers to
divide their time equally between conference rooms and their cubicles.
But as Kelly Johnson, the famous head of Lockheed's legendary Skunk
Works said, "An engineer should never be more than a stone throw away
from the physical product." At Toyota this philosophy is referred to as
"Gentchi genbutsu" and is practiced in many ways. Examples of this
philosophy in action include spending a significant amount of pre-
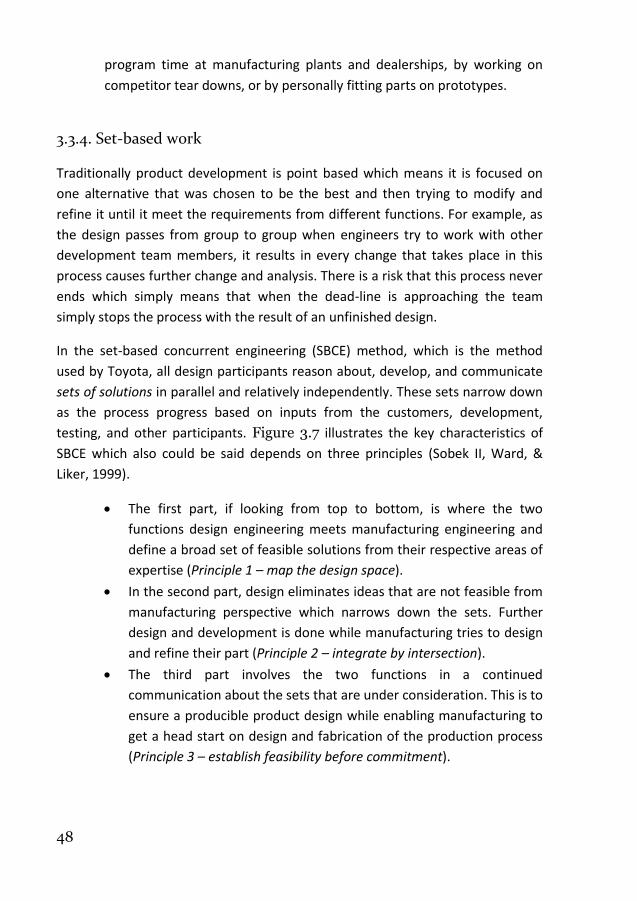
48
program time at manufacturing plants and dealerships, by working on
competitor tear downs, or by personally fitting parts on prototypes.
3.3.4. Set-based work
Traditionally product development is point based which means it is focused on
one alternative that was chosen to be the best and then trying to modify and
refine it until it meet the requirements from different functions. For example, as
the design passes from group to group when engineers try to work with other
development team members, it results in every change that takes place in this
process causes further change and analysis. There is a risk that this process never
ends which simply means that when the dead-line is approaching the team
simply stops the process with the result of an unfinished design.
In the set-based concurrent engineering (SBCE) method, which is the method
used by Toyota, all design participants reason about, develop, and communicate
sets of solutions in parallel and relatively independently. These sets narrow down
as the process progress based on inputs from the customers, development,
testing, and other participants. Figure 3.7 illustrates the key characteristics of
SBCE which also could be said depends on three principles (Sobek II, Ward, &
Liker, 1999).
The first part, if looking from top to bottom, is where the two
functions design engineering meets manufacturing engineering and
define a broad set of feasible solutions from their respective areas of
expertise (Principle 1 – map the design space).
In the second part, design eliminates ideas that are not feasible from
manufacturing perspective which narrows down the sets. Further
design and development is done while manufacturing tries to design
and refine their part (Principle 2 – integrate by intersection).
The third part involves the two functions in a continued
communication about the sets that are under consideration. This is to
ensure a producible product design while enabling manufacturing to
get a head start on design and fabrication of the production process
(Principle 3 – establish feasibility before commitment).
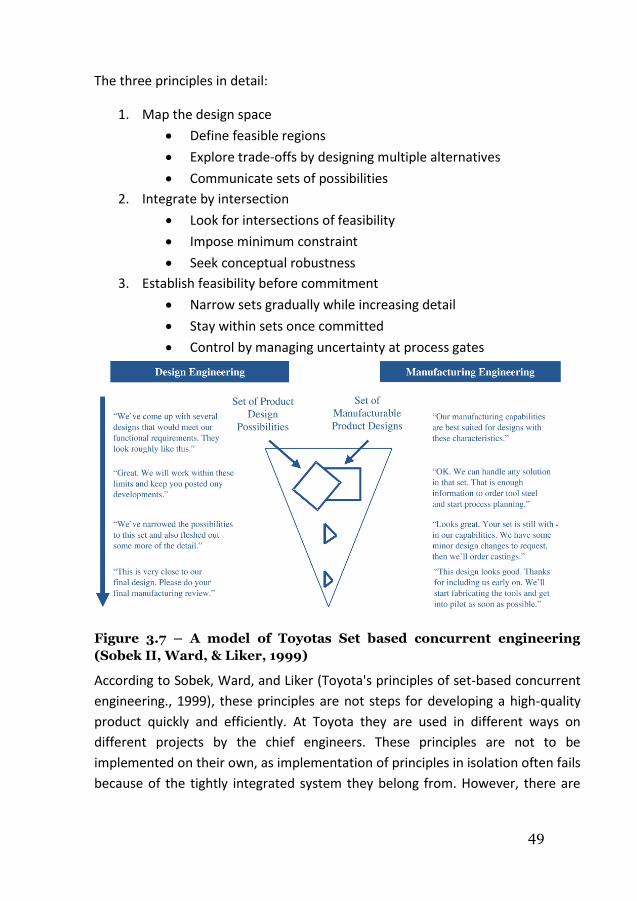
49
The three principles in detail:
1. Map the design space
Define feasible regions
Explore trade-offs by designing multiple alternatives
Communicate sets of possibilities
2. Integrate by intersection
Look for intersections of feasibility
Impose minimum constraint
Seek conceptual robustness
3. Establish feasibility before commitment
Narrow sets gradually while increasing detail
Stay within sets once committed
Control by managing uncertainty at process gates
Figure 3.7 – A model of Toyotas Set based concurrent engineering
(Sobek II, Ward, & Liker, 1999)
According to Sobek, Ward, and Liker (Toyota's principles of set-based concurrent
engineering., 1999), these principles are not steps for developing a high-quality
product quickly and efficiently. At Toyota they are used in different ways on
different projects by the chief engineers. These principles are not to be
implemented on their own, as implementation of principles in isolation often fails
because of the tightly integrated system they belong from. However, there are
50
other companies than Toyota using set-based approaches for product
development and Sobek, Ward, and Liker believes that any product development
organization that can master these principles and their application may be able to
radically improve design and development processes.
3.3.5. Tools used in LPD
LPD consists of a set of central tools and they all have their foundation in the
LAMDA learning cycle that captures knowledge. The knowledge is then
maintained, exposed and developed through other tools like the A3
communication reports, trade-off curves and checklist. (Kennedy, Harmon, &
Minnock, 2008, pp. 137-141)
PDCA
W. Edwards Deming was the original developer of the Plan-Do-Check-Act (PDCA)
model. The model is commonly used in the quality field and is used for
implementing change. At Toyota the PDCA is seen as a problem solving and
continues improvement cycle (Kennedy, Harmon, & Minnock, 2008, p. 27). The
four steps are described below and their interaction is visualized in Figure 3.8
(Ljungberg & Larsson, 2001, p. 281).
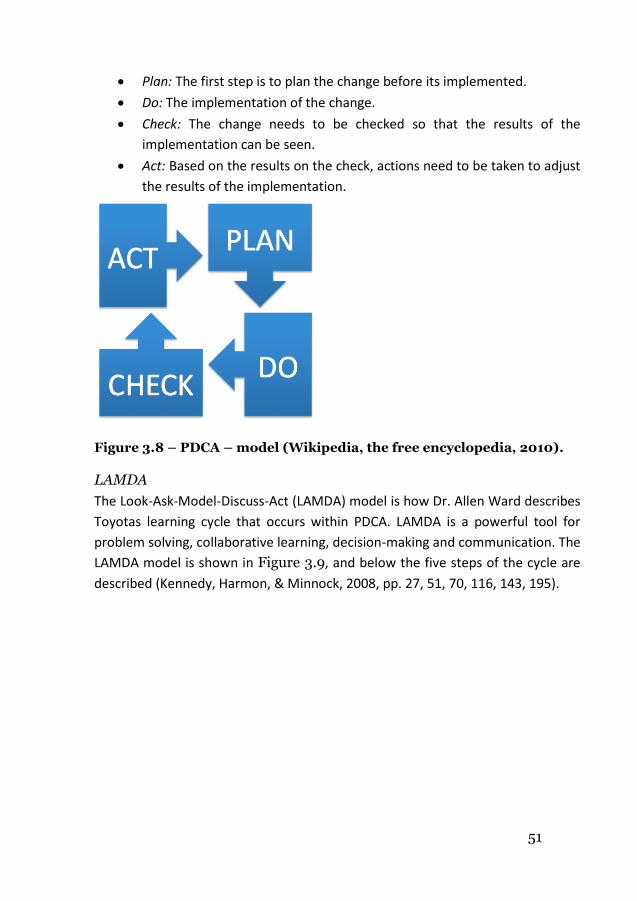
51
Plan: The first step is to plan the change before its implemented.
Do: The implementation of the change.
Check: The change needs to be checked so that the results of the
implementation can be seen.
Act: Based on the results on the check, actions need to be taken to adjust
the results of the implementation.
Figure 3.8 – PDCA – model (Wikipedia, the free encyclopedia, 2010).
LAMDA
The Look-Ask-Model-Discuss-Act (LAMDA) model is how Dr. Allen Ward describes
Toyotas learning cycle that occurs within PDCA. LAMDA is a powerful tool for
problem solving, collaborative learning, decision-making and communication. The
LAMDA model is shown in Figure 3.9, and below the five steps of the cycle are
described (Kennedy, Harmon, & Minnock, 2008, pp. 27, 51, 70, 116, 143, 195).
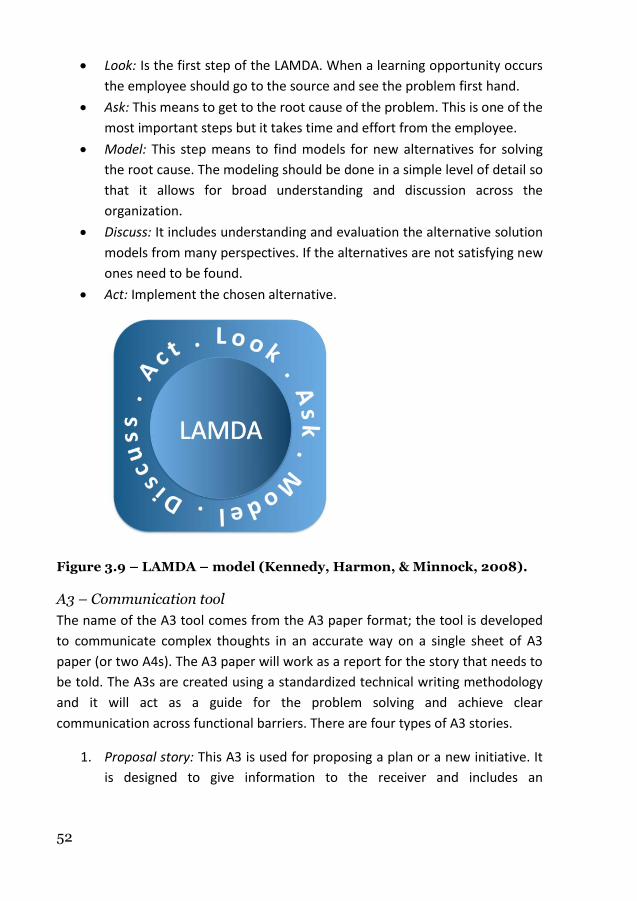
52
Look: Is the first step of the LAMDA. When a learning opportunity occurs
the employee should go to the source and see the problem first hand.
Ask: This means to get to the root cause of the problem. This is one of the
most important steps but it takes time and effort from the employee.
Model: This step means to find models for new alternatives for solving
the root cause. The modeling should be done in a simple level of detail so
that it allows for broad understanding and discussion across the
organization.
Discuss: It includes understanding and evaluation the alternative solution
models from many perspectives. If the alternatives are not satisfying new
ones need to be found.
Act: Implement the chosen alternative.
Figure 3.9 – LAMDA – model (Kennedy, Harmon, & Minnock, 2008).
A3 – Communication tool
The name of the A3 tool comes from the A3 paper format; the tool is developed
to communicate complex thoughts in an accurate way on a single sheet of A3
paper (or two A4s). The A3 paper will work as a report for the story that needs to
be told. The A3s are created using a standardized technical writing methodology
and it will act as a guide for the problem solving and achieve clear
communication across functional barriers. There are four types of A3 stories.
1. Proposal story: This A3 is used for proposing a plan or a new initiative. It
is designed to give information to the receiver and includes an
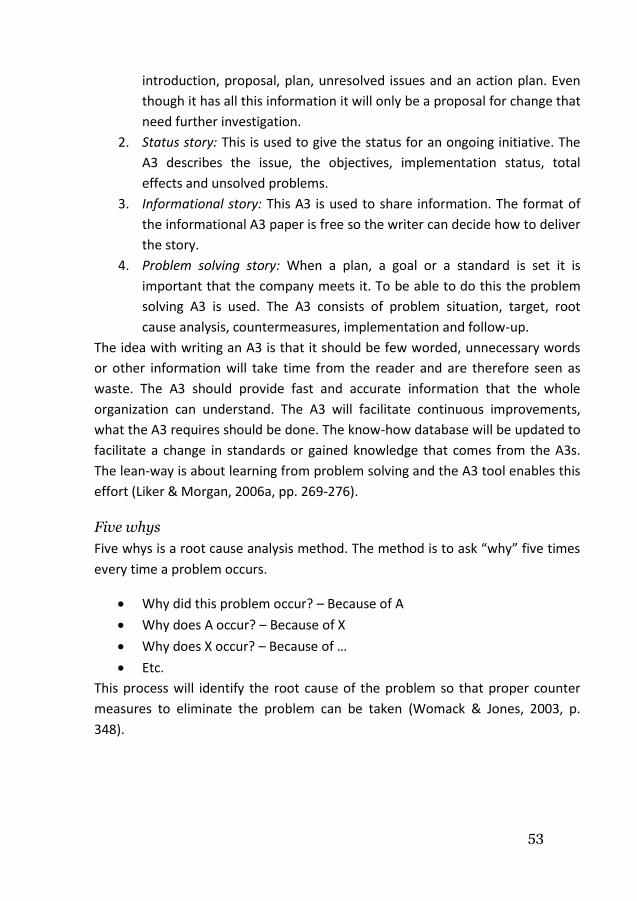
53
introduction, proposal, plan, unresolved issues and an action plan. Even
though it has all this information it will only be a proposal for change that
need further investigation.
2. Status story: This is used to give the status for an ongoing initiative. The
A3 describes the issue, the objectives, implementation status, total
effects and unsolved problems.
3. Informational story: This A3 is used to share information. The format of
the informational A3 paper is free so the writer can decide how to deliver
the story.
4. Problem solving story: When a plan, a goal or a standard is set it is
important that the company meets it. To be able to do this the problem
solving A3 is used. The A3 consists of problem situation, target, root
cause analysis, countermeasures, implementation and follow-up.
The idea with writing an A3 is that it should be few worded, unnecessary words
or other information will take time from the reader and are therefore seen as
waste. The A3 should provide fast and accurate information that the whole
organization can understand. The A3 will facilitate continuous improvements,
what the A3 requires should be done. The know-how database will be updated to
facilitate a change in standards or gained knowledge that comes from the A3s.
The lean-way is about learning from problem solving and the A3 tool enables this
effort (Liker & Morgan, 2006a, pp. 269-276).
Five whys
Five whys is a root cause analysis method. The method is to ask “why” five times
every time a problem occurs.
Why did this problem occur? – Because of A
Why does A occur? – Because of X
Why does X occur? – Because of …
Etc.
This process will identify the root cause of the problem so that proper counter
measures to eliminate the problem can be taken (Womack & Jones, 2003, p.
348).
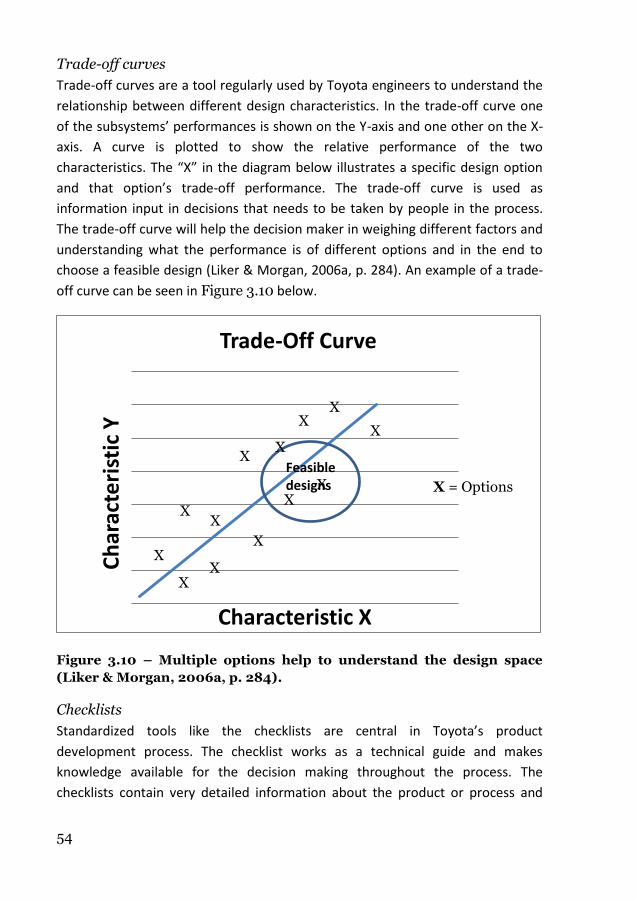
54
Trade-off curves
Trade-off curves are a tool regularly used by Toyota engineers to understand the
relationship between different design characteristics. In the trade-off curve one
of the subsystems’ performances is shown on the Y-axis and one other on the X-
axis. A curve is plotted to show the relative performance of the two
characteristics. The “X” in the diagram below illustrates a specific design option
and that option’s trade-off performance. The trade-off curve is used as
information input in decisions that needs to be taken by people in the process.
The trade-off curve will help the decision maker in weighing different factors and
understanding what the performance is of different options and in the end to
choose a feasible design (Liker & Morgan, 2006a, p. 284). An example of a trade-
off curve can be seen in Figure 3.10 below.
Figure 3.10 – Multiple options help to understand the design space
(Liker & Morgan, 2006a, p. 284).
Checklists
Standardized tools like the checklists are central in Toyota’s product
development process. The checklist works as a technical guide and makes
knowledge available for the decision making throughout the process. The
checklists contain very detailed information about the product or process and
Ch
arac
teri
stic
Y
Characteristic X
Trade-Off Curve
Feasible designs X = Options
X
X
X
X
X
X
X
X X
X
X
X X
55
there are two different types of checklists, process checklists and product
checklists. The process checklist defines the crucial steps within a process and the
product checklist provides guidelines for specific characteristics of a product
design. The information on the checklists are validated and updated regularly to
incorporate new knowledge that can come from e.g. new A3s or trade-off curves.
The group that uses the checklist is also in charge of the maintaining and
updating the checklist in the end of every process cycle (Liker & Morgan, 2006a,
pp. 289-290).
Chief engineer system
The CE has the authority over the product decisions and leads the team through
personal influence and technical know-how. The CE also represents the voice of
the customer and is responsible for the product development process from
concept to sales. The CE focuses its attention on decisions about system
integration and do not spend any time on personnel decisions and project
administration (Liker & Morgan, 2006a, p. 138).
The CE schedules integrate events at the beginning of projects to determine what
knowledge is needed, what technologies and manufacturing process limit the
achievement of customer need and what knowledge is missing (Kennedy,
Harmon, & Minnock, 2008, p. 176).
When reading literature regarding the CE role, it is easy to get the feeling that the
chief engineer has to be some kind of a “super hero” engineer. This is not true; it
is just a system with a different role description than what is common in e.g.
Sweden. Traditionally there is a project leader and a number of group managers
attached to a project. In Table 3.1 below the traditional roles of a project leader
and group manager can be seen.
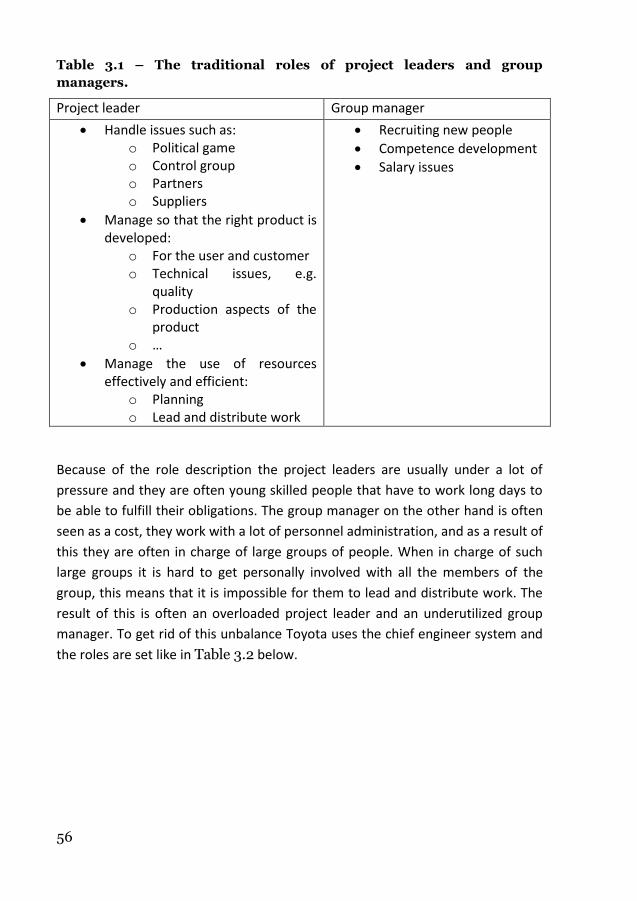
56
Table 3.1 – The traditional roles of project leaders and group
managers.
Project leader Group manager
Handle issues such as: o Political game o Control group o Partners o Suppliers
Manage so that the right product is developed:
o For the user and customer o Technical issues, e.g.
quality o Production aspects of the
product o …
Manage the use of resources effectively and efficient:
o Planning o Lead and distribute work
Recruiting new people
Competence development
Salary issues
Because of the role description the project leaders are usually under a lot of
pressure and they are often young skilled people that have to work long days to
be able to fulfill their obligations. The group manager on the other hand is often
seen as a cost, they work with a lot of personnel administration, and as a result of
this they are often in charge of large groups of people. When in charge of such
large groups it is hard to get personally involved with all the members of the
group, this means that it is impossible for them to lead and distribute work. The
result of this is often an overloaded project leader and an underutilized group
manager. To get rid of this unbalance Toyota uses the chief engineer system and
the roles are set like in Table 3.2 below.
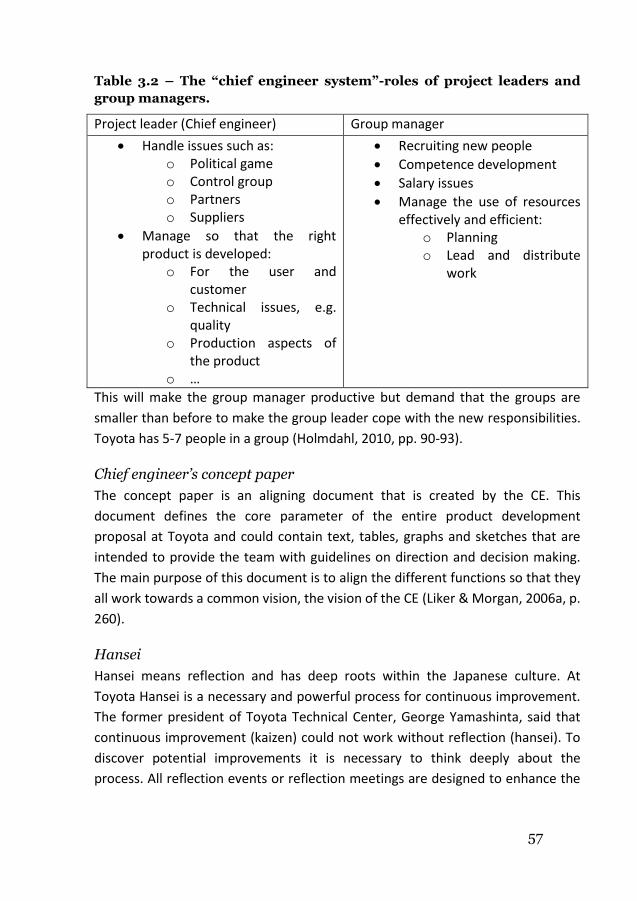
57
Table 3.2 – The “chief engineer system”-roles of project leaders and
group managers.
Project leader (Chief engineer) Group manager
Handle issues such as: o Political game o Control group o Partners o Suppliers
Manage so that the right product is developed:
o For the user and customer
o Technical issues, e.g. quality
o Production aspects of the product
o …
Recruiting new people
Competence development
Salary issues
Manage the use of resources effectively and efficient:
o Planning o Lead and distribute
work
This will make the group manager productive but demand that the groups are
smaller than before to make the group leader cope with the new responsibilities.
Toyota has 5-7 people in a group (Holmdahl, 2010, pp. 90-93).
Chief engineer’s concept paper
The concept paper is an aligning document that is created by the CE. This
document defines the core parameter of the entire product development
proposal at Toyota and could contain text, tables, graphs and sketches that are
intended to provide the team with guidelines on direction and decision making.
The main purpose of this document is to align the different functions so that they
all work towards a common vision, the vision of the CE (Liker & Morgan, 2006a, p.
260).
Hansei
Hansei means reflection and has deep roots within the Japanese culture. At
Toyota Hansei is a necessary and powerful process for continuous improvement.
The former president of Toyota Technical Center, George Yamashinta, said that
continuous improvement (kaizen) could not work without reflection (hansei). To
discover potential improvements it is necessary to think deeply about the
process. All reflection events or reflection meetings are designed to enhance the
58
organizational learning from the experience gained in the process. There are
three types of reflections defined by Toyota (Liker & Morgan, 2006a, pp. 208-
210).
Personal reflection: An employee is asked by a supervisor to reflect on
different aspects of his or hers performance and also to write an action
plan for improvements. The action plan is a review and the employee
gets a response. Specific goals are set and a follow-up plan to control the
employee’s development in specific areas is created.
Real-time reflection: This reflection is on a group level and occurs at
specific time that is scheduled into the NPD process, it usually happens in
major milestone events. The reflection can be on a specific issue or on a
more holistic level. Commonly the team tries to find the root-cause of the
issue and A3s are commonly used.
Postmortem reflection: This reflection is a lessons-learned type of event,
questions that often are asked are “What went right?”, “What went
wrong?” for the specific project. Before the meeting is held a lot of
analyses and real-time reflections are conducted and compiled. The
meeting is between all functions and the group reviews the performance
and discusses results and new ideas for improvements. The results of the
meetings are a document that is shared with other projects.
Ringi system
The Ringi system is the formal decision process used at Toyota for handling
significant decisions. In the process a small team with the necessary expertise is
assigned to analyze a specific issue or challenge and to come up with a
recommendation regarding it. The analysis process ends with that the team
creates a decision document. This document describes the challenges,
countermeasures, potential implication of adopting the recommendation. When
the document is created it will be shown to the managers affected by the
decision and their approval is requested. For the decision to be valid the decision
document has to be signed by a set number of managers. To speed up the
process Toyota has set this number to three and the sign-off is done by a
manager specific stamp (Liker & Morgan, 2006a, pp. 265-266).
59
Visual management
Visual management is about visualization of the process and its resources. This is
a method used by Toyota and is the key to effective communication (Liker &
Morgan, 2006a, p. 262).
Obeya
Obeya stands for big room and it is a way for achieving cross-functional
communication, in the room the product development projects are displayed.
The idea with Obeya is that the communication should be visual, so that all
people in the process have easy access to the information at all time. The visual
communication is achieved by that the employees plaster the room’s walls or
“mobile walls” with papers and boards that contain different kinds of information
(Liker & Morgan, 2006a, pp. 262-263).
Visual planning
Visual planning is a formal way of coordinating work. The visualization of the
planning is effective way to communicate it. When a plan is communicated it will
create expectations that the thing that are planed will happen. It is also easier to
find deviations when the plan is commutated so it will work as a system warning.
In visual planning the focus is on resources and time. A board is often used and a
matrix is created upon it. The rows represents the resources, could be e.g.
employees, and the columns represents time, e.g. weeks and months. In the cells
of the matrix, notes with activities will be placed. The employees that perform
the activities are in charge of which activities to perform and when they should
be performed (Holmdahl, 2010, pp. 124-129).
Multi-project coordination
Multi-project coordination is about managing a project portfolio through the help
of visual methods. One way of visualizing this is through putting up a large board
on the wall where a large matrix with rows and columns are created. On the rows
the different projects are displayed and the columns represent the different
functions that are involved in the product development. In the cell notes
containing information are placed. How the solution for the visualization is
structured is very company specific. (Holmdahl, 2010, p. 90). In front of the large
board meetings are held, these meetings are called PULS-meetings at Scania. The
project leader and function managers are the attending these meetings and they
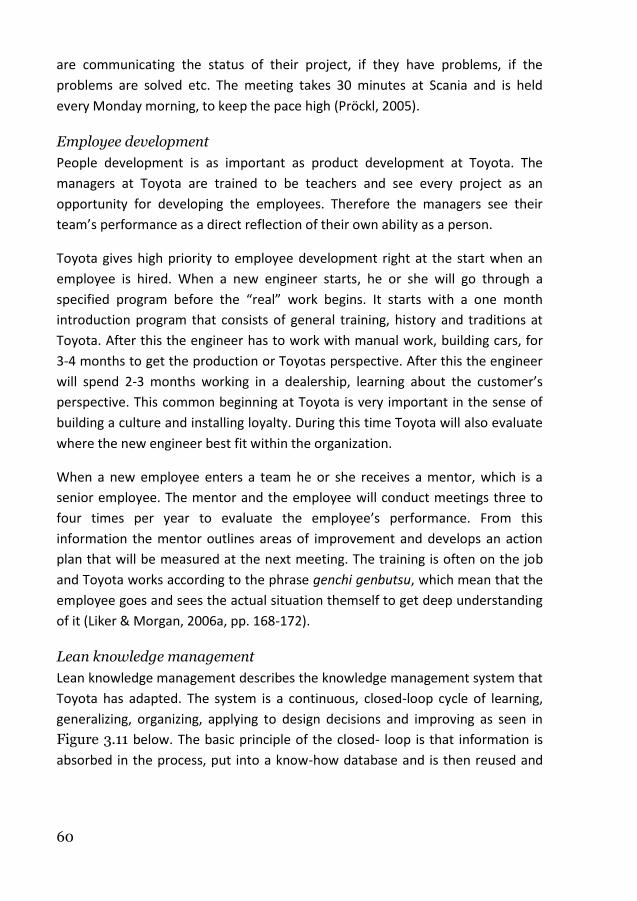
60
are communicating the status of their project, if they have problems, if the
problems are solved etc. The meeting takes 30 minutes at Scania and is held
every Monday morning, to keep the pace high (Pröckl, 2005).
Employee development
People development is as important as product development at Toyota. The
managers at Toyota are trained to be teachers and see every project as an
opportunity for developing the employees. Therefore the managers see their
team’s performance as a direct reflection of their own ability as a person.
Toyota gives high priority to employee development right at the start when an
employee is hired. When a new engineer starts, he or she will go through a
specified program before the “real” work begins. It starts with a one month
introduction program that consists of general training, history and traditions at
Toyota. After this the engineer has to work with manual work, building cars, for
3-4 months to get the production or Toyotas perspective. After this the engineer
will spend 2-3 months working in a dealership, learning about the customer’s
perspective. This common beginning at Toyota is very important in the sense of
building a culture and installing loyalty. During this time Toyota will also evaluate
where the new engineer best fit within the organization.
When a new employee enters a team he or she receives a mentor, which is a
senior employee. The mentor and the employee will conduct meetings three to
four times per year to evaluate the employee’s performance. From this
information the mentor outlines areas of improvement and develops an action
plan that will be measured at the next meeting. The training is often on the job
and Toyota works according to the phrase genchi genbutsu, which mean that the
employee goes and sees the actual situation themself to get deep understanding
of it (Liker & Morgan, 2006a, pp. 168-172).
Lean knowledge management
Lean knowledge management describes the knowledge management system that
Toyota has adapted. The system is a continuous, closed-loop cycle of learning,
generalizing, organizing, applying to design decisions and improving as seen in
Figure 3.11 below. The basic principle of the closed- loop is that information is
absorbed in the process, put into a know-how database and is then reused and
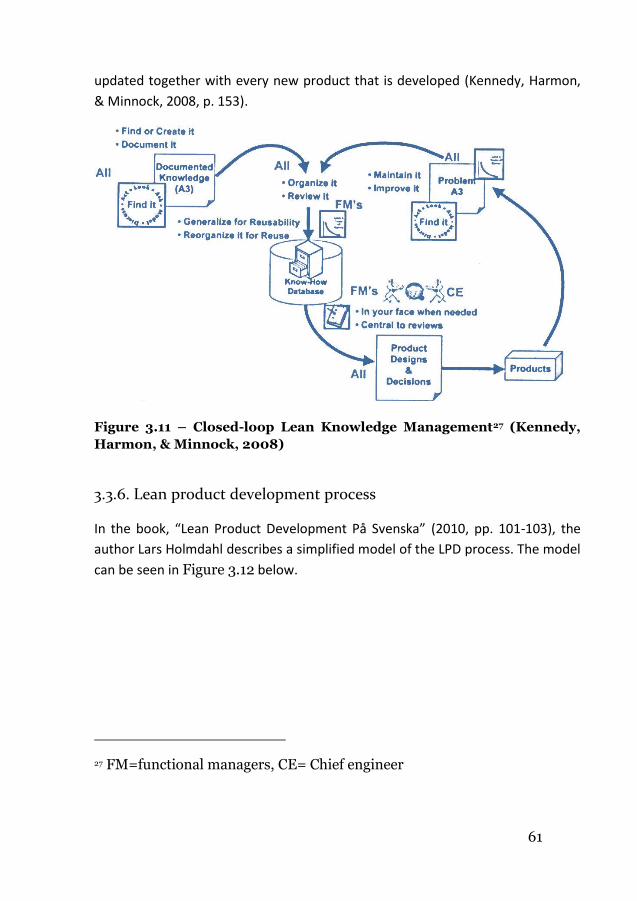
61
updated together with every new product that is developed (Kennedy, Harmon,
& Minnock, 2008, p. 153).
Figure 3.11 – Closed-loop Lean Knowledge Management27 (Kennedy,
Harmon, & Minnock, 2008)
3.3.6. Lean product development process
In the book, “Lean Product Development På Svenska” (2010, pp. 101-103), the
author Lars Holmdahl describes a simplified model of the LPD process. The model
can be seen in Figure 3.12 below.
27 FM=functional managers, CE= Chief engineer
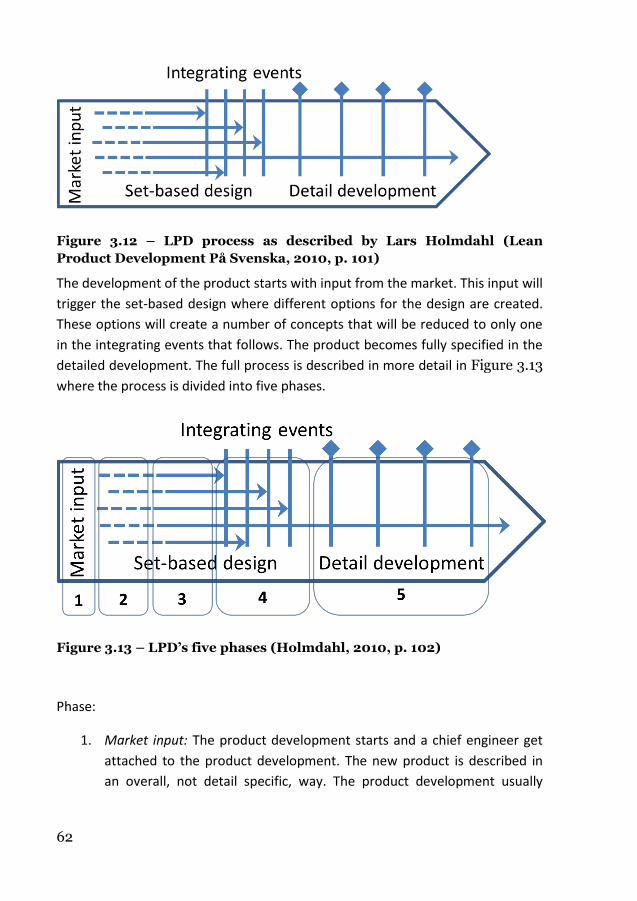
62
Figure 3.12 – LPD process as described by Lars Holmdahl (Lean
Product Development På Svenska, 2010, p. 101)
The development of the product starts with input from the market. This input will
trigger the set-based design where different options for the design are created.
These options will create a number of concepts that will be reduced to only one
in the integrating events that follows. The product becomes fully specified in the
detailed development. The full process is described in more detail in Figure 3.13
where the process is divided into five phases.
Figure 3.13 – LPD’s five phases (Holmdahl, 2010, p. 102)
Phase:
1. Market input: The product development starts and a chief engineer get
attached to the product development. The new product is described in
an overall, not detail specific, way. The product development usually
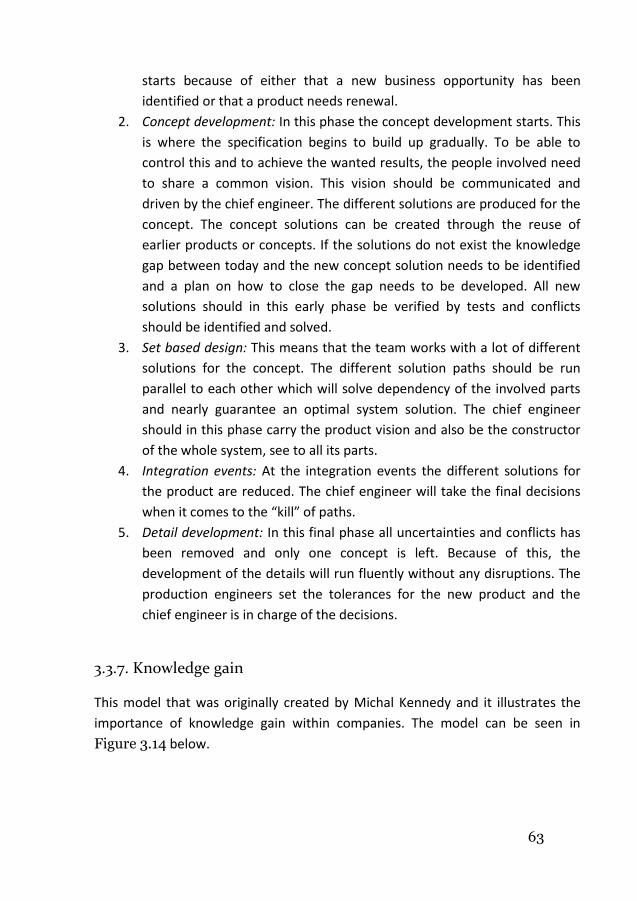
63
starts because of either that a new business opportunity has been
identified or that a product needs renewal.
2. Concept development: In this phase the concept development starts. This
is where the specification begins to build up gradually. To be able to
control this and to achieve the wanted results, the people involved need
to share a common vision. This vision should be communicated and
driven by the chief engineer. The different solutions are produced for the
concept. The concept solutions can be created through the reuse of
earlier products or concepts. If the solutions do not exist the knowledge
gap between today and the new concept solution needs to be identified
and a plan on how to close the gap needs to be developed. All new
solutions should in this early phase be verified by tests and conflicts
should be identified and solved.
3. Set based design: This means that the team works with a lot of different
solutions for the concept. The different solution paths should be run
parallel to each other which will solve dependency of the involved parts
and nearly guarantee an optimal system solution. The chief engineer
should in this phase carry the product vision and also be the constructor
of the whole system, see to all its parts.
4. Integration events: At the integration events the different solutions for
the product are reduced. The chief engineer will take the final decisions
when it comes to the “kill” of paths.
5. Detail development: In this final phase all uncertainties and conflicts has
been removed and only one concept is left. Because of this, the
development of the details will run fluently without any disruptions. The
production engineers set the tolerances for the new product and the
chief engineer is in charge of the decisions.
3.3.7. Knowledge gain
This model that was originally created by Michal Kennedy and it illustrates the
importance of knowledge gain within companies. The model can be seen in
Figure 3.14 below.
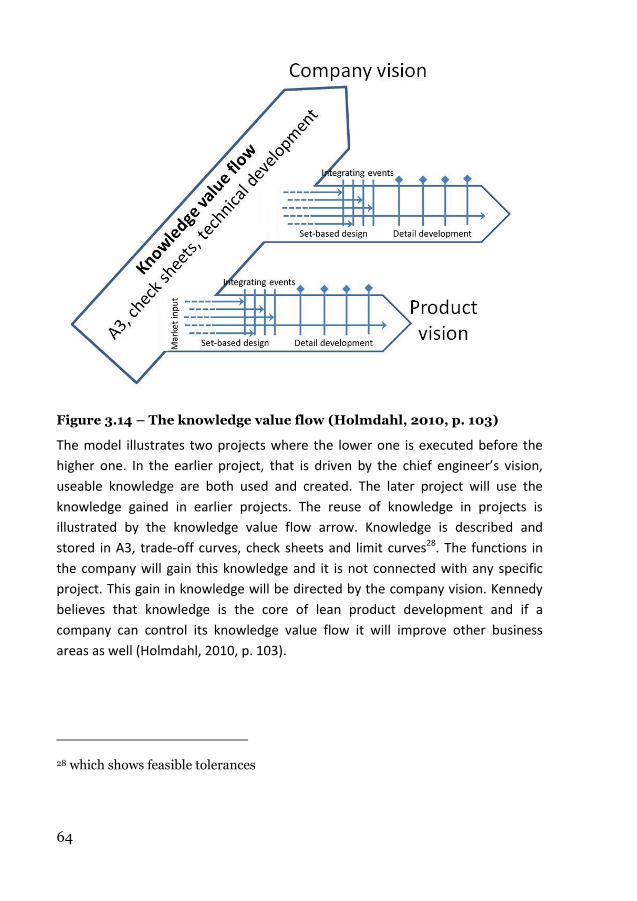
64
Figure 3.14 – The knowledge value flow (Holmdahl, 2010, p. 103)
The model illustrates two projects where the lower one is executed before the
higher one. In the earlier project, that is driven by the chief engineer’s vision,
useable knowledge are both used and created. The later project will use the
knowledge gained in earlier projects. The reuse of knowledge in projects is
illustrated by the knowledge value flow arrow. Knowledge is described and
stored in A3, trade-off curves, check sheets and limit curves28. The functions in
the company will gain this knowledge and it is not connected with any specific
project. This gain in knowledge will be directed by the company vision. Kennedy
believes that knowledge is the core of lean product development and if a
company can control its knowledge value flow it will improve other business
areas as well (Holmdahl, 2010, p. 103).
28 which shows feasible tolerances
65
3.3.8. Implementation of lean product development
During a more than two years long study, Karlsson and Åhlström (The difficult
path to lean product development, 1996) have observed four different product
development processes. This study was done at a company which was doing an
implementation of the lean concept into their product development process.
During this time they identified both supporting factors and hindering factors to
this implementation. Their findings are presented in the lists below.
Hindering factors in the process of implementing lean product development
Focus on the R&D department in development creates difficulties
in achieving cross-functional integration.
Simultaneous engineering is paradoxical to the individual
engineers.
Coordination of the lean project creates a time-consuming
meeting activity.
Request for detailed design specifications disturb the visionary-
led projects.
Ambitions to maintain a flexible relationship with suppliers
coupled with a demand for known costs, obstructs a black box
engineering relationship.
Supporting factors in the process of implementing lean product development
Lean buffers in schedules.
Close cooperation with a qualified customer.
Competence of individual engineers.
Top management commitment and support
Regular gathering with management representatives from
different functions.
Organizational practices factors in the process of implementing lean product
development
66
Sufficient time spent on creating an understanding of the full
concept.
A cross-functional focus throughout the organization created by
regular gatherings with management representatives from
different functions.
Continuous concretizing of product functions and manufacturing
processes, coupled with lean buffers.
A combination of strategic management by objectives with a
hierarchical breakdown of these objectives.
Close cooperation with customers and suppliers, where suppliers
are appropriately remunerated.
They also propose two aspects that are especially important to look at:
1. One is the establishment of an awareness of the entire concept and the
need for change.
2. The other is the ensuring of a concurrent process. It seems to be
important that the new way of working is consistent at all times during
the often gradual change to a completely new approach. Values,
structures, processes, and systems that are consistent at each time seem
to avoid stalemates in the process.
Finally Karlsson and Åhlström draw the conclusion that lean product
development consists of many interrelated techniques. The introduction of these
as well as changes in some persistent procedures implies that a change of basic
values and ideas is needed. Due to the fact that such fundamental changes are
needed it is necessary to see the implementation of lean product development as
the beginning of the journey of continuous improvement. The implication of this
is that lean should not be regarded as a state, to be reached after a certain time,
but as a direction. Management has a crucial role in guiding this journey.
67
3.4. Processes Process thinking is a part of lean and the standardizations that come with it. To
manage a process there is a necessity of clear responsibilities and ownership.
How to handle this in the best way is described in the theory behind processes.
This section will try to cover this area together with an explanation of how
processes should be used in a company to gain the benefits that comes with
processes.
The definition of a process, which will be used in this thesis, is that it is a
repetitively used network of linked activities that use information and resources
to transform object in into object out, from identification to satisfaction of the
customers’ needs (Ljungberg & Larsson, 2001, p. 44).
3.4.1. Identification
One of the fundamentals of being able to control and develop a company is to
understand its processes. The processes need to be known and understood by a
large part of the people in the company. To be able to gain this knowledge a lot
of companies have identified their processes. There are different types of
processes, three of them are more important than others when it comes to
describing a company. These are main, support and management processes.
68
Core processes are processes on a high generic level; they describe the
purpose of the company. Core processes give a good picture of the
important parts of a company in means of delivering customer value.
There are only a low number of core processes.
Support processes are needed for the company to be able to operate in a
good way. This type of process is not of unconditional criticality for the
company to be successful. They are important for the core processes to
work effectively, this mean that they are not of any value themselves
besides helping the core process to deliver value. There can be a very
high number of support processes in a company.
Management processes are needed to be able to control and set the
direction of the company. These processes control and coordinate the
main and support processes.
The work that is done to describe the processes is usually called process
mapping. It is very hard to verify the existence of a process until it has been
mapped on a quite deep level. The best way to describe the appearance of a
process is to illustrate it by drawing a map over the process. The process map
illustrates the connections between the different processes in a very clear way.
3.4.2. Mapping
A process is constructed by five different components that need to be taken into
account when the process is mapped. The components are the following and can
also be seen in Figure 3.15 below (Ljungberg & Larsson, 2001, pp. 184-194).
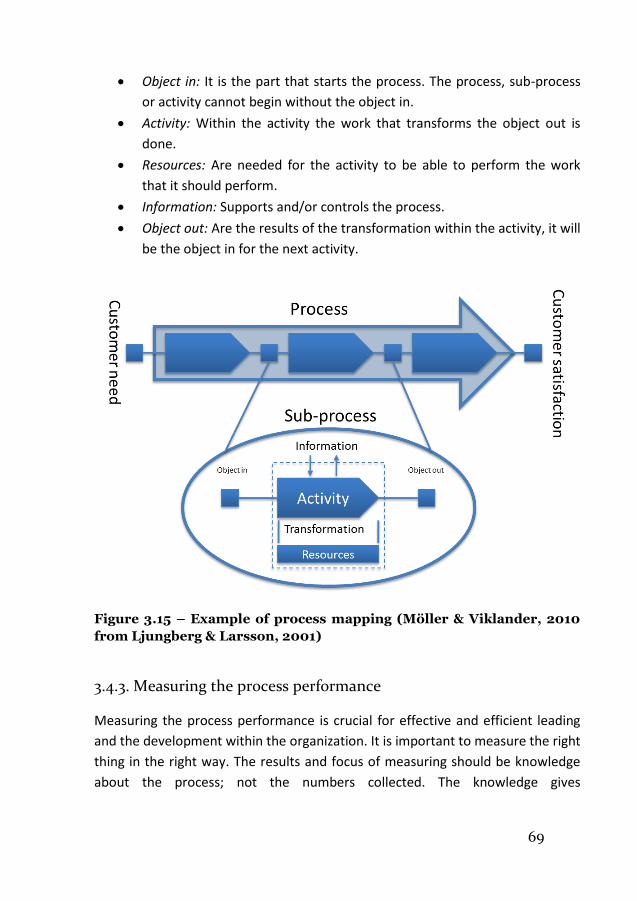
69
Object in: It is the part that starts the process. The process, sub-process
or activity cannot begin without the object in.
Activity: Within the activity the work that transforms the object out is
done.
Resources: Are needed for the activity to be able to perform the work
that it should perform.
Information: Supports and/or controls the process.
Object out: Are the results of the transformation within the activity, it will
be the object in for the next activity.
Figure 3.15 – Example of process mapping (Möller & Viklander, 2010
from Ljungberg & Larsson, 2001)
3.4.3. Measuring the process performance
Measuring the process performance is crucial for effective and efficient leading
and the development within the organization. It is important to measure the right
thing in the right way. The results and focus of measuring should be knowledge
about the process; not the numbers collected. The knowledge gives
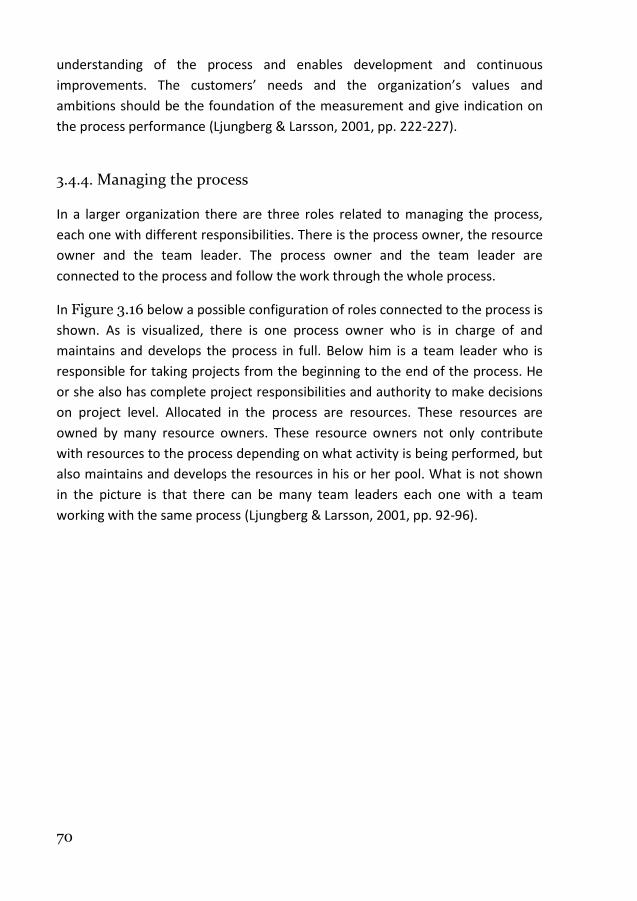
70
understanding of the process and enables development and continuous
improvements. The customers’ needs and the organization’s values and
ambitions should be the foundation of the measurement and give indication on
the process performance (Ljungberg & Larsson, 2001, pp. 222-227).
3.4.4. Managing the process
In a larger organization there are three roles related to managing the process,
each one with different responsibilities. There is the process owner, the resource
owner and the team leader. The process owner and the team leader are
connected to the process and follow the work through the whole process.
In Figure 3.16 below a possible configuration of roles connected to the process is
shown. As is visualized, there is one process owner who is in charge of and
maintains and develops the process in full. Below him is a team leader who is
responsible for taking projects from the beginning to the end of the process. He
or she also has complete project responsibilities and authority to make decisions
on project level. Allocated in the process are resources. These resources are
owned by many resource owners. These resource owners not only contribute
with resources to the process depending on what activity is being performed, but
also maintains and develops the resources in his or her pool. What is not shown
in the picture is that there can be many team leaders each one with a team
working with the same process (Ljungberg & Larsson, 2001, pp. 92-96).
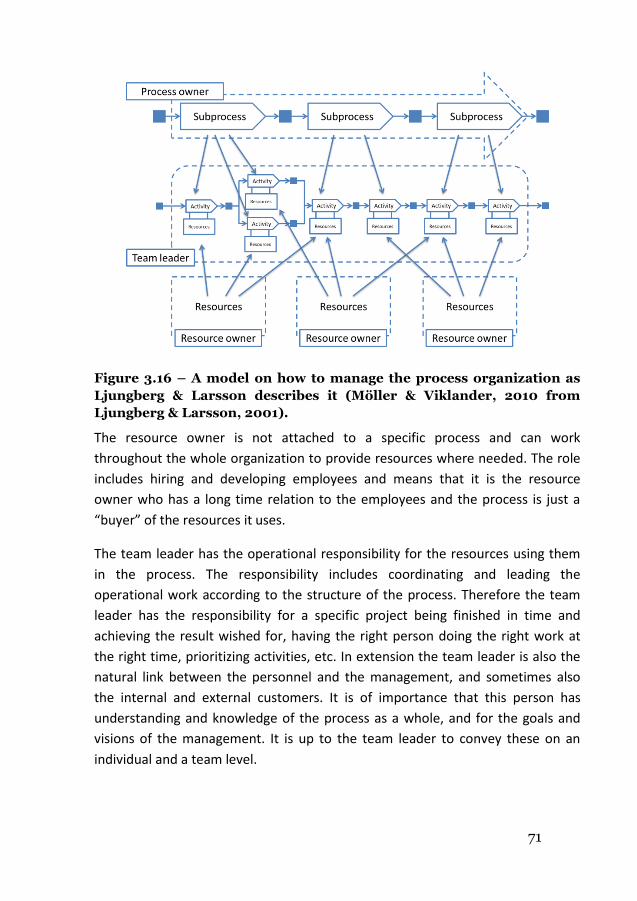
71
Figure 3.16 – A model on how to manage the process organization as
Ljungberg & Larsson describes it (Möller & Viklander, 2010 from
Ljungberg & Larsson, 2001).
The resource owner is not attached to a specific process and can work
throughout the whole organization to provide resources where needed. The role
includes hiring and developing employees and means that it is the resource
owner who has a long time relation to the employees and the process is just a
“buyer” of the resources it uses.
The team leader has the operational responsibility for the resources using them
in the process. The responsibility includes coordinating and leading the
operational work according to the structure of the process. Therefore the team
leader has the responsibility for a specific project being finished in time and
achieving the result wished for, having the right person doing the right work at
the right time, prioritizing activities, etc. In extension the team leader is also the
natural link between the personnel and the management, and sometimes also
the internal and external customers. It is of importance that this person has
understanding and knowledge of the process as a whole, and for the goals and
visions of the management. It is up to the team leader to convey these on an
individual and a team level.
72
3.4.5. Process owner
There is no complete definition of the process owner that explains exactly what it
is, but the literature has tried to define the role in many different ways. The
problem is that such a complex role cannot be described well enough to give the
reader any guidance of the meaning with only a few words. One definition says
that the process owner should works as the “designer, coach and spokesman” for
the process which gives a better focus on the total responsibility for the process
which requires that the process owner has authority to implement changes
throughout the process. Another definition says that the process owner is
responsible for making the process “efficient, effective and flexible”. This
definition gives the process owner a goal for his or her work (Ljungberg &
Larsson, 2001, pp. 128-130).
Basically, the process owner’s task is to develop the process as a whole, e.g. even
if an improvement is only done in a specific part of the process it might affect the
performance of the process as a whole. This indicates a need for a process owner
to coordinate and control improvements on a holistic level (Ljungberg & Larsson,
2001, p. 93).
The process owner should have a complete personal responsibility for the whole
process. This means defining the sub-processes and activities that are included in
the process and also creating an efficient structure for these activities. Another
responsibility is to make sure that resource allocation and working methods will
not create sub-optimizations throughout the process. From the holistic view, the
process owner and see where the need of resources are the biggest and then
allocate the resources offered by the resource owners where they make the most
effort (Ljungberg & Larsson, 2001, pp. 130-132).
How should the process owner make sure that the process is efficient, effective
and flexible?
An effective process means that the process is creating the right value for the
customer, out of the input. To create an effective process it is necessary to know;
who the customers are, what the customers expect, which customers the
company wants, and how to satisfy these customers. The customers could be
both internal and external and their expectations can vary a lot. To get the best
knowledge of what the customers want, the best way is to sit down with them in
73
a structured and well planned way and ask them what they want. A company
does not always want all possible customers. Some customers are more
attractive than others and it is better to focus on these and how to satisfy them.
Different customers can have different requirements and priorities in terms of
price, quality, flexibility, speed, service, design, etc. It is up to the process owner
to break down the company’s strategy into concrete process targets so that the
operational work will satisfy the customers (Ljungberg & Larsson, 2001, pp. 135-
137).
An efficient process means using as few resources29 as possible to achieve the
best result. To accomplish this, the methodology used can be described as
(Ljungberg & Larsson, 2001, pp. 137-140):
Identify and map the process
Analysis and reconstruction of the process
Implement the new or changed process
Measure the process
Continuous improvements of the process performance
It is up to the process owner to make sure this work is done. Usually problems
with continuous improvements occur as the people involved are busy with their
daily work. The process owner must therefore constantly push forward the
process of continuous improvement.
The flexibility aims at how well the process can adapt to a changed environment,
both internal and external. Some ways to build a flexible process could be to
focus on the organizational structure and to create adaptable supporting systems
like for example information systems and economic control systems. It is also
common to avoid binding movable resources i.e. by using flexible forms of
employment and such. However, these measures do only facilitate the creation
of a flexible process; the final determination is how the people in the process act.
Therefore it is of importance to focus on the employees to create a flexible
process. As the process owner is not the owner of the resources this means that
the process owner and the resource owners need to have a close cooperation. It
29 Direct expenses, time, employees and system resources
74
is up to the process owner to define the process’ current and future need of
competence. Then it is up to the resource owners to provide the competence and
up to the team leader to use the competence (Ljungberg & Larsson, 2001, pp.
142-144).
Ljungberg and Larsson summarize the process owner’s tasks to (Ljungberg &
Larsson, 2001, p. 131):
Take a personal responsibilities and a collective responsibility for the
process in full
Coordinate the activities in the process in a structural and value based
way
Avoid sub optimization
Create targets and goals and decide how to focus the process
Manage the process development
Resource owner
The role as a resource owner involves providing employees, with the best
possible knowledge and skills, to the organization. This means that the resource
owner is in charge of a pool of resources and has the task of developing the
competences in this pool so that the processes can use and benefit from these.
The structure of a resource owner’s work is divided into three levels; strategic,
tactical and operative level. (Ljungberg & Larsson, 2001, pp. 156-157,161-162)
Strategic level – (core) competence
o Meet current and future need of competence
o Meet current and future need of staffing
Tactical level – employee development
o Allocate staff to the processes
o Hiring staff
o Staff development
Operative level – coaching
o Distribute the operative work/competence development
o Work as a mentor and support the staff
o Give feed-back on performance and development
o Manage personal questions
75
Competence center
The pool of resources that the resource owner is in charge of is referred to as a
competence center. The competence center is not a physical place where any
operative work is being performed, it is more of a virtual focal where people with
the same competences exchanges experience and perform training in these
competences. It can be seen as what is left of the functions when the operative
work has been removed. The operative work is instead performed in the process
and in the competence center there is education, support and development of
the staff to facilitate a good work in the processes. A natural way of changing the
organization is to change a function into a competence center but gradually
smaller competence centers will evolve as competences are separated.
(Ljungberg & Larsson, 2001, pp. 162-163)
Team leader
The team leader is the one to combine the process provided by the process
owner and the resources provided by the resource owner to create the result
which is sought by the process. The work in the process is being done by different
process teams that the team leader is responsible for. The tasks can be divided
into three main categories (Ljungberg & Larsson, 2001, pp. 163-164):
Design the team
Lead and develop the team (problem, responsibilities, new leadership,
target development)
Contribute to both individual and collective competence development
When designing the team there are three important parameters to consider;
character of the task, the competence and characteristics of the team members,
and the role structure of the team. The view is that it is the character of the task
that should be the foundation of the role definitions in the team, how the
cooperation should be done and how the work is to be coordinated. Three
different ways of organizing a team is:
76
Role-differentiated team
Role-integrated team
Role-complementary team
Role-differentiated team is when the team members have very specialized roles
and the tasks are performed sequential and the management and coordination is
often done by direct orders or standardization.
In the role-integrated teams the roles are still specialized but more cooperation
and coordination of the team members is needed. The necessity of interaction
comes from that activities are more carried out parallel and are more dependent
of each other.
In a role-complementary team the team members are working even more tightly
together and it is hard to define special work- or responsibility areas for each
member. The work is characterized by flexibility and improvisation (Ljungberg &
Larsson, 2001, pp. 163-167).
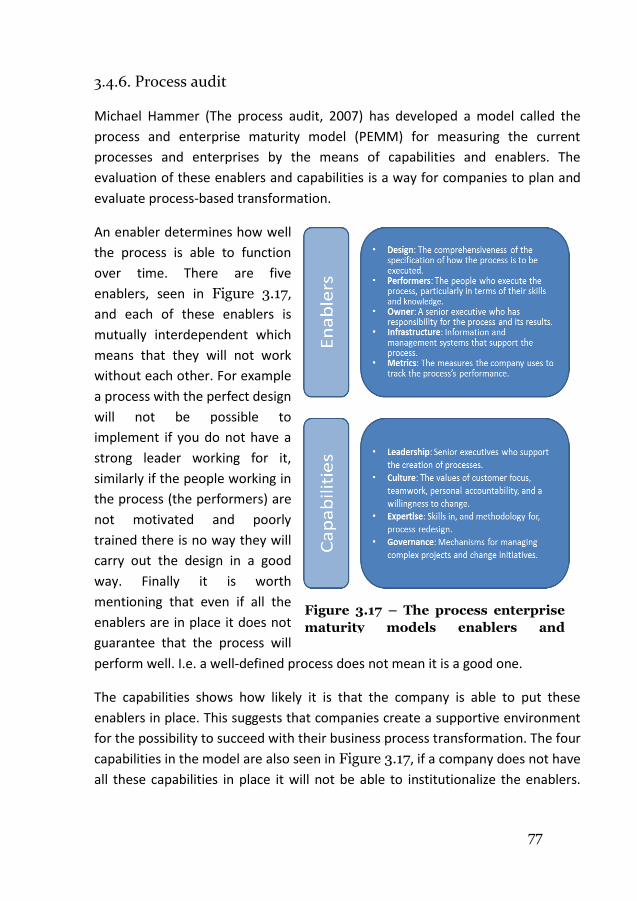
77
3.4.6. Process audit
Michael Hammer (The process audit, 2007) has developed a model called the
process and enterprise maturity model (PEMM) for measuring the current
processes and enterprises by the means of capabilities and enablers. The
evaluation of these enablers and capabilities is a way for companies to plan and
evaluate process-based transformation.
An enabler determines how well
the process is able to function
over time. There are five
enablers, seen in Figure 3.17,
and each of these enablers is
mutually interdependent which
means that they will not work
without each other. For example
a process with the perfect design
will not be possible to
implement if you do not have a
strong leader working for it,
similarly if the people working in
the process (the performers) are
not motivated and poorly
trained there is no way they will
carry out the design in a good
way. Finally it is worth
mentioning that even if all the
enablers are in place it does not
guarantee that the process will
perform well. I.e. a well-defined process does not mean it is a good one.
The capabilities shows how likely it is that the company is able to put these
enablers in place. This suggests that companies create a supportive environment
for the possibility to succeed with their business process transformation. The four
capabilities in the model are also seen in Figure 3.17, if a company does not have
all these capabilities in place it will not be able to institutionalize the enablers.
Figure 3.17 – The process enterprise
maturity models enablers and
capabilities (Hammer, 2007)
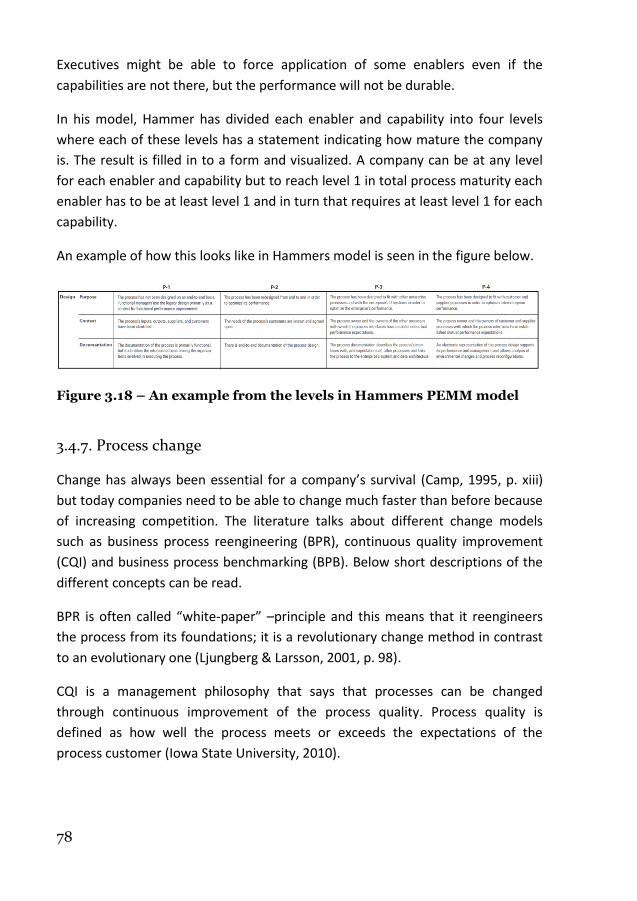
78
Executives might be able to force application of some enablers even if the
capabilities are not there, but the performance will not be durable.
In his model, Hammer has divided each enabler and capability into four levels
where each of these levels has a statement indicating how mature the company
is. The result is filled in to a form and visualized. A company can be at any level
for each enabler and capability but to reach level 1 in total process maturity each
enabler has to be at least level 1 and in turn that requires at least level 1 for each
capability.
An example of how this looks like in Hammers model is seen in the figure below.
Figure 3.18 – An example from the levels in Hammers PEMM model
3.4.7. Process change
Change has always been essential for a company’s survival (Camp, 1995, p. xiii)
but today companies need to be able to change much faster than before because
of increasing competition. The literature talks about different change models
such as business process reengineering (BPR), continuous quality improvement
(CQI) and business process benchmarking (BPB). Below short descriptions of the
different concepts can be read.
BPR is often called “white-paper” –principle and this means that it reengineers
the process from its foundations; it is a revolutionary change method in contrast
to an evolutionary one (Ljungberg & Larsson, 2001, p. 98).
CQI is a management philosophy that says that processes can be changed
through continuous improvement of the process quality. Process quality is
defined as how well the process meets or exceeds the expectations of the
process customer (Iowa State University, 2010).
79
BPB is about learning from other companies so that the change can become more
effective (Camp, 1995, p. xiv).
According to their article, Kevin Dooley and Dirk Jonson (Changing the New
Product Development Process, 2001), say that a company’s success is highly
dependent on the success of the NPD process. The NPD process is not easy to
change due to its complexity and because of that small changes in the process
could have large scale, unanticipated effects. It is also a process that often is
poorly understood and documented, “knowledge-work” is commonly a large part
of the process. The NPD process is also normally of strategic importance and that
means that it can be high risk involved when changing it. In their article, Doodley
and Jonson discusses the factors of using BPR or CQI. The largest advantage with
using CQI is that it is less risky than BPR; on the other hand it requires longer time
to implement large changes.
To accommodate the benefits of the both models the authors of the article has
invented an “ideal model of process change” that contains the following areas or
steps:
1. Motivate the need for change: Convey an understanding of the necessity
for change. Failing to communicate this need to change is one of the
greatest contributors of transformation failure.
2. Secure resources: To secure the support from senior management is vital
for success. Also, cross-functional teams are a practical necessity for
successful NPD reengineering efforts.
3. Evaluate the existing process: Evaluation of the current “as-is” process is
good for finding specific areas in need of improvement i.e. activities that
are non-value adding. It is important to notice that the NPD process is an
open system; this means that it will be affected by outside factors and
processes such as management direction or cooperation with other
functions.
4. Design the new process: Design a logical and flexible workflow process
that matches the company in a good way. It needs to match the
company’s products, technologies and markets to be successful. It is
important to determine the strategic level of the process, answer the
question how the process can integrate the customers, suppliers,
80
technology, manufacturing, marketing and operation strategies. The
tactical level of the process is the details of the new process design. It is
common to look at best practices, search in literature and use BPB to find
good solutions.
5. Implement and measure new results: It is not easy to implement changes
in this kind of complex process. It is important to remember that changes
do not take place over night. Individual behavior must change and that
can take time. When the new process is implemented its performance
should be measured to show the results of the new process.
The model shows that the NPD change can be characterized by both BPR and CQI
(Dooley & Johnson, 2001).
3.4.8. Successful process change
Kotter has developed eight steps or recommendations for successful change
(Kotter, 1998).
1. Establish a sense of urgency: To be able to succeed with the change it is
important to establish urgency for change. If the people within the
company feel the need of change it will be much easier to achieve. One
way to achieve this is to initiate a crisis within the company.
2. Form a powerful guiding coalition: It is important to have a strong team
in command of the change. The team needs to have people for different
parts of the company and also the resources and power to be able to
succeed with the change.
3. Create a vision: To be able to direct the change efforts a vision has to be
created. Strategies to achieve the vision are also necessary.
4. Communicate the vision: The vision and the strategies have to be
communicated through the company. All possible channels should be
used over and over again so that the message is clear.
5. Empower others to act on the vision: Obstacles of change will always
appear along the way, these needs to be removed. If systems block the
change they also need to be changed. Encourage people and perform
tasks that are positive to the change.
81
6. Plan for and create short-term wins: It is important that short-term wins
can be seen. To achieve this, the visible performance improvements need
to be implemented. Reward people when the performance is improved.
7. Consolidate improvements and produce still more change: Use the early
change as fuel for even more change. Hire, promote and develop
employees who can implement the vision.
8. Institutionalize new approaches: Express the links between new
behaviors and the company’s success. Ensure further development of
leadership and progression.
NPD best practice
Today, many companies search for best practice to be able to manage their NPD
process in a better way. Some companies have already implemented best
practice tactics and methods to their NPD process. This has shown to be
successful in many cases and therefore the interest for benchmarking those
companies has grown.
According to Kahn, Barczak and Moss (PERSPECTIVE: Establishing an NPD Best
Practices Framework, 2006) it is important to see the NPD process benchmarking
from multidimensional perspective. Their study shows that the actions
companies take, to achieve best practice, vary a lot. The best practice path
generally focuses on six themes:
Instill a strategic, long-term orientation toward NPD.
Have a formal portfolio management process.
Implement a formal NPD process supported by a discipline to adhere to
this process.
Conduct market research proactively.
Use-cross-functional teams.
Utilize standardized criteria and metrics.
In the article by C. Loch (Tailoring product development to strategy, 2000) he
concludes that no best practice NPD process exists. Instead of counting on one
best practice model the company should develop a customized NPD project
portfolio and a corresponding mixture of processes that together can meet the
strategic needs of the company. To achieve this strategic alignment the company
82
should develop a systematic procedure that can make it easier for them to reach
their target.
Best practice is highly dependent on the company specific attributes because of
the complex and diverse nature of most companies today. A specific company
can be defined using a number of factors for classification, such as organization,
markets, products, production process, suppliers and environment.
Implementation of best practice is therefore dependent on those factors. A
framework for analyzing a company’s processes and key factors are needed for
the company to be able to understand itself and its critical attributes. If this were
done in an adequate way the company will not implement a generic best practice
model that would not be for any real value for it, it would instead implement a
product development process that meets the real needs of the company (Maffin,
Thwaites, & Alderman, 1997).
83
3.5. Fast moving consumer goods The fast moving consumer goods (FMCG) market consists of products that are
characterized by low financial outlays, frequently bought and non-durable.
Customers spend short time searching for information about the product and
when the consumer is satisfied they tend to buy the same brand over and over
again (Lancaster & Whitey, 2007, p. 256).
Typical FMCG products could be toiletries, cosmetics and grocery items. Because
of that consumers spend so little effort on the procurement of the product it has
to be easily accessible for them to be successful. FMCG can be seen from a
market or consumer angle as seen below (Majumdar, 2008).
3.5.1. Characteristics
From a consumer angle the FMCG segment are classified as follows:
Frequent purchase
Low involvement
Low price
From a market angle the FMCG segments are classified as follows:
High volume
Low margins
Extensive distribution networks
High stock turnover
New product development is very important in the FMCG sector because of the
short lifetime of the products. If the company wants to withhold or grow its
market position it is crucial that it introduces new attractive products to the
market (Majumdar, 2008).
3.5.2. Procter & Gamble
P&G is one of the largest companies operating on the FMCG market today.
According to the article “Succeeding at New Products the P&G Way: Work the
Innovation Diamond” (Cooper & Mills, 2005), P&G have exceptional performance
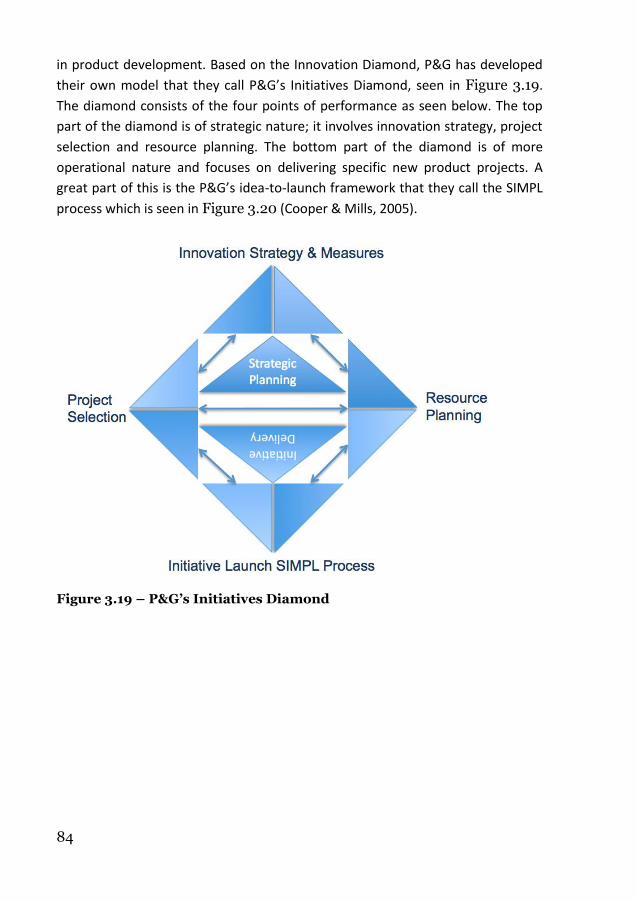
84
in product development. Based on the Innovation Diamond, P&G has developed
their own model that they call P&G’s Initiatives Diamond, seen in Figure 3.19.
The diamond consists of the four points of performance as seen below. The top
part of the diamond is of strategic nature; it involves innovation strategy, project
selection and resource planning. The bottom part of the diamond is of more
operational nature and focuses on delivering specific new product projects. A
great part of this is the P&G’s idea-to-launch framework that they call the SIMPL
process which is seen in Figure 3.20 (Cooper & Mills, 2005).
Figure 3.19 – P&G’s Initiatives Diamond
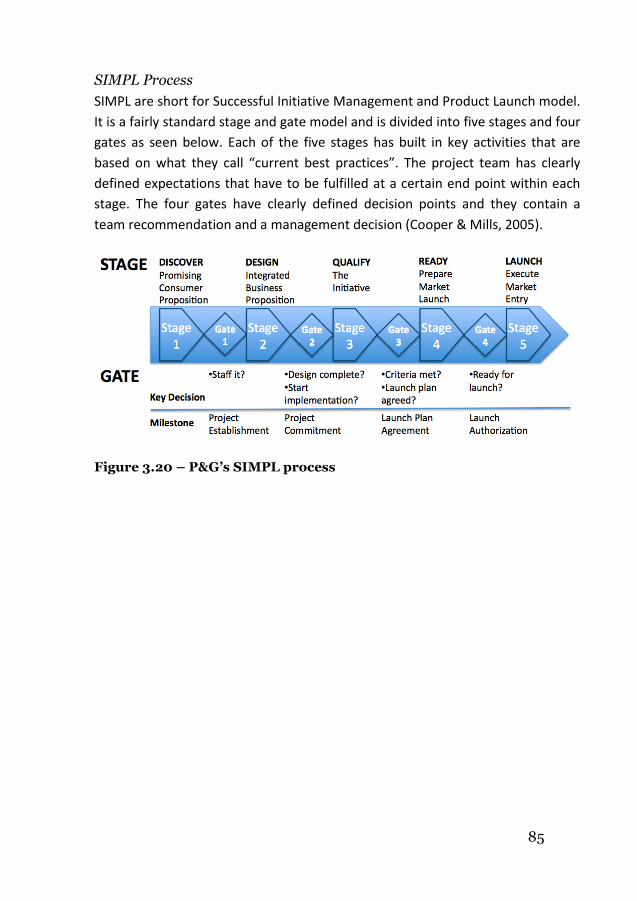
85
SIMPL Process
SIMPL are short for Successful Initiative Management and Product Launch model.
It is a fairly standard stage and gate model and is divided into five stages and four
gates as seen below. Each of the five stages has built in key activities that are
based on what they call “current best practices”. The project team has clearly
defined expectations that have to be fulfilled at a certain end point within each
stage. The four gates have clearly defined decision points and they contain a
team recommendation and a management decision (Cooper & Mills, 2005).
Figure 3.20 – P&G’s SIMPL process
86
4. Best practice framework This chapter presents a model developed by the authors to best practice
framework which is built out of the theory in the previous chapter. This
framework is to be used for evaluation of the current situation in
Oriflame’s NPD process from a lean perspective and also to propose a next
practice. This framework contains a few criterions that are necessary in a
lean product development process. This chapter also includes a survey that
was used to get a better understanding of the NPD process at Oriflame.
4.1. Lean product development maturity model Lean product development comes from Toyota product development system as the authors Jeffrey K. Liker and James Morgan introduces it to us in their book in 2006. The 13 principles that they present is the foundation of lean product development and has to be used together because they all contribute to the system like linked gears, if one is missing the system is not working, and if one is poor the system will be poor. These 13 principles are presented in the theoretical framework, “3.3. Lean product development”, together with a brief description.
4.1.1. The model
Based on these 13 principles the authors of this thesis have developed a maturity model to analyze how lean a product development system is. Each principle has been carefully examined to understand what it is based on and out of this; one question for each principle has been created. One question is not enough to create a complete picture of how good a company is doing but it will provide information on how far they have reached in that specific area, and hopefully provide enough information to give an understanding in how good the company is doing in that principle. For each question six statements were created to easier quantify how lean the system is. The level 0 means that no effort at all has been made in the area of the principle while level 5 means that this principle is completely practiced in a lean way. It is important to remember that even if the company is at level 5 in any specific principle or even in all of them, the journey to lean is a never-ending journey, which means there is always room for improvements. The complete model can be found in “10.1. Lean product development maturity model”.

87
The model which is named Lean product development model, LPDMM, is built with maturity models like Michael Hammers PEMM in mind. Even though this model does not include enablers and capabilities, as PEMM does, the principles pretty much includes the same content. This also means that the maturity is never greater than the minimum grade for each principle in the total system. The LPDMM was also inspired by a model developed by Swerea IVF which is also used to measure how lean a company’s product development process is. This model is not public and the authors did not have access to it during the development of LPDMM.
As mentioned earlier, this model is developed to define the lean product development maturity in a company which could be referred to as the “As Is”-state. As a framework for best practice the highest level for each statement can be used. However, the model can also be used to decide a “To Be”-state which then would be referred to as a next practice framework.
To ensure that the question was well understood each question was asked in person under the first interview and then they were reviewed to better correspond with the proposed issue.
4.1.2. Best practice framework
The framework consists of 13 questions, one question for each principle presented by Liker and Morgan. Each question is then graded from 0 to 5 where 5 should be seen as best practice in lean product development.
Question with best practice statements
1. Does the company focus on creating value for the customer?
Customer defined value is the strongest driving force within
the whole company.
2. How does the company use information and knowledge in the
initial stages to better understand future customer (both internal
and external) requirements (Information from e.g. sales,
marketing, production, logistics, procurement and quality)?
The whole company actively uses a process that search for
information about requirements, usage and process
capabilities. The information is stored in a know-how
database and is used to find solutions how to fulfill the
future demand.
88
3. How far has the company come to minimize the variations and to
level the flow in the process?
The whole organization is benefitting and seeing the
importance of variation reduction and process flow. Work-
load is on an even level throughout the process.
4. How standardized are the company’s processes and products?
The organization’s process interface has been standardized.
Resources can easily be shared between different projects.
Product platforms are used in product development to easily
reuse solutions.
5. How controlled are the ownership, responsibility and leadership
over the product?
Each product has its own "chief engineer" that both works
as the voice of the customer which is communicated
throughout the process and has the authority to make all
decisions about the product.
6. How do cross-functional teams work within the company?
Knowledge from all parts of the company is integrated in the
process. This is done with deep technical competence within
functions and a "chief engineer" building a bridge between
the functional specialists to lay focus on customer value.
7. How does the company focus on the employee development?
Focus on deep technical skills within the function.
Mentoring program and learning-by-doing at the source
(gemba). On-job-training (OJT). Development is focusing
on knowing who the customers are.
8. How well integrated are the suppliers?
Suppliers are divided into different categories depending on
their importance. Most important suppliers are involved in
the whole PD process and are doing investments to provide
better products and quality for a long term relationship.
89
9. How does the company work with learning for continuous
improvements within the organization?
A formal knowledge handling process exists. Knowledge fits
with the future way to work in a clear way. Improvement
through reflection in form of personal reflection of each
individual, real-time reflection of activities and a final
reflection of the completed process.
10. How does the company work in the sense of creating a supportive
culture for achieving excellence and relentless improvements?
Technical excellence before business excellence. A
disciplined process with customer first focus. Improvements
every day. Planned executions of all actions and the
importance of learning are recognized.
11. How does the company work with technology to fit with people and
the process?
New technology fits with current technology and the NPD
system. Technology supports the processes and enhances
peoples work.
12. How does the company communicate to align a project in the NPD
process in the organization?
An aligning document is created for each project to define
core parameters. Visual and simple tools are used.
Communication is targeted, sufficient, and accurate and
focuses on the essential facts.
13. How does the company standardize to achieve learning within the
organization?
Tools are standardized so that they can be understood and
used by the whole organization. The tools are maintained by
the users. Learning is the number one priority within the
organization.
90
4.2. Survey for waste- and problem identification
To identify problems and sources of waste in the NPD process a survey was conducted to use the knowledge of the people who are working in the process. This survey was built by the authors and was based on the theory presented in the theoretical framework. The survey is divided into four parts as follows:
1. The first part is the introduction which collects information about
the respondents’ full name, functional unit at the company, title
and which product category they work in. This information is
requested by two reasons. The first reason is to be able to back-
track interesting results to different parts of the process. The
second reason is that better answers and more accurate information
are expected if a form is not anonymous.
2. The second part is based on Millard’s seven waste categories in lean
product development and focuses on identifying waste by letting
the respondent grade a certain number of statements for each
category by frequency on a five graded scale. For each waste
category there is also a comment field where the respondent can
write e.g. common problems or improvements suggestions.
3. The third part is based on Liker’s and Morgan’s 13 principles of lean
product development and instead of focusing on wastes it focuses
on problems from the principles perspective. Each principle is given
a number of statements which are graded by agreement of the
respondent on a five graded scale.
4. The last part is more open for the respondent to write own text. It is
thought of as a reflection part as the respondent might come up
with suggestions and ideas during the survey.
The full survey with questions is presented in “10.2. Questionnaire for identification of problems and waste”.
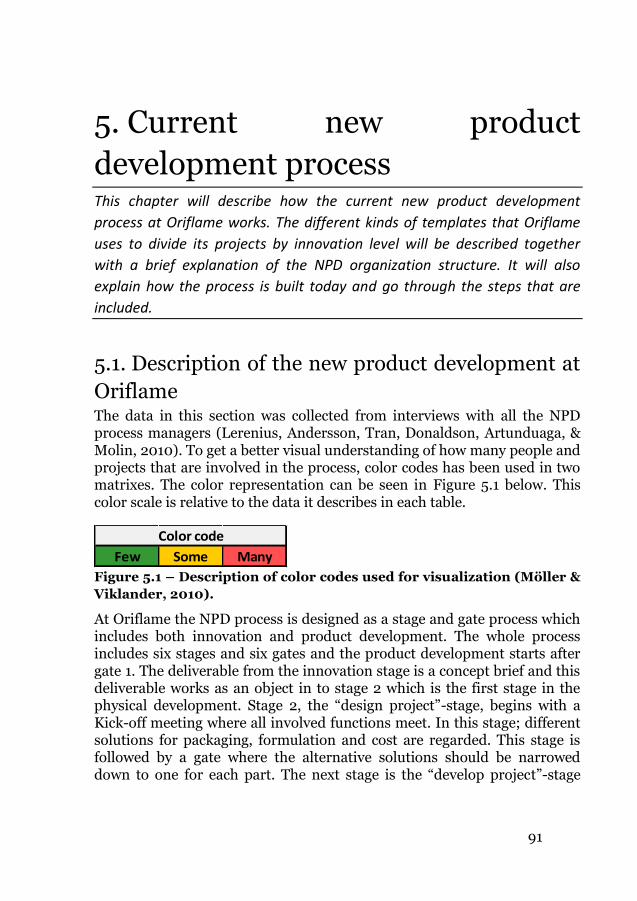
91
5. Current new product
development process This chapter will describe how the current new product development
process at Oriflame works. The different kinds of templates that Oriflame
uses to divide its projects by innovation level will be described together
with a brief explanation of the NPD organization structure. It will also
explain how the process is built today and go through the steps that are
included.
5.1. Description of the new product development at
Oriflame The data in this section was collected from interviews with all the NPD process managers (Lerenius, Andersson, Tran, Donaldson, Artunduaga, & Molin, 2010). To get a better visual understanding of how many people and projects that are involved in the process, color codes has been used in two matrixes. The color representation can be seen in Figure 5.1 below. This color scale is relative to the data it describes in each table.
Figure 5.1 – Description of color codes used for visualization (Möller &
Viklander, 2010).
At Oriflame the NPD process is designed as a stage and gate process which includes both innovation and product development. The whole process includes six stages and six gates and the product development starts after gate 1. The deliverable from the innovation stage is a concept brief and this deliverable works as an object in to stage 2 which is the first stage in the physical development. Stage 2, the “design project”-stage, begins with a Kick-off meeting where all involved functions meet. In this stage; different solutions for packaging, formulation and cost are regarded. This stage is followed by a gate where the alternative solutions should be narrowed down to one for each part. The next stage is the “develop project”-stage
Few Some Many
Color code
92
followed by the third gate where CapEx30 and final cost are approved. The following stage is “implement project” followed by “produce” and “launch”.
The NPD process does contain the same stages and gates for all the products that are developed. However the stages and gates do not contain exactly the same activities depending on the nature of the product being developed. The different kinds of the development that are available are for packaging where three different levels of innovations are used and for formulation where four different levels are used. This gives a total combination of 12 different processes, or templates, for the NPD process for Cosmetics products.
Innovation levels for packaging development:
Tooling: The components specified do not exist and therefore
substantial time and cost is required to prepare the tooling and
equipment to produce. This requires a higher level of innovation.
Standard: The components exist in the portfolio of Oriflame or a
third party but they have never been filled or processed on the
intended production lines. Change parts or equipment are required
to produce.
Re-pack: The components exist in the portfolio of Oriflame or a
third party and they have been filled or processed on the intended
production lines. Only color or decoration changes are required
which means that the innovation level are lower.
Innovation levels for formulation development:
1: New formulation which means high level of innovation. Most
iterative development to achieve performance claims.
2: Some development of a current base, e.g. texture modification,
high moisturizing. Some raw base stability required. Raw materials
changes. Some risk.
3: Standard base. No new raw materials outside fragrances.
4: No base change which means that the innovation level is very
low.
30 Capital Expenditures: One off payments for physical assets; usually
tooling/molds for the manufacture of packaging components. Capital
Expenditures are usually amortized over a fixed 3 year period of payback.
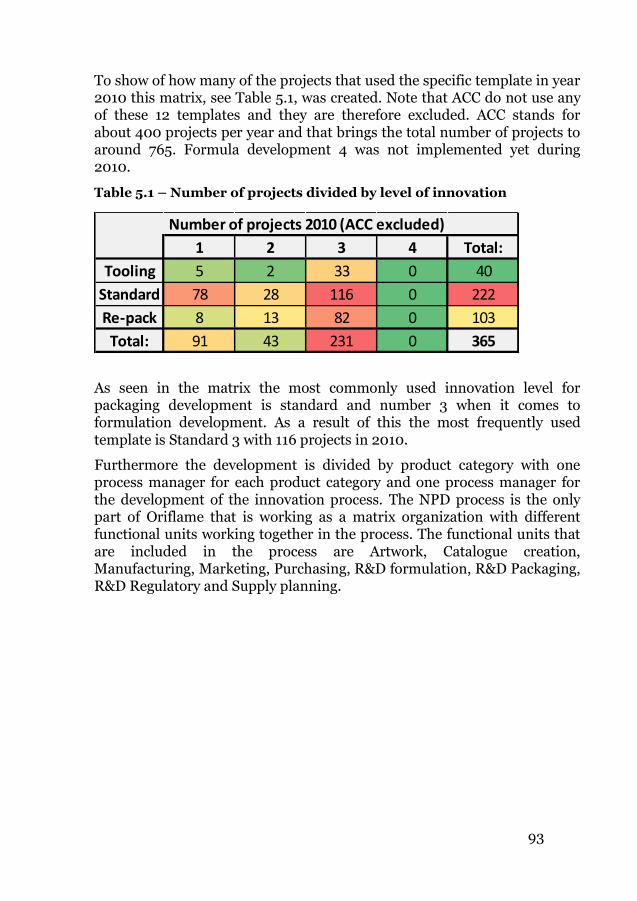
93
To show of how many of the projects that used the specific template in year 2010 this matrix, see Table 5.1, was created. Note that ACC do not use any of these 12 templates and they are therefore excluded. ACC stands for about 400 projects per year and that brings the total number of projects to around 765. Formula development 4 was not implemented yet during 2010.
Table 5.1 – Number of projects divided by level of innovation
As seen in the matrix the most commonly used innovation level for packaging development is standard and number 3 when it comes to formulation development. As a result of this the most frequently used template is Standard 3 with 116 projects in 2010.
Furthermore the development is divided by product category with one process manager for each product category and one process manager for the development of the innovation process. The NPD process is the only part of Oriflame that is working as a matrix organization with different functional units working together in the process. The functional units that are included in the process are Artwork, Catalogue creation, Manufacturing, Marketing, Purchasing, R&D formulation, R&D Packaging, R&D Regulatory and Supply planning.
1 2 3 4 Total:
Tooling 5 2 33 0 40
Standard 78 28 116 0 222
Re-pack 8 13 82 0 103
Total: 91 43 231 0 365
Number of projects 2010 (ACC excluded)
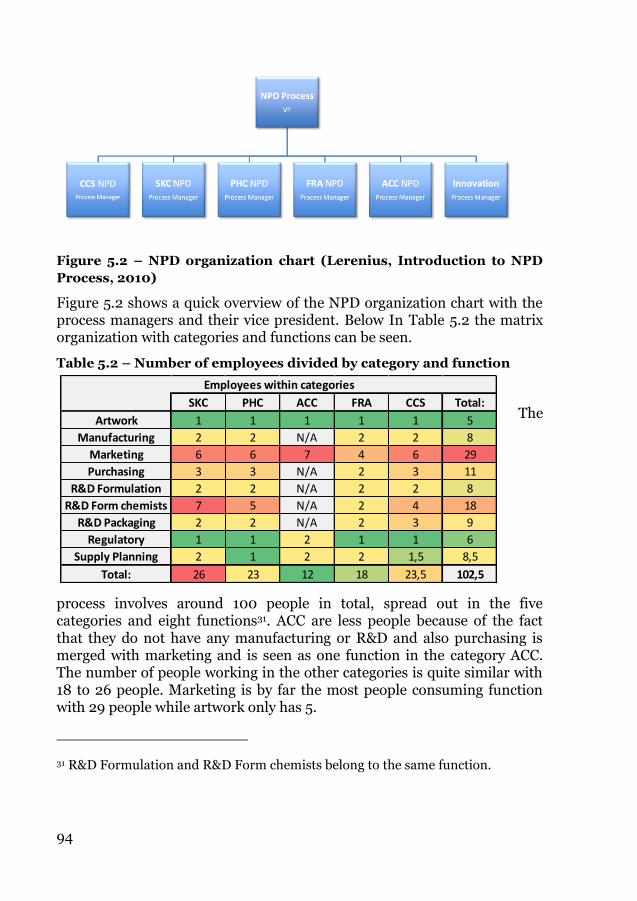
94
SKC PHC ACC FRA CCS Total:
Artwork 1 1 1 1 1 5
Manufacturing 2 2 N/A 2 2 8
Marketing 6 6 7 4 6 29
Purchasing 3 3 N/A 2 3 11
R&D Formulation 2 2 N/A 2 2 8
R&D Form chemists 7 5 N/A 2 4 18
R&D Packaging 2 2 N/A 2 3 9
Regulatory 1 1 2 1 1 6
Supply Planning 2 1 2 2 1,5 8,5
Total: 26 23 12 18 23,5 102,5
Employees within categories
Figure 5.2 – NPD organization chart (Lerenius, Introduction to NPD
Process, 2010)
Figure 5.2 shows a quick overview of the NPD organization chart with the process managers and their vice president. Below In Table 5.2 the matrix organization with categories and functions can be seen.
Table 5.2 – Number of employees divided by category and function
The
process involves around 100 people in total, spread out in the five categories and eight functions31. ACC are less people because of the fact that they do not have any manufacturing or R&D and also purchasing is merged with marketing and is seen as one function in the category ACC. The number of people working in the other categories is quite similar with 18 to 26 people. Marketing is by far the most people consuming function with 29 people while artwork only has 5.
31 R&D Formulation and R&D Form chemists belong to the same function.
95
Super launches
Oriflame classifies their most important product development projects as super launches. There are four criteria for their selection where at least one criteria needs to be satisfied for a development to be considered a super launch.
1. Net sales have to be more than €1.6M in the first campaign or a
total of €3.5M in 12 months; for products developed for CIS and
EMEA regions alone.
2. The product is part of the agreed top 20 brand list.
3. The product is of strategic importance for the business, e.g. entry
into a new product segment or is driving growth in a key market
segment.
4. The investment level for tooling is more than €25k.
The super launches will then be prioritized over other projects in form of:
Full priority over other projects for resources.
Full business cases (not yet implemented).
Reviewed as priorities in NPD reviews.
Reported specifically in the IBM process32.
Unique critical paths.
32 Integrated Business Management which is a top-management process used to
control decision making
96
5.2. Management of the process When looking at the management of the process we find Figure 5.3 to be a good explanation of how Oriflame’s NPD process is managed. Note that the process structure is only a schematic drawing and it is the management that is important in this figure.
This figure describes how the process is owned and maintained by the VP of NPD & Artwork but also by the different process managers by category, and one process manager for the innovation process.
The projects have no clear owner and the NPD process is divided into the innovation process and the development process. The innovation process is owned and managed by partly the innovation process manager and party a category manager. The same way for the development process except it is a NPD process manager instead of the innovation process manager.
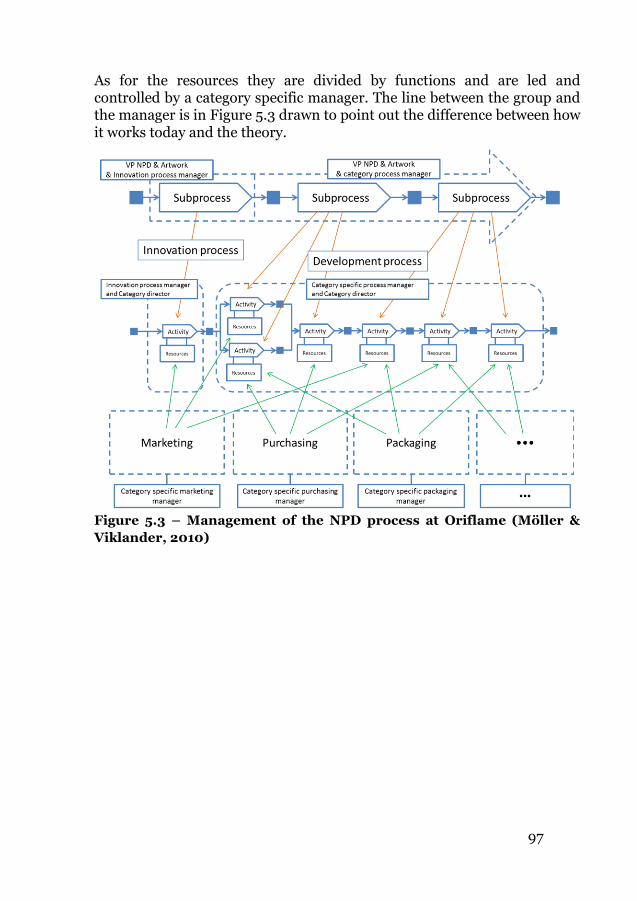
97
As for the resources they are divided by functions and are led and controlled by a category specific manager. The line between the group and the manager is in Figure 5.3 drawn to point out the difference between how it works today and the theory.
Figure 5.3 – Management of the NPD process at Oriflame (Möller &
Viklander, 2010)
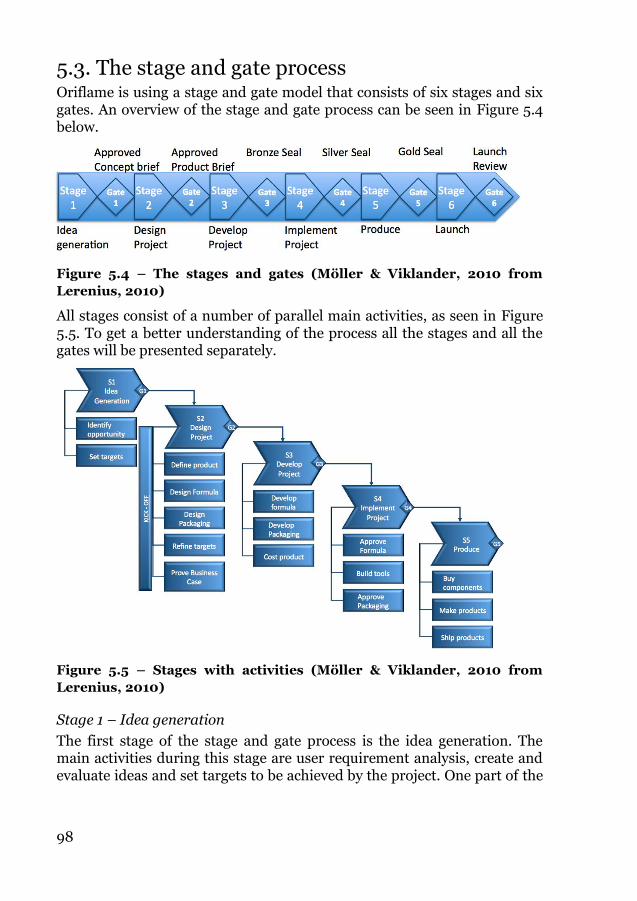
98
5.3. The stage and gate process Oriflame is using a stage and gate model that consists of six stages and six gates. An overview of the stage and gate process can be seen in Figure 5.4 below.
Figure 5.4 – The stages and gates (Möller & Viklander, 2010 from
Lerenius, 2010)
All stages consist of a number of parallel main activities, as seen in Figure 5.5. To get a better understanding of the process all the stages and all the gates will be presented separately.
Figure 5.5 – Stages with activities (Möller & Viklander, 2010 from
Lerenius, 2010)
Stage 1 – Idea generation
The first stage of the stage and gate process is the idea generation. The main activities during this stage are user requirement analysis, create and evaluate ideas and set targets to be achieved by the project. One part of the
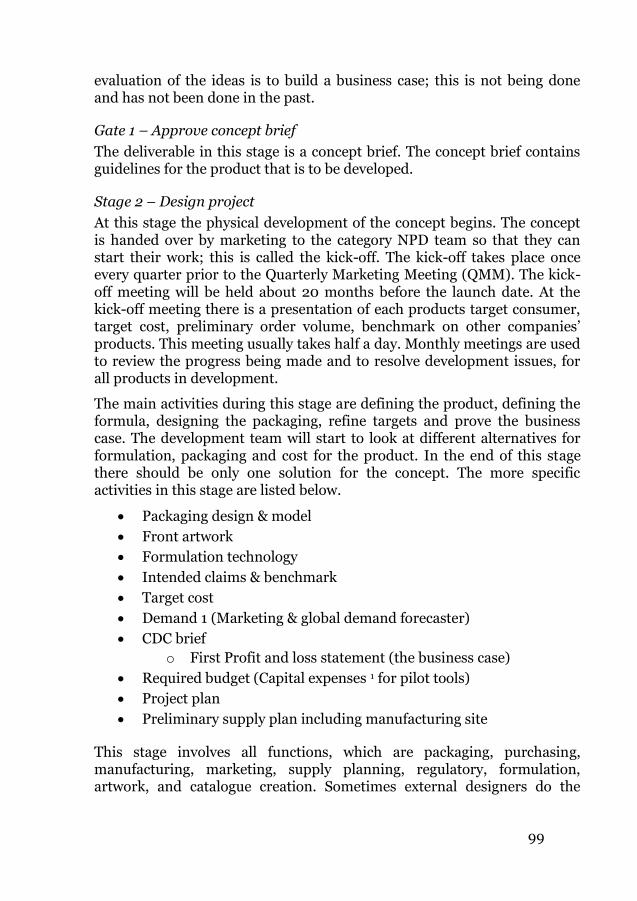
99
evaluation of the ideas is to build a business case; this is not being done and has not been done in the past.
Gate 1 – Approve concept brief
The deliverable in this stage is a concept brief. The concept brief contains guidelines for the product that is to be developed.
Stage 2 – Design project
At this stage the physical development of the concept begins. The concept is handed over by marketing to the category NPD team so that they can start their work; this is called the kick-off. The kick-off takes place once every quarter prior to the Quarterly Marketing Meeting (QMM). The kick-off meeting will be held about 20 months before the launch date. At the kick-off meeting there is a presentation of each products target consumer, target cost, preliminary order volume, benchmark on other companies’ products. This meeting usually takes half a day. Monthly meetings are used to review the progress being made and to resolve development issues, for all products in development.
The main activities during this stage are defining the product, defining the formula, designing the packaging, refine targets and prove the business case. The development team will start to look at different alternatives for formulation, packaging and cost for the product. In the end of this stage there should be only one solution for the concept. The more specific activities in this stage are listed below.
Packaging design & model
Front artwork
Formulation technology
Intended claims & benchmark
Target cost
Demand 1 (Marketing & global demand forecaster)
CDC brief
o First Profit and loss statement (the business case)
Required budget (Capital expenses 1 for pilot tools)
Project plan
Preliminary supply plan including manufacturing site
This stage involves all functions, which are packaging, purchasing, manufacturing, marketing, supply planning, regulatory, formulation, artwork, and catalogue creation. Sometimes external designers do the
100
design activities in this stage. The main formal cross-functional work is done in the beginning, at the kick-off meeting, but also a lot of informal cross-functional work is performed during this stage. The NPD team has weekly and monthly meetings where they meet and discuss the current situation.
Gate 2 – Approve product brief
Deliverables are product brief, business case (second version) and design model. As the business case has not been implemented it cannot be reviewed at this gate. The process manager is the gatekeeper with support from the NPD team.
Stage 3 – Develop project
In stage 2 the concept was defined into a product through exploring different solutions. In stage 3 the development of the product begins. The main activities in this stage are developing formula, develop packaging and cost product. The development of the packaging is still on paper in this stage and the formulation is approved for costing and to go for full testing, R&D formulation and packaging are therefore highly involved. A large part of stage 3 is the cost setting and therefore purchasing plays a big part in this stage. More specific activities performed in stage 3 are the following.
Produce pilot product / Technical model
“Approved” formulation
First catalogue layout
Final cost
Profit and loss
Demand 2 (Regional)
Market research results
Gate 3 – Confirm project for implementation
Deliverables in this gate are capital expenses approved, final business case, final cost defined and the technical model of the product. The problem that comes from the fact that a business case is not implemented is giving the same effect in this gate, it cannot be approved. A lot of the preparation for cost approval is taking place within purchasing. The process manager cannot see the cost before this gate. The gatekeepers are the same here as in gate 2.
Stage 4 – Implement project
The main activities during this stage are to approve formula, build tools if tools are needed and approve packaging. The building of the tools is a time-
101
and money- consuming activity, it is also very important to get it right the first time because it cannot be adjusted later. The testing of the formulation is also critical at this point as it takes over 12 weeks. The result could be either approval of formulation or rejection. Commonly the testing of the formula can give indications of problems before the 12 weeks has past, giving the development team time to solve any problems.
To translate the text-information on packages into different languages Oriflame use employees within the different countries. These employees do not have this task as their main work which can cause delays. The registration of the product also needs to be done at this stage. More specific activities performed in stage 4 are the following:
Final components
Tools & complete line trial (bulk & packaging)
Final catalogue layout
Launch quantities (Demand 3: country / regions)
Supply plan
Gate 4 – Project for production
Deliverables are artwork approved, supply plan, final packaging specifications, approved formulation, approved component samples and packaging standards. Gatekeepers are the same as in gate 2 and 3. Gate 4 signals the end of the product development. From this gate and the following gates there is nearly always a go decision taken.
Stage 5 – Produce
This stage involves the production of the products and also includes the procurement of components and the shipping. There are rarely loop-back to earlier stages in this stage. Other important activities in this stage are:
Line filling
Production sample
This stage involves supply planning, manufacturing and purchasing.
Gate 5 – Confirm product for launch
The deliverable in this gate is the delivered quantities (hub vs. 4 month Forecast). This gate is measured by the supply chain organization and not by any NPD process KPI’s and the gatekeepers are the same here as in gate 2, 3 and 4.
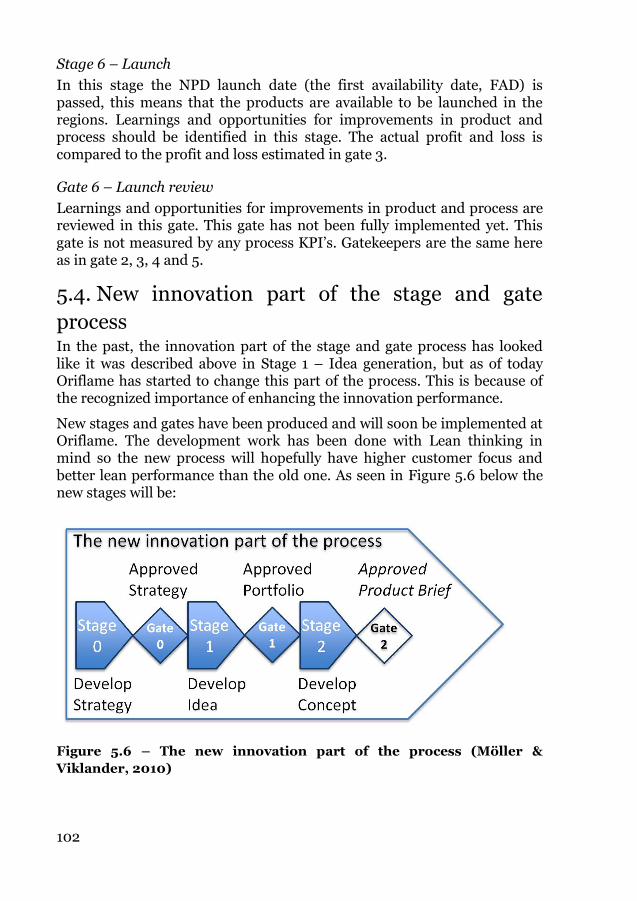
102
Stage 6 – Launch
In this stage the NPD launch date (the first availability date, FAD) is passed, this means that the products are available to be launched in the regions. Learnings and opportunities for improvements in product and process should be identified in this stage. The actual profit and loss is compared to the profit and loss estimated in gate 3.
Gate 6 – Launch review
Learnings and opportunities for improvements in product and process are reviewed in this gate. This gate has not been fully implemented yet. This gate is not measured by any process KPI’s. Gatekeepers are the same here as in gate 2, 3, 4 and 5.
5.4. New innovation part of the stage and gate
process In the past, the innovation part of the stage and gate process has looked like it was described above in Stage 1 – Idea generation, but as of today Oriflame has started to change this part of the process. This is because of the recognized importance of enhancing the innovation performance.
New stages and gates have been produced and will soon be implemented at Oriflame. The development work has been done with Lean thinking in mind so the new process will hopefully have higher customer focus and better lean performance than the old one. As seen in Figure 5.6 below the new stages will be:
Figure 5.6 – The new innovation part of the process (Möller &
Viklander, 2010)
103
Stage 0: Develop strategy
Gate 0: Approved strategy
Stage 1: Develop idea
Gate 1: Approved portfolio
5.5. Common problems at stages The creative design work tends to be finished late, no deadline is set for these activities and that makes them hard to control. When critical activities are late they have a direct and negative effect on the time schedule and give many other downstream effects as late passing of the gates for example.
Problems in the stages most often derive from earlier stages. People tend to wait for tasks to be done and handed to them instead of asking for them when they need them.
The results from the formulation testing are sometimes negative. In that situation a fast solution is critical which often ends with using an already approved formula instead of the intended one.
Translation of product information into different languages is done by employees that have other work priorities. These employees do not always have time for this extra tasks and this causes delays. They tend to under prioritize these translation activities as they are not the most important at that moment.
5.6. Common problems at the gates The kill decision is rarely taken. This means that the gates work more as
milestones than as real gates that open and close the process. The hold decision is
only taken if there is time to pause the project and the project will always be
finished on time, according to the plan. Recycle decisions are more commonly
taken in the early stages. The next stage is very often started before the gate
decisions have been made, this means that the stages very often run parallel to
each other. The gate has no real top-management support; the control is not seen
as very important. Post-launch reviews are not taken seriously.
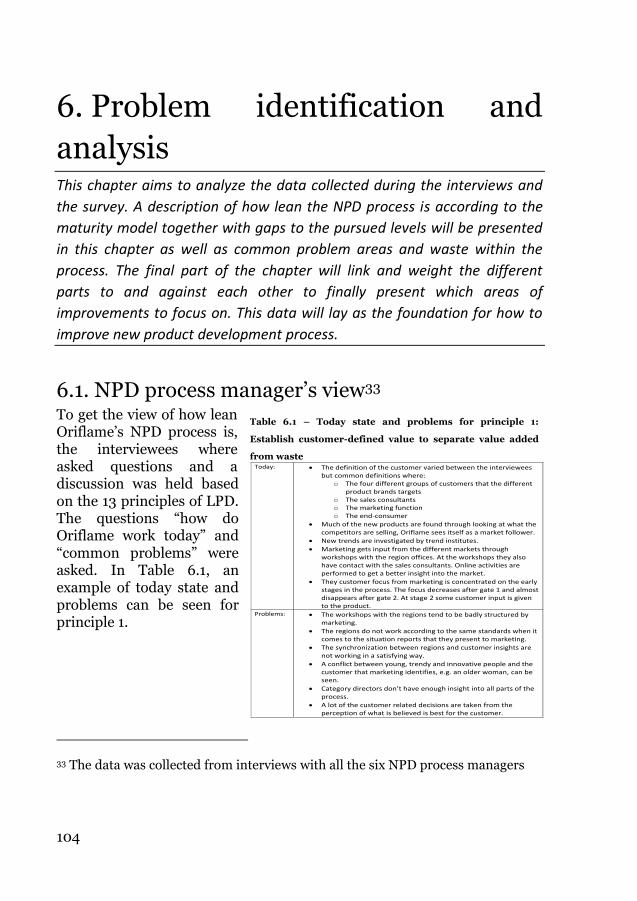
104
Today: The definition of the customer varied between the interviewees but common definitions where:
o The four different groups of customers that the different product brands targets
o The sales consultants o The marketing function o The end-consumer
Much of the new products are found through looking at what the competitors are selling, Oriflame sees itself as a market follower.
New trends are investigated by trend institutes.
Marketing gets input from the different markets through workshops with the region offices. At the workshops they also have contact with the sales consultants. Online activities are performed to get a better insight into the market.
They customer focus from marketing is concentrated on the early stages in the process. The focus decreases after gate 1 and almost disappears after gate 2. At stage 2 some customer input is given to the product.
Problems: The workshops with the regions tend to be badly structured by marketing.
The regions do not work according to the same standards when it comes to the situation reports that they present to marketing.
The synchronization between regions and customer insights are not working in a satisfying way.
A conflict between young, trendy and innovative people and the customer that marketing identifies, e.g. an older woman, can be seen.
Category directors don’t have enough insight into all parts of the process.
A lot of the customer related decisions are taken from the perception of what is believed is best for the customer.
6. Problem identification and
analysis This chapter aims to analyze the data collected during the interviews and
the survey. A description of how lean the NPD process is according to the
maturity model together with gaps to the pursued levels will be presented
in this chapter as well as common problem areas and waste within the
process. The final part of the chapter will link and weight the different
parts to and against each other to finally present which areas of
improvements to focus on. This data will lay as the foundation for how to
improve new product development process.
6.1. NPD process manager’s view33 To get the view of how lean Oriflame’s NPD process is, the interviewees where asked questions and a discussion was held based on the 13 principles of LPD. The questions “how do Oriflame work today” and “common problems” were asked. In Table 6.1, an example of today state and problems can be seen for principle 1.
33 The data was collected from interviews with all the six NPD process managers
Table 6.1 – Today state and problems for principle 1:
Establish customer-defined value to separate value added
from waste
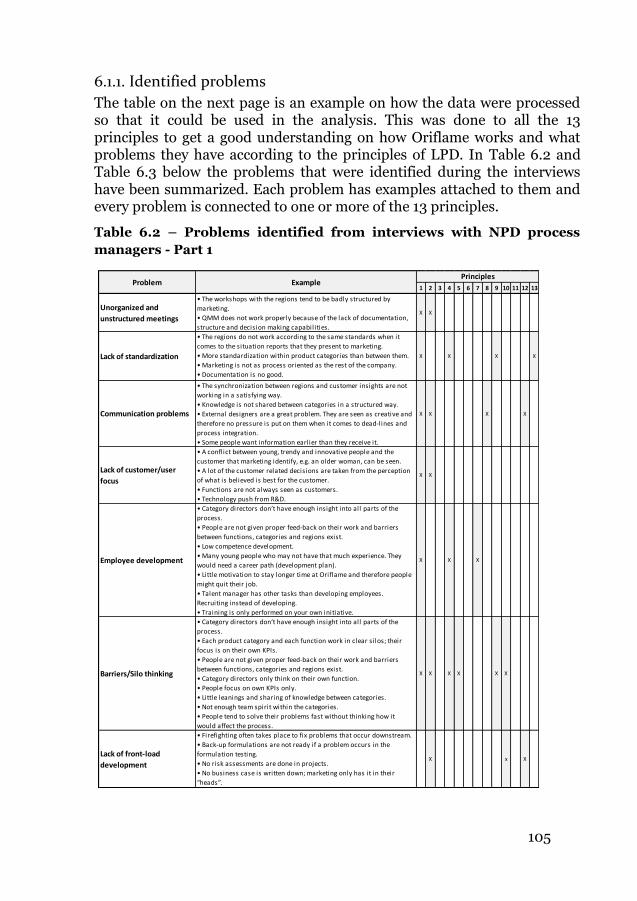
105
6.1.1. Identified problems
The table on the next page is an example on how the data were processed so that it could be used in the analysis. This was done to all the 13 principles to get a good understanding on how Oriflame works and what problems they have according to the principles of LPD. In Table 6.2 and Table 6.3 below the problems that were identified during the interviews have been summarized. Each problem has examples attached to them and every problem is connected to one or more of the 13 principles.
Table 6.2 – Problems identified from interviews with NPD process
managers - Part 1
1 2 3 4 5 6 7 8 9 10 11 12 13
Unorganized and
unstructured meetings
• The workshops with the regions tend to be badly structured by
marketing.
• QMM does not work properly because of the lack of documentation,
structure and decision making capabilities.
X X
Lack of standardization
• The regions do not work according to the same standards when it
comes to the situation reports that they present to marketing.
• More standardization within product categories than between them.
• Marketing is not as process oriented as the rest of the company.
• Documentation is no good.
X X X X
Communication problems
• The synchronization between regions and customer insights are not
working in a satisfying way.
• Knowledge is not shared between categories in a structured way.
• External designers are a great problem. They are seen as creative and
therefore no pressure is put on them when it comes to dead-lines and
process integration.
• Some people want information earlier than they receive it.
X X X X
Lack of customer/user
focus
• A conflict between young, trendy and innovative people and the
customer that marketing identify, e.g. an older woman, can be seen.
• A lot of the customer related decisions are taken from the perception
of what is believed is best for the customer.
• Functions are not always seen as customers.
• Technology push from R&D.
X X
Employee development
• Category directors don’t have enough insight into all parts of the
process.
• People are not given proper feed-back on their work and barriers
between functions, categories and regions exist.
• Low competence development.
• Many young people who may not have that much experience. They
would need a career path (development plan).
• Little motivation to stay longer time at Oriflame and therefore people
might quit their job.
• Talent manager has other tasks than developing employees.
Recruiting instead of developing.
• Training is only performed on your own initiative.
X X X
Barriers/Silo thinking
• Category directors don’t have enough insight into all parts of the
process.
• Each product category and each function work in clear silos; their
focus is on their own KPIs.
• People are not given proper feed-back on their work and barriers
between functions, categories and regions exist.
• Category directors only think on their own function.
• People focus on own KPIs only.
• Little leanings and sharing of knowledge between categories.
• Not enough team spirit within the categories.
• People tend to solve their problems fast without thinking how it
would affect the process.
X X X X X X
Lack of front-load
development
• Firefighting often takes place to fix problems that occur downstream.
• Back-up formulations are not ready if a problem occurs in the
formulation testing.
• No risk assessments are done in projects.
• No business case is written down; marketing only has it in their
“heads”.
X x X
PrinciplesExampleProblem
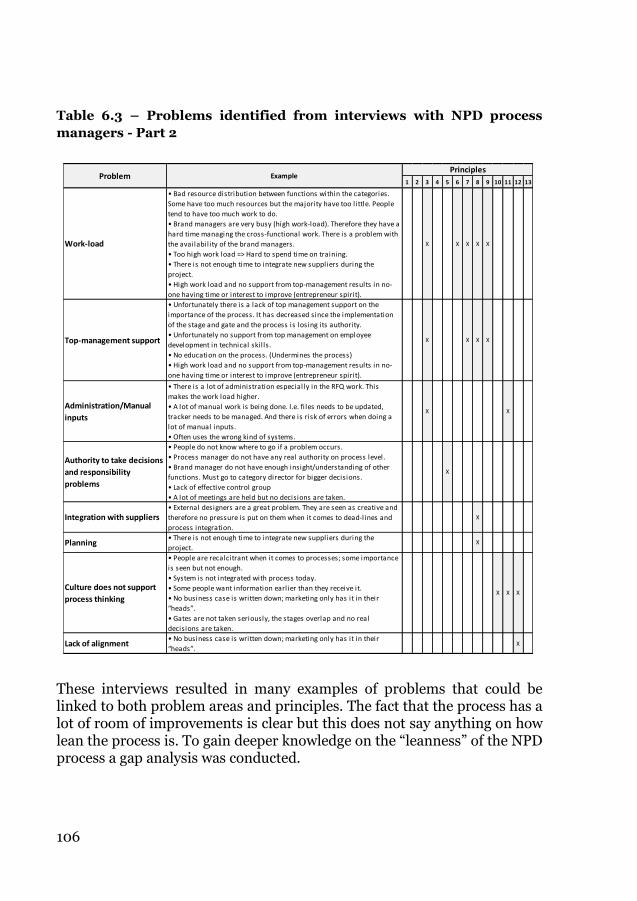
106
Table 6.3 – Problems identified from interviews with NPD process
managers - Part 2
These interviews resulted in many examples of problems that could be linked to both problem areas and principles. The fact that the process has a lot of room of improvements is clear but this does not say anything on how lean the process is. To gain deeper knowledge on the “leanness” of the NPD process a gap analysis was conducted.
1 2 3 4 5 6 7 8 9 10 11 12 13
Work-load
• Bad resource distribution between functions within the categories.
Some have too much resources but the majority have too little. People
tend to have too much work to do.
• Brand managers are very busy (high work-load). Therefore they have a
hard time managing the cross-functional work. There is a problem with
the availability of the brand managers.
• Too high work load => Hard to spend time on training.
• There is not enough time to integrate new suppliers during the
project.
• High work load and no support from top-management results in no-
one having time or interest to improve (entrepreneur spirit).
X X X X X
Top-management support
• Unfortunately there is a lack of top management support on the
importance of the process. It has decreased since the implementation
of the stage and gate and the process is losing its authority.
• Unfortunately no support from top management on employee
development in technical skil ls.
• No education on the process. (Undermines the process)
• High work load and no support from top-management results in no-
one having time or interest to improve (entrepreneur spirit).
X X X X
Administration/Manual
inputs
• There is a lot of administration especially in the RFQ work. This
makes the work load higher.
• A lot of manual work is being done. I.e. fi les needs to be updated,
tracker needs to be managed. And there is risk of errors when doing a
lot of manual inputs.
• Often uses the wrong kind of systems.
X X
Authority to take decisions
and responsibility
problems
• People do not know where to go if a problem occurs.
• Process manager do not have any real authority on process level.
• Brand manager do not have enough insight/understanding of other
functions. Must go to category director for bigger decisions.
• Lack of effective control group
• A lot of meetings are held but no decisions are taken.
X
Integration with suppliers• External designers are a great problem. They are seen as creative and
therefore no pressure is put on them when it comes to dead-lines and
process integration.
X
Planning• There is not enough time to integrate new suppliers during the
project. X
Culture does not support
process thinking
• People are recalcitrant when it comes to processes; some importance
is seen but not enough.
• System is not integrated with process today.
• Some people want information earlier than they receive it.
• No business case is written down; marketing only has it in their
“heads”.
• Gates are not taken seriously, the stages overlap and no real
decisions are taken.
X X X
Lack of alignment• No business case is written down; marketing only has it in their
“heads”.X
Problem ExamplePrinciples
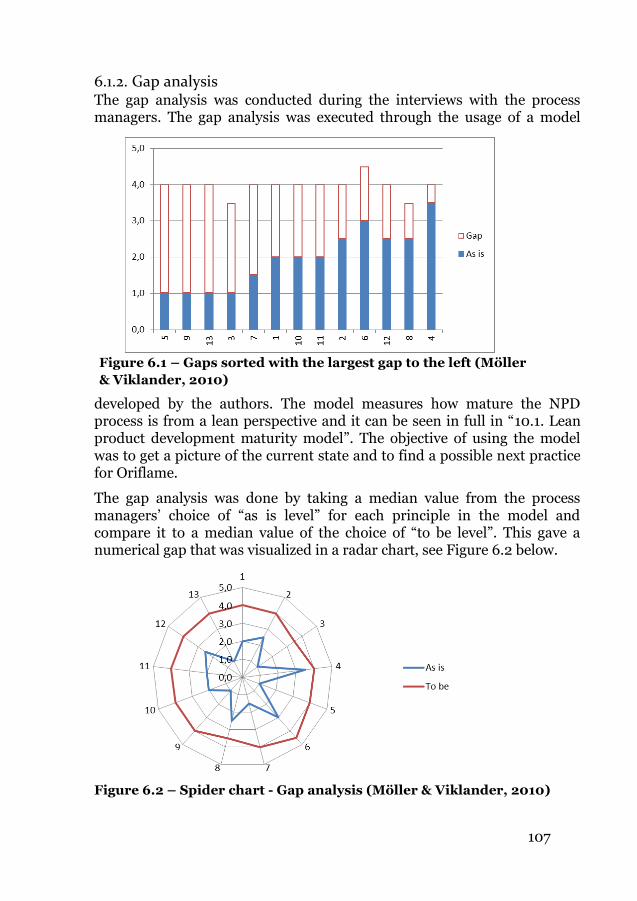
107
6.1.2. Gap analysis The gap analysis was conducted during the interviews with the process managers. The gap analysis was executed through the usage of a model
developed by the authors. The model measures how mature the NPD process is from a lean perspective and it can be seen in full in “10.1. Lean product development maturity model”. The objective of using the model was to get a picture of the current state and to find a possible next practice for Oriflame.
The gap analysis was done by taking a median value from the process managers’ choice of “as is level” for each principle in the model and compare it to a median value of the choice of “to be level”. This gave a numerical gap that was visualized in a radar chart, see Figure 6.2 below.
Figure 6.2 – Spider chart - Gap analysis (Möller & Viklander, 2010)
Figure 6.1 – Gaps sorted with the largest gap to the left (Möller
& Viklander, 2010)
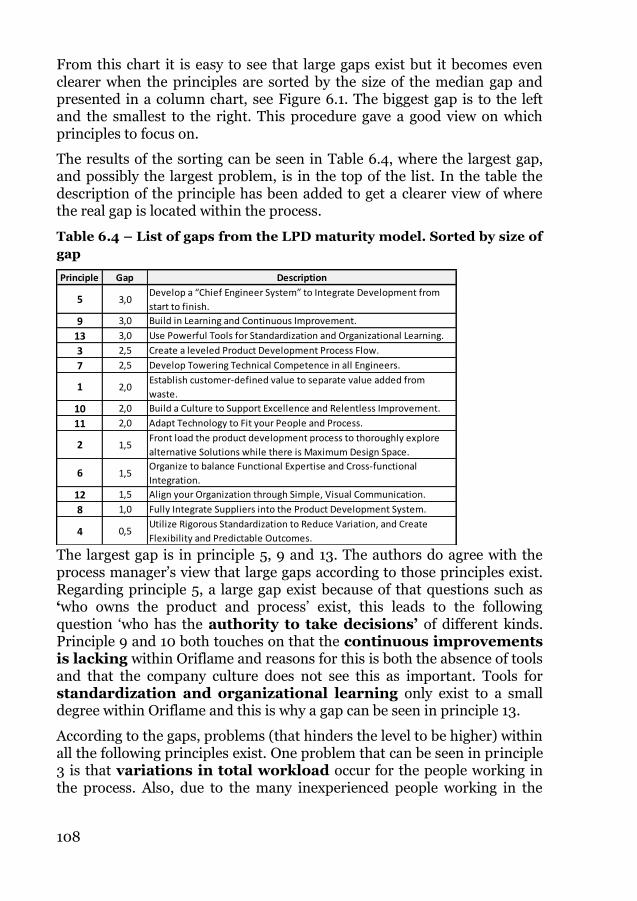
108
From this chart it is easy to see that large gaps exist but it becomes even clearer when the principles are sorted by the size of the median gap and presented in a column chart, see Figure 6.1. The biggest gap is to the left and the smallest to the right. This procedure gave a good view on which principles to focus on.
The results of the sorting can be seen in Table 6.4, where the largest gap, and possibly the largest problem, is in the top of the list. In the table the description of the principle has been added to get a clearer view of where the real gap is located within the process.
Table 6.4 – List of gaps from the LPD maturity model. Sorted by size of
gap
The largest gap is in principle 5, 9 and 13. The authors do agree with the process manager’s view that large gaps according to those principles exist. Regarding principle 5, a large gap exist because of that questions such as ‘who owns the product and process’ exist, this leads to the following question ‘who has the authority to take decisions’ of different kinds. Principle 9 and 10 both touches on that the continuous improvements is lacking within Oriflame and reasons for this is both the absence of tools and that the company culture does not see this as important. Tools for standardization and organizational learning only exist to a small degree within Oriflame and this is why a gap can be seen in principle 13.
According to the gaps, problems (that hinders the level to be higher) within all the following principles exist. One problem that can be seen in principle 3 is that variations in total workload occur for the people working in the process. Also, due to the many inexperienced people working in the
Principle Gap Description
5 3,0Develop a “Chief Engineer System” to Integrate Development from
start to finish.
9 3,0 Build in Learning and Continuous Improvement.
13 3,0 Use Powerful Tools for Standardization and Organizational Learning.
3 2,5 Create a leveled Product Development Process Flow.
7 2,5 Develop Towering Technical Competence in all Engineers.
1 2,0Establish customer-defined value to separate value added from
waste.
10 2,0 Build a Culture to Support Excellence and Relentless Improvement.
11 2,0 Adapt Technology to Fit your People and Process.
2 1,5Front load the product development process to thoroughly explore
alternative Solutions while there is Maximum Design Space.
6 1,5Organize to balance Functional Expertise and Cross-functional
Integration.
12 1,5 Align your Organization through Simple, Visual Communication.
8 1,0 Fully Integrate Suppliers into the Product Development System.
4 0,5Utilize Rigorous Standardization to Reduce Variation, and Create
Flexibility and Predictable Outcomes.
109
process the functional technical competence is limited and principle 7 is affected. The gap in principle 1 mostly exists because of some ambiguities in customer definition. Principle 11 is about that the technology should be adapted to fit the people and processes, which corresponds with believes in Oriflame. The gap exists because of that technology has been left behind and is not adequate at the moment.
In the bottom part of table the principles with small gaps are listed. The gaps are small in principle 2, 6 and 8 and the authors think that Oriflame works in a good way according to these principles even though it is always room for improvement. On the other hand Principle 12 and 4 are misleading according to the authors. Oriflame does not use visual communication commonly and therefore the gap here should be bigger. This misleading result is because of that the question in the maturity model is more directed to aligning document than visual communication in the more specific sense which has been taken into consideration. The last principle in the list and the one with the smallest gap is principle 4. The principle describes standardization as a way of improving the performance of the process and product. According to the gap-analysis results Oriflame should be very good on this but the authors disagree. Oriflame is standardized in its products and also in the high level of the process, the problem is that the low level processes and activities are not standardized and therefore the gap should be considered larger here.
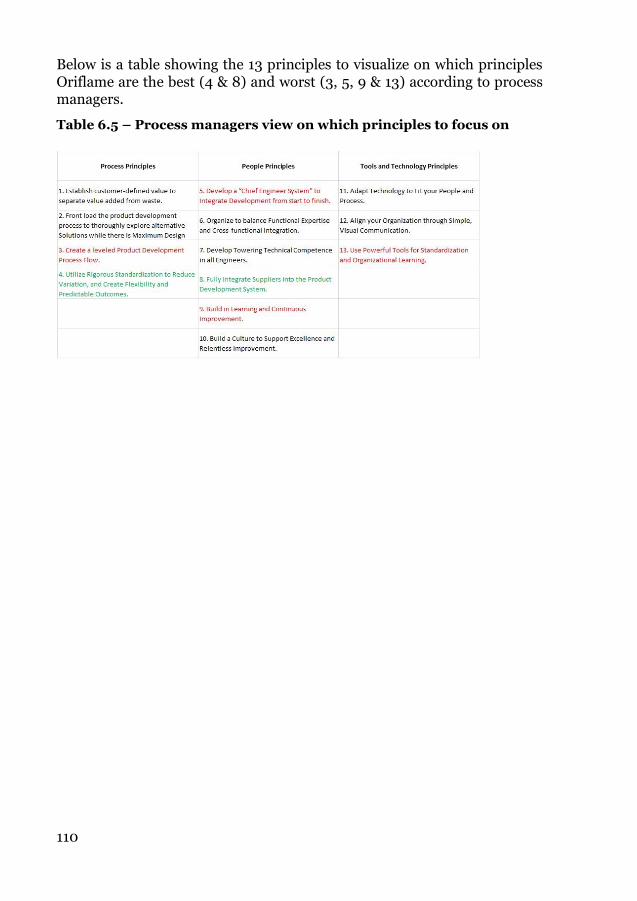
110
Below is a table showing the 13 principles to visualize on which principles Oriflame are the best (4 & 8) and worst (3, 5, 9 & 13) according to process managers.
Table 6.5 – Process managers view on which principles to focus on
111
6.2. Analysis of the survey From the survey, three different parts were separated and analyzed. There was quantitative data from the 7 wastes section and from the 13 principles section, and also qualitative data from the qualitative questions.
The quantitative data was in the form of statements of frequency and agreement. These statements were transformed into grades from 1 to 5 where 1 indicated it was “not lean” or “a problem from a lean perspective” and 5 indicated “lean” or “good from a lean perspective”. Thereafter the questions could be sorted by average values. When the questions were sorted the ones with the lowest value got the biggest focus. Each question was translated into a problem area and got automatically ranked as the value existed from the questions. Note that different questions could relate to the same problem area which implies and results in duplicates as can be seen in the tables below.
For the qualitative answers key words were sought for in each respondent’s answers. These key words were then translated into problem areas and ranked by number of respondents who thought similarly. When another respondent suggested a similar problem (key words matched) the rank increased and was then presented in percent of respondents (out of those who gave qualitative answers) who thought likewise. This list could then be sorted to show which problem areas that were mentioned most often.
6.2.1. 7 wastes The first part of the questionnaire focused on seven wastes in LPD and consisted of 29 questions. In Table 6.6 a result of the analysis can be found with a list where every question has been translated into a problem area, mainly taken from the under-categories from the seven wastes that was the foundation for the questions in the first place. The problem areas were then sorted by rank, where a low ranking indicates it is a common problem. The lowest rankings, which indicate the most waste, are in top of the table to visualize the seriousness of the waste. In the bottom of the table the value are higher, this means that less waste are found within this area.
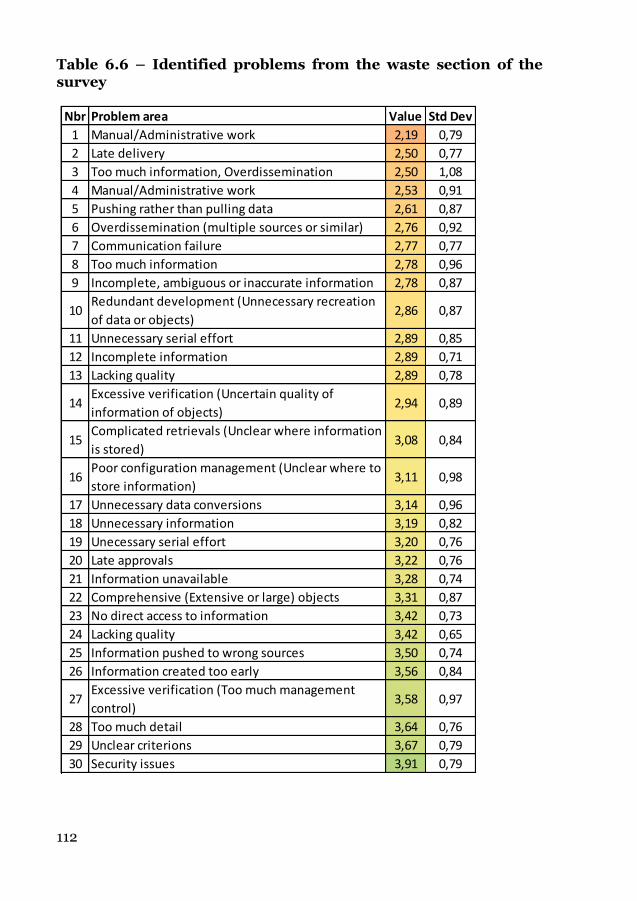
112
Table 6.6 – Identified problems from the waste section of the survey
Nbr Problem area Value Std Dev
1 Manual/Administrative work 2,19 0,79
2 Late delivery 2,50 0,77
3 Too much information, Overdissemination 2,50 1,08
4 Manual/Administrative work 2,53 0,91
5 Pushing rather than pulling data 2,61 0,87
6 Overdissemination (multiple sources or similar) 2,76 0,92
7 Communication failure 2,77 0,77
8 Too much information 2,78 0,96
9 Incomplete, ambiguous or inaccurate information 2,78 0,87
10Redundant development (Unnecessary recreation
of data or objects)2,86 0,87
11 Unnecessary serial effort 2,89 0,85
12 Incomplete information 2,89 0,71
13 Lacking quality 2,89 0,78
14Excessive verification (Uncertain quality of
information of objects)2,94 0,89
15Complicated retrievals (Unclear where information
is stored)3,08 0,84
16Poor configuration management (Unclear where to
store information)3,11 0,98
17 Unnecessary data conversions 3,14 0,96
18 Unnecessary information 3,19 0,82
19 Unecessary serial effort 3,20 0,76
20 Late approvals 3,22 0,76
21 Information unavailable 3,28 0,74
22 Comprehensive (Extensive or large) objects 3,31 0,87
23 No direct access to information 3,42 0,73
24 Lacking quality 3,42 0,65
25 Information pushed to wrong sources 3,50 0,74
26 Information created too early 3,56 0,84
27Excessive verification (Too much management
control)3,58 0,97
28 Too much detail 3,64 0,76
29 Unclear criterions 3,67 0,79
30 Security issues 3,91 0,79
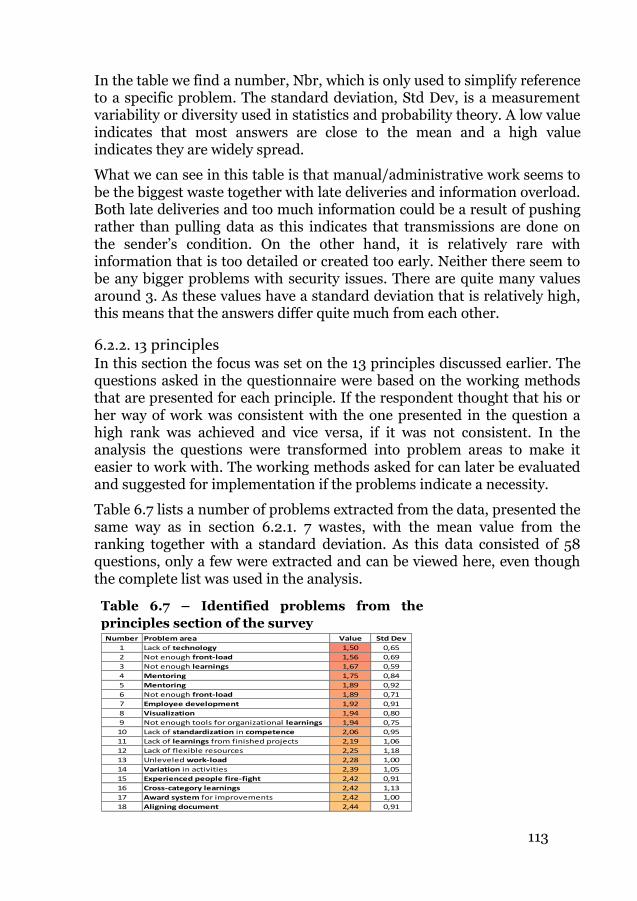
113
In the table we find a number, Nbr, which is only used to simplify reference to a specific problem. The standard deviation, Std Dev, is a measurement variability or diversity used in statistics and probability theory. A low value indicates that most answers are close to the mean and a high value indicates they are widely spread.
What we can see in this table is that manual/administrative work seems to be the biggest waste together with late deliveries and information overload. Both late deliveries and too much information could be a result of pushing rather than pulling data as this indicates that transmissions are done on the sender’s condition. On the other hand, it is relatively rare with information that is too detailed or created too early. Neither there seem to be any bigger problems with security issues. There are quite many values around 3. As these values have a standard deviation that is relatively high, this means that the answers differ quite much from each other.
6.2.2. 13 principles In this section the focus was set on the 13 principles discussed earlier. The questions asked in the questionnaire were based on the working methods that are presented for each principle. If the respondent thought that his or her way of work was consistent with the one presented in the question a high rank was achieved and vice versa, if it was not consistent. In the analysis the questions were transformed into problem areas to make it easier to work with. The working methods asked for can later be evaluated and suggested for implementation if the problems indicate a necessity.
Table 6.7 lists a number of problems extracted from the data, presented the same way as in section 6.2.1. 7 wastes, with the mean value from the ranking together with a standard deviation. As this data consisted of 58 questions, only a few were extracted and can be viewed here, even though the complete list was used in the analysis.
Number Problem area Value Std Dev
1 Lack of technology 1,50 0,65
2 Not enough front-load 1,56 0,69
3 Not enough learnings 1,67 0,59
4 Mentoring 1,75 0,84
5 Mentoring 1,89 0,92
6 Not enough front-load 1,89 0,71
7 Employee development 1,92 0,91
8 Visualization 1,94 0,80
9 Not enough tools for organizational learnings 1,94 0,75
10 Lack of standardization in competence 2,06 0,95
11 Lack of learnings from finished projects 2,19 1,06
12 Lack of flexible resources 2,25 1,18
13 Unleveled work-load 2,28 1,00
14 Variation in activities 2,39 1,05
15 Experienced people fire-fight 2,42 0,91
16 Cross-category learnings 2,42 1,13
17 Award system for improvements 2,42 1,00
18 Aligning document 2,44 0,91
Table 6.7 – Identified problems from the
principles section of the survey
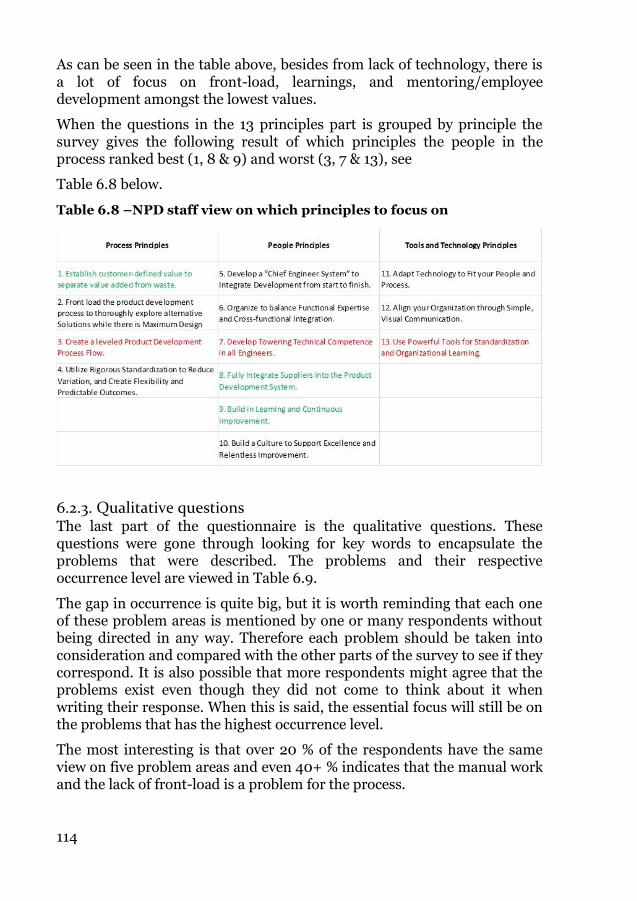
114
As can be seen in the table above, besides from lack of technology, there is a lot of focus on front-load, learnings, and mentoring/employee development amongst the lowest values.
When the questions in the 13 principles part is grouped by principle the survey gives the following result of which principles the people in the process ranked best (1, 8 & 9) and worst (3, 7 & 13), see
Table 6.8 below.
Table 6.8 –NPD staff view on which principles to focus on
6.2.3. Qualitative questions The last part of the questionnaire is the qualitative questions. These questions were gone through looking for key words to encapsulate the problems that were described. The problems and their respective occurrence level are viewed in Table 6.9.
The gap in occurrence is quite big, but it is worth reminding that each one of these problem areas is mentioned by one or many respondents without being directed in any way. Therefore each problem should be taken into consideration and compared with the other parts of the survey to see if they correspond. It is also possible that more respondents might agree that the problems exist even though they did not come to think about it when writing their response. When this is said, the essential focus will still be on the problems that has the highest occurrence level.
The most interesting is that over 20 % of the respondents have the same view on five problem areas and even 40+ % indicates that the manual work and the lack of front-load is a problem for the process.
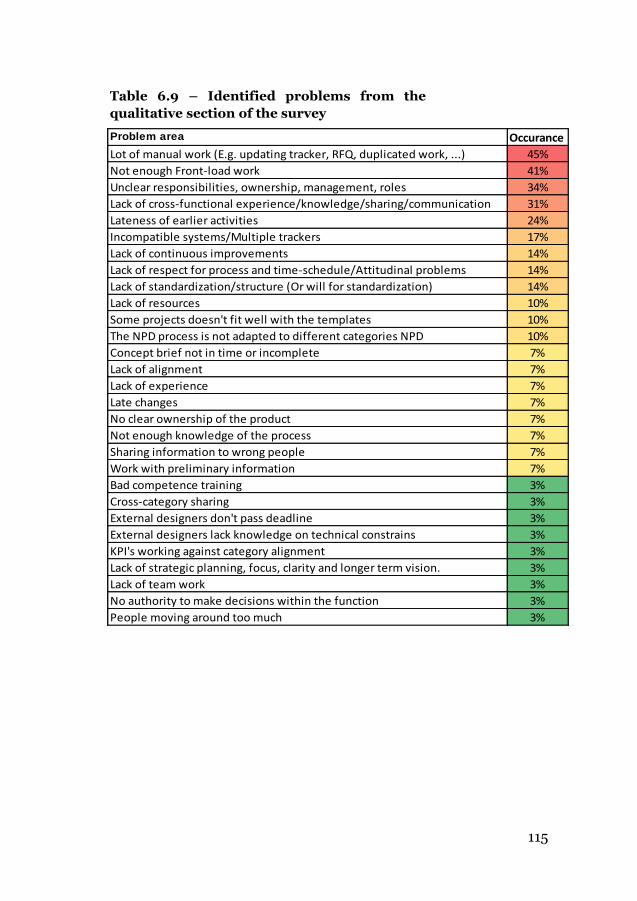
115
Table 6.9 – Identified problems from the
qualitative section of the survey
Problem area Occurance
Lot of manual work (E.g. updating tracker, RFQ, duplicated work, ...) 45%
Not enough Front-load work 41%
Unclear responsibilities, ownership, management, roles 34%
Lack of cross-functional experience/knowledge/sharing/communication 31%
Lateness of earlier activities 24%
Incompatible systems/Multiple trackers 17%
Lack of continuous improvements 14%
Lack of respect for process and time-schedule/Attitudinal problems 14%
Lack of standardization/structure (Or will for standardization) 14%
Lack of resources 10%
Some projects doesn't fit well with the templates 10%
The NPD process is not adapted to different categories NPD 10%
Concept brief not in time or incomplete 7%
Lack of alignment 7%
Lack of experience 7%
Late changes 7%
No clear ownership of the product 7%
Not enough knowledge of the process 7%
Sharing information to wrong people 7%
Work with preliminary information 7%
Bad competence training 3%
Cross-category sharing 3%
External designers don't pass deadline 3%
External designers lack knowledge on technical constrains 3%
KPI's working against category alignment 3%
Lack of strategic planning, focus, clarity and longer term vision. 3%
Lack of team work 3%
No authority to make decisions within the function 3%
People moving around too much 3%
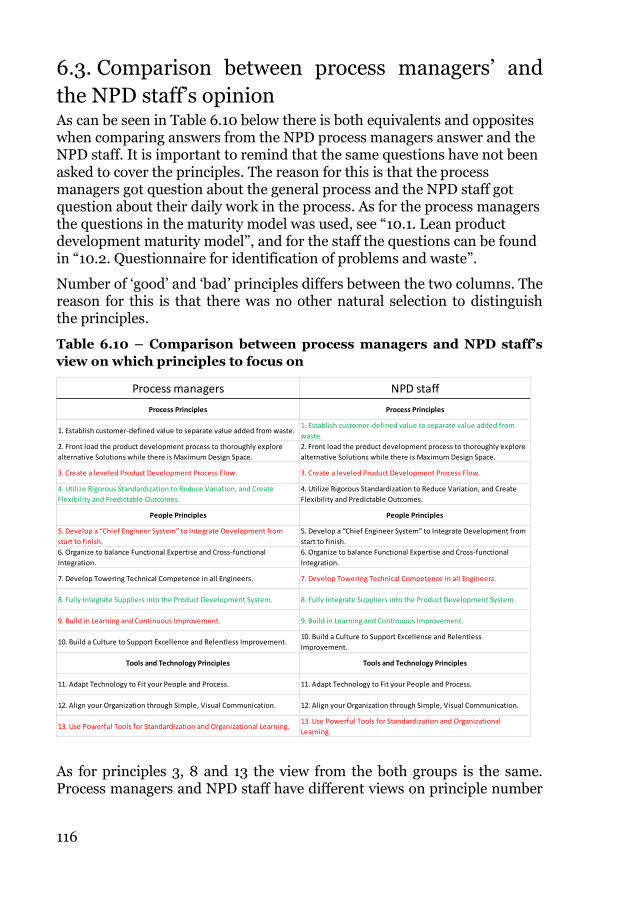
116
6.3. Comparison between process managers’ and
the NPD staff’s opinion As can be seen in Table 6.10 below there is both equivalents and opposites when comparing answers from the NPD process managers answer and the NPD staff. It is important to remind that the same questions have not been asked to cover the principles. The reason for this is that the process managers got question about the general process and the NPD staff got question about their daily work in the process. As for the process managers the questions in the maturity model was used, see “10.1. Lean product development maturity model”, and for the staff the questions can be found in “10.2. Questionnaire for identification of problems and waste”.
Number of ‘good’ and ‘bad’ principles differs between the two columns. The reason for this is that there was no other natural selection to distinguish the principles.
Table 6.10 – Comparison between process managers and NPD staff’s
view on which principles to focus on
As for principles 3, 8 and 13 the view from the both groups is the same. Process managers and NPD staff have different views on principle number
Process managers NPD staff
Process Principles Process Principles
1. Establish customer-defined value to separate value added from waste.1. Establish customer-defined value to separate value added from
waste.
2. Front load the product development process to thoroughly explore
alternative Solutions while there is Maximum Design Space.
2. Front load the product development process to thoroughly explore
alternative Solutions while there is Maximum Design Space.
3. Create a leveled Product Development Process Flow. 3. Create a leveled Product Development Process Flow.
4. Utilize Rigorous Standardization to Reduce Variation, and Create
Flexibility and Predictable Outcomes.
4. Utilize Rigorous Standardization to Reduce Variation, and Create
Flexibility and Predictable Outcomes.
People Principles People Principles
5. Develop a “Chief Engineer System” to Integrate Development from
start to finish.
5. Develop a “Chief Engineer System” to Integrate Development from
start to finish.
6. Organize to balance Functional Expertise and Cross-functional
Integration.
6. Organize to balance Functional Expertise and Cross-functional
Integration.
7. Develop Towering Technical Competence in all Engineers. 7. Develop Towering Technical Competence in all Engineers.
8. Fully Integrate Suppliers into the Product Development System. 8. Fully Integrate Suppliers into the Product Development System.
9. Build in Learning and Continuous Improvement. 9. Build in Learning and Continuous Improvement.
10. Build a Culture to Support Excellence and Relentless Improvement.10. Build a Culture to Support Excellence and Relentless
Improvement.
Tools and Technology Principles Tools and Technology Principles
11. Adapt Technology to Fit your People and Process. 11. Adapt Technology to Fit your People and Process.
12. Align your Organization through Simple, Visual Communication. 12. Align your Organization through Simple, Visual Communication.
13. Use Powerful Tools for Standardization and Organizational Learning.13. Use Powerful Tools for Standardization and Organizational
Learning.
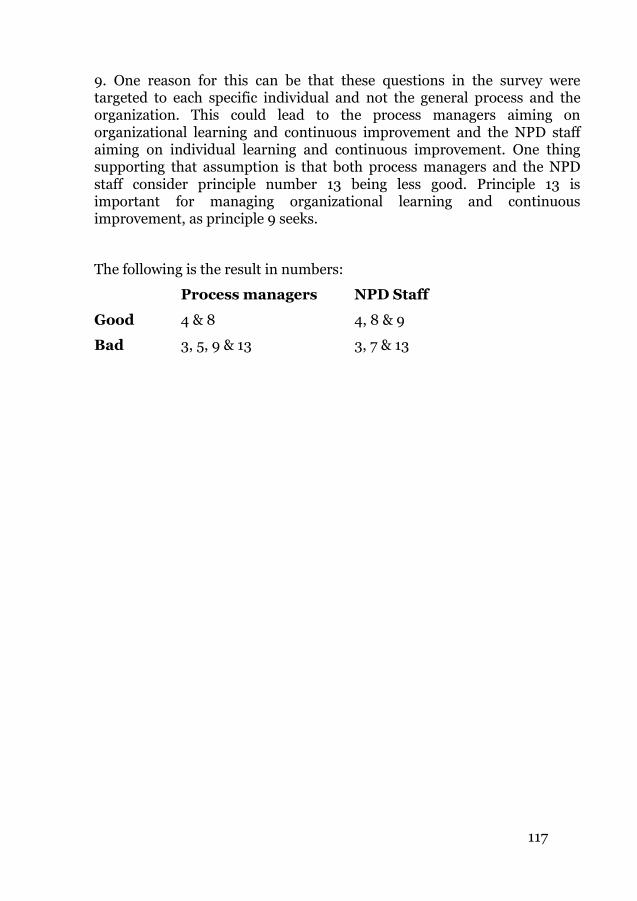
117
9. One reason for this can be that these questions in the survey were targeted to each specific individual and not the general process and the organization. This could lead to the process managers aiming on organizational learning and continuous improvement and the NPD staff aiming on individual learning and continuous improvement. One thing supporting that assumption is that both process managers and the NPD staff consider principle number 13 being less good. Principle 13 is important for managing organizational learning and continuous improvement, as principle 9 seeks.
The following is the result in numbers:
Process managers NPD Staff
Good 4 & 8 4, 8 & 9
Bad 3, 5, 9 & 13 3, 7 & 13
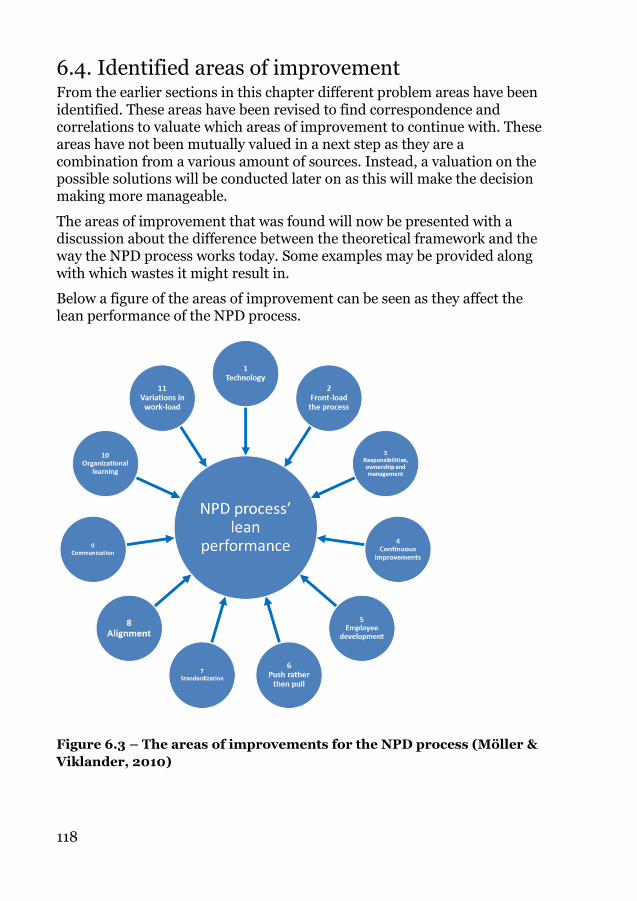
118
6.4. Identified areas of improvement From the earlier sections in this chapter different problem areas have been identified. These areas have been revised to find correspondence and correlations to valuate which areas of improvement to continue with. These areas have not been mutually valued in a next step as they are a combination from a various amount of sources. Instead, a valuation on the possible solutions will be conducted later on as this will make the decision making more manageable.
The areas of improvement that was found will now be presented with a discussion about the difference between the theoretical framework and the way the NPD process works today. Some examples may be provided along with which wastes it might result in.
Below a figure of the areas of improvement can be seen as they affect the lean performance of the NPD process.
Figure 6.3 – The areas of improvements for the NPD process (Möller &
Viklander, 2010)
119
6.4.1. Technology Information technologies that are used in the process today are not adequate to the demands of the process. The reason for the lacking technology is that Oriflame has had a few years of rapid growth and organizational changes. The headquarters has moved and a lot of new employees have been hired. The resources have therefore been directed to operational tasks and trying to understand the process instead of upgrading the technologies.
The results of inadequate technology are a lot of manual and repetitive work that has to be done every day, which is a large waste of time. This waste affects most people in the process and examples of what the tasks may be are e.g. updating the tracker(s) and creating RFQs, much of it in Microsoft Excel.
Technology should help the people working in the process and enhance their performance to do their work. It is also important that the technology is adapted to fit the process not the other way around. The importance of these two statements is recognized within Oriflame and that is a great strength for them when it comes to finding the correct technology solution.
6.4.2. Front-load the process Front-loading the process means putting the most effort in the beginning to avoid problems in the end. By not doing this, there is a risk of e.g. pushing problems forward or developing something that is not possible to produce. Unfortunately, today there are a lot of problems occurring that need fire-fighting leading to experienced people working really hard to fix problems in the end of the process, to reach the launch date.
What is important when talking about front-load is that alternative solutions are discussed early by cross-functional teams. At Oriflame there is a QMM meeting which is used to brief all participants cross-functionally and also to discuss different alternatives. Usually four different solutions are investigated where two, “based on feeling”, are selected. The cheapest solution is mostly the one being picked in the end. Another important part being skipped out is the business case which should be done in the beginning of the process; this is not done at Oriflame.
6.4.3. Responsibilities, ownership and management It is important to know who is responsible for what and who has the authority to make what decisions. Oriflame’s NPD is a matrix organization making it hard to know these things if they are not defined in a clear way. There is no clear owner of each project/product even though there is an unspoken ownership from marketing for all projects. This ownership is not
120
really connected to a specific individual but shared between brand manager and category director. While marketing has great influence in the beginning of the process, after gate 2 it is gradually reduced. In terms of leading a project, that is up to the process managers who properly could “own” the process (process owner, see “3.4.4. Managing the process”) instead and leave the project management part to a project leader/team leader or similar.
6.4.4. Continuous improvements Continuous improvements are one of the most important parts of the lean concept and this is why a company needs to work actively with it to become leaner. One of the most important parts of continuous improvement is according to the literature that reflection appears in the process. The appearance of reflection is strongly linked with the culture within the company. The reflection can be of different kinds; personal reflection, real-time reflection or post-mortem reflection.
Oriflame does not work with continuous improvements or reflection to a large extent, it is not embedded in the company culture. The matrix organization that the NPD process is based on creates barriers both between functions and between categories. This makes the sharing of knowledge and improvements hard but on the other hand gives it a large potential of improving the process. If the reflections could work without barriers it would generate improvements that could be used in multiple cells within the matrix. In the past, learning’s from finished projects has not been collected and used. To get rid of this problem a post launch review has started to be implemented as gate 6 in the stage and gate process. This will give results if the knowledge can be documented and spread across the matrix in an efficient way.
6.4.5. Employee development Employee development is a very important part of lean product development. The employee development is used to enhance the technical expertise, motivate the employees and embed loyalty and culture among the staff. This can be done through introduction programs, mentoring and technical training. An important factor according to LPD is that the employee sees the situation first hand to get a deeper understanding of it.
Oriflame has very little of this as of today but at the same time they have a large need for it because of their many inexperienced employees. A mapped process would be a great first step to simplify the start-up process for a new employee as his or her work would be easier to explain in content. As of today, many of the employees lack the trust and knowledge about how processes work and do not see the benefit with using them. Technical
121
training is rarely offered to the employees and they mostly learn by doing their work. A mentoring program does not exist within Oriflame and the managers are not seen as teachers. Because of the lack of employee development the customer definition is very wide and inconsistent.
6.4.6. Push rather than pull When the flow in the process is on the sender’s conditions and the receiver is passive, it is said to be a push system. The opposite is a pull system where actions are requested by the receiver which means that it is the customer who indicates a need for a product and the process has to be run to develop a product to fulfill that need. In a pull system transfers are on the receiver’s condition which requires the receiver to be active and request information and data.
There are some problems that might occur in push system; too much information might be created, deliveries might be late and information might be sent to the wrong people or people who do not need it. A concrete example at Oriflame is the concept brief that sometimes is presented too late or lacks information. This could be a result of other reasons too but if the system is pulled it should be regarded more important to brief the determined information when requested. Another example might be sending copies of E-mails to people who do not have anything particular to do with that information.
6.4.7. Standardization Standardization is a facilitator for success in many different areas of LPD. Without standardization the continuous improvements will become ineffective and it will be hard to reduce variations. The standardization should be in all levels of the process to be effective; from the top level NPD process down to the activity level such as everyday work. Tools and documents should also be standardized so that more people within the company can understand and use them in a correct way. If these things are standardized it allows for competence standardization that will make it easier to control variations in for example work-load. Products can also be standardized through the use of platforms.
Oriflame has high level standardization today; their stage and gate process and its 12 templates are standardized and mapped. The lower levels of sub-processes and activities are neither standardized nor mapped. This means that people within the process will do their work in different ways depending on their own preferences and competence is not standardized. Today the templates do not fit all the projects in a good way; this is because of that templates are based on the tooling 1 template and the parts that are
122
not needed are removed. If the activities were standardized and the template for a specific project was built using the activities as “building blocks” the template would have a better fit and less waste. Tools, meetings and documents are standardized to some degree within Oriflame even though they often can be seen as unorganized and unstructured.
The will of standardization is modest within Oriflame because of the company culture that says that Oriflame is a company with entrepreneurial spirit. It is important to mention standardization does not inhibit the creativity, instead that by standardizing recurrent activities and such, more time is freed to creative tasks.
6.4.8. Alignment Starting with high-level corporate goals which breaks down into objectives on an operational level to ensure that the whole organization is working towards the same goal is an important part of alignment. On a lower level it is important that everyone in a project also is working towards the same goal. When a lot of cross-functional work takes place such as it does in a NPD project it is a necessity to align the team. Functional KPIs is something that works against this, the thing needed to be measured is what is coming out from the process as a whole, see 3.4.3.
Today Oriflame uses the concept brief and different meetings to align the process. At the same time functional KPIs are in place and are also used to measure performance to determine compensation levels which is creating sub optimization according to the interviews and the survey. One KPI exist for the process, gate on time34, which is not taken as seriously as other functional KPIs.
The theory favors simple tools visualizing the project to align the team in the NPD process. Along with these KPIs covering the entire process could be used, such as NPD productivity.
6.4.9. Communication This area is closely connected with “6.4.8. Alignment” which is about making everyone in the process working towards the same goal. The alignment needs to be communicated in a good way to reach out and make everyone concerned and involved.
When talking about communication in LPD, tools for visual communication is a recurrent theme. Different kinds of tools exist but the
34 Measures the on-time rate for the in each category.
123
most common is A3 reports that are used for different reasons to communicate only the most relevant information in a simple visual format so anyone can understand it. Another important part for communication and for integrating the functions within the organization is the chief engineer who should be the one communicating the customer need to the people in the process.
Communication is also very important for learning. Documenting learnings is completely unnecessary if no one can use the documentation to improve either the process or him or herself.
6.4.10. Organizational learning Learning from each project to become better and better is essential for the continuous improvement which is the core of the lean philosophy. As the process is repeated for every project there is a lot of room for continuous improvement at Oriflame. One problem seems to be lack of time for documenting and reviewing old projects. Today they rely on that their employees’ competence is high which means that the knowledge leaves the office on Friday afternoon and come back on Monday morning. A few attempts to learn from past projects have been made; post launch reviews and workshops are examples on this. However, this has only been done to a small extent.
The spirit at Oriflame is entrepreneurial which makes it harder to follow processes and to look back and review what has been done. This applies especially for marketing.
6.4.11. Variations in work-load When there are variations in work-load, it means that the employees sometimes
have too much to do sometimes and sometimes too little; a variation exists.
Variations in work-load are common at Oriflame because of that many of the
projects are linked to the same catalogue and launch date. The variation can be
linked to other issues within the process as standardization of competence and the
lack of technology. The belief that competence standardization is hard, because of
category specific knowledge, has been expressed as well as that Oriflame’s product
portfolio, with many low innovation products, is ideal for this kind of competence
standardization. The lack of technology has a negative effect on the work-load
because of the many hours that need to be spent on non-value adding and time
consuming administrative work.
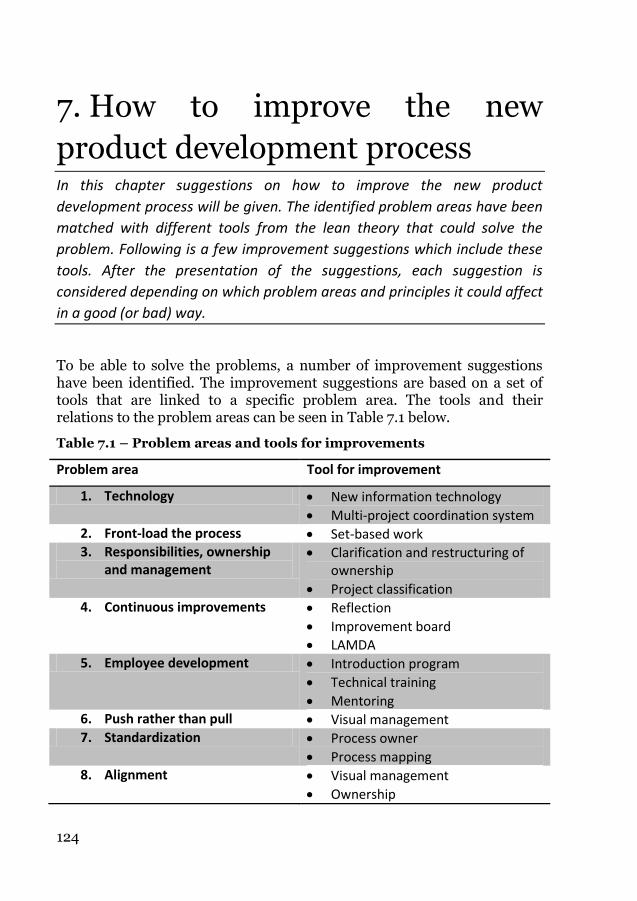
124
7. How to improve the new
product development process In this chapter suggestions on how to improve the new product
development process will be given. The identified problem areas have been
matched with different tools from the lean theory that could solve the
problem. Following is a few improvement suggestions which include these
tools. After the presentation of the suggestions, each suggestion is
considered depending on which problem areas and principles it could affect
in a good (or bad) way.
To be able to solve the problems, a number of improvement suggestions have been identified. The improvement suggestions are based on a set of tools that are linked to a specific problem area. The tools and their relations to the problem areas can be seen in Table 7.1 below.
Table 7.1 – Problem areas and tools for improvements
Problem area Tool for improvement
1. Technology New information technology
Multi-project coordination system 2. Front-load the process Set-based work 3. Responsibilities, ownership
and management Clarification and restructuring of
ownership
Project classification 4. Continuous improvements Reflection
Improvement board
LAMDA 5. Employee development Introduction program
Technical training
Mentoring 6. Push rather than pull Visual management 7. Standardization Process owner
Process mapping 8. Alignment Visual management
Ownership
125
9. Communication Visual management
Ownership 10. Organizational learning Knowledge database
A3 11. Variations in work-load Visual management
Competence groups
Following is an explanation of each improvement suggestion, and how Oriflame should use it in its NPD process.
7.1.1. LAMDA
The LAMDA model is used to find more efficient ways of developing products. It should work as the foundation of learning and improvements at Oriflame.
When someone discovers a problem they use LAMDA to ensure a good way of taking care of this problem. The model makes sure that the analysis of the problem goes down to the source of the problem and that all necessary knowledge is collected before any decisions are made.
For Oriflame this could mean that problems are solved at the root cause not creating problems down-stream. It is also a good way to create a decision support for e.g. the project leader.
7.1.2. Management and ownership
The literature implies that it is important to have one process owner with a complete responsibility for the whole process. Our suggestion is to have one process owner, e.g. one of the process managers, which should own the complete NPD process. The benefit is that one person would have the authority to develop the process and to create targets and goals for the process in a whole, which would speed up the decision-making and align the process cross-category. The process owner should work as a facilitator of continuous improvements and make sure that an improvement in the process reaches all categories.
It is possible to divide process owner’s responsibilities by dividing the process into parts. This would however most probably create sub-optimization by the new silos that will evolve from the processes parts. As the NPD process and the innovation process are two parts already, it would be possible is to keep it that way with closely working process owners for each process. However that solution is not recommended by the authors as it will most likely be sub-optimal. If a process owner’s work would be too
126
extensive there is another way to divide the responsibility by dividing the tasks into strategic, tactic and operation levels. The process owner should always be responsible for the strategic level; the other levels could be delegated.
The authors would like to emphasize that the process owner’s operational work is not project management. Instead it is to map, analyze and reconstruct the process. Another part of the operational work is to make sure that the changes really get implemented and to maintain the continuous improvements.
When regarding projects and taking them through the process, the process theory refers to a team leader to do this. This person takes the role as the one creating the team and along with the project contributing to both individual and collective competence development. In the theory of lean product development there is the role of a chief engineer that is quite similar to the team leader. The chief engineer is a little more specified as the voice of the customer working to integrate all functions of the organization into the development and making them work in the same direction to satisfy the customer needs. The most important, though, is that the chief engineer has complete responsibility and an authority to make decision throughout the process. The chief engineer has to have competence from each part of the process to make these decisions, still more advanced questions should of course be solved with the help from the staff in the projects who has the deep technical skills. The authors have chosen to call this role ‘project leader’ and suggest Oriflame to implement this role to clarify the ownership of a project.
As Oriflame has over 400 NPD projects each year it would be impossible to have a chief engineer for each project. Therefore the authors promote a separation of projects on the basis of innovation level and together with super launches. In the figure below an example of how a separation could look can be seen. The highest innovation level for Oriflames NPD projects is Tooling-projects. These projects add up to 40 projects in a year which is a manageable amount. Projects on a lower innovation level could be defined as initiatives35 and demands less management and control. The innovation levels within formulation are not considered by the authors as the knowledge in this area is limited.
35 Example from Deloitte Consulting internal material
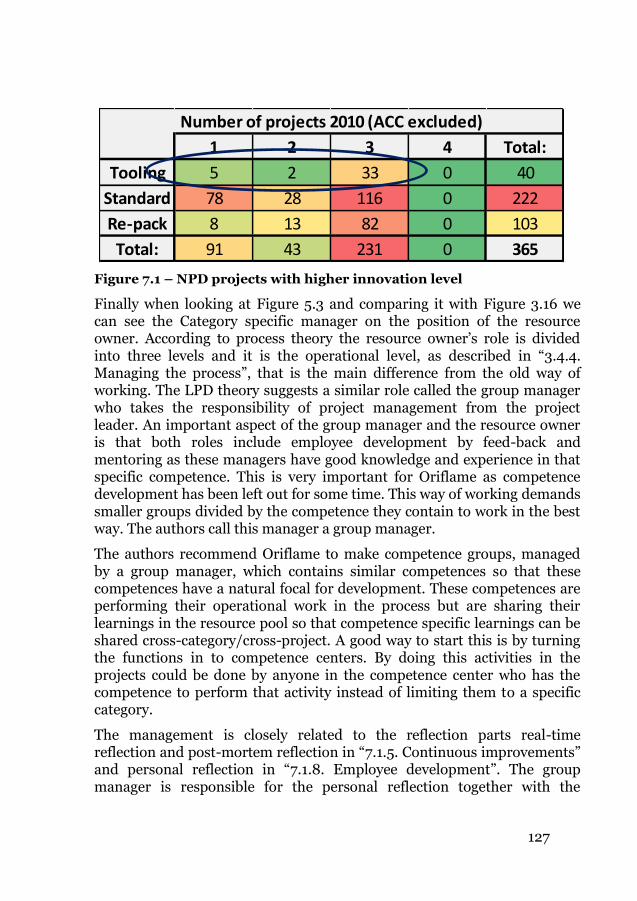
127
1 2 3 4 Total:
Tooling 5 2 33 0 40
Standard 78 28 116 0 222
Re-pack 8 13 82 0 103
Total: 91 43 231 0 365
Number of projects 2010 (ACC excluded)
Figure 7.1 – NPD projects with higher innovation level
Finally when looking at Figure 5.3 and comparing it with Figure 3.16 we can see the Category specific manager on the position of the resource owner. According to process theory the resource owner’s role is divided into three levels and it is the operational level, as described in “3.4.4. Managing the process”, that is the main difference from the old way of working. The LPD theory suggests a similar role called the group manager who takes the responsibility of project management from the project leader. An important aspect of the group manager and the resource owner is that both roles include employee development by feed-back and mentoring as these managers have good knowledge and experience in that specific competence. This is very important for Oriflame as competence development has been left out for some time. This way of working demands smaller groups divided by the competence they contain to work in the best way. The authors call this manager a group manager.
The authors recommend Oriflame to make competence groups, managed by a group manager, which contains similar competences so that these competences have a natural focal for development. These competences are performing their operational work in the process but are sharing their learnings in the resource pool so that competence specific learnings can be shared cross-category/cross-project. A good way to start this is by turning the functions in to competence centers. By doing this activities in the projects could be done by anyone in the competence center who has the competence to perform that activity instead of limiting them to a specific category.
The management is closely related to the reflection parts real-time reflection and post-mortem reflection in “7.1.5. Continuous improvements” and personal reflection in “7.1.8. Employee development”. The group manager is responsible for the personal reflection together with the
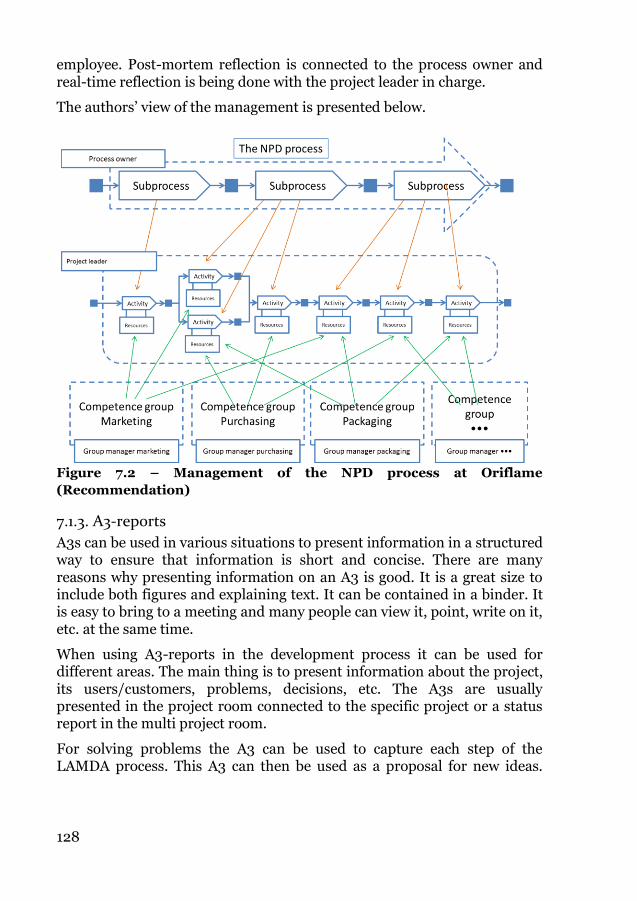
128
employee. Post-mortem reflection is connected to the process owner and real-time reflection is being done with the project leader in charge.
The authors’ view of the management is presented below.
Figure 7.2 – Management of the NPD process at Oriflame
(Recommendation)
7.1.3. A3-reports
A3s can be used in various situations to present information in a structured way to ensure that information is short and concise. There are many reasons why presenting information on an A3 is good. It is a great size to include both figures and explaining text. It can be contained in a binder. It is easy to bring to a meeting and many people can view it, point, write on it, etc. at the same time.
When using A3-reports in the development process it can be used for different areas. The main thing is to present information about the project, its users/customers, problems, decisions, etc. The A3s are usually presented in the project room connected to the specific project or a status report in the multi project room.
For solving problems the A3 can be used to capture each step of the LAMDA process. This A3 can then be used as a proposal for new ideas.
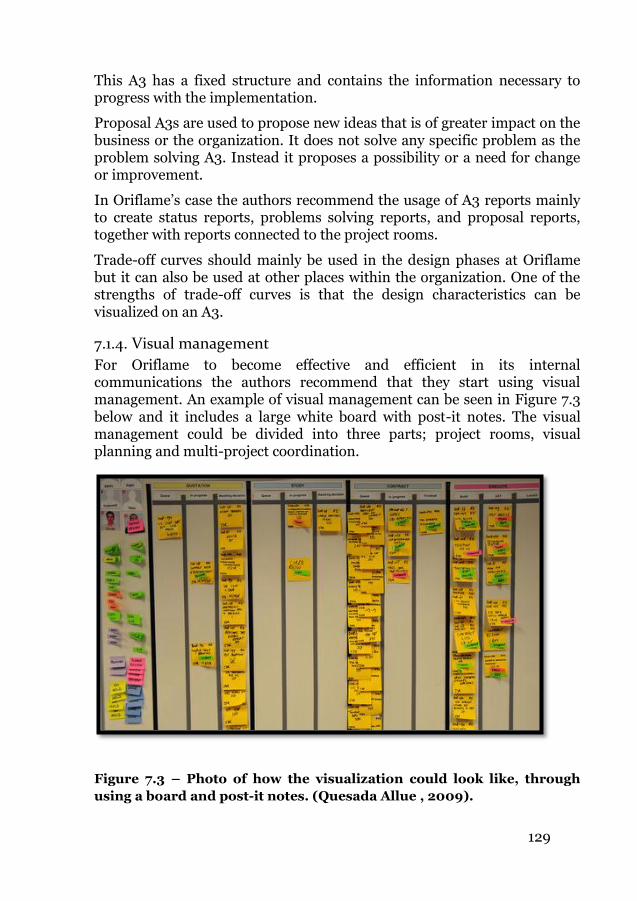
129
This A3 has a fixed structure and contains the information necessary to progress with the implementation.
Proposal A3s are used to propose new ideas that is of greater impact on the business or the organization. It does not solve any specific problem as the problem solving A3. Instead it proposes a possibility or a need for change or improvement.
In Oriflame’s case the authors recommend the usage of A3 reports mainly to create status reports, problems solving reports, and proposal reports, together with reports connected to the project rooms.
Trade-off curves should mainly be used in the design phases at Oriflame but it can also be used at other places within the organization. One of the strengths of trade-off curves is that the design characteristics can be visualized on an A3.
7.1.4. Visual management
For Oriflame to become effective and efficient in its internal communications the authors recommend that they start using visual management. An example of visual management can be seen in Figure 7.3 below and it includes a large white board with post-it notes. The visual management could be divided into three parts; project rooms, visual planning and multi-project coordination.
Figure 7.3 – Photo of how the visualization could look like, through
using a board and post-it notes. (Quesada Allue , 2009).
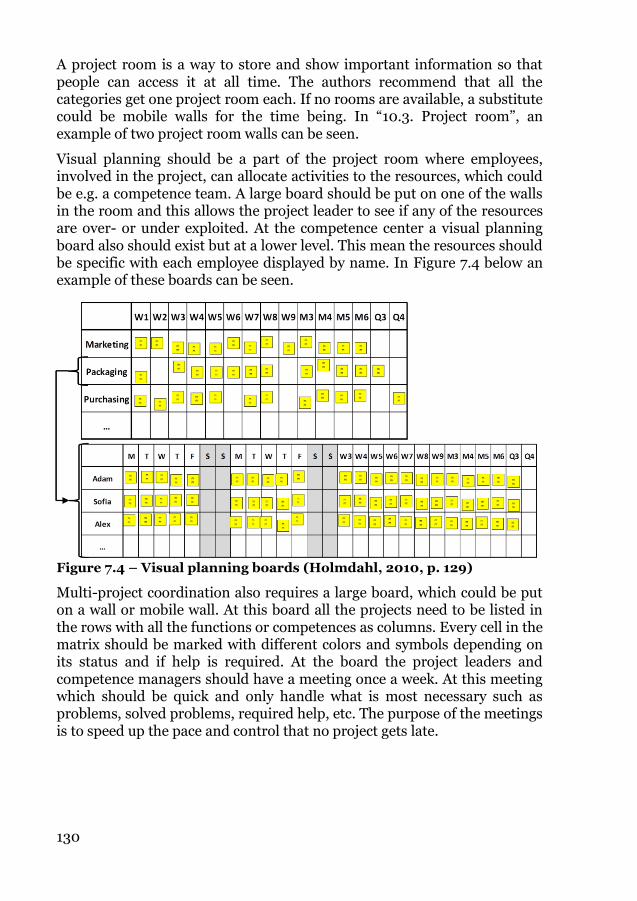
130
A project room is a way to store and show important information so that people can access it at all time. The authors recommend that all the categories get one project room each. If no rooms are available, a substitute could be mobile walls for the time being. In “10.3. Project room”, an example of two project room walls can be seen.
Visual planning should be a part of the project room where employees, involved in the project, can allocate activities to the resources, which could be e.g. a competence team. A large board should be put on one of the walls in the room and this allows the project leader to see if any of the resources are over- or under exploited. At the competence center a visual planning board also should exist but at a lower level. This mean the resources should be specific with each employee displayed by name. In Figure 7.4 below an example of these boards can be seen.
Figure 7.4 – Visual planning boards (Holmdahl, 2010, p. 129)
Multi-project coordination also requires a large board, which could be put on a wall or mobile wall. At this board all the projects need to be listed in the rows with all the functions or competences as columns. Every cell in the matrix should be marked with different colors and symbols depending on its status and if help is required. At the board the project leaders and competence managers should have a meeting once a week. At this meeting which should be quick and only handle what is most necessary such as problems, solved problems, required help, etc. The purpose of the meetings is to speed up the pace and control that no project gets late.
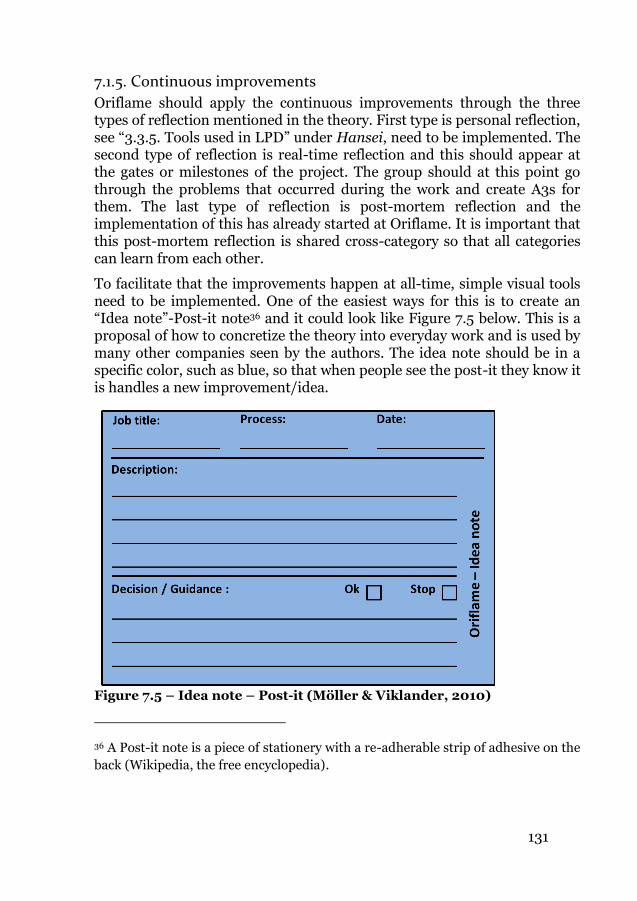
131
7.1.5. Continuous improvements
Oriflame should apply the continuous improvements through the three types of reflection mentioned in the theory. First type is personal reflection, see “3.3.5. Tools used in LPD” under Hansei, need to be implemented. The second type of reflection is real-time reflection and this should appear at the gates or milestones of the project. The group should at this point go through the problems that occurred during the work and create A3s for them. The last type of reflection is post-mortem reflection and the implementation of this has already started at Oriflame. It is important that this post-mortem reflection is shared cross-category so that all categories can learn from each other.
To facilitate that the improvements happen at all-time, simple visual tools need to be implemented. One of the easiest ways for this is to create an “Idea note”-Post-it note36 and it could look like Figure 7.5 below. This is a proposal of how to concretize the theory into everyday work and is used by many other companies seen by the authors. The idea note should be in a specific color, such as blue, so that when people see the post-it they know it is handles a new improvement/idea.
Figure 7.5 – Idea note – Post-it (Möller & Viklander, 2010)
36 A Post-it note is a piece of stationery with a re-adherable strip of adhesive on the
back (Wikipedia, the free encyclopedia).
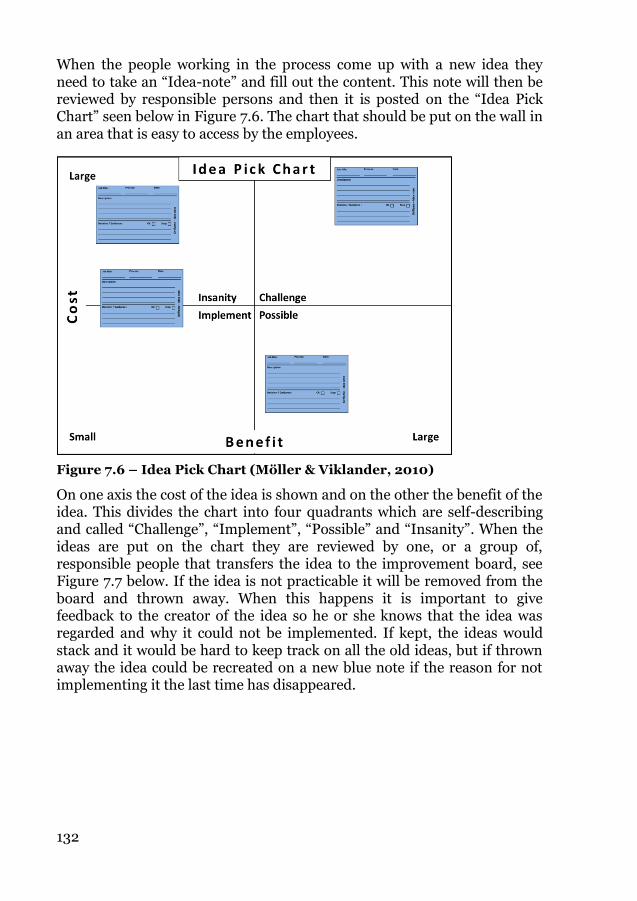
132
When the people working in the process come up with a new idea they need to take an “Idea-note” and fill out the content. This note will then be reviewed by responsible persons and then it is posted on the “Idea Pick Chart” seen below in Figure 7.6. The chart that should be put on the wall in an area that is easy to access by the employees.
Figure 7.6 – Idea Pick Chart (Möller & Viklander, 2010)
On one axis the cost of the idea is shown and on the other the benefit of the idea. This divides the chart into four quadrants which are self-describing and called “Challenge”, “Implement”, “Possible” and “Insanity”. When the ideas are put on the chart they are reviewed by one, or a group of, responsible people that transfers the idea to the improvement board, see Figure 7.7 below. If the idea is not practicable it will be removed from the board and thrown away. When this happens it is important to give feedback to the creator of the idea so he or she knows that the idea was regarded and why it could not be implemented. If kept, the ideas would stack and it would be hard to keep track on all the old ideas, but if thrown away the idea could be recreated on a new blue note if the reason for not implementing it the last time has disappeared.
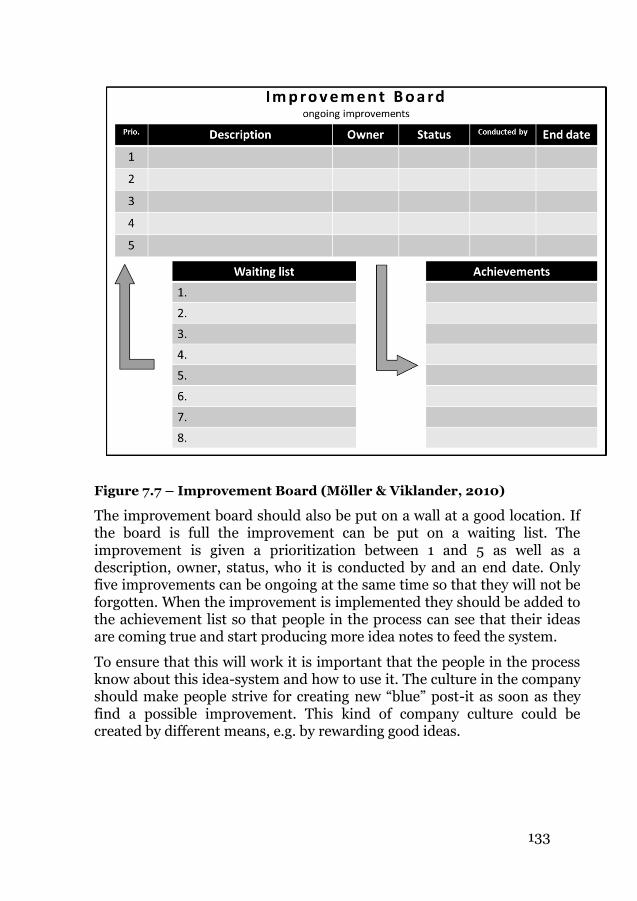
133
Figure 7.7 – Improvement Board (Möller & Viklander, 2010)
The improvement board should also be put on a wall at a good location. If the board is full the improvement can be put on a waiting list. The improvement is given a prioritization between 1 and 5 as well as a description, owner, status, who it is conducted by and an end date. Only five improvements can be ongoing at the same time so that they will not be forgotten. When the improvement is implemented they should be added to the achievement list so that people in the process can see that their ideas are coming true and start producing more idea notes to feed the system.
To ensure that this will work it is important that the people in the process know about this idea-system and how to use it. The culture in the company should make people strive for creating new “blue” post-it as soon as they find a possible improvement. This kind of company culture could be created by different means, e.g. by rewarding good ideas.
134
7.1.6. Knowledge database
The knowledge database is used to collect and distribute knowledge in the organization. This knowledge is used and maintained by the users and should be updated continuously. It should contain process maps with sub-processes and activities described, organization charts, and routines. It should also contain more specific information like feasible designs, concept briefs, check sheets, etc. (see chapter 3 and 4).
The authors recommend one way to build a knowledge database which is easy and cheap to implement but still very powerful as it is simple enough to be used by anyone. The recommendation is a local wiki37-site that is open for anyone at the company to view and edit.
This wiki should be structured around different main areas such as categories, projects/initiatives, solutions within different areas (e.g. packaging or design), improvements, etc. Each area should is connected to each other through relations such as for a project, the specific design solutions could be presented and by clicking on these, information about earlier projects that used that design is presented.
The wiki should act as the foundation of the knowledge gain illustrated in Figure 3.14. This means that every new product development that starts has more background knowledge then the previous.
7.1.7. Standardization
A very important part of lean and LPD is standardization. It is the foundation for a number of things which cannot be achieved without it. The authors have divided standardization at Oriflame into four different areas:
By standardizing the process and its activities the resources needed
to complete each activity are known which makes it easier to level
work-load by planning. This also facilitates the standardization of
skill-sets which gives flexibility in staffing and program planning.
By standardizing competences, resources can more easily be shared
and work within different part of the organization. This is also a
way to level work-load as resources can be allocated where the need
is the greatest.
37 A wiki is a searchable website that allows easy creation and editing of any
number of interlinked web pages via a web browser.
135
By standardizing and structure reports such as the concept brief,
status reports, proposals, and such, the report will always look the
same and contain the same data. Reports will be easy to
understand, quick to read, and no information should be left out
accidently or on purpose.
Standardizing a meeting will make it efficient. Everyone will know
what is meant to be handled and no-one will be on the meeting
unnecessarily.
By mapping the lowest level activities in the process, they will be registered and explained, creating higher-level flexibility. This is also the beginning for standardization and continuous improvements of the process. It is up to the process owner to make sure this is done, but the actual mapping could be delegated. Another good outcome by doing this is that labor hour requirements can be predicted at every point in the process which makes it easier to predict fluctuations in the resource demand.
Competence standardization can be achieved by using the same tools and skill-sets within the competence areas. The authors propose that people that are working with similar tasks (both within and cross-category) get together and decide how to work and build skill-sets. Another proposal is to implement tools and systems that are usable in every category. By doing this workers could more easily do the same tasks in another category. If category-specific knowledge is needed to complete the task it can be gained by asking more experienced people in that area, the procedure would still be the same.
Every report or hand-over that should be read by one or many other parts should be more or less standardized. This is to ensure that it contains the necessary information, is easily read and received, and that it is addressed to the correct receiver. For some reports this could be done by using A3 reports. In other cases it has to be decided mutually by the people involved in the creation and the usage of the reports. This could reduce over-creation, reduce misdirection and increase quality of the information.
Often meetings are attended by too many people, where many of them do not get anything out of it. It is also common that discussion gets too deep into a specific field where only a few people are involved, leaving out the rest of the meeting. To avoid this it is important to standardize recurring meetings. By doing this it is pre-decided who is to attend and what is to be regarded in that meeting. No one will feel left out as it is rigorously determined who has to attend. Only information that needs to be discussed
136
by most of the participants is reviewed and other discussions are taken outside of the meeting.
7.1.8. Employee development
Employee development should consist of start-up program, technical training and mentoring for the employees. When new employees start at Oriflame it is important to communicate the Oriflame culture right from the start. They employee should attend presentations of the company and the different functions, go out and see at least one production site and also meet the sales consultants and typical users of the Oriflame products.
Technical training should be within the employees’ specific field at the different functions or competence groups. The aim of this training aim is to let the employee grow deep technical expertise. The training could be outside Oriflame, attending courses, or that the employee go and see the problems that occur as a result of their work e.g. at the production sites.
The group manager, see “7.1.2. Management and ownership”, should work as the mentor for all people that are part of the group. The mentoring meetings should be personal and personal reflection, see “3.3.5. Tools used in LPD” under Hansei, should be supervised by the mentor. The mentor should also lay out a career plan for the employee so he or she has clear goals and can grow within Oriflame. This would make the competence and experiences grow and also get the employee too stay longer at Oriflame.
7.1.9. Technical solutions
The theory behind LPD encourages the use of technical solutions as long as they are adapted to fit with the process and the people as principle number 13 suggests. As this thesis does not handle technical solutions in detail this suggestion will only be an indication to further research in the area. However, the authors suggest one tool that is in alignment with lean and would benefit Oriflame both in project management, leveling of resources and lead time.
It is obvious that the technical tools used at Oriflame lacks in update. The company has grown in a rapid pace and the tools that exist have not been updated. The tool to keep track of every project used today is a tracker connected to each category and function-specific trackers. These trackers are managed through Excel and demand a lot of manual inputs and work. Besides the other suggestions about multi-project management through visualization, technical tools can be used on a higher level to plan resource demand and prioritization in advance.
The authors recommend a tool for critical chain project management, CCPM. Oriflame has a lot of projects and resources and their work requires
137
a lot of multi-tasking. By performing tasks as late as possible and the most critical tasks first; multi-tasking and lead time could be reduced for all projects. CCPM is a method for planning and managing multiple projects with focus on the resources needed to perform tasks. It differs from the critical path method where the resources are unlimited. Therefore critical chain is dependent on both the precedence- and resource-dependent elements that control the projects.
Besides CCPM there exist a lot of tools, systems and technologies that possibly could enhance the performance at Oriflame. No deeper research has been conducted but the authors consider that every tool that enhances performance, as long as it is adapted to the process and the people, could be a good aid for the company.
7.1.10. Set-based work
The authors recommend Oriflame to work set-based when it comes to design of new products. The process should be more front-loaded, both when it comes to time spent and alternatives regarded, which means that more work is done in the beginning of the process to avoid loop-backs and fire-fighting. To achieve this, the set-based methods can be used and as presented in the theory it consists of three principles which are to map the design space, integrate by intersection and establish feasibility before commitment.
Map the design space should start with the different functions trying to find solutions from their own perspective; the functions do not have to communicate with each other at this stage. This will generate a feasible region for the design that will have multiple alternatives.
Integrate by intersection is where the alternatives from the different functions unite where they correspond. Trade-off curves (see “3.3.5. Tools used in LPD” under Trade-off curves) should be used to weight different characteristics. The interaction between the different alternatives will create a number of working, but not optimal product concepts.
Establish feasibility before commitment means that the number of concepts is reduced gradually with the increasing detail of specification. The concepts that are left will therefore nearly guarantee an optimal system solution.
The set-based approach to product development will reduce the risk that are increasing with the innovation level (Holmdahl, 2010, p. 149).Because of the low innovation level in Oriflame’s products this might not be of the highest value. However, the authors can still see benefits with the set-based
138
method, especially in the projects with high innovation level and risk such as super launches or those who require “Tooling”.
It is also important to explore the financial side of all the different concepts; this means that it is crucial that the concept has an attached business case. Business case is not only important for the specific project but it can also be stored in the knowledge database and give knowledge and measurement points to later projects and the company progress.
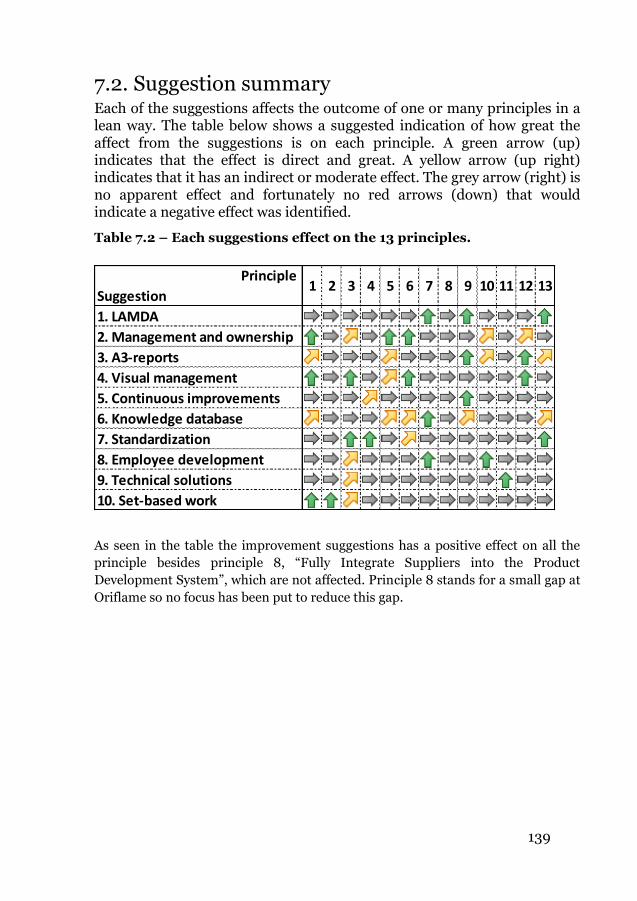
139
7.2. Suggestion summary Each of the suggestions affects the outcome of one or many principles in a lean way. The table below shows a suggested indication of how great the affect from the suggestions is on each principle. A green arrow (up) indicates that the effect is direct and great. A yellow arrow (up right) indicates that it has an indirect or moderate effect. The grey arrow (right) is no apparent effect and fortunately no red arrows (down) that would indicate a negative effect was identified.
Table 7.2 – Each suggestions effect on the 13 principles.
As seen in the table the improvement suggestions has a positive effect on all the
principle besides principle 8, “Fully Integrate Suppliers into the Product
Development System”, which are not affected. Principle 8 stands for a small gap at
Oriflame so no focus has been put to reduce this gap.
Principle
Suggestion1 2 3 4 5 6 7 8 9 10 11 12 13
1. LAMDA
2. Management and ownership
3. A3-reports
4. Visual management
5. Continuous improvements
6. Knowledge database
7. Standardization
8. Employee development
9. Technical solutions
10. Set-based work
140
8. Conclusions and
recommendations In this chapter conclusions that were drawn throughout the thesis are
presented together with recommendations and solution prioritization for
Oriflame. Finally recommendations for further studies are presented.
8.1. Improvement prioritization To be able to prioritize between the suggestions for improvements each one has been visualized in the chart below. The chart has cost on the vertical axis and benefit on the horizontal axis. The cost is approximated by the authors and represents the cost of resources needed, such as time, people and money, to implement the improvement suggestion. The approximated cost is relative to the other improvement suggestions. The benefit is also approximated by the authors and represents how beneficial the improvement would be to Oriflame. The chart can be seen in Figure 8.1 on the next page.
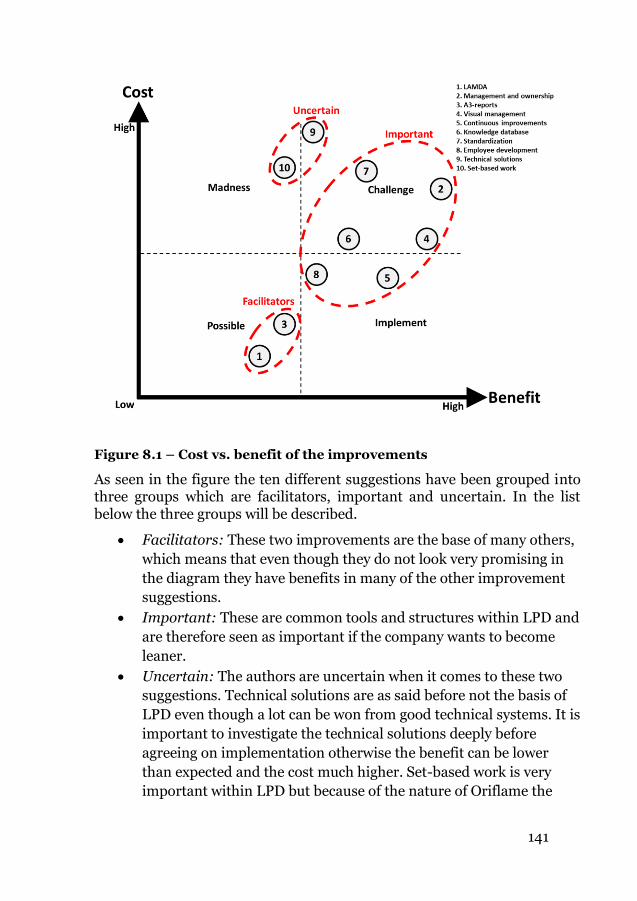
141
Figure 8.1 – Cost vs. benefit of the improvements
As seen in the figure the ten different suggestions have been grouped into three groups which are facilitators, important and uncertain. In the list below the three groups will be described.
Facilitators: These two improvements are the base of many others,
which means that even though they do not look very promising in
the diagram they have benefits in many of the other improvement
suggestions.
Important: These are common tools and structures within LPD and
are therefore seen as important if the company wants to become
leaner.
Uncertain: The authors are uncertain when it comes to these two
suggestions. Technical solutions are as said before not the basis of
LPD even though a lot can be won from good technical systems. It is
important to investigate the technical solutions deeply before
agreeing on implementation otherwise the benefit can be lower
than expected and the cost much higher. Set-based work is very
important within LPD but because of the nature of Oriflame the
142
authors are uncertain on the cost and benefit of implementing this
suggestion, further investigation is needed.
8.2. Recommendations to Oriflame Some of the improvements are larger and need more implementation resources than the others. To make the change happen it is important to know how the change will affect the people, processes and tools.
Karlsson and Åhlström, see “3.3.8. Implementation of lean product development”, describe two aspects that are important to look at when implementing LPD. The first one is to establish an awareness of the entire concept and the need for change. This would mean that the people at Oriflame will need education in the lean concept and especially the Oriflame view of lean and LPD. To establish the need of change Kotter’s eight steps can be used, see Successful process change in “3.4.7. Process change”. The second aspect is the ensuring of a concurrent process. This means that all parts of Oriflame have to work in a consistent way toward a common goal. The management of Oriflame has the crucial role of getting values, structures, systems and processes to correspond so that the change will not come to a standstill. It is also necessary to see the implementation of lean product development as the beginning of the journey of continuous improvements. Different types of process change have been discussed in the theory, see “3.4.7. Process change”, such as BPR, CQI and BPB. The authors recognize that CQI would be the approach that is most fitted for Oriflame, this is due to less risk and that the tools do not have to be implemented at the same time. The authors also recommend Oriflame to use BPB which could be easiest achieved through joining the Swedish LPD network38 where companies that have started the LPD journey can share their insights.
The final recommendations on implementation are to start with the easiest areas which still give a great benefit; such as the improvement board for continuous improvements and the employee development to create a momentum for change. After this is done, the facilitators in Figure 8.1, LAMDA and A3, can be implemented. Following each suggestion in the ‘important’-circle of the figure should be considered. “Going” upwards to the right in the ‘challenge’-quadrant ensures that both benefit and cost
38 Run by Sverea IVF, see
http://www.swerea.se/sv/ivf/Kunskapsomraden/Produktutveckling/Lean-produktutveckling/
143
grows as the work is going further. The authors recommend that further investigation into technical solutions for managing and controlling the NPD process, such as a CCPM-tool. However, this should not be done ahead of getting the process and its management more lean as that could create problems in the implementation and hinder the chances of becoming lean.
8.3. Conclusions of the master thesis The gap-analysis in this thesis shows us that the median “as is”-value for each principle for Oriflame’s NPD process is rather low and a gap up to a wanted “to be”-level is present at every principle. This means that today’s process is not lean. It also means that there is room for improvements as the process managers indicate that Oriflame as a company wants to achieve a higher level of “leanness”. The authors recognize that the change needed for Oriflame to achieve a greater level does not have to be that big. However, it is about implementing small improvements over time and to keep the momentum high when doing this.
LPD would fit Oriflame in many ways because of the high degree of repetition in the process. One of the hardest obstacles to overcome for Oriflame will be to get the people to understand the benefit of standardization and process thinking. The change is dependent on culture! The entrepreneurial culture within Oriflame does not fit well with the lean concept according to the authors and their perception. However, the authors are convinced that it is possible to have standardized processes and activities while keeping the creative sense of product development. Much of the products at Oriflame are pushed from the head-quarter out to the regions. Oriflame needs to find a way of facilitating market/region pull so that the focus is put on the user of the products. This means that a need in the regions facilitates a generation of a lot of concepts that fills that need.
Procter & Gamble is seen as a FMCG best practice in some literature and they use a stage and gate process that looks much as the Oriflame one. The authors’ point of view is that best practices like this should not be copied as they are limiting the creativeness when developing an own process. Also processes are very company specific as they are defined by internal structures and resources and can therefore not be copied right off. A company should develop and refine their processes so that they fit and adapt to the companies conditions. The stage and gate process implemented at Oriflame today does not have the authority as it should have; the gates are more like milestones where no real decision needs to be taken. The authors do not see the Procter & Gamble model as the next practice for Oriflame as that model does not have the potential of the newer
144
LPD paradigm. LPD is a new way of looking at NPD and many of the basic tools and models are more effective and efficient due to the nature of people and communication. Companies often search for new advanced and complex ways of managing and controlling when LPD works the other way around and do this by simplifying and visualizing the process.
8.4. Suggestions for further investigation The focus in this master thesis has been to evaluate the NPD process at Oriflame from a lean perspective. This evaluation has been done based on the 13 principles of LPD and further on areas of improvements and suggestions for improvements have been given. The area of implementation has only been touched upon briefly and further investigation of how to perform the real implementation is needed.
The need of new technical solutions has been identified even though no focus has been put on any specific solution. The need of multi project coordination through e.g. CCPM, has been suggested. An investigation has to be done to find out if this is a real need and if a benefit will motivate the cost.
No mapping of the process has been done but the authors recommend Oriflame to
do this. This mapping can be done through two different ways, either process
mapping or value stream mapping. A further investigation has to be done to find
out which one of these two methods that fits Oriflame best.
145
9. List of references Bjerke, B., & Arbnor, I. (1994). Företagsekonomisk metodlära (2 ed.). Lund:
Studentlitteratur.
Björklund, M., & Paulsson, U. (2003). Seminarieboken - att skriva, presentera och
opponera. Lund: Studentlitteratur.
Björklund, M., Gibe, J., Kalling, T., & Setterberg, S. (2007). The success and failure
of new product development – A study with focus on the early phases.
Lund: Institute of Economic Research at Lund University, Chalmers
University of Technology.
BusinessDictionary.com. (2010). Structural Capital definition. Retrieved October
7, 2010, from BusinessDictionary.com:
http://www.businessdictionary.com/definition/structural-capital.html
Camp, R. C. (1995). Business process benchmarking: finding and implementing
best practices. Milwaukee, Wis., USA: ASQC Quality Press.
Cooper, R. G. (1998). Product leadership : creating and launching superior new
products. Reading, Mass., USA: Perseus.
Cooper, R. G., & Edgett, S. J. (2005). New Product Development: Lean, Rapid and
Profitable. Canada: First Printing.
Cooper, R. G., & Mills, M. S. (2005). Succeeding at New Products the P&G Way:
Work the Innovation Diamond. Working paper no. 21. Ancaster, Ontario,
Canada: Product development institute inc.
Dooley, K., & Johnson, D. (2001). Changing the New Product Development
Process: Reengineering or Continuous Quality Improvement? Measuring
Business Excellence, 5(4), pp. 32-38.
Eriksson, L. T., & Wiedersheim-Paul, F. (2006). Att utreda forska och rapportera (8
ed.). Liber.
146
Fenger-Krog, A. (2010, September 13). Introduction meeting for Master Thesis. (J.
Viklander, & D. Möller, Interviewers) Stockholm, Sweden.
Hammer, M. (2007). The process audit. Harvard Business Review, 85(4), pp. 111-
124.
Henning, J. (2009, May 26). Common Rating Scales to Use when Writing
Questions. Retrieved October 27, 2010, from Voice of Vovici Blog:
http://blog.vovici.com/blog/bid/18261/Common-Rating-Scales-to-Use-
when-Writing-Questions
Holmdahl, L. (2010). Lean Product Development På Svenska (1.1 ed.). Göteborg:
www.larsholmdahl.com.
Höst, M., Regnell, B., & Runeson, P. (2006). Att genomföra examensarbete. Lund:
Studentlitteratur.
Industrial and Financial Systems, I. (2010). IFS Applications, affärssystem för
hantering av service och underhåll, tillverkning, projekt och logistik.
Retrieved December 15, 2010, from IFS Applications – affärssystem för
flexibla företag: http://www.ifsworld.com/sv-SE/Solutions
Iowa State University. (2010). CQI. Retrieved October 1, 2010, from IOWA state
university, Facilities planning and management:
http://www.fpm.iastate.edu/worldclass/cqi.asp
Kahn, K. B., Barczak, G., & Moss, R. (2006). PERSPECTIVE: Establishing an NPD
Best Practices Framework. Journal of Product Innovation Management,
23(2), pp. 106-116.
Karlsson, C., & Åhlström, P. (1996). The difficult path to lean product
development. Journal of Product Innovation Management, 13(4), 283-
295.
Kennedy, M., Harmon, K., & Minnock, E. (2008). Reday, Set, Dominate:
Implementing Toyota's Set-Based Learning. Virginia: The Oaklea Press.
Kotter, J. P. (1998). Winning at change. Leader to leader, 10, pp. 27-34.
147
Lancaster, G., & Whitey, F. (2007). The official CIM coursebook: Marketing
fundamentals (1 ed.). Burlington, MA, USA: Elsevier.
Lerenius, J. (2010, October 18). Introduction to NPD Process. (D. Möller, & J.
Viklander, Interviewers) Stockholm, Sweden.
Lerenius, J., Andersson, K., Tran, P., Donaldson, E., Artunduaga, C., & Molin, L.
(2010). Interviews with process manager for the NPD process at Oriflame.
(D. Möller, & J. Viklander, Interviewers)
Liker, J. K. (2003). Toyota Way. McGraw-Hill Professional Publishing.
Liker, J. K., & Morgan, J. M. (2006a). The Toyota Product Development System:
Integrating People, Process and Technology. New York, USA: Productivity
Press.
Liker, J. K., & Morgan, J. M. (2006b, May). The Toyota Way in Services: The Case
of Lean Product Development. Academy of Management Perspectives,
20(2), pp. 5-21.
Ljungberg, A., & Larsson, E. (2001). Processbaserad verksamhetsutveckling. Lund,
Skåne, Sweden: Studentlitteratur.
Loch, C. (2000). Tailoring product development to strategy: case of a European
technology manufacturer. European Management Journal, 18(3), pp.
246-258.
Maffin, D., Thwaites, A., & Alderman, N. (1997). Managing the Product
Development Process: Combining Best Practice with Company and
Projects Contexts. Technology Analysis & Strategic Management, 9(1),
pp. 53-75.
Majumdar, R. (2008). Product Management in India (3rd ed.). Prentice hall of
india.
Millard, R. L. (2001). Value Stream Analysis and Mapping for Product
Development. Institute of Technology. Massachusetts: Massachusetts
Institute of Technology.
148
Monczka, R. M., Handfield, R. B., Scannell, T. V., Ragatz, G. L., & Frayer, D. J.
(2000). New Product Development : Strategies for supplier integration.
Milwaukee, Wis.: ASQ Quality Press.
Morgan, J. (2002, February 01). SAE International. Retrieved September 30, 2010,
from SAE in Manufacturing: Applying Lean Principles to Product
Development:
http://www.sae.org/manufacturing/lean/column/leanfeb02.htm
Ohno, T. (1988). Toyota Production System: Beyond Large-Scale Production.
Cambridge: Productivity Press.
Oosterwal, D. P. (2010). The lean machine : how Harley-Davidson drove top-line
growth and profitability with revolutionary lean product development.
New York: American Management Association.
Oppenheim, B. W. (2004). Lean product development flow. Systems Engineering,
7(4).
Oriflame Cosmetics. (2010). Oriflame Cosmetics: About Direct Selling. Retrieved
October 05, 2010, from Oriflame Cosmetics:
http://www.oriflame.com/Business_Opportunity/Direct-Selling-in-
Oriflame/
Oriflame Cosmetics. (2010). Oriflame Cosmetics: Fact Sheet. Retrieved October 5,
2010, from Oriflame Cosmetics:
http://www.oriflame.com/Global/Fact%20Sheet/Fact_Sheet2010.pdf
Oriflame Cosmetics. (2010). Oriflame Cosmetics: Oriflame in brief. Retrieved
October 5, 2010, from Oriflame Cosmetics:
http://www.oriflame.com/About_Oriflame/About-Oriflame/
Oriflame Cosmetics. (2010). Oriflame Cosmetics: Our markets. Retrieved October
5, 2010, from Oriflame Cosmetics:
http://www.oriflame.com/About_Oriflame/About-Oriflame/Our-
markets/
149
Ottosson, S., Björk, E., Holmdahl, L., & Vajna, S. (2006). Research approaches on
product development processes. Design 2006. Dubrovnik: 9th
International Design Conferences.
Product Development Institute Inc. (2010). Innovation Diamond Framework -
What is it? Retrieved October 6, 2010, from Product Development
Institute: The Official website of Robert G. Cooper and Scott J. Edgett:
http://www.prod-dev.com/innovation_diamond.php
Pröckl, E. (2005, June 15). Scania höjer pulsen på FoU. Retrieved December 21,
2010, from Nyteknik.se:
http://www.nyteknik.se/nyheter/it_telekom/allmant/article243268.ece
Quesada Allue , X. (2009, February 11). Visual Management for Agile Teams.
Retrieved December 21, 2010, from Visual Management Blog:
http://www.xqa.com.ar/visualmanagement/2009/02/visual-
management-for-agile-teams/
Smith, P. G., & Reinertsen, D. G. (1998). Developing products in half the time :
new rules, new tools. New York, USA: Viley, cop.
Sobek II, D. K., Ward, A. C., & Liker, J. K. (1999). Toyota's principles of set-based
concurrent engineering. Sloan Management Review, 40(2), pp. 67-84.
Trott, P. (2008). Innovation management and new product development (4 ed.).
Harlow: Financial Times/Prentice Hall.
Wallén, G. (1996). Vetenskapsteori och forskningsmetodik. Lund:
Studentlitteratur.
Wikipedia, the free encyclopedia. (2010, October 10). PDCA. Retrieved October
15, 2010, from Wikipedia, the free encyclopedia:
http://sv.wikipedia.org/wiki/PDCA
Wikipedia, the free encyclopedia. (n.d.). Post-it note. Retrieved 12 21, 2010, from
Wikipedia, the free encyclopedia: http://en.wikipedia.org/wiki/Post-
it_note

150
Womack, J. P., & Jones, D. T. (2003). Lean thinking: Banish waste and create
wealth in your corporation. London: Simon & Schuster UK Ltd.
Womack, J. P., Jones, D. T., & Roos, D. (1990). The Machine That Changed The
World. New York: Rawson Associates.
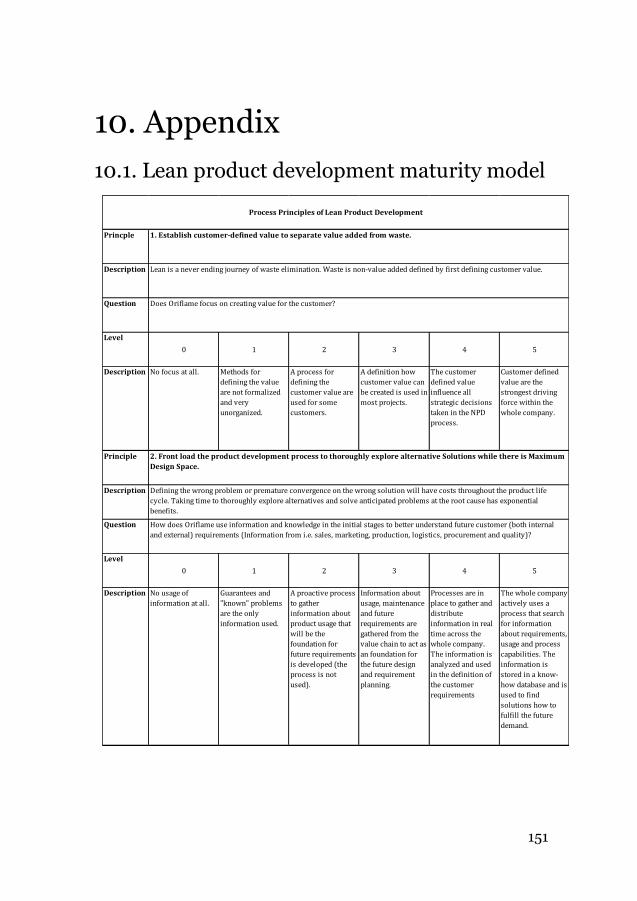
151
10. Appendix
10.1. Lean product development maturity model
Princple
Description
Question
Level
0 1 2 3 4 5
Description No focus at all. Methods for
defining the value
are not formalized
and very
unorganized.
A process for
defining the
customer value are
used for some
customers.
A definition how
customer value can
be created is used in
most projects.
The customer
defined value
influence all
strategic decisions
taken in the NPD
process.
Customer defined
value are the
strongest driving
force within the
whole company.
Principle
Description
Question
Level
0 1 2 3 4 5
Description No usage of
information at all.
Guarantees and
"known" problems
are the only
information used.
A proactive process
to gather
information about
product usage that
will be the
foundation for
future requirements
is developed (the
process is not
used).
Information about
usage, maintenance
and future
requirements are
gathered from the
value chain to act as
an foundation for
the future design
and requirement
planning.
Processes are in
place to gather and
distribute
information in real
time across the
whole company.
The information is
analyzed and used
in the definition of
the customer
requirements
The whole company
actively uses a
process that search
for information
about requirements,
usage and process
capabilities. The
information is
stored in a know-
how database and is
used to find
solutions how to
fulfill the future
demand.
Process Principles of Lean Product Development
Lean is a never ending journey of waste elimination. Waste is non-value added defined by first defining customer value.
1. Establish customer-defined value to separate value added from waste.
2. Front load the product development process to thoroughly explore alternative Solutions while there is Maximum
Design Space.
Defining the wrong problem or premature convergence on the wrong solution will have costs throughout the product life
cycle. Taking time to thoroughly explore alternatives and solve anticipated problems at the root cause has exponential
benefits.
Does Oriflame focus on creating value for the customer?
How does Oriflame use information and knowledge in the initial stages to better understand future customer (both internal
and external) requirements (Information from i.e. sales, marketing, production, logistics, procurement and quality)?
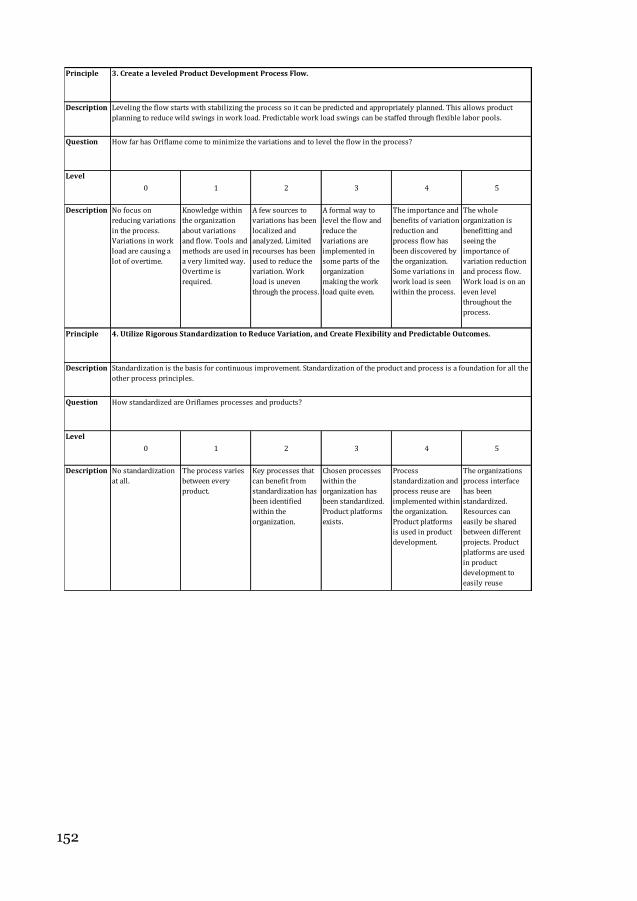
152
Principle
Description
Question
Level
0 1 2 3 4 5
Description No focus on
reducing variations
in the process.
Variations in work
load are causing a
lot of overtime.
Knowledge within
the organization
about variations
and flow. Tools and
methods are used in
a very limited way.
Overtime is
required.
A few sources to
variations has been
localized and
analyzed. Limited
recourses has been
used to reduce the
variation. Work
load is uneven
through the process.
A formal way to
level the flow and
reduce the
variations are
implemented in
some parts of the
organization
making the work
load quite even.
The importance and
benefits of variation
reduction and
process flow has
been discovered by
the organization.
Some variations in
work load is seen
within the process.
The whole
organization is
benefitting and
seeing the
importance of
variation reduction
and process flow.
Work load is on an
even level
throughout the
process.
Principle
Description
Question
Level
0 1 2 3 4 5
Description No standardization
at all.
The process varies
between every
product.
Key processes that
can benefit from
standardization has
been identified
within the
organization.
Chosen processes
within the
organization has
been standardized.
Product platforms
exists.
Process
standardization and
process reuse are
implemented within
the organization.
Product platforms
is used in product
development.
The organizations
process interface
has been
standardized.
Resources can
easily be shared
between different
projects. Product
platforms are used
in product
development to
easily reuse
solutions.
3. Create a leveled Product Development Process Flow.
Leveling the flow starts with stabilizing the process so it can be predicted and appropriately planned. This allows product
planning to reduce wild swings in work load. Predictable work load swings can be staffed through flexible labor pools.
How far has Oriflame come to minimize the variations and to level the flow in the process?
4. Utilize Rigorous Standardization to Reduce Variation, and Create Flexibility and Predictable Outcomes.
Standardization is the basis for continuous improvement. Standardization of the product and process is a foundation for all the
other process principles.
How standardized are Oriflames processes and products?
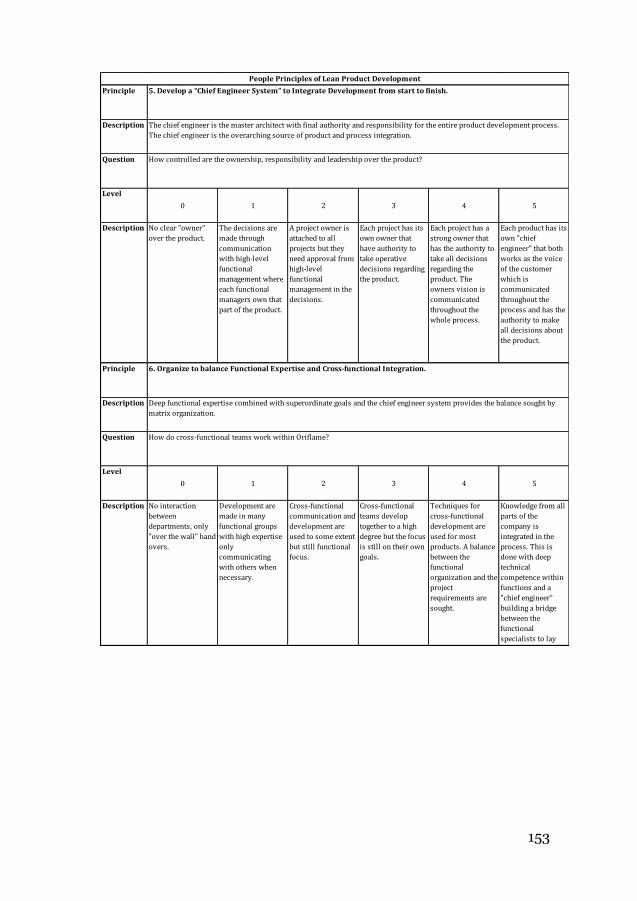
153
Principle
Description
Question
Level
0 1 2 3 4 5
Description No clear "owner"
over the product.
The decisions are
made through
communication
with high-level
functional
management where
each functional
managers own that
part of the product.
A project owner is
attached to all
projects but they
need approval from
high-level
functional
management in the
decisions.
Each project has its
own owner that
have authority to
take operative
decisions regarding
the product.
Each project has a
strong owner that
has the authority to
take all decisions
regarding the
product. The
owners vision is
communicated
throughout the
whole process.
Each product has its
own "chief
engineer" that both
works as the voice
of the customer
which is
communicated
throughout the
process and has the
authority to make
all decisions about
the product.
Principle
Description
Question
Level
0 1 2 3 4 5
Description No interaction
between
departments, only
"over the wall" hand
overs.
Development are
made in many
functional groups
with high expertise
only
communicating
with others when
necessary.
Cross-functional
communication and
development are
used to some extent
but still functional
focus.
Cross-functional
teams develop
together to a high
degree but the focus
is still on their own
goals.
Techniques for
cross-functional
development are
used for most
products. A balance
between the
functional
organization and the
project
requirements are
sought.
Knowledge from all
parts of the
company is
integrated in the
process. This is
done with deep
technical
competence within
functions and a
"chief engineer"
building a bridge
between the
functional
specialists to lay
focus on customer
People Principles of Lean Product Development
5. Develop a “Chief Engineer System” to Integrate Development from start to finish.
The chief engineer is the master architect with final authority and responsibility for the entire product development process.
The chief engineer is the overarching source of product and process integration.
How do cross-functional teams work within Oriflame?
6. Organize to balance Functional Expertise and Cross-functional Integration.
Deep functional expertise combined with superordinate goals and the chief engineer system provides the balance sought by
matrix organization.
How controlled are the ownership, responsibility and leadership over the product?
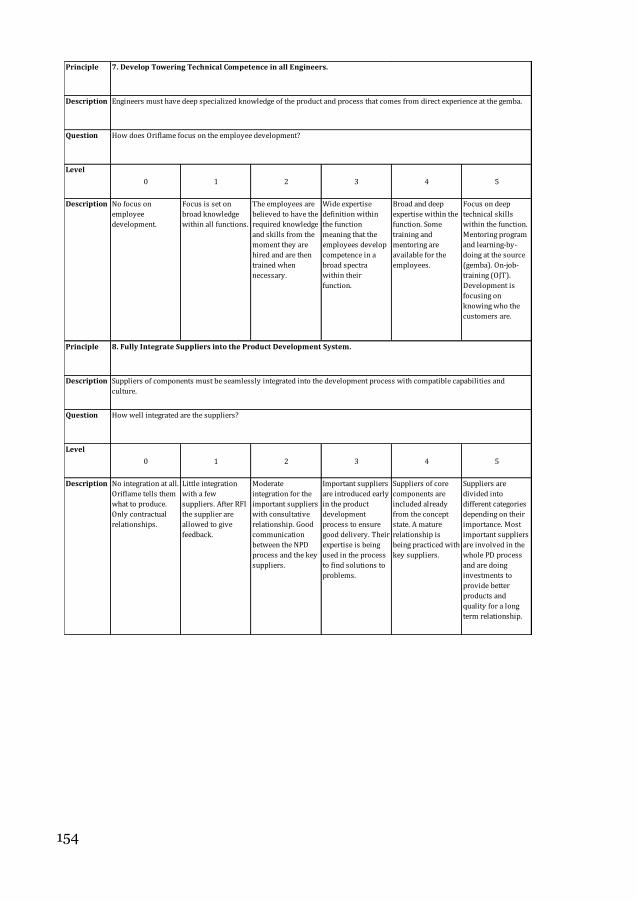
154
Principle
Description
Question
Level
0 1 2 3 4 5
Description No focus on
employee
development.
Focus is set on
broad knowledge
within all functions.
The employees are
believed to have the
required knowledge
and skills from the
moment they are
hired and are then
trained when
necessary.
Wide expertise
definition within
the function
meaning that the
employees develop
competence in a
broad spectra
within their
function.
Broad and deep
expertise within the
function. Some
training and
mentoring are
available for the
employees.
Focus on deep
technical skills
within the function.
Mentoring program
and learning-by-
doing at the source
(gemba). On-job-
training (OJT).
Development is
focusing on
knowing who the
customers are.
Principle
Description
Question
Level
0 1 2 3 4 5
Description No integration at all.
Oriflame tells them
what to produce.
Only contractual
relationships.
Little integration
with a few
suppliers. After RFI
the supplier are
allowed to give
feedback.
Moderate
integration for the
important suppliers
with consultative
relationship. Good
communication
between the NPD
process and the key
suppliers.
Important suppliers
are introduced early
in the product
development
process to ensure
good delivery. Their
expertise is being
used in the process
to find solutions to
problems.
Suppliers of core
components are
included already
from the concept
state. A mature
relationship is
being practiced with
key suppliers.
Suppliers are
divided into
different categories
depending on their
importance. Most
important suppliers
are involved in the
whole PD process
and are doing
investments to
provide better
products and
quality for a long
term relationship.
8. Fully Integrate Suppliers into the Product Development System.
Suppliers of components must be seamlessly integrated into the development process with compatible capabilities and
culture.
How does Oriflame focus on the employee development?
7. Develop Towering Technical Competence in all Engineers.
Engineers must have deep specialized knowledge of the product and process that comes from direct experience at the gemba.
How well integrated are the suppliers?
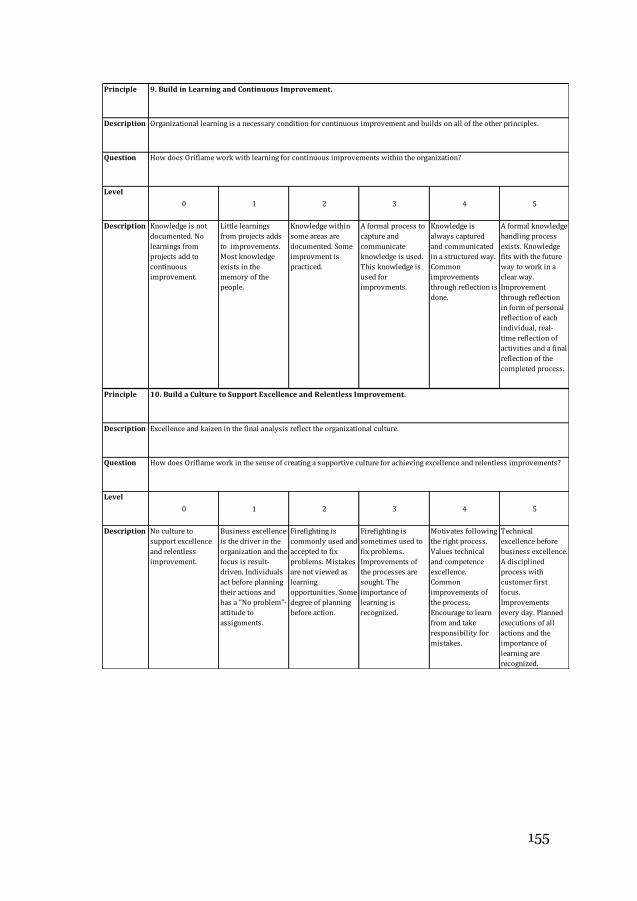
155
Principle
Description
Question
Level
0 1 2 3 4 5
Description Knowledge is not
documented. No
learnings from
projects add to
continuous
improvement.
Little learnings
from projects adds
to improvements.
Most knowledge
exists in the
memory of the
people.
Knowledge within
some areas are
documented. Some
improvment is
practiced.
A formal process to
capture and
communicate
knowledge is used.
This knowledge is
used for
improvments.
Knowledge is
always captured
and communicated
in a structured way.
Common
improvements
through reflection is
done.
A formal knowledge
handling process
exists. Knowledge
fits with the future
way to work in a
clear way.
Improvement
through reflection
in form of personal
reflection of each
individual, real-
time reflection of
activities and a final
reflection of the
completed process.
Principle
Description
Question
Level
0 1 2 3 4 5
Description No culture to
support excellence
and relentless
improvement.
Business excellence
is the driver in the
organization and the
focus is result-
driven. Individuals
act before planning
their actions and
has a "No problem"-
attitude to
assignments.
Firefighting is
commonly used and
accepted to fix
problems. Mistakes
are not viewed as
learning
opportunities. Some
degree of planning
before action.
Firefighting is
sometimes used to
fix problems.
Improvements of
the processes are
sought. The
importance of
learning is
recognized.
Motivates following
the right process.
Values technical
and competence
excellence.
Common
improvements of
the process.
Encourage to learn
from and take
responsibility for
mistakes.
Technical
excellence before
business excellence.
A disciplined
process with
customer first
focus.
Improvements
every day. Planned
executions of all
actions and the
importance of
learning are
recognized.
9. Build in Learning and Continuous Improvement.
Organizational learning is a necessary condition for continuous improvement and builds on all of the other principles.
10. Build a Culture to Support Excellence and Relentless Improvement.
Excellence and kaizen in the final analysis reflect the organizational culture.
How does Oriflame work with learning for continuous improvements within the organization?
How does Oriflame work in the sense of creating a supportive culture for achieving excellence and relentless improvements?
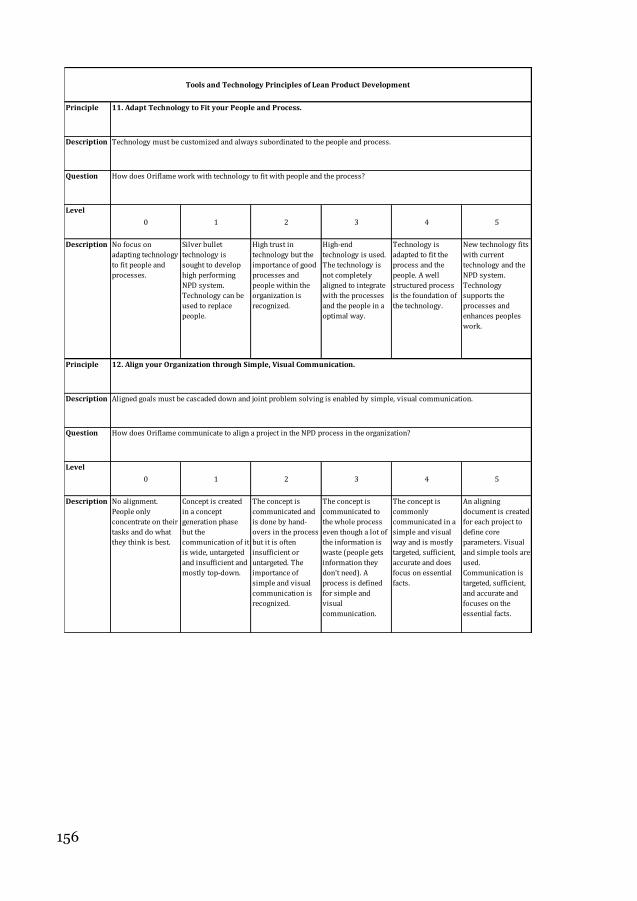
156
Principle
Description
Question
Level
0 1 2 3 4 5
Description No focus on
adapting technology
to fit people and
processes.
Silver bullet
technology is
sought to develop
high performing
NPD system.
Technology can be
used to replace
people.
High trust in
technology but the
importance of good
processes and
people within the
organization is
recognized.
High-end
technology is used.
The technology is
not completely
aligned to integrate
with the processes
and the people in a
optimal way.
Technology is
adapted to fit the
process and the
people. A well
structured process
is the foundation of
the technology.
New technology fits
with current
technology and the
NPD system.
Technology
supports the
processes and
enhances peoples
work.
Principle
Description
Question
Level
0 1 2 3 4 5
Description No alignment.
People only
concentrate on their
tasks and do what
they think is best.
Concept is created
in a concept
generation phase
but the
communication of it
is wide, untargeted
and insufficient and
mostly top-down.
The concept is
communicated and
is done by hand-
overs in the process
but it is often
insufficient or
untargeted. The
importance of
simple and visual
communication is
recognized.
The concept is
communicated to
the whole process
even though a lot of
the information is
waste (people gets
information they
don't need). A
process is defined
for simple and
visual
communication.
The concept is
commonly
communicated in a
simple and visual
way and is mostly
targeted, sufficient,
accurate and does
focus on essential
facts.
An aligning
document is created
for each project to
define core
parameters. Visual
and simple tools are
used.
Communication is
targeted, sufficient,
and accurate and
focuses on the
essential facts.
Technology must be customized and always subordinated to the people and process.
Tools and Technology Principles of Lean Product Development
11. Adapt Technology to Fit your People and Process.
How does Oriflame work with technology to fit with people and the process?
12. Align your Organization through Simple, Visual Communication.
Aligned goals must be cascaded down and joint problem solving is enabled by simple, visual communication.
How does Oriflame communicate to align a project in the NPD process in the organization?
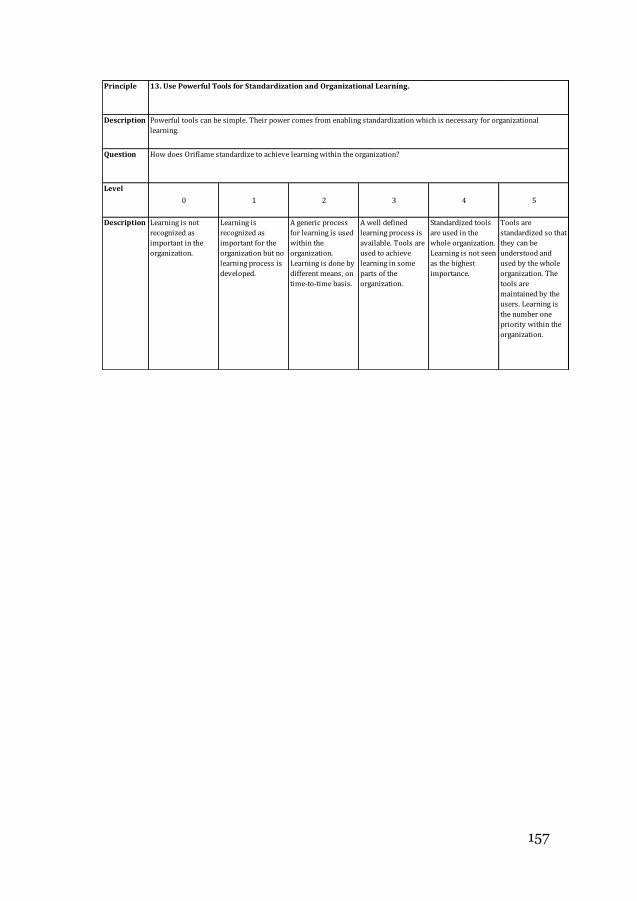
157
Principle
Description
Question
Level
0 1 2 3 4 5
Description Learning is not
recognized as
important in the
organization.
Learning is
recognized as
important for the
organization but no
learning process is
developed.
A generic process
for learning is used
within the
organization.
Learning is done by
different means, on
time-to-time basis.
A well defined
learning process is
available. Tools are
used to achieve
learning in some
parts of the
organization.
Standardized tools
are used in the
whole organization.
Learning is not seen
as the highest
importance.
Tools are
standardized so that
they can be
understood and
used by the whole
organization. The
tools are
maintained by the
users. Learning is
the number one
priority within the
organization.
How does Oriflame standardize to achieve learning within the organization?
13. Use Powerful Tools for Standardization and Organizational Learning.
Powerful tools can be simple. Their power comes from enabling standardization which is necessary for organizational
learning.
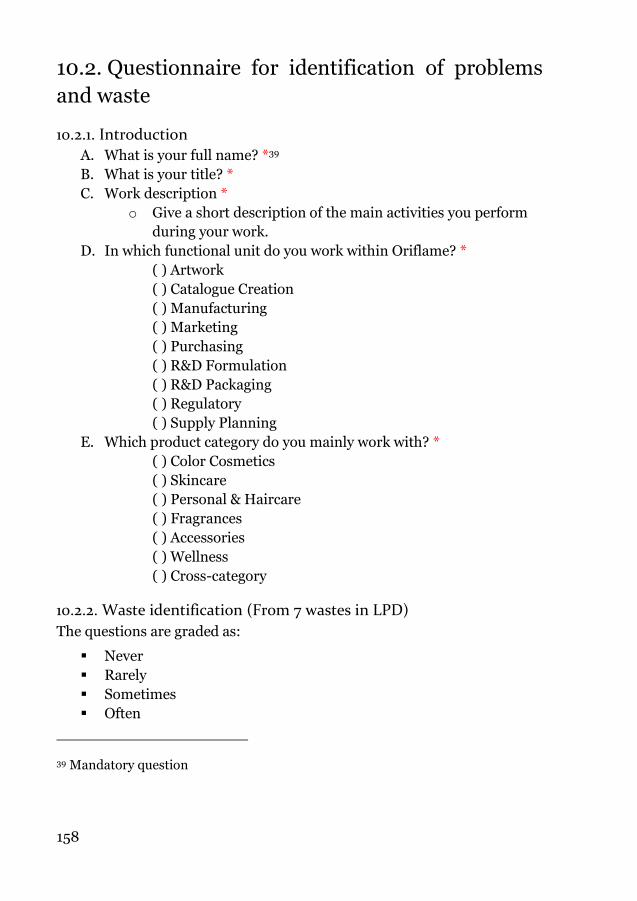
158
10.2. Questionnaire for identification of problems
and waste
10.2.1. Introduction
A. What is your full name? *39
B. What is your title? *
C. Work description *
o Give a short description of the main activities you perform
during your work.
D. In which functional unit do you work within Oriflame? *
( ) Artwork
( ) Catalogue Creation
( ) Manufacturing
( ) Marketing
( ) Purchasing
( ) R&D Formulation
( ) R&D Packaging
( ) Regulatory
( ) Supply Planning
E. Which product category do you mainly work with? *
( ) Color Cosmetics
( ) Skincare
( ) Personal & Haircare
( ) Fragrances
( ) Accessories
( ) Wellness
( ) Cross-category
10.2.2. Waste identification (From 7 wastes in LPD)
The questions are graded as:
Never
Rarely
Sometimes
Often
39 Mandatory question
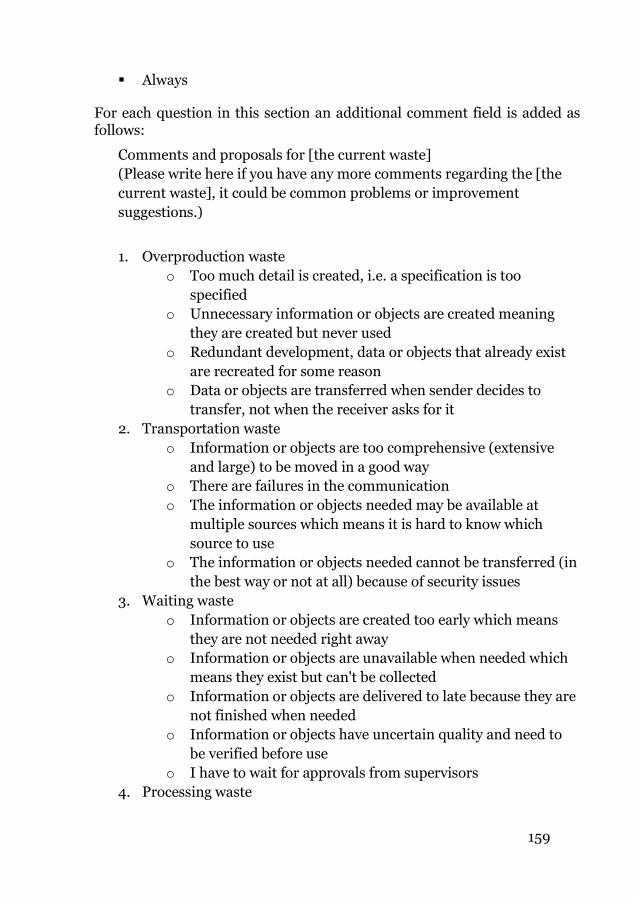
159
Always
For each question in this section an additional comment field is added as follows:
Comments and proposals for [the current waste]
(Please write here if you have any more comments regarding the [the
current waste], it could be common problems or improvement
suggestions.)
1. Overproduction waste
o Too much detail is created, i.e. a specification is too
specified
o Unnecessary information or objects are created meaning
they are created but never used
o Redundant development, data or objects that already exist
are recreated for some reason
o Data or objects are transferred when sender decides to
transfer, not when the receiver asks for it
2. Transportation waste
o Information or objects are too comprehensive (extensive
and large) to be moved in a good way
o There are failures in the communication
o The information or objects needed may be available at
multiple sources which means it is hard to know which
source to use
o The information or objects needed cannot be transferred (in
the best way or not at all) because of security issues
3. Waiting waste
o Information or objects are created too early which means
they are not needed right away
o Information or objects are unavailable when needed which
means they exist but can't be collected
o Information or objects are delivered to late because they are
not finished when needed
o Information or objects have uncertain quality and need to
be verified before use
o I have to wait for approvals from supervisors
4. Processing waste
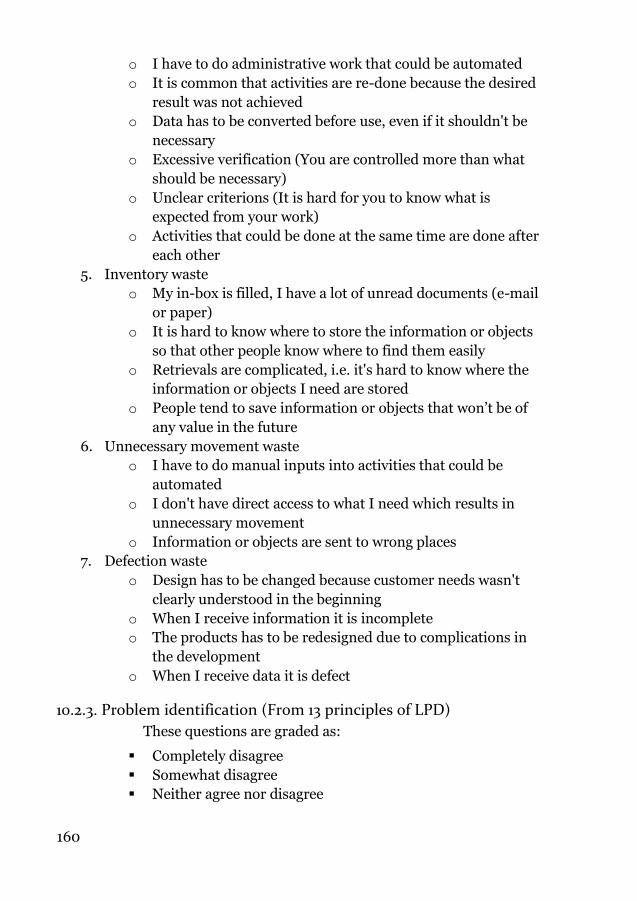
160
o I have to do administrative work that could be automated
o It is common that activities are re-done because the desired
result was not achieved
o Data has to be converted before use, even if it shouldn't be
necessary
o Excessive verification (You are controlled more than what
should be necessary)
o Unclear criterions (It is hard for you to know what is
expected from your work)
o Activities that could be done at the same time are done after
each other
5. Inventory waste
o My in-box is filled, I have a lot of unread documents (e-mail
or paper)
o It is hard to know where to store the information or objects
so that other people know where to find them easily
o Retrievals are complicated, i.e. it's hard to know where the
information or objects I need are stored
o People tend to save information or objects that won’t be of
any value in the future
6. Unnecessary movement waste
o I have to do manual inputs into activities that could be
automated
o I don't have direct access to what I need which results in
unnecessary movement
o Information or objects are sent to wrong places
7. Defection waste
o Design has to be changed because customer needs wasn't
clearly understood in the beginning
o When I receive information it is incomplete
o The products has to be redesigned due to complications in
the development
o When I receive data it is defect
10.2.3. Problem identification (From 13 principles of LPD)
These questions are graded as:
Completely disagree
Somewhat disagree
Neither agree nor disagree
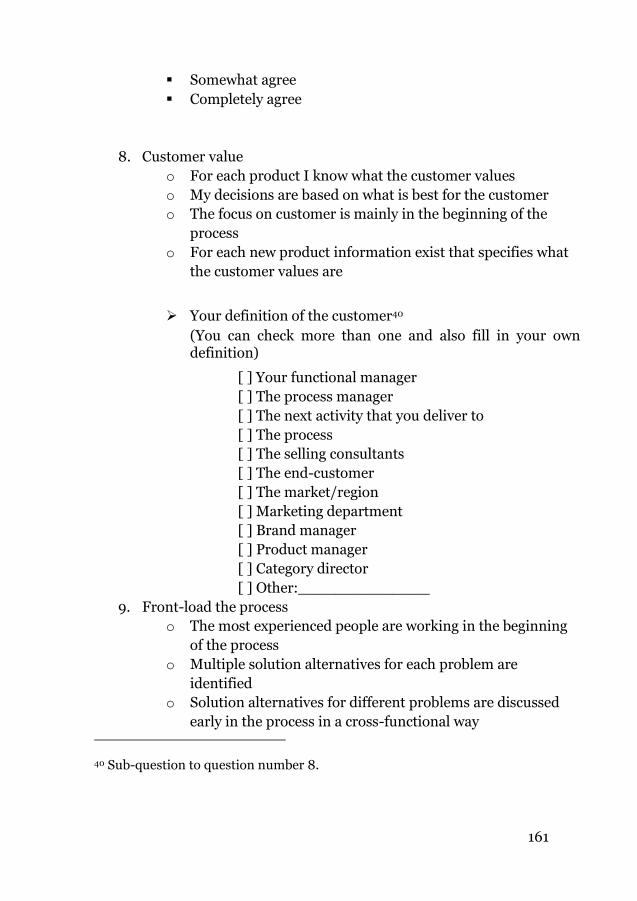
161
Somewhat agree
Completely agree
8. Customer value
o For each product I know what the customer values
o My decisions are based on what is best for the customer
o The focus on customer is mainly in the beginning of the
process
o For each new product information exist that specifies what
the customer values are
Your definition of the customer40
(You can check more than one and also fill in your own definition)
[ ] Your functional manager
[ ] The process manager
[ ] The next activity that you deliver to
[ ] The process
[ ] The selling consultants
[ ] The end-customer
[ ] The market/region
[ ] Marketing department
[ ] Brand manager
[ ] Product manager
[ ] Category director
[ ] Other:______________
9. Front-load the process
o The most experienced people are working in the beginning
of the process
o Multiple solution alternatives for each problem are
identified
o Solution alternatives for different problems are discussed
early in the process in a cross-functional way
40 Sub-question to question number 8.
162
o Different solution alternatives are compared by looking at
their trade-offs
o The most experienced people are fire-fighting downstream
to solve important issues
o Many of the problems I face could be avoided if more effort
were put earlier in the process
10. Leveled process flow
o Variation in activities from project to project exists,
meaning that activities are done in different ways from
project to project
o The work-load is higher than it should be throughout the
process
o Resources are flexible, I can get help when my work-load is
to high
o The work-load varies throughout a project meaning that
sometimes I have little to do and sometimes too much to do
o I could work in another category with the same tasks as I do
now without any transit time
11. Standardization
o Competence is standardized, which means that differences
in competence between product categories do not exist
o Tools are standardized, which means that the tools I am
using are also being used in other product categories
o Activities are standardized, which means that activities are
performed in the same way between the product categories
o Products are standardized, platforms are used to simplify
the development of similar products
o Standardized processes are used, i.e. my colleagues and I
always work in the same way
12. "Chief engineer"
o Each project has one specific manager throughout the whole
process who has authority to take all important decisions
o A manager responsible for the product supports the
interaction between functions
o I always know whom to ask when a problem occurs
o I get the answers I need in time so that I don't get late with
my work
13. Balance between functional expertise and cross-functional
integration
163
o There is no one responsible for bringing together the cross-
functional work
o I think that I work with too little influence from other
functions
14. Towering technical competence
o My skill development focuses on getting better on my tasks
rather than getting expertise from other functions
o Mentoring program exist to transfer knowledge that is hard
to teach in theory
o When a problem occur I have the opportunity to see the
problem with my own eyes to get a better understanding of
it
o My work would benefit if I got more training in my technical
competence
o My work would benefit if a mentor helped me in my
personal development
15. Integration with suppliers
o I have contact with suppliers during my work
o It would benefit me if I had more contact with suppliers
o Price is the most important factor when choosing a supplier
16. Learning and continuous improvement
o If I come up with an improvement I know who to contact for
feed-back and eventually an implementation of that idea
o Personal reflection after each project exist (What did I do
right and what did I do wrong)
o When a problem appears I try to find the root cause of the
problem
o Learnings from finished projects are documented
o Learnings from other projects are of help to me in my work
o Earlier learnings and documented knowledge are used to
improve my way of work
o We share experience and learnings cross categories and
projects
164
Finding the root cause of problems41
(If you disagree on the third statement in last question, what are the reasons for not trying to find the root cause of problems?)
[ ] I do not have enough time
[ ] It is not my job
[ ] I cannot see the benefit
[ ] No interest from management to do this
[ ] It is better to fix the problem than to find the root
cause
[ ] I do not have the authority to do this
17. Company culture
o It is more important with process discipline and work ethics
than with result focus
o A willingness of getting better and to always learn exists
within the organization
o If I come up with a good idea for improvement, the
organization will award me
o I receive problems that could have been solved earlier in the
process
18. Technology that fits people and process
o If implemented, new technology could fit with older
technology in a good way
o Current technology enhance my performance
o New technology could speed up my work so I could spend
more time on value adding activities
o Today technology is integrated with the process which
makes it easy to work according to the process
19. Alignment
o My work would benefit if an alignment document was
created for each product that is to be developed, this
document includes every important aspect and core
parameters for the product
o Visual and simple tools would be a good way to
communicate between people in the process
41 Sub-question to question number 16.
165
o Communication is targeted to the right persons and has the
right information
o It is easy to know how my work affect other peoples work
o We all work together towards a clear goal in each project
o High-level corporate goals are broken down into objectives
so that I can use them in my daily work
20. Tools for standardization and organizational learning
o Tools for standardization and learning exist
o Learnings should be considered more important in the
organization
o I believe it would be possible to use tools to achieve
organizational learnings
10.2.4. Reflections
21. What are the main issues according to you in the new product
development process?
(Where do you see the greatest problems?)
22. Do you have any concrete suggestion for improvements
(Please write your own suggestions for improvements in the NPD process here.)
23. Final reflections
(Please use this field for additional comments)
10.2.5. Cover letter
Hello,
We are two students from Lunds tekniska högskola that are doing our master
thesis at Oriflame. The purpose of the master thesis is to evaluate the new
product development process from a Lean perspective and eventually give
recommendations on how to improve the process. Our supervisor at Oriflame is
Anders Fenger-Krog.
This form is used for our master thesis to identify waste and problems from a
lean perspective. We would greatly appreciate if you took your time and
answered our questions.
The data will be collected at next Wednesday 1st December Nov. so please answer
before that date but preferably as soon as possible.
If you have any question regarding the form don't hesitate to contact us at

166
Use this link to go to the form:
https://spreadsheets.google.com/viewform?hl=en&formkey=dGRrYk1oR3JSd2R5YUE5OWZlbmlvT
Gc6MQ#gid=0
Kind regards,
Jonathan Viklander and Dan Möller
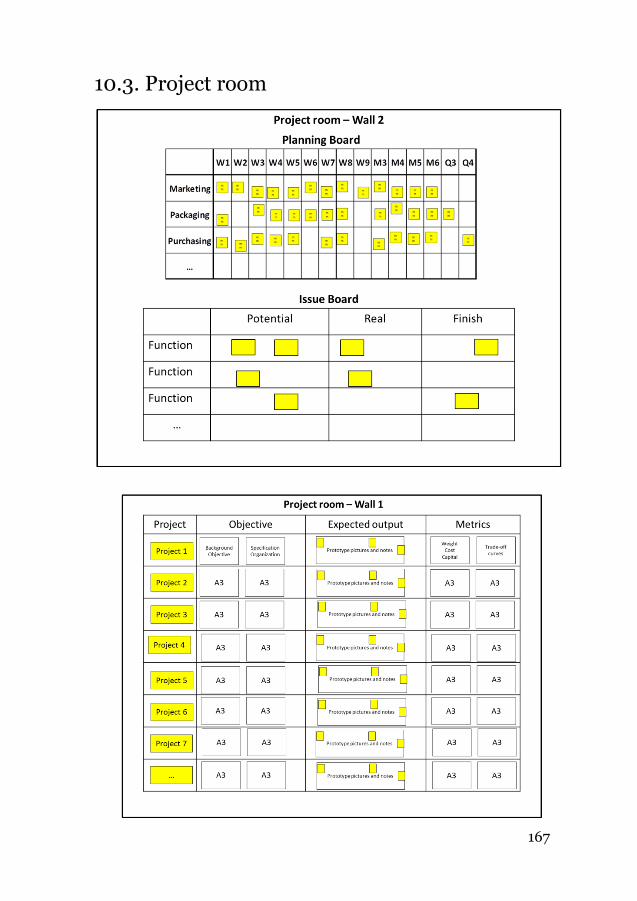
167
10.3. Project room