an evaluation of the zambia influenza sentinel
TRANSCRIPT

RESEARCH ARTICLE Open Access
An evaluation of the Zambia influenzasentinel surveillance system, 2011–2017Paul Simusika1* , Stefano Tempia2,3,4, Edward Chentulo1, Lauren Polansky3, Mazyanga Lucy Mazaba1,Idah Ndumba1, Quinn K. Mbewe1 and Mwaka Monze1*
Abstract
Background: Over the past decade, influenza surveillance has been established in several African countries includingZambia. However, information on the on data quality and reliability of established influenza surveillance systems in Africaare limited. Such information would enable countries to assess the performance of their surveillance systems, identifyshortfalls for improvement and provide evidence of data reliability for policy making and public health interventions.
Methods: We used the Centers for Disease Control and Prevention guidelines to evaluate the performance of theinfluenza surveillance system (ISS) in Zambia during 2011–2017 using 9 attributes: (i) data quality and completeness, (ii)timeliness, (iii) representativeness, (iv) flexibility, (v) simplicity, (vi) acceptability, (vii) stability, (viii) utility, and (ix)sustainability. Each attribute was evaluated using pre-defined indicators. For each indicator we obtained the proportion(expressed as percentage) of the outcome of interest over the total. A scale from 1 to 3 was used to provide a score foreach attribute as follows: < 60% (as obtained in the calculation above) scored 1 (weak performance); 60–79% scored 2(moderate performance); ≥80% scored 3 (good performance). An overall score for each attribute and the ISS wasobtained by averaging the scores of all evaluated attributes.
Results: The overall mean score for the ISS in Zambia was 2.6. Key strengths of the system were the quality of datagenerated (score: 2.9), its flexibility (score: 3.0) especially to monitor viral pathogens other than influenza viruses, itssimplicity (score: 2.8), acceptability (score: 3.0) and stability (score: 2.6) over the review period and its relatively low cost($310,000 per annum). Identified weaknesses related mainly to geographic representativeness (score: 2.0), timeliness(score: 2.5), especially in shipment of samples from remote sites, and sustainability (score: 1.0) in the absence of externalfunds.
Conclusions: The system performed moderately well in our evaluation. Key improvements would include improvementsin the timeliness of samples shipments and geographical coverage. However, these improvements would result inincreased cost and logistical complexity. The ISSS in Zambia is largely reliant on external funds and the acceptability ofmaintaining the surveillance system through national funds would require evaluation.
Keywords: Influenza, Surveillance, Evaluation, Zambia
BackgroundSeasonal influenza virus infections are responsible for anestimated 291,243–645,832 respiratory deaths globallyevery year [1]. Influenza infections have been describedin Zambia [2] since the 1990s, but because of limited la-boratory diagnostic capacity prior to 2008 [3], little wasknown about the contribution of influenza viruses to the
respiratory disease burden, rendering difficult publichealth planning for the prevention and control ofinfluenza-associated illness. At present, no influenzatreatment or immunization guidelines are available inZambia, and no measures for mitigating the transmis-sion and disease burden associated with influenza infec-tion are in place.Public health surveillance is the ongoing, systematic
collection, analysis, interpretation, and dissemination ofdata regarding a health-related event for use in publichealth action to reduce morbidity and mortality and to
© The Author(s). 2020 Open Access This article is distributed under the terms of the Creative Commons Attribution 4.0International License (http://creativecommons.org/licenses/by/4.0/), which permits unrestricted use, distribution, andreproduction in any medium, provided you give appropriate credit to the original author(s) and the source, provide a link tothe Creative Commons license, and indicate if changes were made. The Creative Commons Public Domain Dedication waiver(http://creativecommons.org/publicdomain/zero/1.0/) applies to the data made available in this article, unless otherwise stated.
* Correspondence: [email protected]; [email protected] Influenza Center, Virology Laboratory, University Teaching Hospital,Lusaka, ZambiaFull list of author information is available at the end of the article
Simusika et al. BMC Health Services Research (2020) 20:35 https://doi.org/10.1186/s12913-019-4884-5
improve health [4]. Data disseminated by a public healthsurveillance system can be used for immediate publichealth action, program planning and evaluation, and for-mulation of research hypotheses [5].The lack of a routine influenza surveillance program
in Zambia placed the country at a disadvantage as sucha system would serve as an ever-ready early warning sys-tem with the potential to detect and confirm the etiologyof respiratory disease outbreaks, including seasonal andpandemic influenza viruses, and trigger a response. TheMinistry of Health (MoH) recognized a need to gatherinfluenza epidemiological and virological data fromZambia that would not only help decision makers to for-mulate policies targeted toward influenza prevention inZambia but also to provide a more comprehensive un-derstanding of the dynamics of influenza viruses world-wide and in African tropical zones in particular. Inaddition, virological data would help to identify seed vi-ruses for the production of seasonal influenza vaccinesthat can be effectively used for the Southern Hemi-sphere. In recognition of these needs, in 2008 theZambia Ministry of Health established an influenza sen-tinel surveillance system (ISSS) targeting outpatientswith influenza-like illness (ILI) and in-patients with se-vere acute respiratory illness (SARI).The World Health Organization (WHO) recommends
that established influenza surveillance systems undergo acomprehensive evaluation periodically, beginning 1–2years after implementation in order to ascertain howwell the system fulfills its purposes [6, 7]. Such evalua-tions are useful to identify shortfalls, improve perform-ance and provide evidence of data reliability for policymaking and public health interventions. However, des-pite recent progress in describing the epidemiology andburden of influenza in sub-Saharan Africa [8–16], only afew countries have implemented a comprehensive evalu-ation of their surveillance systems [17–21].To ensure that the national ISSS objectives are met,
that they are in line with WHO requirements and thatreliable data are generated for public health interven-tions, we conducted an evaluation of the performance ofthe Zambia ILI and SARI ISSS from January 2011 to De-cember 2017. The inception and consolidation of thesurveillance system occurred during 2008–2010. Theoutputs of the surveillance systems during this periodhave been previously published [3] and they are not in-cluded in this review.
MethodsOverview of the influenza sentinel surveillance systemduring 2011–2017In Zambia, an ISSS was first established in 2008 in LusakaProvince (the most populated province of the country wherethe capital city is located) [3] and subsequently expanded to
the Copperbelt Province (the second most populated prov-ince). The objectives of the Zambia-ISSS were to: (i) moni-tor the temporal trends of influenza virus circulation; (ii)monitor the circulating influenza virus types and subtypesannually, including pandemic strains; (iii) assess the propor-tion of patients meeting the ILI and SARI case definition at-tributable to influenza virus infection; (iv) assess risk factorsfor influenza-associated severe illness; (v) assess the burdenof influenza-associated illness; and (vi) obtain and share clin-ical samples for annual selection of influenza virus strainsfor influenza vaccine formulation under the WHO-GlobalInfluenza Surveillance and Response Network. During2011–2017, ILI influenza sentinel surveillance was con-ducted in three urban outpatient clinics targeting outpa-tients with ILI and three large referral hospitals targetinginpatients with SARI (Fig. 1, panel A). Both pediatric andadult cases were investigated.A case of ILI was defined as an outpatient of any age
presenting with a recorded temperature ≥ 38 °C andcough or sore throat of duration of ≤7 days [6]. A caseof SARI was defined as a hospitalized person who hadillness onset within 7 days of admission and who metage-specific clinical inclusion criteria. A case in childrenaged 2 days to < 5 years included any hospitalized patientwith cough or difficulty breathing and at least one of thefollowing danger signs: unable to drink or breastfeed,lethargic, vomits everything, convulsion, chest in-drawing or stridor in a calm child. A case in personsaged ≥5 years included any hospitalized patient withfever (≥38 °C), cough and shortness of breath or diffi-culty breathing [6]. All patients with SARI were eligiblefor enrollment; whereas 5 patients with ILI (the first pa-tient every day from Monday to Friday) were targetedfor enrollment per week and per facility.Activities at the sentinel sites situated in Lusaka were
coordinated by a dedicated surveillance officer from theNational Influenza Center (NIC). For sites situated inthe Copperbelt Province, supervision was conducted bya focal point at the Provincial Medical Office. Due tohigh staff turnover, training was conducted once a yearwhile supervisory visits to sites were done at least quar-terly. Clinical staff at sentinel sites tasked with surveil-lance implementation were remunerated according totime spent on surveillance activities. The Zambia ISSS isco-funded by the Zambia-MoH, the U.S. Centers forDisease Control and Prevention (U.S. CDC) and WHO.
Data and sample collection proceduresData were collected from eligible cases using WHOadapted and standardized case investigation forms (CIF)by trained nurses in each sentinel site. For patientsmeeting the SARI case definition the number of patientseligible for enrollment was also collected. A combinationof nasopharyngeal and oropharyngeal swabs were
Simusika et al. BMC Health Services Research (2020) 20:35 Page 2 of 12

collected from consenting patients, placed in universaltransport medium (Copan, Murrieta, California, USA)and transported to the University Teaching Hospital Vir-ology Laboratory, the WHO-recognized NIC in Lusaka,via a cold chain for testing. Samples with respective CIFforms collected from sites situated in Lusaka were sentto the laboratory within 48 h, while those from theCopperbelt Province were refrigerated and sent withintwo weeks of collection [22]. Verbal informed consentwas obtained from all patients prior to data and speci-men collection. For children aged < 15 years, verbal con-sent was obtained from a parent or legal guardian.
Sample processingAt the NIC, samples and accompanying CIFs werelogged by recording key data in the laboratory log book.Specimens were tested for the presence of influenza vi-ruses using the U.S. CDC real-time reverse-transcriptionpolymerase chain reaction (RT-PCR) protocol forcharacterization of influenza viruses [3]. During 2011–2012, all specimens from children aged < 5 years withSARI were tested for other respiratory viruses includingparainfluenza virus (PIV) types 1, 2 and 3, respiratorysyncytial virus (RSV), adenovirus, rhinovirus, humanmetapneumovirus (hMPV), coronavirus (OC43, NL63,
Fig. 1 Influenza sentinel surveillance implemented at six surveillance sites in Zambia, 2011–2017. A: years of implementation of influenzasurveillance by sentinel site (solid line: sentinel sites situated in Lusaka Province; dashed line: sentinel sites situated in Copperbelt Province). B:monthly number of influenza-positive specimens among patients with influenza-like illness (ILI) or severe acute respiratory illness (SARI)
Simusika et al. BMC Health Services Research (2020) 20:35 Page 3 of 12

229E, HKU1) and bocavirus using an FTD multiplex real-time RT-PCR assay [23]. Since 2012, RT-PCR influenza-positive samples with a cycle threshold value < 28 werecultured at the NIC, after which further viral identificationof the samples was done using Haemagglutination (HA)and Haemagglutination Inhibition (HAI) testing. Con-firmed virus isolates were shared with WHO Collaborat-ing Centers for further characterization; both viral isolatesand clinical specimens were shared twice a year.
Data management and reportingData from the CIF including demographics and clinical in-formation, exposure risk and past medical history werecaptured in a customized influenza sentinel surveillanceMS Access® database with inbuilt data validation checks.Data entry was done daily as forms were received.Monthly reports of the total number of samples receivedand processed (including positive specimens by subtype)were reported to the Ministry of Health public healthunits. A separate patient line-list was also sent monthly tothe sentinel sites; the results report included total samplesprocessed by sentinel site and total confirmed influenzainfections. Weekly influenza surveillance data andinfluenza-positive specimens were reported to WHOAFRO using an excel template. Virological and epidemio-logical data were reported to WHO FLUNET / FLUID.
Evaluation of the influenza sentinel surveillance systemThe evaluation of the ISSS was based on CDC guidelines[5] and focused on the performance of the system fromJanuary 2011 to December 2017. The objective of the evalu-ation was to determine: (i) whether the surveillance systemwas designed and operated in such a way as to be capableof detecting and monitoring seasonal influenza viruses,
including pandemic strains; (ii) the usefulness of the col-lected data to assess influenza disease burden in the generalpopulation; (iii) the impact of the system in informing pub-lic health intervention and policies; and (iv) the ability ofthe system to contribute to the annual selection of influ-enza strains for vaccine development. The performance ofthe system was assessed using nine surveillance attributes,namely: (i) data quality and completeness for selected keyvariables, (ii) timeliness, (iii) representativeness, (iv) flexibil-ity, (v) simplicity (vi) acceptability, (vii) stability; (viii) utility;and (ix) sustainability.For consistency and comparability of findings we used
the evaluation method and scoring system utilized for in-fluenza surveillance evaluations conducted in other Afri-can countries [17–21]. Each of the above mentionedattribute was evaluated using pre-defined quantitative orqualitative indicators. A total of 38 indicators were devel-oped for the evaluation. The number of indicators evalu-ated for each attribute is provided in Table 1; whereas theindividual indicators and the calculations and data sourcesused to evaluate each indicator are provided in Tables 2-5.Data for calculation of the indicators for data quality and
completeness, timeliness, stability and utility were obtainedfrom various sources including the main influenza sentinelsurveillance database, the laboratory database, annualreports and other documents and records. In order toassess simplicity, acceptability, stability and utility, a self-administered questionnaire as shown in additional file 1below was designed targeting staff involved in surveillanceat the sentinel sites. The questionnaire was designed to cap-ture data based on staff perceptions of the program. Datacollected from the surveillance system were also comparedwith WHO minimum data collection standards for ILI andSARI surveillance [6].
Table 1 Mean indicators’ scores (range 1–3) for each attribute used for the evaluation of the influenza sentinel surveillance systemin Zambia, 2011-2017a
Attributes Number of evaluated indicators Mean score Performance
• Data quality and completeness 7 2.9 Moderate to good
• Timeliness 2 2.5 Moderate
• Representativeness 2 2.0 Moderate to weak
• Flexibility 2 3.0 Good
• Simplicity 7 2.8 Moderate to good
• Acceptability 4 3.0 Good
• Stability 8 2.6 Moderate to good
• Utility 4 2.7 Moderate to good
• Sustainability 2 1.0 Weak
• Overall 38 2.6 Moderate to goodaEach quantitative indicator was evaluated as the proportion (expressed as percentage) of the outcome of interest over the total. A scale from 1 to 3 was used toprovide a score for each quantitative indicator as follows: < 60% (from the above calculation) scored 1 (weak performance); 60–79% scored 2 (moderateperformance); ≥80% scored 3 (good performance). For indicators for which a proportion over a total could not be obtained (qualitative indicators) a score wasassigned based on the same scale using expert consensus. The scores assigned to each indicator were averaged for all indicators evaluated for each attribute toprovide a mean score for each surveillance attribute. An overall score for the surveillance system was obtained by averaging the scores of all evaluated indicators
Simusika et al. BMC Health Services Research (2020) 20:35 Page 4 of 12

For each quantitative indicator we first obtained theproportion (expressed as percentage) of the outcome ofinterest over the total [18–21]. For instance, for the
indicator on completeness of laboratory testing (one ofthe indicators used to evaluate the data quality and com-pleteness attribute) we divided the number of samples
Table 2 Indicators for data quality and completeness, timeliness, representativeness and flexibility used for the evaluation of theinfluenza sentinel surveillance system in Zambia, 2011-2017a
Indicator Calculation/data inputs Data source Indicator value Score
Data quality and completeness
• Proportion of enrolled patients with ILI againstset target (5 patients per week per site).
Number of enrolled patients with ILI/ Estimated target.
ISS databaseand estimatedtarget
140.4% 3
• Proportion of enrolled patients with SARIagainst set target (all eligible patients).
Number of enrolled patients withSARI / All patients with SARI.
ISS database 69.8% 2
• Proportion of SARI/ILI cases that meetthe case definition
Number of ILI/SARI cases that meetthe case definition / Total number ofenrolled ILI/SARI cases
ISS database 86.5% 3
• Proportion of forms without at least oneinconsistent or missing value for key variablesb
Number of forms without at leastone incorrect or missing value /Total number of forms
ISS database 93.8% 3
• Proportion of sampled ILI/SARI caseswith available laboratory results
Number of ILI/SARI cases withavailable laboratory results / Numberof sampled ILI/SARI cases
ISS database 93.2% 3
• Proportion of sample with positive RNP results Number of samples with a positiveRNP result / Total number ofsamples tested
ISS database 99.8% 3
• Proportion of collected variables included inthe WHO recommended minimum datacollection standard
Number of collected variables withinthe WHO list / Number of WHOrecommended variables.
CIF and WHOguidelines forinfluenzasentinelsurveillance.
82.3% 3
Timeliness
• Proportion of samples received withinthe target period from collectionc
Number of samples received at thelaboratory within 14 days fromcollection / Number of samplesreceived
ISS database 73.2% 2
• Proportion of samples tested withinone week from receipt
Number of samples tested withintwo weeks from receipt / Number ofsamples tested
ISS database 87.3% 3
Representativeness
• Geographical coverage Number of provinces covered by theinfluenza sentinel surveillancenetwork / Total number of provincesof the country
Geographicdistribution ofsentinel sites.
20.0% 1
• Inclusion of all age groups Age distribution of ILI/SARI cases(median, minimum and maximum)
ISS database Med.: 4 Y 3
Min.: 0 Y
Max.: 97 Y
Flexibility
• Expansion of sentinel sites participatingto the ISSS since inception
Number of new sentinel sites sinceinception
Protocol 5 3
• Surveillance for pathogens otherthan influenza
Number of investigated pathogensother than influenza
Protocol 10 3
Abbreviations: ILI influenza-like-illness; SARI severe acute respiratory illness; CIF case investigation form; RNP RiboNucleic Protein; WHO World Health Organization;ISS influenza sentinel surveillanceaEach quantitative indicator was evaluated as the proportion (expressed as percentage) of the outcome of interest over the total (indicator value). A scale from 1to 3 was used to provide a score for each quantitative indicator as follows: < 60% (from the above calculation) scored 1 (weak performance); 60–79% scored 2(moderate performance); ≥80% scored 3 (good performance)bKey variables evaluated for completeness and consistency of data: site, age/date of birth, sex, date of consultation/admission, date of symptoms onset, date ofsample collection and signs and symptoms included in the case definitionscThe target period was 48 h from sites situated in Lusaka Province and 14 days from sites situated in Copperbelt Province
Simusika et al. BMC Health Services Research (2020) 20:35 Page 5 of 12

with available influenza results by the total number ofsamples collected and received by the laboratory. Subse-quently, similar to other influenza surveillance evalua-tions conducted in Africa, we used a scale from 1 to 3 toprovide a score for each quantitative indicator as follows:< 60% (as obtained in the example above) scored 1 (weakperformance); 60–79% scored 2 (moderate perform-ance); ≥80% scored 3 (good performance) [18–21]. Forindicators for which a proportion over a total could notbe obtained (qualitative indicators) a score was assignedbased on the same scale using expert consensus.Thereafter, the scores assigned to each indicator were
averaged for all indicators evaluated within each attri-bute to provide an overall score for each surveillance at-tribute assessed in this study. An overall score for thesurveillance system was obtained by averaging the scoresof all evaluated indicators as previously described [18–21]. All data generated by the surveillance system duringthe review period were included in the evaluation. Theanalysis was implemented using Stata version 14.2 (Sta-taCorp, College Station, Texas, USA).
Ethical approval and consent to participateThis surveillance evaluation was deemed non-researchby the Zambia-MoH and the US CDC. Consent to par-ticipate was voluntary and verbally obtained, becausethis was a non-research and the procedure was non-risks to client ethical clearance was deemed unnecessaryby the University of Zambia Biomedical Research EthicsCommittee.
ResultsSummary of influenza surveillance results during theevaluation periodFrom January 2011 to December 2017, 10,958 patientswere enrolled in the ISSS. Of these, 5111 (46.6%) and5847 (53.4%) had ILI and SARI, respectively. Influenzaresults were available for 10,212 of 10,958 (93.2%) en-rolled patients; 4776/5111 (93.5%) and 5436/5847(93.0%) among patients with ILI and SARI, respectively.Influenza viruses were detected in 894/10,212 (8.7%)specimens; in 601/4776 (12.6%) and 293/5436 (5.4%)specimens among patients with ILI and SARI, respect-ively. Of the 894 influenza-positive specimens, 86 (9.6%)were influenza A(H1N1)pdm09, 342 (38.2%) were influ-enza A(H3N2), 6 (0.7%) were influenza A not-subtypedand 459 (51.3%) were influenza B viruses. The weeklynumber of influenza-positive specimens is provided inFig. 1, panel B.
Questionnaire surveyThe questionnaire was completed by 43/44 (97.7%) sur-veillance staff at sentinel sites. Of these, 35 (81.4%) were
nurses, 5 (11.6%) were clinical officers, 2 (4.7%) wereparamedics and 1 (2.3%) was a laboratory technician.
Evaluation of the surveillance systemThe overall mean score for the ISSS in Zambia was 2.6(moderate to good performance) (Table 1).
Data quality and completenessDuring the evaluation period, of the seven data indica-tors, six had good performance and one had moderateperformance (Table 2). Approximately 70% of identifiedSARI cases were enrolled in the surveillance program,while the enrollment target was 100%. The enrollmenttarget for ILI cases was exceeded (140% of the target of5 cases per week and per facility). More than 90% of CIFwere accurately completed for key variables (includingsite, age/date of birth, sex, date of consultation/admis-sion, date of symptoms onset, date of sample collectionand signs and symptoms included in the case defini-tions) and more than 90% of samples collected had avail-able influenza results and a positive ribonucleic proteinresult (an indicator of presence of human mucosal cellsin the sample). The proportion of collected variables in-cluded in the WHO minimum data collection standardwas 82.3%. Information on the use of antivirals and thepresence of some underlying medical conditions werenot included in the patients’ CIFs. The mean score fordata quality and completeness was 2.9 (moderate togood performance) (Table 1).
TimelinessDuring the evaluation period, one timeliness indicatorhad good performance and one had moderate perform-ance (Table 2). Approximately 25% of samples were notreceived or tested within the expected time period.86.3% of the samples collected in Lusaka Province werereceived within the expected time period, whereas only67.3% of the samples collected in the Copperbelt Prov-ince met the expected timeline. No significant differencein the proportion of samples positive for influenza wasobserved between the sites situated in Lusaka (9.0% 650/7207) and Ndola (8.1%; 244/3005) (p = 0.1429). Themean score for data timeliness was 2.5 (moderate togood performance) (Table 1).
RepresentativenessDuring the evaluation period, one indicator had goodperformance and one had weak performance (Table 2).Age representativeness was strong, with patients en-rolled across all age groups. Geographic representative-ness was poor, with sentinel sites situated only in 2/10(20.0%) provinces. The mean score for representative-ness was 2.0 (moderate performance) (Table 1).
Simusika et al. BMC Health Services Research (2020) 20:35 Page 6 of 12

FlexibilityDuring the evaluation period, both indicators had goodperformance (Table 2). The ISSS was used as a platformto monitor the circulation of respiratory viruses otherthan influenza (even though only for two years). Themean score for flexibility was 3.0 (good performance)(Table 1).
SimplicityDuring the evaluation period, of the seven indicators, sixhad good performance and one (time of enrollment ofSARI/ILI cases) had moderate performance (Table 3).The six indicators used to assess the perception of sur-veillance personnel at sentinel sites to implement differ-ent surveillance activities were rated well by respondingpersonnel. Over 31% of staff, however, reported that sur-veillance procedures from the identification of cases tothe final packaging of samples took > 30min, showingonly moderate performance. The mean score for simpli-city was 2.8 (moderate to good performance) (Table 1).
AcceptabilityDuring the evaluation period, all four evaluated indica-tors had good performance (Table 3). More than 90% ofsurveillance staff was satisfied or very satisfied with thesurveillance reports or the feedback of laboratory results.Surveillance activities did not pose a heavy workload onsurveillance staff in addition to the required clinicalwork. The mean score for acceptability was 3.0 (goodperformance) (Table 1).
StabilityDuring the evaluation period, of the eight indicators, fivehad good performance and three had moderate perform-ance (Table 4). All surveillance sites provided samplesweekly during the evaluation period. The main aspectsthat affected stability were elevated frequencies of elec-tricity cuts and generator failures. Approximately 30% ofsurveillance staff did not receive annual refresher train-ing during the last year and approximately 30% of ex-pected weekly reports were not sent to the Zambia MoHwithin the expected time frame (one week from the endof the reported period). The mean score for stability was2.6 (moderate to good performance) (Table 1).
UtilityDuring the evaluation period, of the four indicators,three had good performance and one had moderate per-formance (Table 5). In terms of international utility theZambia ISSS reported regularly to the WHO FluNet,generated samples that were shared with the WHO col-laborating centers and contributed to regional studies. Interms of domestic utility, 4/5 (80.0%) key national objec-tives of the ISSS were met at the time of this evaluation.
The mean score for utility was 2.7 (moderate to goodperformance) (Table 1).
SustainabilityDuring the evaluation period, the two indicators hadpoor performance (Table 5). Only 17% of the ISSSbudget was provided by the Zambia MoH and theremaining by international agencies. The mean annualrunning cost of the system was approximately $310,000($105 per sample collected and tested in 2017). Whereas,a sustainability plan was drafted in 2015, the documentwas not finalized and implemented at the time of thisevaluation. The mean score for sustainability was 1.0(weak performance) (Table 1).
DiscussionWe evaluated the performance of the Zambia ISSS overa 7-year period, 3 years from its inception. Overall, basedon the evaluated indicators, the system performed satis-factorily with a mean system score of 2.6 (moderate togood performance). The system demonstrated its utilityaccording to its objectives by (i) monitoring the tem-poral trends of influenza virus circulation; (ii) monitor-ing the circulating influenza virus types and subtypesannually and enabling the detection of pandemic influ-enza A(H1N1)pdm09 in 2009 [3] and in subsequentyears, (iii) assessing the contribution of seasonal influ-enza viruses to mild (ILI) and severe (SARI) respiratoryillness; (iv) assessing the burden of influenza-associatedillness [14]; and (v) generating isolates to contribute tothe annual influenza vaccine formulation. Nonetheless,the ISSS was not able to identify groups at increased riskof influenza-associated severe illness (as the necessaryvariables were not collected in the CIF), one of the ob-jectives of the surveillance system. Strengths of the sys-tem included the quality of data generated, its flexibilityto monitor viral pathogens other than influenza viruses[24], its potential expandability, its stability over the re-view period, and its relatively low cost. Identified weak-nesses were poor geographic representativeness, lack oftimeliness in shipping samples from remote sites, andlow sustainability in the absence of external funds.While quality and completeness of collected key epi-
demiological and virological data was good overall, anunder-enrollment of SARI cases was noted. Many factorscould have affected site performance including low staffnumbers, high turnovers rates of staff as well as partici-pant refusals. It should be noted that nurses employedby the MoH and tasked with surveillance activities alsoprovided direct patient care. Having dedicated surveil-lance staff may increase enrollment rates. However, hir-ing new staff would decrease the sustainability of thesurveillance system.
Simusika et al. BMC Health Services Research (2020) 20:35 Page 7 of 12
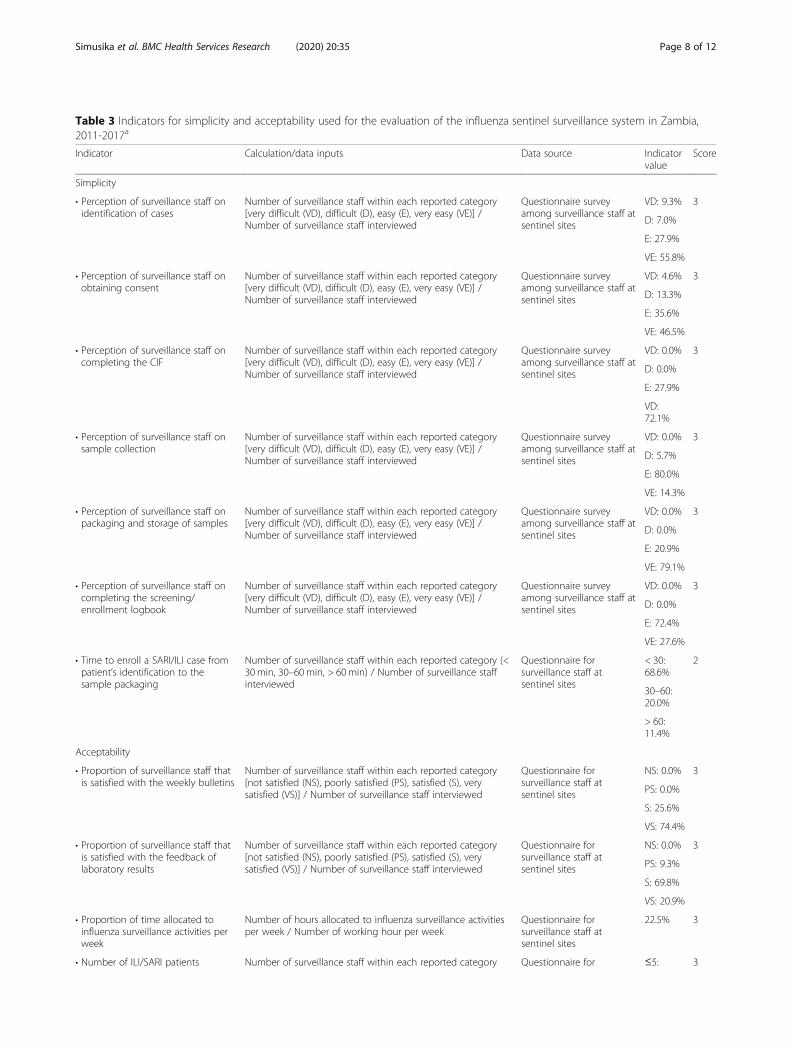
Table 3 Indicators for simplicity and acceptability used for the evaluation of the influenza sentinel surveillance system in Zambia,2011-2017a
Indicator Calculation/data inputs Data source Indicatorvalue
Score
Simplicity
• Perception of surveillance staff onidentification of cases
Number of surveillance staff within each reported category[very difficult (VD), difficult (D), easy (E), very easy (VE)] /Number of surveillance staff interviewed
Questionnaire surveyamong surveillance staff atsentinel sites
VD: 9.3% 3
D: 7.0%
E: 27.9%
VE: 55.8%
• Perception of surveillance staff onobtaining consent
Number of surveillance staff within each reported category[very difficult (VD), difficult (D), easy (E), very easy (VE)] /Number of surveillance staff interviewed
Questionnaire surveyamong surveillance staff atsentinel sites
VD: 4.6% 3
D: 13.3%
E: 35.6%
VE: 46.5%
• Perception of surveillance staff oncompleting the CIF
Number of surveillance staff within each reported category[very difficult (VD), difficult (D), easy (E), very easy (VE)] /Number of surveillance staff interviewed
Questionnaire surveyamong surveillance staff atsentinel sites
VD: 0.0% 3
D: 0.0%
E: 27.9%
VD:72.1%
• Perception of surveillance staff onsample collection
Number of surveillance staff within each reported category[very difficult (VD), difficult (D), easy (E), very easy (VE)] /Number of surveillance staff interviewed
Questionnaire surveyamong surveillance staff atsentinel sites
VD: 0.0% 3
D: 5.7%
E: 80.0%
VE: 14.3%
• Perception of surveillance staff onpackaging and storage of samples
Number of surveillance staff within each reported category[very difficult (VD), difficult (D), easy (E), very easy (VE)] /Number of surveillance staff interviewed
Questionnaire surveyamong surveillance staff atsentinel sites
VD: 0.0% 3
D: 0.0%
E: 20.9%
VE: 79.1%
• Perception of surveillance staff oncompleting the screening/enrollment logbook
Number of surveillance staff within each reported category[very difficult (VD), difficult (D), easy (E), very easy (VE)] /Number of surveillance staff interviewed
Questionnaire surveyamong surveillance staff atsentinel sites
VD: 0.0% 3
D: 0.0%
E: 72.4%
VE: 27.6%
• Time to enroll a SARI/ILI case frompatient’s identification to thesample packaging
Number of surveillance staff within each reported category (<30min, 30–60min, > 60min) / Number of surveillance staffinterviewed
Questionnaire forsurveillance staff atsentinel sites
< 30:68.6%
2
30–60:20.0%
> 60:11.4%
Acceptability
• Proportion of surveillance staff thatis satisfied with the weekly bulletins
Number of surveillance staff within each reported category[not satisfied (NS), poorly satisfied (PS), satisfied (S), verysatisfied (VS)] / Number of surveillance staff interviewed
Questionnaire forsurveillance staff atsentinel sites
NS: 0.0% 3
PS: 0.0%
S: 25.6%
VS: 74.4%
• Proportion of surveillance staff thatis satisfied with the feedback oflaboratory results
Number of surveillance staff within each reported category[not satisfied (NS), poorly satisfied (PS), satisfied (S), verysatisfied (VS)] / Number of surveillance staff interviewed
Questionnaire forsurveillance staff atsentinel sites
NS: 0.0% 3
PS: 9.3%
S: 69.8%
VS: 20.9%
• Proportion of time allocated toinfluenza surveillance activities perweek
Number of hours allocated to influenza surveillance activitiesper week / Number of working hour per week
Questionnaire forsurveillance staff atsentinel sites
22.5% 3
• Number of ILI/SARI patients Number of surveillance staff within each reported category Questionnaire for ≤5: 3
Simusika et al. BMC Health Services Research (2020) 20:35 Page 8 of 12

Table 3 Indicators for simplicity and acceptability used for the evaluation of the influenza sentinel surveillance system in Zambia,2011-2017a (Continued)
Indicator Calculation/data inputs Data source Indicatorvalue
Score
enrolled per day [≤5 patients (≤5), 6–10 patients (6–10), > 10 (> 10)] / Numberof surveillance staff interviewed
surveillance staff atsentinel sites
95.2%
6–10:3.2%
> 10:1.2%
Abbreviations: ILI influenza-like-illness; SARI severe acute respiratory illness; CIF Case Investigation FormaEach quantitative indicator was evaluated as the proportion (expressed as percentage) of the outcome of interest over the total (indicator value). A scale from 1to 3 was used to provide a score for each quantitative indicator as follows: < 60% (from the above calculation) scored 1 (weak performance); 60–79% scored 2(moderate performance); ≥80% scored 3 (good performance)
Table 4 Indicators for stability used for the evaluation of the influenza sentinel surveillance system in Zambia, 2011-2017a
Indicator Calculation/data inputs Data source Indicatorvalue
Score
Stability
• Frequency of lack of data collection forms Number of surveillance sites within each reported category[never (0), once per year (1), 2–3 times per year (2–3), ≥4times per year(≥4)] / Number of surveillance sites
Questionnaire forsurveillance staff atsentinel sites
0: 83.3% 3
1: 16.7%
2–3:0.0%
≥4: 0.0%
• Frequency of lack of sampling material Number of surveillance sites within each reported category[never (0), once per year (1), 2–3 times per year (2–3), ≥4times per year(≥4)] / Number of surveillance sites
Questionnaire forsurveillance staff atsentinel sites
0: 83.3% 3
1: 16.7%
2–3:0.0%
≥4: 0.0%
• Frequency at which a power failure,including the generator, occurred at thesurveillance sites
Number of surveillance sites within each reported category[never (N), seldom (S), often (O), regularly (R)] / Number ofsurveillance sites
Questionnaire forsurveillance staff atsentinel sites
N: 16.7% 2
S: 50.0%
O: 33.3%
R: 0.0%
• Proportion of sentinel sites with at leastone member of staff trained on sentinelsurveillance procedures
Number of sentinel sites with at least one trained member ofstaff / Number of surveillance sites
Questionnaire forsurveillance staff atsentinel sites
100.0% 3
• Proportion of sentinel surveillance staff evertrained on sentinel surveillance procedures
Number of surveillance staff ever trained / Number ofsurveillance staff
Questionnaire forsurveillance staff atsentinel sites
90.7% 3
• Proportion of sentinel surveillance stafftrained on sentinel surveillance proceduresduring the last one year
Number of surveillance staff during the last one year /Number of surveillance staff
Questionnaire forsurveillance staff atsentinel sites
69.7% 2
• Availability and use of standard operatingprocedures (SOPs) by surveillance staff
Number of surveillance staff with access and use of SOPs /Number of surveillance staff
Questionnaire forsurveillance staff atsentinel sites
97.7% 3
• Proportion of surveillance sites providingsamples weekly after 3 months frominception
Number of surveillance sites providing samples weekly/Number of surveillance sites
ISS database 100.0% 3
• Proportion of weekly surveillance reportssent to MoH
Number of surveillance reports sent to MoH / Number ofreporting weeks
Surveillance reports 71.4% 2
Abbreviations: ISS influenza sentinel surveillance; MoH Ministry of HealthaEach quantitative indicator was evaluated as the proportion (expressed as percentage) of the outcome of interest over the total (indicator value). A scale from 1to 3 was used to provide a score for each quantitative indicator as follows: < 60% (from the above calculation) scored 1 (weak performance); 60–79% scored 2(moderate performance); ≥80% scored 3 (good performance)
Simusika et al. BMC Health Services Research (2020) 20:35 Page 9 of 12

The surveillance system performed moderately interms of timeliness in transporting samples from thefield to the laboratory. Timeliness was mainly affectedby the delays experienced from sites located outsideLusaka. Conversely, when samples were received at thecentral laboratory the processing time was overall satis-factory. While timeliness of shipping of samples fromsites situated outside Lusaka Province could be im-proved by using couriers on a more regular basis thismay increase costs. Consideration should be given totimeliness of the system and its geographical representa-tiveness especially in the African setting where moreregular shipments of samples from areas distant from
central locations are not only affected by cost, but alsoby logistical constraints.The geographic representativeness of the system was
weak. Establishing additional surveillance sites in otherkey areas of the country could provide a better represen-tativeness of the circulating influenza viruses. However,it is unclear whether expanding the number of surveil-lance sites would improve the virological and epidemio-logical understanding of influenza in Zambia. In a studythat included surveillance data from 15 African coun-tries, the detection rate of influenza virus among SARIand ILI cases was similar across the participating coun-tries, suggesting that similarities of the burden of
Table 5 Indicators for utility and sustainability used for the evaluation of the influenza sentinel surveillance system in Zambia, 2011-2017a
Indicator Calculation/data inputs Data source Indicator value Score
Utility
International
• Proportion of weeks withdata reported to WHOFluNet
Number of weeks with datareported to WHO FluNet /Number of weeks during theevaluated period
Weekly FluNetsubmissions
98.4% 3
• Mean annual number ofsamples shared with WHOCollaborating Centers(WHO CC)
Number of samples/isolatesshared with WHO CC / Numberof years with samples shipped.
Shipment logsto WHO CCLondon
23 (range 14–33) shippedduring 2012 and 2014–2017
3
• Number of contributionsto influenza Regional/Global studies
Number of publications onRegional/Global studies withinfluenza data from Zambia
PubMed 2 [8,28] 2
Domestic
• Ability to assess importantinfluenza epidemiologicalfeatures/public healthoutcomes
• Temporal patters of influenzavirus circulation (Yes) [3]
Publicationsand reports
80.0%b 3
• Circulating influenza types/subtypes, including pandemicstrains (Yes) [3]
• Proportion of ILI/SARI illnessattributable to influenza virusinfection (Yes) [3]
• Risk factors for influenza-associated severe illness (No)
• Burden of influenza-associatedillness (Yes) [14]
Sustainability
• Proportion of the ISSScost covered by theZambia-MoH
Cost covered by the Zambia-MoH/ Total cost
Budget report 16.9% 1
• Availability andimplementation of asustainability plan
• Drafted (Yes) Sustainabilityplan
25.0%b 1
• Finalized (No)
• Approved (No)
• Implemented (No)
Abbreviations: MoH Ministry of HealthaEach quantitative indicator was evaluated as the proportion (expressed as percentage) of the outcome of interest over the total. A scale from 1 to 3 was used toprovide a score for each quantitative indicator as follows: < 60% (from the above calculation) scored 1 (weak performance); 60–79% scored 2 (moderateperformance); ≥80% scored 3 (good performance). For indicators for which a proportion over a total could not be obtained (qualitative indicators) a score wasassigned based on the same scale using expert consensusbIndicator value calculated by dividing the number of achieved outcome by the total number of outcome considered (i.e. 4/5 = 80.0% or 1/4 = 25.0%)
Simusika et al. BMC Health Services Research (2020) 20:35 Page 10 of 12

influenza-associated illness across different geographicalareas of the continent may be expected [15]. Increasingthe number of surveillance sites in Zambia should beconsidered in light of increased cost, logistical con-straints (e.g. regular supervision and transportation ofspecimens) and impact on laboratory testing capacityand potentially on data quality. Instead of expanding thegeographic coverage of the system, efforts could be tar-geted to improve timeliness of sample shipment and en-rollment of patients meeting the SARI case definition atthe existing sentinel sites as well as collecting more de-tailed epidemiological information on enrolled cases(e.g., relevant risk factors for influenza-associated severeillness and in-hospital outcomes that are recommendedby the WHO guidelines for global influenza surveillance,but are currently not fully captured by the system). Inparticular, the collection of additional information onunderlying medical conditions may enable the continu-ous monitoring of high risk groups for influenza-associated severe illness. This would also align theZambia ISSS to the minimum data collection require-ments suggested by WHO [6].The flexibility of the system was demonstrated by its
ability to investigate the viral etiology of pathogens otherthan influenza [24]. While the recruitment of dedicatedsurveillance officers may not be justifiable for a verticalinfluenza surveillance program it may be considered foran integrated multi-pathogen surveillance platform. Thiscould be potentially cost-beneficial for a sentinel surveil-lance system where a limited number of surveillance of-ficers may be needed in selected sentinel sites ascompared to national passive surveillance programs. In-tegrated and well-run multi-pathogen surveillance sys-tems, if adequately staffed may provide high quality andtimely epidemiological and virological data with a “mod-est” financial investment. The national burden of illnessattributable to specific pathogens can be estimated fromsentinel surveillance data through special studies asdemonstrated in Zambia and other African countries forinfluenza [10–16]. This would be particularly relevantfor policy makers if multiple pathogens are included soas to provide the relative burden associated with differ-ent etiological agents. Risk factors for influenza-associated severe illness (e.g. hospitalization or death)have also been assessed using sentinel surveillance sys-tems [23, 25–27] and this could be implemented also inZambia for influenza and other pathogens.The stability of the system was demonstrated by its abil-
ity to enroll and process samples every week of the reviewperiod. This may be related to the simplicity and accept-ability of the system and the availability and use of stand-ard operating procedures at sites. Nonetheless, tasking ofsurveillance staff with clinical and surveillance work mayhave affected the enrollment rate as previously discussed.
ConclusionIn conclusion, the system performed satisfactorily overrecent years. It contributed to the body of knowledge onthe burden of influenza [3, 14] and other respiratory vi-ruses [24] among common respiratory syndromes inZambia and globally through sharing of influenza data[8, 28] and virus isolates. Nonetheless, despite its moder-ate cost, the ISSS in Zambia is largely reliant on externalfunds and the acceptability of maintaining the surveil-lance system through national funds would requireevaluation. Improvement of the system would entail theimprovement of the timeliness of sample shipments, en-rollment of patients meeting the SARI case definitionand an increased geographical coverage; however, thelatter would increase costs and impose logistical con-straints. Furthermore, while the surveillance system isstable and able to identify circulating influenza strains,the data being generated is not fully utilized as Zambialacks guidelines on antivirals use and vaccination policyfor influenza. A better use of the available data, in asso-ciation with special studies, could be made to informand promote mitigation interventions.
Additional file
Additional file 1. QUESTIONNAIRE FOR THE SITE PROVIDER(S)
AbbreviationsCDC: Centers for Disease Control and Prevention; CIF: Case InvestigationForm; HA: Haemagglutination; HAI: Haemagglutination Inibition;hMPV: Human Metapneumovirus; ILI: Influenza-Like Illness; ISSS: InfluenzaSentinel Surveillance System; MoH: Ministry of Health; MS: Microsoft;NIC: National Influenza Center; PIV: Parainfluenza Virus; RSV: RespiratorySyncytial Virus; RT-PCR: Reverse Transcription Polymerase Chain Reaction;SARI: Severe Acute Respiratory Illness; WHO: World Health Organization
AcknowledgmentsWe thank all members involved in ILI and SARI surveillance for datacollection and their participation to the evaluation.
Author contributionsAll authors take responsibility for the integrity of the data and the accuracyof the data analysis. In addition, All Authors have read and approved themanuscript in its current state. Study concept and design: ST, LP, PS.Acquisition, analysis or interpretation of data: PS, ST, EC, QKM, MLM, IN, MM.Drafting of the manuscript: PS, ST, EC, MM. Critical revision of the manuscriptfor important intellectual content: ST, LP.
FundingThis work was supported by the Zambia Ministry of Health and the USCenters for Disease Control and Prevention (co-operative agreementnumber: NU511P000828–05-02). The Ministry of Health, provided surveillancepersonnel, Laboratory space, Reagents and equipment to perform tests andsites for sample data collection and personnel in drafting and analyzing ofthe manuscript.US CDC provided funds and support for reagents and surveillance sitesincluding technical support to analyze the data, training of key personnel onevaluation of surveillance systems and writing of the manuscript.
Availability of data and materialsAll data generated or analyzed during this study are included in thispublished article.
Simusika et al. BMC Health Services Research (2020) 20:35 Page 11 of 12

Ethical approval and consent to participateThis surveillance evaluation was deemed non-research by the Zambia-MoHand the US CDC.Consent to participate was voluntary and verbally obtained,because this was a non-research and the procedure was non-risks to clientethical clearance was deemed unnecessary by the University of Zambia Bio-medical Research Ethics Committee.
DisclaimerThe findings and conclusions in this report are those of the authors and donot necessarily represent the official position of the US Centers for DiseaseControl and Prevention, USA or the Zambia Ministry of Health.
Consent for publicationNot applicable.
Competing interestsAll authors declare that they have no commercial or other associations thatmay pose a conflict of interest.
Author details1National Influenza Center, Virology Laboratory, University Teaching Hospital,Lusaka, Zambia. 2Influenza Division, Centers for Disease Control andPrevention, Atlanta, GA, USA. 3Influenza Program, Centers for Disease Controland Prevention, Pretoria, South Africa. 4MassGenics, Duluth, GA, USA.
Received: 7 October 2019 Accepted: 30 December 2019
References1. Iuliano AD, Roguski KM, Muscatello DJ, et al. Estimates of global seasonal
influenza-associated mortality: a modelling study. Lancet. 2018;391(10127):1285–300.
2. Mizuta K, Oshitani H, Saijo M, et al. Epidemiology of influenza virusinfections in children with acute respiratory infections in Zambia. Ann TropPaediatr. 1997;17(2):115–9.
3. Theo A, Liwewe M, Ndumba I, et al. Influenza surveillance in Zambia, 2008-2009. JInfect Dis. 2012;206(Suppl 1):S173–7. https://doi.org/10.1093/infdis/jis599.
4. Buehler JW. Surveillance. In: Rothman KJ, Greenland S. Modernepidemiology, 2nd ed. Philadelphia, PA: Lippencott-Raven, 1998.
5. Germain RR, Westmoreland D, Amstrong G, et al. CDC. Guidalines forevaluating surveillance systems. MMVR; July 27,2001/50(RR13): 1-35.Available at https://www.cdc.gov/mmwr/preview/mmwrhtml/rr5013a1.htm.
6. WHO. WHO interim global epidemiological surveillance standards for influenza.WHO, 2012. Available at: http://www.who.int/influenza/resources/documents/influenza_surveillance_manual/en/. Accessed on 15 August 2018.
7. WHO. Protocol for the evaluation of epidemiological surveillance system.WHO/EMC/ DIS/97.2. 1997.
8. Radin JM, Katz MA, Tempia S, et al. Influenza surveillance in 15 countries inAfrica, 2006-2010. J Infect Dis. 2012;206(Suppl 1):S14–21.
9. McMorrow ML, Wemakoy EO, Tshilobo JK, et al. Severe acute respiratoryillness deaths in sub-Saharan Africa and the role of influenza: A case seriesfrom 8 countries. J Infect Dis. 2015;212(6):853–60. https://doi.org/10.1093/infdis/jiv100.
10. Ntiri M, McMorrow ML, Frimpong JA, et al. Incidence of medically attendedinfluenza among residents of Shai-Osudoku and Ningo-Prampram districts,Ghana, may 2013-April 2015. BMC Infect Dis. 2016;16(1):757.
11. Nyamusore J, Rukelibuga J, Mutagoma M, et al. The national burden ofinfluenza-associated severe acute respiratory illness hospitalization inRwanda, 2012-2014. Influenza Other Respir Viruses. 2018. https://doi.org/10.1111/irv.12494.
12. Tempia S, Walaza S, Moyes J, et al. The Effects of the Attributable Fractionand the Duration of Symptoms on Burden Estimates of Influenza-AssociatedRespiratory Illnesses in a High HIV-Prevalence Setting, South Africa, 2013-2015. Influenza Other Respir Viruses. 2018. https://doi.org/10.1111/irv.12529.
13. Dawa JA, Chaves SS, Nyawanda B, et al. National burden of hospitalized andnon-hospitalized influenza-assocaited severe acute respiratory illness inKenya, 2012-2014. Influenza Other Respir Viruses. 2018. https://doi.org/10.1111/irv.12488.
14. Theo A, Tempia S, Cohen AL, et al. The national burden of influenza-associated severe acute respiratory illness hospitalization in Zambia, 2011-2014. Influenza Other Respir Viruses. 2018. https://doi.org/10.1111/irv.12492.
15. Rabarison JH, Tempia S, Harimanana A, et al. Burden and Epidemiology ofInfluenza- and Respiratory Syncytial Virus-Associated Severe AcuteRespiratory Illness Hospitalization in Madagascar, 2011-2016. Influenza OtherRespir Viruses. 2018. https://doi.org/10.1111/irv.12607.
16. Babakazo P, Lubula L, Disasuani W, et al. The national and provincial burdenof medically attended influenza-associated influenza-like illness and severeacute respiratory illness in the Democratic Republic of Congo, 2013-2015.Influenza Other Respir Viruses. 2018. https://doi.org/10.1111/irv.12601.
17. Budgell E, Cohen AL, McAnerney J, et al. Evaluation of two influenzasurveillance systems in South Africa. PLoS One. 2015;10(3):e0120226.
18. Rakotoarisoa A, Randrianasolo L, Tempia S, et al. Evaluation of the influenzasentinel surveillance system in Madagascar, 2009-2014. Bull World HealthOrgan. 2017;95(5):375–81.
19. Nuvey FS, Edu-Quansah EP, Kuma GK, et al. Evaluation of the sentinelsurveillance system for influenza-like illnesses in the Greater Accra region,Ghana, 2018. PLoS One. 2019;14(3):e0213627. https://doi.org/10.1371/journal.pone.0213627.
20. Yazidi R, Aissi W, Bouguerra H, et al. Evaluation of the influenza-like illnesssurveillance system in Tunisia, 2012-2015. BMC Public Health. 2019;19(1):694.https://doi.org/10.1186/s12889-019-7035-3.
21. Babakazo P, Kabamba-Tshilobo J, Wemakoy EO, et al. Evaluation of theinfluenza sentinel surveillance system in the Democratic Republic of Congo,2012–2015. BMC Public Health. 2019;19(1652). https://doi.org/10.1186/s12889-019-8008-2.
22. Caselton D, Arunga G, Emukule G, et al Does the length of specimenstorage affect influenza testing results by real-time reverse transcription-polymerase chain reaction? an analysis of influenza surveillance specimens,2008 to 2010. Euro Surveill. 2014;19(36). pii: 20893.
23. Cohen C, Moyes J, Tempia S, et al. Mortality amongst Patients withInfluenza-Associated Severe Acute Respiratory Illness, South Africa, 2009-2013. PLoS One. 2015;10(3):e0118884. https://doi.org/10.1371/journal.pone.0118884.
24. Simusika P, Bateman AC, Theo A, et al. Identification of viral and bacterialpathogens from hospitalized children with severe acute respiratory illness inLusaka, Zambia, 2011-2012: a cross-sectional study. BMC Infect Dis. 2015;15:52. https://doi.org/10.1186/s12879-015-0779-1.
25. Abadom TR, Smith AD, Tempia S, et al. Risk factors associated withhospitalisation for influenza-associated severe acute respiratory illness inSouth Africa: A case-population study. Vaccine. 2016;34(46):5649–55. https://doi.org/10.1016/j.vaccine.2016.09.011.
26. Tempia S, Walaza S, Moyes J, et al. Risk Factors for Influenza-AssociatedSevere Acute Respiratory Illness Hospitalization in South Africa, 2012-2015.Open Forum Infect Dis. 2017;4(1):ofw262. https://doi.org/10.1093/ofid/ofw262.
27. Ho A, Aston SJ, Jary H, et al. Impact of Human Immunodeficiency Virus onthe Burden and Severity of Influenza Illness in Malawian Adults: AProspective Cohort and Parallel Case-Control Study. Clin Infect Dis. 2018;66(6):865–76. https://doi.org/10.1093/cid/cix903.
28. Lafond KE, Nair H, Rassoly MH, et al. Global role and burden of influenza inpediatric respiratory hospitalizations, 1982-2012: a systematic analysis. PLoSMed. 2016;13(3):e1001977. https://doi.org/10.1371/journal.pmed.1001977.
Publisher’s NoteSpringer Nature remains neutral with regard to jurisdictional claims inpublished maps and institutional affiliations.
Simusika et al. BMC Health Services Research (2020) 20:35 Page 12 of 12