an evaluation of utility system technical report · nrel report/project number: ... title: an...
TRANSCRIPT

A national laboratory of the U.S. Department of EnergyOffice of Energy Efficiency & Renewable Energy
National Renewable Energy Laboratory Innovation for Our Energy Future
An Evaluation of Utility System Impacts and Benefits of Optimally Dispatched Plug-In Hybrid Electric Vehicles P. Denholm and W. Short
Technical Report NREL/TP-620-40293 Revised October 2006
NREL is operated by Midwest Research Institute ● Battelle Contract No. DE-AC36-99-GO10337

National Renewable Energy Laboratory1617 Cole Boulevard, Golden, Colorado 80401-3393 303-275-3000 • www.nrel.gov
Operated for the U.S. Department of Energy Office of Energy Efficiency and Renewable Energy by Midwest Research Institute • Battelle
Contract No. DE-AC36-99-GO10337
Technical Report NREL/TP-620-40293 Published July 2006 Revised August 2006 Revised October 2006
An Evaluation of Utility System Impacts and Benefits of Optimally Dispatched Plug-In Hybrid Electric Vehicles P. Denholm and W. Short
Prepared under Task No. FC03.0120

NOTICE
This report was prepared as an account of work sponsored by an agency of the United States government. Neither the United States government nor any agency thereof, nor any of their employees, makes any warranty, express or implied, or assumes any legal liability or responsibility for the accuracy, completeness, or usefulness of any information, apparatus, product, or process disclosed, or represents that its use would not infringe privately owned rights. Reference herein to any specific commercial product, process, or service by trade name, trademark, manufacturer, or otherwise does not necessarily constitute or imply its endorsement, recommendation, or favoring by the United States government or any agency thereof. The views and opinions of authors expressed herein do not necessarily state or reflect those of the United States government or any agency thereof.
Available electronically at http://www.osti.gov/bridge
Available for a processing fee to U.S. Department of Energy and its contractors, in paper, from:
U.S. Department of Energy Office of Scientific and Technical Information P.O. Box 62 Oak Ridge, TN 37831-0062 phone: 865.576.8401 fax: 865.576.5728 email: mailto:[email protected]
Available for sale to the public, in paper, from: U.S. Department of Commerce National Technical Information Service 5285 Port Royal Road Springfield, VA 22161 phone: 800.553.6847 fax: 703.605.6900 email: [email protected] online ordering: http://www.ntis.gov/ordering.htm
Printed on paper containing at least 50% wastepaper, including 20% postconsumer waste

ERRATA SHEET NREL REPORT/PROJECT NUMBER: NREL/TP-620-40293
DOE NUMBER: None
TITLE: An Evaluation of Utility System Impacts and Benefits of Optimally Dispatched
Plug-In Hybrid Electric Vehicles
AUTHOR(S): P Denholm and W. Short
ORIGINAL PUBLICATION DATE: July 2006; Revised August 2006
DATE OF CORRECTIONS: October 2006
The following corrections were made to this report/document:
Page 1 (Abstract, line 15): Based on existing electricity demand and driving patterns, a 50% penetration of PHEVs would increase the per capita electricity demand by around 5-10%, depending on the region evaluated. Page 13: New Figure 5: Relationship Between PHEV Penetration and Per Capita Electricity Demand Related to PHEV Charging Page 16: New Figure 9: Increase in Total Electric Demand as a Function of PHEV Penetration Page 17: New Figure 10: Utility Load Factors with PHEV Charging Page 17: New Figure 11: Regional Increase in Utility System Annual Minimum Load with PHEV Charging Page 18: New Figure 12: Regional Decrease in Relative System Cycling with PHEV Charging

Table of Contents Abstract ............................................................................................................................... 1
1) Introduction .................................................................................................................... 2
2) Possible Impacts of PHEVs on the Existing Electric Power System ............................. 3
3) Analysis Methods Using the PHEV-load Tool............................................................... 6
3.1 Evaluated Regions .................................................................................................... 6
3.2 Vehicle Assumptions ................................................................................................ 7
3.3 Vehicle Charging ...................................................................................................... 9
3.4 Vehicle Discharge Capacity.................................................................................... 10
4) Results .......................................................................................................................... 12
4.1 Impacts of PHEV Charging. ................................................................................... 13
4.2 Potential PHEV Peaking Capacity.......................................................................... 19
5) Conclusions and Discussion ......................................................................................... 21
6) Future Work.................................................................................................................. 22
Appendix: Vehicle Capacity Credit Using IC Engine Run .............................................. 23
iii

Abstract Hybrid electric vehicles with the capability of being recharged from the grid may provide a significant decrease in oil consumption. These “plug-in” hybrids (PHEVs) will affect utility operations, adding additional electricity demand. Because many individual vehicles may be charged in the extended overnight period, and because the cost of wireless communication has decreased, there is a unique opportunity for utilities to directly control the charging of these vehicles at the precise times when normal electricity demand is at a minimum. We evaluated the effects of optimal PHEV charging, under the assumption that utilities will indirectly or directly control when charging takes place, providing consumers with the absolute lowest cost of driving energy. By using low-cost off-peak electricity, PHEVs owners could purchase the drive energy equivalent to a gallon of gasoline for under 75 cents, assuming current national average residential electricity prices. We evaluated six geographic regions in the United States and found that under cases where PHEVs derive 40% of their miles from electricity, penetrations up to 50% of the vehicle fleet require no new electric generation capacity under optimal dispatch rules. Based on existing electricity demand and driving patterns, a 50% penetration of PHEVs would increase the per capita electricity demand by around 5-10%, depending on the region evaluated. While increasing total electrical energy consumption (but without requiring additional generation capacity), the optimal dispatch of the additional PHEV demand would increase loading of baseload power plants built to meet the normal demand. This also would substantially decrease the daily “cycling” of power plants, both of which would translate into lower operational costs. We also considered the ability of PHEVs to discharge into the grid to replace conventional capacity that provides peaking and peak reserve capacity. While the ability of PHEVs to provide short-term ancillary services has been previously analyzed, their ability to provide “long-term” energy and capacity services on a regional basis is not as well understood. If utilities use conservative estimates for the availability of PHEVs, and require vehicles to provide continuous discharge for extended periods, then the effective planning capacity of an individual PHEV could be quite small (well under 1 kW). While it appears that PHEVs are much better suited for short-term ancillary services such as regulation and spinning reserve, a large fleet of PHEVs could possibly replace a moderate fraction (perhaps up to 25%) of conventional low-capacity factor (rarely used) generation used for periods of extreme demand or system emergencies. Overall, the ability to schedule both charging and very limited discharging of PHEVs could significantly increase power system utilization.
1

1) Introduction The “plug-in” hybrid electric vehicle is a potentially significant technology for reducing vehicle emissions and reliance on petroleum for transportation. As currently offered by several major auto manufacturers, conventional hybrid electric vehicles (HEVs) add a battery and electric motor to an internal combustion (IC) engine. This combination increases fuel economy by allowing the IC engine to operate more efficiently, shutting off the engine during stops, and recapturing otherwise discarded kinetic energy through regenerative braking. Though the overall vehicle efficiency is increased, all of the energy that HEVs use is still derived from petroleum. A “plug-in” or “pluggable” HEV (PHEV) uses the same technology, but it also features a larger battery and plug-in charger that allows electricity from the grid to replace a portion of the petroleum-fueled drive energy. PHEVs combine the benefits of HEVs and pure electric vehicles (EVs): They are less reliant on petroleum than conventional HEVs, and they are a more practical alternative to pure electric vehicles because they avoid the challenges presented by EVs’ battery-only operation (prohibitive cost, long charge times, and limited range.) A PHEV may also be designated by its effective “all-electric” range, such as PHEV-20, referring to a vehicle that may be driven 20 miles from its batteries. Beyond this range, the vehicle operates as a conventional “charge-sustaining” HEV. It should be noted that while the PHEV-20 nomenclature implies that the vehicle drives for the first 20 miles on electricity and then switches to gasoline, this clean switch from one mode of operation to the other is unlikely. More likely is “blended” operation where the electric motor supplies low-speed operation, supplemented by the IC engine at high speed. With this mode of operation, the maximum power draw on the batteries and electric drivetrain is reduced, and the size distribution between electric and IC power plants is more optimized. The use of plug-in hybrid technology results in substantial reduction in gasoline use. For many U.S. drivers, a PHEV-40 could reduce average gasoline consumption by 50% or more.1 As of 2006, relatively few PHEVs have been built, essentially as demonstration vehicles and prototypes. While no major manufacturer has yet produced PHEVs, a study by the Electric Power Research Institute (EPRI) found a significant potential market for PHEVs, depending on vehicle cost and the future cost of petroleum.2 The economic incentive for drivers to use electricity as fuel is the comparatively low cost. The electric equivalent of the “drive energy” in a gallon of gasoline delivering 25-30 miles in a typical midsized car is about 9-10 kWh, assuming a vehicle efficiency of 2.9 mile/kWh.3 The cost of this electricity using the U.S. average residential rate for 2003 (7.6 cents/kWh)4 is less than $1, and could be less than 50 cents when using off-peak power at preferential rates.
1 Electric Power Research Institute (2001). “Comparing the Benefits and Impact of Hybrid Electric Vehicle Options,” EPRI, Palo Alto CA, 10003496892. 2 Electric Power Research Institute, 2002. “Comparing the Benefits and Impacts of Hybrid Electric Vehicle Options for Compact Sedan and Sport Utility Vehicles,” EPRI, Palo Alto, Calif., 1006891 3 Electric Power Research Institute (2001). 4 U.S. Department of Energy (2005). Electric Power Annual 2004, DOE/EIA-0348(2003), Energy Information Administration, Washington, D.C.
2

Furthermore, several researchers have noted that by adding “vehicle to grid” (V2G) capability, where the vehicle can discharge as well as charge, PHEV owners may also receive substantial revenue by providing high-value electric system services such as regulation, spinning reserve, and peaking capacity.5,6
The use of PHEVs represents a significant potential shift in the use of electricity and the operation of electric power systems. Electrification of the transportation sector will create additional loads on generators and transmission and distribution (T&D) systems. Well-publicized failures of the electric grid have increased concerns regarding grid reliability and the need for additional transmission and generation capacity. Widespread acceptance of PHEVs may require assurance that this technology will neither result in decreased electric system reliability nor require massive new unsightly and unpopular infrastructure. Previous studies of pure electric vehicles (EVs) have demonstrated that existing capacity can meet the overnight charging loads of a modest penetration (up to 20%) of these vehicles.7 The emergence of commercially viable HEVs, and the re-emergence of realistic electric vehicles via PHEVs, warrants a new look at vehicle impacts on utility loads. The “new” capabilities of a modern PHEV fleet include almost ideal charging dispatch made possible by wireless communications and improvements in power electronics, and the possibility of V2G for peaking and reserve capacity. We present the results of a study where the electricity demand of a hypothetical fleet of PHEVs was added to actual recorded utility loads under an optimal charging strategy. The impact of the use of PHEVs for peaking generation and reserve capacity was also considered. The resulting daily and yearly generation and demand profiles were then examined to provide some basic insight into the potential grid impacts of PHEVs. 2) Possible Impacts of PHEVs on the Existing Electric Power System Electric power systems are designed to respond to instantaneous consumer demand, which constantly varies as a function of time of day and season, depending on the requirements for heat, light, and other services provided by electricity. Figure 1 shows three hourly demand curves from one Midwestern U.S. utility. Each curve illustrates seven days’ worth of data, from three different seasons in 2002.8 These curves illustrate the significant variation in electric demand, with the annual peak demand driven by air- conditioning requirements in late afternoons on hot summer days. On a daily basis, minimum demand occurs in the early morning, with the annual minimum generally occurring in the spring. 5 Kempton, W. and S. E. Letendre (1997). “Electric Vehicles as a New Power Source for Electric Utilities.” Transportation Research D 3: 157-175. 6 Kempton, W. and J. Tomic (2005). “Vehicle-to-grid power fundamentals: Calculating capacity and net revenue.” Journal of Power Sources 144(1): 268-279. 7 Ford, A. (1995). “The Impacts of Large-Scale Use of Electric Vehicles in Southern California.” Energy and Buildings, 22(3): 207-218. 8 Federal Energy Regulatory Commission. “Northern States Power Form 714 - Annual Electric Control and Planning Area Report,” http://www.ferc.gov/docs-filing/eforms/form-714/data.asp
3

0
0.1
0.2
0.3
0.4
0.5
0.6
0.7
0.8
0.9
1
0 24 48 72 96 120 144 168
Hour
Load
(% o
f Ann
ual P
eak
Load
)
Summer Maximum
Winter
Spring Minimum
Figure 1: Typical Hourly Electric Demand Patterns
The significant variation in daily and seasonal demand illustrated in Figure 1 creates significant burdens on the generating utility and also costs, which are ultimately passed on to consumers. These costs result from underutilized baseload power plants, large capacity requirements for peak demand, and demands of power plant cycling. The effective utilization of a utility’s power plant fleet can be illustrated in a load duration curve (LDC), created by reordering the hourly demand data from greatest to least demand for all 8760 hours in a year and illustrated in Figure 2. The load at any point may be expressed as a fraction of annual peak load, and any load above minimum represents power plants that are not fully utilized. The low-demand hours on the right side of the LDC generally occur during overnight hours and result in underutilized baseload plants. (Any decrease in a plant’s capacity factor results in an increase in the average price of electricity in order to recover the plant’s fixed costs.) The average capacity factor for U.S. power plants is about 60%, while well-run power plants can achieve capacity factors well above 90%.9
9 U.S. Department of Energy (2005).
4

0.0
0.2
0.4
0.6
0.8
1.0
1.2
0.000 0. 000. 00. 0.
Hours at Load
Load
(% o
f Pea
k)
200 4 60 800
Underutilized baseload capacity
Rarely used peaking capacity (20% of capacity
meets 1% of load)
Reserve capacity
0 2000 4000 6000 8000
Figure 2: Utility Load Duration Curve
The capacity requirements for peak load also add substantial costs to the electric power system. The far left side of the LDC illustrates the peak demand that occurs during a small number of hours of the year. This peak demand, generally associated with air-conditioning loads on hot days requires utilities to install large amounts of generation that is seldom used. Figure 2 illustrates this scenario: The top 20% of load-serving capacity effectively runs less than 5% of the time and provides less than 1% of the system’s electricity demand. The sharp “super peak” of the top 2% of demand hours requires the bulk of this peaking capacity – in this year about 13% of the capacity is used to meet load for less than 200 hours. In addition, utilities employ an additional peak reserve margin, which is typically an extra 10-20% of capacity over projected peak demand. This required reserve capacity ensures system reliability by serving as a contingency against system failures and any unexpected increase in peak demand. In addition to the fixed costs associated with underutilized capacity, the significant cycling that occurs on a daily basis creates additional costs for plants that actually do run. The large swings in daily demand requires utilities to start up and shut down plants at considerable cost, and the constantly varying loads often require generators to operate well below the “design point” of optimum efficiency.10 Power plant cycling also increases operation and maintenance requirements. We examined two general impacts that PHEVs had on the performance of electric power systems: increased demand from PHEV charging, and PHEV discharging for peaking capacity. PHEVs may function as a source of dispatchable demand that utilities can use to increase plant loading during low-demand periods, given that PHEV owners will
10 Lefton, S., Grimsrud, P., and P. Besuner (1997). “Cycling Fossil-Fired Units Proves Costly Business.” Electric Light & Power, 75(7): 19-20.
5

probably not care when their vehicles actually charge during an overnight period, as long as the vehicle is charged when needed in the morning. Utilities could “ramp up” vehicle charging in the late evening, with maximum charging occurring at normal system minimum. In this manner, utilities increase minimum load while substantially reducing power plant cycling during the charge period. In addition, PHEVs may provide a resource for meeting peak capacity requirements by discharging stored energy. While PHEVs will not themselves reduce midday loads, they could potentially be an economic alternative to conventional generators. PHEVs would have the advantage of being distributed around load centers, reducing burdens on T&D systems, making them a possible substitute for centralized peaking plants. Overall, optimally dispatched PHEVs could flatten electricity demand patterns, increase power plant utilization, and reduce overall system costs. In addition to the energy demands illustrated in Figures 1 and 2, utility systems also require short-term ancillary services such as frequency regulation and spinning reserves. These high-value services are an almost ideal application of PHEVs and may be an important source of value for PHEV owners. This application has been previously evaluated,11 and because the focus of this analysis is on bulk generation and capacity impacts, the use of PHEVs for ancillary services was not analyzed in this work. 3) Analysis Methods Using the PHEV-load Tool A “PHEV-load” tool was developed to examine the potential impacts of large-scale deployment of PHEVs on a given electric power system. The PHEV-load tool consists of several components: an hourly demand database to which PHEV loads are added, a set of vehicle parameters which establishes the performance of the PHEV fleet, and a demand dispatch algorithm which attempts to optimally charge and discharge the PHEV fleet. To maximize the usefulness of this study, we used data from several geographical regions, and evaluated a range of possible PHEV scenarios to enable sensitivity analysis to electricity load variation and market penetration. Each of the PHEV-load tool components and study assumptions are described in further detail in the following sections.
3.1 Evaluated Regions
To account for differences in electricity use and driving patterns, we evaluated six different geographical regions in the United States. Because the primary goal of the study was to evaluate impacts on electric power systems, each geographical region evaluated was a utility power control area or other region for which hourly electric load data is available. Table 1 lists the regions and corresponding utility control area. The average per capita electricity use for each region is assumed to be equivalent to the state average (total state
11 Kempton, W. and J. Tomic (2005).
6

electricity use12 divided by state population13). This assumption should be reasonably accurate because the chosen service territories are a large fraction of the entire state. The population served in the utility control area was estimated by dividing the annual electricity consumption in the region by the state average consumption.
Table 1: List of Regions Used for PHEV Analysis (year 2003 data)
Region (State)
Utility Control Area
Utility Share of State Demand
Per Capita Electricity Use
(MWh/person/yr)
Estimated Population
(million) Northwest (Oregon)
Portland Gas & Electric
44 12.68 1.56
Southwest (California)
Southern Cal. Edison
41 6.73 14.45
Central (Missouri)
Union Electric/ AMEREN
74 12.98 4.23
Southeast (Florida)
Florida Power & Light
50 12.79 8.47
North East (New York)
Consolidated Edison
40 7.5 7.7
Midwest (Minnesota)
Northern States Power/Xcel
69 12.46 3.47
3.2 Vehicle Assumptions
There is considerable uncertainty in the most economical size and configuration of marketable PHEVs.14 A PHEV represents a tradeoff between various components including the battery size (both energy and power), electric motor size, and IC engine size. The vehicle’s electric range is variable (PHEV-20, PHEV-40, etc.) and so is the fraction of drive energy derived from the battery while operating in blended mode at higher speeds. One previous study evaluated PHEVs with ranges from 20 to 60 miles,15 while the current goal of the Advanced Energy Initiative is a PHEV-40.16 At high penetration, it is likely that a variety of PHEV ranges will become available. The fraction of miles displaced by electricity for a specific PHEV size is also uncertain given the significant variation in driving habits and PHEV operational modes. Figure 3 provides two estimates of the potential miles displaced by electricity for a variety of PHEV ranges.17 We chose a base case where the overall PHEV fleet derives 40% of its miles
12 U.S. Department of Energy (2004). Electric Power Annual 2003, DOE/EIA-0348(2003), Energy Information Administration, Washington, D.C. 13 U.S. Census Bureau (2005). Annual Estimates of the Population for the United States and States, and for Puerto Rico: April 1, 2000 to July 1, 2005 (NST-EST2005-01) http://www.census.gov/popest/states/NST-ann-est.html 14 Markel, T.; O’Keefe, M.; Simpson, A.; Gonder, J.;Brooker A. (2005) “Plug-in HEV’s: A Near-term Option to Reduce Petroleum Consumption FY05 Milestone Report,” National Renewable Energy Laboratory, Golden, Colorado August, 2005 15 Electric Power Research Institute (2001). 16 National Economic Council (2006) “Advanced Energy Initiative,” via http://www.whitehouse.gov/stateoftheunion/2006/energy/ 17 Electric Power Research Institute (2001).
7

from electricity. Based on the values in Figure 3, this electric fraction represents a vehicle sized between a PHEV-20 and a PHEV-40.
0%
10%
20%
30%
40%
50%
60%
70%
80%
0 5 10 15 20 25 30 35 40 45 50 55 60
PHEV Electric Range (miles)
Frac
tion
of V
ehic
le M
iles
from
El
ectr
icity
Method 1 (MileageWeighted Probability)Method 2 (Utility Factor)
Figure 3: Fraction of PHEV Miles Derived from Electricity To calculate the impacts on utility loads, the PHEV characteristics and regional VMT assumptions were combined to derive a per capita electricity demand associated with PHEV charging. Table 2 provides our assumptions for the regional vehicle and PHEV charging characteristics. The regional VMTs and vehicle ownership data is derived from state-level transportation statistics.18,19 As stated previously, we assumed that 40% of all PHEV VMTs are derived from electricity. This value was multiplied by the average daily per- vehicle miles traveled in each of the six regions to derive a value for the average per PHEV daily “electric transportation” demand (miles driven electrically per day for the average PHEV). Finally, the average daily miles driven electrically is converted to PHEV electricity demand, using the assumed average vehicle efficiency of 0.34 kWh/mile (2.9 miles/kWh) .20
18 U.S. Department of Transportation (2004), Federal Highway Administration, Highway Statistics 2003 , Washington, D.C.: http://www.fhwa.dot.gov/policy/ohpi/hss/index.htm 19 U.S. Department of Transportation (2004), State Transportation Statistics 2004. http://www.bts.gov/publications/state_transportation_profiles/state_transportation_statistics_2004/ 20 Electric Power Research Institute (2001).
8
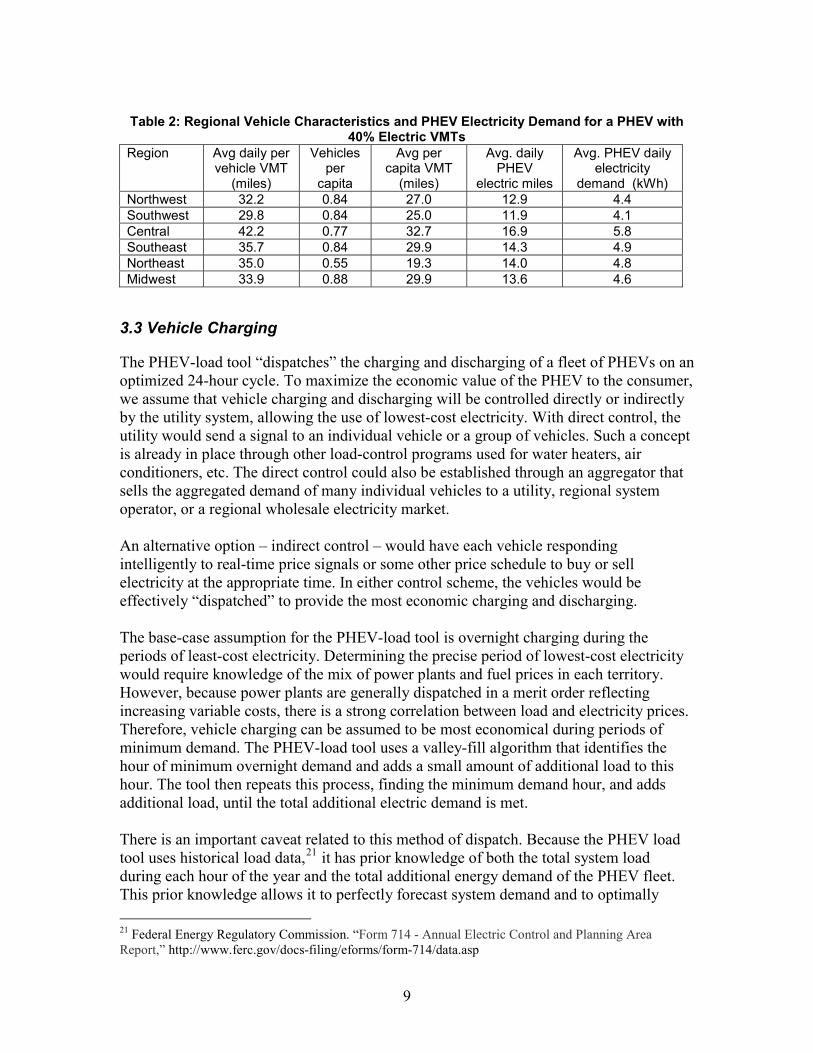
Table 2: Regional Vehicle Characteristics and PHEV Electricity Demand for a PHEV with
40% Electric VMTs Region Avg daily per
vehicle VMT (miles)
Vehicles per
capita
Avg per capita VMT
(miles)
Avg. daily PHEV
electric miles
Avg. PHEV daily electricity
demand (kWh) Northwest 32.2 0.84 27.0 12.9 4.4 Southwest 29.8 0.84 25.0 11.9 4.1 Central 42.2 0.77 32.7 16.9 5.8 Southeast 35.7 0.84 29.9 14.3 4.9 Northeast 35.0 0.55 19.3 14.0 4.8 Midwest 33.9 0.88 29.9 13.6 4.6
3.3 Vehicle Charging
The PHEV-load tool “dispatches” the charging and discharging of a fleet of PHEVs on an optimized 24-hour cycle. To maximize the economic value of the PHEV to the consumer, we assume that vehicle charging and discharging will be controlled directly or indirectly by the utility system, allowing the use of lowest-cost electricity. With direct control, the utility would send a signal to an individual vehicle or a group of vehicles. Such a concept is already in place through other load-control programs used for water heaters, air conditioners, etc. The direct control could also be established through an aggregator that sells the aggregated demand of many individual vehicles to a utility, regional system operator, or a regional wholesale electricity market. An alternative option – indirect control – would have each vehicle responding intelligently to real-time price signals or some other price schedule to buy or sell electricity at the appropriate time. In either control scheme, the vehicles would be effectively “dispatched” to provide the most economic charging and discharging. The base-case assumption for the PHEV-load tool is overnight charging during the periods of least-cost electricity. Determining the precise period of lowest-cost electricity would require knowledge of the mix of power plants and fuel prices in each territory. However, because power plants are generally dispatched in a merit order reflecting increasing variable costs, there is a strong correlation between load and electricity prices. Therefore, vehicle charging can be assumed to be most economical during periods of minimum demand. The PHEV-load tool uses a valley-fill algorithm that identifies the hour of minimum overnight demand and adds a small amount of additional load to this hour. The tool then repeats this process, finding the minimum demand hour, and adds additional load, until the total additional electric demand is met. There is an important caveat related to this method of dispatch. Because the PHEV load tool uses historical load data,21 it has prior knowledge of both the total system load during each hour of the year and the total additional energy demand of the PHEV fleet. This prior knowledge allows it to perfectly forecast system demand and to optimally 21 Federal Energy Regulatory Commission. “Form 714 - Annual Electric Control and Planning Area Report,” http://www.ferc.gov/docs-filing/eforms/form-714/data.asp
9

dispatch generators without error. Because utilities can generally predict short-term loads (less than 24 hours in advance) with a high degree of accuracy (often less than 5% error),22 we assume that this perfect forecasting assumption will not significantly impact our results.
3.4 Vehicle Discharge Capacity
For utilities to realize the potential benefits of PHEVs, it is important to establish the “dependable” capacity an aggregated number of vehicles could provide for peaking generation or reserves. Estimating the potential peaking capacity provided by PHEVs is somewhat challenging, given the important time-sensitive (how many cars are plugged in and when) nature of PHEV capacity. The power capacity of an individual PHEV is a function of many factors: the energy capacity of the battery, whether or not it is plugged in, the capacity of the plug circuit, the state of charge of the battery at the initiation of discharge, and the amount of time that vehicle discharge is required. For a reasonable number of vehicles deployed, each of these factors can be expressed as a distribution, or average, which may or may not vary over time. In our base-case analysis, we assume that the IC engine may not be turned on to provide electricity; however, this possibility is discussed in the Appendix. Battery Capacity: The size of the vehicle’s usable battery capacity depends on the electric range and the vehicle electric drive efficiency. Estimates of efficiencies for simulated vehicles range from 0.25 kWh/mile for compact vehicles to 0.42 kWh/mile for large SUVs (this assessment uses a fleet average of 0.34 miles/kWh or 2.9 miles/kWh). As a result, the usable battery capacity over this range of vehicles would be 5.0 kWh for a compact PHEV-20 to 14.4 kWh for a large SUV PHEV-40. We assumed a fleet average usable battery capacity of 10.2 kWh. PHEV plug-in factor: Data from the U.S. Department of Transportation23 indicates that only a small fraction of vehicles (fewer than 20%) are on the road at any one time. However, it is less clear what fraction of stationary vehicles are in places likely to be plugged in, including home, work, and other locations during times that a utility will require capacity “services” from PHEVs. The “capacity credit” (the amount of reliable electricity generation capacity available from a PHEV fleet) would likely be based largely on vehicle availability during peak periods.24 In most of the United States, peak demand occurs in late afternoons during summer weekdays. One previous PHEV assessment assumed very high plug-in factors (75%) resulting in part from financial incentives to individual PHEV owners.25 This would also likely require development of charging infrastructure at many places of work, or public parking facilities. 22 PJM (2006). “PJM System Operator Seminar Spring – 2005” http://www.pjm.com/services/training/downloads/20050607-seminar-state-pjm-system.pdf 23 U.S. Department of Transportation (2004), 2001 National Household Travel Survey at http://nhts.ornl.gov/2001/index.shtml 24 Milligan, M. (2002).”Modeling Utility_Scale Wind Power Plants, Part 2: Capacity Credit” NREL, TP-500-29701. 25 Kempton, W. and J. Tomic (2005).
10

Maximum circuit capacity: A PHEV could have an internal electric capacity that exceeds 100 kW.26 However, the capacity actually accessible to the grid for planning reserves will be limited by the grid connection. We assume that most PHEVs will be plugged into conventional residential and commercial electric circuits at 120V or 240V. At these voltages, the line capacity is the bottleneck on power flow to and from the grid. However, many customers (such as fleet owners) may choose to utilize much higher-capacity circuits for maximum economic benefits. The overall range of likely circuits is about 2 kW (120V @ 20A) to perhaps 20 kW (240V @ 100A).27,28 Discharge Time and Battery Capacity: To assign a usable capacity credit to a PHEV fleet (and have the PHEV fleet actually replace conventional peaking generation), the total discharge time requirements must be established. As indicated in Figure 1, typical afternoon peaks last 2-6 hours. However, peak reserve generators are also used to replace the output from failed generators or transmission lines. These contingencies can last considerably longer. We could find no clear guidelines on what a typical utility might expect in terms of continuous output needed for reliable planning capacity. However, PHEVs might be compared to other utility storage systems in terms of reliable capacity.29,30 If a vehicle cannot run the IC engine to provide electricity, a PHEV’s dependable capacity will be limited by battery capacity. The relationship between battery discharge time and reliable capacity for a plugged-in PHEV can be defined by Vehicle Capacity = The minimum of
Line capacity OR
Stored Battery energy / Discharge Time Required Figure 4 provides an example of this relationship for three vehicles: a compact PHEV-20, a full-size PHEV-40 SUV, and our assumed fleet average. Each curve represents the discharge capacity of a vehicle with a fully charged battery, when connected to a 9.6 kW circuit. (In all cases in this document, battery capacity is considered useful capacity, meaning the battery can be cycled over its “usable” capacity affecting useful life.) For short-term events (30 minutes or less), the vehicle is limited by the plug circuit capacity, but still provides significant per-vehicle capacity for operating reserve and other ancillary services. At an aggregated level, the capacity credit of a fleet would be derived by multiplying the per-vehicle capacity credit by the number of vehicles plugged in at a given time. 26 2006 Toyota Motor Sales, U.S.A., Inc. http://toyota.com/highlander/specs_hybrid.html 27 The continuous rating of a plug circuit is less than its peak capacity. 28 National Electric Code (1999). Section 210-23(a). 29 Utilities do provide capacity credit to pumped hydro storage systems (the only utility-scale energy storage system widely deployed), which typically have a full-rated discharge time of eight hours or more. 30 Denholm, Paul, and G.L. Kulcinski. (2004). ”Life-Cycle Energy Requirements and Greenhouse Gas Emissions from Large-Scale Energy Storage Systems,” Energy Conversion and Management. 45, 2153-2172.
11

0
1
2
3
4
5
6
7
8
9
10
0 2 4 6 8Discharge Time Required (Hours)
PHEV
Dis
char
ge C
apac
ity C
redi
t (k
W)
Large PHEV-40(14.4 kWh)
Assumed FleetAverage (10.2 kWh)Compact PHEV-20(5.0 kWh)
Figure 4: Capacity of a Fully-Charged PHEV as a Function of Discharge Time Required
4) Results The effects of PHEV charging and discharging were evaluated separately in each region, with a PHEV penetration of up to 50%. It will be some time before PHEVs penetrate the market. To avoid the need to pick a specific year to evaluate, and to maximize the usefulness of the study in considering sensitivities, a flexible PHEV penetration metric was developed. The penetration of PHEVs in this analysis is measured as a function of per capita electric transportation demand in each region. Also, electric power system impacts are measured in comparative terms, not as absolutes. This measurement system is described in more detail as follows. The impact of PHEVs can be measured by comparing the relative change in a utility system’s performance with and without PHEV loads. The actual PHEV load can be measured as a function of per capita electric transportation demand, based on the values in Table 2. This per capita electric transportation demand can then be added to the base per capita electricity demand, and the resulting impacts can be measured. The per capita PHEV electricity demand in this report is evaluated up to the point of a 50% penetration (50% of all vehicles are PHEVs). Figure 5 establishes the relationship between per capita daily PHEV electricity demand and PHEV penetration for the six evaluated regions.
12

0%
10%
20%
30%
40%
50%
0.0 0.5 1.0 1.5 2.0 2.5Per Capita PHEV Electricity Demand (kWh/person/day)
PHEV
Pen
etra
tion
(%)
NortheastSouthwestNorthwestMidwestSoutheastCentral
Figure 5: Relationship Between PHEV Penetration and Per Capita Electricity Demand
Related to PHEV Charging When applied to future scenarios, the relationship shown in Figure 5 is independent of population growth, because it evaluates the system on a per capita basis. However, it does assume the per capita electricity use and per capita VMTs remain constant over time. However, the relationship in Figure 5 can be shifted to evaluate the impacts of different growth rates or PHEV performance. For example, if the fleet average efficiency of PHEVs is 20% less than the stated assumption, the per capita electricity demand would increase by 20%, holding all other variables constant.
4.1 Impacts of PHEV Charging
Figure 6 illustrates the daily load profiles from Figure 1 with the added PHEV loads. The added PHEV loads represent a 50% penetration of PHEVs. In this case, the added optimized charging has both increased the minimum overnight load, and flattened the load during this time period. Comparing the daily demand peak and daily demand minimum in Figure 1 and Figure 6 illustrates the substantial reduction in cycling of the generation fleet.
13

0
0.1
0.2
0.3
0.4
0.5
0.6
0.7
0.8
0.9
1
0 24 48 72 96 120 144 168
Hour
Load
(% o
f Ann
ual P
eak
Load
)
Summer Maximum
Winter
Spring Minimum
Figure 6: Daily Demand with PHEVs at 50% Penetration (Midwestern Region)
To achieve the nearly flat loads in the overnight hours, the overall charging rate must vary considerably. Figure 7 indicates the PHEV fleet charging requirements for the same case.
0
0.05
0.1
0.15
0.2
0 24 48 72 96 120 144 168
Hour
Load
(% o
f Ann
ual P
eak
Load
)
Summer Maximum WinterSpring Minimum
Figure 7: PHEV System Load at 50% Penetration (Midwestern Region)
The per-vehicle peak charging rate varies somewhat based on the optimal charging window, which is generally shorter in the summer and longer in the spring. The system-wide peak charging rate occurs at the daily system minimum, typically around 4 a.m., and
14

requires a total capacity equal to between 10% and 20% of the system peak capacity. Preliminary driving-pattern data obtained by NREL indicates that this optimal peak charging rate at around 4 a.m. coincides well with vehicle availability (4 a.m. appears to be the time when the maximum number of vehicles are parked at home).31 On a per-vehicle basis, the peak charging rate in this scenario is well under 2 kW. As noted previously, the smallest common household circuit (120V, 20A) has a continuous rating of about 2 kW,32 which implies limited requirements for charging infrastructure. To achieve a flat overnight load and optimize overall charging at high PHEV penetration, we found some modification of our charging assumptions was necessary. During some days, low loads occur in the mid to late morning. If all vehicles must be fully charged by 8 a.m., we observed a drop-off in load after the morning charge requirement was met, resulting in a less than optimal dispatch. To increase the optimization, we allowed up to 20% of the total PHEV demand to be met by charging between 8 a.m. and 11 a.m. In practical terms, this would require some consumers to delay some charging until later in the morning. However, this also means that there is substantial opportunity for some early- to late-morning recharging for many commuters. Further analysis of consumer driving patterns may allow a more detailed analysis of potential benefits of midday charging. Figure 8 provides modified load duration curves for the Midwestern utility system with different levels of PHEV penetration. It is clear that the majority of PHEV charging energy is supplied by baseload units, and that there is a significant increase in the system minimum load. A very small amount of electricity is provided by intermediate load plants, mostly during summer nights when air-conditioning demand stays high until late in the evening as illustrated in Figure 1. However, in all systems even at 50% PHEV penetration, greater than 80% of the charging electricity is derived from units meeting the bottom two-thirds of the LDC. Perhaps even more important, there is no need for additional generation capacity, even at 50% PHEV penetration.
31 Markel, T.; O’Keefe, M.; Simpson, A.; Gonder, J.;Brooker A. (2005) 32 National Electric Code (1999).
15

0.3
0.4
0.5
0.6
0.7
0.8
0.9
1.0
0 2000 4000 6000 8000
Hours at Load
Load
(% o
f Pea
k)
50%30%10%No PHEVs
Additional load on baseload units
No additional load during peak demand
periods
Figure 8: Load Duration Curves With PHEV Charging (Midwestern Region)
The impacts on the electric power system can be quantified for each region. Figure 9 is the increase in total electricity demand as a function of PHEV penetration for each system. The difference in demand increase between systems is a function of base electricity demand and the per capital transportation demand. In systems with low per capita electricity use, such as California, adding PHEVs results in a proportionally larger increase in electricity demand.
0%
3%
5%
8%
10%
0 10 20 30 40 5
Penetration of PHEVs (%)
Incr
ease
in T
otal
Ele
ctric
ity D
eman
d
0
NortheastSouthwestCentralSoutheastMidwestNorthwest
Figure 9: Increase in Total Electric Demand as a Function of PHEV Penetration
Because the additional PHEV load does not require an increase in generation capacity, PHEVs will increase the system’s load factor (defined as the average load divided by
16

peak load). The normal load factors for the six regions ranged from 54% to 67%. The fractional increase in load is also equal to the fractional increase in utility load factor, illustrated in Figure 10.
50%
55%
60%
65%
70%
75%
0 10 20 30 40 50
Penetration of PHEVs (%)
Util
ity L
oad
Fact
or (%
)
NorthwestSoutheastMidwestNortheastSouthwestCentral
Figure 10: Utility Load Factors with PHEV Charging
Figure 11 illustrates the increase in minimum system load, which results from the increased overnight load demonstrated in Figure 6.
0%
10%
20%
30%
40%
50%
0 10 20 30 40 5Penetration of PHEVs (%)
Incr
ease
in M
inim
um L
oad
(%)
0
SoutheastNorthwestNortheastSouthwestCentralMidwest
Figure 11: Regional Increase in Utility System Annual Minimum Load with PHEV Charging
The shape of the curves in Figure 11 results largely from daily and seasonal demand patterns. An examination of Figure 1 indicates that the “valley” of overnight load widens
17

as the minimum load increases. This fact produces the decreasing slope in all cases in Figure 11. Ultimately, the addition of overnight load does not increase the minimum load, because the overnight valley is completely filled in one or more days of the year. This results in a new annual minimum load, typically occurring on a spring day with normally low demand. This can be observed in Figure 6, where the new minimum load occurs in the afternoon. The shape of Figure 11 is driven largely by our assumption that vehicles must be charged mostly in the overnight hours, with no charging allowed during the afternoon. In reality, some low-cost charging opportunities will be available during the day in low-demand seasons. This probably means even greater electrification of the transportation system, because some drivers will be able to partially or fully recharge after the morning commute without negative impacts on the system as a whole. As noted previously, optimal charging of a PHEV fleet will require greater understanding of driving patterns and the marginal cost of electricity on an hourly basis. The increased overnight minimum load substantially decreases power plant cycling, illustrated in Figure 12. In this case, we measure system cycling as the average difference between daily peak and daily minimum demand, normalized by the annual peak demand. This reduction in cycling will translate into decreased power plant start-up and operations and maintenance (O&M) costs.33
0%
5%
10%
15%
20%
25%
30%
35%
0 10 20 30 40 50
Penetration of PHEVs (%)
Aver
age
Daily
Cyc
ling
(% o
f Pea
k Lo
ad)
SoutheastNorthwestSouthwestMidwestNortheastCentral
Figure 12: Regional Decrease in Relative System Cycling with PHEV Charging
33 Lefton, S., Grimsrud, P., and P. Besuner (1997).
18
4.2 Potential PHEV Peaking Capacity
A number of previous studies have estimated the significant value of PHEVs in offering short-term ancillary services such as spinning and regulation reserve.34,35 By offering these services, PHEVs would free-up traditional capacity and improve system efficiency. These high-value services would probably be the “first” application of PHEV discharge capacity. Because previous studies have addressed in detail the significant value of PHEVs in providing regulation reserve, we only assess here their capacity to provide peaking power or peak reserve capacity. PHEVs would only replace traditional peaking capacity if the payment to the vehicle owner were less than what utilities would pay for a conventional generator (or if PHEVs offer other attributes superior to traditional capacity) and utilities could be assured of PHEV reliability and availability. Determining how much capacity PHEVs could economically replace would require knowledge of future electric power system costs. As an alternative to a cost-based analysis, we compared total PHEV capacity to the installed utility capacity with an effective capacity factor of 2%. This capacity roughly approximates the “super peak” capacity best suited for PHEVs, since it represents a significant fraction of installed utility capacity, but it is very rarely used.36 For the six cases evaluated, this represented from 10% to 16% of the effective load-serving capacity. An additional amount of capacity (equivalent to 10% or more of the load-serving capacity) represents the peak reserve capacity, which also could be replaced with PHEVs. As a result, we evaluated cases where the PHEV fleet potentially replaces up to about 25% of a utility system’s generation capacity. While representing a significant amount of generation capacity, these generators would be expected to run less that 200 hours per year, and provide well under 0.5% of the total energy demand. Figure 13 establishes a baseline comparison between the per-vehicle capacity requirements, PHEV penetration, and super-peak capacity replacement. This graph demonstrates the per-vehicle amount of capacity needed to replace 100% of the system’s combined super-peak capacity and peak reserve capacity as a function of PHEV penetration. (As mentioned previously, super-peak capacity is defined as capacity that effectively runs up to 2% of the time, with peak reserve capacity defined as equal to 10% of the capacity required at annual peak demand. This is equivalent to a peak reserve margin of 10%.)
34 Kempton, W. and S. E. Letendre (1997). 35 Kempton, W. and J. Tomic (2005). 36 There appears to be no industry-wide standard for the amount of load in the “peak” or “super peak” demand regions. For this analysis, we define the “super peak” as demand that requires capacity, which effectively runs less than 2% of the time (175 hours per year). As noted in Figure 2, much of the peaking capacity in a utility system is used to meet the sharp “super peak” demand occurring less than 200 hours per year.
19

0
2
4
6
8
10
0% 10% 20% 30% 40% 50%PHEV Penetration (%)
Per V
ehic
le C
apac
ity N
eede
d to
R
epla
ce S
uper
-Pea
k C
apac
ity
with
PH
EVs
(kW
/veh
icle
)
CentralNortheastMidwestSoutheastNorthwestSouthwest
Figure 13: PHEV Capacity Needed to Replace All Super-Peak and Peak Reserve Capacity
To provide an estimate of the range of individual PHEV capacity credits available to a PHEV, we established four cases, defined in Table 3.
Table 3: Effective Capacity of a PHEV
Vehicle Use Case 1 Case 2 Case 3 Case 4 % Reliably Plugged in at Planning Peak
40 40 50 60
Average Battery SOC at Planning Peak
40 40 50 50
Discharge Time Required for “Dependable” Capacity (hours)
8 6 6 4
Base Dependable Capacity (kW per PHEV)
0.20 0.27 0.43 0.77
The assumptions used in Table 3 result in a relatively low per-vehicle capacity. These assumptions are fairly conservative, in an attempt to capture the uncertainty utilities may apply to generators they do not own. However, as PHEVs penetrate the market, utilities may become more comfortable with “relying” on PHEVs to provide firm capacity, and increase the per-vehicle capacity used for planning purposes. Of particular importance will be establishing reliability criteria for electric power systems that rely, in part, on energy storage systems with limited continuous discharge. To provide some estimate of the total peaking and peak reserve capacity offered by a PHEV fleet, we combined the capacity requirements in Figure 13 with a potentially conservative estimate of individual PHEV capacity at 0.25 kW, slightly lower than Case 2 in Table 3. This estimate is provided in Figure 14, the fraction of this peaking capacity that PHEVs could serve as a function of PHEV penetration for each region.
20

0%
5%
10%
15%
20%
25%
30%
0% 10% 20% 30% 40% 50%
PHEV Penetration (%)
Frac
tion
of S
uper
-Pea
k C
apac
ity
Serv
ed b
y PH
EVs
(%)
SouthwestNorthwestSoutheastMidwestNortheastCentral
Figure 14: Fraction of Super-Peak and Peak Reserve Capacity Replaced by a PHEV Fleet
While Figure 14 provides an indication of the amount of capacity replaced by a fleet of PHEVs, further analysis will be required to determine the actual dispatch of the vehicles. 5) Conclusions and Discussion Based on results from the PHEV-load tool, we conclude that large-scale deployment of PHEVs will have limited, if any, negative impacts on the electric power system in terms of additional generation requirements. As demonstrated by utility system load duration curves, current electric power systems have large amounts of underutilized capacity. This excess capacity could potentially provide electricity to PHEVs provided the utilities have some control over when charging occurs. We did not evaluate system-wide effects of uncontrolled charging; however, we would anticipate significant negative impacts if this were allowed at a large scale. Typical summer peak for much of the United States occurs in the late afternoon (4-6 p.m.), and this time has a strong coincidence with the end of the daily work cycle, and possible beginning of an “uncontrolled” PHEV charge cycle. It is possible that the first generation of PHEVs will not have utility-controlled or “smart” charging, especially in areas where customers are on simple flat rates. While it is likely that utilities will quickly address this possibility, this issue adds even more incentive to create electricity pricing structures that actually reflect the marginal costs of electricity. The dispatchable load offered by PHEVs could increase the minimum system load, increase the utilization of baseload units, and decrease plant cycling all without increasing the need for new generation assets. It is assumed that if a utility can add load to existing generators, these “marginal” sales can be made at just the variable cost of fuel and O&M, which can be quite low. In this manner, the system benefits would (and probably should) go to PHEV owners. However, some of the benefits, such as decreased O&M from decreased cycling, might potentially be spread across all consumers. Additional study is required to assess the appropriate distribution of the economic
21

benefits of PHEVs in customer rate structures in regulated and deregulated electric power systems. It is more difficult to make general conclusions about the discharge benefits of PHEVs. While PHEVs are ideally suited for short-term ancillary services, their use for firm peaking capacity may be restricted by their limited battery capacity and uncertainty about availability. Utilities may be unwilling to replace traditional generation capacity with PHEVs, unless they can be assured of reliable availability over extended periods. However, even at relatively low per-vehicle capacity, moderate penetration of PHEVs could replace a substantial fraction of the capacity currently in place to meet system “super peak” and the peak reserve margin. This could facilitate the retirement of older peaking units with high emissions and low efficiency such as diesel generators and older gas, oil, and coal-fired steam plants. 6) Future Work This report provides an overview of possible utility system impacts of large-scale deployment of PHEVs. However, it does not quantify these possible financial benefits of improved utility system operation to the utility, ratepayers, or PHEV owners. Future analysis projects at NREL will include detailed modeling of a specific utility system under various scenarios of PHEV penetration. This analysis will quantify the financial benefits described above, examine implications for existing electricity rates, and potentially provide guidance for development of rate structures appropriate for PHEV owners. This analysis also does not evaluate various environmental impacts of PHEVs. PHEVs will reduce emissions from combustion of gasoline, and increase emissions from baseload electricity generation units. One previous analysis demonstrated positive net emissions impacts from PHEVs when charging electricity is derived from advanced, high-efficiency gas-fired generators.37 However, much of the off-peak capacity available for PHEVs in the United States is in existing coal-fired units.38 Future analysis at NREL will investigate emissions impacts of PHEVs where electricity is derived from a variety of current and future generation technologies. Another issue raised by potential large-scale deployment of PHEVs is the potential enabling of large-scale deployment of intermittent renewables such as solar and wind. We have performed a preliminary analysis of the synergism between distributed PHEV energy storage and intermittent renewables39 and will continue to analyze the possibility of reducing the use of fossil fuels for both the transportation and electric power sectors via the use of intermittent energy sources.
37 Electric Power Research Institute (2002). 38 Denholm, Paul, and T. Holloway. (2005). “Improved Accounting of Emissions from Utility Energy Storage System Operation,” Environmental Science and Technology. 39(23), 9016-9022. 39 Short, W. and P. Denholm (2006).”A Preliminary Assessment of Plug-in Hybrid Electric Vehicles on Wind Energy Markets,” NREL, TP-620-39729.
22

Appendix: Vehicle Capacity Credit Using IC Engine Run Given the limited battery capacity and potentially limited state of charge at demand peak, utilities would probably apply a relatively small capacity credit to individual vehicles. The limitation imposed by battery capacity can be partially eliminated by allowing the PHEV IC engine to run. Because most peaking generators are run for a very small number of hours per year, it may be acceptable for some fraction of vehicles to run their engines to provide firm capacity. Allowing a utility to remotely start and control privately owned vehicles raises many concerns that are not trivial and easily dismissed. Implementing this capability will require addressing safety issues, such as adequacy of ventilation in open parking garages and the need for potentially costly interlocks required to prevent vehicle operation in closed garages. Vehicle operation in enclosed garages raises issues of home and vehicle security, and the large amount of heat generated by the IC engine. The cooling systems of vehicles may have to be upgraded to reject the heat that would be produced while operating as a stationary generator, especially because the planning capacity of the vehicles would most likely be rated at their capacity on hot summer days. While these issues may not be insurmountable, they may restrict the availability of peak reserve capacity from IC engine operation. Using the base capacity values from Table 3, Figure A.1 illustrates how the average per-vehicle capacity credit increases as a function of the fraction of vehicles allowed to run their IC engines. This chart assumes that the continuous thermal limit of the IC engine is 5 kW.
0
0.2
0.4
0.6
0.8
1
1.2
1.4
0% 5% 10% 15% 20%Fraction of Vehicles that Can Run IC Engine
Per V
ehic
le C
apac
ity C
redi
t (kW
) Case 4Case 3Case 2Case 1
Figure A.1: PHEV Per-Vehicle Capacity Credit
Figure A.1 illustrates that IC engine run capability could substantially increase the system peaking capacity offered by PHEVs. However, additional analysis is required to evaluate
23

the economics and overall systems benefits. Of particular importance would be the hours of IC engine operation and the number of utility-initiated engine starts. Also, while it will require a detailed regional analysis, it is possible that using modern distributed gasoline IC engines located close to load centers could be cleaner than alternatives used for extreme peak and emergency conditions.
24

F1147-E(12/2004)
REPORT DOCUMENTATION PAGE Form Approved OMB No. 0704-0188
The public reporting burden for this collection of information is estimated to average 1 hour per response, including the time for reviewing instructions, searching existing data sources, gathering and maintaining the data needed, and completing and reviewing the collection of information. Send comments regarding this burden estimate or any other aspect of this collection of information, including suggestions for reducing the burden, to Department of Defense, Executive Services and Communications Directorate (0704-0188). Respondents should be aware that notwithstanding any other provision of law, no person shall be subject to any penalty for failing to comply with a collection of information if it does not display a currently valid OMB control number. PLEASE DO NOT RETURN YOUR FORM TO THE ABOVE ORGANIZATION. 1. REPORT DATE (DD-MM-YYYY)
Revised October 2006 2. REPORT TYPE
Technical Report 3. DATES COVERED (From - To)
5a. CONTRACT NUMBER
DE-AC36-99-GO10337
5b. GRANT NUMBER
4. TITLE AND SUBTITLE An Evaluation of Utility System Impacts and Benefits of Optimally Dispatched Plug-in Hybrid Electric Vehicles
5c. PROGRAM ELEMENT NUMBER
5d. PROJECT NUMBER NREL/TP-620-40293
5e. TASK NUMBER FC03.0120
6. AUTHOR(S) P. Denholm and W. Short
5f. WORK UNIT NUMBER
7. PERFORMING ORGANIZATION NAME(S) AND ADDRESS(ES) National Renewable Energy Laboratory 1617 Cole Blvd. Golden, CO 80401-3393
8. PERFORMING ORGANIZATION REPORT NUMBER NREL/TP-620-40293
10. SPONSOR/MONITOR'S ACRONYM(S) NREL
9. SPONSORING/MONITORING AGENCY NAME(S) AND ADDRESS(ES)
11. SPONSORING/MONITORING AGENCY REPORT NUMBER
12. DISTRIBUTION AVAILABILITY STATEMENT National Technical Information Service U.S. Department of Commerce 5285 Port Royal Road Springfield, VA 22161
13. SUPPLEMENTARY NOTES
14. ABSTRACT (Maximum 200 Words) Hybrid electric vehicles with the capability of being recharged from the grid may provide a significant decrease in oil consumption. These “plug-in” hybrids (PHEVs) will affect utility operations, adding additional electricity demand. Because many individual vehicles may be charged in the extended overnight period, and because the cost of wireless communication has decreased, there is a unique opportunity for utilities to directly control the charging of these vehicles at the precise times when normal electricity demand is at a minimum. This report evaluates the effects of optimal PHEV charging, under the assumption that utilities will indirectly or directly control when charging takes place, providing consumers with the absolute lowest cost of driving energy. By using low-cost off-peak electricity, PHEVs owners could purchase the drive energy equivalent to a gallon of gasoline for under 75 cents, assuming current national average residential electricity prices.
15. SUBJECT TERMS plug-in hybrid electric vehicle; PHEV; analysis; transportation; carbon emissions; energy; oil; gasoline; fuel; fuel-efficient vehicles; utilities; gasoline; electricity demand; PHEV charging; Walter Short; Paul Denholm.
16. SECURITY CLASSIFICATION OF: 19a. NAME OF RESPONSIBLE PERSON a. REPORT
Unclassified b. ABSTRACT Unclassified
c. THIS PAGE Unclassified
17. LIMITATION OF ABSTRACT
UL
18. NUMBER OF PAGES
19b. TELEPHONE NUMBER (Include area code)
Standard Form 298 (Rev. 8/98) Prescribed by ANSI Std. Z39.18