an event-driven language for cartographic modelling of
TRANSCRIPT

TECHNICAL REPORT
Report No. CS2011-02Date: May 2011
An Event-Driven Language forCartographic Modelling of Knowledgein Software DevelopmentOrganisations
Mark MicallefChristian Colombo
University of Malta
Department of Computer ScienceUniversity of MaltaMsida MSD 2080MALTA
Tel: +356-2340 2519Fax: +356-2132 0539http://www.cs.um.edu.mt


An Event-Driven Language forCartographic Modelling of Knowledge in
Software Development Organisations
Mark Micallef, Christian ColomboDepartment of Computer Science
University of MaltaMsida, Malta
{mark.micallef,christian.colombo}@um.edu.mt
Abstract: With software engineering now being considered afully-fledged knowledge industry in which the most valuable asset toan organisation is the knowledge held by its employees [BD08], highstaff turnover rates are becoming increasingly worrying. If softwareengineering organisations are to maintain their competitive edge,they need to ensure that their intellectual capital continues to growand is not lost as people move in and out of their employ.
In this paper, the authors present work involving the formali-sation of a language that enables organisations to create and analysemaps of their organisational knowledge. In a more elaborate versionof the traditional yellow-pages approach utilised in the cartographicschool of thought, the proposed language models various relation-ships between knowledge assets, uses an event-driven mechanismto determine who knows what within the organisation, and finallyprovides metrics for detecting three types of risk related to knowl-edge management in modern software engineering. A three monthevaluation of the language is also outlined and results discussed.
1 Introduction
Software engineering is now a fully-fledged knowledge industry. Even though prac-titioners have a systems-centric view of their day and think in terms of specifyingsystems, designing systems, coding systems and so on, they are in fact going to workeveryday to create, store, retrieve, transfer and apply knowledge. The authors ar-gue that what most people perceive as developers’ jobs (designing, coding, etc) is in
1

fact simply the application phase of an implicit knowledge management cycle. Mostsoftware development processes cater for knowledge management solely through cod-ification strategies, which tend to focus on generating documentation at the end ofeach development phase. This, coupled with high staff turnover rates and the ex-tensive role played by tacit knowledge in the industry, exposes software engineeringorganisations to knowledge risk.
Knowledge risk is defined as operational risk that is caused by a dependency on,loss of, unsuccessful intended or unintended transfer of knowledge assets and resultsin a lack of, or non-exclusivity of these assets [BM06]. When employees leave, com-panies lose not only human capital, but also accumulated knowledge [DH03]. As aresult, information technology firms are realising that their “whole business is prettymuch locked away in the minds of employees” [Kou03], yet this knowledge is rarelyshared, swapped, traced and fertilised to ensure that it remains, at least in part,with the firm when employees leave [DH03]. When an employee does hand in hernotice, managers usually spring to action, doing their best to capture her knowl-edge by means of knowledge transfer activities such as exit interviews [Bra98]. Atthis point however, such activities may be disruptive to other employees at best andtoo late to have any meaningful effect at worst. The work presented here seeks toaddress these issues based on insights from the cartographic school of thought [Ear01].
The cartographic school of thought is one of nine schools in knowledge managementidentified by Earl [Ear01]. The driving principle here is that of connectivity. That isto say, maximising the use of knowledge within the organisation by focusing on lead-ing knowledge seekers directly to the knowledge providers who can satisfy their needs.This is usually accomplished using a yellow-pages style directory and has been shownto be useful for allocating resources, searching for competence, identifying projectopportunities and upgrading skills [DDR05].
In this paper, the authors extend the yellow pages concept in order to realise anumber of benefits. Firstly, it would be useful for an organisation to model variousrelationships between its knowledge assets, thus paving the way for structural analysisof its knowledge landscape. Secondly, the proposed approach makes it possible to notonly model who knows what within the organisation but also how much they knowit when compared to their colleagues. This is achieved by means of an event-drivenmechanism which relates an employee’s involvement in the life cycle of a knowledgeasset to the likelihood of her ‘knowing’ the knowledge asset to some degree. Finally,as a result of the first two benefits, the proposed approach enables the definition ofmetrics that enable a company to detect the build up of three types knowledge risksand thus be able to take mitigating action when required.
2

This paper is organised as follows. In section 2, the basic concepts of knowledgemap creation are introduced, as well as an example which will be used as a runningexample throughout the paper. Section 3 introduces an event-based mechanism forkeeping knowledge maps representative of the knowledge landscape they model. Sec-tions 4 and 5 then go on to showcase the languages features when it comes to drawingconclusions about organisational knowledge and identifying knowledge risks. Finally,a three-month evaluation of the language is outlined and results discussed in section6.
2 Basic Concepts
Consider a typical software development organisation with a number of persons em-ployed, and a number of knowledge assets which the organisation has identified asbeing valuable to it. Persons are organised into teams and knowledge assets havevarious attributes. For example, an organisation has identified seven knowledge as-sets: Java, Smalltalk, OOP, SQL, JDBC, Serlvets, and WebDevelopment and em-ploys a single team of three people: Chris, Mary and Jane. The team members areknowledgeable of different topics and some persons are more expert than others onparticular topics. For example, whilst everyone knows Java, Chris is clearly far moreknowledgeable about it than Mary and Jane. Furthermore, knowledge assets are re-lated to each other: the use of Java and Smalltalk is dependent on OOP, similarlythe knowledge of JDBC depends on SQL; on the other hand, the knowledge of JDBCand Servlets is part of the knowledge of Java; and the knowledge of Servlets is relatedto WebDevelopment. This scenario is depicted in figure 1.
Please note that the convention for graphical representation is specified when rela-tionships are introduced in section 2.1.
In the following subsections, we formalise the concepts necessary to specify such ascenario. This paves the way for building knowledge maps which reflect organisations’knowledge landscapes, which in turn can be analysed for various types of knowledgerisks as discussed in section 5.
3

Figure 1: A graphical depiction of a scenario example.
2.1 Knowledge Assets
Knowledge assets are intangible firm-specific knowledge resources that are indispens-able to create value for firms [BM06], and as such form the basis of any attempt tocreate a knowledge map of an organisation. For the purposes of richer knowledgemodelling, it is desirable to model properties of knowledge assets. More specifically,we consider four properties of knowledge assets:
Category A property can fall under one of three categories: technical, business,or general. These categories are an adaptation of the those proposed by Ra-mal [RMA02] who proposed that software engineers know three categories ofknowledge: computer science, business and general. The authors felt that therenaming of the “Computer Science” category to “Technical” was required be-cause the term “Technical” knowledge provides an umbrella term for knowledgewhich may have otherwise been confusing given that computer science refers toa specific subset of topics in the academic world.
Visibility The second property of knowledge assets is visibility and refers to thewidely cited tacit and explicit knowledge taxonomy of knowledge [AL01][Duf99][Szu96][Tiw00].
Sociality Another property is the sociality property which classifies a knowledgeasset as either individual knowledge or social knowledge [Non94].
4

Operationality Finally, the language also models an operationality property whichclassifies a knowledge asset as declarative (know-about), procedural (know-how),causal (know-why), conditional (know-if) or relational (know-with)[NNI98][Zac98].
In summary and more formally, we define four corresponding types: CAT, VIS, SOC,and OPR as follows:
CATdef= {technical, business, general, undefined}
VISdef= {tacit, explicit, undefined}
SOCdef= {individual, social, undefined}
OPRdef= {declarative, procedural, causal,
conditional, relational, undefined}
Given a type K of knowledge assets, we assign an attribute of each of the above typesthrough the following four total functions:
category : K −→ CATvisibility : K −→ VISsociality : K −→ SOC
operationality : K −→ OPR
Further to assigning attribute to knowledge assets, we relate knowledge assets to eachother through the following four kinds of relationships of type P(K ×K):
Related - A related relationship signifies that the two knowledge assets are related insome way. For example, in the example provided at the beginning of section 2,the servlets knowledge asset and web development knowledge asset are related.This does not imply that one cannot exist without the other, but merely thatif a person is knowledgeable about one asset, there is a likelihood that sheis knowledgeable about the second. This relationship is the weakest form ofrelationship between two knowledge assets in the proposed model and is denoted
by the symmetric relation ←related−−−→. In graphical depictions of knowledge maps,the convention is adapted that two related knowledge assets are linked togetherby a dashed edge.
Dependency - One knowledge asset ka is said to be dependent on a second knowl-edge asset kb if in order to learn ka, one first has to learn kb. A typical examplefrom the knowledge map depicted in figure 1 is “java depends on oop”. That isto say that before one can effectively use the Java programming language, onemust understand the concepts of object oriented programming. We denote this
5

relation bydeps on−−−→. Note that
deps on−−−→ is antisymmetric, i.e. if an assets ka dependson kb, then kb cannot depend on ka. In graphical representations of knowledge
maps, the convention is being adapted that kadeps on−−−→ kb is represented by a
continuous directed edge between ka and kb with a solid arrowhead.
Composition - A knowledge asset kb is said to be partially composed of anotherknowledge asset ka when ka represents a subset of knowledge represented by
kb. This relation, which is also antisymmetric, is denoted bypart of−−−→. Note that
part of−−−→⊆ deps on−−−→, i.e. if an asset ka is a part of kb, then ka depends on kb. A typical
example is provided in figure 1 whereby servletspart of−−−→ java and jdbc
part of−−−→ java.In graphical representations of knowledge maps, the convention is being adapted
that kapart of−−−→ kb is represented by a continuous directed edge between ka and kb
with a hollow arrowhead.
Having outlined the attributes of, and the relationships between knowledge assets,we next define the relationship between people and knowledge assets.
2.2 People and Knowledge
Our interest in reasoning about knowledge assets is to be able to reason about whatpeople in an organisation know. Thus we relate people to knowledge assets by assign-ing a magnitude relative to how much the person knows that knowledge asset. More
formally let P be the type representing people in the organisation, the relationknows−−→
of type P × K × N is a set of triples representing a person, a knowledge asset anda magnitude. To facilitate reasoning about people, we also define a set T of teamswhereby each team is a subset of people, T ⊆ PP .
Finally, we define the whole scenario in terms of a graph structure as follows:
Definition 1 The graph G, representing the knowledge landscape, is a triple (V, L,E)where: (i) a set of vertices, V , made up of persons and knowledge assets, V = P ∪K;(ii) a set of labels, L, made up of natural numbers and L′ = {related , deps on, part of },L = N ∪ L′; and iii a set of edges, E, a subset of V × L× V .
Given relations, ←related−−−→,deps on−−−→,
part of−−−→, andknows−−→, defined over knowledge assets K and
persons P , we can derive the corresponding graph edges as follows:
Edef= {(ka, related , kb) : V × L′ × V | (ka, kb) ∈←
related−−−→}∪ {(ka, deps on, kb) : V × L′ × V | (ka, kb) ∈
deps on−−−→}∪ {(ka, part of , kb) : V × L′ × V | (ka, kb) ∈
part of−−−→}∪ {(p, n, k) : P × N× V | (p, k, n) ∈ knows−−→}
6

As abbreviation we use vlabel−−→ v′ for (v, label, v′) ∈ E.
Example 1 Referring back to the example given at the beginning of section 2 anddepicted in figure 1, we now give the formal definition of the knowledge landscape, g,by instantiating the graph structure we have just defined:
Kdef= {Java, Smalltalk, OOP, SQL,
JDBC, Serlvets, WebDevelopment}P
def= {Chris, Jane, Mary}
Edef= {Servlets
related−−−→WebDevelopment,
WebDevelopmentrelated−−−→ Servlets, JDBC
part of−−−→ Java,
Javadeps on−−−→ OOP, Smalltalk
deps on−−−→ OOP,
JDBCdeps on−−−→ SQL,Mary
1−→ Servlets,
Mary3−→ Java,Chris
45−→ Java,
Jane3−→ Java, Jane
1−→ JDBC}g
def= (P ∪K,L,E)
One can note that the example defines certain knowledge relationships and their mag-nitudes explicitly. This is indeed useful when one first starts building a knowledgemap. However, it is desirable for knowledge relationships to be created and adjustedautomatically over time based on some mechanism. This is the subject of section 3.
3 Maintaining the Knowledge Landscape
Knowledge is never static in an organisation. People learn new knowledge and forgetother knowledge, other people join and leave the organisation bringing/taking knowl-edge with them, and so on. Therefore it is important to model such changes so thatthe knowledge landscape remains up to date and representative of the organisation’sknowledge landscape. We model such changes in terms of events. For example, if anevent is modelled whereby a person p is applying a knowledge asset ka over a periodof time, then it can be inferred that the longer the period of time over which p applieska, the more p knows ka. Conversely, if there are no events in the model which linkp to a second knowledge asset kb, then it can be inferred that p does not know kb.
The events we consider here fall under one of three categories: Asset-Changing Events,
7

Relationship-Changing Events, and Time Events. In the following subsections, we in-troduce the different event types and explain the changes that occur to the underlyingknowledge map upon the triggering of an event. To this end, we define a functionProg, of type (G×Events)→ G, which takes a graph and an event (the type Eventsis defined to be the union of the events defined below) and returns a modified graph.This new graph represents the organisation’s updated knowledge landscape.
3.1 Asset-Changing Events
Resource events deal with the changes in the personnel and knowledge assets of theorganisation. For simplicity we parametrise events over persons and knowledge assets,virtually having an event for each possible person/knowledge asset.
• Upon a person p joining the organisation, we simply add a vertex to the graph:Prog((V, L,E), p left org(p))
def= (V ∪ {p}, L, E)
• Upon a person p leaving the organisation, we simply remove the vertex fromthe graph and remove the edges concerned:Prog((V, L,E), p left org(p))
def= (V \{p}, L, {(v, l, v′) ∈ E | v 6= p ∧ v′ 6= p})
• When a knowledge asset k is identified, a vertex is added to the graph:Prog((V, L,E), k ident(k))
def= (V ∪ {k}, L, E)
• When a knowledge asset k is discarded, the vertex and the edges concerned areremoved:Prog((V, L,E), k disc(k))
def= (V \{k}, L, {(v, l, v′) ∈ E | v 6= k ∧ v′ 6= k})
3.2 Relationship-Changing Events
Several researchers within the knowledge-based perspective of the firm have come tosee organisations as knowledge systems consisting of a set of socially enacted knowl-edge processes[?][?]. Much in the same way that software systems have a life cycleor development process, so do knowledge assets. Although various, more detaileddelineations of knowledge processes exist, these can all be generalised to four primaryelements: (i) knowledge creation, (ii) knowledee storage/retrieval, (iii) knowledgetransfer, and (iv) knowledge application [?][?][?][?]. When these processes are en-acted, the organisation’s knowledge landscape changes and peoples’ knowledge ofparticular knowledge assets can grow or shrink. The events in this section are thusmodelled on these four basic knowledge processes.
8

A considerable challenge here is the calculation of how much to influence the mag-nitude of individual knowledge relationships based on some event. It is arguablyimpossible to model learning and forgetting with a simple formula and achieve 100%accuracy. The amount one learns or forgets depends on a number of factors such asthe individual’s age, background and cognitive ability. For this reason, the languageoutsources these calculations to an oracle. This provides us with the ability to plugin oracles based on the organisation’s context and/or the state of understanding ofhuman learning (and forgetting) over time.
• When knowledge is created, the likelihood is that the person p who createsknowledge about knowledge asset k has increased his knowledge about k. Thusthe magnitude of the relationship between p and k increases and a relationshipis created if it does not already exist. Note the use of oracle-decided m (of typeN) which signifies the new magnitude of the relationship.
Prog((V, L,E), create(p,k,m))def= (V, L,E ′ ∪ {p,m, k})
where E ′ = {(v, l, v′) ∈ E | v 6= p ∧ v′ 6= k}.
• Similarly, when knowledge about a knowledge asset k is stored, retrieved, trans-ferred of applied, the people involved in those events gain more knowledge aboutk. Please note that we are splitting knowledge transfer events into two such thatthe “giving” and “receiving” ends of a knowledge transfer activity are modelledas separate events. This is mathematically more elegant and also facilitates themodelling of one-to-many and many-to-many transfer activities. Therefore thedefinitions of Prog for events store(p,k,δ), retrieve(p,k,δ), apply(p,k,δ), given(p,k,δ), andrecvd(p,k,δ) are all identical and are defined as follows (we use the event store(p,k,δ)
as an example):
Prog((V, L,E), store(p,k,δ))def= (V, L,E ′)
whereE ′ = {(p, l, k) ∈ E • (v, l + δ, v′)}∪ {(v, l, v′) ∈ E | v 6= p ∨ v′ 6= k • (v, l, v′)}
• The authors also propose the modelling of events whereby existing knowledgeis modified. This is perceived as being important for two reasons. Firstly,since the knowledge map clearly shows who knows a particular knowledge asset,this information can be used to notify all knowers when it changes. Also, thefact that knowledge has been modified is likely to result in an increase in theknowledge of the person who modified it but also a decrease in the knowledge ofall other persons who knew the knowledge asset before it was modified. Thus,the modification event is parametrised over a person p, a knowledge asset k,
9

an upward change δ and a downward change δ′: Prog((V, L,E), mod(p,k,δ,δ′))def=
(V, L,E ′)whereE ′ = {(p, l, k) ∈ E • (v, l + δ, v′)}∪ {(p′, l, k) ∈ E | p′ ∈ P • (v,max(0, l − δ′), v′)}∪ {(v, l, v′) ∈ E | v /∈ P}
3.3 Time Events
Knowledge decreases over time if not used. Thus, to keep the graph realistic, wepropose a time event which decreases all the knowledge magnitudes as follows:
Prog((V, L,E), time(δ′))def= (V, L,E ′)
whereE ′ = {(v, l, v′) ∈ E | v ∈ P ∧ v′ ∈ K • (v,max(0, l − δ′), v′)}∪ {(v, l, v′) ∈ E | v /∈ P}
3.4 Bringing it all Together
Starting from an initial graph g1, which may either be the empty graph (∅, L, ∅) oran initialised graph (V, L,E), one can apply a number of events through the functionProg to keep the graph updated. Each application of Prog would then result in a new
version of the graph g2, g3, . . .. By representing Prog(gi, ev) = gi+1 as giev−→ gi+1, we
get the following:
g1ev1−−→ g2
ev2−−→ g3 · · ·evn−−→ gn+1
Example 2 Building on example 1, consider a scenario whereby on the followingevents occur: (i) Mary reads a book about Smalltalk and considers herself knowledge-able on the subject, (ii) Mary applies her knowledge of Smalltalk for 5 days, (iii) Maryteaches Chris about Smalltalk. Assuming g is a graph representing the knowledge mapfrom example 1, the language can be used to model these events as follows:
10

gcreate(mary,smalltalk,1)−−−−−−−−−−−−−→ g1
apply(mary,smalltalk,1)−−−−−−−−−−−−→ g2
g2time(0)−−−−→ g3
apply(mary,smalltalk,1)−−−−−−−−−−−−→ g4
g4time(0)−−−−→ g5
apply(mary,smalltalk,1)−−−−−−−−−−−−→ g6
g6time(0)−−−−→ g7
apply(mary,smalltalk,1)−−−−−−−−−−−−→ g8
g8time(0)−−−−→ g9
apply(mary,smalltalk,1)−−−−−−−−−−−−→ g10
g10time(0)−−−−→ g11
given(mary,smalltalk,1)−−−−−−−−−−−−→ g11
g11recvd(chris,smalltalk,1)−−−−−−−−−−−−→ g12
In the name of simplicity, this example assumes that the oracle being utilised alwaysincreases knowledge relationship magnitudes by 1 and time has no negative affect onknowledge relationships in the short timeframe of 5 days being considered here. Atthis point, the graph g12 is an update version of the original graph g such that it hasbeen updated relevant knowledge relationships as depicted in in figure 2.
Figure 2: The resulting graph after events from example 2 have been logged.
One can note that Mary now knows Smalltalk with a magnitude of 8 whilst Christ
11

knows Smalltalk with a magnitude of 2. Mary’s knowledge comes from reading abook (creating knowledge), applying her newly acquired knowledge for 5 days andtransferring it to Chris. Chris on the other hand, only interacted with Smalltalkduring the knowledge transfer activity. Hence his knowledge is considerably less thanMary’s.
4 Cartographic Queries
Much in the same way that the traditional yellow-pages style knowledge maps canbe used for allocating resources, searching for competence, identifying project oppor-tunities and upgrading skills, so can the language presented in this paper. However,since the technique presented here maintains knowledge relationship magnitudes, itallows for a number of interesting queries. In this section, a number of cartographicqueries which operate on knowledge maps are outlined. Please note that due to lengthrestrictions, it is impractical to give a mathematical definition of these functions here.Consequently, in this section name a number of functions and describe their purposebut will not provide a mathematical definition.
knows is a function which given a graph g, a person p and a knowledge asset k,
returns the magnitude of pknows−−→ k in the context of g. This is a simple query
function which is utilised in the definition of other functions and the metricspresented in section 5.
who knows is a function which given a graph and a knowledge asset, returns anordered tuple of persons who know the knowledge asset. The tuple is sorted indescending order of the magnitude of the knowledge relationships. This queryenables organisations to analyse their knowledge of particular assets and canthus prove useful in project sourcing.
knows what is a function which given a graph and a person, returns an ordered tupleof knowledge assets which the person knows. The tuple is sorted in descendingorder of how much the person knows the asset. This query is useful for teamformation and planning of training for individual staff members.
experts is a function which given a graph and a knowledge asset, returns an orderedlist of people whose knowledge of the asset is statistically much stronger thanthat of their colleagues and can thus be considered to be the experts on thetopic. This list is sorted in descending order of knowledge magnitude. Thisquery is similar to the who knows query but since it only returns people who
12

are statistically considered to be experts would prove more useful when theexpertise of such people is being sought.
person similarity is a function that given a graph g, a person p and a set of knowl-edge assets Ka, returns an ordered tuple of persons whose knowledge of theassets in Ka is similar to that of p. The list is sorted in descending order ofsimilarity. This query enables organisations to find suitable candidates duringteam formation or in cases where for example, a person needs to be transferredto a different team and thus needs to be replaced.
team knows is a function which given a graph and a team assignment, returnsthe knowledge assets which the team knows, in descending order of knowledgemagnitudes. This enables organisations to reason about the knowledge of groupsof people rather than individuals.
assets with attribute is a function which given a graph and a knowledge attributeassignment function, returns a set of assets which exhibit the attribute. Suchqueries can be useful when analysing a knowledge landscape from differentpoints of view. For example, it might be useful for an organisation to analyseits knowledge landscape from the point of view of the Operational Classificationof it’s knowledge assets (see section 2). In such cases, it could detect that forexample, the organisation has very little causal knowledge about what it doesand this might present problems in future.
5 Knowledge Metrics
This section defines a number of metrics which can be used to analyse a model witha view to understand the health of the organisation’s knowledge landscape. Pleasenote that due to length contraints, only a few salient metrics could be defined in thispaper.
5.1 Knowledge Mobility Risk
The term knowledge mobility risk refers to the chance of the company loosing a valuedknowledge asset as a result of a particular person or persons leaving. In general, thegreater the number of people that know a knowledge asset, the less mobility risk thatknowledge asset exhibits. However, one must consider ‘how much’ each person knowsthe knowledge asset. If (for example) four people in a team are vaguely familiar witha critical part of a system but a fifth person is an expert about it, then with respect
13

to that particular knowledge asset, loosing that one expert will probably hurt morethan loosing any number of the other four members.
Two mobility risk metrics are defined:
Knowledge Asset Mobility Risk (KMR) - Assesses the risk of individual knowl-edge assets being lost should certain personnel movements occur. Any riskyassets identified by this metric should lead to the organisation taking risk-mitigation action such as knowledge transfer activities.
Person Mobility Risk (PMR) - Assesses the risk posed by individual personsshould they suddenly leave the company. This metric operates in the context ofa subset of knowledge assets chosen by the user so as to provide provide moremeaningful information. For example, one could calculate PMR in the contextof the subset of knowledge assets related to database technologies in the organ-isation. This localises the metric and provides more useful information. If aperson is identified as being risky by this metric, it implies that if the personleaves, the organisation’s knowledge of one or more knowledge assets is likelyto be severely damaged. In such a case, the organisation should take risk miti-gation and transfer the person’s knowledge to other people in the organisation,thus spreading the risk.
Both metrics are adaptations of centrality metrics presented by Botafogo et al [BRS92]which measure the social importance of vertices in a graph. However, Botafogo’s workcalculated centrality based on the length of paths between pairs of vertices. This isnot suitable in our context because (a) the maximum length of a knowledge path be-tween a person and a vertex is 1 and (b) knowledge relationships exhibit a magnitudeproperty which must be taken into account.
Definition 2 Given a graph g with k1, ..., kn knowledge asset vertices and p1, ..., pmperson person vertices, then the knowledge distance matrix M for the graph is definedas a n×m matrix in which:
Mn′,m′ =
K if knows(g, pm′ , kn′) = 0
maxKMknows(g,pm′ ,kn′ )
otherwise
Where:
14

K is a constant which represents infinity in the graph. Throughout this paper, K willbe maxKM + 1.
maxKM is the highest knowledge magnitude assigned to knowledge relationships inthe graph. This is used as a normalising value whereby a simulated path distanceof 1 is assumed for knowledge relationships of maxKM magnitude. All smallervalues of magnitude will be translated to a proportionately larger path size. Thisallows us to use centrality metrics.
Definition 3 Given a knowledge distance matrix M representing k1, ..., kn knowl-edge asset vertices and p1, ..., pm person person vertices, we define the knowledge indistance (KID) and the knowledge out distance (KOD) for each person vertex asfollows:
KID(kn′) =∑m
i=1Mn′,i
KOD(pm′) =∑n
i=1Mm′,i
We also define the concept of knowledge distance (KD) as:
KD =∑n
i=1
∑mj=1Mi,j
Definition 4 At this point we can define the metrics for knowledge asset mobilityrisk (KMR) and person mobility risk (PMR) as:
KMR(kn′) = KDKID(kn′ )
PMR(pm′) =KOD(pm′ )
KD
The higher the value of KMR for a particular knowledge asset, the more at risk itis of being lost due to personnel movements. Similarly, the higher the value of PMRfor a particular person, the more knowledge the company stands to loose if the personleaves.
Example 3 Consider the subgraph of a model depicted in figure 3. In this example,the organisation is analysing whether any knowledge risks exist when considering itsknowledge of dynamic web technologies (jsp and servlets). The calculations for KMRand PMR would be carried out as follows:
15

Figure 3: An example for use in knowledge mobility risk definition.
jsp servlets KOD PMRSaviour 1 42 43 8.96Sergio 85 85 170 2.27Shirley 1 1.25 2.25 171.22Stephen 85 85 170 2.27KID 172 213.25 385.25KMR 0.44 0.55
One can make a number of observations after examining the results. Firstly, Sergioand Stephen present no risk in this particular context. This is because according tothe model, they have no knowledge of the knowledge assets in question. So if anyof them leave, the organisation’s knowledge of servlets and jsp will not be affected.The reason why they have a PMR value greater than 0 is related to our choice ofthe constant K. Secondly, Shirley has an astronomical PMR value when comparedto other people in the organisation. This means that if Shirley leaves tomorrow,the organisation stand to loose substantial knowledge about servlets and jsp. In fact,Shirley has strong knowledge of both when compared to Saviour’s knowledge magnitude
16
of 2 when considering servlets. Finally, jsp and servlets exhibit a KMR of 0.44 and055 respectively. This essentially means that the servlets knowledge asset exhibist25% more risk than jsp, due to the fact that even though two people know servlets,Saviour’s knowledge is minuscule compared to Shirley’s.
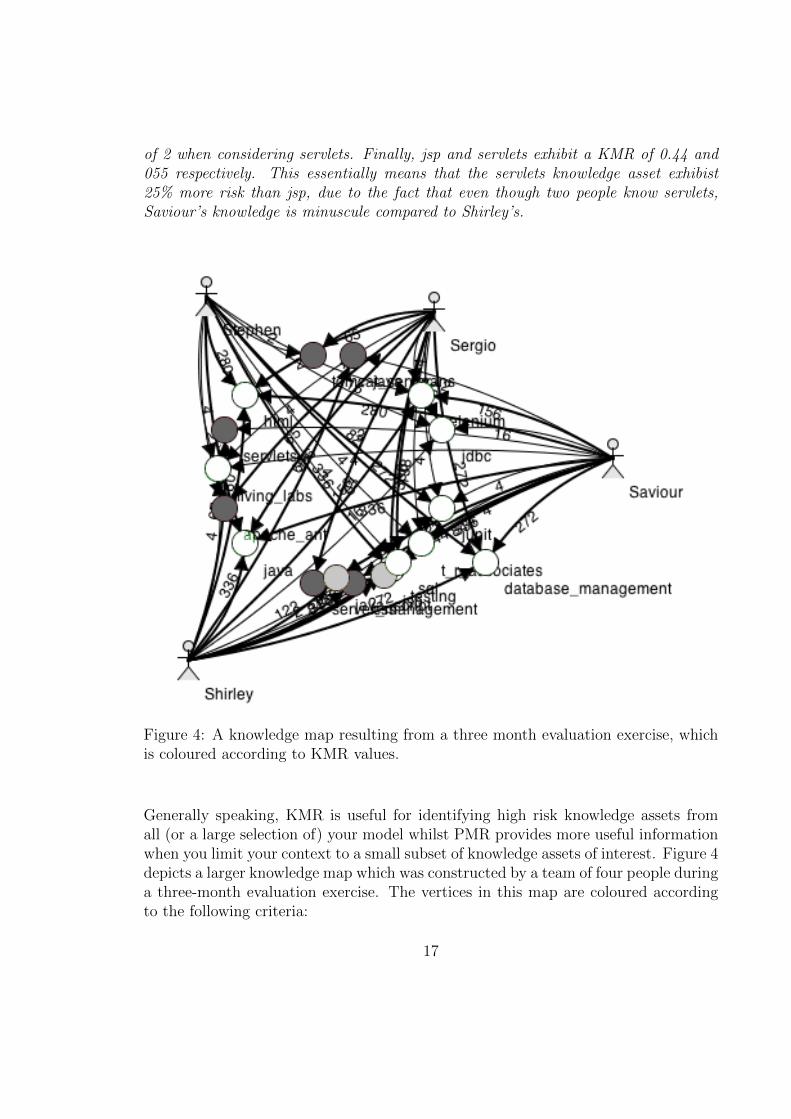
Figure 4: A knowledge map resulting from a three month evaluation exercise, whichis coloured according to KMR values.
Generally speaking, KMR is useful for identifying high risk knowledge assets fromall (or a large selection of) your model whilst PMR provides more useful informationwhen you limit your context to a small subset of knowledge assets of interest. Figure 4depicts a larger knowledge map which was constructed by a team of four people duringa three-month evaluation exercise. The vertices in this map are coloured accordingto the following criteria:
17

1. Let σ be the standard deviation of the KMR values for all knowledge assetvertices in the graph
2. Let µ be the average of the KMR values for all knowledge asset vertices in thegraph
3. Colour all nodes with KMR ≤ µ green (represented as white in this paper)
4. Colour all nodes with µ > KMR ≤ (µ + σ) orange (represented as light-greyin this paper)
5. Colour all nodes with KMR > (µ + σ) red (represented as dark-grey in thispaper)
Filtering the graph to red (dark grey) vertices results in figure 5. This demonstrateshow the metrics in question can take all the clutter out of a complex knowledge mapand provide a much clearer view of where the problem areas might be.
5.2 Knowledge Transfer Risks
Knowledge transfer risks refer to situations which might compromise the likelihoodof a knowledge transfer activity to be successful. Knowledge transfer activities areamongst the most important activities which enable organisations to hold on to or-ganisational knowledge despite staff turnover. Although research carried out seems toindicate that most knowledge transfer success factors can only be detected and influ-enced by company culture and management practices, Cummings and Teng [Cum03]developed a research model consisting of nine key factors which affect knowledgetransfer, two of which can be detected using the event-based cartographic approachproposed in this paper. These are knowledge embeddedness and knowledge distance.The former refers to the extent to which a particular knowledge asset is linked toother knowledge assets within the organisational knowledge landscape. Cummingsand Teng found that the more embedded a knowledge asset is, the more difficultit is to transfer. Knowledge Distance refers to the difference between two people’sknowledge in relation to the knowledge asset being transferred. If two people sharea relevant common basis of knowledge, their knowledge distance is said to be small.This makes a knowledge transfer exercise between such persons more likely to succeedthan if they had a large knowledge distance separating them.
Both knowledge embeddedness and knowledge distance can be inferred from knowledgemodels constructed using the language presented in this paper.
18

Figure 5: A filtered version of the knowledge map in figure 4 showing only highknowledge mobility risk assets.
5.2.1 Embeddedness
The following measure of embeddedness is propopsed:
embeddedness(k) = |dep(k)|
Where dep(k) is a function that given a knowledge asset k, returns the set of allknowledge assets which k depends on. Please note that since dependency is tran-sitive, this set will also include knowledge assets which are depended on by directdependencies of k. Also, since composition is a form of dependency (see section 2),dep(k) will also return elements which k forms part of.
For any knowledge asset k, a higher value of embeddedness(k) implies a higher levelof knowledge transfer risk exhibited by k.
19

5.2.2 Knowledge Distance
Consider a knowledge transfer exercise whereby a person who is a knowledge sourcepsrc is transferring a knowledge asset k to a second person who is a knowledge receiverprec. The knowledge distance measure takes into account prec’s lack of knowledge ofall assets in dep(k) (see section 5.2.1):
distance(psrc, prec, k) =∑
∀k′∈dep(k)
distabs(psrc, prec, k′)
Where:
distabs(psrc, prec, k) =0
if knows(g, psrc, k)− knows(g, prec, k) < 0
knows(g, psrc, k)− knows(g, prec, k)otherwise
6 Evaluation
An evaluation exercise was carried out involving two four-member undergraduatestudent teams participating in a three-month development project for which theyreceived academic credit. The project required students to work for an actual indus-try client and delivery software using agile methodologies. A number of workshopsabout agile development and knowledge management were delivered to all studentsparticipating in the exercise. They were also tasked with creating and maintaininga knowledge map using the techniques presented in this paper. In order to facilitatethis, a GUI tool for creating and analysing knowledge maps was developed and madeavailable to the students.
The exercise was targeted at evaluating participants’ perceived accuracy of conclu-sions drawn from their knowledge maps with regards to (i) knowledge relationshipsregardless of magnitudes, (ii) knowledge relationship magnitudes and (iii) risk met-rics. At the end of the three month exercise, each team’s knowledge map was analysed
20

by researchers and a custom survey was designed for each team. Each survey con-sisted of two sections: section one was to be answered by the team as a whole andsection two consisted of a personalised question for each team member. In sectionone, participants were asked to rate their agreement with a number of statementssuch as “All team members can write unit tests”, “Elise knows Javascript more thanIan” and “if Joseph leaves the team, we will have no knowledge of photoshop”. Eachquestion was designed to assess the team’s perceived accuracy of various aspects ofthe knowledge map as discussed above. Team members discussed each statement andjointly provided a rating on a scale of 1 (strongly disagree) to 5 (strongly agree).Section two consisted of one personalised question for each team member wherebythey were provided with five knowledge assets and asked to rank them in descendingorder of their familiarity with them. This made it possible to compare each teammember’s ranking with the ranking provided by the knowledge map.
6.1 Evaluation Results
Table 1 summarises the average scores for questions designed to measure the per-ceived accuracy of conclusions drawn from the knowledge maps. With regards to thequestions designed to gauge participants’ perceived accuracy of the model’s knowl-edge relationships regardless of magnitude, the results are highly encouraging. Teamsscore a high level of agreement with statements like “Sergio is the only person whoknows JDBC” with the average score being 4.3 (agree). This essentially means thatthe proposed technique effectively models who knows what within the organisation.
Perceived accuracy of... Avg Score CommentKnowledge relationships 4.3 AgreeKnowledge rel magnitudes 3.6 Weak AgreeKnowledge metrics 3.9 Agree
Table 1: Results of perceived accuracy questions
The next area of interest involved investigating whether or not a knowledge mapaccurately represents knowledge magnitudes. That is to say, not only “what” peo-ple know but also “how much” they know it. This was approached from two angles.Firstly, in section one of the survey, a number of statements were specifically designed
21

to query participants about conclusions involving magnitudes. Typical statements in-clude “Jacqueline and Elise are the team’s experts on Javascript”, “Jacqueline, Eliseand Ian are similarly knowledgeable about Liferay”, and so on. The results in thiscase were slightly disappointined with this category of questions scoring an average of3.6 (weak agree). However, upon further investigation, it was discovered that the re-sults reflected errors by participants when building the knowledge map. For example,the knowledge map for one team indicated that there was one expert on a knowledgeasset labelled as Liferay. In fact, it transpired that a second person was also highlyknowledgeable but his activities with regard to the Liferay knowledge asset were notproperly logged. This skewed the results towards disagreement. The second anglefrom which this question was approached involved providing each participant witha list of five knowledge assets and asking them to rank them in descending order offamiliarity. These rankings were then compared with rankings derived directly fromthe knowledge maps using the Spearman Rank Correlation Coefficient. This measureprovides a value between -1 and 1 where a value close to -1 indicates that your datais negatively correlated, a value close to 0 indicates no linear correlation of your datawhilst a value close to 1 indicates a positive correlation of your data. The SpearmanRank Coefficient was calculated for each of the eight team members’ rankings and theresults plotted on a frequency distribution graph (see figure 6). The results indicatethat there is a positive correlation between the rankings provided by participantsand those derived from the knowledge maps. Even though the level of correlationvaries, one should keep in mind that the participants made some errors when loggingevents throughout the exercise. If these mistakes are corrected, correlation is likelyto improve.
Finally the effectiveness of the metrics presented in this paper was investigated. Thiswas done by drawing certain conclusions based on metrics and then soliciting partic-ipants to score their agreement with the conclusions. Typical conclusions include “ifJoseph leaves the team, our knowledge of photoshop will suffer”, “it would be diffi-cult to transfer your knowledge about servlets to someone who does not know Javaor HTML”, and so on. These conclusions were drawn from values of KMR, PMR,Embeddedness and Knowledge Distance metrics. Statements designed to gauge thevalidity of such conclusions scored an average of 3.9 (agree). Although this is pos-itive, further investigation into individual results revealed an unexpected problem.There were knowledge assets used by the team which were easy to learn, apply andremember. Usually this was because the knowledge assets were ‘small’ in size. Eventhough such knowledge assets were not necessarily applied very often, participantsstill felt they had a strong knowledge of them. This was contrary to what the event-based mechanism of the knowledge map concluded. This development gives rise tothe possibility of modifying the work presented here to reflect these types of situations.
22

Figure 6: Distribution graph of Spearman Rank Coefficients for the knowledge mag-nitude ranking test
In summary, although the evaluation has its limitations, it does give encouragingresults. It did however uncover two potential issues. The first is a question of incor-porating the use of the language into a process so that knowledge maps are correctlycreated and maintained. This may sound simple but could be a challenge consideringthe tendency of knowledge workers to resist routine tasks. The second issue refers tothe fact that the language does not differentiate between knowledge assets of differentsizes. In some cases, this can skew conclusions derived from a knowledge map.
References
[AL01] Maryam Alavi and Dorothy E. Leidner. Review: Knowledge managementand knowledge management systems: Conceptual foundations and researchissues. MIS Quarterly, 25(1):107–136, 2001.
[BD08] F. Bjørnson and T. Dingsøyr. Knowledge management in software engi-neering: A systematic review of studied concepts, findings and research
23

methods used. Information and Software Technology, 50(11):1055–1068,October 2008.
[BM06] Florian Bayer and Ronald Maier. Knowledge risks in inter-organizationalknowledge transfer. In Proceedings of the International Conference onKnowledge Management and Knowledge Technologies. ACM ICPS, 2006.
[Bra98] S. Branch. You hired ’em. but cab you keep ’em? Fast Company, September1998.
[BRS92] Rodrigo A. Botafogo, Ehud Rivlin, and Ben Shneiderman. Structural anal-ysis of hypertexts: identifying hierarchies and useful metrics. ACM Trans.Inf. Syst., 10:142–180, April 1992.
[Cum03] J. Cummings. Transferring r&d knowledge: the key factors affecting knowl-edge transfer success. Journal of Engineering and Technology Management,20(1-2):39–68, June 2003.
[DDR05] Torgeir Dingsøyr, Hans Karim Djarraya, and Emil Røyrvik. Practicalknowledge management tool use in a software consulting company. Com-mun. ACM, 48:96–100, December 2005.
[DH03] Scott B. Droege and Jenny M. Hoobler. Employee Turnover And TacitKnowledge Diffusion: A Network Perspective. Journal of Managerial Is-sues, 15(1):50+, 2003.
[Duf99] N. Duffy. Benchmarking knowledge strategy. Leveraging Knowledge forBusiness Performance 1999: Knowledge In Action, 1999.
[Ear01] Michael Earl. Knowledge management strategies: Toward a taxonomy.Journal of Management Information Systems, 18(1):215–233, May 2001.
[Kou03] S. Koudsi. Actually, it is brain surgery. Fortune, March 2003.
[NNI98] The Nolan Norton Institute. “Putting the knowing organization to value”white paper. Nolan Norton Institute, 1998.
[Non94] I. Nonaka. A dynamic theory of organizational knowledge creation. Orga-nization Science, 5(1):14–37, 1994.
[RMA02] M. F. Ramal, R. de Moura Meneses, and N. Anquetil. A disturbing resulton the knowledge used during software maintenance. In Proceedings ofthe Ninth Working Conference on Reverse Engineering (WCRE’02), pages277–, Washington, DC, USA, 2002. IEEE Computer Society.
24

[Szu96] Gabriel Szulanski. Exploring internal stickiness: Impediments to the trans-fer of best practice within the firm. Strategic Management Journal, 17:27–43, 1996.
[Tiw00] A. Tiwana. The Knowledge Management Toolkit: Practical Techniques ForBuilding A Knowledge Management System. Prentice Hall, 2000.
[Zac98] M. Zack. What knowledge-problems can information technology help tosolve. In Proceedings of the Fourth Americas Conference on InformationSystems, pages 644–646, 1998.
25