an examination of the incremental validity of the serve
TRANSCRIPT
Western Kentucky UniversityTopSCHOLAR®
Masters Theses & Specialist Projects Graduate School
Spring 2017
An Examination of the Incremental Validity of theServe-Specific Core Self-Evaluation Scale Over theCore Self-Evaluation Scale in Predicting ServePerformanceJoshua S. BowmanWestern Kentucky University, [email protected]
Follow this and additional works at: http://digitalcommons.wku.edu/theses
Part of the Applied Behavior Analysis Commons, and the Organizational Behavior and TheoryCommons
This Thesis is brought to you for free and open access by TopSCHOLAR®. It has been accepted for inclusion in Masters Theses & Specialist Projects byan authorized administrator of TopSCHOLAR®. For more information, please contact [email protected].
Recommended CitationBowman, Joshua S., "An Examination of the Incremental Validity of the Serve-Specific Core Self-Evaluation Scale Over the Core Self-Evaluation Scale in Predicting Serve Performance" (2017). Masters Theses & Specialist Projects. Paper 1944.http://digitalcommons.wku.edu/theses/1944

AN EXAMINATION OF THE INCREMENTAL VALIDITY OF THE
SERVE-SPECIFIC CORE SELF-EVALUATION SCALE OVER THE
CORE SELF-EVALUATION SCALE IN PREDICTING
SERVE PERFORMANCE
A Thesis
Presented to
The Faculty of the Department of Psychological Sciences
Western Kentucky University
Bowling Green, Kentucky
In Partial Fulfillment
Of the Requirements for the Degree
Master of Science
By
Joshua Bowman
May 2017

AN EXAMINATION OF THE INCREMENTAL VALIDITY OF THE
SERVE-SPECIFIC CORE SELF-EVALUATION SCALE OVER THE
CORE SELF-EVALUATION SCALE IN PREDICTING
SERVE PERFORMANCE

I dedicate this thesis to my parents, Steve and Stephanie Bowman, who have devoted
their lives to helping my brother and me be successful in all our endeavors. Their love
and support has enabled me to achieve more than I ever would without them.

iv
ACKNOWLEDGMENTS
Foremost, I would like to express my sincere gratitude to my advisor, Dr. Betsy
Shoenfelt, for the continuous support and guidance on this project, and throughout my
graduate education. In working with Dr. Shoenfelt, I feel I have learned many valuable
lessons, and developed skills that will be crucial to the success of my career.
Additionally, I would like to thank the rest of my thesis committee, Dr. Reagan Brown
and Dr. Andy Mienaltowski, for their constructive feedback and expertise on this project.

vi
Joshua Bowman May 2017 40 Pages
Directed by: Elizabeth L. Shoenfelt, Reagan D. Brown, and Andrew S. Mienaltowski
Department of Psychological Sciences Western Kentucky University
This study examined the relationship of the serve-specific core self-evaluation
scale (SS-CSES) with serve performance of inter-collegiate volleyball athletes. The SS-
CSES is a modified version of the core self-evaluations scale (CSE). It was hypothesized
that SS-CSES would be related to serve performance, that SS-CSE would be more related
to serve performance than CSE, and that SS-CSE would have incremental validity over
CSE when predicting serve performance. Responses to the two scales and self-
assessments of server performance were collected online through self-report
questionnaire. Additionally, NCAA serve statistics were collected by the researchers.
Results indicated that SS-CSE was a stronger predictor of performance than CSE, and all
other hypotheses were supported.
AN EXAMINATION OF THE INCREMENTAL VALIDITY OF THE
SERVE-SPECIFIC CORE SELF-EVALUATION SCALE OVER THE
CORE SELF-EVALUATION SCALE IN PREDICTING
SERVE PERFORMANCE

v
CONTENTS
Introduction................................................................................................................. 1
Background and Origin of Core Self-Evaluations (CSE)........................................ 2
CSE Scale Development.......................................................................................... 5
CSES Use in Organizations..................................................................................... 7
CSES Use in Sports .............................................................................................. 10
Modification of the CSES for Specific Activities.................................................. 11
Use of the CSES Across Cultures.......................................................................... 12
CSE Discrepancies................................................................................................. 13
Summary of Literature........................................................................................... 15
Current Study............................................................................................................ 15
Method ...................................................................................................................... 16
Participants ............................................................................................................ 16
Materials................................................................................................................ 17
Procedure............................................................................................................... 20
Results....................................................................................................................... 20
Discussion ................................................................................................................. 26
Conclusion and Implications ............................................................................... 28
References................................................................................................................. 30
Appendix A............................................................................................................... 35
1
Introduction
Researchers and practitioners are constantly searching for methods to predict
specific outcomes related to human performance, whether it be a company trying to
determine level of job performance or a baseball team attempting to forecast how many
homeruns their players will hit. Specifically, organizations of any kind (e.g., businesses,
sports teams, colleges) are often trying to acquire the best performers or are trying to
improve the performance of current incumbents. Especially in the modern workplace,
change is evident, and it is crucial that employees are well-suited to perform at their best
in a dynamic and complex environment. In some areas, such as sports, there has never
been more emphasis on maximizing performance as the level of competition has
increased (Thorton, Champion, & Ruddell, 2011).
Whether in business or sports, an important factor in being successful is not only
understanding the current environment, but understanding the people within the
environment and how they operate in that environment. Performance has been linked to
many factors. Research has shown that significant variability in human performance
results from inherent traits (e.g., personality, intelligence, and physical abilities) as well
as learned knowledge and skills. Specifically, aspects of personality have been
investigated in the prediction of important performance outcomes (Judge, Locke, &
Durham, 1997). The current study investigated the personal trait of core self-evaluations
(CSE; Judge et al., 1997) and whether a skill-specific version of the CSE scale is better at
predicting performance than is the general CSE scale. This study examined if the Serve-
Specific Core Self-Evaluation scale (SS-CSES) is a better predictor of serve performance

2
in serving sports than is the general Core Self-Evaluation Scale (CSES). First, a review
of the CSE literature is necessary to provide background for the current study.
Background and Origin of Core Self-Evaluations (CSE)
Judge et al. (1997) first examined the concept of core self-evaluations (CSE).
They stated that a fundamental characteristic that differentiates individuals from one
another are core evaluations they make about themselves and their environment. For
example, people who have high CSE see themselves positively across many situations
and approach the world in a confident and self-assured manner. CSE consists of four
inherent components: generalized self-efficacy, self-esteem, locus of control, and
emotional stability. Judge et al. proposed that these four traits combine to form a unitary
trait. The four traits have been well-researched and there is an abundance of literature
that defines each of them.
Generalized self-efficacy is defined as an individual’s estimate of his or her
ability to perform well across a variety of situations (Bandura, 1982). Generally,
individuals have varying levels of self-efficacy across performance domains, but it is a
global estimate of ability across a wide range of situations that is typically considered a
stable trait. Individuals high in generalized self-efficacy likely will undertake new tasks
that promote growth in their abilities, and they are more persistent than those with lower
generalized self-efficacy (Judge et al., 1997).
Self-esteem mirrors an individual’s general examination of his or her own worth
(Harter, 1990). Self-esteem may be one of the most essential components of core self-
evaluations because it is the overall value an individual places on him/herself as a person
(Judge, Locke, Durham, & Kluger, 1998).
3
Locus of control is a tendency for an individual to attribute life events to his/her
own actions or to forces beyond his/her control. People who believe they control their
own environment have an internal locus of control; people who believe outside forces
control their environment have an external locus of control (Rotter, 1990). Individuals
with an internal locus of control are more likely to be satisfied with their lives, jobs, or
roles because they believe they can control of situations (Judge et al., 1998).
Last, emotional stability or neuroticism brings in a more emotional component.
Defining this trait in terms of neuroticism, it is an enduring tendency to experience
negative emotions such as anger, anxiety, or depression (Costa and McCrae, 1992).
Individuals high in neuroticism are often feel helpless, are more prone to anxiety, and are
poor at handling stress (Judge et al., 1997). Individuals low in neuroticism are
considered to be emotionally stable. Emotional stability is the opposite end of the
continuum.
Prior to the development of the construct of core self-evaluations, each of these
four core traits was seen as a relatively good predictor of various work outcomes. Judge
et al. (1997) discovered that combining these traits to form the broader trait of core self-
evaluations predicted job outcomes such as job satisfaction better than did each
individual trait alone. The four traits are conceptually similar, but prior to the study of
core self-evaluations, they had rarely been examined together. Researchers (Eysenck,
1990; Watson & Clark, 1984) have argued that many traits (e.g., affective disposition and
emotional stability) have been proposed and studied without considering that the traits
have a broad common core. Many of the traits such as affective disposition and
emotional stability correlate highly and could potentially be considered measures of the

4
same construct (Bono & Judge, 2003). Bono and Judge determined that this is the case
with the CSE components.
Judge and Kammeyer-Mueller (2012) supported the idea that the four traits that
form CSE overlap and often provide more insight when combined into a single trait.
They discussed the debate on using general versus specific constructs. There are
psychologists who seek to make clear distinctions among psychological constructs by
dividing them into constituent elements and there are psychologists who seek to
aggregate constructs by combining narrow constructs into broader ones. The decision to
take a general or specific approach in classifying constructs depends on whether the
specificity of one construct depends on the specificity of other constructs in the model,
and the fact that general constructs will work better for some characteristics and specific
constructs better for others. CSE is a broad or general trait that is an integration of four
narrow or specific traits. Judge and Kammeyer-Mueller (2012) view CSE as a
hierarchical latent construct. This latent construct of an individual’s capability and
efficacy in life is what leads to the inter-correlation of the CSE core trait measures.
Therefore, CSE is identified as a reflective construct with scale scores on the core traits
serving as effect indicators. However, some psychologists (e.g., Johnson, Rosen, &
Levy, 2007) support a different perspective that conceptualizes CSE as a formative
construct that forms as a result of causally independent measures of the core traits. Thus,
there is disagreement in how CSE is viewed as a construct. Discrepancy over this
construct is discussed further in a later section.
CSE was initially developed as a dispositional predictor of job satisfaction, but
has since been found to predict a variety of other outcomes in varying settings. CSE is

5
important because it is an inherent trait that should remain stable over time. However, it
has been proposed that aspects of performance and life events can alter CSE. Therefore,
researchers have recognized that more research is needed to determine if CSE is a stable
trait or a dynamic trait that may change based on performance or life events (Judge &
Kammeyer-Mueller, 2011). To assess CSE in an optimal manner, the core self-
evaluation scale (CSES) was developed.
CSE Scale Development
Judge, Erez, Bono, and Thoresen (2003) developed a 12-item scale to directly
measure CSE. Prior to the development of this scale, instruments were being used that
only indirectly measured the construct. The final items of the CSE scale were selected
from a pool of 65 items that were based on the literature involving the measurement of
the four core traits. The researchers carefully examined the items of existing measures of
the four core traits and wrote items base on those measures. In selecting the final items,
the items needed to adequately sample the content domain covered by the four core traits,
needed to significantly correlate with one another to ensure scale reliability, needed to
have significant or strong correlations with important job outcomes, and needed to be
short enough to be useful. The researchers decided on 12 items that addressed all four of
their item selection criteria. After the development of the scale, the researchers
investigated its psychometric properties and if it conveyed a single unitary construct.
The results indicated that the scale had good internal consistency, achieving an
average across samples of .84, and a mean item-total correlation of .50. Additionally,
there was high test re-test reliability of .81 and there were strong correlations with the
core traits. The scale also displayed a unitary factor structure, had validity equal to that of

6
the optimal weighting of the four core traits, and had incremental validity over the five-
factor model of personality. The overall results of the Judge et al. (2003) study indicated
that the CSES has robust psychometric properties, suggesting that it is a valid measure
that could be useful in psychological research and applied settings.
Prior to the development of this scale, CSE had to be extracted from measures of
each individual trait and then compiled. The CSES was shown to have convergent
validity with valid and reliable measures of the individual traits showing that this scale
actually does measure these traits. However, as mentioned before, the collective scale
has more predictive power. Judge et al. (2003) cited a few advantages of using a direct
scale in comparison to measuring the trait indirectly. First, direct scales are able to
measure the trait with fewer items. Second, direct scales are likely to be more valid
because they are designed to measure the trait itself as opposed to indicators of the trait.
Third, most traits in contemporary personality research are measured with relatively short
and direct scales.
The single direct scale generally predicted better than the measures of the four
core traits. Judge et al. (2003) addressed why this may be even though they are
essentially measuring the same construct. They proposed that CSES may measure more
than CSE, but in their study they found that the CSES did not reflect a relationship with
related traits like conscientiousness and extraversion any more than did the measures of
the individual core traits. However, it could measure more distant traits outside of the
five-factor model or other common personality traits related to CSE. A more likely
explanation for its superior prediction is that the CSES was designed to directly measure
the CSE construct. Items on the CSES were developed to include the intersections

7
between the core traits likely leading to a more direct measure with less error than
measures of the individual core traits. Essentially, the CSES measures the commonality
among the core traits as compared to only the traits themselves, resulting in a more
comprehensive measure. As mentioned above, the CSES was found to have strong
psychometric properties and may serve as a valid measure in both applied and research
settings. Since the development of this scale, it has been used successfully in
organizations, sports, across cultures, and it has been modified to measure CSE of
specific skills.
CSES Use in Organizations
The CSES has been used in many organizational studies to determine the
relationship between CSE and a variety of employee-related criterion. In this section, I
will discuss prior research that has demonstrated a strong positive relationship between
CSE and work-related variables. Research has shown that CSE is related to several
important work-related outcomes such as job satisfaction, job performance, coping, and
motivation (Erez & Judge, 2001; Judge et al., 2003; Kanmeyer-Mueller, Judge, & Scott,
2009). The CSES was originally developed in a study that examined if scale scores were
correlated with common job outcomes such as job satisfaction and job performance.
Results indicated that it was significantly correlated with both of these outcomes (Judge
et al., 2003).
In addition to overall job satisfaction, CSE has been shown to be positively
related to task satisfaction. This relationship was evidenced by the correlation between
task complexity and CSE. Through a strategic business simulation with undergraduate
business students and from survey results from over 100 full-time employees, Srivastava,

8
Locke, Judge, and Adams (2010) found that individuals with higher CSE chose or sought
out tasks with higher levels of complexity. They also demonstrated that task complexity
increased task/work satisfaction. Practically, these findings have implications for using
CSE as an employee selection measure. Individuals with high CSE viewed their jobs as
more challenging, sought out greater task complexity, and were more satisfied with their
work, all factors that have been linked to better performance. Also, Judge et al. (2003)
and Judge and Bono (2001) found individuals with high CSE often perform better than
those with low CSE. Based on this evidence, Srivastava and colleagues suggested that
using CSE would be beneficial in selecting employees. Because high CSE is related to
increased performance, it would be beneficial for supervisors to provide high CSE
employees with opportunities to work on complex tasks and to provide them with the
resources needed to succeed in tasks to increase satisfaction.
Erez and Judge (2001) found that core self-evaluations were significantly related
to task motivation, task performance, productivity, and goal-setting behaviors.
Employees with high CSE took more ownership of their goals and were convinced that
attaining their goals was solely in their control. Goal ownership and control led to greater
performance and productivity. Although this study predated the development of the
CSES, the four core traits together predicted the aforementioned traits better than did
each trait in isolation. It is likely that if the CSES had been used in this study, there
would have been even greater predictability.
Kanmeyer-Muller, Judge, and Scott (2009) investigated if CSE served as an
integrative framework for understanding individual differences in the coping process. A
meta-analytic review indicated that CSE was positively related to fewer perceived
9
stressors, lower strain, less avoidance coping, more problem solving coping, and was not
related to emotion-focused coping. Results from a second part of this study where
individuals kept a daily stress diary found consistent results. Individuals high in CSE
perceived fewer stressors, experienced less strain, and engaged in less avoidance coping.
Additionally, both parts of the study demonstrated that CSE had a unique relationship
with stress and the coping process, and that it moderated the relationship between
perceived stressors and strain. High CSE moderated the relationship by decreasing the
negative effects of the stressors, resulting in less strain. The researchers indicated these
results have implications for individuals within organizations that may be facing stressful
assignments. Individuals with high CSE may handle stressful assignments or workplace
stressors more effectively than people with lower CSE. This relationship has
implications for managers to carefully monitor the work choices and attitudes of
individuals who have lower CSE, and to provide further task training, encouragement,
and social support to assist with autonomously managing obstacles to task goals.
In summary, the aforementioned studies demonstrated that CSE is related to many
important work-related outcomes. Judge et al. (2003) indicated that CSE was
significantly related to job satisfaction and job performance. Srivastava et al. (2010)
found that task complexity was positively correlated with CSE and that task complexity
led to task/work satisfaction. Erez and Judge (2001) demonstrated that high goal
ownership and control were related to greater job performance and productivity. Last,
individuals who have high CSE have lower stress, engage in more productive coping
behaviors, and are able to handle stressful work assignments or workplace stressors better

10
than individuals with low CSE (Kanmeyer-Mueller et al., 2009). The CSES has been
used successfully in organizations, and it may be used effectively in other settings too.
CSES Use in Sports
Not only has CSE been applied to a business or workplace setting, researchers
have started examining its use in sports. Shoenfelt and Griffith (2008) used the CSES in
a study examining mental skills training for serving in volleyball. This was the first
known study that applied this scale to a sports setting. Shoenfelt and Griffith used the
scale to measure self-efficacy of serving prior to and after mental skills training. They
modified the scale to make it a serve-specific scale. This was done by adding or
substituting the word “serve” or “serving” to each item of the CSES. The new scale was
called the serve-specific core self-evaluations scale (SS-CSES). The SS-CSES had a
coefficient alpha of .70 and was correlated with serve performance.
Machado et al. (2016a) used the SS-CSES in another volleyball study. In this
study, the SS-CSES was successfully translated into Portuguese. The Portuguese version
of the scale demonstrated strong internal consistency (Cronbach’s alpha of .85) and test-
retest reliability (r = .96). Volleyball players in Brazil completed the Portuguese SS-
CSES. SS-CSES scores were significantly related to years of practice (r =.18) and level
of competition (r =.16).
Machado, Valentim, and Stefanello (2016b) used the Portuguese SS-CSES with
volleyball athletes in their study examining self-assessment of serving. Serving
effectiveness data, years of practice, and serve self-assessments were collected for each
athlete. The SS-CSES was used as a measure of self-assessment of serving efficacy.
Athletes that had more years of practice and who assessed themselves as having higher

11
serve efficacy were more effective servers. The results of this study provided evidence
that the CSES was successfully modified to be serve specific. The last three studies (i.e.,
Machado et al., 2016a, 2016b; Shoenfelt & Griffith, 2008) indicated that CSE can
successfully be used in sports. Thus, it has been established that the CSES can be used
across different settings (i.e., organizations and sports) and that it can also be modified to
predict performance outcomes for specific activities.
Modification of the CSES for Specific Activities
The CSES measures general CSE, but the scale can be modified to measure CSE
for specific activities. Bowling, Wang, Tang, and Kennedy (2010) stated that researcher
reliance on general rather than specific CSES has resulted in underestimates of the
importance of CSES. Bowling et al. modified the CSES items to include the words “at
work” to measure CSE for certain work-related outcomes. Using two independent
samples, they found that, when compared to the CSES, the work-specific CSES yielded
minimal differences with work-related criteria. However, they found several instances
where the work-specific CSES predicted incremental variance in work-related criteria
beyond using the CSES alone. The work-specific scale demonstrated strong internal
consistency yielding coefficient alphas of .81 and .86 for the two samples.
As mentioned before, Shoenfelt and Griffith (2008) modified the CSES to make
the SS-CSES. This scale measures CSE in volleyball serving. The SS-CSES has since
been used in a few other studies and even was translated into Portuguese (Machado et al.,
2016a, 2016b). Aside from the study by Bowling et al. (2010) investigating work-
specific CSE and the few studies examining serve specific CSE, no other studies have
been found that focus on skill specific CSE. This is an indication that more research is

12
needed on the development of skill specific CSES. The CSES has also been translated
into other languages to be used across cultures.
Use of the CSES Across Cultures
There are at least four studies to date that have translated the CSES into other
languages for use across cultures. In each of the studies, the translated scales were shown
to have robust psychometric properties. As mentioned earlier, Machado et al. (2016a)
translated the scale to Portuguese. Judge, Van Vianen, and De Prater (2004) found that
both Spanish and Dutch versions of the scale had strong psychometric properties having
coefficient alpha reliability estimates greater than .80. This is consistent with the results
found by Judge et al. (2003) when they created the original English version of the scale.
Stumpp, Muck, Hulsheger, Judge, and Maier (2010) translated the CSE scale into
German and found results consistent with previous studies. They found an average
internal consistency estimate of .84, and test-retest reliability of .82. Additionally, the
researchers indicated that the German CSES had incremental validity over the individual
core traits, as well as the Big Five, and positive and negative affect when predicting
career success. Convergent validity with measures of the four core traits was found and
discriminate validity with traits different from the core traits was found. These results
indicate that the German CSES is a reliable and valid measure that is likely to be
successful for both practical and research purposes.
Rode, Judge, and Sun (2012) translated the CSES into Chinese. The resulting
coefficient alpha reliability estimate was .75, a similar degree of internal consistency as
other versions of the CSES. The Chinese version of the scale demonstrated incremental
validity over other individual traits such as self-esteem, narcissism, and protestant work

13
ethic in predicting criteria such as job and life satisfaction, extrinsic and intrinsic job
satisfaction, and several job attitude variables. Thus, the CSES has successfully been
translated into Chinese, Dutch, German, Portuguese, and Spanish and has been used
successfully across cultures. Even though research has shown that the CSES successfully
predicts performance outcomes across cultures, in organizations, and in sports, there is
disagreement about how the construct should be defined.
CSE Discrepancies
Although CSE has been an effective predictor of important outcomes in work and
sports, there are discrepancies over its meaning as a construct. A major concern of
psychologists is that CSE is just another measure of emotional stability. Emotional
stability is an old and vastly researched construct, and some researchers consider some of
the core traits of CSE to be indicators of emotional stability (e.g., Eyseneck, 1990;
Johnson, Rosen, & Levy, 2007). These researchers argued that CSE as developed by
Judge et al. (1997) is just a broader conceptualization of emotional stability. Judge,
Heller, and Klinger (2008) discovered that when examining dispositional sources of job
satisfaction (i.e., CSE, the Big Five, and positive affect and negative affect typologies),
CSE was the strongest predictor. Because CSE and the Big Five both contain emotional
stability, Judge et al. addressed that connection. Emotional stability was the best
predictor of job satisfaction among all of the Big Five traits. However, it was not the best
predictor of the CSE traits. Judge et al. stated that CSE offers more than just a measure of
emotional stability.
However, apart from the argument that CSE is more than just emotional stability,
Judge et al. (2008) recognized it is likely that CSE could be integrated into emotional

14
stability. However, if that were to happen, emotional stability would need to be
measured more broadly than it has been in the past to achieve maximum prediction of
outcomes. In the past, emotional stability has been measured by scales designed to
measure the specificity of the trait. Judge et al. mentioned that scales such as Costa and
McCrae’s (1992) NEO-PI-R do not measure the evaluative indicators of CSE. The other
three traits in CSE may be considered indicators of emotional stability, and that overlap
and broader definition is measured in the CSES. If CSE were to be integrated into
emotional stability, measures would need to be broader to account for aspects of
emotional stability that are explained by overlap with the other CSE traits. Judge et al.
suggested that the other component traits of CSE, as well as others, are just indicators of
emotional stability and overlap with it to the extent that they all measure emotional
stability.
Judge and Kammeyer-Mueller (2011) stated that if CSE is redundant with other
established personality traits, there is likely little practicality in studying CSE. Schmitt
(2004) argued that CSE was nothing but a combination of three of the Big Five traits:
conscientiousness, extraversion, and emotional stability because CSE was correlated with
all of them. However, although CSE measures overlap with other constructs such as the
Big Five, studies have shown that CSE is more predictive of important outcomes like job
satisfaction and job performance when compared to predictive power of the Big Five
(Judge, et al., 2003). Consequently, even if the constructs are the same, CSE is a stronger
predictor, justifying the utility of CSE research.

15
Summary of Literature
As discussed, researchers and practitioners are constantly trying to predict
performance outcomes. To do this we rely on measures of related constructs.
Specifically, CSE has been positively linked to many performance outcomes. CSE is a
broad trait formed from the combination of generalized self-efficacy, self-esteem, locus
of control and emotional stability. The CSES is the only known measure of CSE and it
has been successfully used in several different settings (Judge et al., 2003). In
organizations, CSES scores have been positively correlated with important work-related
outcomes such as job satisfaction, job performance, coping, and motivation (Erez &
Judge, 2001; Judge et al., 2003; Kanmeyer-Mueller, Judge, & Scott, 2009). The CSES
has been modified to be skill-specific. In volleyball, SS-CSES scores have been shown
to predict serve performance (Machado et al., 2016b; Shoenfelt & Griffith, 2008). The
CSES also has been translated into five different languages and used successfully across
cultures (Judge et al., 2004; Machado et al., 2016a; Rode et al., 2012; Stumpp et al.,
2010). Apart from the success of the CSES, there is disagreement on how CSE should
be defined. Some psychologists (Judge et al., 2003) think that CSE is an important trait
that encompasses where the four core traits overlap and explains more than any of the
four traits do alone. Others psychologists believe that CSE is too similar to traits such as
emotional stability and is believed to be nothing more than another adaption of emotional
stability (Schmitt, 2004).
Current Study
The purpose of the current research was to establish whether the SS-CSE will be
more strongly related to serve performance than will general CSE, and if the SS-CSES

16
has incremental validity over the general CSES in predicting serve performance
outcomes in the sport of volleyball. Investigating this question will provide validity
evidence for using skill-specific core self-evaluation scales versus the general core self-
evaluation scale. No prior research has examined the incremental validity of the SS-
CSES over the CSES in predicting performance outcomes, and only one other study
(Bowling et al., 2010) has investigated the incremental validity of using skill-specific
scale over using the general scale. Additionally, only two skill-specific scales have been
developed (Shoenfelt & Griffith, 2008; Bowling et al., 2010), and there is limited
research on this subject. This study adds to the knowledge of using skill-specific scales
and will contribute to closing the gap of establishing incremental validity of using the SS-
CSES over the CSES when trying to predict performance outcomes in serving sports.
Additionally, SS-CSE results gained from the study may inform athletes and their
coaches of areas they can work on to help improve their serve performance. The
following hypotheses were tested:
Hypothesis 1: SS-CSE will be positively related to serve performance.
Hypothesis 2: SS-CSE will be more strongly related to serve performance than
will general CSE.
Hypothesis 3: The SS-CSE will demonstrate incremental validity over the CSES
when predicting serve performance.
Method
Participants
Data were collected from 87 athletes from Division 1 inter-collegiate women’s
volleyball teams across the U.S. On the questionnaire, athletes indicated whether they

17
served in the Fall 2016 season. As the major premise of the study was to determine if the
SS-CSE was related to serve performance, all analyses were run only with data from
athletes who served in the Fall 2016 season. Although non-servers likely have served in
the past, if they did not serve in Fall 2016, performance statistics were not available.
Additionally, it would be reasonable to say that some responses from non-servers are
inaccurate without a specific reference point (e.g., Fall 2016 season). There were about
three times as many servers (n = 65) than non-servers (n = 22), so the majority of the data
were included.
The average age of the 65 participants included in the analyses was 19.98 years
(SD = 1.24); 12 Seniors, 17 Juniors, 23 Sophomores, and 13 Freshman participated;
43.1% of participants indicated they have played volleyball 10-15 years, 50.8% have
played 5-9 years, and 6.1% have played less than 5 years. Athletes were solicited to
participate by sending an email to the head coach, requesting they forward the study
information to their players.
Materials
A close-ended questionnaire (see Appendix A) was administered to participants
online. The questionnaire included the 12 items from the CSES, 12 items from the SS-
CSES, 11 items from the Mental Toughness Scale (Madrigal, Hamill, & Gil, 2013), 9
items addressing serve performance, and 8 demographic items. Additionally, to gauge
the level of effort and focus participants were engaging in while completing the
questionnaire, after each section they were asked to indicate how much effort they
exerted (e.g., “How much effort did you put forth when responding to the Serving Self-
Evaluation Scale?”) and what they were thinking about while responding to the items

18
(e.g., “What were you thinking about when completing the Serving Self-Evaluation
Scale?”). Athletes rated their effort on a five-point Likert Scale where a rating of 1
indicated “Very low effort” and a rating of 5 indicated “Very high effort.”
The first section of the questionnaire asked participants to provide demographic
information including their name, whether they served in the Fall 2016 season, gender,
age, ethnicity, grade level, number of years playing volleyball, and the college they
attend. Participants were then asked to complete the 12 items from the CSES
(Cronbach’s alpha = .77) and the 11 items from the Mental Toughness Scale (Cronbach’s
alpha = .88). Madrigal et al. (2013) specifically developed the Mental Toughness Scale
for use with collegiate athletes. The scale is designed to measure the key components of
mental toughness related to being a collegiate athlete. The mental toughness scale was
included to help establish discriminant validity. Six of the 12 CSES items were
negatively worded; these items were reverse scored. The mean was calculated to attain a
CSE composite score. The mean was calculated for the 11 mental toughness items to
form a mental toughness composite score. After completing these scale, participates
indicated what they were thinking about when responding, and how much effort they put
forth.
Next, participants completed the 12 item SS-CSES. As before, after completing
the items they were asked to indicate what they were thinking about while responding
and how much effort they put forth. Six of the SS-CSES items were negatively worded,
so they were reverse scored; then the means were found to form a SS-CSE composite
score (Cronbach’s alpha = .89). After completion of the SS-CSES, participants
responded to items about their serve performance. There were two performance

19
measures. The first measure included four items (i.e., items 1-4 in the Serve Performance
section in Appendix A). Items 1, 2, and 3 asked participants about their level of
agreement with statements regarding their serve performance (e.g. “My opponent
generally had trouble returning my serve.”). Athletes responded on a 5-point Likert scale
where 1 indicated a strong level of disagreement and 5 indicated a strong level of
agreement. Item 4 asked participants to rate their level of serve performance. Athletes
responded on a 5-point Likert scale where 1 indicated very poor performance and 5
indicated very good performance. The mean was calculated for these four items to form
a composite score, General Perceptions of Serve Performance (GPSP). A higher score is
indicative of a higher level of performance. An internal consistency analysis of GPSP
revealed that it had a Cronbach’s alpha of .76, indicating a moderate level of reliability.
However, when Item 1 was deleted alpha increased to .86, indicating greater reliability.
Accordingly, Item 1 was dropped from the GPSP measure.
The second performance measure consisted of five items (i.e., items 5-9 in the
Serve Performance section in Appendix A) asking athletes to indicate the percent of time
their serve attained a specific result (e.g., “% of time my serve got the other team out of
system.”). One item (% errors) was negatively worded, so it was reverse scored. The
mean of the four items was calculated to form a composite score, Self-Report Serve
Percentage (SRSP). A high score indicated a higher level of performance. An internal
consistency analysis of SRSP revealed that it had a Cronbach’s alpha of .74, indicating a
moderate level of reliability. If Item 5 is deleted alpha increases to .86, indicating greater
reliability. Despite the moderate reliability with Item 5, “percent of time my serve is an

20
error” is unambiguous and clearly related to serve performance; accordingly, it was
retained as an item in SRSP.
As an additional measures of performance, the researchers collected Fall 2016
serve statistics for each athlete that served in match that season. Statistics were collected
from the website of the athlete’s university. Statistics collected included service aces,
service aces per set, service errors, ace-to-error ratio, serve percentage, and ace-efficiency
rating. Ace efficiency is not an official NCAA statistic, but it is recorded by some teams
and leagues. Ace efficiency is calculated by subtracting the number of service errors
from the number of service aces then dividing this difference by the number of total
service attempts. Each statistic served as a separate measure of performance.
Procedure
Head coaches of inter-collegiate women’s volleyball teams were contacted
through email requesting their team’s participation in the study. The email explained the
study and included the link for the questionnaire to be completed online. If coaches
wished for their athletes to participate, they forwarded the email to the players. The
players completed the questionnaire online and it took approximately 20 to 25 minutes to
finish.
Results
Before any statistical analyses were conducted, I wanted to determine the level of
effort participants put forth, and what they were thinking about while responding to the
questionnaire. Responses on the effort scale indicated that all participants responded to
all items with at least moderate effort; CSE and Mental Toughness effort (M = 3.86, SD =
.61), SS-CSE effort (M = 3.92, SD = .71), GPSP and SRSP effort (M = 3.86, SD = .77).

21
Responses to the open-ended thought items, indicated that virtually all participants were
thinking about things related to their serve performance when responding to the SS-CSE
items. When responding to the CSE and mental toughness scales, responses on thought
items indicated that the most common things participants were thinking about were
school, life in general, and athletics.
First, there was a comparison of the three independent variables in this study:
CSE, Mental Toughness, and SS-CSE. To examine the relationship between these
variables a correlational analysis was conducted. There was significant association
between CSE and SS-CSE, r(63) = .33, p < .01. Although these two measures are
related, they predict athlete serve performance differently, as seen in subsequent analyses.
SS-CSES had a non-significant relationship with mental toughness r(65) = .19, p > .05.
This lack of a relationship helps demonstrate the discriminant validity of the SS-CSES
from a similar measure (i.e., Mental Toughness). All means, standard deviations, and
correlations between study variables are provided in Table 1.
Hypothesis 1 stated that SS-CSE would have a positive relationship with serve
performance. To test this hypothesis, a correlational analysis was conducted. There were
significant positive correlations between SS-CSE and GPSP, r(64) = .61, p < .01 and
between SS-CSE and SRSP, r(64) = .46 p < .01. To demonstrate that SS-CSE was
related to serve performance and that CSE and mental toughness were not, four more
correlations were run. There was a non-significant relationship between CSE and GPSP
r(62) = .02, p > .05, and between CSE and SRSP r(62) = .22, p > .05. Regarding mental
toughness, there were non-significant relationships with GPSP r(64) = .21, p > .05, and
SRSP r(64) = .05, p > .05.

22
Table 1
Descriptive Statistics and Correlations for all Study Variables
Variable M SD 1 2 3 4 5 6 7 8 9 10 11
1. CSE 3.66 0.53
2. MT 4.47 0.52 .38**
3. SS-CSE 3.75 0.60 .37** 0.19
4. GPSP 3.54 0.76 0.02 0.21 .61**
5. SRSP 58.82 12.35 0.22 0.04 .46** .46**
6. Service aces 15.30 11.16 0.03 0.11 .30* .44** .41**
7. Service
aces/set
0.17 0.10 0.05 0.12 0.23 .39** .28* .664**
8. Service errors 23.29 19.63 0.05 0.12 -0.09 0.02 0.01 .621** .30*
9. Ace/Error ratio 0.87 0.95 0.01 0.00 0.11 -0.02 0.14 -0.01 .53** -0.29
10. Serve
percentage
0.84 0.12 0.39 0.16 0.40 0.07 -0.19 0.15 0.23 -0.15 .56**
11. Ace
efficiency
-0.07 0.12 .005 0.19 .59** .37* 0.28 0.30 .43* -0.12 .70** .90**
Note. *p < .05, **p < .01

23
Serve performance statistics were collected for each athlete that served in a match
in the Fall 2016 season. A common indicator of good versus poor performance is ace-to-
error ratio. A correlation was run between SS-CSE and ace-to-error ratio. There was not
a significant relationship between the two, r(50) = .13, p < .05. There were only two
significant relationships found between SS-CSE and the serve statistics. SS-CSE was
associated with number of aces r(52) = .37, p < .01, and ace efficiency r(21) = .58, p <
.01.
Next, I wanted to determine how much stronger the relationship was between SS-
CSE and serve performance versus CSE and serve performance. Hypothesis 2 stated that
SS-CSE will more strongly related to serve performance than will general CSE. To test
this, I used Steiger’s (1980) z-test of difference in dependent correlations. This test is
used to determine the difference between dependent correlations, or correlations that
involve a common variable. I used Steiger’s formula 14; �̅�1 = (N – 3)1/2 (zjk - zjh)(2 –
2�̅�jk,jh)-1/2. This test determined that the correlation between SS-CSE and Perf 1 was
significantly stronger than the correlation between CSE and GPSP (z = 4.39, p < .01).
SS-CSE did not yield a significantly stronger relationship with SRSP compared to CSE (z
= 1.74, p > .05). SS-CSE had a significant correlation with aces and ace efficiency, so a
Steiger’s z-test was conducted to examine those relationships. There was a significant
difference in the relationship between SS-CSE and aces and CSE and aces, (z = 2.03, p <
.05). Also, there was a significant difference in the relationship between SS-CSE and ace
efficiency and CSE and ace efficiency (z = 2.36, p < .05). Table 2 provides a comparison
of SS-CSE and CSE zero-order relationships with the four performance criteria.

24
Finally, I tested if SS-CSE had incremental validity over general CSE in
predicting serve performance. Hypothesis 3 was that SS-CSES will have incremental
validity over CSES when predicting serve performance. This was tested using
hierarchical multiple regression analysis. The independent variables were scores on the
SS-CSES and scores on the CSES, and the dependent variables were scores on the serve
performance measures and serve statistics.
A hierarchical multiple regression was conducted to determine whether both CSE
and SS-CSE were needed to predict GPSP (athlete serve performance). At step one of
the analysis CSE was entered into the regression equation and was not significantly
related to
GPSP F(1, 60) = .03, p > .05. The multiple regression coefficient was .02, indicating that
essentially none of the variance in GPSP could be accounted for CSE. At step two SS-
Table 2
Comparisons of SS-CSE and CSE zero-order relationships serve performance criteria
Criteria N SS_CSE CSE z
GPSP 62 .61** .02 4.39**
SRSP 62 .46** .22 1.74*
Aces 50 .37** .04 2.03*
Ace efficiency 21 .58** .00 2.36*
*p < .05, **p < .01
CSE was added to the equation in addition to CSE. The addition of SS-CSE to the
regression equation containing CSE resulted in a significant increase in the relationship
with GPSP,R2 = .40, F(1, 59) = 19.57, p < .01. The multiple regression coefficient was

25
.63 indicating that 38% of the variance in GPSP could be account for by SS-CSE and
CSE.
An identical stepwise regression was conducted with SRSP. At step one of the
analysis, CSE was entered into the regression equation and was not significantly related
to SRSP F(1, 60) = 2.70, p > .05. The multiple regression coefficient was .22, indicating
that approximately 5% of the variance in GPSP could be accounted for by CSE. At step
two, SS-CSE was added to the equation in addition to CSE. The addition of SS-CSE to
the regression equation containing CSE resulted in a significant increase in the
relationship with SRSP, R2 = .18, F(1, 59) = 8.81, p < .01. The multiple regression
coefficient was .48 indicating that 23% of the variance in GPSP could be account for by
SS-CSE and CSE.
Two hierarchical multiple regressions were conducted with serve statistics as the
dependent variables. One was run for each of the statistics that had a significant
correlation with SS-CSE (i.e., aces and ace efficiency). For the regression with aces,
CSE was entered into the regression equation at step one and was not significantly related
to aces F(1, 48) = .08, p > .05. The multiple regression coefficient was .04, indicating
that virtually none of the variance in aces could be explained by CSE. SS-CSE was
entered into the model in step two. At step two, the addition of SS-CSE to the regression
equation containing CSE resulted in a significant increase in the relationship with aces,
R2 = .18, F(1, 47) = 3.36, p < .05. The multiple regression coefficient was .35,
indicating that 13% of the variance in aces could be accounted for by SS-CSE and CSE.
An identical regression was conducted for ace efficiency. In model 1, CSE was
not significantly related to serve performance F(1, 19) = 0.00 , p > .05. The multiple
26
regression coefficient was .005, indicating that no variance in ace efficiency was
accounted for by CSE. SS-CSE was added in step two. The addition of SS-CSE to the
regression equation containing CSE resulted in a significant increase in the relationship
with ace efficiency,R2 = .34, F(1, 18) = 4.70, p < .05. The multiple regression
coefficient was .59, indicating that 34% of the variance in ace efficiency was accounted
for by SS-CSE and CSE. The results from all four regressions support Hypothesis 3 that
SS-CSE has incremental validity over CSE in predicting serve performance.
Discussion
The purpose of this study was to examine if SS-CSE was related to athlete serve
performance, to determine if it would be more strongly related to athlete serve
performance than general CSE, and to examine if SS-CSE would have incremental
validity beyond general CSE in predicting serve performance. All three hypotheses were
supported. As expected, SS-CSE was significantly related to athlete serve performance
and was a far better predictor of serve performance compared to general CSE. SS-CSES
had a significant relationship with both self-report performance measures, with one of the
five NCAA serve statistics (i.e., aces), and with ace efficiency. General CSE had no
significant relationship with any of the serve performance measures. Steiger’s z-test
results indicated that the correlation between SS-CSE and GPSP was significantly
stronger than the correlation between general CSE and GPSP. Additionally, there was a
significant difference between the correlations with SS-CSE and with CSE for aces, and
ace efficiency. Results of the four hierarchical multiple regressions indicated that SS-
CSE had incremental validity over CSE in predicting all four serve performance
statistics. All results from these analyses suggest that SS-CSE is a better predictor of

27
athlete serve performance than is general CSE. When trying to predict serve
performance, SS-CSE should be used instead of the general CSE scale.
The finding that the serve specific CSE is more strongly related to and is a better
predictor of performance than is general CSE, is consistent with past research that has
shown task-specific variations of general concepts to be better predictors of specific
performance outcomes than general constructs (e.g., Bandura, 1982; Bowling et al.,
2010). No previous studies had evaluated whether SS-CSES was a better predictor of
serve performance than general CSE. Thus, this study is the first study to demonstrate
that the serve-specific CSE accounts for significantly more variance in serve performance
than does general CSE. Additionally, only a few previous studies (Machado et al.,
2016a, 2016b; Shoenfelt & Griffith, 2008) examined the relationship between SS-CSE
and serve performance. This is the first study to evaluate SS-CSE with a moderately
large sample of U.S. inter-collegiate athletes, and only the second study to use the SS-
CSE scale in English.
This study had a few potential limitations. First, data were gathered via a self-
report measure. Participants may have had social desirability bias, thus altering their
responses to be consistent with acceptable societal standards. Responses on self-report
performance items may have been inflated or even deflated. However, given that the
participants were Division 1 inter-collegiate volleyball players, it is likely that they took
responding seriously and attempted to be as accurate as possible. Furthermore, GPSP
and SRSP correlated significantly with several of the NCAA statistics (see Table1).
Also, there were items in the questionnaire that asked participants to indicate the level of
effort they engaged and what they were thinking about while responding. The responses

28
from these items indicated that everyone exerted at least moderate effort and that that
their minds were focused on things related to the study.
Another possible limitation to the current study is that there may not have been
enough items to accurately assess serve performance. However, GPSP and SRSP had
strong internal consistency. GPSP was significantly correlated with aces and ace
efficiency providing support for its validity. SRSP was significantly correlated with aces
providing support for its validity. Replicating the results of this study would provide
further support for the reliability and validity of the two serve performance measures as
criterion variables.
As discussed above, SS-CSE was found to be a better predictor of serve
performance than general CSE. This is a promising finding in this area of limited
research. This study adds to the knowledge of using skill-specific scales and it
establishes that the SS-CSE is a better predictor of serving performance outcomes than is
CSE. Future research could bring in raters of athlete performance, such as coaches, to
evaluate inter-rater reliability. Also, coaches or other raters could observe in-match serve
performance and record outcomes such as the number times the other team has trouble
returning the serve, number times the serve causes the other team to get out of system, or
number times the ball was not an ace but was not returned. To improve GPSP, perhaps a
better item to include rather than “My serve usually puts the ball in play,” would be “My
team usually scores a point when I serve.”
Conclusion and Implications
SS-CSE was found to be a better predictor of athlete serve performance than
general CSE. This is a major finding that goes beyond Shoenfelt and Griffith (2008) and

29
Machado et al. (2010a, 2010b), as it establishes that SS-CSE is a better predictor of serve
performance than CSE. Thus, this study provides further support for the idea that
specific measures are better at predicting performance outcomes than are general
measures. As discussed previously, more research needs to be done to further validate
the findings in this study. The results from this study have both theoretical and practical
applications. The results demonstrated that using specific measures predict performance
outcomes better than using general measures. Only changing a general scale slightly,
such as adding the word “serve” to the general CSE items, can influence the context the
participants consider when responding, thus changing their responses. Additionally, this
establishes SS-CSE as valid measure, which has discriminate validity when compared to
the general CSE and other similar measures such as the Mental Toughness Scale.
Practically, the results of this study indicate that volleyball coaches could use the
SS-CSE to predict serve performance. Additionally, sport psychologists could use SS-
CSE and the serve self-report performance measures to help coaches and athletes identify
areas they could work on to improve serve performance. This study supports the use of
specific measures over general measures and provides direction for future research on
serve-specific measures.

30
References
Bandura, A. (1982). Self-efficacy mechanism in human agency. American Psychologist,
37, 122-147. doi:10.1037/0003-066X.37.2.122
Bono, J. E., & Judge, T. A. (2003). Core self-evaluations: A review of the trait and its
role in job satisfaction and job performance. European Journal of Personality,
17(s1), S5-S18. doi:10.1002/per.481
Bowling, N. A., Wang, Q., Tang, H. Y., & Kennedy, D. D. (2010). A comparison of
general and work-specific measures of core self-evaluations. Journal of
Vocational Behavior, 76, 559-566. doi:10.1037/e518392013-557
Costa, P.T., Jr., & McCrae, R.R. (1992). Revised NEO Personality Inventory (NEO-PI-R)
and NEO Five-Factor Inventory (NEO-FFI) professional manual. Odessa,
FL: Psychological Assessment Resources.
Erez, A., & Judge, T. A. (2001). Relationship of core self-evaluations to goal setting,
motivation, and performance. Journal of Applied Psychology, 86, 1270-1279.
doi:10.1037//0021-9010.86.6.1270
Eysenck, H. J. (1990). Biological dimensions of personality. In L.A. Pervin (Ed.),
Handbook of Personality (pp. 244–276). New York: The Guilford Press.
Harter, S. (1990). Causes, correlates, and the functional role of global self-worth: A life-
span perspective. In R. J. Sternberg & J. Kolligan Jr. (Eds.), Competence
Considered (pp. 67-97). New Haven, CT: Yale University Press.
Johnson, R. E., Rosen, C. C., & Levy, P. R. (2007). Getting to the core of core self-
evaluation: A review and recommendations. Journal of Organizational Behavior,
29, 391-413. doi:10.1002/job.514

31
Judge, T. A., & Bono, J. E. (2001). Relationship of core self-evaluations traits – self-
esteem, generalized self-efficacy, locus of control, and emotional stability – with
job satisfaction and job performance: A meta-analysis. The Journal of Applied
Psychology, 86, 80−92. doi:10.1037//0021-9010.86.1.80
Judge, T. A., Erez, A., Bono, J. E., & Thoresen, C. J. (2003). The core self-evaluations
scale: Development of a measure. Personnel Psychology, 56, 303-331.
doi:10.1111/j.1744-6570.2003.tb00152.x
Judge, T. A., Heller, D., & Klinger, R. (2008). The dispositional sources of job
satisfaction: A comparative test. Applied Psychology: An International Review,
57, 361-372. doi:10.1111/j.1464-0597.2007.00318.x
Judge, T. A., & Kammeyer-Mueller, J.D. (2011). Implications of core self-evaluations for
a changing organizational context. Human Resources Management Review, 21,
331-341. doi:10.1016/j.hrmr.2010.10.003
Judge, T. A., & Kammeyer-Mueller, J. D. (2012). General and specific measures in
organizational behavior research: Considerations examples, and recommendations
for researchers. Journal of Organizational Behavior, 33, 161-174.
doi:10.1002/job.764
Judge, T. A., Locke, E. A., & Durham, C. C. (1997). The dispositional causes of job
satisfaction: A core evaluations approach. In L. L. Cummins & B. M. Staw (Eds.),
Research in Organizational Behavior Vol. 19 (pp. 151-188). Greenwich, CT: Jai
Press Inc.

32
Judge, T. A., Locke, E. A., Durham, C. C., & Kluger, A. N. (1998). Dispositional effects
on job and life satisfaction: The role of core evaluations. Journal of Applied
Psychology, 83, 17-34. doi:10.1037/0021-9010.83.1.17
Judge, T. A., Van Vianen, A. E., & De Pater, I. E. (2004). Emotional stability, core self-
Evaluations, and job outcomes: A review of the evidence and an agenda for future
research. Human Performance, 17, 325-346. doi:10.1207/s15327043hup1703_4
Kammeyer-Mueller, J. D., Judge, T. A., & Scott, B. A. (2009). The role of core self-
evaluations in the coping process. Journal of Applied Psychology, 94, 177-195.
doi:10.1037/a0013214
Machado, T. D. A., Shoenfelt, E. L., Nacimento, J. V. D., Taconeli, C. A., Forbellone, A.
A., Brown, R. D., & Stefanello, J. M. F. (2016a). Development and evaluation of
the serve-specific core self-evaluations scale in Portuguese. International Journal
of Sport and Exercise Psychology, 1-10. doi:10.1080/1612197x.2016.1154089
Machado, T. D. A., Valentim, F. P., & Stefanello, J. M. F. (2016b). Criterion validity of a
volley-ball serve-specific core self-evaluations scale: Relationship between serve
efficacy, effectiveness and self-assessment in infant female Brazilian athletes. The
Journal of Physical Education/UEM, 27, 1-9.
Madrigal, L., Hamil, S., & Gil, D. L. (2013). Mind over matter: The development of the
Mental Toughness Scale (MTS). The Sport Psychologist, 27, 62-77.
doi:10.1123/tsp.27.1.62
33
Rode, J. C., Judge, T. A., & Sun, J. M. (2012). Incremental validity of core self-
evaluations in the presence of other select self-concept traits: An investigation of
applied psychology criteria in the United States and China. Journal of Leadership
and Organizational Studies, 19, 326-340. doi:10.1177/1548051812442964
Rotter, J. B. (1990). Internal versus external control of reinforcement. American
Psychologist, 45, 489-493. doi: 10.1037/0003-066X.45.4.489
Schmitt, N. (2004). Beyond the Big Five: Increases in understanding and practicality
utility. Human Performance, 17, 347-357. doi:10.1207/s15327043hup1703_5
Shoenfelt, E. L., & Griffith, A. U. (2008). Evaluation of mental skills program for serving
for an intercollegiate volleyball team. Perceptual Motor Skills, 107, 293-306.
doi:10.2466/pms.107.5.293-306
Srivastava, A., Locke, E. A., Judge, T. A., & Adams, J. W. (2010). Core self-evaluations
as causes of satisfaction: The mediating role of seeking task complexity. Journal
of Vocational Behavior, 77, 255-265. doi:10.1016/j.jvb.2010.04.008
Steiger, J. H. (1980). Tests for comparing elements of a correlation matrix. Psychological
Bulletin, 87, 245-251. doi:10.1037/0033-2909.87.2.245
Stumpp, T., Muck, P. M., Hulsheger, U. R., Judge, T., & Maier, G. W. (2010). Core self-
evaluations in Germany: Validation of a German measure and its relationship to
career success. Applied Psychology: An International Review, 59, 674-700.
doi:10.1016/j.jvb.2010.04.008
Thorton, P. K., Champion Jr., W. T., & Ruddell, L. S. (2011). Sports ethics for sports
Management professionals. Sudbury, MA: Jones & Bartlett Learning.

34
Watson, D. & Clark, L. A. (1984). Negative affectivity: The disposition to experience
aversive emotional states. Psychological Bulletin, 96, 465-490. doi:10.1037/0033-
2909.96.3.465
35
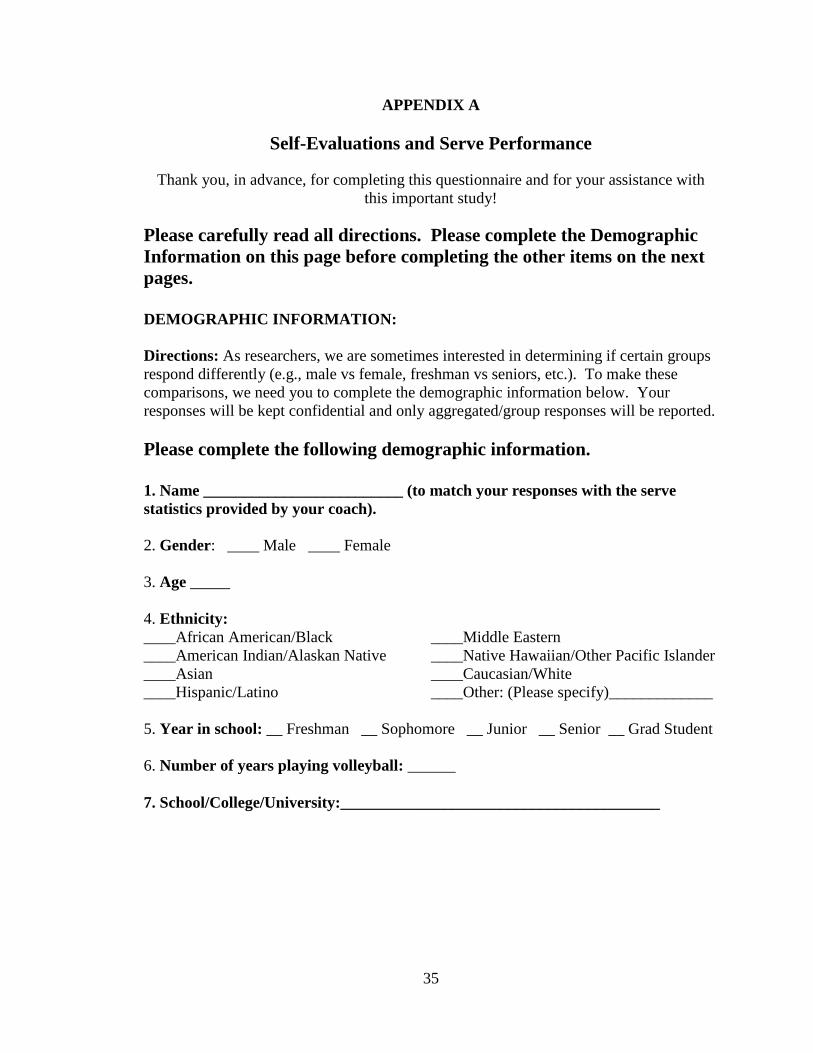
APPENDIX A
Self-Evaluations and Serve Performance
Thank you, in advance, for completing this questionnaire and for your assistance with
this important study!
Please carefully read all directions. Please complete the Demographic
Information on this page before completing the other items on the next
pages.
DEMOGRAPHIC INFORMATION:
Directions: As researchers, we are sometimes interested in determining if certain groups
respond differently (e.g., male vs female, freshman vs seniors, etc.). To make these
comparisons, we need you to complete the demographic information below. Your
responses will be kept confidential and only aggregated/group responses will be reported.
Please complete the following demographic information.
1. Name _________________________ (to match your responses with the serve
statistics provided by your coach).
2. Gender: ____ Male ____ Female
3. Age _____
4. Ethnicity:
____African American/Black ____Middle Eastern
____American Indian/Alaskan Native ____Native Hawaiian/Other Pacific Islander
____Asian ____Caucasian/White
____Hispanic/Latino ____Other: (Please specify)_____________
5. Year in school: __ Freshman __ Sophomore __ Junior __ Senior __ Grad Student
6. Number of years playing volleyball: ______
7. School/College/University:________________________________________

36
SELF-EVALUATION
Directions: Below are several statements about you with which you may agree or
disagree. Using the response scale below, indicate your level of agreement or
disagreement with each item by placing the appropriate number on the line preceding that
item.
1 2 3 4 5
Strongly disagree Disagree Neither agree Agree Strongly Agree
nor disagree
________________________________________________________________________
PART A
1. _____ I am confident I get the success I deserve in life.
2. _____ Sometimes I feel depressed.
3. _____ When I try, I generally succeed.
4. _____ Sometimes when I fail I feel worthless.
5. _____ I complete tasks successfully.
6. _____ Sometimes, I do not feel in control of my work.
7. _____ Overall, I am satisfied with myself.
8. _____ I am filled with doubts about my competence.
9. _____ I determine what will happen in my life.
10. _____ I do not feel in control of my success in my career.
11. _____ I am capable of coping with most of my problems.
12. _____ There are times when things look pretty bleak and hopeless to me.

37
PART B
1. _____ I have an inner arrogance that makes me believe I can achieve anything I set
my mind
to.
2. _____ I know when to celebrate success but also know when to stop and focus on the
next
challenge.
3. _____ I have a killer instinct to capitalize on the moment when I know I can win.
4. _____ I know what needs to be done to achieve the level of performance required to
win.
5. _____ I have the patience and discipline to control my efforts to achieve each goal
along the
ladder of success.
6. _____ Even though I am tired, I continue to train to achieve my goal.
7. _____ I use all aspects of a very difficult training environment to my advantage.
8. _____ I am able to increase my effort if it is required to win.
9. _____ When an obstacle is in my way I find a way to overcome it.
10. _____ I accept, embrace, and even welcome the elements of training that are
considered
painful.
11. _____ I have total commitment to my performance goal until every possible
opportunity of
success has passed.
Please answer the following 2 questions about how you responded to the Self-
Evaluation scales (the 23 items above).
12. What were you thinking about when completing the above items? (Please fill in
below.)
________________________________________________________________________
13. How much effort did you put forth when responding to the Self-Evaluation items?
Circle the number below that reflects your answer.
1 2 3 4 5
Very low effort Low effort Moderate effort High effort Very high effort

38
SERVING SELF-EVALUATION SCALE
Directions: Below are several statements about you when you are serving with which
you may agree or disagree. Using the response scale below, indicate your level of
agreement or disagreement with each item by placing the appropriate number on the line
preceding that item. Think about when you are serving while completing these items.
1 2 3 4 5
Strongly disagree Disagree Neither agree Agree Strongly Agree
nor disagree
________________________________________________________________________
1. _____ I am confident I get the outcome I deserve when I serve.
2. _____ Sometimes I feel depressed when I think of my serve.
3. _____ When serving, I generally succeed.
4. _____ Sometimes when I fail at serving I feel worthless.
5. _____ I complete my serve successfully.
6. _____ Sometimes, I do not feel in control of my serve.
7. _____ Overall, I am satisfied with my serve.
8. _____ I am filled with doubts about my serving competence.
9. _____ I determine what will happen with my serve
10. _____ I do not feel in control of my success in my serving.
11. _____ I am capable of coping with most of my serving problems.
12. _____ There are times when my serve looks pretty bleak and hopeless to me.
Please answer the following 2 questions about how you responded to the Serving
Self-Evaluation Scale (the 12 items above).
13. What were you thinking about when completing the above items? (Please fill in
below.)
________________________________________________________________________

39
14. How much effort did you put forth when responding to the Serving Self-Evaluation
Scale? Circle the number below that reflects your answer.
1 2 3 4 5
Very low effort Low effort Moderate effort High effort Very high
effort
SERVE PERFORMANCE SCALE
Directions: Below are three statements about you with which you may agree or disagree.
Using the response scale below, indicate your level of agreement or disagreement with
each item by placing the appropriate number on the line preceding that item.
1 2 3 4 5
Strongly disagree Disagree Neither agree Agree Strongly Agree
nor disagree
________________________________________________________________________
1. ______ My serve usually puts the ball in play.
2. ______ My opponent generally has trouble returning my serve.
3. ______ Others say I am great at serving.
________________________________________________________________________
4. Generally, how would you rate your serve performance? Circle the number below that
reflects your answer.
1 2 3 4 5
Very poor Poor Acceptable Good Very good
Please indicate the percent of time your serve attains the results below. For each
item, write the percentage on the line preceding that item.
5. ______ % of the time my serve puts the ball in play.
6. ______ % of the time my aggressive serve puts the ball in play.
7. ______ % of the time my serve gets the other team out of system.
8. ______ % of the time my serve is an ace.
9. ______ % of the time my serve is an error.
40
10. How much effort did you put forth when responding to the Serve Performance Scale
(the 9 items above)? Circle the number below that reflects your answer.
1 2 3 4 5
Very low effort Low effort Moderate effort High effort Very high effort
Thank you for participating!