an experimental scaling law for particle-size segregation
TRANSCRIPT

J. Fluid Mech. (2021), vol. 916, A55, doi:10.1017/jfm.2021.227
An experimental scaling law for particle-sizesegregation in dense granular flows
T. Trewhela1,†, C. Ancey1 and J.M.N.T. Gray2
1École Polytechnique Fédérale de Lausanne, Écublens 1015 Lausanne, Switzerland2Department of Mathematics and Manchester Centre for Nonlinear Dynamics, University of Manchester,Oxford Road, Manchester M13 9PL, UK
(Received 15 June 2020; revised 31 January 2021; accepted 11 March 2021)
Particles of differing sizes are notoriously prone to segregation in shear driven flows underthe action of gravity. This has important implications in many industrial processes, whereparticle-size segregation can lead to flow problems and reduced product quality, as wellas longer product development and start-up times. Particle-size segregation also readilyoccurs in many hazardous geophysical mass flows (such as snow avalanches, debris flowsand volcanic pyroclastic flows) and can lead to the formation of destructive boulderyflow fronts and significantly longer runouts. Although general theories exist to modelparticle-size segregation, the detailed functional dependence of the segregation flux onthe shear rate, gravity, pressure, particle concentration, grain size and grain-size ratiois still not known. This paper describes refractive-index matched oscillatory shear-cellexperiments that shed light on the segregation velocity in the two extreme cases of (i) asingle large intruder rising up through a matrix of smaller grains, and (ii) a single smallintruder percolating down through a matrix of large particles. Despite the sometimesmarkedly different time scales for segregation in these two situations, a unifying scalinglaw has been found that is able to collapse all the experimental data over a wide rangeof shear rates and grain-size ratios in the range [1.17, 4.17]. The resulting functionalform is easily generalizable to intermediate concentrations and can quantitatively capturelaboratory experiments and numerical simulations with a 50 : 50 mix of large and smallgrains.
Key words: granular media, particle/fluid flow
† Email address for correspondence: [email protected]
© The Author(s), 2021. Published by Cambridge University Press. This is an Open Access article,distributed under the terms of the Creative Commons Attribution licence (http://creativecommons.org/licenses/by/4.0/), which permits unrestricted re-use, distribution, and reproduction in any medium,provided the original work is properly cited. 916 A55-1
Dow
nloa
ded
from
htt
ps://
ww
w.c
ambr
idge
.org
/cor
e. IP
add
ress
: 85.
218.
39.6
9, o
n 20
Apr
202
1 at
16:
11:4
1, s
ubje
ct to
the
Cam
brid
ge C
ore
term
s of
use
, ava
ilabl
e at
htt
ps://
ww
w.c
ambr
idge
.org
/cor
e/te
rms.
htt
ps://
doi.o
rg/1
0.10
17/jf
m.2
021.
227

T. Trewhela, C. Ancey and J.M.N.T. Gray
1. Introduction
Shallow granular free-surface flows (or granular avalanches) are one of the most commonparticle transport mechanisms in industrial bulk solids handling processes. They form inchute flows (Savage & Hutter 1989; Gray, Wieland & Hutter 1999), as well as in thinfluid-like layers at the free surface of heaps (Williams 1968; Baxter et al. 1998; Fan et al.2012), silos (Bates 1997; Schulze 2008; Liu, Gonzalez & Wassgren 2019; Isner et al. 2020)and rotating tumblers (Gray & Hutter 1997; Hill et al. 1999; Khakhar, Orpe & Hajra2003; Schlick et al. 2015; Gilberg & Steiner 2020). These high density, gravity driven,shear flows are highly efficient at segregating particles by size. Despite many years ofresearch, particle-size segregation continues to present considerable practical problems inmany industrial processes (Johanson 1978; Isner et al. 2020). Sometimes the segregationis useful, such as in the mining industry (Wills 1979). However, in the bulk chemical,pharmaceutical, agricultural and food industries it is the single biggest cause of productnon-uniformity (Bates 1997). This can lead to complete product batches having to bediscarded at significant cost. In addition, the evolving local particle-size distribution mayfeedback on the rheology of the bulk flow and cause unexpected flow problems (Pouliquen,Delour & Savage 1997; Pouliquen & Vallance 1999; Baker, Johnson & Gray 2016) that arestill poorly understood. Segregation-induced frictional feedback is also thought to play avital part in the formation of bouldery flow fronts (Pierson 1986; Denissen et al. 2019) andstatic levees (Iverson & Vallance 2001; Baker et al. 2016; Rocha, Johnson & Gray 2019)in geophysical mass flows (such as snow avalanches, debris flows and pyroclastic flows),which can significantly enhance their run out.
In the avalanching region of these industrial and geophysical flows, small grainspercolate towards the base of the shearing layer and large grains rise towards the freesurface. Complex interactions between the shear flow and an underlying static, or slowlymoving region of grains, can lead to the development of amazing patterns in the deposit(e.g. Williams 1968; Gray & Hutter 1997; Baxter et al. 1998; Hill et al. 1999; Barkeret al. 2021). However, for a steady-state flow on a fixed base, an inversely gradedparticle-size distribution develops, with the large particles concentrated at the top of theflow and the finer grains concentrated near the base. The segregation occurs due to thecombination of two processes; kinetic sieving (Middleton 1970) and squeeze expulsion(Savage & Lun 1988). Essentially, as the layers of grains shear past one another theyact as random fluctuating sieves, which preferentially allow small particles to percolatedownwards into gaps that open up beneath them (known as kinetic sieving), while allparticles are squeezed upwards with equal probability (known as squeeze expulsion),which maintains an approximately constant solid volume fraction (GDR-MiDi 2004). Thishas been termed gravity driven segregation (Gray 2018) for short, to reflect the fact thatgravity is fundamental to the smaller grains falling into the gaps between the larger grains,and therefore setting the direction for segregation. The grains also diffuse within the shearflow, which produces a smoothly varying inversely graded particle-size distribution atsteady state (with the large grains concentrated on top of the fines) rather than beingsharply segregated.
The earliest continuum model for bidisperse particle segregation was developedby Bridgwater, Foo & Stephens (1985). It consists of a spatially one-dimensionaltime-dependent advection–diffusion equation, with a shear-rate-dependent segregationflux that shuts off when the species concentration reaches zero and one hundred per cent.The key elements of this theory are still present in more recent multi-dimensional modelsthat use either a quadratic (e.g. Savage & Lun 1988; Dolgunin & Ukolov 1995; Khakharet al. 2003; Gray & Thornton 2005; Gray & Chugunov 2006; Thornton, Gray & Hogg
916 A55-2
Dow
nloa
ded
from
htt
ps://
ww
w.c
ambr
idge
.org
/cor
e. IP
add
ress
: 85.
218.
39.6
9, o
n 20
Apr
202
1 at
16:
11:4
1, s
ubje
ct to
the
Cam
brid
ge C
ore
term
s of
use
, ava
ilabl
e at
htt
ps://
ww
w.c
ambr
idge
.org
/cor
e/te
rms.
htt
ps://
doi.o
rg/1
0.10
17/jf
m.2
021.
227

An experimental scaling law for particle-size segregation
2006; Gray & Ancey 2011; Wiederseiner et al. 2011; Tripathi & Khakhar 2013; Gajjar& Gray 2014; Tunuguntla, Bokhove & Thornton 2014; Gray & Ancey 2015; Schlick et al.2015; Xiao et al. 2016; Liu et al. 2019; Gilberg & Steiner 2020) or cubic (e.g. Gajjar & Gray2014; van der Vaart et al. 2015; Jones et al. 2018) small particle concentration dependencein the segregation flux.
Wiederseiner et al. (2011) filmed the spatially two-dimensional steady-state segregationof large black and small white particles through the sidewall of a chute. By using acalibration curve, they were able to determine the local small particle concentrationsas the grains segregated from a sharply segregated normally graded inflow (with allthe small particles on top of the large grains) to a fully developed inversely gradedsteady state. Wiederseiner et al. (2011) showed that by using the measured downslopevelocity, and choosing appropriate constant values for the segregation velocity magnitudeand the diffusivity, it was possible to accurately model the spatial development of theconcentration using Gray & Chugunov’s (2006) theory. Thornton et al. (2012) performeddiscrete particle model (DPM) simulations in a periodic box using bidisperse mixturesof particles with different size ratios. The final steady-state numerical results were thencompared to the exact steady-state solution of Gray & Chugunov (2006). In this solutionthe length scale for the transition between high concentrations of large and small particles,is inversely proportional to the Péclet number for segregation. This is defined as the flowthickness times the segregation velocity magnitude divided by the diffusivity. Thorntonet al. (2012) showed that the Péclet number increased with increasing grain-size ratio andpeaked at a value close to 8 at a grain-size ratio just below two. However, Wiederseineret al. (2011) found experimental values of the Péclet number between 11 and 19 for similarsize ratios. This discrepancy may be due to the coupling with the bulk velocity, which wasan exponential profile in Wiederseiner et al.’s (2011) experiments, but was Bagnold-like(Silbert et al. 2001) in Thornton et al.’s (2012) simulations, since they are not affected bysidewall friction.
In order to better visualize the segregation in experiments, van der Vaart et al. (2015)performed a series of refractive-index matched particle-size segregation experiments inan oscillating shear box. This has the advantage that the shear rate is independent ofdepth, and the flow field is explicitly prescribed rather than spontaneously developingin a chute flow. The experiment was stopped after each complete oscillation and thethree-dimensional particle-size distribution was determined by scanning a laser sheetacross the cell while taking a series of photographs. From these extremely detailed data,van der Vaart et al. (2015) showed that there was a fundamental asymmetry to particle-sizesegregation. In particular, a single small intruder will percolate down through a matrix oflarge grains much faster than a single large intruder will rise up through a matrix of fines.This suggests that the segregation flux function is not quadratic, but has a more cubic-likedependence on the small particle concentration (Bridgwater et al. 1985; Gajjar & Gray2014; van der Vaart et al. 2015; Jones et al. 2018).
The annular shear-cell experiments of Golick & Daniels (2009) also provide importantinsights into the functional dependence of the segregation flux. The experiment was drivenby a moving bottom plate, but the top plate was also free to move vertically in response tothe pressure generated during the flow. Their experiments showed that there were subtlepacking effects, as a normally graded initial configuration mixed and then segregated intoa final inversely graded steady state. The ability of the grains to pack tighter together ina shearing bidisperse mixture caused the top plate to drop from its initial height, andthen recover as the particles segregated again. Intriguingly, Golick & Daniels (2009)showed that when a weight was placed on the top plate the rate of segregation was
916 A55-3
Dow
nloa
ded
from
htt
ps://
ww
w.c
ambr
idge
.org
/cor
e. IP
add
ress
: 85.
218.
39.6
9, o
n 20
Apr
202
1 at
16:
11:4
1, s
ubje
ct to
the
Cam
brid
ge C
ore
term
s of
use
, ava
ilabl
e at
htt
ps://
ww
w.c
ambr
idge
.org
/cor
e/te
rms.
htt
ps://
doi.o
rg/1
0.10
17/jf
m.2
021.
227

T. Trewhela, C. Ancey and J.M.N.T. Gray
dramatically decreased. This suggests that the segregation velocity magnitude is pressureand/or solids volume fraction dependent. This has been investigated further by Fry et al.(2019) using DPM simulations of a confined shear flow. Their simulations suggest that thepercolation velocity, and hence the segregation velocity magnitude, is proportional to thereciprocal of the square root of the pressure. It follows that segregation is suppressed inGolick & Daniels’ (2009) experiments, when a weight in applied, because the pressurereduces the segregation rate while having no effect on the diffusion.
A definitive form for the segregation flux function that makes sense of, and hopefullyunifies, all the observations is still lacking. It is clear that it is dependent on the shearrate (Bridgwater et al. 1985; Savage & Lun 1988; May et al. 2010; Fan et al. 2014), thepressure (Golick & Daniels 2009; Fry et al. 2019), gravity (Vallance & Savage 2000; Gray& Thornton 2005; Gray & Chugunov 2006; Fry et al. 2019), the mean particle size (Fryet al. 2019; Chassagne et al. 2020) and the particle size ratio (Savage & Lun 1988; Gray &Thornton 2005; Thornton et al. 2012; Fan et al. 2014), as well as that it has a non-quadraticconcentration dependence (Bridgwater et al. 1985; Gajjar & Gray 2014; van der Vaart et al.2015; Jones et al. 2018). However, there may also be additional functional dependencieson the friction of the grains (Guillard, Forterre & Pouliquen 2016; Jing, Kwok & Leung2017) and the evolving local solids volume fraction (Golick & Daniels 2009; Gilberg &Steiner 2020).
This paper aims to shed further light on the functional form of the segregationflux by using refractive-index matched shear-cell experiments and dimensional analysis.Section 2 reviews the governing equations and explains the rationale behind studying theextreme end states of a single large, and a single small, intruder. Section 3 describesthe experimental shear box and the refractive-index matching technique. Section 4 usesdimensional analysis and a series of key observations to motivate a simple functional formfor the flux. Sections 5 and 6 compare the theoretical large and small intruder trajectoriesto those measured in experiment, for a wide range of shear rates and size ratios, and showthat the data can be collapsed using the same non-dimensional coefficients. Section 7shows that the theory quantitatively matches van der Vaart et al.’s (2015) shear boxexperiments with a 50 : 50 mix of particles using the same non-dimensional coefficientsand the simplest possible function to map between the size-ratio dependence of the largeand small intruders. Section 8 introduces the concept of increased packing efficiency asthe grain-size ratio becomes large and discusses how this is able to moderate the overallsegregation. Section 9 then concludes and makes some interesting observations about thefunctional form of the segregation flux that is implied by the theory.
2. Bidisperse particle-size segregation
2.1. Governing equationsConsider a mixture of large and small particles whose pore space is occupied by aninterstitial fluid. Each of the constituents occupies a volume fraction Φν ∈ [0, 1] per unitmixture volume, where the constituent letters ν = l, s and f , refer to large particles, smallparticles and fluid, respectively. It is also possible to define volume fractions of large andsmall particles per unit granular volume
φl = Φ l
Φ l + Φs , φs = Φs
Φ l + Φs . (2.1a,b)
This is useful, because in many situations of practical interest the solids volume fractionΦ = Φ l + Φs does not change very much (Silbert et al. 2001; GDR-MiDi 2004) and can
916 A55-4
Dow
nloa
ded
from
htt
ps://
ww
w.c
ambr
idge
.org
/cor
e. IP
add
ress
: 85.
218.
39.6
9, o
n 20
Apr
202
1 at
16:
11:4
1, s
ubje
ct to
the
Cam
brid
ge C
ore
term
s of
use
, ava
ilabl
e at
htt
ps://
ww
w.c
ambr
idge
.org
/cor
e/te
rms.
htt
ps://
doi.o
rg/1
0.10
17/jf
m.2
021.
227

An experimental scaling law for particle-size segregation
therefore be scaled out of the equations (Thornton et al. 2006). In this situation, the generalform of the bidisperse segregation equations for the volume fractions (concentrations) ofthe large and small particles (see e.g. Gray 2018) are
∂φl
∂t+ ∇ · (φlu) − ∇ ·
(fslφ
lφs g|g|)
= ∇ · (Dsl∇φl), (2.2)
∂φs
∂t+ ∇ · (φsu) + ∇ ·
(fslφ
sφl g|g|)
= ∇ · (Dsl∇φs), (2.3)
respectively, where u is the bulk granular velocity field, fsl is the segregation velocitymagnitude, g is the gravitational acceleration vector and Dsl is the diffusivity of the largeand small particles. Since by definition the concentration of large and small particles sumto unity
φl + φs = 1, (2.4)
the sum of (2.2) and (2.3) implies that the bulk velocity field is incompressible
∇ · u = 0. (2.5)
This is reasonable leading-order approximation that is made in the incompressibleμ(I)-rheology (GDR-MiDi 2004; Jop, Forterre & Pouliquen 2006; Barker & Gray 2017)for example (where μ is the friction and I is the inertial number). It should be noted,however, that in reality there is some compressibility and indeed compressibility is neededto make the rheology thermodynamically consistent (Goddard & Lee 2018) and well posed(Barker et al. 2017; Schaeffer et al. 2019). In this paper, however, the solids volume fractionis assumed to be equal to a constant uniform value of Φ = 0.6.
2.2. Segregation fluxes and velocitiesIn (2.2) and (2.3) the large and small particle segregation fluxes are
F l = −fslφlφs g
|g| , (2.6)
F s = +fslφsφl g
|g| , (2.7)
respectively. These are aligned with the direction of gravitational acceleration g to reflectthe fact that the downward percolation of small particles due to kinetic sieving is a gravitydriven process. In order to maintain bulk incompressibility there is a net reverse flow oflarge particles towards the surface due to squeeze expulsion. In the absence of diffusionthe segregation velocity of the large and small particles relative to the bulk flow are
ul = ul − u = −fslφs g|g| , (2.8)
us = us − u = +fslφl g|g| , (2.9)
respectively. The summation constraint (2.4) implies that the segregation fluxes (2.6)–(2.7)are zero when either of the particle species is in a pure phase. If fsl is independent of φs
and φl then (2.4) implies that the large particle segregation flux is quadratic in φs and issymmetric about φs = 1/2. Equation (2.8) shows that the corresponding large particlesegregation velocity is linear in φs and hence implies that the maximum segregation
916 A55-5
Dow
nloa
ded
from
htt
ps://
ww
w.c
ambr
idge
.org
/cor
e. IP
add
ress
: 85.
218.
39.6
9, o
n 20
Apr
202
1 at
16:
11:4
1, s
ubje
ct to
the
Cam
brid
ge C
ore
term
s of
use
, ava
ilabl
e at
htt
ps://
ww
w.c
ambr
idge
.org
/cor
e/te
rms.
htt
ps://
doi.o
rg/1
0.10
17/jf
m.2
021.
227

T. Trewhela, C. Ancey and J.M.N.T. Gray
0.25
1.0
0.5
–0.5
–1.0
–1.5
0 0.2 0.4 0.6 0.8 1.0
0
0.20
0.15
0.10
0.05
0 0.2 0.4 0.6 0.8 1.0
Large grains
Small grains
wl
ws
f slφ
s φl
φs φs
χ = 1χ = 0
(a)
(c) (d) (e)
(b)
Figure 1. (a) Segregation flux functions and (b) the large and small particle segregation velocities as a functionof the small particle concentration φs (adapted from Gajjar & Gray 2014; Gray 2018). These assume thatfsl = Aχ (1 − χφs), where χ ∈ [0, 1] and Aχ is a normalization factor giving all the flux functions the sameamplitude as the quadratic flux when χ = 0 (red lines). The blue lines show the cubic flux model of Bridgwateret al. (1985) for χ = 1 and the green lines show the intermediate cases when χ = 0.2, 0.4, 0.6, 0.8. Forχ ∈ [1/2, 1] these develop an inflection point at φs
inf = (1 + χ)/(3χ) (circular markers a) and a group of largeparticles rise fastest at φs
crit = 1/(2χ) (circular markers b). Sketches showing (c) the rapid percolation of asingle small intruder in a matrix of large grains, (d) the slow rise of a single large particle in a matrix of fineand (e) the faster rise of a group of large particles at intermediate concentrations for a sufficiently skewed fluxfunction.
velocity is equal to fsl and is attained when there is a single large grain at concentrationφs = 1− (note the superscript minus is used to show that the concentration is not 100 %small particles, i.e. there is a large intruder, but it does not significantly change the localconcentration from unity). Similarly, the small particle segregation velocity is linear inφl and the maximum segregation velocity equals −fsl and is attained when there is asingle small grain at concentration φs = 0+. The quadratic large particle segregation fluxfunction and the associated linear segregation velocities are plotted in figure 1(a,b).
Using shear box experiments van der Vaart et al. (2015) showed that there wasan underlying asymmetry to the particle-size segregation, i.e. a single small particle
916 A55-6
Dow
nloa
ded
from
htt
ps://
ww
w.c
ambr
idge
.org
/cor
e. IP
add
ress
: 85.
218.
39.6
9, o
n 20
Apr
202
1 at
16:
11:4
1, s
ubje
ct to
the
Cam
brid
ge C
ore
term
s of
use
, ava
ilabl
e at
htt
ps://
ww
w.c
ambr
idge
.org
/cor
e/te
rms.
htt
ps://
doi.o
rg/1
0.10
17/jf
m.2
021.
227

An experimental scaling law for particle-size segregation
percolating down through a matrix of large particles moves much faster than a single largeparticle being squeezed up through a matrix of fines. This is illustrated schematically infigure 1(c,d) and is not captured in the simple quadratic flux model. Gajjar & Gray (2014)showed that this asymmetry could, however, be captured by skewing the peak segregationflux towards smaller concentrations of fine grains, as illustrated for a cubic flux functionin figure 1(a). As the peak of the large particle segregation flux moves to the left, themaximum downward small particle segregation velocity (at φs = 0+) is progressivelyincreased even though the maximum amplitude of the flux function stays the same. As thecubic flux curves become skewed, the large particle segregation velocity at concentrationφs = 1− is progressively diminished below that of the quadratic flux model. Moreover,as the skewness parameter χ rises above one half, an inflection point develops in theflux function and the maximum segregation velocity of large particles no longer occursat φs = 1−, but at an intermediate concentration φs within the range [1/2, 1]. As a resulta group of large particles will rise faster than an individual large intruder as illustratedschematically in figure 1(d,e).
The theory shows that studying (i) a large intruder being squeezed up through a matrixof fine particles and (ii) a small intruder percolating down through a matrix of large grainscan yield a considerable amount of information about the shape of the segregation fluxfunction. A series of single-intruder refractive-index matched shear box experiments havetherefore been performed in this paper.
3. Refractive-index matched shear box experiments
3.1. Experimental apparatusThe shear box apparatus is shown in figure 2(a). It consists of two polyvinyl chloride(PVC) rough lateral side plates that are able to pivot about two transverse steel rods, thatare located at their centres and bolted to glass panes at the front and back of the shear box.The top ends of the PVC plates are attached to a steel bar that keeps the plates parallel andconnects them to a horizontally moving plunger driven by a rotational motor. The bottomof the sheared domain consists of another rough PVC plate of length L = 4.5 cm, whichsets the distance between the two rotating walls, and is free to move horizontally withinslotted grooves in the transparent front and back walls. As the top of the PVC side platesare driven backwards and forwards the plates pivot about their centres and push the baseplate from side to side as shown in figure 2(b). To try to prevent the formation of crystallineparticle structures the three PVC plates have a random stepped roughness profile, whoseaverage length and depth are of the scale of the background particles. For instance, in theexperiment shown in figure 2 the average profile length and depth are 4 mm and 2 mm,respectively, and the background medium size is ds = 6 mm. To give structural stabilitythe four corners of the glass panes were screwed to steel spacer tubes to maintain thetransverse separation width W = 7 cm of the shear cell. The volume between the threePVC plates is filled to a height h = 12 cm with a mixture of large and small borosilicateglass beads of diameter dl and ds, respectively. The whole cell is then submerged in arefractive-index matched fluid to make the semi-opaque intruder easy to identify and track.All the materials used to make the box were selected to be compliant with the refractiveindex matching technique. The dimensions of the shear cell have been selected to imposea slightly dilated bulk shearing motion on all the grains in the cell. Earlier prototypes hada larger separation distance between the pivoting walls that allowed crystalline particlepackings to develop in regions of the flow, which is undesired. A relatively small spacingbetween the two rotating walls appears to prevent such effects.
916 A55-7
Dow
nloa
ded
from
htt
ps://
ww
w.c
ambr
idge
.org
/cor
e. IP
add
ress
: 85.
218.
39.6
9, o
n 20
Apr
202
1 at
16:
11:4
1, s
ubje
ct to
the
Cam
brid
ge C
ore
term
s of
use
, ava
ilabl
e at
htt
ps://
ww
w.c
ambr
idge
.org
/cor
e/te
rms.
htt
ps://
doi.o
rg/1
0.10
17/jf
m.2
021.
227

T. Trewhela, C. Ancey and J.M.N.T. Gray
Plunger Motor
Crank
Power supply
h
z
θ
(a)
(b)
Figure 2. (a) A photograph of the experimental apparatus showing the power supply, motor, crank and plungerthat drive the upper end of the pivoted parallel PVC plates from side to side. The two pivot points are locatedin the middle of the sidewalls and one of them is indicated on the photo. The base plate sits in a notched grooveand is able to move freely from side to side in response to the driving motion. The volume between the pivotedPVC plates is filled with a granular material of thickness h that is composed of large and small borosilicateglass beads with diameters dl and ds, respectively. The whole system is submersed in a refractive index matchedfluid, consisting of benzyl alcohol and ethanol, which makes the majority of particles transparent and allowsthe position of the semi-opaque red intruder to be easily identified. (b) An image sequence showing the riseof a large red intruder of diameter dl = 25 mm through a background medium of small particles of diameterds = 6 mm over a number of oscillatory cycles. The small grains are just visible so it is possible to see thefree surface. A supplementary movie available at https://doi.org/10.1017/jfm.2021.227 showing the operationof experimental apparatus is available online.
Figure 2(b) and the first supplementary movie show how, over a series of cycles, thelarge red intruder is progressively squeezed upwards until it reaches the top of the cell.To analyse this motion it is useful to define a coordinate system Oxyz with the horizontalx-axis orientated in the direction of shear, the horizontal y axis across the cell and the zaxis pointing vertically upwards. Assuming that the PVC plates are pivoted at a heightz = zpivot their imposed horizontal displacement field is
x = (z − zpivot) sin(ωt) tan θmax, (3.1)
where ω is the frequency and θmax is the maximum angle of displacement of the sidewallsmeasured from the vertical axis. Typically θmax ranges between 22.5◦ and 25◦ in the
916 A55-8
Dow
nloa
ded
from
htt
ps://
ww
w.c
ambr
idge
.org
/cor
e. IP
add
ress
: 85.
218.
39.6
9, o
n 20
Apr
202
1 at
16:
11:4
1, s
ubje
ct to
the
Cam
brid
ge C
ore
term
s of
use
, ava
ilabl
e at
htt
ps://
ww
w.c
ambr
idge
.org
/cor
e/te
rms.
htt
ps://
doi.o
rg/1
0.10
17/jf
m.2
021.
227

An experimental scaling law for particle-size segregation
experiments presented here. Assuming that the resulting velocity u within the granularmaterial is spatially uniform in each (x, y)-plane, the resulting velocity components are
u = (z − zpivot)ω cos(ωt) tan θmax, v = 0, w = 0, (3.2)
respectively. The shear rate γ = 2‖D‖ where ‖D‖ =√
12 tr(D2) is the second invariant of
the strain-rate tensor D = (∇u + (∇u)T)/2. For the imposed bulk velocity field (3.2) itfollows that the shear rate
γ =∣∣∣∣dudz
∣∣∣∣ = ω| cos(ωt)| tan θmax. (3.3)
This varies in time, but is spatially uniform throughout the shear cell. The average shearrate over one complete cycle is
γm = ω
2π
∫ 2π/ω
0γ dt = 2ω
πtan θmax. (3.4)
The motor which drives the oscillatory shear cell has a variable voltage input, so theapplied shear rate depends directly on the voltage and the amplitude of the crankconnected to the plunger. Monodisperse experiments with four 6 mm opaque tracersin a 6 mm translucent media sheared at γm = 1.1 s−1 have been performed to checkthat the segregation is not caused by secondary convection in the underlying flow. Asupplementary movie showing this is available online.
3.2. Refractive-index matching, image acquisition and particle trackingThe experiments rely on the refractive-index matching (RIM) technique to make theintruder visible. This is achieved by using transparent borosilicate glass beads for thebackground media and submerging them in a mixture of benzyl alcohol and ethanol.A summary of the material properties is given in table 1. A calibration procedure wasrequired to get the right index match. An Atago RX 5000 α refractometer was thereforeused to measure samples of the interstitial fluid. The initial mixture was based on themeasurement tables of Chen, Lin & Tu (2012). Further adjustments to obtain the desiredvalue of nr = 1.4726 were done by adding small quantities of either ethanol or benzylalcohol. A value of nr in between 1.471 and 1.472 were acceptable to clearly observe theintruder, a condition that improved for a period of time due to the faster evaporation ofethanol. For the same reason, values over 1.473 were undesirable despite an initially goodmatch. The effect of the RIM is shown in figure 3(b) where a large red intruder can clearlybe seen in the submersed lower two thirds of the image, but is completely obscured by thesmall particles in the dry upper third of the image.
The RIM technique allows the intruder to be clearly seen throughout the experiment(figure 2b). Image acquisition was performed with a Basler acA2000-165uc camerapositioned in front of the shear box. Different frame rates were used for each experiment,but for most experiments recording was done at 10 frames per second. Particleidentification was done using the imfindcircles routine implemented in Matlab. Thesingle-intruder tracking was performed using the code of Crocker & Grier (1996). Aswell as tracking the opaque intruder this code also helped to identify, and exclude, falseintruders, which could occur when the intruder size was close to that of the backgroundmedium (figure 3c). Figure 4 shows two space–time plots constructed by taking the verticalline of pixels through the centre of the intruder at each frame and plotting them adjacent to
916 A55-9
Dow
nloa
ded
from
htt
ps://
ww
w.c
ambr
idge
.org
/cor
e. IP
add
ress
: 85.
218.
39.6
9, o
n 20
Apr
202
1 at
16:
11:4
1, s
ubje
ct to
the
Cam
brid
ge C
ore
term
s of
use
, ava
ilabl
e at
htt
ps://
ww
w.c
ambr
idge
.org
/cor
e/te
rms.
htt
ps://
doi.o
rg/1
0.10
17/jf
m.2
021.
227

T. Trewhela, C. Ancey and J.M.N.T. Gray
(a)
(b) (c)
Figure 3. (a) Close-up photograph to show how the random profile structure of the pivoting and sliding wallshelps to prevent the formation of crystalline structures in the particles surrounding the intruder. (b) Imageshowing the contrast between dry and wet conditions using the RIM technique with transparent borosilicateglass beads and a mixture of benzyl alcohol and ethanol. (c) Semi-opaque red intruder identified with theimage analysis code.
Material nr ρ∗ (g cm−3) η (cP) Supplier
Borosilicate glass 1.4726 2.2 NA Schäffer GlasBenzyl alcohol 1.5396 1.044 5.474 Acros OrganicsEthanol 1.3656 0.789 1.2 Fisher Scientific
Table 1. Refractive indices nr , intrinsic densities ρ∗, viscosities η and suppliers for the materials used in therefractive-index matched experiments.
916 A55-10
Dow
nloa
ded
from
htt
ps://
ww
w.c
ambr
idge
.org
/cor
e. IP
add
ress
: 85.
218.
39.6
9, o
n 20
Apr
202
1 at
16:
11:4
1, s
ubje
ct to
the
Cam
brid
ge C
ore
term
s of
use
, ava
ilabl
e at
htt
ps://
ww
w.c
ambr
idge
.org
/cor
e/te
rms.
htt
ps://
doi.o
rg/1
0.10
17/jf
m.2
021.
227

An experimental scaling law for particle-size segregation
0.10
0.09
0.08
0.07
0.06
0.05
0.04
0.03
0.02
0.01
50 100 150 200 250 300 350 400 450 20 400
z (m)
t (s) t (s)
(a) (b)
Figure 4. (a) Space–time plot of a large intruder of diameter dl = 19 mm segregating upwards in a mediumof small particles of diameter ds = 6 mm subject to an average shear rate γm = 0.26 s−1 (taken from set 2in table 2). The space–time plot is made by plotting the vertical line of pixels that passes through the centreof the large particle at each time. The intruder therefore appears as a band of red, while the index matchedinterstitial fluid and the background medium of small particles appear green. The trajectory of the centre of thelarge intruder as a function of time is shown with the white dashed line. (b) Space–time plot of small intruderparticle of diameter ds = 6 mm percolating down through a matrix of large particles of diameter dl = 14 mmat a shear rate γm = 0.34 s−1 (taken from set 4 in table 2). In this experiment the background medium appearsblack while the intruder is orange. The intruder centre as a function of time is shown with a white dashed line.
one another. It is striking that for comparable size ratios and shear rates the large intrudertakes much longer to be squeezed up to the free surface than the small intruder takes topercolate down to the base. It is also very significant that the trajectories of the intrudercentres are both curved.
3.3. Experimental data setsA series of five sets of experiments were performed in order to understand the functionaldependence of the segregation velocity magnitude fsl. Sets 1 and 2 correspond toexperiments with a single large intruder rising through a medium of small particles. In set1 the diameter of the large and small particles are held constant and the shear rate is varied,while in set 2 the diameter of the small particles and the shear rate are held constant andthe diameter of the large intruder is changed. These sets represent experimental conditionswhere φ = 1−. Sets 3, 4 and 5 all relate to a small intruder segregating through a matrix oflarge grains, when φ = 0+. In sets 3 and 4 the shear rate is varied for two different smallintruder diameters, while in set 5 the shear rate is held constant and the small intruderdiameter is changed. The experimental conditions of all the sets are summarized in table 2.
4. Preliminary interpretation of the data
4.1. Dimensional analysisThe experimental data are complex and contain a number of functional dependencies thatare hard to interpret without a clear initial hypothesis. It is therefore useful to consider whatdimensional analysis can say about the functional behaviour of the segregation velocity
916 A55-11
Dow
nloa
ded
from
htt
ps://
ww
w.c
ambr
idge
.org
/cor
e. IP
add
ress
: 85.
218.
39.6
9, o
n 20
Apr
202
1 at
16:
11:4
1, s
ubje
ct to
the
Cam
brid
ge C
ore
term
s of
use
, ava
ilabl
e at
htt
ps://
ww
w.c
ambr
idge
.org
/cor
e/te
rms.
htt
ps://
doi.o
rg/1
0.10
17/jf
m.2
021.
227

T. Trewhela, C. Ancey and J.M.N.T. Gray
Set Intruder dl (mm) ds (mm) R = dl/ds γm (s−1)
1 Large 19 6 3.17 0.2619 6 3.17 0.4219 6 3.17 0.5919 6 3.17 0.77
2 Large 10 6 1.67 0.2612 6 2 0.2619 6 3.17 0.2625 6 4.17 0.26
3 Small 14 8 1.75 0.3414 8 1.75 1.1014 8 1.75 2.30
4 Small 14 6 2.33 0.3414 6 2.33 0.6314 6 2.33 0.87
5 Small 14 12 1.17 0.3414 10 1.4 0.3414 8 1.75 0.3414 6 2.33 0.3414 4 3.5 0.34
Table 2. Diameters of the large particles dl, small particles ds, the size ratio R = dl/ds and average shear ratesγm for each experimental set 1–5. Sets 1–2 correspond to a single large intruder rising through a matrix ofsmall particles, whereas sets 3–5 correspond to a single small particle percolating down through a matrix oflarge grains.
magnitude fsl before presenting the results. For a dry bidisperse mixture of large and smallparticles, fsl is considered to be an output of the system. The inputs are the particle sizesdl and ds, the intrinsic density of the grains ρ∗, the volume fraction of small particlesφs = 1 − φl per unit granular volume, the solids volume fraction Φ, the bulk shear stressτ , the pressure p, gravity g and the shear rate γ . This is a total of nine variables with threeprimary dimensions (mass, length and time), so dimensional analysis implies that thereare six independent non-dimensional quantities
μ = τ
p, I = γ d√
p/ρ∗, Φ, P = p
ρ∗gd, R = dl
ds, φs, (4.1a–f )
where μ is the friction, I is the generalized inertial number in which d is the volumefraction weighted average particle diameter
d = φldl + φsds, (4.2)
P is the non-dimensional pressure and R = dl/ds is the grain-size ratio. In this analysis, theexperimental system size and any higher gradients of the variables are implicitly assumednot to be of importance. For a monodisperse system in the absence of gravity, only thefirst three non-dimensional variables in (4.1a–f ) are relevant, and (4.2) reduces to themonodisperse particle diameter. It was this type of dimensional analysis combined withobservations from DPM simulations and experiments that led to the development of theincompressible μ(I)-rheology (GDR-MiDi 2004; Jop et al. 2006), which has advanced ourunderstanding of the rheology of monodisperse granular flows.
Dimensional analysis also provides a powerful way of interpreting the segregationexperiments in this paper. It is assumed that it is the combination of shear-induced gravity
916 A55-12
Dow
nloa
ded
from
htt
ps://
ww
w.c
ambr
idge
.org
/cor
e. IP
add
ress
: 85.
218.
39.6
9, o
n 20
Apr
202
1 at
16:
11:4
1, s
ubje
ct to
the
Cam
brid
ge C
ore
term
s of
use
, ava
ilabl
e at
htt
ps://
ww
w.c
ambr
idge
.org
/cor
e/te
rms.
htt
ps://
doi.o
rg/1
0.10
17/jf
m.2
021.
227

An experimental scaling law for particle-size segregation
driven percolation (kinetic sieving) and squeeze expulsion (Middleton 1970; Bridgwateret al. 1985; Savage & Lun 1988; Gray & Thornton 2005; Gray 2018) that generate thedominant mechanism for segregation in dense granular flows. In particular, dimensionalanalysis implies that the segregation velocity magnitude should scale as
fsl ∼ γ d G(μ, I, Φ, P, R, φs), (4.3)where γ d is chosen as a reference scale and G is an arbitrary function of the sixnon-dimensional variables defined in (4.1a–f ). The five sets of experiments detailed intable 2 provide key observations that help to constrain the functional form of G.
4.2. Fundamental observations and resulting hypothesisThis paper makes four key assumptions based on the observations (a)–(d) below:-(a) Experimental data sets 1, 3 and 4 imply that the segregation velocity magnitude fslscales linearly with the shear rate γ for both large and small intruders. (b) Experimentalset 2 implies that the rise velocity of large intruders scales linearly with the particle sizeratio R, and since it necessarily shuts off when R = 1, this implies that fsl scales linearlyin R − 1 in the limit φs = 1−. (c) Set 5 shows that in the limit φs = 0+ small intrudersexhibit an approximately quadratic dependence on R − 1 for large size ratios, but have thesame linear dependence on R − 1, as the large intruders, for small size ratios in the range[1, 1.5]. (d) All of the data sets in 1–5 show that the large and small intruders move alongcurved trajectories (see e.g. figure 4), with slower percolation and rise rates deeper in theflow, where the lithostatic pressure is higher. These trajectories are well approximated byquadratic curves. Since the pressure is lithostatic in the shear cell, this suggests that fsl isproportional to 1/(C + P), where the non-dimensional constant C has been introduced toprevent a singularity when P = 0 at the free surface.
The four key experimental observations (a–d) above suggest that the segregationvelocity magnitude can be written as
fsl = B γ dF(R, φs)
C + P, (4.4)
where B and C are non-dimensional constants and F is a function of R and φs. The particlesize-ratio dependence is encapsulated in F , which satisfies the limits
F(R, 1−) = R − 1, (4.5)
F(R, 0+) = R − 1 + E(R − 1)2, (4.6)where E is another non-dimensional constant. A simple functional form that captures thesingle large and small intruder cases (4.5) and (4.6) is
F = (R − 1) + EΛ(φs)(R − 1)2, (4.7)where the function Λ satisfies the constraints
Λ(0) = 1, and Λ(1) = 0. (4.8a,b)A very simple linear function for Λ will be investigated further in § 7.
Substituting for the non-dimensional pressure P from the scaling (4.1a–f ) thesegregation velocity magnitude can be written as
fsl = B ρ∗gγ d2
Cρ∗gd + pF(R, φs). (4.9)
This formula captures the key processes of gravity, shear and pressure that drive kineticsieving and squeeze expulsion during the segregation of particles of different sizes and
916 A55-13
Dow
nloa
ded
from
htt
ps://
ww
w.c
ambr
idge
.org
/cor
e. IP
add
ress
: 85.
218.
39.6
9, o
n 20
Apr
202
1 at
16:
11:4
1, s
ubje
ct to
the
Cam
brid
ge C
ore
term
s of
use
, ava
ilabl
e at
htt
ps://
ww
w.c
ambr
idge
.org
/cor
e/te
rms.
htt
ps://
doi.o
rg/1
0.10
17/jf
m.2
021.
227

T. Trewhela, C. Ancey and J.M.N.T. Gray
size ratios. The local small particle concentration φs = 1 − φl enters through the averagegrain size (4.2) and the nonlinear size-ratio dependence (4.7), and automatically generatesasymmetry in the segregation flux functions. Equation (4.9) neglects any dependence onthe friction of the particles μ and the solids volume fraction Φ. Such dependencies mayexist (see Golick & Daniels 2009; Guillard et al. 2016; Jing et al. 2017), but they add anextra level of complexity that goes beyond the scope of this paper. Since I = γ d/
√p/ρ∗
is linear in the shear rate γ , (4.9) can be reformulated to have a linear inertial numberdependence instead of a linear shear-rate dependence. Importantly the experimentalobservation (a), above, implies that there is either a linear shear-rate dependence or alinear inertial number dependence, but to leading order, at least, other shear rate or inertialnumber dependencies are not permitted.
4.3. Effect of the interstitial fluidEquations (4.4) and (4.9) take no account of the interstitial fluid present in the experimentsin § 3. Thornton et al. (2006) used a three phase mixture theory, composed of large grains,small grains and an interstitial fluid, to show that the segregation velocity magnitude fslwas moderated by the relative density difference
ρ = ρ∗ − ρf∗
ρ∗, (4.10)
where ρf∗ is the density of the fluid. If this multiplicative factor is included then fsl = 0
when ρf∗ = ρ∗, and the particles do not segregate. This is consistent with the fluid density
matched bidisperse experiment of Vallance & Savage (2000) in which no significantsegregation was observed. Vallance & Savage (2000) also made the rather counterintuitiveobservation that the segregation was slightly weaker in water than in a water–ethanolmixture that was 3.7 times more viscous. The viscosity therefore does not suppresssegregation as Vallance & Savage (2000) had hypothesized, but, instead, it is the relativedensity difference ρ that explains their results (Thornton et al. 2006). All the experimentsin this paper are performed with the same interstitial fluid, and for simplicity the factor ρ
is not explicitly included throughout most of the paper. However, in § 8 the dry DPMsimulations of Thornton et al. (2012) are considered, and to compare the theory it isnecessary to correct the experimentally measured value of B to account for the absence ofinterstitial fluid.
4.4. Intruder trajectoriesIn the shear box the gravitational acceleration vector g points downwards parallel to the zaxis, i.e. g = −gk, where k is the unit vector in the z-direction. For the bulk velocity fielddefined in (3.2) it follows from (2.8) that, in the absence of diffusion, the vertical velocityof the large particles satisfies
wl = dzl
dt= fslφ
s, (4.11)
where fsl is given by (4.9). For the case of a single large intruder, φs = 1−, and hence theaverage particle size d = ds. The large particle trajectory therefore satisfies the ordinary
916 A55-14
Dow
nloa
ded
from
htt
ps://
ww
w.c
ambr
idge
.org
/cor
e. IP
add
ress
: 85.
218.
39.6
9, o
n 20
Apr
202
1 at
16:
11:4
1, s
ubje
ct to
the
Cam
brid
ge C
ore
term
s of
use
, ava
ilabl
e at
htt
ps://
ww
w.c
ambr
idge
.org
/cor
e/te
rms.
htt
ps://
doi.o
rg/1
0.10
17/jf
m.2
021.
227

An experimental scaling law for particle-size segregation
differential equation (ODE)
dzl
dt= B ρ∗gγ d2
s
Cρ∗gds + pF(R, 1−). (4.12)
Substituting for F(R, 1−) from (4.5) and assuming that the pressure in the grains islithostatic
p = ρ∗gΦ(h − z), (4.13)
the ODE (4.12) reduces todzl
dt= B γ d2
s (R − 1)
Cds + Φ(h − zl). (4.14)
This is separable and can be integrated, subject to the initial condition that zl = zl0 at t = 0,
to show that time is a quadratic function Z l of the vertical coordinate zl, i.e.
Klt = Cds(zl − zl0) + Φ
2[(h − zl
0)2 − (h − zl)2] = Z l(zl), (4.15)
where the constantKl = B γ d2
s (R − 1), (4.16)
is different for each individual experiment. Note that ds and Φ, which arise in the definitionof Z l in (4.15), are the same for all the experiments in sets 1 and 2. The quadratic equation(4.15) can be solved to give an explicit formula for the trajectory of the large intruder
zl = 1Φ
[Cds + Φh −
√C2d2
s + 2CdsΦ(h − zl0) + Φ2(h − zl
0)2 − 2ΦKlt
]. (4.17)
An exactly analogous argument implies that at φs = 0+ the trajectory of a small intrudersatisfies the ODE
dzs
dt= −B γ d2
l [(R − 1) + E(R − 1)2]Cdl + Φ(h − zs)
. (4.18)
This is also separable and can be integrated, subject to the initial condition that zs = zs0 at
t = 0, to show that time is a quadratic function Zs of the vertical coordinate zs,
Kst = −Cdl(zs − zs0) − Φ
2[(h − zs
0)2 − (h − zs)2] = Zs(zs), (4.19)
where the constantKs = B γ d2
l [(R − 1) + E(R − 1)2], (4.20)
changes between experiments. In all the experiments in sets 3–5 the values of dl and Φ inthe definition of Zs are the same. The quadratic equation (4.19) can be solved to give anexplicit formula for the small intruder trajectory
zs = 1Φ
[Cdl + Φh −
√C2d2
l + 2CdlΦ(h − zs0) + Φ2(h − zs
0)2 + 2ΦKst
]. (4.21)
A key test of this scaling argument and the fundamental assumptions (a)–(d) in § 4.2 iswhether the intruder trajectories (4.17) and (4.21) are able to collapse all of the data withthe same choices of the non-dimensional constants B, C and E .
916 A55-15
Dow
nloa
ded
from
htt
ps://
ww
w.c
ambr
idge
.org
/cor
e. IP
add
ress
: 85.
218.
39.6
9, o
n 20
Apr
202
1 at
16:
11:4
1, s
ubje
ct to
the
Cam
brid
ge C
ore
term
s of
use
, ava
ilabl
e at
htt
ps://
ww
w.c
ambr
idge
.org
/cor
e/te
rms.
htt
ps://
doi.o
rg/1
0.10
17/jf
m.2
021.
227

T. Trewhela, C. Ancey and J.M.N.T. Gray
4.5. The role of particle diffusionIt is important to note that the intruder trajectories calculated in § 4.4 implicitly assume thatthere is no diffusion. In fact, experimental observations suggest that there is a significantamount of self-diffusion that leads to the intruders performing random walks around themean path. Utter & Behringer (2004) used a two-dimensional Couette cell to make detailedexperimental measurements of the self-diffusion in a monodisperse system of disks. Theyconcluded that the diffusion was anisotropic, but that to leading order the diffusivity wasproportional to γ d2, where d was the particle diameter. The natural generalization of thisresult to polydisperse systems is to replace the particle diameter with the mean particlediameter (4.2) to give
Dsl = Aγ d2, (4.22)
where A is a non-dimensional constant. Figure 9(b) in Utter & Behringer’s (2004) papershows that the tangential diffusivity implies A = 0.223, whereas the radial diffusivityimplies A = 0.108. The simulations in § 7 adopt the lower value of A, because it is basedon measurements of the diffusivity made normal to the direction of shear, which is also thepredominant direction for diffusion and segregation in the shear box experiments. Note,that since d = ds for a large intruder and d = dl for a small intruder equation (4.22) impliesthat there will be much more diffusion, and hence variability, for the small intruder pathsthan for the large intruders.
5. Large intruder experiments
The segregation of a single large intruder is stable and robust, especially when the sizeratio is large. This is a reflection of the fact that, according to the diffusion scaling (4.22),the underlying self-diffusion within the small particle matrix is lower than for a largeparticle matrix. Larger size ratio intruders also have a lot of contacts with the surroundingsmall grains, which provides another mechanism for averaging the natural fluctuations.As a result the large intruders only occasionally migrate to the PVC side plates, wherethey can become stuck when the particle size ratio R is close to unity. To determine thevalues of B and C a global least squares fit is made to all the large intruder trajectories inexperimental sets 1 and 2. This suggests that
B = 0.3744, and C = 0.2712. (5.1a,b)
In practice, the constant C only changes the gradient of the trajectory close to the freesurface, and this is least well constrained because the experimental free surface is notclearly defined at the particle scale. Good fits to the data can also be obtained by assumingC = 0, in which case B = 0.3615. This is only a 3.45 % difference. Setting C = 0 does,however, introduce a pressure singularity at p = 0, which implies that the segregationvelocity becomes infinite at the free surface. This singularity is not only unphysical, butcauses difficulties in numerical methods, so in the sections that follow C is assumed totake its global value defined in (5.1a,b).
5.1. Variable shear rate for the large intrudersThe experimentally measured position of a large 19 mm intruder in a matrix of small6 mm particles as a function of time is shown in figure 5, for four different shear rates.These experiments correspond to set 1 in table 2. The intruder struggles to segregateupwards when it is close to the bottom of the cell, but once it moves past a few layersit segregates faster and faster towards the surface. As a result the intruder trajectories all
916 A55-16
Dow
nloa
ded
from
htt
ps://
ww
w.c
ambr
idge
.org
/cor
e. IP
add
ress
: 85.
218.
39.6
9, o
n 20
Apr
202
1 at
16:
11:4
1, s
ubje
ct to
the
Cam
brid
ge C
ore
term
s of
use
, ava
ilabl
e at
htt
ps://
ww
w.c
ambr
idge
.org
/cor
e/te
rms.
htt
ps://
doi.o
rg/1
0.10
17/jf
m.2
021.
227

An experimental scaling law for particle-size segregation
0.10
0.09
0.08
0.07
0.06
0.05
0.04
0.03
0.02
0 100 200 300 400 500 600 700 800
2.0
1.5
1.0
0.5
0 0.2 0.4 0.6 0.8
(×10–5)
γm (s–1)
γm = 0.26 s–1, Kl = 7.2 × 10⁻⁶ m2 s–1
γm = 0.42 s–1, Kl = 1.0 × 10⁻⁵ m2 s–1
γm = 0.58 s–1, Kl = 1.4 × 10⁻⁵ m2 s–1
γm = 0.77 s–1, Kl = 1.8 × 10⁻⁵ m2 s–1
Quadratic fit
Kl (m
2 s
–1)
t (s)
zl (m)
Figure 5. Experimentally measured position of a 19 mm large intruder segregating through a 6 mm matrix ofsmall particles as a function of time, for four different imposed shear rates γm = 0.26, 0.42, 0.59 and 0.77 s−1.Darker red lines correspond to higher shear rates. These data correspond to set 1 in table 2. For each case,(4.15) is fitted to the experimental data to determine the constant Kl assuming that the depth h = 12 cm andC = 0.2712 is given by the global best fit to all the large intruder data. The fitted intruder trajectory in time(4.17) is then plotted for each γm with dashed lines for comparison. The coefficient of determination rangesbetween 0.96 and 0.97 for the proposed fits. The inset shows the fitting constants Kl as a function of γm. Thesepoints are closely approximated by the global best fit straight (red dashed) line that passes through the origin(5.2), implying that fsl has a linear shear-rate dependence.
show a pronounced curvature in time that are well fitted by the quadratic curves derivedin § 4.4 using the global value of C defined in (5.1a,b). For each individual trajectory,(4.15) is fitted to the experimental data by determining the constant Kl that gives the bestapproximation. Typically the fits were extremely good, with a coefficient of determinationlying in the range 0.96–0.97. As the shear-rate γm is increased the large intruder segregatesto the surface faster and therefore the time to reach the surface decreases, while the fittingconstant increases. The four values of Kl are plotted as a function of γm in the inset plotin figure 5, together with the theoretical straight line passing through the origin defined in(4.16), i.e.
Kl = Bγmd2s (R − 1), (5.2)
where it is assumed that γ = γm and B is given by the global value in (5.1a,b). Thepoints all lie close to the straight line, although for this subset of data the global fit is notquite the best fit. The data are, however, close to the global fit and is consistent with thefundamental assumption (a) in § 4.2 that the segregation velocity magnitude is linear in theshear rate.
916 A55-17
Dow
nloa
ded
from
htt
ps://
ww
w.c
ambr
idge
.org
/cor
e. IP
add
ress
: 85.
218.
39.6
9, o
n 20
Apr
202
1 at
16:
11:4
1, s
ubje
ct to
the
Cam
brid
ge C
ore
term
s of
use
, ava
ilabl
e at
htt
ps://
ww
w.c
ambr
idge
.org
/cor
e/te
rms.
htt
ps://
doi.o
rg/1
0.10
17/jf
m.2
021.
227

T. Trewhela, C. Ancey and J.M.N.T. Gray
0.10
0.09
0.08
0.07
0.06
0.05
0.04
0.03
0.02
0 200 400 600 800 1000 1200 1400 1600 1800
t (s)
1.4
1.2
1.0
0.8
0.6
0.4
0.2
0 1 2 3 4
R – 1
Kl (m
2 s
–1)
(×10–5)
R = 1.7, Kl = 2.9 × 10⁻⁶ m2 s–1
R = 2, Kl = 4.2 × 10⁻⁶ m2 s–1
R = 3.2, Kl = 7.2 × 10⁻⁶ m2 s–1
R = 4.2, Kl = 1.2 × 10⁻⁵ m2 s–1
Quadratic fit
zl (m)
Figure 6. Experimentally measured position of a large intruder of size dl = 10, 12, 19 and 25 mm (darker redlines correspond to larger intruders) in a matrix of 6 mm small particles as a function of time, and at the sameimposed shear rate γm = 0.26 s−1. This corresponds to set 2 in table 2. For each case, (4.15) is fitted to theexperimental data to determine the constant Kl assuming that the depth h = 12 cm and C = 0.2712 is given bythe global best fit to all the large intruder data. The fitted intruder trajectory in time (4.17) is then plotted foreach size ratio R with dashed lines for comparison. The coefficient of determination ranges between 0.93 and0.98. The inset shows the measured constants Kl as a function of R − 1. These points are well approximatedby a global best fit straight (red dashed) line that passes through the origin (5.2), implying that fsl has a lineardependence on R − 1.
5.2. Variable size ratio for the large intrudersFigure 6 shows experimental set 2 (from table 2) in which both the shear rate γm =0.26 s−1 and the small particle diameter ds = 6 mm are held constant, while the diameterof the large intruder dl is varied. In this limit the average particle size d = ds, but the sizeratio R changes between experiments. As the size ratio is increased the particles segregatefaster and the time for a particle to rise from the bottom to the top of the cell decreases. Ineach case the large intruders describe curved trajectories in time as they rise through thecell. This implies that near the bottom of the cell the segregation rate is considerably lowerthan close to the surface, where the intruder moves notably faster. The intruder trajectoriesare all well approximated by the quadratic curves derived in § 4.4, although there is someevidence that the curves become more linear at high size ratios. The curves are fittedusing a similar procedure to § 5.1, i.e. by determining the best value of the constant Kl foreach experiment using the global value of C defined in (5.1a,b). The fitted values of Kl areplotted as a function of the size ratio R − 1 in the inset of figure 6. The points lie extremelyclose to the theoretical straight line (5.2) that passes through the origin, indicating that thesegregation rate magnitude fsl is linear in R − 1 even at high size ratios, as assumed inhypothesis (b) in § 4.2.
916 A55-18
Dow
nloa
ded
from
htt
ps://
ww
w.c
ambr
idge
.org
/cor
e. IP
add
ress
: 85.
218.
39.6
9, o
n 20
Apr
202
1 at
16:
11:4
1, s
ubje
ct to
the
Cam
brid
ge C
ore
term
s of
use
, ava
ilabl
e at
htt
ps://
ww
w.c
ambr
idge
.org
/cor
e/te
rms.
htt
ps://
doi.o
rg/1
0.10
17/jf
m.2
021.
227

An experimental scaling law for particle-size segregation
5.3. Collapse of all the large intruder experimentsAll the large intruder trajectory data from sets 1 and 2 can be collapsed by plottingthe quadratic function of the height Z l, defined in (4.15), as a function of scaled timeBγmd2
s (R − 1)t as shown in figure 7. This collapse is based on (4.15) and (5.2), whichimply that
Z l = Bγmd2s (R − 1)t. (5.3)
The mapped trajectories should therefore all lie on the 45 degree line shown in figure 7. Allthe trajectories follow the right trend, but move slightly off the ideal straight line as theyrise up through the cell. Some variability is to be expected because the theoretical largeintruder trajectory completely ignores the effect of diffusion, which will generate randomwalks around the average behaviour captured by the theory. Some of the variability is alsolikely to be an artifact of the oscillatory shear cell, which moves through a maximum angleθmax before reversing direction, rather than shearing in a consistent direction. This reducesthe particle rearrangements, somewhat, and creates brief interludes during which the largeintruder oscillates around a given level, before rising upwards again. As can be seen infigure 7 these interludes create a horizontal offset in some of the shear-rate data, beforethe overall rise continues along a line parallel to the 45 degree line. The inset image infigure 7 shows the values of Kl as a function of γmd2
s (R − 1). All the experimental pointsfor variable shear rate and variable size ratio lie close to the theoretical straight line impliedby the global fit with the values of B and C from (5.1a,b). This confirms that hypotheses(a), (b) and (d), made in § 4.2, are able to collapse all the large intruder data, with the sameconstant values of B and C.
6. Small intruder experiments
The small intruders typically percolate downwards much faster than the large particlessegregate upwards (as shown in figure 4). It is also anticipated that the small intruders willbe subject to much more diffusion than the large intruders, because the average grain sizeof the background medium d = dl > ds in the diffusivity (4.22). These combined effectsresult in the small intruders segregating much more erratically than the large intruders.Several experimental difficulties were observed. The intruder could migrate towards thePVC side plates and become stuck, or get stuck on top of a layer of well-packed largeparticles. Experimental data where the intruder suddenly dropped down after being stuckfor a large number of cycles were not considered to be representative. To ensure consistentdata were collected, the experiments were repeated four times for R = 1.167, up to eighttimes for 1.167 < R < 3.5 and six times for R = 3.5. Three representative experimentalcurves were then selected, on the basis that the intruder did not contact the walls, and thesegregation times were similar.
6.1. Variable shear rate for the small intrudersFigure 8 shows the trajectories of an 8 mm small intruder in a matrix of 14 mm largeparticles for three different shear rates corresponding to set 3 in table 2. The threerepresentative profiles are plotted for each shear rate. The theoretical small particletrajectory is fitted to each curve using the same value of C as in (5.1a,b), and the averagevalue of Ks is then used to determine the overall fit. There is quite a lot of variability aboutthe individual fits, as anticipated, but the fitted trajectory captures the overall behaviour ofthe small intruders as they percolate downwards. As the shear rate is increased the timetaken for intruder to reach the bottom of the cell decreases and Ks increases. The values
916 A55-19
Dow
nloa
ded
from
htt
ps://
ww
w.c
ambr
idge
.org
/cor
e. IP
add
ress
: 85.
218.
39.6
9, o
n 20
Apr
202
1 at
16:
11:4
1, s
ubje
ct to
the
Cam
brid
ge C
ore
term
s of
use
, ava
ilabl
e at
htt
ps://
ww
w.c
ambr
idge
.org
/cor
e/te
rms.
htt
ps://
doi.o
rg/1
0.10
17/jf
m.2
021.
227

T. Trewhela, C. Ancey and J.M.N.T. Gray
4.5
4.0
3.5
3.0
2.5
2.0
1.5
1.0
0.5
0 0.5 1.0 1.5 2.0 2.5 3.0 3.5 4.0 4.5
(×10–3)
(×10–3)
(×10–5)
2
1
0
0 4 62
Kl (m
2 s
–1)
Zl (m2)
γmds2(R – 1) (m2 s–1)
Bγmds2(R – 1)t (m2)
Figure 7. The large intruder trajectories for varying shear rate γm and size ratio R are collapsed onto anapproximately straight (dashed) 45 degree line by plotting the transformed height Z l, defined in (4.15), againstthe scaled time Bγmd2
s (R − 1)t. The data correspond to all the cases in sets 1 and 2 in table 2. The inset plotshows the best fit values of the constants Kl for each of the experiments as a function of γmd2
s (R − 1). The reddashed line in the inset has gradient B = 0.3744, i.e. the global best fit value of B. The colours of the pointsand the lines are the same as those used in figures 5 and 6, where the legends are defined.
of Ks are plotted in the inset graph in figure 8 and show a clear linear dependence on theaverage shear rate γm, consistent with the theoretical line
Ks = Bγmd2l [(R − 1) + E(R − 1)2], (6.1)
implied by (4.20). The quadratic dependence on R − 1 in (6.1) suggests that thesegregation rate could be much larger for higher size ratios. To test this, and to test thatthere is still a linear shear-rate dependence, figure 9 shows how a 6 mm small intruderpercolates down through a matrix of 14 mm large particles at various shear rates. Thiscorresponds to a size ratio R = 2.333, which is not that much larger than R = 1.75 forthe previous experiments in figure 8, but the time taken to reach the bottom of the cellfor γm = 0.34 s−1 is approximately a quarter of that when the size ratio was R = 1.75.Importantly, however, the fitted values of Ks still exhibit a linear dependence on γm asshown in the inset of figure 9. This observation suggests that the dramatic enhancement inthe segregation rate of the small intruders at large size ratios, can be modelled through anadditional quadratic size-ratio dependence in the function F = F(R, φs) defined in (4.7)at low small particle volume fractions.
6.2. Variable size ratio for the small intrudersIn order to determine the non-dimensional constant E in (6.1) a series of experimentswere performed at the same shear rate, but with variable size ratio. These correspond to
916 A55-20
Dow
nloa
ded
from
htt
ps://
ww
w.c
ambr
idge
.org
/cor
e. IP
add
ress
: 85.
218.
39.6
9, o
n 20
Apr
202
1 at
16:
11:4
1, s
ubje
ct to
the
Cam
brid
ge C
ore
term
s of
use
, ava
ilabl
e at
htt
ps://
ww
w.c
ambr
idge
.org
/cor
e/te
rms.
htt
ps://
doi.o
rg/1
0.10
17/jf
m.2
021.
227

An experimental scaling law for particle-size segregation
0.11
0.10
0.09
0.08
0.07
0.06
0.05
0.04
0.03
0.02
0 20 40 60 80 100 120
2.5
2.0
1.5
1.0
0.5
0 0.5 1.0 1.5 2.0 2.5
(×10–4)
Ks (m
2 s
–1)
γm (s–1)
γm = 0.34 s–1, Ks = 3.2 × 10⁻⁵ m2 s–1
γm = 1.3 s–1, Ks = 1.5 × 10⁻⁴ m2 s–1
γm = 2.3 s–1, Ks = 2.7 × 10⁻⁴ m2 s–1
Quadratic fit
t (s)
zs (m)
Figure 8. Measured position of a 8 mm small intruder segregating through a 14 mm matrix of large particlesas a function of time for three different imposed shear rates γm (darker turquoise lines correspond to highershear-rates). Three representative experimental profiles are plotted for each experiment. These data correspondto set 3 in table 2. For each case, (4.19) is fitted to the data set and the value is then averaged over the threerealizations to determine Ks, assuming the same value of C as in (5.1a,b). The average fitted intruder trajectory(4.21) is then plotted as a function of time for each γm with dashed lines for comparison. The insets show thefitting constant Ks as a function of γm. All the points are closely approximated by a straight (dot-dashed) linethat passes through the origin, implying that fsl has a linear shear-rate dependence at moderate size ratios.
set 5 in table 2 and are shown in figure 10. Fits to the three sets of data shown for eachcase were performed in the same way as in § 6.1 and the values of Ks are shown in theinset of figure 10. For size ratios close to unity the values of Ks lie very close to the reddashed line, corresponding to (6.1) with E = 0, using the same coefficients B and C thatwere determined for the large intruders in (5.1a,b). However, as the size ratio increasesabove R = 1.5 the values of Ks depart markedly from this line. The additional quadraticdependence on R − 1 in (6.1) is, however, able to capture the dramatic increase in thesegregation velocity at large size ratios. A least squares fit to the data suggests that
E = 2.0957. (6.2)
The small intruders therefore segregate with a linear R − 1 dependence for size ratios closeto unity, but segregate with an (R − 1)2 dependence at larger size ratios. This is consistentwith the notion that small intruders find it increasingly easy to find holes in which topercolate, as the size ratio increases towards the limit of spontaneous percolation at R � 6.Above this threshold, spontaneous percolation implies that small particles can percolatethrough a matrix of large grains even in the absence of shear (Bridgwater & Ingram 1971;Wilkinson & Edwards 1982), so this observation makes physical sense. The result is alsobacked up by recent DPM simulations of segregation at low small particle concentrations.To see this, compare the inset in figure 10 with figure 6(b) of Chassagne et al. (2020),
916 A55-21
Dow
nloa
ded
from
htt
ps://
ww
w.c
ambr
idge
.org
/cor
e. IP
add
ress
: 85.
218.
39.6
9, o
n 20
Apr
202
1 at
16:
11:4
1, s
ubje
ct to
the
Cam
brid
ge C
ore
term
s of
use
, ava
ilabl
e at
htt
ps://
ww
w.c
ambr
idge
.org
/cor
e/te
rms.
htt
ps://
doi.o
rg/1
0.10
17/jf
m.2
021.
227
T. Trewhela, C. Ancey and J.M.N.T. Gray
0.12
0.11
0.10
0.09
0.08
0.07
0.06
0.05
0.04
0.03
0.02
0 5 10 15 20 25 30 35
4
3
2
1
0 0.5 1.0
γm (s–1)
Ks (m
2 s
–1)
(×10–4)γm = 0.34 s–1, Ks
= 1.3 × 10⁻⁴ m2 s–1
γm = 0.63 s–1, Ks = 2.7 × 10⁻⁴ m2 s–1
γm = 0.87 s–1, Ks = 3.9 × 10⁻⁴ m2 s–1
Quadratic fit
t (s)
zs (m)
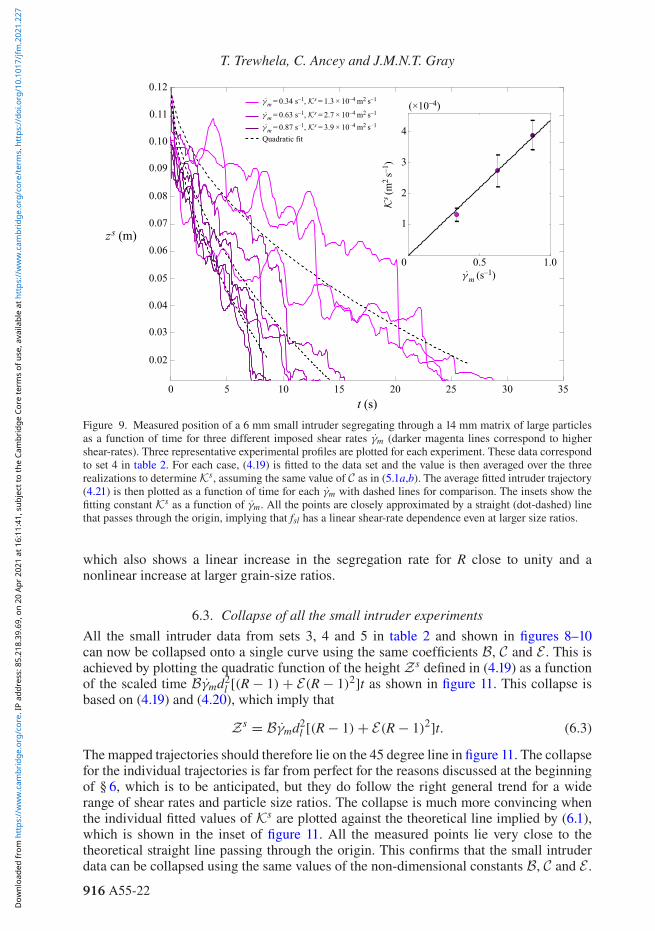
Figure 9. Measured position of a 6 mm small intruder segregating through a 14 mm matrix of large particlesas a function of time for three different imposed shear rates γm (darker magenta lines correspond to highershear-rates). Three representative experimental profiles are plotted for each experiment. These data correspondto set 4 in table 2. For each case, (4.19) is fitted to the data set and the value is then averaged over the threerealizations to determine Ks, assuming the same value of C as in (5.1a,b). The average fitted intruder trajectory(4.21) is then plotted as a function of time for each γm with dashed lines for comparison. The insets show thefitting constant Ks as a function of γm. All the points are closely approximated by a straight (dot-dashed) linethat passes through the origin, implying that fsl has a linear shear-rate dependence even at larger size ratios.
which also shows a linear increase in the segregation rate for R close to unity and anonlinear increase at larger grain-size ratios.
6.3. Collapse of all the small intruder experimentsAll the small intruder data from sets 3, 4 and 5 in table 2 and shown in figures 8–10can now be collapsed onto a single curve using the same coefficients B, C and E . This isachieved by plotting the quadratic function of the height Zs defined in (4.19) as a functionof the scaled time Bγmd2
l [(R − 1) + E(R − 1)2]t as shown in figure 11. This collapse isbased on (4.19) and (4.20), which imply that
Zs = Bγmd2l [(R − 1) + E(R − 1)2]t. (6.3)
The mapped trajectories should therefore lie on the 45 degree line in figure 11. The collapsefor the individual trajectories is far from perfect for the reasons discussed at the beginningof § 6, which is to be anticipated, but they do follow the right general trend for a widerange of shear rates and particle size ratios. The collapse is much more convincing whenthe individual fitted values of Ks are plotted against the theoretical line implied by (6.1),which is shown in the inset of figure 11. All the measured points lie very close to thetheoretical straight line passing through the origin. This confirms that the small intruderdata can be collapsed using the same values of the non-dimensional constants B, C and E .
916 A55-22
Dow
nloa
ded
from
htt
ps://
ww
w.c
ambr
idge
.org
/cor
e. IP
add
ress
: 85.
218.
39.6
9, o
n 20
Apr
202
1 at
16:
11:4
1, s
ubje
ct to
the
Cam
brid
ge C
ore
term
s of
use
, ava
ilabl
e at
htt
ps://
ww
w.c
ambr
idge
.org
/cor
e/te
rms.
htt
ps://
doi.o
rg/1
0.10
17/jf
m.2
021.
227

An experimental scaling law for particle-size segregation
0.12
0.11
0.10
0.09
0.08
0.07
0.06
0.05
0.04
0.03
0.02
0 100 200 300 400 500 600 700 800
6
5
4
3
2
1
0 1 2 3R – 1
(×10–4)
Ks (m
2 s
–1)
R = 1.2, Ks = 5.5 × 10⁻⁶ m2 s–1
R = 1.4, Ks = 1.3 × 10⁻⁵ m2 s–1
R = 1.8, Ks = 3.2 × 10⁻⁵ m2 s–1
R = 2.3, Ks = 1.2 × 10⁻⁴ m2 s–1
R = 3.5, Ks = 3.9 × 10⁻⁴ m2 s–1
Quadratic fit
t (s)
zs (m)
Figure 10. Experimentally measured position of a small intruder of size dl = 12, 10, 8, 6 and 4 mm in amatrix of 14 mm large particles as a function of time, and at the same imposed shear-rate γm = 0.34 s−1. Threerepresentative experimental profiles are plotted for each experiment. This corresponds to set 5 in table 2. Foreach case, (4.19) is fitted to the data set and the value is then averaged over the three realizations to determineKs, assuming the same value of C as in (5.1a,b). The average fitted intruder trajectory (4.21) is then plotted as afunction of time for each size ratio R with dashed lines for comparison. The inset shows the fitting constants Ks
as a function of R − 1. At size ratios close to unity the constants follow the same linear dependence on R − 1as the large grains (red dashed line), but for larger size ratios the constants Ks become much larger. This is wellfitted by the quadratic size-ratio dependence in (6.1) with E = 2.0957 (dashed blue line).
Moreover, the constants B and C are exactly the same as the values used to collapsethe large intruder data in § 5. These results therefore validate our preliminary hypotheses(a)–(d) made in § 4.2.
7. Simulation of van der Vaart et al.’s (2015) experiment
The fully index matched experiment of van der Vaart et al. (2015), which was performed ina similar shear cell to that in this paper, provides an important constraint on the functionalform of F , since the volume fraction of small particles evolves through the complete rangeof φs ∈ [0, 1].
7.1. Summary of the equations and coefficientsIn order to derive the governing equations, the particle-size distribution is assumed to bespatially uniform in the x and y directions. Substituting the gravity vector g = −gk and thevelocity field (3.2) into (2.3) implies that the small particle segregation equation reducesto
∂φs
∂t− ∂
∂z( fslφ
sφl) = ∂
∂z
(Dsl
∂φs
∂z
), (7.1)
916 A55-23
Dow
nloa
ded
from
htt
ps://
ww
w.c
ambr
idge
.org
/cor
e. IP
add
ress
: 85.
218.
39.6
9, o
n 20
Apr
202
1 at
16:
11:4
1, s
ubje
ct to
the
Cam
brid
ge C
ore
term
s of
use
, ava
ilabl
e at
htt
ps://
ww
w.c
ambr
idge
.org
/cor
e/te
rms.
htt
ps://
doi.o
rg/1
0.10
17/jf
m.2
021.
227

T. Trewhela, C. Ancey and J.M.N.T. Gray
4.5
4.0
3.5
3.0
2.5
2.0
1.5
1.0
0.5
0 0.5 1.0 1.5 2.0 2.5 3.0 3.5 4.0 4.5
4
6
2
0
0 5 10
γmdl2F (R, 0+) (m2 s–1)
Ks (m
2 s
–1)
(×10–4)
(×10–3)
(×10–3)
Zs (m2)
Bγmdl2[(R – 1)+E(R – 1)2]t (m2)
Figure 11. The small intruder trajectories for varying shear rate γm and size ratio R are collapsed onto anapproximately straight (dashed) 45 degree line by plotting the transformed height Zs, defined in (4.19), againstthe scaled time Bγmd2
l [(R − 1) + E(R − 1)2]t. The data correspond to all the cases in sets 3, 4 and 5 in table 2.The inset plot shows the best fit values of the constants Ks for each of the experiments as a function ofγmd2
l F(R, 0+). The red dashed line in the inset has gradient B = 0.3744, i.e. the global best fit value of B. Thecolours of the points and the lines are the same as those used in figures 8–10, where the legends are defined.
where fsl and Dsl are the segregation velocity magnitude and diffusivity, respectively.Substituting the lithostatic pressure (4.13) into (4.9) and cancelling ρ∗g, implies that
fsl = Bγ d2FCd + Φ(h − z)
, (7.2)
where the size-ratio dependence is encapsulated in
F = (R − 1) + EΛ(φs)(R − 1)2. (7.3)
The function Λ = Λ(φs) satisfies the constraints that Λ(0) = 1 and Λ(1) = 0. It describesthe effect of the size ratio at intermediate concentrations, and allows F to smoothlytransition from the linear R − 1 dependence of a large intruder (4.5) to the (R − 1)2
dependence (4.6) for a small intruder. The simplest possible form for Λ is the linear law
Λ = φl = 1 − φs, (7.4)
which will be investigated here. However, much more complicated functions are possible,so long as they satisfy the constraints (4.8a,b). As discussed in § 4.5 the diffusivity isassumed to take the form
Dsl = Aγ d2, (7.5)
where the non-dimensional coefficient A is determined by the experiments of Utter& Behringer (2004). The other non-dimensional coefficients B, C and E have been
916 A55-24
Dow
nloa
ded
from
htt
ps://
ww
w.c
ambr
idge
.org
/cor
e. IP
add
ress
: 85.
218.
39.6
9, o
n 20
Apr
202
1 at
16:
11:4
1, s
ubje
ct to
the
Cam
brid
ge C
ore
term
s of
use
, ava
ilabl
e at
htt
ps://
ww
w.c
ambr
idge
.org
/cor
e/te
rms.
htt
ps://
doi.o
rg/1
0.10
17/jf
m.2
021.
227

An experimental scaling law for particle-size segregation
A = 0.108, B = 0.3744, C = 0.2712, E = 2.0957
Table 3. Non-dimensional coefficients B, C, E determined from the refractive-index matched shear-cellexperiments. Note that it is anticipated that in the absence of an interstitial fluid the segregation rate willbe enhanced (see § 4.3), which increases the assumed value of B. The non-dimensional coefficient A is takenfrom figure 9 of Utter & Behringer (2004).
determined by the shear box experiments in this paper and all of them are summarizedin table 3.
7.2. Non-dimensionalization and numerical methodIn order to solve the system of (7.1)–(7.5) it is useful to non-dimensionalize the equationsusing the same scalings as in van der Vaart et al. (2015), i.e.
t = Tt, z = hz, (7.6a,b)
where T = 13 s is the period of one cycle and h = 0.087 m is the depth of the cell. Itfollows that the segregation equation (7.1) can be written in the non-dimensional form
∂φs
∂ t− ∂
∂ z(Srφ
sφl) = ∂
∂ z
(Dr
∂φs
∂ z
), (7.7)
where the non-dimensional segregation rate and non-dimensional diffusivity are
Sr = Tfsl
h= Bγ T(d/h)2F
C(d/h) + Φ(1 − z), (7.8)
Dr = TDsl
h2 = Aγ T(d/h)2, (7.9)
respectively. The period equals T = 2π/ω by definition. It therefore follows from (3.4)that the average shear rate γm times the period
γmT = 4 tan θmax, (7.10)
where θmax = 30◦ in the experiments of van der Vaart et al. (2015). The mean value γmTis used to approximate γ T in (7.8) and (7.9). The non-dimensional segregation equation(7.7) is solved subject to no flux conditions at the surface and the base of the cell
Srφsφl + Dr
∂φs
∂ z= 0, at z = 0, 1, (7.11)
and the initial condition
φs ={
1, z > 0.5,
0, z ≤ 0.5,(7.12)
so that all the small grains are above the large particles at the start of the experiment (vander Vaart et al. 2015). A Galerkin finite element solver (Skeel & Berzins 1990) is used togenerate the results. This method is conveniently coded in the pdepe routine in Matlab andhas been extensively tested in previous papers (Gray & Ancey 2011; Wiederseiner et al.2011; Gray & Ancey 2015; van der Vaart et al. 2015). It should be noted, however, that thismethod fails when C = 0, because in this case the segregation rate becomes unbounded atthe free surface.
916 A55-25
Dow
nloa
ded
from
htt
ps://
ww
w.c
ambr
idge
.org
/cor
e. IP
add
ress
: 85.
218.
39.6
9, o
n 20
Apr
202
1 at
16:
11:4
1, s
ubje
ct to
the
Cam
brid
ge C
ore
term
s of
use
, ava
ilabl
e at
htt
ps://
ww
w.c
ambr
idge
.org
/cor
e/te
rms.
htt
ps://
doi.o
rg/1
0.10
17/jf
m.2
021.
227

T. Trewhela, C. Ancey and J.M.N.T. Gray
0.05
0.04
0.03
0.02
0.01
0 0.2 0.4 0.6 0.8 1.0
0.1
–0.1
–0.2
–0.3
–0.4
–0.50 0.2 0.4 0.6 0.8 1.0
0
R = 3.00R = 2.50R = 2.00
R = 1.50
φs φs
Large grains
Small grains
wl
ws
(b)(a)
S rφs φ
l
Figure 12. (a) The non-dimensional segregation flux Srφsφl as a function of the small particle concentration
φs, for a range of grain-size ratios R = 1.5, 2, 2.5 and 3. The flux is evaluated with h = 87 mm, T = 13 s,θmax = 30◦, ds = 4 mm and z = 1/2, using the non-dimensional coefficients summarized in table 3. The greenmarkers show the position of the maximum and the blue markers show the inflection point. (b) Shows thecorresponding non-dimensional large and small particle segregation velocities, wl and ws, as a function of φ.The yellow markers show the position of the maximum large particle segregation velocity, which occurs atintermediate concentrations.
7.3. Asymmetric segregation flux functionsIt is interesting to see what the consequences the empirically derived scaling law hasfor the shape of segregation flux function. The non-dimensional segregation equation(7.7) implies that the non-dimensional segregation flux of large and small particles in thevertical direction are
Fl = Srφsφl, (7.13)
Fs = −Srφsφl, (7.14)
respectively. Rather than being a non-dimensional constant (as in Gray & Thornton 2005;Gray & Chugunov 2006), the non-dimensional segregation rate Sr is a function, whosevalue varies locally in the flow, and which is given by (7.8).
Figure 12(a) shows a series of flux curves for different size ratios R, assuming thatz = 1/2, ds = 4 mm and the non-dimensional coefficients in table 3. All the flux curvesare asymmetric and have an inflection point that lies to the right of the maximum.Qualitatively they look similar to the cubic flux functions for χ > 1/2 illustrated infigure 1. Crucially, however, these curves have been derived to quantitatively matchexperimental data and contain complex functional dependencies on the shear rate, thelocal small particle concentration, the average grain size, the grain-size ratio and the localpressure. In particular, as the grain-size ratio is increased the amplitude of the flux functionincreases and both the local maximum and the inflection point move to the left.
916 A55-26
Dow
nloa
ded
from
htt
ps://
ww
w.c
ambr
idge
.org
/cor
e. IP
add
ress
: 85.
218.
39.6
9, o
n 20
Apr
202
1 at
16:
11:4
1, s
ubje
ct to
the
Cam
brid
ge C
ore
term
s of
use
, ava
ilabl
e at
htt
ps://
ww
w.c
ambr
idge
.org
/cor
e/te
rms.
htt
ps://
doi.o
rg/1
0.10
17/jf
m.2
021.
227

An experimental scaling law for particle-size segregation
The increasing skewness with grain-size ratio encodes the idea that small intrudersfind it increasingly easy to percolate downwards as the size ratio increases, whereas thelarge intruders find it harder to segregate upwards when there are more contacts withneighbouring small particles. The flux curves have this asymmetric behaviour even whenC = 0 and E = 0, indicating that the scaling of the segregation rate on the mean particlediameter d in (4.9) is already sufficient to produce this effect. The flux curves look similarat other heights in the flow and grow in amplitude as one approaches the free surface. WhenC /= 0 there is an upper bound for the amplitude at z = 1, but when C = 0 the segregationflux becomes unbounded at the free surface, which is not desired.
7.4. Large and small particle segregation velocitiesIn the absence of diffusion the non-dimensional vertical velocities of the large and smallparticles are given by
wl = Srφs, (7.15)
ws = −Srφl, (7.16)
respectively. These are plotted in figure 12(b) for the same size ratios and parameters asthe flux functions in figure 12(a). For a given size ratio, the downward small particlesegregation velocity is an increasing function of the large particle concentration φl =1 − φs, and therefore the maximum speed is attained at φs = 0+. Conversely, the largeparticles have a local maximum segregation velocity at an intermediate concentrationφs ∈ (0, 1), with the segregation velocity of a single large intruder at φs = 1− being ata much reduced rate, compared to either the maximum large particle, or the maximumsmall particle, segregation speed. Experimental measurements of the single intruder endstates have been specifically used in this paper to determine the scaling law for segregation,and hence the segregation rate Sr. The particle velocities in these end states are thereforea close match to the experimental data.
It is interesting to note that when C = 0, the ratio of the maximum percolation velocityof a single small intruder to the rise velocity of a single large intruder at a given height z0,satisfies the simple relation
|ws(0+)||wl(1−)|
∣∣∣∣z=z0
= Sr(0+)
Sr(1−)
∣∣∣∣z=z0
= R2 (1 + E(R − 1)) . (7.17)
The remarkable equation relates two seemingly disparate ends of the flux curve with asimple relation that is purely dependent on the particle size ratio R. It holds at all heights z0in the flow, which implies that the trajectories of the particles are also related. In particular,it follows from (4.15) and (4.19) that the ratio of the time tl for a large intruder to reach thetop of the cell, and the time ts for a small intruder to percolate down to the base, satisfiesthe same law
tlts
= R2 (1 + E(R − 1)) . (7.18)
Even when C = 0.2712, and there is some dependence on the average grain size and theposition in the flow, (7.17) and (7.18) provide good approximations to the ratio of the singleparticle intruder speeds and the ratio of intruder times, respectively.
7.5. Comparison to van der Vaart’s (2015) experimental dataVan der Vaart et al. (2015) used an earlier version of the shear cell and the RIM techniqueto measure the evolution of the particle-size distribution in a 50 : 50 mix of 8 mm and
916 A55-27
Dow
nloa
ded
from
htt
ps://
ww
w.c
ambr
idge
.org
/cor
e. IP
add
ress
: 85.
218.
39.6
9, o
n 20
Apr
202
1 at
16:
11:4
1, s
ubje
ct to
the
Cam
brid
ge C
ore
term
s of
use
, ava
ilabl
e at
htt
ps://
ww
w.c
ambr
idge
.org
/cor
e/te
rms.
htt
ps://
doi.o
rg/1
0.10
17/jf
m.2
021.
227

T. Trewhela, C. Ancey and J.M.N.T. Gray
1.0(a)
(b)
(c)
0.8
0.6
0.4
0.2
0
1.0
0.8
0.6
0.4
0.2
0
1.0
0.8
0.6
0.4
0.2
020 40 60 80 100 200
0.50 1.0
Numerical solutionExperimental data
z
z
t
φs
φs
Figure 13. (a) Contour plot of van der Vaart et al.’s (2015) small particle concentration data as a functionof the non-dimensional depth z = z/h and non-dimensional time t = t/T , for a 50 : 50 mix of large andsmall particles with h = 87 mm, T = 13 s, θmax = 30◦, ds = 4 mm and dl = 8 mm. (b) Contour plotof the corresponding numerical results using the non-dimensional coefficients summarized in table 3. (c)Experimental and numerical time series of the depth-averaged concentration of small particles, φs = φs(t).
4 mm particles that was initially in a normally graded configuration. To do this, the shearwas stopped after each complete cycle and the cell was scanned with a laser while aseries of photographs were taken. From these photos it was possible to determine thethree-dimensional particle positions after each cycle and hence to build up a picture of theevolving particle-size distribution in time. A space–time plot of the van der Vaart et al.’s(2015) small particle concentration data is shown in figure 13(a).
Figure 13(b) shows a contour plot of the computed small particle concentration as afunction of the non-dimensional depth and time, using the experimentally determinednon-dimensional coefficients in table 3. The simulations are in very good quantitative
916 A55-28
Dow
nloa
ded
from
htt
ps://
ww
w.c
ambr
idge
.org
/cor
e. IP
add
ress
: 85.
218.
39.6
9, o
n 20
Apr
202
1 at
16:
11:4
1, s
ubje
ct to
the
Cam
brid
ge C
ore
term
s of
use
, ava
ilabl
e at
htt
ps://
ww
w.c
ambr
idge
.org
/cor
e/te
rms.
htt
ps://
doi.o
rg/1
0.10
17/jf
m.2
021.
227

An experimental scaling law for particle-size segregation
agreement with the experimental data of van der Vaart et al. (2015). In particular, theyaccurately capture the time at which the first small grains reach the base of the flow, theslightly later arrival of the first large grains at the top of the flow, as well as the overalltime scale for the solution to approach the steady state by t = 120. During this evolutionthe grains reverse position, with the large particles rising to the surface and the smallgrains percolating down to the base, to form a slightly diffuse inversely graded particle-sizedistribution. It should be emphasized that this excellent overall agreement is achieved withthe value of A determined from the experiments of Utter & Behringer (2004) and the samenon-dimensional coefficients B, C or E measured in this paper, together with the simplestpossible functional form for Λ.
The slight mismatches between the simulated and experimental concentration contoursin the expansion fan, between t = 0 and 60 time units, are most likely due to experimentalerror. To demonstrate this, it is useful to integrate the segregation equation (7.7) from thebase up to the free surface, and apply the surface and basal no flux boundary conditions(7.11). Exchanging the order of integration and differentiation implies that
ddt
(∫ 1
0φs dz
)= 0, (7.19)
and hence that the depth-averaged concentration of small particles is conserved, i.e.
φs =∫ 1
0φs(z, t) dz =
∫ 1
0φs(z, 0) dz = φs
0. (7.20)
Figure 13(c) shows the depth-averaged concentration φs as a function of time for thenumerical simulation and the experiment. While the simulated φs is indeed constant,and equal to the initial depth-averaged concentration of small particle φs
0 = 0.5, theexperimental value of φs is up to 5 % below this value in the first t = 0 and 60 timeunits. This is due to the error in identifying all the small particles with the refractive-indexmatched fluid technique used by van der Vaart et al. (2015).
7.6. Properties of the steady-state solutionA first-order ODE for the steady-state concentration profile can be formulated by assumingthat the concentration is independent of time. Integrating the non-dimensional segregationequation (7.7) with respect to z, applying the no flux condition (7.11) and cancelling theγ T(d/h)2 dependence yields
dφs
dz= −(B/A)φsφlF(R, φs)
C(d/h) + Φ(1 − z). (7.21)
This equation has some interesting properties. In particular, the non-dimensionalcoefficient C is included in the theory primarily to remove the singularity in the segregationrate at the free surface in the numerical method. When C = 0, (7.21) just depends onthe particle size ratio R, and is completely independent of d and h. The thickness doesenter in the non-dimensionalization (7.6a,b), so although the non-dimensional solutionwill be identical for a fixed size ratio, the physical solution will be stretched verticallyproportionately to h. As a result, a flow of double the thickness will have steady-stateconcentration gradients that are half as strong as the original flow for the same size ratio.This is a highly non-intuitive consequence of the combination of the scaling law (7.2) andthe diffusivity (7.5), and is a bold prediction of the resulting theory.
916 A55-29
Dow
nloa
ded
from
htt
ps://
ww
w.c
ambr
idge
.org
/cor
e. IP
add
ress
: 85.
218.
39.6
9, o
n 20
Apr
202
1 at
16:
11:4
1, s
ubje
ct to
the
Cam
brid
ge C
ore
term
s of
use
, ava
ilabl
e at
htt
ps://
ww
w.c
ambr
idge
.org
/cor
e/te
rms.
htt
ps://
doi.o
rg/1
0.10
17/jf
m.2
021.
227

T. Trewhela, C. Ancey and J.M.N.T. Gray
7.7. Exact steady-state solution for the case C = 0In the case when C = 0, it is possible to derive an exact steady-state solution to (7.21).Substituting (7.3) and (7.4) into (7.21) and writing it as an ODE for z = z(φs) implies
−1(1 − z)
dzdφs = AΦ
B(R − 1)φs(1 − φs) [1 + E(1 − φs)(R − 1)]. (7.22)
Using partial fractions the right-hand side can be integrated to give the exact solution
z = 1 − K(1 − φs)−λ1(1 + E(1 − φs)(R − 1))λ2(φs)λ3, (7.23)
where K is a constant of integration and the coefficients λ1, λ2 and λ3 are
λ1 = ΦAB(R − 1)
, λ2 = ΦAEB(1 + E(R − 1))
, λ3 = ΦAB(R − 1)(1 + E(R − 1))
,
(7.24a–c)
respectively. The average volume fraction of small particles in the cell is obtained byintegrating the area under the curve φs = φs(z) between z is zero and unity. Since, thisarea is exactly the same as the area under the curve z = z(φs) > 0 in the range φs = [0, 1],it is easy to find the constant of integration for any given average concentration of smallparticles in the cell.
7.8. Steady-state comparison to van der Vaart’s (2015) experimentFigure 14 shows the predicted steady-state exact solution for the experiment of van derVaart et al. (2015), where K = 0.4041 for the initial 50 : 50 mix of particles. At t = 221non-dimensional units the exact solution lies very close to the computed concentrationprofile using the non-zero value of C = 0.2712 determined in this paper. In fact both thecurves lie very close to van der Vaart et al.’s (2015) experimental data between 177 and221 cycles, when the experiment is essentially in steady state (see figure 14). FollowingWiederseiner et al. (2011) and Gray (2018), the Péclet number for segregation is defined asthe ratio of the non-dimensional segregation rate to the rate of non-dimensional diffusion,i.e.
Pe = Sr
Dr= B(R − 1)(1 + E(1 − φs)(R − 1))
A(C(d/h) + Φ(1 − z)). (7.25)
It provides a measure of the strength of the segregation relative to the diffusion. Asopposed to some earlier theories (see e.g. Gray & Chugunov 2006; Wiederseiner et al.2011), which had a constant Péclet number, the segregation model developed in thispaper produces a Péclet number that varies strongly with depth. This is due to thechanging local grain-size distribution and the decreasing lithostatic pressure distributionwith increasing height. For the computed solution (see inset figure 14) the Péclet numberstarts at Pe = 5.74 at the base of the flow, rises to Pe = 18.86 at z = 1/2 and then tendsto a finite, but, large, value of Pe = 430 at the top. Note that in the case when C = 0,the Péclet number will be similar over most of the range, but the singularity in pressureat the free-surface implies that Pe → ∞ at z → 1. Since the diffuse interface separatinghigh concentrations of large particles from high concentrations of fines, in figure 14, liesbetween z = 0.4 and 0.6, the Péclet number Pe = 11.38 at the lower end of this range andrises sharply to Pe = 37 near the top. As a result, the solution is much more rounded anddiffuse at the bottom, which is a defining feature of the current theory.
916 A55-30
Dow
nloa
ded
from
htt
ps://
ww
w.c
ambr
idge
.org
/cor
e. IP
add
ress
: 85.
218.
39.6
9, o
n 20
Apr
202
1 at
16:
11:4
1, s
ubje
ct to
the
Cam
brid
ge C
ore
term
s of
use
, ava
ilabl
e at
htt
ps://
ww
w.c
ambr
idge
.org
/cor
e/te
rms.
htt
ps://
doi.o
rg/1
0.10
17/jf
m.2
021.
227

An experimental scaling law for particle-size segregation
1.0
0.9
0.8
0.7
0.6
0.5
0.4
0.3
0.2
0.1
00 0.1 0.2 0.3 0.4 0.5 0.6 0.7 0.8 0.9 1.0
1.0
0.5
0100 101 102 103
Experimental data 177 to 221 cycles
Exact solution when C = 0Computed solution with C = 0.2712
z
z
Pe
φs
Figure 14. Plot of the computed small concentration φs at t = 221 non-dimensional time units (red line)as a function of the non-dimensional depth, for h = 87 mm, T = 13 s, θmax = 30◦, ds = 4 mm, dl = 8 mmand using the non-dimensional coefficients summarized in table 3. The blue circles show the correspondingexperimental data of van der Vaart et al. (2015) between t = 177 and 221 non-dimensional time units (cycles).The yellow curve shows the exact steady-state solution (when C = 0) with a constant of integration K = 0.4041for a 50 : 50 mix of particles as in van der Vaart et al.’s (2015) experiments. The inset image shows the variationof the Péclet number with depth for the computed solution when C /= 0.
8. Predicting maximum segregation at a grain-size ratio close to two
Golick & Daniels (2009) and Thornton et al. (2012) provide experimental and DPMsimulation evidence, which strongly suggests that maximum segregation occurs close toa grain-size ratio of two for a 50 : 50 mixture of large and small particles (see data infigure 15). At first sight, this appears to be incompatible with the experimental shearbox results presented here, where the segregation velocity magnitude fsl increases linearlywith R − 1 for both large and small intruders, and where there is an additional (R − 1)2
dependence for the small intruders at high grain-size ratios. In short, the shear box datashow no evidence of a maximum in the segregation at a grain-size ratio of two. One maytherefore legitimately ask how these results can be compatible with one another?
In contrast to the prescribed motion and shear rate in our experiments, Golick & Daniels(2009) and Thornton et al. (2012) consider rapid flows in which segregation, diffusionand advection actively contribute to the evolving particle-size distribution, i.e. they areinherently more complex coupled flows. In particular, the velocity profile u(z, t), shear rateγ (z, t) and solids volume fraction Φ(z, t) are functions of space and time. In chute flows,Rognon et al. (2007), Tripathi & Khakhar (2011) and Barker et al. (2021) have shown thatsegregation-induced frictional feedbacks are responsible for marked deviations away fromthe classical monodisperse Bagnold velocity profile (Silbert et al. 2001; GDR-MiDi 2004;Jop et al. 2006). These feedbacks will in turn change the local shear rate and hence thetime scale for particles to segregate and diffuse. In addition, mixtures of disparately sizedparticles can pack more efficiently than monodisperse grains even during shear (Golick& Daniels 2009; Thornton et al. 2012). This packing effect is so significant in Golick &
916 A55-31
Dow
nloa
ded
from
htt
ps://
ww
w.c
ambr
idge
.org
/cor
e. IP
add
ress
: 85.
218.
39.6
9, o
n 20
Apr
202
1 at
16:
11:4
1, s
ubje
ct to
the
Cam
brid
ge C
ore
term
s of
use
, ava
ilabl
e at
htt
ps://
ww
w.c
ambr
idge
.org
/cor
e/te
rms.
htt
ps://
doi.o
rg/1
0.10
17/jf
m.2
021.
227

T. Trewhela, C. Ancey and J.M.N.T. Gray
8
7
6
5
4
3
2
1
01.0 1.2 1.3 1.4 1.5 1.6 1.7 1.8 1.9 2.01.1
Thornton et al. (2012) full height data
Thornton et al. (2012) dense base layer data
Packing efficiency reduced Péclet number
R
Pe
Figure 15. A comparison of the packing efficiency reduced Péclet number (8.3) as a function of the grain-sizeratio R, with the DPM simulation results of Thornton et al. (2012). The Péclet number is evaluated at z = 0.5and φs = 0.5 to approximate the position and concentration along the smooth steady-state interface betweenlarge and small grains in a 50 : 50 mix. The transition φs
c = 0.2, so the factor Λ is zero, and for simplicity C = 0.To account for the absence of an interstitial fluid, the constant B is divided by a buoyancy factor (4.10) usingthe ρ∗ = 2.2 g cm−3 and ρ
f∗ = 1.044 g cm−3 for the intrinsic density of the grains and the fluid, respectively
(table 1). This determines the initial linear gradient of the Péclet number at grain-size ratios close to unity.A remarkably good fit to Thornton et al.’s (2012) DPM data is provided by setting the constant a = 9 in thesegregation reduction factor (8.2). In particular, it produces a maximum in the Péclet number at a grain-sizeratio R � 1.66.
Daniels’ (2009) annular shear-cell experiments, that they used the motion of the freelymoving top plate to infer the segregation time scale. If the solids volume fraction is locallyenhanced, then this reduces the number of gaps that particles can move into and provides anatural mechanism for reducing both the segregation rate and the diffusivity. The observedmaximum in segregation in the vicinity of R = 2 may therefore be a consequence ofincreased solids volume fraction, or frictional feedback, rather than a direct dependenceof segregation velocity magnitude fsl on the grain-size ratio R.
It is instructive to consider how packing effects may be parameterized in a simple way,without developing a compressible theory for particle-size segregation that fully accountsfor the changes in solids volume fraction. To begin, let us assume that the (1 − R)2
enhancement of segregation, as one approaches the transition to spontaneous percolation(Bridgwater & Ingram 1971; Wilkinson & Edwards 1982), is confined to low small particleconcentrations. This effect can be achieved by defining
Λ =⎧⎨⎩ 1 − φs
φsc, φ ≤ φs
c
0, φs > φsc,
(8.1)
916 A55-32
Dow
nloa
ded
from
htt
ps://
ww
w.c
ambr
idge
.org
/cor
e. IP
add
ress
: 85.
218.
39.6
9, o
n 20
Apr
202
1 at
16:
11:4
1, s
ubje
ct to
the
Cam
brid
ge C
ore
term
s of
use
, ava
ilabl
e at
htt
ps://
ww
w.c
ambr
idge
.org
/cor
e/te
rms.
htt
ps://
doi.o
rg/1
0.10
17/jf
m.2
021.
227

An experimental scaling law for particle-size segregation
where the transition point φsc ∈ (0, 1). There are two key ideas that the function must
parameterize: (i) grains can only pack together more efficiently when they are mixedtogether and (ii) this effect becomes progressively stronger as the grain-size ratio increasesfrom unity. A packing-induced segregation reduction factor might therefore take the form
R = 1 + a(R − 1)2φs(1 − φs), (8.2)
where a is a constant. This factor enters the denominator of the Péclet number (7.25) togive a packing efficiency reduced Péclet number of the form
Pe = B(R − 1)(1 + EΛ(φs)(R − 1))
AR(φs, R)(C(d/h) + Φ(1 − z)). (8.3)
The reduction factor R is equal to unity at φs = 0, 1, so our single-intruder results areencapsulated unchanged in this function. However, at intermediate concentrations φs > φs
cthe Péclet number is reduced when either the grain-size ratio R is increased, or themixture concentration approaches φs = 0.5. Figure 15 shows that the reduction factor (8.2)accurately captures Thornton et al.’s (2012) steady-state Péclet number dependence on R,with a maximum segregation at a grain-size ratio R � 1.66. This is remarkably close tothe maximum at R = 1.7 in Thornton et al.’s (2012) DPM simulations, which is veryencouraging. The fact that Golick & Daniels’ (2009) annular shear-cell experiments havea minimum segregation time at R � 2, suggests that this factor reduces the segregationvelocity magnitude, rather than the diffusion. However, it is possible that the increasedsolids volume fraction in mixtures of differently sized particles also moderates theself-diffusion, and that (8.2) is the net effect of the reduction in segregation and thereduction or enhancement in diffusion.
Other effects such as the intermediate and reverse segregation reported by Thomas(2000) and Thomas & D’Ortona (2019) at very large size ratios R > 4 probably require anadditional effective density effect to explain them. To see this, consider filling the volumeof a large grain with smaller particles. As they randomly pack together to fill the volumethey will introduce a significant amount of empty space. At the large particle scale, itfollows that very large intruders will appear significantly denser than an equivalent volumeof small grains, even if their intrinsic densities are the same. This apparent density increasemay thus lead to a competition between particle size and particle density segregation(Tunuguntla et al. 2014; Gray & Ancey 2015), which combined with flow feedback andpacking efficiency effects may explain how very large intruders can find equilibria atintermediate depths, or sink to the base of the flow.
9. Conclusions
The refractive-index matched shear box experiments performed in this paper suggest asimple functional form (4.9) for the segregation velocity magnitudes fsl of single largeand small intruders. For grain-size ratios close to unity, a simple linear interpolation (7.4)between these two end states is sufficient to quantitatively model the segregation of a50 : 50 mix of large and small particles in the shear box experiments of van der Vaart et al.(2015), when it is combined with the generalized diffusivity (4.22) (see figures 13 and 14).At larger size ratios the annular shear-cell experiments of Golick & Daniels (2009) suggestthat mixtures of grains can pack at significantly higher solids volume fractions, evenduring shear, and that this hinders the small particles ability to percolate and segregate.By introducing a simple parametrization of this reduced segregation efficiency (8.2), itis possible to produce a maximum Péclet number for segregation at a grain-size ratio
916 A55-33
Dow
nloa
ded
from
htt
ps://
ww
w.c
ambr
idge
.org
/cor
e. IP
add
ress
: 85.
218.
39.6
9, o
n 20
Apr
202
1 at
16:
11:4
1, s
ubje
ct to
the
Cam
brid
ge C
ore
term
s of
use
, ava
ilabl
e at
htt
ps://
ww
w.c
ambr
idge
.org
/cor
e/te
rms.
htt
ps://
doi.o
rg/1
0.10
17/jf
m.2
021.
227

T. Trewhela, C. Ancey and J.M.N.T. Gray
R � 1.66. This is remarkably close to the maximum at R = 1.7 found in the steady-stateDPM simulations of Thornton et al. (2012). The composite small particle segregation flux(2.7) that includes all of these effects, is then
F s =(
ρBρ∗γ d2
Cρ∗gd + p
)[(R − 1) + EΛ(φs)(R − 1)2]
R(φs, R)φsφlg, (9.1)
where the relative density difference ρ defined in (4.10) accounts for the presence of aninterstitial fluid of density ρ
f∗ , and the correspondingly adjusted constant B = B/ρ �
0.7125. The remaining values of the universal constants can be found in table 3. The smallparticle segregation flux is dependent of the shear rate γ , the local mean particle size d,the intrinsic density of the grains ρ∗, the pressure p, the size ratio R, the gravitationalacceleration vector g and the local concentration of small particles φs = 1 − φl. Thedependence on the average particle size d naturally leads to increasingly asymmetric fluxfunctions as the size ratio R increases (Gajjar & Gray 2014; van der Vaart et al. 2015). Thisleads to markedly different time scales for the rise and fall of large and small intruders, asshown theoretically in figure 12.
Particle-size segregation usually takes place in rapidly sheared free-surface flows,where the pressure is lithostatic. Interestingly, when the pressure distribution (4.13)is substituted into (9.1) the intrinsic density dependence and the magnitude of thegravitational acceleration g = |g| cancel out, to leave the segregation flux
F s =(
ρBγ d2
Cd + Φ(h − z)
)[(R − 1) + EΛ(φs)(R − 1)2]
R(φs, R)φsφlg, (9.2)
where g = g/|g| is the unit vector in the direction of gravity. This implies that gravitysets the direction for segregation, but it does not determine the time scale for particlesto segregate. This is consistent with Savage & Lun’s (1988) statistical model for kineticsieving and squeeze expulsion, in which the shear rate sets the time scale for segregation,as it determines the rate at which small particles see gaps that they can percolate downinto during the kinetic sieving process. The percolation velocity of a single small intruderhas a linear dependence on R − 1 for size ratios close to unity, but develops a quadraticdependence at higher grain-size ratios as shown in the inset in figure 10. This is probablyrelated to the transition to spontaneous percolation for grain-size ratios greater than six(Bridgwater & Ingram 1971; Wilkinson & Edwards 1982). This effect may be confined torelatively low concentrations of fine particles, since at larger concentrations the pores willbe blocked. The function Λ defined in (8.1) restricts enhanced percolation to φs ∈ [0, φs
c],where φs
c < 1. There are, however, independent DPM simulations (Chassagne et al. 2020)that support the linear and quadratic dependence on R − 1 proposed here.
The ability of the theory to match all the existing experiments that have been performedin the oscillating shear cell, as well as Thornton et al.’s (2012) steady-state DPMsimulations, suggests that the empirical segregation flux (9.1) might usefully be applied toother problems. Certainly, the theory has the right pressure dependence in the segregationand diffusion terms to capture the suppression of segregation in Golick & Daniels’ (2009)annular shear-cell experiments, and Fry et al.’s (2019) DPM simulations, when a weightis added to the top plate. In addition, Barker et al. (2021) have coupled the empiricalsegregation law (9.1) to the partially regularized μ(I)-rheology (Barker & Gray 2017),and used it to compute the segregation in a square rotating drum. The results show thatthe empirical law can capture the qualitative development of the segregation patterns thatform in the drum. Quantitative comparison with experiments is much more difficult than
916 A55-34
Dow
nloa
ded
from
htt
ps://
ww
w.c
ambr
idge
.org
/cor
e. IP
add
ress
: 85.
218.
39.6
9, o
n 20
Apr
202
1 at
16:
11:4
1, s
ubje
ct to
the
Cam
brid
ge C
ore
term
s of
use
, ava
ilabl
e at
htt
ps://
ww
w.c
ambr
idge
.org
/cor
e/te
rms.
htt
ps://
doi.o
rg/1
0.10
17/jf
m.2
021.
227

An experimental scaling law for particle-size segregation
one might expect, because sidewall wall friction significantly influences the depth andspeed of the surface avalanche where most of the segregation occurs. For the same rotationrate, a narrow drum produces a much thinner faster moving avalanche than a wide drum(Jop, Forterre & Pouliquen 2005). As a result, the shear rate is higher and the pressure islower in a narrow drum, and both of these effects combine to increase the segregation rateaccording to (9.1). It is therefore vital to include sidewall friction in numerical simulations,in order to make a proper comparison to experimental patterns observed through thesidewall of narrow drums.
The fully coupled simulations of Barker et al. (2021) make it clear that one of the keyadvantages of the oscillatory shear cell is that the bulk motion of the grains is prescribedrather than being free to evolve as part of the experiment. This eliminates many of theproblems posed by sidewall friction (Jop et al. 2005) as well as the more subtle feedbackof the evolving particle-size distribution on the bulk flow field (see e.g. Tripathi & Khakhar2011; Barker et al. 2021). It is this uncoupling which makes it much easier to determinethe underlying functional dependence of the segregation rate in the shear cell.
Supplementary movies. Supplementary movies are available at https://doi.org/10.1017/jfm.2021.227.
Acknowledgements. The authors would like to thank B. de Graffenried for designing and building the newexperimental shear cell, as well as for taking some of the photographs in this paper. All the data used forplotting figures 5–15 are archived at Zenodo (https://doi.org/10.5281/zenodo.4597441).
Funding. We acknowledge the support of the Swiss National Science Foundation through Project 200020175750 and the Swiss Federal Commission for Scholarships. This research was also supported by NERC grantsNE/E003206/1 and NE/K003011/1 as well as EPSRC grants EP/I019189/1, EP/K00428X/1 and EP/M022447/1.J.M.N.T.G. is a Royal Society Wolfson Research Merit Award holder (WM150058) and an EPSRC EstablishedCareer Fellow (EP/M022447/1).
Declaration of interests. The authors report no conflict of interest.
Author ORCIDs.T. Trewhela https://orcid.org/0000-0002-7461-8570;C. Ancey https://orcid.org/0000-0003-3354-7398;J.M.N.T. Gray https://orcid.org/0000-0003-3554-0499.
REFERENCES
BAKER, J.L., JOHNSON, C.G. & GRAY, J.M.N.T. 2016 Segregation-induced finger formation in granularfree-surface flows. J. Fluid Mech. 809, 168–212.
BARKER, T. & GRAY, J.M.N.T. 2017 Partial regularisation of the incompressible μ(I)-rheology for granularflow. J. Fluid Mech. 828, 5–32.
BARKER, T., RAUTER, M., MAGUIRE, E., JOHNSON, C. & GRAY, J.M.N.T. 2021 Coupling rheology andsegregation in granular flows. J. Fluid Mech. 909, A22.
BARKER, T., SCHAEFFER, D.G., SHEARER, M. & GRAY, J.M.N.T. 2017 Well-posed continuum equationsfor granular flow with compressibility and μ(I)-rheology. Proc. R. Soc. A 473, 20160846.
BATES, L. 1997 User Guide to Segregation. British Materials Handling Board.BAXTER, J., TÜZÜN, U., HEYES, D., HAYATI, I. & FREDLUND, P. 1998 Stratification in poured granular
heaps. Nature 391, 136.BRIDGWATER, J., FOO, W. & STEPHENS, D. 1985 Particle mixing and segregation in failure zones – theory
and experiment. Powder Technol. 41, 147.BRIDGWATER, J. & INGRAM, N. 1971 Rate of spontaneous inter-particle percolation. Trans. Inst. Chem.
Engng 49, 163–169.CHASSAGNE, R., MAURIN, R., CHAUCHAT, J., GRAY, J.M.N.T. & FREY, P. 2020 Discrete and continuum
modelling of grain size segregation during bedload transport. J. Fluid Mech. 895, A30.CHEN, K.-D., LIN, Y.-F. & TU, C.-H. 2012 Densities, viscosities, refractive indexes, and surface tensions for
mixtures of ethanol, benzyl acetate, and benzyl alcohol. J. Chem. Engng Data 57 (4), 1118–1127.
916 A55-35
Dow
nloa
ded
from
htt
ps://
ww
w.c
ambr
idge
.org
/cor
e. IP
add
ress
: 85.
218.
39.6
9, o
n 20
Apr
202
1 at
16:
11:4
1, s
ubje
ct to
the
Cam
brid
ge C
ore
term
s of
use
, ava
ilabl
e at
htt
ps://
ww
w.c
ambr
idge
.org
/cor
e/te
rms.
htt
ps://
doi.o
rg/1
0.10
17/jf
m.2
021.
227

T. Trewhela, C. Ancey and J.M.N.T. Gray
CROCKER, J.C. & GRIER, D.G. 1996 Methods of digital video microscopy for colloidal studies. J. ColloidInterface Sci. 179 (1), 298–310.
DENISSEN, I., WEINHART, T., TE VOORTWIS, A.S., GRAY, S.L. & THORNTON, A.R. 2019 Bulbous headformation in bidisperse shallow granular flow over an inclined plane. J. Fluid Mech. 866, 263–297.
DOLGUNIN, V.N. & UKOLOV, A.A. 1995 Segregation modelling of particle rapid gravity flow. PowderTechnol. 83, 95–103.
FAN, Y., BOUKERKOUR, Y., BLANC, T., UMBANHOWAR, P.B., OTTINO, J.M. & LUEPTOW, R.M. 2012Stratification, segregation, and mixing of granular materials in quasi-two-dimensional bounded heaps.Phys. Rev. E 86, 051305.
FAN, Y., SCHLICK, C.P., UMBANHOWAR, P.B., OTTINO, J.M. & LUEPTOW, R.M. 2014 Modelling sizesegregation of granular materials: the roles of segregation, advection and diffusion. J. Fluid Mech. 741,252–279.
FRY, A.M., UMBANHOWAR, P.B., OTTINO, J.M. & LUEPTOW, R.M. 2019 Diffusion, mixing, andsegregation in confined granular flows. AIChE J. 65, 875–881.
GAJJAR, P. & GRAY, J.M.N.T. 2014 Asymmetric flux models for particle-size segregation in granularavalanches. J. Fluid Mech. 757, 297–329.
GDR-MIDI 2004 On dense granular flows. Eur. Phys. J. E 14, 341–365.GILBERG, D. & STEINER, K. 2020 Size segregation in compressible granular shear flows of binary particle
systems. Granul. Matter 22, 45.GODDARD, J.D. & LEE, J. 2018 Regularization by compressibility of the μ(I) model of dense granular flow.
Phys. Fluids 30, 073302.GOLICK, L.A. & DANIELS, K.E. 2009 Mixing and segregation rates in sheared granular materials. Phys. Rev.
E 80 (4), 042301.GRAY, J.M.N.T. 2018 Particle segregation in dense granular flows. Annu. Rev. Fluid Mech. 50, 407–433.GRAY, J.M.N.T. & ANCEY, C. 2011 Multi-component particle size segregation in shallow granular
avalanches. J. Fluid Mech. 678, 535–588.GRAY, J.M.N.T. & ANCEY, C. 2015 Particle-size and particle-density segregation in granular avalanches.
J. Fluid Mech. 779, 622–668.GRAY, J.M.N.T. & CHUGUNOV, V.A. 2006 Particle-size segregation and diffusive remixing in shallow
granular avalanches. J. Fluid Mech. 569, 365–398.GRAY, J.M.N.T. & HUTTER, K. 1997 Pattern formation in granular avalanches. Continuum Mech.
Thermodyn. 9, 341–345.GRAY, J.M.N.T. & THORNTON, A.R. 2005 A theory for particle size segregation in shallow granular
free-surface flows. Proc. R. Soc. A 461, 1447–1473.GRAY, J.M.N.T., WIELAND, M. & HUTTER, K. 1999 Free surface flow of cohesionless granular avalanches
over complex basal topography. Proc. R. Soc. A 455, 1841–1874.GUILLARD, F., FORTERRE, Y. & POULIQUEN, O. 2016 Scaling laws for segregation forces in dense sheared
granular flows. J. Fluid Mech. 807, R1.HILL, K.M., KHARKAR, D.V., GILCHRIST, J.F., MCCARTHY, J.J. & OTTINO, J.M. 1999 Segregation
driven organization in chaotic granular flows. Proc. Natl Acad. Sci. USA 96, 11701–11706.ISNER, A.B., UMBANHOWAR, P.B., OTTINO, J.M. & LUEPTOW, R.M. 2020 Axisymmetric granular flow
on a bounded conical heap: kinematics and size segregation. Chem. Engng Sci. 217, 115505.IVERSON, R.M. & VALLANCE, J.W. 2001 New views of granular mass flows. Geology 29 (2), 115–118.JING, L., KWOK, C.Y. & LEUNG, Y.F. 2017 Micromechanical origin of particle size segregation. Phys. Rev.
Lett. 118, 118001.JOHANSON, J.R. 1978 Particle segregation . . . and what to do about it. Chem. Engng 85, 183–188.JONES, R.P., ISNER, A.B., XIAO, H., OTTINO, J.M., UMBANHOWAR, P.B. & LUEPTOW, R.M. 2018
Asymmetric concentration dependence of segregation fluxes in granular flows. Phys. Rev. Fluids 3, 094304.JOP, P., FORTERRE, Y. & POULIQUEN, O. 2005 Crucial role of sidewalls in granular surface flows:
consequences for the rheology. J. Fluid Mech. 541, 167–192.JOP, P., FORTERRE, Y. & POULIQUEN, O. 2006 A constitutive relation for dense granular flows. Nature 44,
727–730.KHAKHAR, D.V., ORPE, A.V. & HAJRA, S.K. 2003 Segregation of granular materials in rotating cylinders.
Physica A 318, 129–136.LIU, Y., GONZALEZ, M. & WASSGREN, C. 2019 Modeling granular material segregation using a combined
finite element method and advection-diffusion-segregation equation model. Powder Technol. 346,38–48.
MAY, L.B.H., GOLICK, L.A., PHILLIPS, K.C., SHEARER, M. & DANIELS, K.E. 2010 Shear-driven sizesegregation of granular materials: modeling and experiment. Phys. Rev. E 81 (5), 051301.
916 A55-36
Dow
nloa
ded
from
htt
ps://
ww
w.c
ambr
idge
.org
/cor
e. IP
add
ress
: 85.
218.
39.6
9, o
n 20
Apr
202
1 at
16:
11:4
1, s
ubje
ct to
the
Cam
brid
ge C
ore
term
s of
use
, ava
ilabl
e at
htt
ps://
ww
w.c
ambr
idge
.org
/cor
e/te
rms.
htt
ps://
doi.o
rg/1
0.10
17/jf
m.2
021.
227

An experimental scaling law for particle-size segregation
MIDDLETON, G.V. 1970 Experimental studies related to problems of flysch sedimentation. In FlyschSedimentology in North America (ed. J. Lajoie), pp. 253–272. Business and Economics Science Ltd.
PIERSON, T.C. 1986 Flow behavior of channelized debris flows, Mount St. Helens, Washington. In HillslopeProcesses (ed. A. D. Abrahams), pp. 269–296. Allen and Unwin, Winchester.
POULIQUEN, O., DELOUR, J. & SAVAGE, S.B. 1997 Fingering in granular flows. Nature 386, 816–817.POULIQUEN, O. & VALLANCE, J.W. 1999 Segregation induced instabilities of granular fronts. Chaos 9 (3),
621–630.ROCHA, F.M., JOHNSON, C.G. & GRAY, J.M.N.T. 2019 Self-channelisation and levee formation in
monodisperse granular flows. J. Fluid Mech. 876, 591–641.ROGNON, P.G., ROUX, J.N., NAAIM, M. & CHEVOIR, F. 2007 Dense flows of bidisperse assemblies of disks
down an inclined plane. Phys. Fluids 19, 058101.SAVAGE, S.B. & HUTTER, K. 1989 The motion of a finite mass of granular material down a rough incline.
J. Fluid Mech. 199, 177–215.SAVAGE, S.B. & LUN, C.K.K. 1988 Particle size segregation in inclined chute flow of dry cohesionless
granular solids. J. Fluid Mech. 189, 311–335.SCHAEFFER, D.G., BARKER, T., TSUJI, D., GREMAUD, P., SHEARER, M. & GRAY, J.M.N.T. 2019
Constitutive relations for compressible granular flow in the inertial regime. J. Fluid Mech. 874, 926–951.SCHLICK, C.P., FAN, Y., UMBANHOWAR, P.B., OTTINO, J.M. & LUEPTOW, R.M. 2015 Granular
segregation in circular tumblers: theoretical model and scaling laws. J. Fluid Mech. 765, 632–652.SCHULZE, D. 2008 Powders and Bulk Solids . Springer.SILBERT, L.E., ERTAS, D., GREST, G.S., HALSEY, T.C., LEVINE, D. & PLIMPTON, S.J. 2001 Granular
flow down an inclined plane: bagnold scaling and rheology. Phys. Rev. E 64, 051302.SKEEL, R.D. & BERZINS, M. 1990 A method for the spatial discretization of parabolic equations in one space
variable. SIAM J. Sci. Stat. Comput. 11 (1), 1–32.THOMAS, N. 2000 Reverse and intermediate segregation of large beads in dry granular media. Phys. Rev. E
62, 961–974.THOMAS, N. & D’ORTONA, U. 2019 Evidence of reverse and intermediate size segregation in dry granular
flows down a rough incline. Phys. Rev. E 97, 022903.THORNTON, A.R., GRAY, J.M.N.T. & HOGG, A.J. 2006 A three-phase mixture theory for particle size
segregation in shallow granular free-surface flows. J. Fluid Mech. 550, 1–25.THORNTON, A.R., WEINHART, T., LUDING, S. & BOKHOVE, O. 2012 Modeling of particle size segregation:
calibration using the discrete particle method. Intl J. Mod. Phys. C 23, 1240014.TRIPATHI, A. & KHAKHAR, D.V. 2011 Numerical simulation of the sedimentation of a sphere in a sheared
granular fluid: a granular stokes experiment. Phys. Rev. Lett. 107, 108001.TRIPATHI, A. & KHAKHAR, D.V. 2013 Density difference-driven segregation in a dense granular flow. J.
Fluid Mech. 717, 643–669.TUNUGUNTLA, D.R., BOKHOVE, O. & THORNTON, A.R. 2014 A mixture theory for size and density
segregation in shallow granular free-surface flows. J. Fluid Mech. 749, 99–112.UTTER, B. & BEHRINGER, R.P. 2004 Self-diffusion in dense granular shear flows. Phys. Rev. E 69, 031308.VALLANCE, J.W. & SAVAGE, S.B. 2000 Particle segregation in granular flows down chutes. In IUTAM
Symposium on segregation in granular materials (ed. A.D. Rosato & D.L. Blackmore), pp. 31–51. Kluwer.VAN DER VAART, K., GAJJAR, P., EPELY-CHAUVIN, G., ANDREINI, N., GRAY, J.M.N.T. & ANCEY, C.
2015 Underlying asymmetry within particle size segregation. Phys. Rev. Lett. 114, 238001.WIEDERSEINER, S., ANDREINI, N., EPELY-CHAUVIN, G., MOSER, G., MONNEREAU, M., GRAY,
J.M.N.T. & ANCEY, C. 2011 Experimental investigation into segregating granular flows down chutes.Phys. Fluids 23, 013301.
WILKINSON, D.R. & EDWARDS, S.F. 1982 Spontaneous interparticle percolation. Proc. R. Soc. A 381,33–51.
WILLIAMS, S.C. 1968 The mixing of dry powders. Powder Technol. 2, 13–20.WILLS, B.A. 1979 Mineral Processing Technology. Pergamon.XIAO, H.Y., UMBANHOWAR, P.B., OTTINO, J.M. & LUEPTOW, R.M. 2016 Modelling density segregation
in flowing bidisperse granular materials. Proc. R. Soc. A 472, 20150856.
916 A55-37
Dow
nloa
ded
from
htt
ps://
ww
w.c
ambr
idge
.org
/cor
e. IP
add
ress
: 85.
218.
39.6
9, o
n 20
Apr
202
1 at
16:
11:4
1, s
ubje
ct to
the
Cam
brid
ge C
ore
term
s of
use
, ava
ilabl
e at
htt
ps://
ww
w.c
ambr
idge
.org
/cor
e/te
rms.
htt
ps://
doi.o
rg/1
0.10
17/jf
m.2
021.
227