an experimental study on the behavior of trusses built with hsla-v steel
TRANSCRIPT
An ExperimentalStudy of theBehavior ofTrussesFabricated withHigh-StrengthLow-AlloyMicroalloyedVanadium Steel
17 October 2008
SGH Project 047079

BostonLos AngelesNew YorkSan FranciscoWashington, DC
www.sgh.comDesign, Investigate,
and Rehabilitate
PREPARED FOR:
Advanced Technology Institute5300 International BoulevardNorth Charleston, SC 29418
PREPARED BY:
Simpson Gumpertz & Heger Inc.41 Seyon StreetBuilding 1, Suite 500Waltham, MA 02453Tel: 781.907.9000Fax: 781.907.9009

- i -
Table of Contents
ABSTRACT1
CONTENTS Page
1. INTRODUCTION 21.1 Background and Goals of the Overall Vanadium Technology Program 2
1.1.1 Vanadium Microalloyed Steels Are Produced by the Integration ofSeveral Technical Concepts and Technologies 3
1.1.2 What is Vanadium? 41.1.3 Environmental Benefits 4
1.2 SGH Phase 1 of the Vanadium Technology Project 51.3 SGH Phase 2 of the Vanadium Technology Project 8
1.3.1 Production- and Fabrication-Related Issues 81.3.2 Single- and Double-Angle Buckling Tests Performed at Lehigh 91.3.3 Subassembly Tests Performed at Lehigh University 121.3.4 Tests on Complete-Truss Specimens Performed at CanAm 131.3.5 Analytical Correlation Study 141.3.6 Parametric Studies 14
2. SUMMARY OF COMPONENT AND SUBASSEMBLY TEST RESULTS 16
3. TEST PROGRAM 173.1 Purpose of Tests 173.2 Test Matrix 173.3 Design of Test Specimens 18
3.3.1 K-Values and Bracing 183.3.2 AISC Specification Design Equations 19
3.4 Fabrication of Test Specimens 23
4. TEST SET-UP 244.1 Test Machine 244.2 Instrumentation 244.3 Test Sequence 25
5. TEST RESULTS 285.1 Results Summary 285.2 Specimen A1 295.3 Specimen A2 305.4 Specimen B1 305.5 Specimen B2 305.6 Specimen C1 305.7 Specimen C2 305.8 Strain Gage Analysis 31
5.8.1 Specimen C1 315.8.2 Specimen B1 325.8.3 Specimen A1 32
5.9 Coupon Tests of Samples Taken from Trusses after Testing 32
1Bold capitalized headings are tab indexed.

- ii -
6. DISCUSSION 356.1 Vertical Displacements and End Rotations 356.2 Weld and Member Eccentricities 356.3 Strain Gage Results 366.4 Evaluation of Design Approach 38
7. CONCLUSIONS 39
ILLUSTRATIONS
Photos 1 through 14Figures 1 through 8
APPENDIX
APPENDIX A – Recorded Test Data

- 1 -
ABSTRACT
We conducted tests of six complete trusses constructed using high-strength low-alloy (HSLA-V)microalloyed vanadium steels as part of a research program to determine the feasibility of usingHSLA-V steel to produce long-span steel trusses. The test specimens had double-angle chordmembers, and a combination of double-angle and crimped single-angle web members. Theyield stress of the truss members ranged from 78 to 82 ksi.
We compared our test results to strength predictions using the Steel Joist Institute StandardSpecification for Longspan Steel Joists, LH-Series and Deep Longspan Steel Joists, DLH-Series. Although the SJI Specification limits its applicability to joists constructed using steel witha maximum yield stress of 50 ksi, we found that the SJI design approach conservativelypredicted the strengths of the HSLA-V test specimens.

- 2 -
1. INTRODUCTION
1.1 Background and Goals of the Overall Vanadium Technology Program
The Army Research Laboratory (ARL) mission is to execute fundamental and applied research
to provide the Army with the key technologies and analytical support necessary to assure
supremacy in future land warfare. A long-term research project sponsored by ARL under
Cooperative Agreement Number DAAD 19-03-2-0036 and executed by the Advanced
Technology Institute (ATI), was initiated in 2003 to assess the impact of high-strength low-alloy
(HSLA-V) microalloyed vanadium steels on a wide variety of different army applications that use
steel.
The Vanadium Technology Partnership that developed from the early stages of this research
project is fostering a cooperative relationship between the vanadium microalloyed steel industry
and the U.S. Army to effectively apply these high-performance steels in U.S. Army applications.
Principal partners include experts from the vanadium industry and experts from the U.S. Army.
Together, this team is guiding this program through the stages of investigation, development,
and deployment, while transferring technical information to the market place.
The United States Army will benefit from lighter, more mobilesystems, which improve airlift capability and decrease logisticalsupport. Fixed Army assets (army base buildings, bridges, andblast-resistant structures) are strengthened and hardened.
The Steel Industry will benefit by becoming more competitiveand sustainable by transforming itself into a profitable enterprisebased on technologies supporting value-added vanadium micro-alloyed steels.
The Environment will benefit from the manufacture of vanadiummicroalloyed steels through a host of environmental benefits byexploiting recycled catalysts, lighter-weight structures, andreducing system emissions of vehicles.

- 3 -
High-strength and lightweight microalloyed materials are increasingly important in the design of
both commercial and military applications. Material reliability, availability, environmental factors,
fabrication costs, and design difficulties are just some of the important issues considered during
the material selection phase of a design procedure. There are large potential margins for
improvement to the user by substitution of high-strength low-alloy (HSLA) steels based on
microalloying with strong carbide and nitride formers. These lead to lower material costs and
weight reduction, leading to much lighter structures across a wide range of engineering
applications include bridges, buildings, and vehicles. These applications also benefit from
improved fabrication where weldability is important, reduced costs of transportation, or the
combination of properties in the finished product. This technology offers the opportunity of a
value-added product at very low incremental cost, a lower capital and operating cost structure
offering greater profit potential, and the chance to recapture markets lost to imports.
The common elements used in HSLA steels are vanadium and niobium, and to a lesser extent
titanium. Compared with niobium, vanadium microalloyed steels offer certain cost advantages.
When continuous casters are operated, one of the possibilities is a propensity for cracking at
certain temperatures in the cooling range; with vanadium, there is a lower propensity for
cracking than with niobium. By using vanadium, hot rolling is simplified greatly by the
differences in solubility of the carbides and nitrides of niobium and vanadium, thus resulting in
energy savings and lower rolling loads. The lack of precipitation in vanadium steels during hot
rolling allows austenite to continue to recrystallize freely, and leads to fine ferrite grains after
transformation, followed by vanadium carbo-nitride precipitation in ferrite.
1.1.1 Vanadium Microalloyed Steels Are Produced by the Integration of SeveralTechnical Concepts and Technologies
Electric-arc furnace technology is energy efficient and thrives on recycled scrap steel,which is abundant in the United States and produces in excess 50% of the domesticproduction. Vanadium strengthens steel with minor (micro) additions to the steelchemistry.
Vanadium binds nitrogen introduced in the arc furnace melting and is trapped insubsequent freezing (solidification) of the steel. Vanadium offsets the otherwisedeleterious effects of nitrogen in steel.
Continuous casting solidifies the vanadium microalloyed steel uniformly and quicklywhile providing a steady stream of feedstock for rolled products.
Continuous thermal processing and rolling economically transforms the continuouslycast feedstock into useful product forms ready for steel construction, stamping, rolling,
- 4 -
or any other manufacturing process required of the U.S. Army and commercial supplychains.
1.1.2 What is Vanadium?
Vanadium is a well-known, but perhaps underutilized, alloying element that enables higher
strength steel. Two broad areas of U.S. Army applications could benefit from innovative
designs utilizing vanadium microalloyed steels. Civil engineering applications could realize
higher strength or lighter structures designed to resist blasts or seismic shocks. Mobility and
packaging applications could benefit from higher strength steel to reduce weapon system
weight, improve mobility and readiness, while reducing fuel requirements and emissions.
Vanadium is a soft, ductile, silver-gray metal. Many of its properties resemble those of
chromium. It is corrosion-resistant at normal temperature, but oxidizes above 600ºC.
Vanadium is not found uncombined in nature, but is distributed widely through a variety of
minerals. In the United States, the primary source of vanadium is spent catalyst from chemical
processing plants. These catalysts are processed by several companies that, in turn, supply
vanadium alloying stock to steel producers. The principal use of vanadium is in metallic alloys,
especially steels. In tool and spring steels it is a powerful alloying agent; a small amount (less
than 1%) adds strength, toughness, and heat resistance. It is usually added in the form of
ferrovanadium, a vanadium-iron alloy. Vanadium compounds, especially vanadium pentoxide,
are used in the ceramics, glass, and dye industries, and are important as catalysts in the
chemical industry.
1.1.3 Environmental Benefits
The environmental benefits of recycled vanadium are worth noting. Each year six million
pounds of vanadium are recycled from spent catalysts. Recycling reduces energy requirements
associated with processing virgin vanadium ores, eliminates or reduces the need for land-filling
these "wastes," and ensures a domestic supply of vanadium for U.S. steel producers that supply
here and abroad.
Domestic vanadium supplies are derived primarily from recycling of residual waste from oil
refining and burning. Alternatively, these residual wastes would be land-filled, often as
hazardous wastes. Environmental benefits accrued through this process include:
Applying vanadium microalloyed steels in long-span structures results in reduced steelconsumption while providing greater spanning capability.
- 5 -
Stop/reduce land-filling of inadequately treated catalyst and encourage materialsreuse.
Reduce energy use and waste generated in mining and smelting.
Six million plus pounds of vanadium are generated from recycled waste per year,compared to 1.2 billion pounds of waste to produce the same amount of vanadiumfrom virgin ore.
Simpson Gumpertz & Heger, Inc. (SGH) uses a life-cycle assessment (LCA) approach to
evaluate the benefits of vanadium-alloyed steels. LCA is a quantifiable, cradle-to-grave
methodology which is used to evaluate any number of environmental impacts of a material or
system.
1.2 SGH Phase 1 of the Vanadium Technology Project
In the first phase of the project, SGH performed a total of three case studies. The objective of
the three case studies was to assess the potential cost savings and environmental benefits that
could be achieved using HSLA Vanadium alloy steels in selected civil engineering applications.
The potential economic benefits were measured in terms of a reduction in steel tonnage and
overall building cost. The environmental benefits were determined using an LCA approach to
quantify six environmental impact measures from cradle-to-grave. This LCA approach
constituted a quantified, rational method to weighing the environmental costs and benefits of
construction options.
The current state of the art in steel production is such that structural steel for building and bridge
applications is typically produced in a 50 ksi yield strength grade. Vanadium microalloying has
significant benefits in producing cost effective plates (up to 0.5 inch thick) using thin slab casting
techniques up to 85 ksi in yield strength with good deformation and weldability properties.
Rolled structural shapes, employing Vanadium microalloying and thermal mechanical
processing, are available in yield strengths up to 65 ksi for standard building applications and in
bridge applications structural girders are being fabricated from plate material in the 70 to 100 ksi
yield strength range. In each of the three case studies, a range of steel yield strengths from 50
to 100 ksi was assessed with the 50 ksi study providing a benchmark for comparison of the
benefits of employing the higher strength Vanadium microalloyed steels. Of these three studies,
the use of HSLA-V steels in long-span structures with fabricated steel truss framing showed
significant potential in both cost and environmental benefits and was recommended as the basis
for further study in the demonstration project phase.
- 6 -
Long-span structures are prevalent in many applications for both military and civilian
applications, including hangars, maintenance facilities, training centers, warehouses, sports
centers, and manufacturing plants. Typical steel framing systems for these structures
incorporate long-span steel trusses. These are fabricated, open-web members built up from
relatively light structural sections. Steel trusses are also a common component in steel bridge
construction.
A significant part of the cost of truss framing is associated with the design, detailing, and
fabrication costs, which must be repeated for each truss assembly having different span, depth,
load, and geometric conditions. To minimize these costs and make building construction with
steel trusses economical, the building industry has developed a large series of standardized
steel truss designs for which span and load tables have been published. Engineers can then
specify these standard truss designs without performing the laborious design calculations
required for each one and contractors can purchase the trusses as off-the-shelf items from
manufacturers who produce them in assembly-line fashion. These standardized steel trusses
are termed steel joists and joist girders, depending on their specific framing application.
Currently, steel joists are fabricated almost exclusively using Grade 50 steels. Their use is
widespread in civilian and military applications. Current production of steel joists and joist
girders in the United States is about 1 million tons per year.
The long-span case study focused on the reduction in member sizes and thus weight savings
attainable when higher strength steels are used in the fabrication of the standard joist and joist
girders currently published by the Steel Joist Institute (SJI). SJI is the industry association that
brings uniformity and standardization to design and manufacturing practice with this structural
type. SJI publishes standard design specifications, standard fabrication practices, a code of
standard practice, and the series of design tables used by design professionals to specify joists
for projects.
The use of higher-strength steels in the design of long-span joists and joist girders reduced the
material weights significantly and a majority of the weight reduction is independent of the joist or
girder geometry. Weight savings of approximately 25% and 33% were achieved for 80 and
100 ksi steel respectively. For the joists, one possible negative impact of the higher-strength
steels in a limited number of applications is an increase in the live load deflection. Since live
load deflection is primarily a function of the joist geometry, and the use of high-strength steel
permits standardized loads to be carried with lighter and smaller members, high-strength joists

- 7 -
will have increased live load deflection under a given loading, compared to joists designed using
lower strength steels. However, in the applications for which steel joist and other steel truss
framing is commonly employed, live load deflection is often not a significant design issue and in
many applications, the larger deflections associated with the use of higher strength steels can
be tolerated.
In addition to the weight savings attainable for joist girders, an added benefit of using the higher
strength steel was the increased load capacity of the joist girders for a given span. The higher
grade steels expanded the functionality and the feasibility of the joist girders for larger loads,
while reducing the girder weight for the existing loading conditions. The savings obtained with
the higher-strength steels were more apparent for the larger sized joists and joist girders.
Lighter joists with smaller initial member sizes had smaller weight savings when using
higher-strength steels. As the member sizes decrease, the controlling factor becomes the
slenderness and buckling criteria instead of the member strength.
To illustrate the cost savings related to the weight savings for joists and joist girders, SGH
developed a prototypical warehouse design example. SGH sized the joists and joist girders
using 50 and 80 ksi yield-strength steel and compared the total weight of joists and joist girders
for each of the designs. The warehouse was a 300 ft by 180 ft structure consisting of three
bays with 100 ft joist spans in the east-west direction and three bays with 60 ft joist girder spans
in the north-south direction. The joists were spaced at 5 ft on center along the joist girders.
Based on industry data, the cost of the steel was based on an erected cost of $0.85 per lb
(approximately $1700 per ton) of steel. It was assumed that the cost to produce, ship, and erect
the joists and joist girders would not change for higher-strength steels, an assumption that must
be verified. The estimated steel weight for the 50 ksi design in this case study was 181 tons at
a cost of $307,700. The estimated steel weight for the 80 ksi design was 139 tons at a cost of
$236,300, which is a 24% weight reduction and cost savings. The weight reduction represents
approximately 42 tons of steel at a cost savings of $71,400 or 23%.
As discussed above, SGH used an LCA approach to evaluating the benefits of HSLA-V steels.
The environmental benefit of using vanadium-alloy steel in long-span structures is nearly
proportional to the weight savings, so long as the extra strength is obtained by the addition of
alloys rather than additional reheat or other energy-intensive procedures.
- 8 -
1.3 SGH Phase 2 of the Vanadium Technology Project
Following the promising results of Phase 1, ATI awarded SGH a Phase 2 project to look at all of
the important issues related to the implementation of HSLA-V steels in long-span structures.
This work involved both experimental and analytical studies.
1.3.1 Production- and Fabrication-Related Issues
Production issues related to HSLA-V steel shapes in building and long-span applications
needed to be understood in order to establish the highest possible strength for structural steel
shapes that could be produced for the experimental phase of the project at a cost that retains
the use of this material as a desirable alternative to current structural grade materials. Roanoke
Steel proved to be the best candidate as they were producing small I-beams for truck trailers for
Steel of West Virginia (one of their subsidiaries) that had an 80 to 85 ksi yield-strength with
appropriate properties. In addition, Roanoke Steel was also able to hot-roll a limited number of
angle structural shapes (up to 4 in. x 4 in. x 1/2 in.) required for the long span application.
SGH was required to order a full heat (90 tons) of billets (6 in. x 6 in. x 26 ft) of the same steel
that was used to produce the I-beams because Roanoke Steel did not routinely produce angles
with this higher strength material. In addition, Roanoke Steel was not prepared to guarantee
any specific yield strength of the material because they were aware that the yield strength
decreased as the thickness of the shape increased. Once the probable extent of the
experimental phase of the project was determined, the following angle sizes were ordered to be
rolled from the billets that Roanoke Steel produced:
4 in. x 4 in. x 1/2 in. – 4 billets – 40 ft lengths – 490 ft 3.5 x 3.5 x 3/8 – 2 billets – 40 ft lengths – 740 ft 3 x 3 x 3/16 – 2 billets – 40 ft lengths – 1700 ft 2 x 2 x 3/16 – 2 billets – 40 ft lengths – 2580 ft 1.75 x 1.75 x 1/8 – 2 billets – 40 ft lengths – 4370 ft
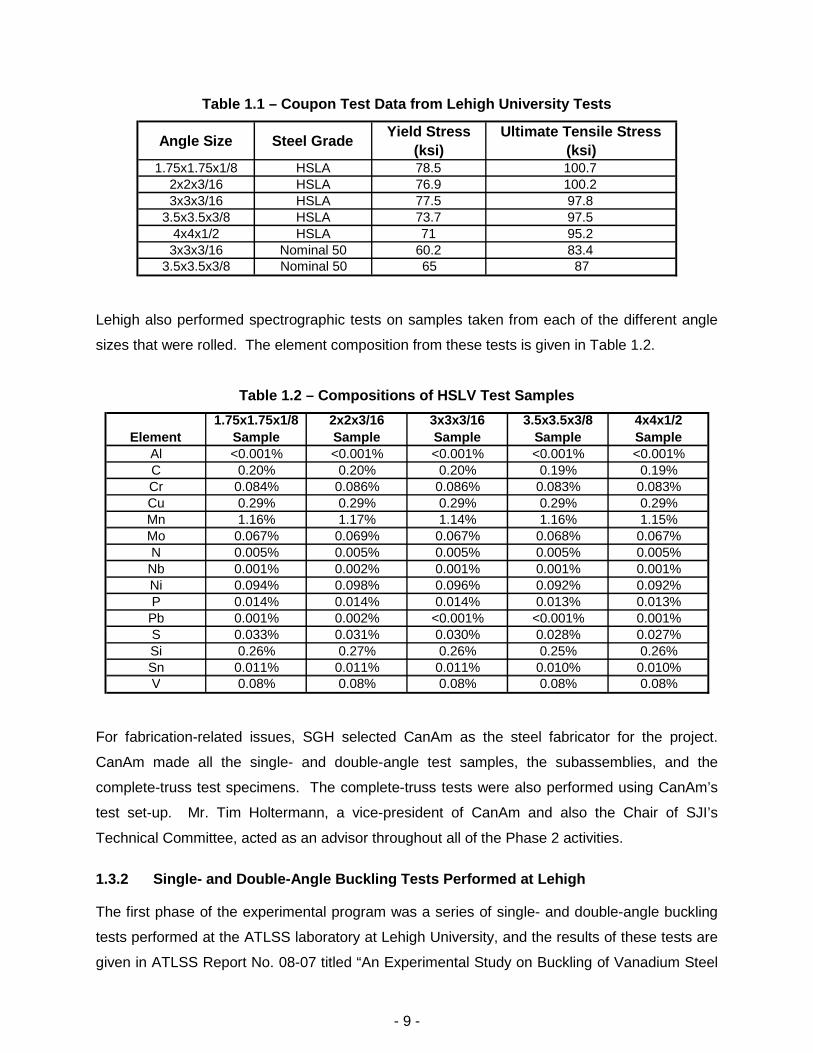
As part of the single and double angle testing performed at Lehigh University, five coupons from
each angle size were tested for basic strength properties. The yield and tensile strength
properties obtained from the Lehigh tests are given in Table 1.1.
- 9 -
Table 1.1 – Coupon Test Data from Lehigh University Tests
Angle Size Steel GradeYield Stress
(ksi)
Ultimate Tensile Stress
(ksi)1.75x1.75x1/8 HSLA 78.5 100.7
2x2x3/16 HSLA 76.9 100.23x3x3/16 HSLA 77.5 97.8
3.5x3.5x3/8 HSLA 73.7 97.54x4x1/2 HSLA 71 95.23x3x3/16 Nominal 50 60.2 83.4
3.5x3.5x3/8 Nominal 50 65 87
Lehigh also performed spectrographic tests on samples taken from each of the different angle
sizes that were rolled. The element composition from these tests is given in Table 1.2.
Table 1.2 – Compositions of HSLV Test Samples
Element
1.75x1.75x1/8
Sample
2x2x3/16
Sample
3x3x3/16
Sample
3.5x3.5x3/8
Sample
4x4x1/2
Sample
Al <0.001% <0.001% <0.001% <0.001% <0.001%C 0.20% 0.20% 0.20% 0.19% 0.19%Cr 0.084% 0.086% 0.086% 0.083% 0.083%Cu 0.29% 0.29% 0.29% 0.29% 0.29%Mn 1.16% 1.17% 1.14% 1.16% 1.15%Mo 0.067% 0.069% 0.067% 0.068% 0.067%N 0.005% 0.005% 0.005% 0.005% 0.005%Nb 0.001% 0.002% 0.001% 0.001% 0.001%Ni 0.094% 0.098% 0.096% 0.092% 0.092%P 0.014% 0.014% 0.014% 0.013% 0.013%Pb 0.001% 0.002% <0.001% <0.001% 0.001%S 0.033% 0.031% 0.030% 0.028% 0.027%Si 0.26% 0.27% 0.26% 0.25% 0.26%Sn 0.011% 0.011% 0.011% 0.010% 0.010%V 0.08% 0.08% 0.08% 0.08% 0.08%
For fabrication-related issues, SGH selected CanAm as the steel fabricator for the project.
CanAm made all the single- and double-angle test samples, the subassemblies, and the
complete-truss test specimens. The complete-truss tests were also performed using CanAm’s
test set-up. Mr. Tim Holtermann, a vice-president of CanAm and also the Chair of SJI’s
Technical Committee, acted as an advisor throughout all of the Phase 2 activities.
1.3.2 Single- and Double-Angle Buckling Tests Performed at Lehigh
The first phase of the experimental program was a series of single- and double-angle buckling
tests performed at the ATLSS laboratory at Lehigh University, and the results of these tests are
given in ATLSS Report No. 08-07 titled “An Experimental Study on Buckling of Vanadium Steel

- 10 -
Members with Single- or Double-Angle Cross-Sections,” by Ali B. Candas, Richard Sause, and
James M. Ricles, to be published in 2008.
The primary objectives of these tests were:
Evaluate AISC equations for correct failure mode and strength prediction for a range ofQ-values and slenderness ratios.
Evaluate whether AISC equations properly address local buckling for high-strengthsteel.
Evaluate the effect of end restraint on behavior.
Evaluate the effect of crimping on single-angle compressive strength.
The range of l/r ratios from the 80-ksi truss designs we performed as part of our Phase 1 effort
are given in Table 1.3.
Table 1.3 – Slenderness Ratios from 80-ksi Designs
Top Chord Bottom Chord“Compression”
Diagonal“Tension”Diagonal
Basic Girder 36 to 41 60 to 64 75 to 100 96 to 120Snow Girder 32 to 49 98 68 to 91 114 to 146HurricaneGirder
47 to 51 41 to 66 68 to 101 67 to 101
Basic Joist 39 to 91 84 to 103 98 to 141 139 to 141Snow Joist 32 to 76 107 56 to 118 70 to 83Hurricane Joist 32 to 75 55 to 92 78 to 141 67 to 112
We used these slenderness ratios as a guide to help us determine the range of variables to
include in the test program. Under our direction, Lehigh performed a total of fourteen
single-angle tests as shown in Table 1.4. The test set-up used cylindrical bearings which
allowed rotation about the symmetrical (strong) axis and restrained rotation about the weak axis.
Thus k (effective length factor) for weak-axis flexural buckling was 0.5.

- 11 -
Table 1.4 – Single Angle Test Variables
Test No. SizeCrimped/
Weld MaterialLength
(in.) Q kl/rS-A1 L3.5x3.5x3/8 no 80 ksi 24 0.97 18
S-A2 L3.5x3.5x3/8 no 80 ksi 60 0.97 44
S-A3 L3.5x3.5x3/8 no 50 ksi 24 1.00 18
S-B1 L3x3x3/16 no 80 ksi 24 0.70 20
S-B2 L3x3x3/16 no 80 ksi 48 0.70 40
S-B3 L3x3x3/16 no 50 ksi 24 0.83 20
S-C1 L2x2x3/16 yes-L weld 80 ksi 30 0.91 38
S-C2 L2x2x3/16 yes-L weld 80 ksi 60 0.91 77
S-C3 L2x2x3/16 yes-U weld 80 ksi 30 0.91 38
S-C4 L2x2x3/16 yes-U weld 80 ksi 60 0.91 77
S-C5 L2x2x0.186 yes-L weld 50 ksi 30 1.00 38
S-C6 L2x2x0.186 yes-L weld 50 ksi 60 1.00 77
S-D1 L1.75x1.75x1/8 yes-L weld 80 ksi 30 0.78 87
S-D2 L1.75x1.75x1/8 yes-L weld 80 ksi 60 0.78 173
Note: “L weld” denotes L-shaped welds at both ends of specimen (to connect the crimpedangle to the chord stubs). “U weld” denotes U-shaped welds.
Lehigh performed a total of 15 double-angle compression tests as shown in Table 1.5; the
slenderness ratio (l/r) refers to the weak axis. As for the single-angle tests, the test set-up used
cylindrical bearings which allowed rotation about the symmetrical (strong) axis and restrained
rotation about the weak axis, so K (effective length factor) for weak-axis flexural buckling was
0.5. There was a 1-in. gap between LL3.5x3.5 angles and a 1.5-in. gap between LL3x3 and
LL1.75x1.75 angles. Spacers were spaced so as to prevent the flexural failure of a single angle
prior to the flexural buckling capacity of the member as a whole. Single angle K is taken as 1.

- 12 -
Table 1.5 – Double Angle Test Variables
Test No. SizeNo. of
Spacers MaterialLength
(in.) Q l/rD-A1 LL3.5x3.5x3/8 2 80 ksi 30 0.97 28
D-A2 LL3.5x3.5x3/8 2 80 ksi 48 0.97 45
D-A3 LL3.5x3.5x3/8 2 80 ksi 66 0.97 61
D-A4 LL3.5x3.5x3/8 2 80 ksi 84 0.97 78
D-A5 LL3.5x3.5x3/8 2 50 ksi 48 1.00 45
D-B1 LL3x3x3/16 2 80 ksi 24 0.70 26
D-B2 LL3x3x3/16 2 80 ksi 48 0.70 51
D-B3 LL3x3x3/16 2 80 ksi 72 0.70 77
D-B4 LL3x3x3/16 2 80 ksi 96 0.70 102
D-B5 LL3x3x3/16 2 50 ksi 48 0.83 51
D-C1 LL1.75x1.75x1/8 3 80 ksi 24 0.78 44
D-C2 LL1.75x1.75x1/8 3 80 ksi 33 0.78 60
D-C3 LL1.75x1.75x1/8 3 80 ksi 42 0.78 77
D-C4 LL1.75x1.75x1/8 3 80 ksi 51 0.78 94
D-C5 LL1.75x1.75x1/8 3 50 ksi 24 0.90 44
1.3.3 Subassembly Tests Performed at Lehigh University
The second phase of the experimental program was a series of seven subassembly tests
performed at the ATLSS laboratory at Lehigh University and the results of these tests are given
in the same report as the single- and double-angle compression tests.
Lehigh performed two different types of tests: the constant-moment test shown schematically in
Figure 1.1 and the moment-gradient test shown in Figure 1.2. SGH designed the
constant-moment tests to evaluate the performance of the high-strength trusses near the mid-
span, where the moment is high and the shear is low. The test set-up loads the specimens in
pure moment, so the web members have no forces other than the bracing forces required to
prevent the chord members from buckling in-plane.
Figure 1.1: Girder Subassembly – Constant Moment Test
2’-0” 6’-0” 6’-0”
3’-8” (out-to-out)
H2
H1
Compression Chord Out-of-PlaneBracing Location (Typ.)
2’-0”
Top Chord
Bottom Chord

- 13 -
The objective of the constant-moment tests was to evaluate the buckling behavior of the
compression chord. In the SJI design procedure, K is taken as 1 for both in-plane and
out-of-plane buckling. However, the web members and connections to the supported joists (in
the case of truss girders) or steel deck (in the case of joists) likely provide enough restraint to
allow a lower value of K to be used. These tests and follow-up analytical studies should help
assess what K-Factors may be appropriate.
We designed the two moment-gradient tests shown schematically in Figure 1.2 to represent the
combined shear and moment that might be experienced by a normally loaded truss. The tests
attempted to capture the effect of web member weld eccentricity on the strength of the
compression web members and the strength of web member end connections.
1.3.4 Tests on Complete-Truss Specimens Performed at CanAm
The purpose of the complete-truss tests was to extend the findings of the component and
subassembly tests to complete trusses fabricated using HSLA-V steel and is the subject of this
report. The component and subassembly test results indicated that the strength of HSLA-V
steel members can be conservatively predicted using AISC equations that were developed for
lower-strength steels. The Steel Joist Institute (SJI) specification uses a modified AISC design
approach that neglects the flexural-torsional buckling mode for double-angle members. The
results of the component and subassembly tests suggested that the SJI approach is acceptable
for HSLA-V steel. One goal of the complete-truss tests was to determine whether the SJI
design approach is appropriate for HSLA-V members. If so, SJI producers would be able to
design products using HSLA-V steel without major revisions to the SJI specifications. The other
goals of the complete-truss tests are discussed in Section 3 of this report.
Figure 1.2: Joist Subassembly – Moment-Gradient Test (Web Controls)
3’-8” (out-to-out)
2’-0” 6’-0” 6’-0” 2’-0”
C1C2
V1V2
- 14 -
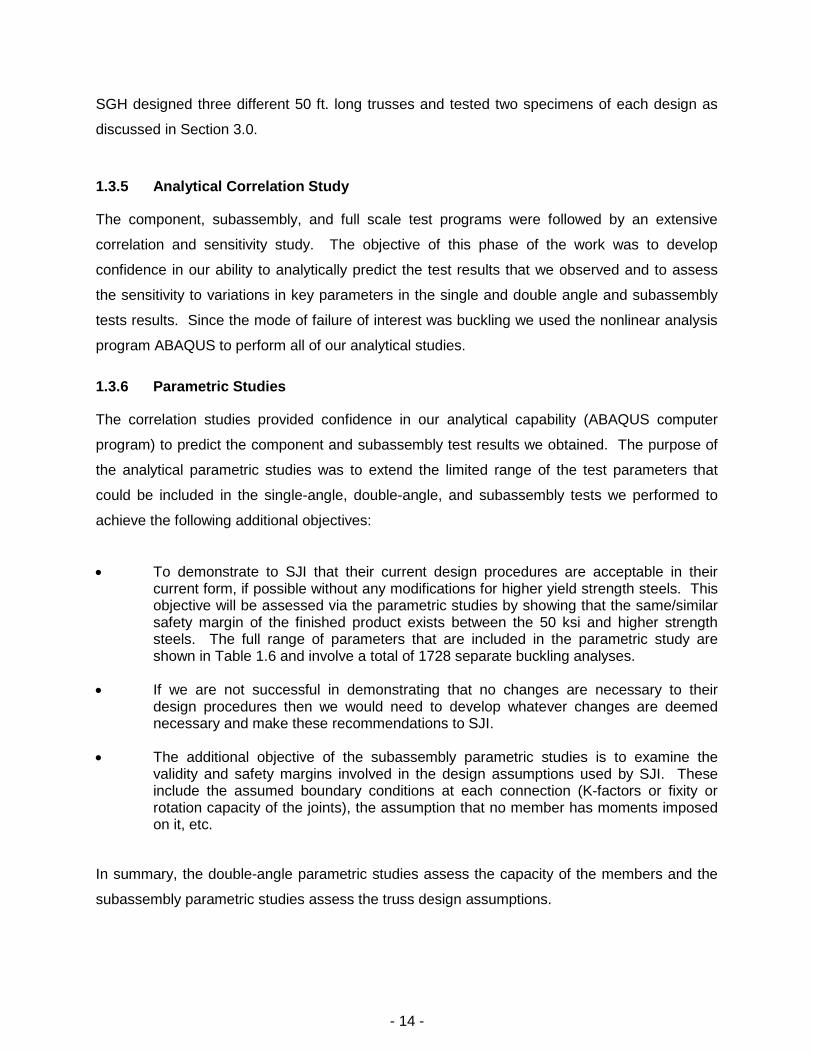
SGH designed three different 50 ft. long trusses and tested two specimens of each design as
discussed in Section 3.0.
1.3.5 Analytical Correlation Study
The component, subassembly, and full scale test programs were followed by an extensive
correlation and sensitivity study. The objective of this phase of the work was to develop
confidence in our ability to analytically predict the test results that we observed and to assess
the sensitivity to variations in key parameters in the single and double angle and subassembly
tests results. Since the mode of failure of interest was buckling we used the nonlinear analysis
program ABAQUS to perform all of our analytical studies.
1.3.6 Parametric Studies
The correlation studies provided confidence in our analytical capability (ABAQUS computer
program) to predict the component and subassembly test results we obtained. The purpose of
the analytical parametric studies was to extend the limited range of the test parameters that
could be included in the single-angle, double-angle, and subassembly tests we performed to
achieve the following additional objectives:
To demonstrate to SJI that their current design procedures are acceptable in theircurrent form, if possible without any modifications for higher yield strength steels. Thisobjective will be assessed via the parametric studies by showing that the same/similarsafety margin of the finished product exists between the 50 ksi and higher strengthsteels. The full range of parameters that are included in the parametric study areshown in Table 1.6 and involve a total of 1728 separate buckling analyses.
If we are not successful in demonstrating that no changes are necessary to theirdesign procedures then we would need to develop whatever changes are deemednecessary and make these recommendations to SJI.
The additional objective of the subassembly parametric studies is to examine thevalidity and safety margins involved in the design assumptions used by SJI. Theseinclude the assumed boundary conditions at each connection (K-factors or fixity orrotation capacity of the joints), the assumption that no member has moments imposedon it, etc.
In summary, the double-angle parametric studies assess the capacity of the members and the
subassembly parametric studies assess the truss design assumptions.

- 15 -
Table 1.6 – Range of Variables in the Parametric Study
SIZE l/rFy
(ksi)
t (in)Spacer
sImperfectionMagnitude
BucklingAxis
ResidualStress
Total CasesQ=1 Q=0.85 Q=0.7
2L8x8 20, 40, 80,160
506580
3/47/8
15/16
1/29/165/8
---
1, 2 bars L/500, L/1500 Strong,Weak
no 4x3x2x2x2x2=
144
2L6x6 20, 40, 60,80, 100,
160
506580
9/1611/16
3/4
3/87/161/2
---
1, 2 bars L/500, L/1500 Strong,Weak
no 6x3x2x2x2x2=
288
2L4x4 50, 70, 90,110, 130,
260
506580
3/87/16
15/32
1/49/325/16
3/167/321/4
1, 2angle
L/500, L/1500 Strong,Weak
no 6x3x3x2x2x2=
432
2L2x2 50, 70, 90,130, 150,
240
506580
3/167/321/4
1/85/325/32
3/321/81/8
1, 2angle
L/500, L/1500 Strong,Weak
0, 11ksi 6x3x3x2x2x2 x2=
864

- 16 -
2. SUMMARY OF COMPONENT AND SUBASSEMBLY TEST RESULTS
As discussed in Section 1.3, our partners at Lehigh University conducted the component tests of
single and double angles and the subassembly tests. In the component test program, we tested
in compression six single-angle members, nineteen double-angle members, and seven crimped
single-angle members. In the subassembly test program, we tested seven truss subassemblies
constructed using double-angle chords and web members. Each subassembly represented four
panels of a complete truss, with tension and compression chords and diagonal web members.
The component and subassembly test findings are summarized as follows:
The tensile coupon tests showed variability in the yield stress values for different cross-section sizes. The average yield stress values ranged from 71.0 ksi for the 4 x 4 x 1/2angles to 78.5 ksi for the 1.75x1.75x1/8 angles.
Both the single- and double-angle specimens in the component tests typically failed inflexural-torsional buckling with some influence from local plate bending or local platebuckling. The measured capacities of the specimens, however, were in closeragreement with the predicted flexural buckling capacity about the strong axis (i.e., they-axis) based on the 2005 Specification for Structural Steel Buildings (“AISCSpecification”).
The AISC Specification was significantly more conservative in predicting the strength ofsingle- and double-angle test specimens with smaller Q reduction factors (moreslender legs) than in predicting the strength of specimens with larger Q-values.
The experimental buckling capacities of the single-angle test specimens with crimpedends were less than the capacities predicted using the AISC Specification provisionsfor single angles without considering the reduced flexural stiffness and strength of thecrimped region. Simple application of the AISC Specification provisions for singleangles without considering the crimped ends is unconservative.
The buckling capacities predicted using the AISC Specification were equallyconservative for both the double-angle-component test specimens and the double-angle members in the truss subassemblies.

- 17 -
3. TEST PROGRAM
3.1 Purpose of Tests
The purpose of the complete truss tests is to extend the findings of the component and
subassembly tests to complete trusses fabricated using HSLA-V steel.
The component and subassembly test results indicated that the strength of HSLA-V steel
members can be conservatively predicted using AISC equations that were developed for lower-
strength steels. The 2005 Steel Joist Institute (SJI) Standard Specification for Longspan Steel
Joists, LH-Series and Deep Longspan Steel Joists, DLH-Series (“SJI Specification”), uses a
modified AISC design approach that neglects the flexural-torsional buckling mode for double-
angle members. The results of the component and subassembly tests suggested that the SJI
approach is acceptable for HSLA-V steel. One goal of the complete truss tests is to determine
whether the SJI design approach is appropriate for HSLA-V members. If so, SJI producers
would be able to design products using HSLA-V steel without major revisions to the SJI
Specification.
Other goals of the complete truss tests are to
determine whether we can predict failure location and mode based on AISC provisionswith SJI modifications,
determine how deflections obtained from truss analysis using standard analysisassumptions (e.g., pinned ends, no rigid end zones) compares to actual deflection,
estimate appropriate effective length factors (K) for truss members, and
evaluate the accuracy of the AISC combined force equations when applied to HSLA-Vsteel members.
3.2 Test Matrix
We designed three different trusses and tested two specimens of each design, as summarized
in Table 3.1. Specimen A is designed like a production truss, in which every member is
optimized. The most-likely failure location is either the compression chord end panel,
compression chord midspan, or end diagonal, all with combined stress ratios (CSRs) over 0.95.
Specimens B and C are designed to fail in a particular member, the compression chord end
panel and first compression diagonal, respectively. We designed these trusses so that, at
predicted capacity (combined stress ratio of critical member equals 1.0), no member but the
critical member has a combined stress ratio over approximately 0.75.

- 18 -
Table 3.1 – Test Matrix
Specimen Critical Member
Predicted Axial FailureForce in CriticalMember (kips)
Predicted TotalLoad on Trussat Failure (kips)
A
CompressionChord End Panel
30.729.6
End Diagonal(Tension)
34.0
BCompression
Chord End Panel27.6 22.2
CFirst Compression
Diagonal18.8 34.2
Figures 1 through 3 depict the geometry of each specimen and show member sizes on one-half
of the specimen and calculated combined stress ratios for each member on the other half (see
Section 3.3).
All the specimens are 32 in. deep from outer face of top chord to outer face of bottom chord and
50 ft-4 in. long from edge of seat to edge of seat. The design span is 50 ft-0 in.
3.3 Design of Test Specimens
We analyzed the test specimens using RISA-3D structural analysis software. The RISA-3D
analysis provided axial and bending forces in each member. Since the welded connections at
the ends of the web members effectively resist moment forces, we did not release the ends of
the web members (no pins) in the model. We used the software’s P-delta option to account for
second-order bending effects in the top chord. We applied a uniformly distributed load to the
truss compression chord.
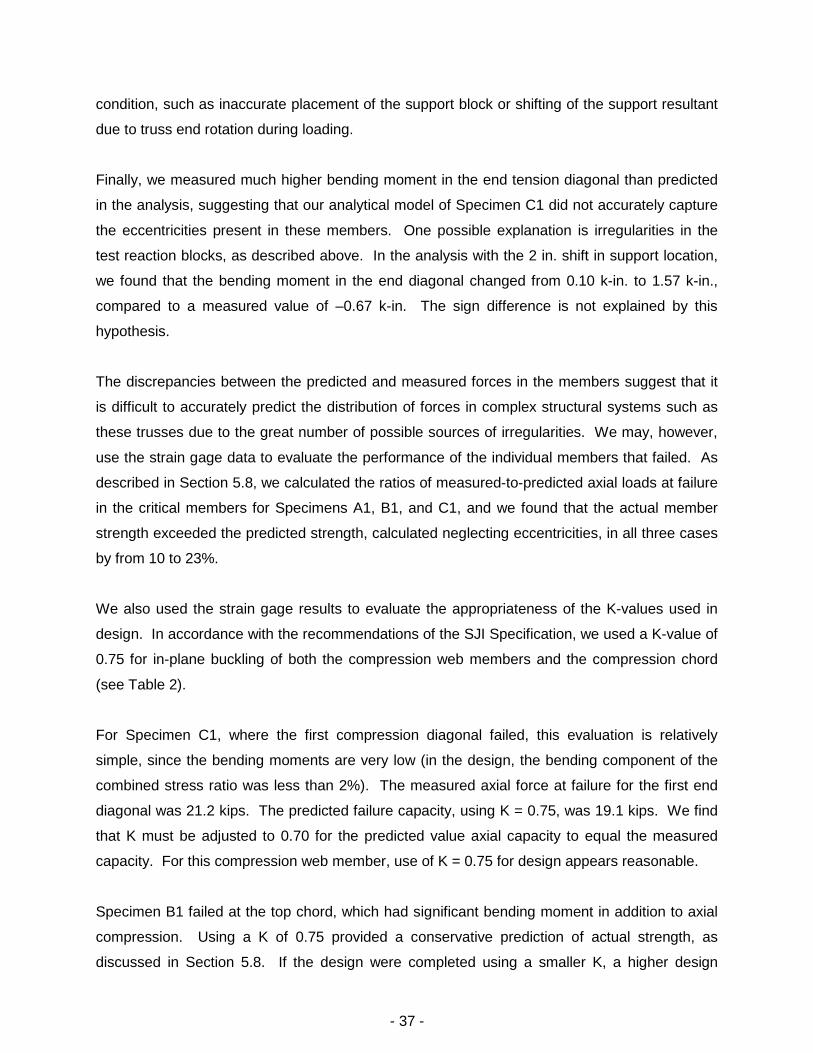
Top and bottom chords are equal-leg double-angle members. Web members are crimped
equal-leg single-angle members or equal-leg double-angle members, depending on design
forces (Photo 1). See Figure 4 for truss nomenclature.
We checked each member using a modified AISC LRFD code check procedure based on the
AISC Specification with no reduction (phi) factors.
3.3.1 K-Values and Bracing
When calculating compressive strength, we used K-values (effective length factors) for
members as a whole as specified in the SJI Specification. For member components, i.e., single
angles in double-angle members buckling about the z-axis between panel point and spacer, we

- 19 -
reduced the SJI K-value from 1.0 to 0.75. This reduction is justified by the results of the
component tests and the observed rigidity of the single-angle end conditions. We did not
observe this mode of failure in the component and subassembly tests, even though it
theoretically controlled using a K-value of 1.0. Furthermore, a K-value of 1.0 appears
excessively conservative due to member end restraint and the shorter actual buckling length
due to the welds at the ends of the members and the spacers.
Double-angle members were all constructed with a filler (spacer) at midlength (Photos 2 and 3),
so K-values are based on SJI Specification values for members with fillers or ties. Table 3.2
summarizes the K-values used for each compression member of the truss.
Table 3.2 – K-Values
Member In Plane of TrussOut of Plane of
Truss
Componentbetween Spacersand Panel Points
CompressionChord InteriorPanel
0.75 1.0 0.75*
CompressionChord End Panel
1.0 1.0 0.75*
Compression WebMembers
0.75 1.0 0.75*
* Modified from SJI values.
We designed the compression chord assuming that it is braced out of the plane of the truss
every 12 in., since steel deck is normally fastened to the top chord at this spacing. The
compression chord critical buckling mode is therefore in the truss in-plane direction. We
designed the web-compression members using a buckling length equal to the member length
for buckling in both the in-plane and out-of-plane directions.
3.3.2 AISC Specification Design Equations
Chapter E of the AISC Specification requires designers to check double-angle compression
members for flexural buckling and flexural-torsional buckling. For the flexural buckling mode,
the elastic critical buckling stress is
2
2
r
KL
EFe
(AISC E3-4)
where
E = the elastic modulus, taken as 29,000 ksi
K = the effective length factor per Table 2 of this report

- 20 -
L = the unbraced length
r = the radius of gyration
We calculated KL/r for both major axes and used the larger of the two results to calculate Fe.
For the flexural-torsional buckling mode, where y is the axis of symmetry:
2
411
2ezey
ezeyezeye
FF
HFF
H
FFF (AISC E4-5)
where
g
yxooo
A
IIyxr
222 (AISC E4-7)
2
22
1o
oo
r
yxH
(AISC E4-8)
2
2
y
y
ey
r
LK
EF
(AISC E4-10)
2og
ezrA
GJF (AISC E4-11)
xo, yo = coordinates of shear center with respect to the centroid, in.
Ix, Iy = moment of inertia about the principal axes, in.4
Ag = gross area of member, in.2
G = shear modulus of elasticity = 11,200 ksi
J = torsional constant, in.4
Note that AISC Equation E4-11 has been simplified in accordance with AISC recommendations.
For double angles, AISC permits Cw to be taken as 0.
The x-axis is the horizontal axis (bending about the x-axis is in the plane of the truss), and the
y-axis is the vertical axis (bending about the y-axis is out of the plane of the truss, or about the
axis of symmetry of the double angle).
In the component and subassembly tests, the AISC Specification typically predicted that the
specimens would fail in the flexural-torsional buckling mode, but the measured strengths and
observed failure mode were more consistent with the flexural buckling mode. We therefore
- 21 -
neglected the flexural-torsional buckling mode in designing the members. Our approach is
consistent with the SJI Specification, which does not require checking for flexural-torsional
buckling.
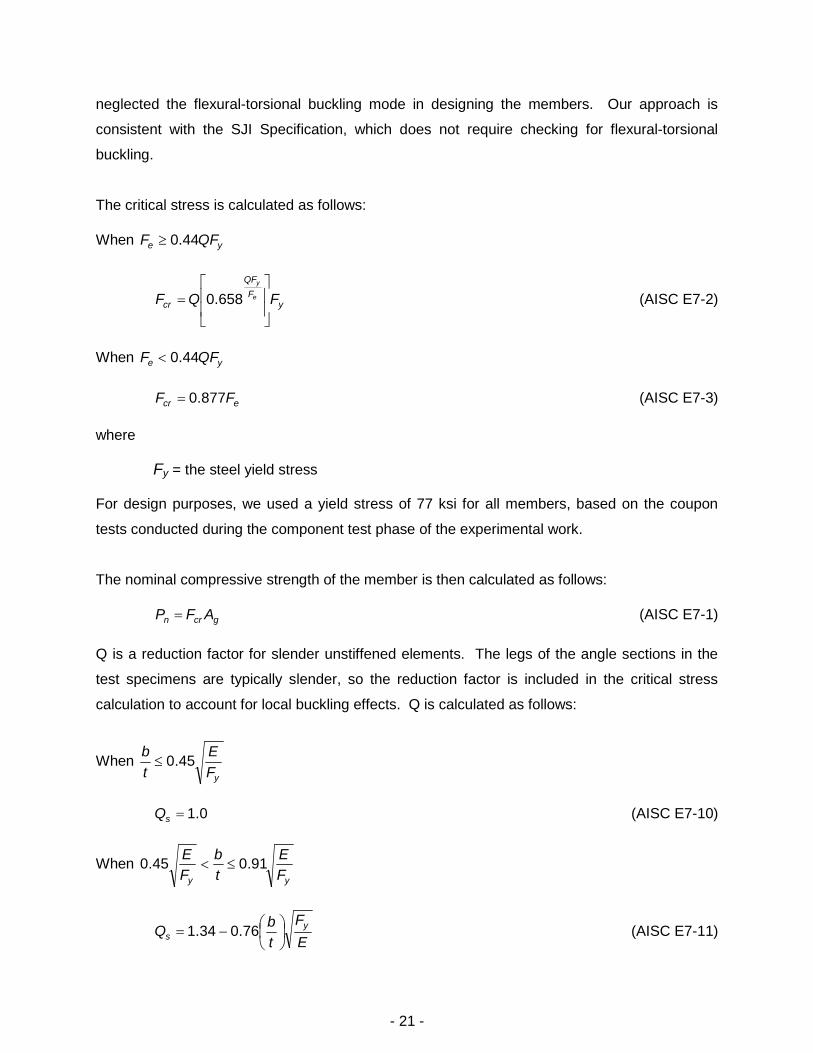
The critical stress is calculated as follows:
When ye QFF 44.0
yF
QF
cr FQF e
y
658.0 (AISC E7-2)
When ye QFF 44.0
ecr FF 877.0 (AISC E7-3)
where
Fy = the steel yield stress
For design purposes, we used a yield stress of 77 ksi for all members, based on the coupon
tests conducted during the component test phase of the experimental work.
The nominal compressive strength of the member is then calculated as follows:
gcrn AFP (AISC E7-1)
Q is a reduction factor for slender unstiffened elements. The legs of the angle sections in the
test specimens are typically slender, so the reduction factor is included in the critical stress
calculation to account for local buckling effects. Q is calculated as follows:
WhenyF
E
t
b45.0
0.1sQ (AISC E7-10)
Whenyy F
E
t
b
F
E91.045.0
E
F
t
bQ
ys
76.034.1 (AISC E7-11)
- 22 -
WhenyF
E
t
b91.0
2
53.0
t
bF
EQ
y
s (AISC E7-12)
where
b = the length of the angle leg
t = the thickness of the angle leg
We also used the AISC Specification to calculate the bending strength of the members for
bending in the plane of the truss. The AISC Specification requires checks on yielding and
lateral-torsional buckling. The yielding mode is calculated as follows:
pn MM (AISC E9-1)
where
yxyp MZFM 6.1 for stems in tension (AISC F9-2)
yp MM for stems in compression (AISC F9-3)
xyy SFM
Zx = the plastic section modulus
Sx = the elastic section modulus
The lateral-torsion buckling mode is calculated as follows:
21 BB
L
GJEIMM
b
y
crn
where
J
I
L
dB
y
b
3.2
Lb = distance between points where the compression chord is braced against lateraltranslation
B is positive when the stem is in tension and negative when the stem is in compression. Lb is
taken as 12 in. for the compression chord, as discussed above, and is taken as the full member
length for compression web members.

- 23 -
We calculated the tensile strength of members per Chapter D of the AISC Specification:
gyn AFP (AISC D2-1)
We combined bending and compression forces in accordance with Chapter H of the AISCSpecification:
For 2.0c
r
P
P:
0.19
8
cy
ry
cx
rx
c
r
M
M
M
M
P
P(AISC H1-1a)
For 2.0c
r
P
P:
0.19
8
2
cy
ry
cx
rx
c
r
M
M
M
M
P
P(AISC H1-1b)
where
Pr = required axial compressive strength from the RISA model
Pc = available axial compressive strength from equation AISC E7-1 (Pn)
Mrx = required flexural strength from the RISA model in the plane of the truss
Mcx = available flexural strength in the plane of the truss from equation AISC E9-1 (Mn)
Mry = 0 (theoretically there is no bending out of the plane of the truss)
3.4 Fabrication of Test Specimens
Canam Steel Corporation fabricated all six of the test specimens in its Washington, Missouri,
joist manufacturing facility using angle stock rolled by Roanoke Steel of Roanoke, Virginia. For
details regarding the mechanical and chemical properties of the steel, see ATLSS Report
No. 08-07, referenced in Section 2.
Canam used its standard joist manufacturing procedures and quality control to fabricate the
specimens. Canam used E90 weld material for all welding.
- 24 -
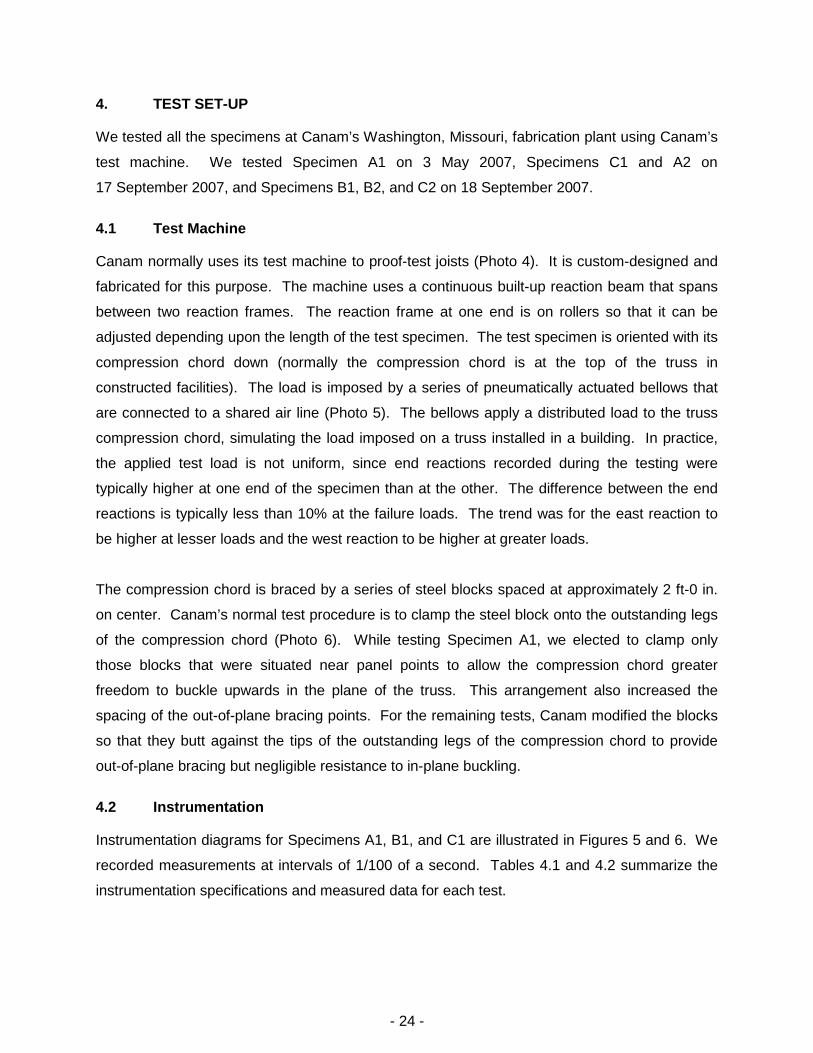
4. TEST SET-UP
We tested all the specimens at Canam’s Washington, Missouri, fabrication plant using Canam’s
test machine. We tested Specimen A1 on 3 May 2007, Specimens C1 and A2 on
17 September 2007, and Specimens B1, B2, and C2 on 18 September 2007.
4.1 Test Machine
Canam normally uses its test machine to proof-test joists (Photo 4). It is custom-designed and
fabricated for this purpose. The machine uses a continuous built-up reaction beam that spans
between two reaction frames. The reaction frame at one end is on rollers so that it can be
adjusted depending upon the length of the test specimen. The test specimen is oriented with its
compression chord down (normally the compression chord is at the top of the truss in
constructed facilities). The load is imposed by a series of pneumatically actuated bellows that
are connected to a shared air line (Photo 5). The bellows apply a distributed load to the truss
compression chord, simulating the load imposed on a truss installed in a building. In practice,
the applied test load is not uniform, since end reactions recorded during the testing were
typically higher at one end of the specimen than at the other. The difference between the end
reactions is typically less than 10% at the failure loads. The trend was for the east reaction to
be higher at lesser loads and the west reaction to be higher at greater loads.
The compression chord is braced by a series of steel blocks spaced at approximately 2 ft-0 in.
on center. Canam’s normal test procedure is to clamp the steel block onto the outstanding legs
of the compression chord (Photo 6). While testing Specimen A1, we elected to clamp only
those blocks that were situated near panel points to allow the compression chord greater
freedom to buckle upwards in the plane of the truss. This arrangement also increased the
spacing of the out-of-plane bracing points. For the remaining tests, Canam modified the blocks
so that they butt against the tips of the outstanding legs of the compression chord to provide
out-of-plane bracing but negligible resistance to in-plane buckling.
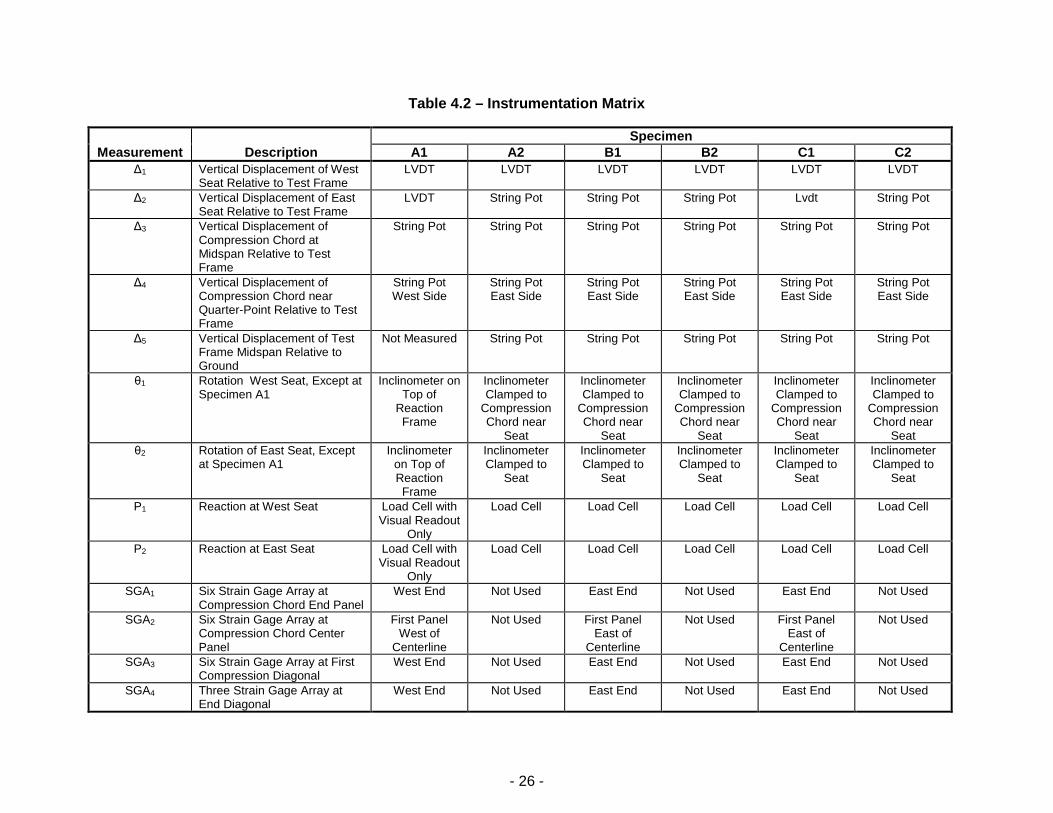
4.2 Instrumentation
Instrumentation diagrams for Specimens A1, B1, and C1 are illustrated in Figures 5 and 6. We
recorded measurements at intervals of 1/100 of a second. Tables 4.1 and 4.2 summarize the
instrumentation specifications and measured data for each test.

- 25 -
Table 4.1 – Instrumentation Specifications
Type Manufacturer Part Number Capacity
LVDT Macro Sensors GHSD-750 ± 0.25 in.Load Cell(Tests B and C)
TransducerTechniques
SWO-50K 50 kips
Inclinometer AppliedGeomechanics
801 Tuff Tilt Uniaxial Tiltmeter ± 3°
String Pot Patriot/MagneTek Rayelco Linear MotionTransducer
± 25 in. and ± 10 in.
Data Logger Campbell Scientific CR9000 16 bit, high speed with analogand digital filtering
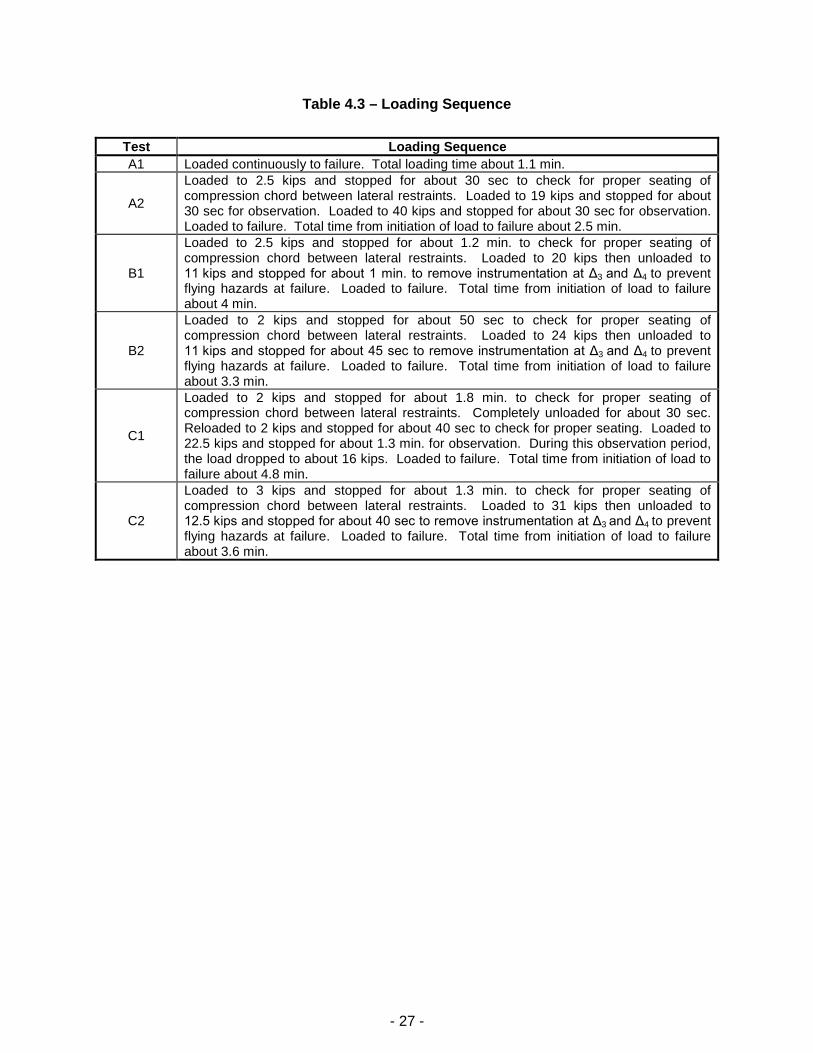
4.3 Test Sequence
The test machine provided little control over loading rate; the switch was either on or off.
Loading rates were most rapid at low loads, and slowed at higher loads. At low loads (under
15 kips), the loading rates were typically about 0.8 kips per second, while at high loads (over
25 kips) the loading rates were typically about 0.5 kips per second. The load increased in
stepped fashion, apparently in unison with the action of the compressor delivering air to the
system. When loading stopped, leakage in the pneumatic system caused the applied load to
slowly decrease. Table 4.3 summarizes the loading sequence for each test. See Appendix A
for plots showing the rates of loading during the test.
- 26 -
Table 4.2 – Instrumentation Matrix
Measurement DescriptionSpecimen
A1 A2 B1 B2 C1 C2Δ1 Vertical Displacement of West
Seat Relative to Test FrameLVDT LVDT LVDT LVDT LVDT LVDT
Δ2 Vertical Displacement of EastSeat Relative to Test Frame
LVDT String Pot String Pot String Pot Lvdt String Pot
Δ3 Vertical Displacement ofCompression Chord atMidspan Relative to TestFrame
String Pot String Pot String Pot String Pot String Pot String Pot
Δ4 Vertical Displacement ofCompression Chord nearQuarter-Point Relative to TestFrame
String PotWest Side
String PotEast Side
String PotEast Side
String PotEast Side
String PotEast Side
String PotEast Side
Δ5 Vertical Displacement of TestFrame Midspan Relative toGround
Not Measured String Pot String Pot String Pot String Pot String Pot
θ1 Rotation West Seat, Except atSpecimen A1
Inclinometer onTop of
ReactionFrame
InclinometerClamped to
CompressionChord near
Seat
InclinometerClamped to
CompressionChord near
Seat
InclinometerClamped to
CompressionChord near
Seat
InclinometerClamped to
CompressionChord near
Seat
InclinometerClamped to
CompressionChord near
Seatθ2 Rotation of East Seat, Except
at Specimen A1Inclinometer
on Top ofReactionFrame
InclinometerClamped to
Seat
InclinometerClamped to
Seat
InclinometerClamped to
Seat
InclinometerClamped to
Seat
InclinometerClamped to
Seat
P1 Reaction at West Seat Load Cell withVisual Readout
Only
Load Cell Load Cell Load Cell Load Cell Load Cell
P2 Reaction at East Seat Load Cell withVisual Readout
Only
Load Cell Load Cell Load Cell Load Cell Load Cell
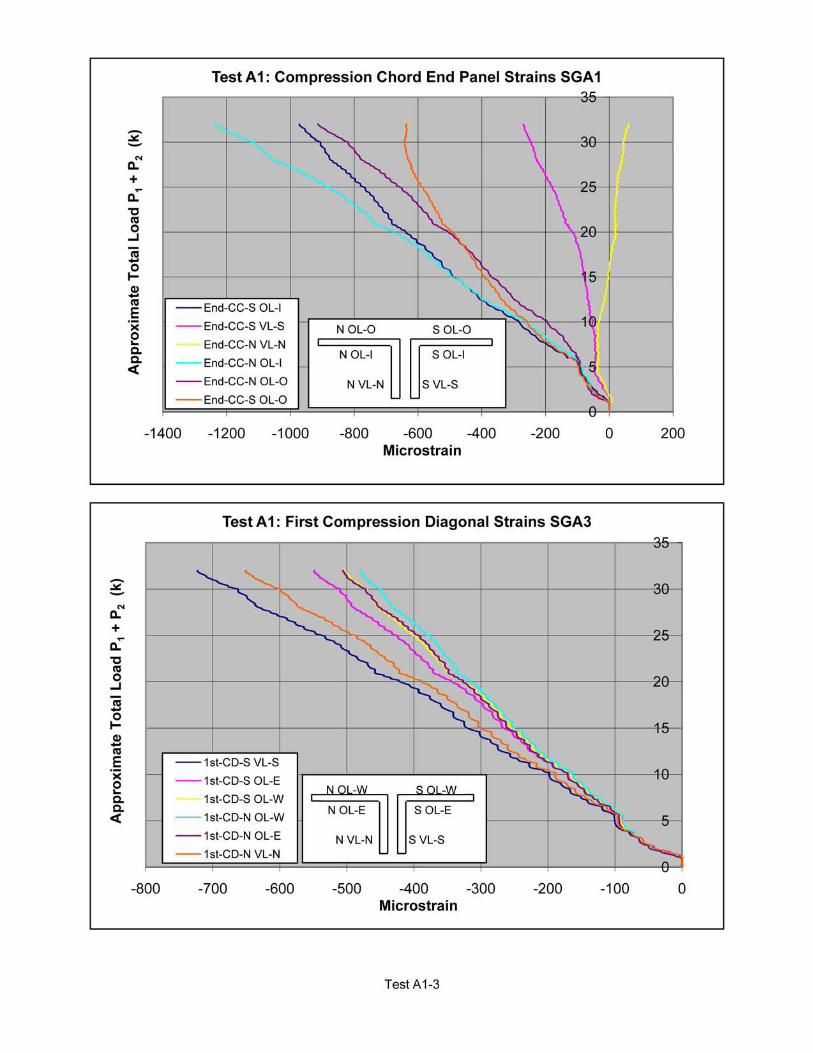
SGA1 Six Strain Gage Array atCompression Chord End Panel
West End Not Used East End Not Used East End Not Used
SGA2 Six Strain Gage Array atCompression Chord CenterPanel
First PanelWest of
Centerline
Not Used First PanelEast of
Centerline
Not Used First PanelEast of
Centerline
Not Used
SGA3 Six Strain Gage Array at FirstCompression Diagonal
West End Not Used East End Not Used East End Not Used
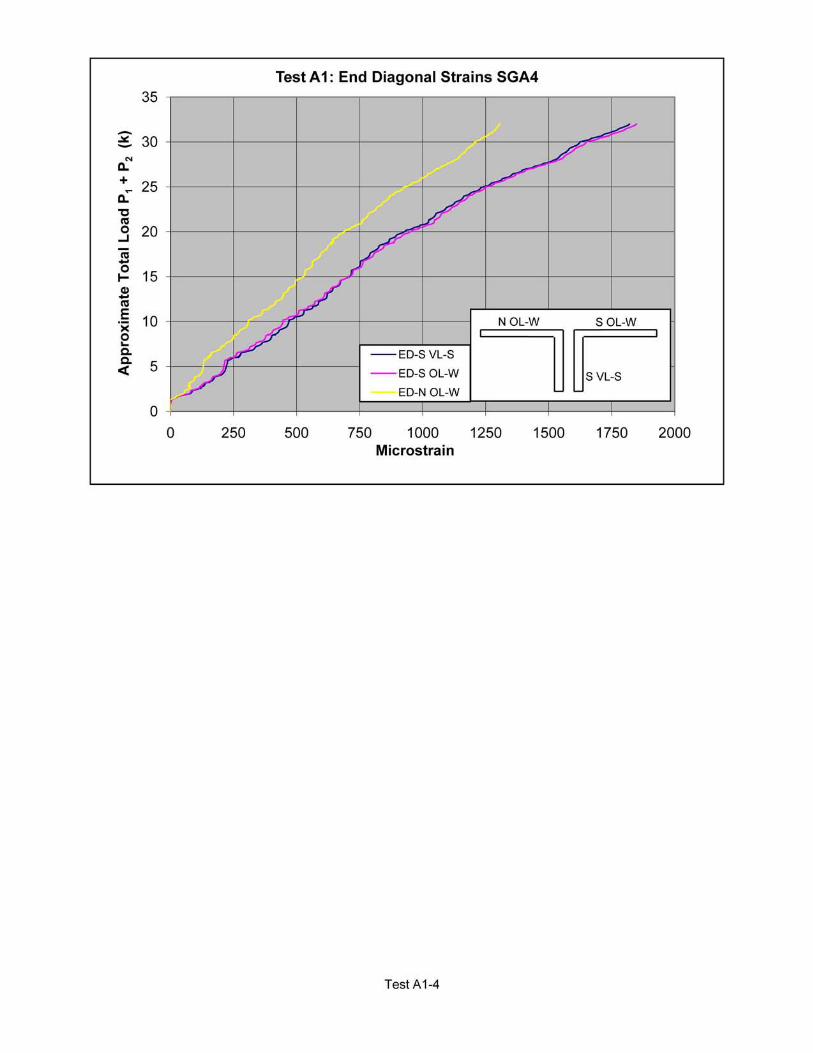
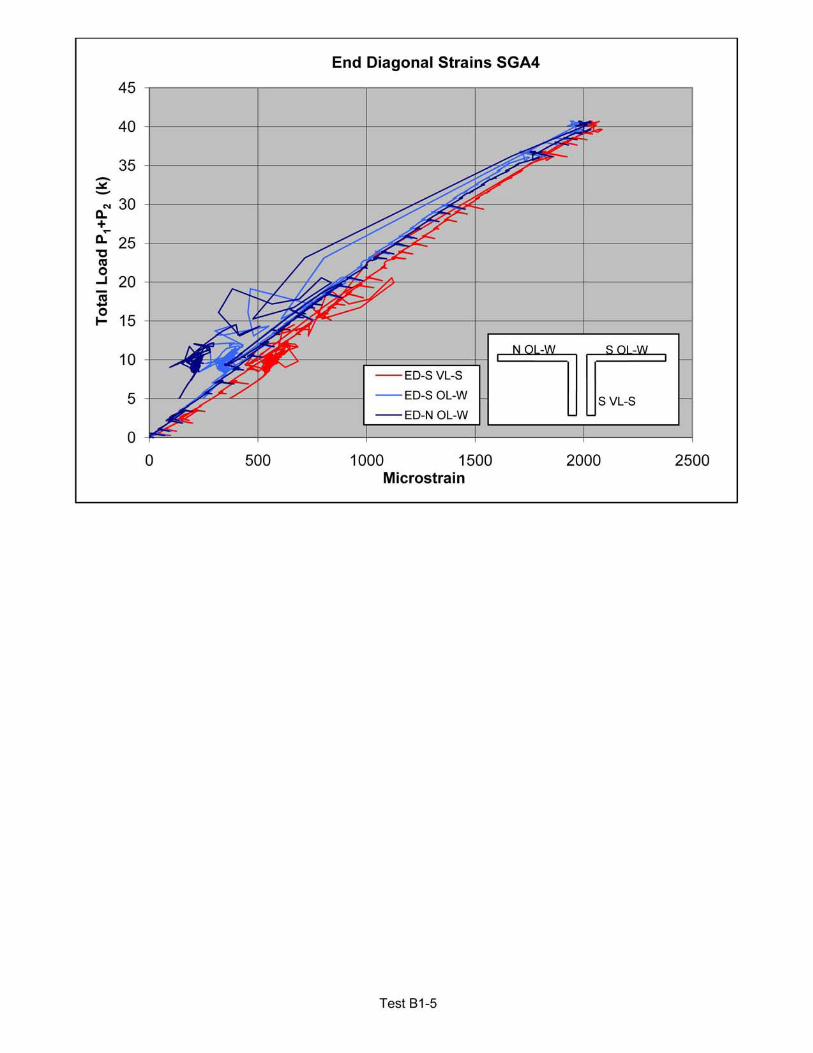
SGA4 Three Strain Gage Array atEnd Diagonal
West End Not Used East End Not Used East End Not Used
- 27 -
Table 4.3 – Loading Sequence
Test Loading Sequence
A1 Loaded continuously to failure. Total loading time about 1.1 min.
A2
Loaded to 2.5 kips and stopped for about 30 sec to check for proper seating ofcompression chord between lateral restraints. Loaded to 19 kips and stopped for about30 sec for observation. Loaded to 40 kips and stopped for about 30 sec for observation.Loaded to failure. Total time from initiation of load to failure about 2.5 min.
B1
Loaded to 2.5 kips and stopped for about 1.2 min. to check for proper seating ofcompression chord between lateral restraints. Loaded to 20 kips then unloaded to11 kips and stopped for about 1 min. to remove instrumentation at Δ3 and Δ4 to preventflying hazards at failure. Loaded to failure. Total time from initiation of load to failureabout 4 min.
B2
Loaded to 2 kips and stopped for about 50 sec to check for proper seating ofcompression chord between lateral restraints. Loaded to 24 kips then unloaded to11 kips and stopped for about 45 sec to remove instrumentation at Δ3 and Δ4 to preventflying hazards at failure. Loaded to failure. Total time from initiation of load to failureabout 3.3 min.
C1
Loaded to 2 kips and stopped for about 1.8 min. to check for proper seating ofcompression chord between lateral restraints. Completely unloaded for about 30 sec.Reloaded to 2 kips and stopped for about 40 sec to check for proper seating. Loaded to22.5 kips and stopped for about 1.3 min. for observation. During this observation period,the load dropped to about 16 kips. Loaded to failure. Total time from initiation of load tofailure about 4.8 min.
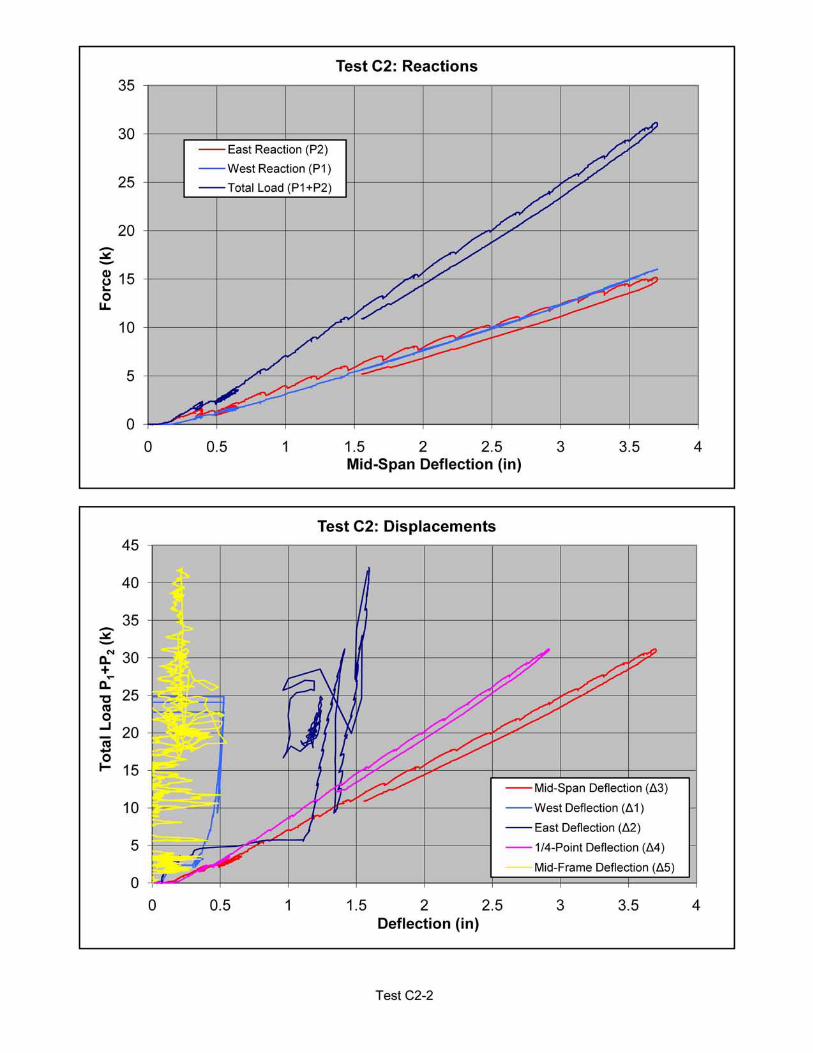
C2
Loaded to 3 kips and stopped for about 1.3 min. to check for proper seating ofcompression chord between lateral restraints. Loaded to 31 kips then unloaded to12.5 kips and stopped for about 40 sec to remove instrumentation at Δ3 and Δ4 to preventflying hazards at failure. Loaded to failure. Total time from initiation of load to failureabout 3.6 min.

- 28 -
5. TEST RESULTS
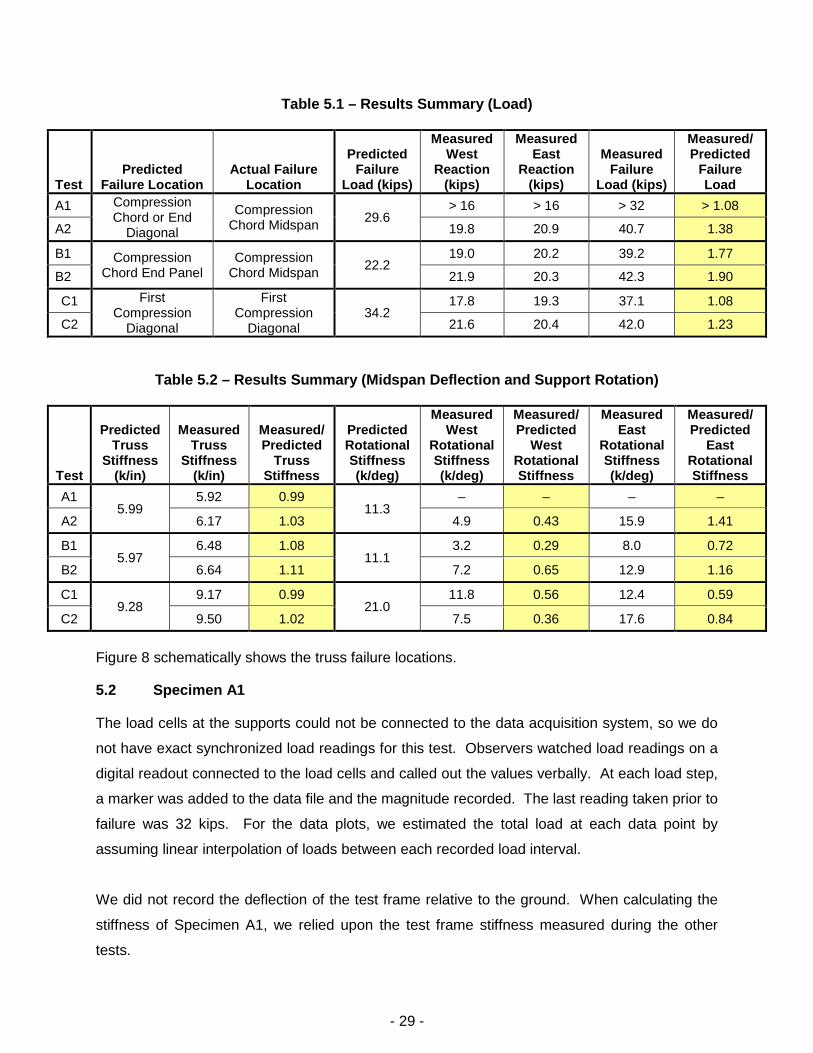
5.1 Results Summary
Appendix A includes complete graphs of measured test data. Table 5.1 provides an overview of
the test results. In Tests B1 and C1, the load spiked suddenly at failure, so we reported the
load just prior to the spike. The reported loads are the sum of the end reactions. The predicted
failure loads are based upon our analyses as described in Section 3.3.
Measured truss stiffness is determined using the midpoint deflection of the truss relative to the
test frame less the deflection at the midpoint of the test frame relative to the ground and less the
average deflection at the supports (Figure 7), algebraically expressed:
221
53t (6-1)
where
Δt = vertical displacement of truss midspan relative to truss supports Δ1 = vertical displacement of west seat relative to test frame Δ2 = vertical displacement of east seat relative to test frame Δ3 = vertical displacement of compression chord at midspan relative to test frame Δ5 = vertical displacement of test frame midspan relative to ground
To determine the effect of support flexibility on the deflection of the truss, we calculated an
average deflection based on the stiffness of the supports over a linear portion of the force-
deflection curve, once the initial seating had occurred. For example, for Specimen A2 we
looked at the increase in displacement at each support between applied loads of 20 and
25 kips. In this range, kwest = 263 k/in., keast = 74 k/in., and kaverage = 115 k/in., where kaverage is
calculated as follows:
eastwest
average
kk
k11
2(6-2)
Predicted and measured truss vertical and end rotational stiffnesses are summarized in
Table 5.2 below. The predicted stiffnesses are based upon our analyses as described in
Section 3.3. We repeated the analysis with the ends of the web members pinned (free to
rotate), a common design assumption, and found that the calculated truss vertical stiffnesses
did not change significantly.
- 29 -
Table 5.1 – Results Summary (Load)
TestPredicted
Failure LocationActual Failure
Location
PredictedFailure
Load (kips)
MeasuredWest
Reaction(kips)
MeasuredEast
Reaction(kips)
MeasuredFailure
Load (kips)
Measured/Predicted
FailureLoad
A1 CompressionChord or End
Diagonal
CompressionChord Midspan
29.6> 16 > 16 > 32 > 1.08
A2 19.8 20.9 40.7 1.38
B1 CompressionChord End Panel
CompressionChord Midspan
22.219.0 20.2 39.2 1.77
B2 21.9 20.3 42.3 1.90
C1 FirstCompression
Diagonal
FirstCompression
Diagonal34.2
17.8 19.3 37.1 1.08
C2 21.6 20.4 42.0 1.23
Table 5.2 – Results Summary (Midspan Deflection and Support Rotation)
Test
PredictedTruss
Stiffness(k/in)
MeasuredTruss
Stiffness(k/in)
Measured/Predicted
TrussStiffness
PredictedRotationalStiffness(k/deg)
MeasuredWest
RotationalStiffness(k/deg)
Measured/Predicted
WestRotationalStiffness
MeasuredEast
RotationalStiffness(k/deg)
Measured/Predicted
EastRotationalStiffness
A15.99
5.92 0.9911.3
– – – –
A2 6.17 1.03 4.9 0.43 15.9 1.41
B15.97
6.48 1.0811.1
3.2 0.29 8.0 0.72
B2 6.64 1.11 7.2 0.65 12.9 1.16
C19.28
9.17 0.9921.0
11.8 0.56 12.4 0.59
C2 9.50 1.02 7.5 0.36 17.6 0.84
Figure 8 schematically shows the truss failure locations.
5.2 Specimen A1
The load cells at the supports could not be connected to the data acquisition system, so we do
not have exact synchronized load readings for this test. Observers watched load readings on a
digital readout connected to the load cells and called out the values verbally. At each load step,
a marker was added to the data file and the magnitude recorded. The last reading taken prior to
failure was 32 kips. For the data plots, we estimated the total load at each data point by
assuming linear interpolation of loads between each recorded load interval.
We did not record the deflection of the test frame relative to the ground. When calculating the
stiffness of Specimen A1, we relied upon the test frame stiffness measured during the other
tests.

- 30 -
Specimen A1 was not effectively restrained out of the plane of the truss. The compression
chord buckled out of plane in the second panel west of the truss centerline (Photo 7).
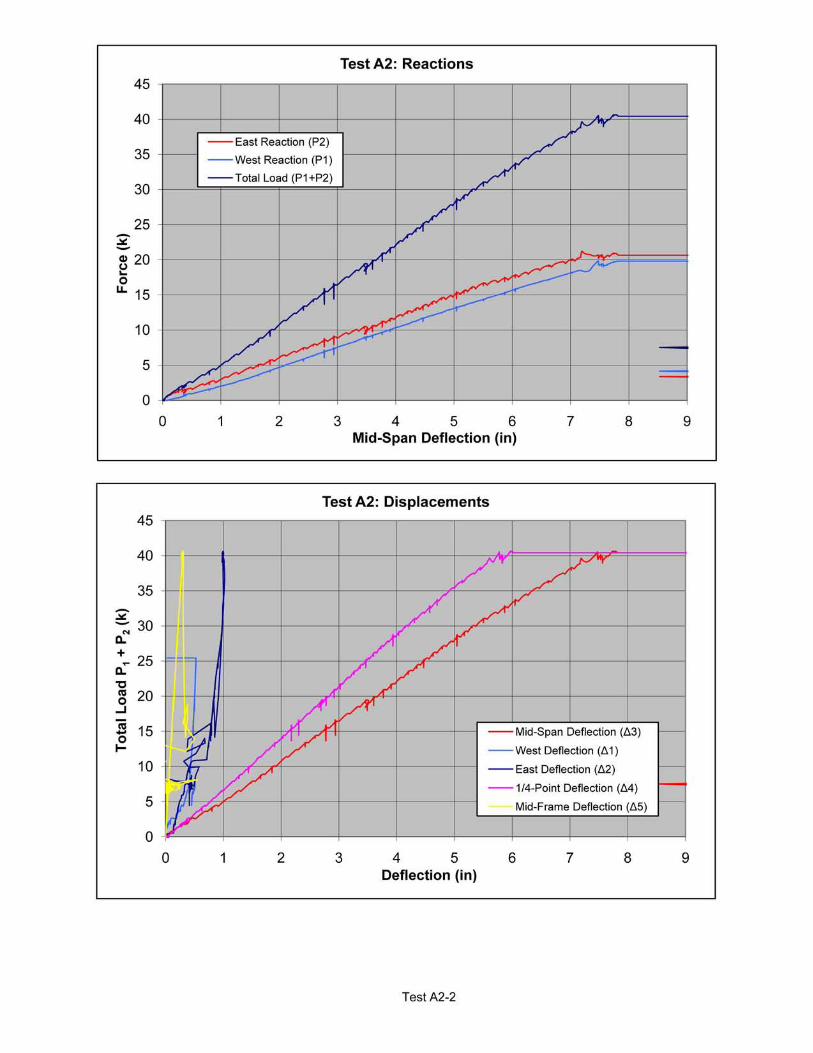
5.3 Specimen A2
Specimen A2 failed when the compression chord buckled in the plane of the truss at the second
panel east of the truss centerline (Photo 8). Three hinges developed in the chord. Since the
east hinge occurred on the far side of the panel point where two web diagonals intersect the
compression chord, hinges also developed in these diagonals at the ends of the crimped
sections.
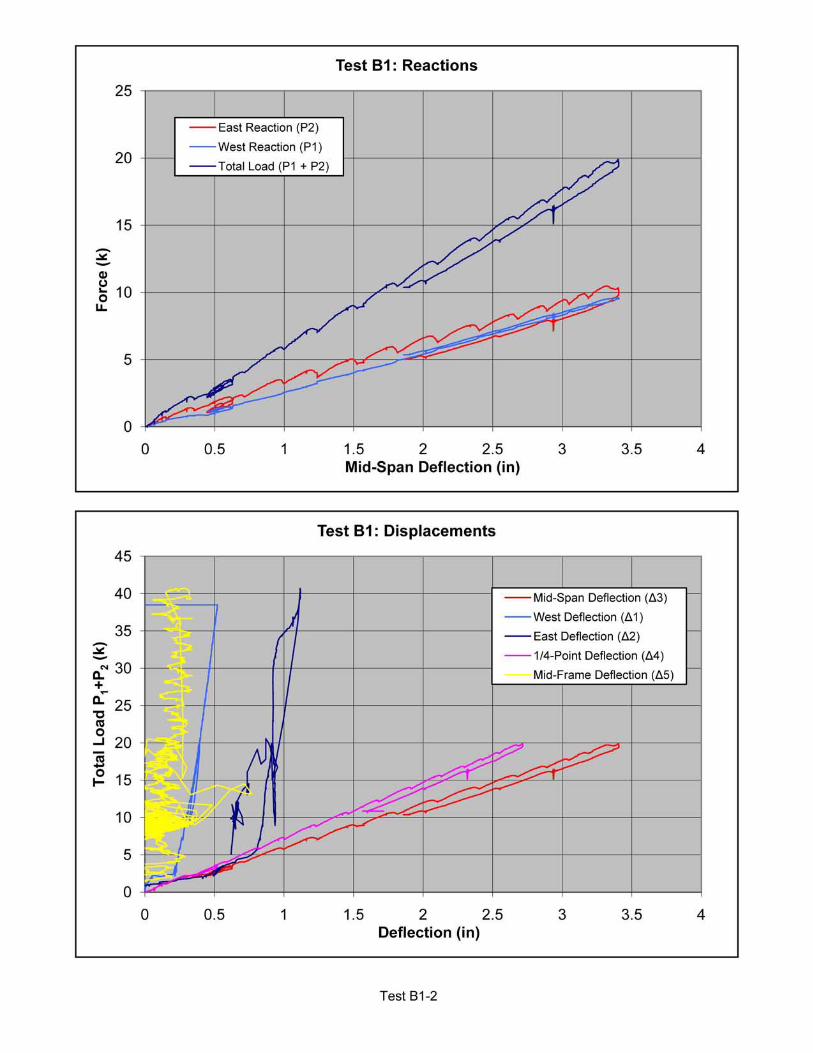
5.4 Specimen B1
Specimens B1 and B2 were designed to fail at the end panel of the compression chord.
Specimen B1 instead failed when the compression chord buckled in the plane of the truss at the
second panel east of the truss centerline (Photo 9), the same location where Specimen A2
failed. As in Specimen A2, the east hinge is past the panel point, resulting in the formation of
plastic hinges in the web diagonals.
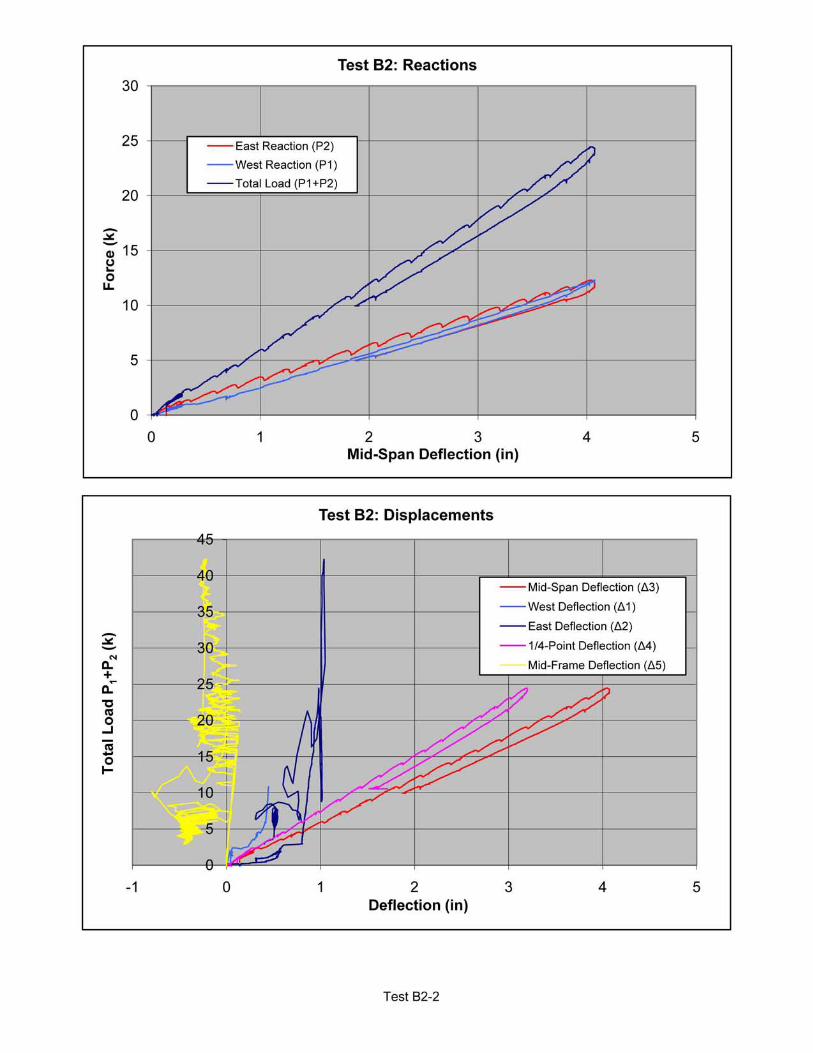
5.5 Specimen B2
Specimen B2 failed in the same location as Specimen B1 (Photo 10). The plastic hinges,
however, formed in different locations. The east hinge formed on the west side of the panel
point where the two web diagonals intersect the compression chord, while the west hinge
occurred on the west side of the panel point formed by the intersection of the web vertical and
the compression chord. Therefore, a hinge developed in the web vertical rather than the pair of
web diagonals.
5.6 Specimen C1
Specimens C1 and C2 were designed to fail at the first compression diagonal. Specimen C1
failed at the expected location (Photo 11) on the east end of the truss. The first compression
diagonal buckled out of the plane of the truss. The compression chord bracing member east of
the first compression diagonal also buckled. Plastic hinges developed in the tension chord at
the first panel point to the west and at both ends of the end diagonal.
5.7 Specimen C2
Specimen C2 failed in the same manner as Specimen C1 (Photo 12).

- 31 -
5.8 Strain Gage Analysis
We performed an analysis of the strain gage readings to determine how closely the measured
stresses in the instrumented members matched the stresses predicted by the computer
analysis.
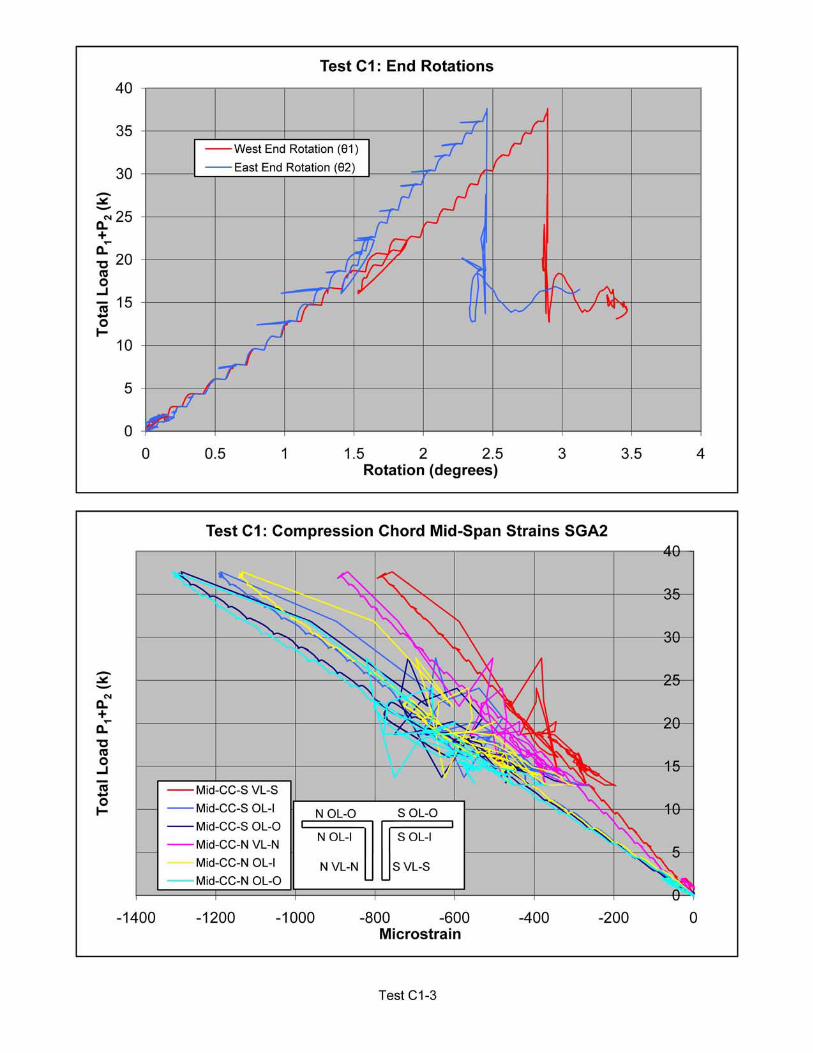
5.8.1 Specimen C1
Our design computer model for the test specimens did not account for the joint or weld
eccentricities at the ends of the web members, in keeping with standard design practice. For
the purpose of evaluating the measured strains, these eccentricities are important to include,
since they increase the bending moments on the web members significantly. We revised our
computer model of Specimen C1 to account for both the joint eccentricities and the weld
eccentricities. We evaluated the strain gage data at two test steps, one at about 40% of the
failure load and one just before failure. We applied a linearly varying distributed load to the
modeled truss, scaled to match the measured unequal end reactions at these two test steps.
We used the strain gage data to calculate the axial force and moment in the member, and
compared these measured forces to the predicted forces using the computer model. The
results are summarized in Table 5.3 below:
Table 5.3 – Specimen C1 Measured vs. Predicted Member Forces
40% of Failure Failure
AnalysisValue
MeasuredValue
Measured/Analysis
AnalysisValue
MeasuredValue
Measured/Analysis
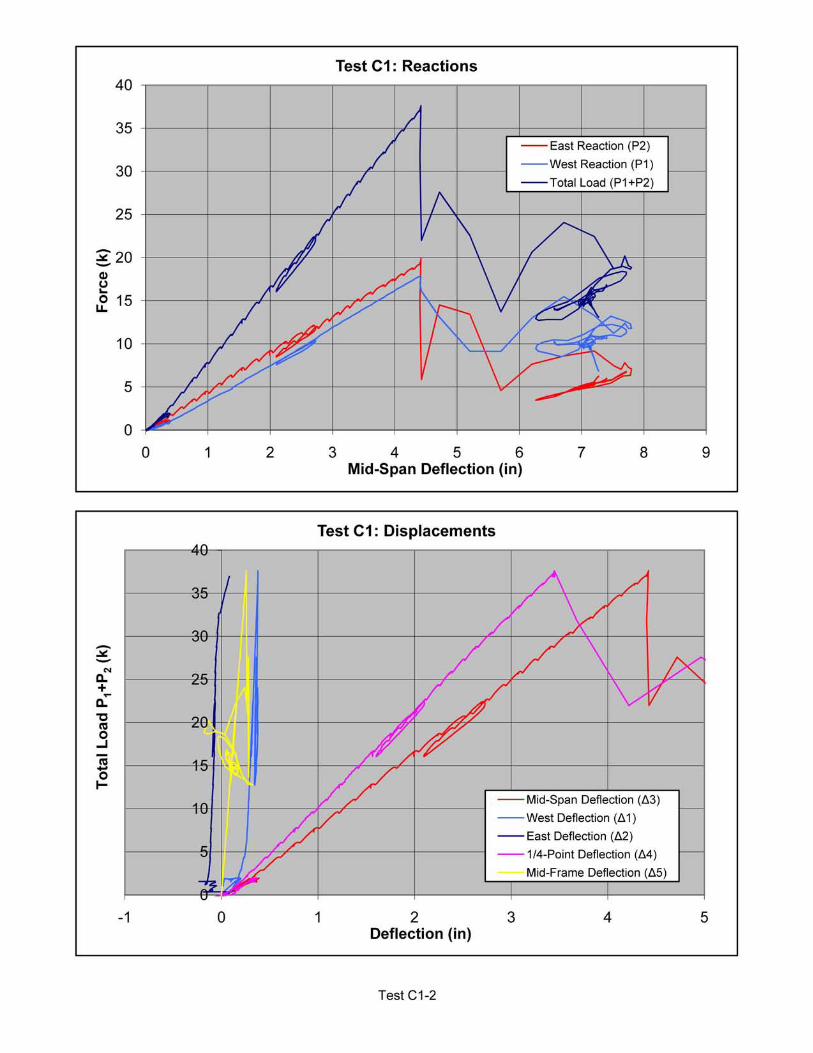
West Reaction (kips) 6.86 6.85 1.00 17.77 17.75 1.00East Reaction (kips) 8.16 8.17 1.00 19.09 19.14 1.00
FirstCompression
Diagonal
P (kips) 9.13 8.33 0.91 22.90 21.21 0.93
M (k-in) 0.38 0.49 1.29 1.47 4.31 2.93
EndDiagonal
P (kips) 18.4 15.6 0.85 45.0 38.1 0.85M (k-in) 0.01 –0.33 –33.0 0.10 –0.67 –6.7
CompressionChord
Midspan
P (kips) 38.1 29.0 0.76 98.9 71.2 0.72
M (k-in) –3.11 –5.36 1.72 –8.60 –12.43 1.44
CompressionChord End
Panel
P (kips) 16.8 15.4 0.92 41.1 36.9 0.90
M (k-in) –7.94 –2.31 0.29 –20.17 –1.49 0.07
At failure, the strain gage readings indicate that the first compression diagonal had an axial
force of about 21.2 kips, 13% higher than the predicted failure force of 18.75 kips using an
analytical model that neglects member and weld eccentricities.
- 32 -
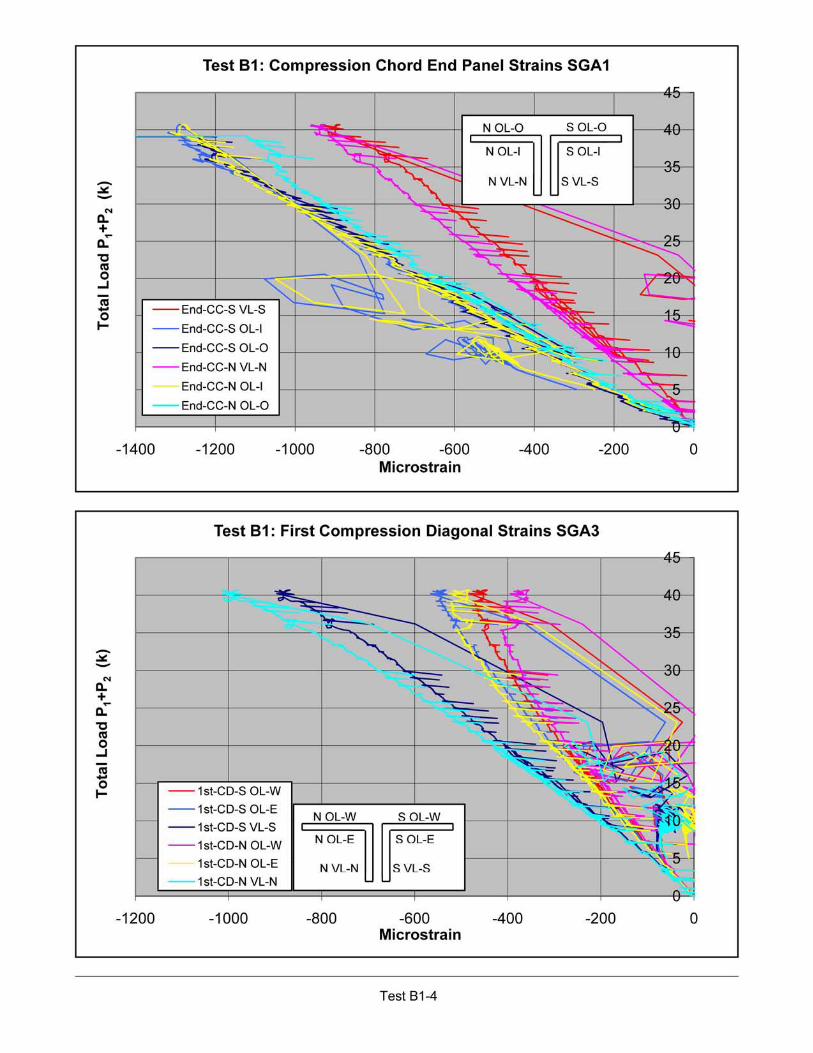
5.8.2 Specimen B1
We have not created computer models of Specimens A1 and B1 that include member and weld
eccentricities, and therefore have not performed a detailed analysis of the strain gage readings
as we did for Specimen C1. We found so many incongruities in our analysis of Specimen C1
that we are not confident that we can model the truss to the level of accuracy required to
meaningfully evaluate the strain gage readings, due to unknowns in the geometry and loading of
the test specimen.
However, the strain gage readings provide a useful measure of the forces in the member that
failed that we can compare to the predicted failure force. Specimen B1 failed in the
compression chord near midspan. The strain gage readings indicate that the force in the
compression chord at failure was 84.5 kips. Using an analytical model that neglects member
and weld eccentricities, the predicted failure force is 76.0 kips. The member capacity exceeded
the predicted capacity by 11%.
5.8.3 Specimen A1
Specimen A1 failed in the top chord near midspan. The chord did not appear to be adequately
braced against lateral movement, as it buckled out of plane. To predict the failure capacity of
the top chord, we therefore assumed that the top chord is braced at 66 in. on center instead of
12 in. – the value we used for Specimens B1 and C1. Using an analytical model that neglects
member and weld eccentricities, the predicted failure force is 60.7 kips. The strain gage
readings for this member indicate that the actual failure force was 67.0 kips, 10% higher than
the predicted force.
5.9 Coupon Tests of Samples Taken from Trusses after Testing
Following testing, Canam cut samples of the failed members from the trusses at locations we
designated. We contracted with a machine shop to prepare coupon specimens and tested the
specimens in our laboratory in accordance with ASTM A370.

- 33 -
The source of the specimens is summarized in the following table:
Specimen Designation Source Truss Member Size
A2-S A2 compression chord L2x2x3/16B1-1S B1 compression chord L2x2x3/16B2-1S B2 compression chord L2x2x3/16C1-C C1 compression web diagonal L1.25x1.25x1/8C1-T C1 compression web diagonal L1.25x1.25x1/8C2-C C2 compression web diagonal L1.25x1.25x1/8
The test results are summarized in the following table:
The SGH average coupon test results for the L2x2 and L1.25x1.25 members exceeded the
Lehigh results for both yield stress and ultimate stress. This difference may be explained by the
different rates of loading used by Lehigh and SGH. ASTM A370 permits a test rate of up to
1/16 in. per minute per inch of gage length from half the anticipated yield stress up to the yield
point. The gage lengths of both the Lehigh and SGH specimens were 2 in., so the specification
permits testing up to 1/8 in. per minute. Lehigh performed its coupon tests at a rate of 0.02 in.
per minute, while SGH used the maximum speed of 1/8 in. per minute. More rapid testing tends
to increase the measured strength.
Our strength calculations elsewhere in this report are based on a yield stress of 77 ksi. Our
measured value of 78.6 ksi for the L2x2x3/16 members is only about 2% higher. Specimens A
and B failed in the LL2x2x3/16 compression chord, so our evaluation of the results for these
members is reasonably accurate even when using 77 ksi. The C specimens, however, failed in
the first web compression diagonal. The average yield stress from the SGH coupon tests is
81.7 ksi, about 6% higher than the assumed yield stress of 77 ksi.
Specimen DesignationYield Point
(ksi)
Yield Stress(0.2% Offset)
(ksi)Ultimate
Stress (ksi)Elongation
(%)
A2-S 79.2 79.2 98.7 24.1B1-1S 78.0 77.5 99.4 23.9B2-1S 78.8 78.8 103.4 25.1C1-C 81.8 82.0 103.2 25.5C1-T 82.1 82.0 103.1 22.3C2-C 81.3 81.1 101.7 23.4SGH Average for L2x2x3/16 78.6 78.5 100.5 24.4SGH Average for L1.25x1.25x1/8 81.7 81.7 102.7 23.7Lehigh Average for L2x2x3/16 76.9 100.2Lehigh Average for L1.25x1.25x1/8 78.5 100.7SGH/Lehigh for L2x2x3/16(% difference)
2.2% 0.3%
SGH/Lehigh for L1.25x1.25x1/8(% difference)
4.1% 3.0%
- 34 -
Recomputing the axial capacity of the first compression diagonal in Specimen C1 using the SJI
design approach with a yield stress of 81.7 ksi and, as in Section 5.8.1, neglecting member end
and weld eccentricities, we find that the expected compression capacity is 18.9 kips. The strain
gage reading from the test indicates that the member failed at an axial load of 21.2 kips, 12%
higher than the calculated capacity. Therefore, even using the higher yield stress found in our
coupon tests, the conclusion that the tested capacity of the first compression diagonal exceeded
the predicted capacity does not change.
- 35 -
6. DISCUSSION
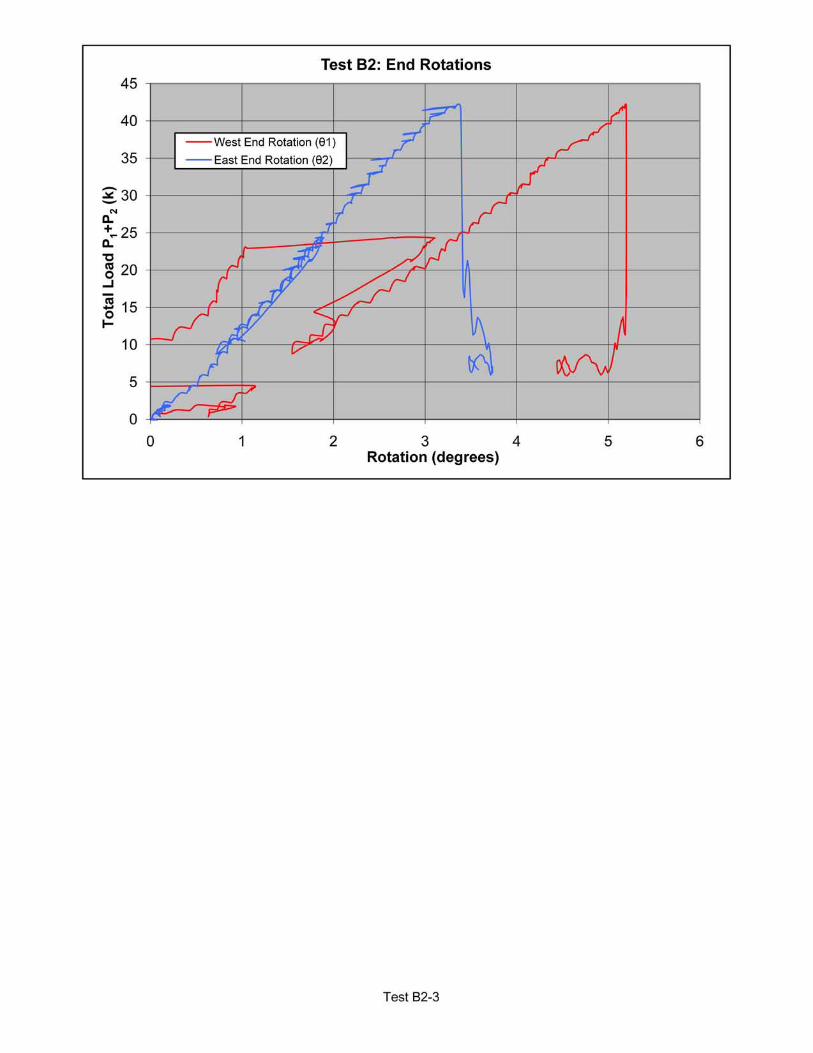
6.1 Vertical Displacements and End Rotations
The measurements of vertical displacements at the east and west seats are characterized by
high displacements at low load followed by stiffening as the load increased. This pattern
indicates that some seating of the specimen in the test frame occurred as loading progressed.
The effect is particularly pronounced at the east end, where the measurements were taken from
the loading head to a fixed portion of the frame (Photo 13). Due to the camber of the truss, the
head initially was not in contact with the compression chord of the truss. The gap between the
head and the truss closed as the load increased. Once the gap closed, the measured
deflections were due to flexibilities in the test set-up, such as the load cell, the cross-frame, etc.
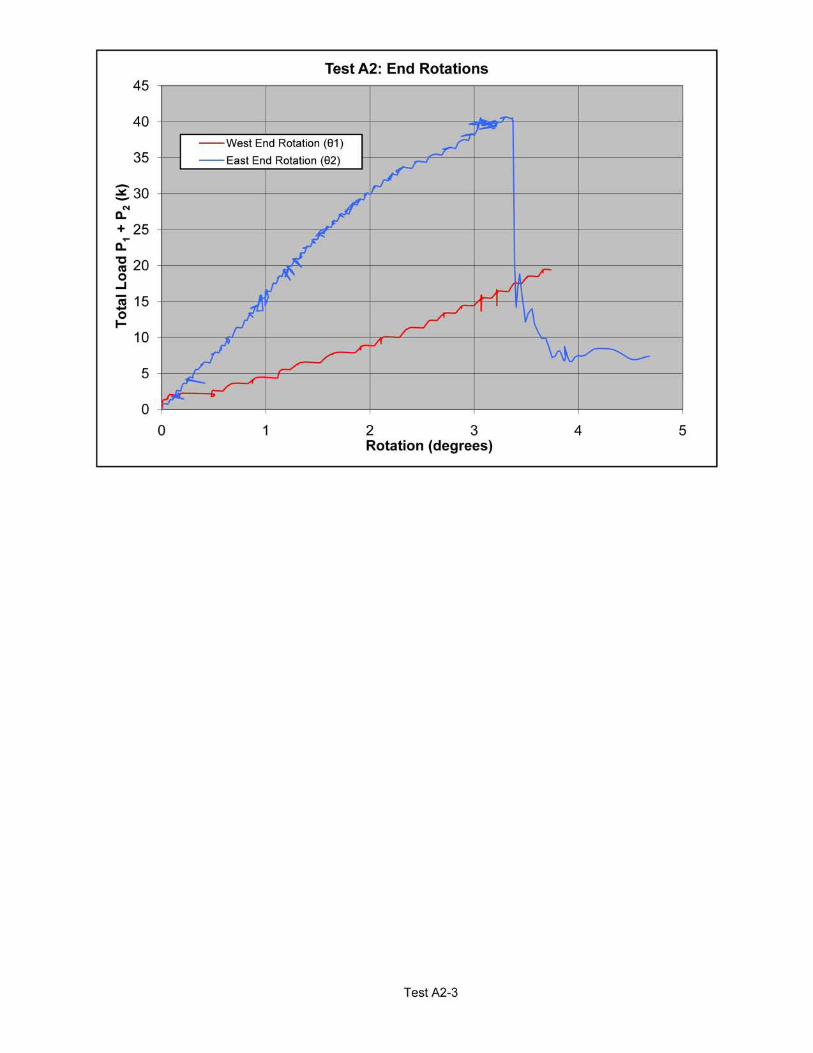
The end rotation measurements are highly variable and do not correlate well with predicted
rotations, particularly at the west end where rotations were in all cases greater than predicted, in
one case (Specimen B1), by more than a factor of three. One possible cause of error is contact
between the load frame and the inclinometers (Photo 14).
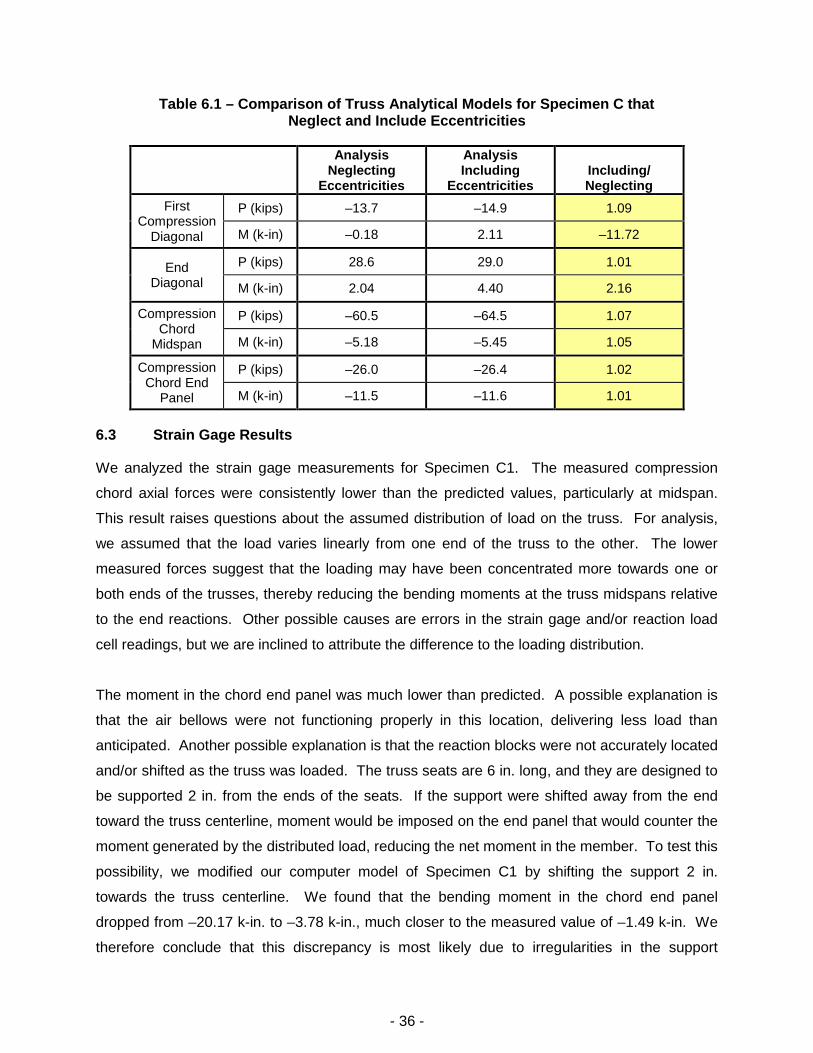
6.2 Weld and Member Eccentricities
It is customary for weld and small member eccentricities to be ignored in SJI truss design
procedures. The end welds of double-angle web members typically are made without
consideration of their eccentricity relative to the web centroid. The SJI Specification permits the
web-member work points at chord joints to be at the face of the chord rather than at the chord
centroid.
Using RISA software, we created an analytical model of Specimen C1 that incorporates the
member and weld eccentricities at the three web members nearest the supports at each end of
the truss, and found that the effect of the eccentricities was greater on the web members than
the chord members. The web member moments increased the most. Table 6.1 compares the
results for computer models that include and neglect these eccentricities, using identical
distributed loads of 500 plf. Based on this limited study, it appears that designing with a model
that includes eccentricities would result in larger members. However, as discussed below, we
find that trusses designed using analyses that neglect member eccentricities have more than
enough strength to resist imposed loads, so we do not recommend routinely designing for these
eccentricities.
- 36 -
Table 6.1 – Comparison of Truss Analytical Models for Specimen C thatNeglect and Include Eccentricities
AnalysisNeglecting
Eccentricities
AnalysisIncluding
EccentricitiesIncluding/Neglecting
FirstCompression
Diagonal
P (kips) –13.7 –14.9 1.09
M (k-in) –0.18 2.11 –11.72
EndDiagonal
P (kips) 28.6 29.0 1.01
M (k-in) 2.04 4.40 2.16
CompressionChord
Midspan
P (kips) –60.5 –64.5 1.07
M (k-in) –5.18 –5.45 1.05
CompressionChord End
Panel
P (kips) –26.0 –26.4 1.02
M (k-in) –11.5 –11.6 1.01
6.3 Strain Gage Results
We analyzed the strain gage measurements for Specimen C1. The measured compression
chord axial forces were consistently lower than the predicted values, particularly at midspan.
This result raises questions about the assumed distribution of load on the truss. For analysis,
we assumed that the load varies linearly from one end of the truss to the other. The lower
measured forces suggest that the loading may have been concentrated more towards one or
both ends of the trusses, thereby reducing the bending moments at the truss midspans relative
to the end reactions. Other possible causes are errors in the strain gage and/or reaction load
cell readings, but we are inclined to attribute the difference to the loading distribution.
The moment in the chord end panel was much lower than predicted. A possible explanation is
that the air bellows were not functioning properly in this location, delivering less load than
anticipated. Another possible explanation is that the reaction blocks were not accurately located
and/or shifted as the truss was loaded. The truss seats are 6 in. long, and they are designed to
be supported 2 in. from the ends of the seats. If the support were shifted away from the end
toward the truss centerline, moment would be imposed on the end panel that would counter the
moment generated by the distributed load, reducing the net moment in the member. To test this
possibility, we modified our computer model of Specimen C1 by shifting the support 2 in.
towards the truss centerline. We found that the bending moment in the chord end panel
dropped from –20.17 k-in. to –3.78 k-in., much closer to the measured value of –1.49 k-in. We
therefore conclude that this discrepancy is most likely due to irregularities in the support
- 37 -
condition, such as inaccurate placement of the support block or shifting of the support resultant
due to truss end rotation during loading.
Finally, we measured much higher bending moment in the end tension diagonal than predicted
in the analysis, suggesting that our analytical model of Specimen C1 did not accurately capture
the eccentricities present in these members. One possible explanation is irregularities in the
test reaction blocks, as described above. In the analysis with the 2 in. shift in support location,
we found that the bending moment in the end diagonal changed from 0.10 k-in. to 1.57 k-in.,
compared to a measured value of –0.67 k-in. The sign difference is not explained by this
hypothesis.
The discrepancies between the predicted and measured forces in the members suggest that it
is difficult to accurately predict the distribution of forces in complex structural systems such as
these trusses due to the great number of possible sources of irregularities. We may, however,
use the strain gage data to evaluate the performance of the individual members that failed. As
described in Section 5.8, we calculated the ratios of measured-to-predicted axial loads at failure
in the critical members for Specimens A1, B1, and C1, and we found that the actual member
strength exceeded the predicted strength, calculated neglecting eccentricities, in all three cases
by from 10 to 23%.
We also used the strain gage results to evaluate the appropriateness of the K-values used in
design. In accordance with the recommendations of the SJI Specification, we used a K-value of
0.75 for in-plane buckling of both the compression web members and the compression chord
(see Table 2).
For Specimen C1, where the first compression diagonal failed, this evaluation is relatively
simple, since the bending moments are very low (in the design, the bending component of the
combined stress ratio was less than 2%). The measured axial force at failure for the first end
diagonal was 21.2 kips. The predicted failure capacity, using K = 0.75, was 19.1 kips. We find
that K must be adjusted to 0.70 for the predicted value axial capacity to equal the measured
capacity. For this compression web member, use of K = 0.75 for design appears reasonable.
Specimen B1 failed at the top chord, which had significant bending moment in addition to axial
compression. Using a K of 0.75 provided a conservative prediction of actual strength, as
discussed in Section 5.8. If the design were completed using a smaller K, a higher design

- 38 -
capacity would be expected. However, even reducing K to 0.5 does not increase the predicted
axial capacity sufficiently to reach the measured capacity. We do not know whether this result
is an anomaly for this particular test, but if it could be reproduced in other tests, it would suggest
that a K-value lower than 0.75 may be appropriate for design of truss top chords.
Specimen A1 failed in the out-of-plane direction because it was not adequately braced in that
direction. We therefore cannot evaluate whether a lower K-value for in-plane buckling design
would have better predicted the failure load.
6.4 Evaluation of Design Approach
All six complete truss specimens failed at a higher load than the design load, exceeding
predicted failure loads by factors of 1.08 to 1.90, based on total load. We are uncertain about
the actual load distribution, however, since the end reactions were not identical. Clearly the
applied loads in the tests did not match the uniformly distributed design load. If the design loads
were actually higher near the ends of the trusses, as suggested by the lower measured chord
forces than predicted, then the factors of safety might actually be lower than those calculated
assuming a uniformly distributed load. We therefore also calculated the ratios of measured-to-
predicted failure forces for the three members that failed in Specimens A1, B1, and C1, all of
which had strain gages either on or nearby the failed members. The ratios for these three
members ranged from 1.10 to 1.23. Thus, whether viewed relative to the overall truss capacity
or the capacity of the critical members, the design approach underestimated the actual failure
capacity, which suggests that the standard design approach is suitable for the vanadium-
strengthened steel. Note that in actual truss design, an additional factor of safety would be
applied to ensure a safe design.

- 39 -
7. CONCLUSIONS
We draw the following conclusions from this experimental program.
1. A design approach using SJI Specification K-values, neglecting flexural-torsionalbuckling in compression members and using continuity at the ends of web members(no moment releases), conservatively predicted the strengths of the high-strengthlow-alloy microalloyed vanadium steel test specimens.
2. Truss vertical deflection was well predicted using analysis simplifications andassumptions such as web members with pinned ends, no rigid end zones to accountfor connection overlaps, and no member eccentricities.
3. Design K-values in the SJI Specification were suitable for design of the high-strengthlow-alloy microalloyed vanadium steel test specimens. The specified K-value of 0.75for the compression chord could possibly be reduced, but further research is needed toconfirm this finding.
4. Member and weld eccentricities caused significant bending moments in web members,but the design approach had sufficient conservatism that the eccentricities could beneglected in the design.
O:\DATEFILE\2008\Webster\MDW48-R.ptl.doc
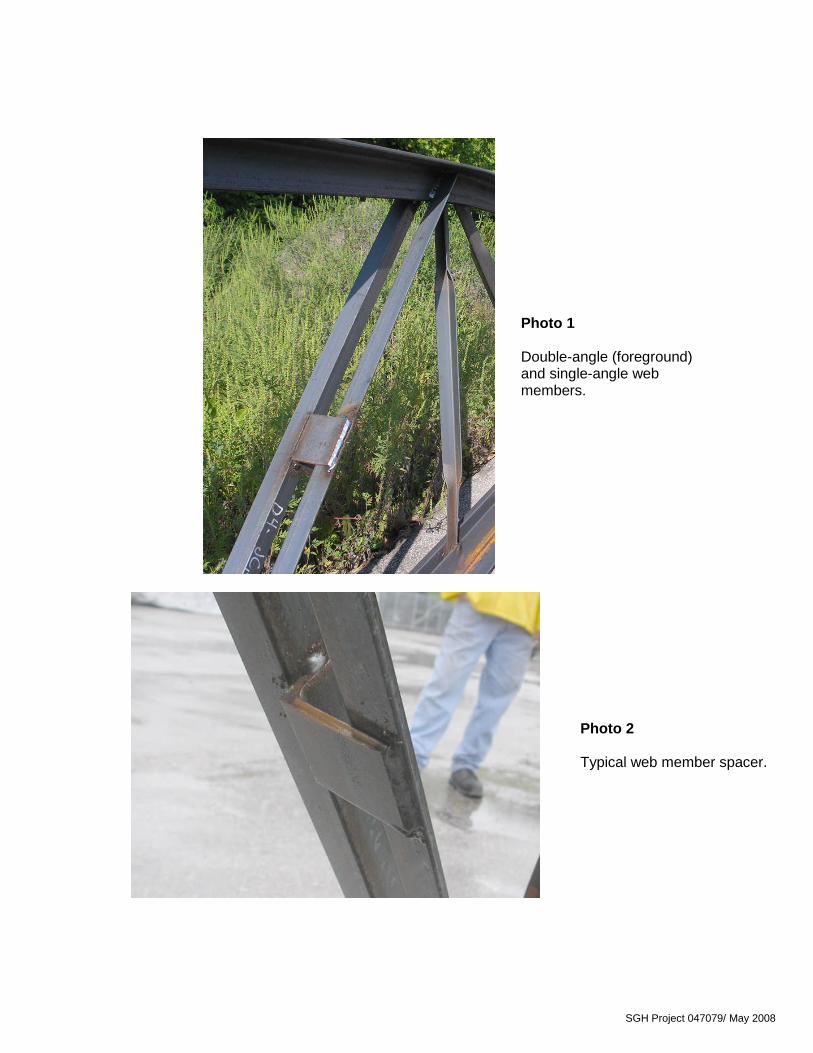
SGH Project 047079/ May 2008
Photo 1
Double-angle (foreground)and single-angle webmembers.
Photo 2
Typical web member spacer.

SGH Project 047079/ May 2008
Photo 3
Typical chord memberspacer.
Photo 4
Canam test machine.
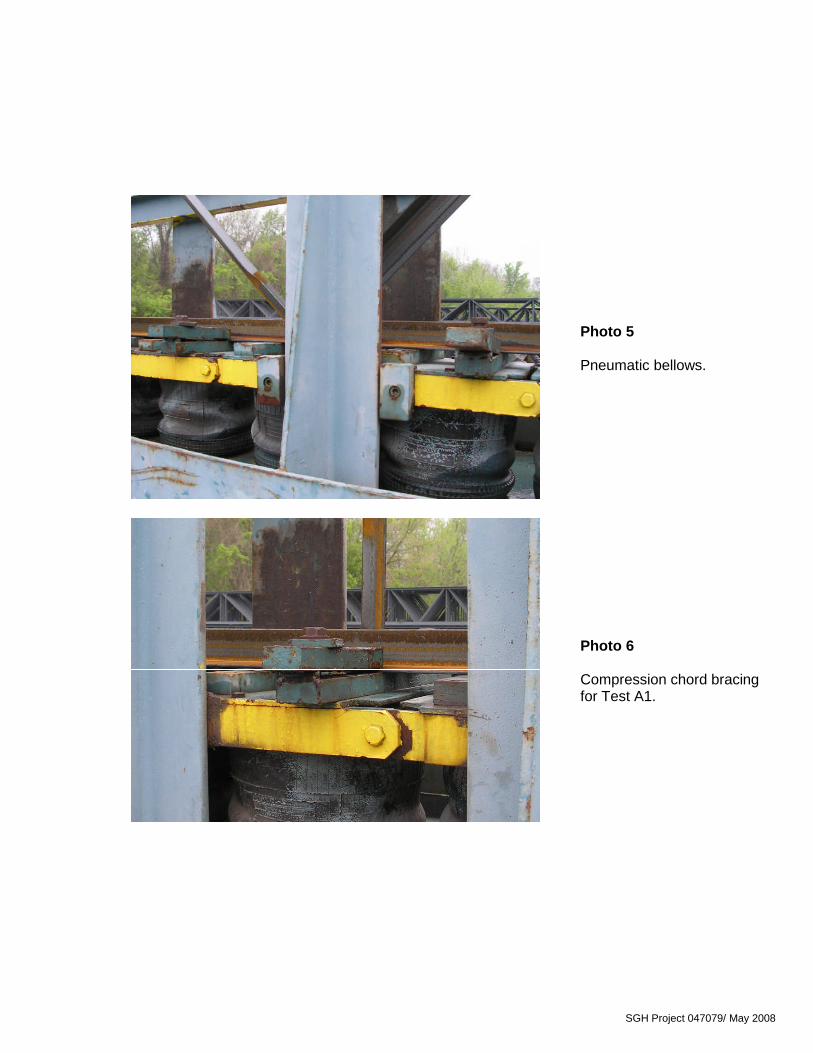
SGH Project 047079/ May 2008
Photo 5
Pneumatic bellows.
Photo 6
Compression chord bracingfor Test A1.

SGH Project 047079/ May 2008
Photo 7
Out-of-plane buckling ofcompression chord atSpecimen A1, looking east.
Photo 8
In-plane buckling ofcompression chord atSpecimen A2, east end oftruss towards the right.

SGH Project 047079/ May 2008
Photo 9
In-plane buckling ofcompression chord atSpecimen B1, lookingtowards east end of truss.
Photo 10
In-plane buckling ofcompression chord atSpecimen B2, lookingtowards west end of truss.

SGH Project 047079/ May 2008
Photo 11
Out-of-plane buckling of firstcompression diagonal atSpecimen C1, east end oftruss.
Photo 12
Out-of-plane buckling of firstcompression diagonal atSpecimen C2, lookingtowards west end of truss.
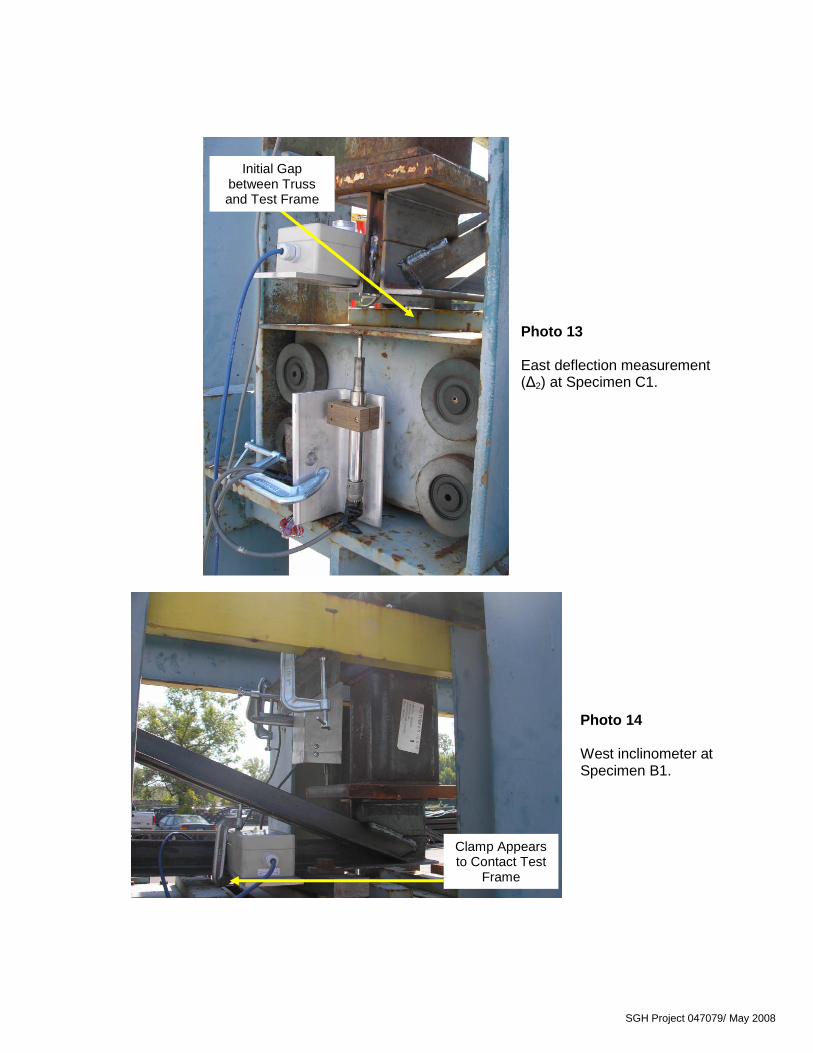
SGH Project 047079/ May 2008
Photo 13
East deflection measurement(Δ2) at Specimen C1.
Photo 14
West inclinometer atSpecimen B1.
Initial Gapbetween Trussand Test Frame
Clamp Appearsto Contact Test
Frame

SGH Project 047079/ May 2008
Figure 1Specimen A member sizes and CSRs – limited by first compression diagonal.
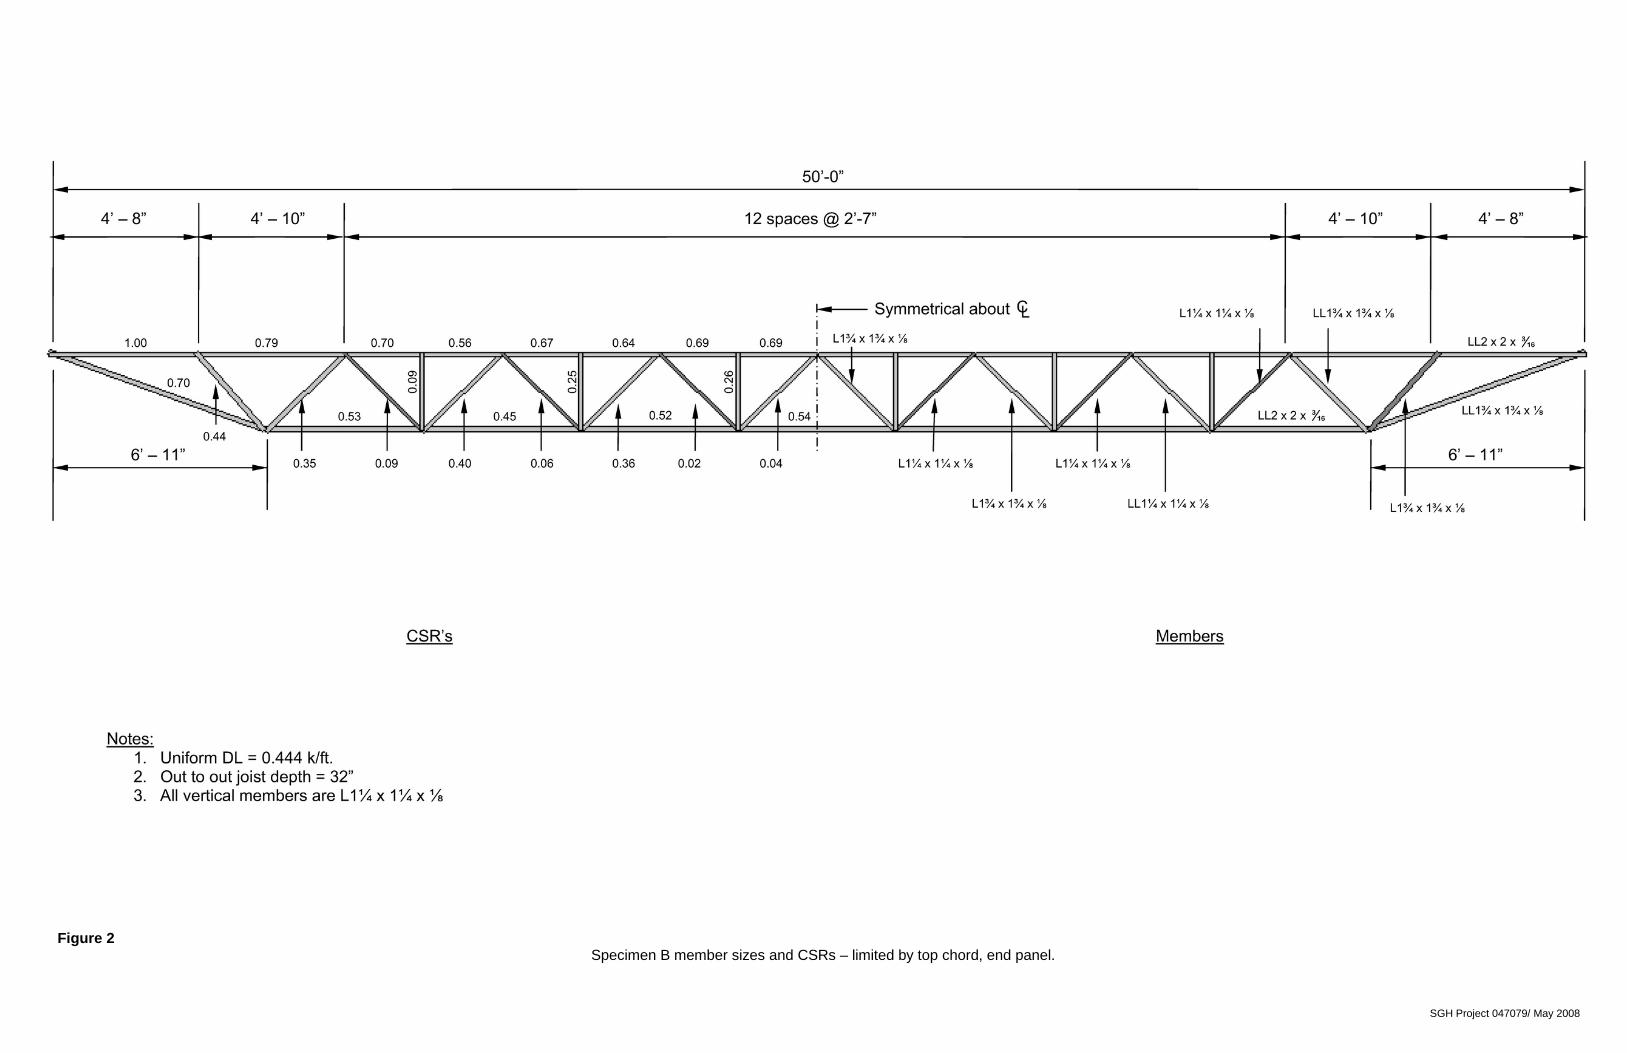
SGH Project 047079/ May 2008
Figure 2Specimen B member sizes and CSRs – limited by top chord, end panel.

SGH Project 047079/ May 2008
Figure 3Specimen C member sizes and CSRs – limited by first compression diagonal.
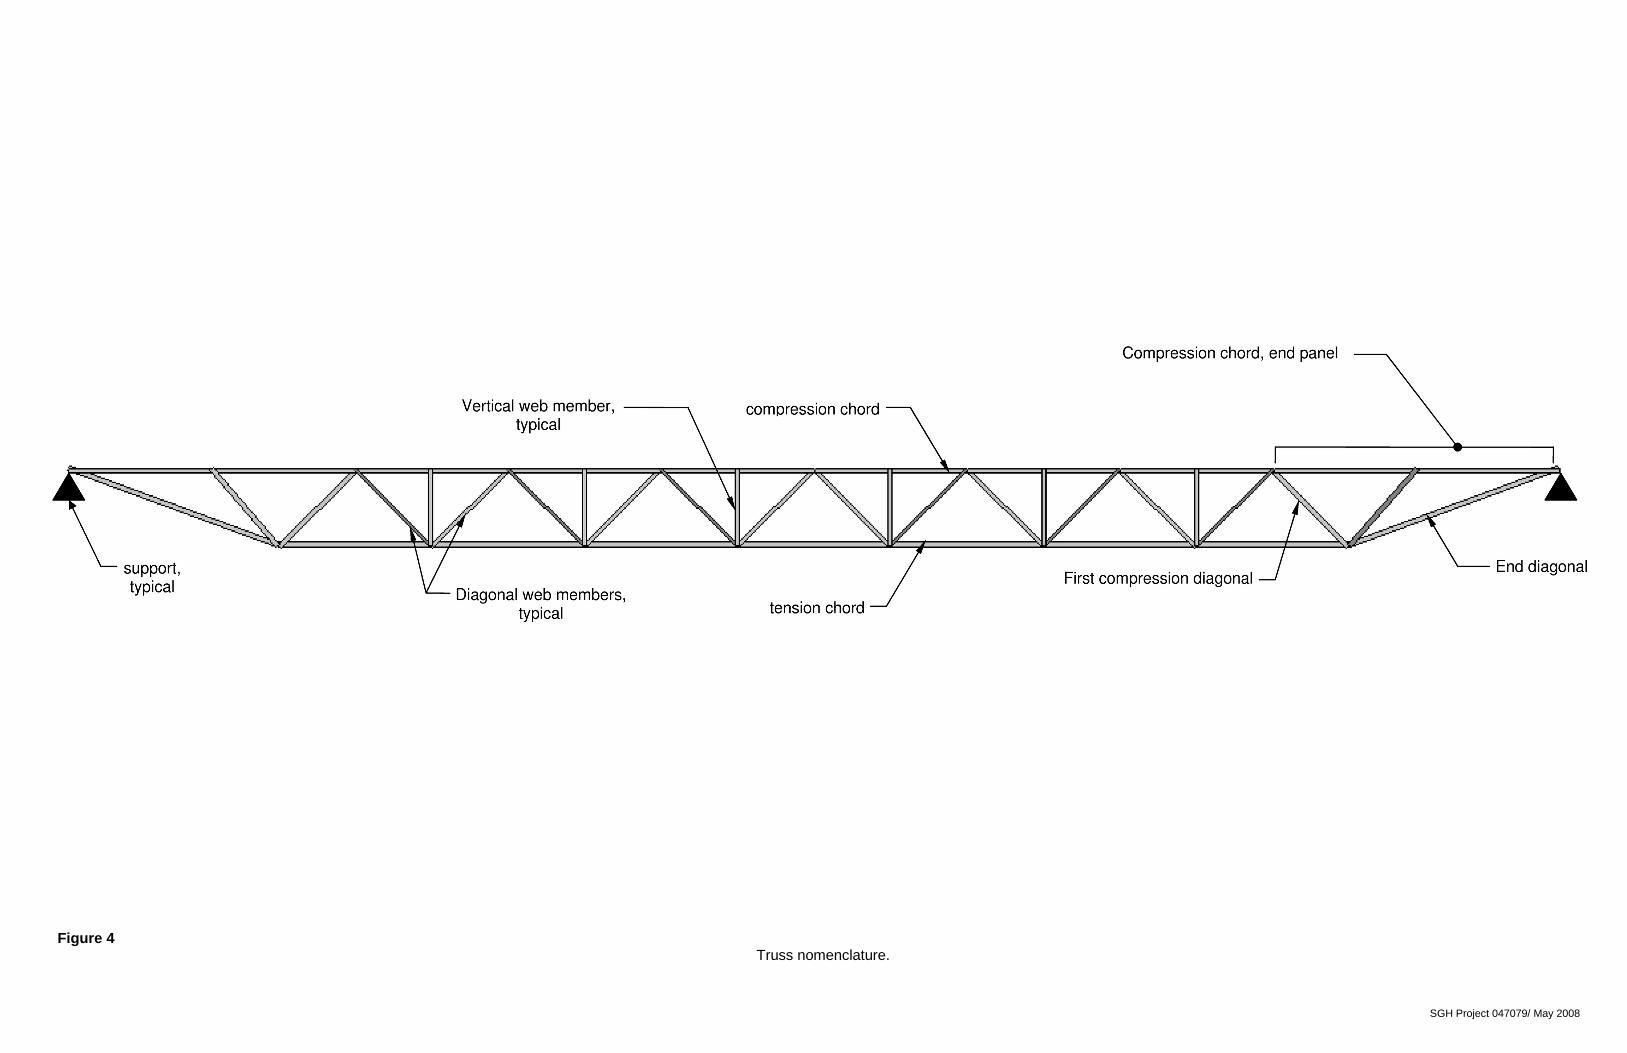
SGH Project 047079/ May 2008
Figure 4Truss nomenclature.

SGH Project 047079/ May 2008
Figure 5
Instrumentation for Test A1.
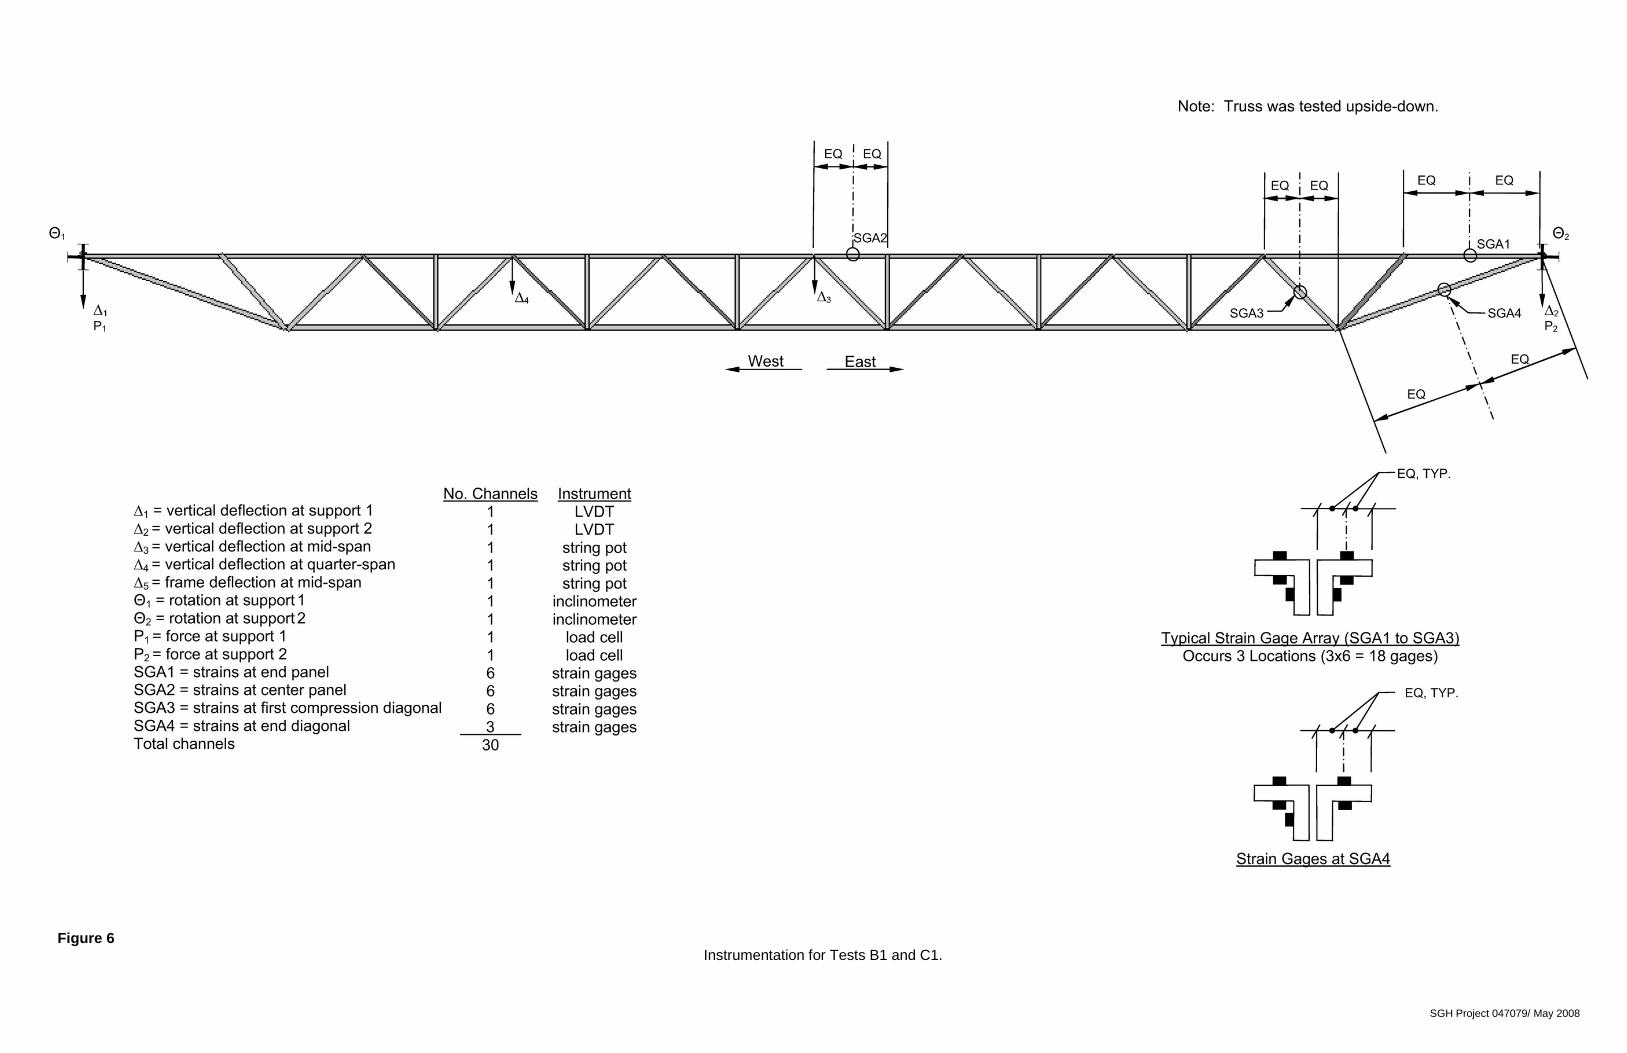
SGH Project 047079/ May 2008
Figure 6Instrumentation for Tests B1 and C1.

SGH Project 047079/ May 2008
Figure 7
Deflection measurements.
Δ1 Δ2
Δ5
Δt
Δ3
Undeformed Shape ofTruss and Test Frame
Deformed Shape ofTruss
Deformed Shape ofTest Frame
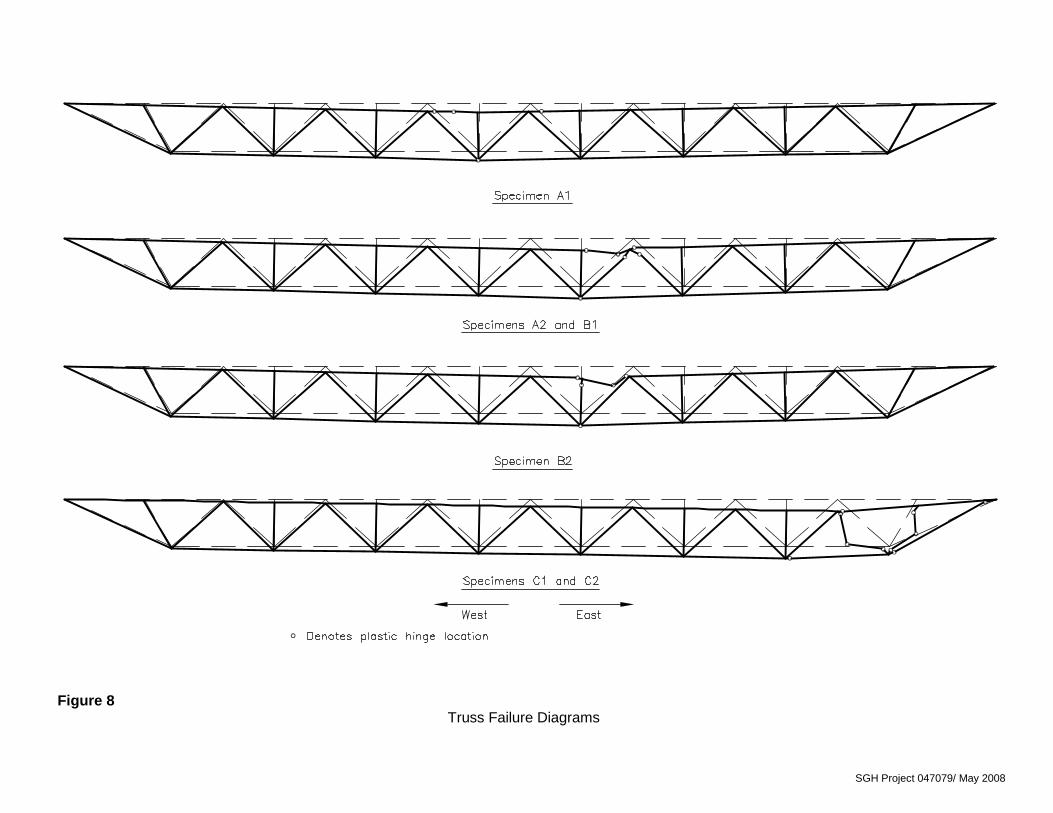
SGH Project 047079/ May 2008
Figure 8Truss Failure Diagrams

APPENDIX A
Recorded Test Data