an experimental study on the spray behavior and fuel distribution of gdi injectors using the entropy...
TRANSCRIPT

An experimental study on the spray behavior and fuel distribution of GDI
injectors using the entropy analysis and PIV method
K.H. Leea,*, C.H. Leea, C.S. Leeb
aDepartment of Mechanical Engineering, Hanyang University, 1271 Sa1-dong, Ansan-si, Kyungki-do 425-791, South KoreabDepartment of Mechanical Engineering, Hanyang University, 17 Hangdang-dong, Sungdong-gu, Seoul 133-070, South Korea
Received 4 February 2003; accepted 22 October 2003; available online 21 November 2003
Abstract
To improve the fuel consumption and exhaust emission for gasoline engines, Gasoline Direct Injection (GDI) system was spotlighted to
solve above requirements. Thus, many researchers have been studied to investigate the spray characteristics and the fuel formation of GDI
injector. In this study, we tried to study the characteristics of a direct injection gasoline spray by using entropy analysis and PIV methods. The
entropy analysis is based on the concept of statistical entropy, and it identifies the degree of homogeneity in the fuel concentration. The PIV
method was adopted to determine the fluid dynamics information at the spray. Also fuel formation within the cylinder in the case of early
injection timing greatly influences combustion characteristics. This study developed the analyzing system for the mixing fuel with air using
the Mie scattering method to visualize the fuel distribution. This technique was applied to a visualization single cylinder engine in order to
investigate the spray behavior and fuel distribution.
q 2004 Elsevier Ltd. All rights reserved.
Keywords: Entropy analysis; Particle image velocimetry; Vorticity strength; Gasoline direct injection
1. Introduction
As the environmental problems caused by vehicle
exhaust emissions become more severe, exhaust emission
standards and fuel economy regulations become more
stringent. For the gasoline engine, the emission of CO2 gas,
which is one of the main causes of global warming,
becomes a severe problem as well as the emission of toxic
gases such as CO, HC, NOx. Recently, the gasoline direct
injection (GDI) engine is spotlighted as a next generation
engine that can satisfy the Super Ultra Low Emission
Vehicle Super Ultra Low Emission Vehicle regulation and
can reduce the fuel consumption. Thus, the studies of high-
pressure vortex type injector, one of the key parts for the
development of GDI engine, have been performed by many
researchers [1,2]. Zhao et al. visualized the development
process of fuel spray of GDI injector by using a two-
dimensional Mie scattering method, and measured the
SMD and velocity of spray to investigate the evaporation
of fuel [3]. Yamauchi et al. performed a numerical analysis
for the fuel spray vortex of a high-pressure GDI injector by
using a Generalized Tank and Tube code, and compared
the results with those obtained by PDA [4]. Yamakawa
et al. developed a new fuel spray measuring technology of
LIF-PIV [5]. The velocity of airflow, which is induced by
the fuel spray, with the variation of the ambient pressure
was measured by using a LIF-PIV method. These studies
investigated particle diameter, velocity distribution, and
evaporation process of spray. However, the studies
experimentally investigated the fuel distribution within a
cylinder are very rare. Yuyama et al. developed a new
entropy analysis method that is based on the statistical
thermodynamics, and applied this method for the investi-
gation of propagation process of Diesel spray [6].
The present study developed a laser scattering image
detection system, and measured the macro scale fuel spray
characteristics such as spray penetration length, spray angle
and vorticity. An entropy analysis method based on the
concept of statistical thermodynamics has been developed,
and the fuel distribution was analyzed by this method.
0016-2361/$ - see front matter q 2004 Elsevier Ltd. All rights reserved.
doi:10.1016/j.fuel.2003.10.021
Fuel 83 (2004) 971–980
www.fuelfirst.com
* Corresponding author. Tel.: þ 82-31-400-5251; fax: þ 82-31-406-
5550.
E-mail addresses: [email protected] (K.H. Lee); leemech@
ihanyang.ac.kr (C.H. Lee); [email protected] (C.S. Lee).

2. Experimental apparatus and procedures
2.1. Entropy analysis method
The principle of entropy analysis that uses laser
scattering image is based on the concept of the statistical
thermodynamics Boltzmann studied a correlation of the
probability of particle distribution in the control volume and
the entropy. If particles of Ni are existed in energy level of
1i; the total energy E and the total number of particles N are
expressed as following equation
E ¼X
Ni1i; N ¼X
Ni
For convenience, let 10 is the lowest energy in system. And
assuming this value is zero relative to the other energy level.
For example, if all of it is existed in 10 state, possible
particle array is expressed like this {N;O;O;…}(case A).
And {N;22;22; 0;…}(case B) is that 10 state is the number
of N 2 2; 11 state is the number of 2. Generalized each
energy level 1i is the particle number of Ni; the number of
possible combination of the total particles number of N is
distinguished in this system, W is
W ¼N CN1£ðN2N1Þ
CN2£ · · · £NM
CNM
¼N!
N1!N2!N3!· · ·NM!¼
N!QNi!
ð1Þ
It is obvious that occurrence possibility of case B is higher
than that of case A.
The entropy might be expressed in the natural
logarithm of W combination according to the concept of
the Boltzmann statistics. It becomes a following equation
when Stirling approximation is applied for the case of
N q 1
ln n! < n ln n 2 n ðn q 1Þ
ln W ¼ ln N!2X
ln Ni
¼ N ln N 2 N 2X
Ni ln Ni þX
Ni
¼ N ln N 2X
Ni 2X
Ni ln Ni ð2Þ
S ¼ k lnðWÞ ¼ k½N lnðNÞ2X
{Ni lnðNiÞ}� ð3Þ
where k is a Boltzmann constant.
If we assume that the particle number of Ni in each cell
ðMÞ of the image is in proportion to image intensity IðiÞ of the
cell
S ¼ aXM
i
IðiÞ
( )ln a
XMi
IðiÞ
( )2
XMi
½aIðiÞ ln{aIðiÞ}�
¼ aXM
i
IðiÞ
( )ln
XMi
IðiÞ
( )2 a
XMi
½IðiÞ ln{IðiÞ}� ð4Þ
where a is the constant including a Boltzmann constant and
the coefficient of proportion between the number of particle
and image intensity.
IðiÞ is an image intensity corresponding to the number of
particle within the cell divided the number of M: If we think
that the particle is uniformly scattered, the average intensity
is
IðiÞ ¼1
M
XMi
IðiÞ ¼It
Mð5Þ
where It is the integrated value of the luminance over the
whole space. The entropy of a homogeneous divergence is
then
S1 ¼ aIt lnðMÞ ð6Þ
Beside, the total sum of luminance over the whole space is
constant and entropy S0 divided the image distribution to 0
and 255 is indicated as following, if P is the number of sell
that fluorescent light 255 occupy
S0 ¼ a½It lnðItÞ2 PIMAX lnðIMAXÞ�
¼ a½It lnðItÞ2 It lnðIMAXÞ� ð7Þ
Using S1 and S0; when entropy is a maximum value, that is
one, and when entropy is a minimum value, that is zero,
Nomenclature
E total energy
I the intensity of an individual pixel
M the number of meshs
N the total number of particles
S entropy
u X-directional velocity
v Y-directional velocity
W the number of a case for groups
a a proportionality factor
1 specific energy
k Boltzmann’s constant
v vorticity
F correlation coefficient
V the number of microscopic state
Subscripts
i ith state
z interrogation area (A, B, C)
t total
K.H. Lee et al. / Fuel 83 (2004) 971–980972

normalized entropy Sp is defined as
Sp ¼S 2 S0
S1 2 S0
¼
It lnðIMAXÞ2XM
i
{IðiÞ lnðIðiÞÞ}
It{lnðMÞ2 lnðItÞ þ lnðIMAXÞ}ð8Þ
The value of Eq. (8) writes directly a program from a
luminosity distribution in pictures and we can analyze
homogeneity degree of a spray and a diffusion phenomenon.
2.2. Experimental apparatus for spray behavior
Fig. 1 shows a schematic diagram of the experimental
apparatus for the entropy analysis of GDI spray. In order to
simulate the spray behavior in the engine combustion
chamber with different engine operation condition, the
ambient pressure and the temperature in the high-pressure
chamber controlled by nitrogen gas and a heater. The spray
chamber is pressured by high-pressure nitrogen gas and fuel
is injected to the high-pressure chamber. An Nd:YAG laser
(200 mJ, 532 nm) is used as a light source. It generates two
times sequentially laser beam with short time interval by
using a double pulse option (DPO). The laser beam passes
through the cylindrical lens and is introduced to the
observation area as a form of sheet with the thickness of
2–3 mm. The exposure times of CCD camera and laser
beam and the injection time of fuel spray are controlled by a
timing board (PC-TIO-10) and the LabView program. By
controlling the laser trigger signal and delay time, the
scattering image of the formation of fuel spray can be
obtained. The image obtained by a high resolution CCD
camera (1008 £ 1008, Kodak, Megaplus ES 1.0) is recorded
as a digital form by an image board (frame grabber,
metoerll/digital) in a PC. Fig. 2 shows the definition of
injector attached angle and specification of test injectors,
and Table 1 shows the experimental conditions.
2.3. Experimental apparatus for PIV system
The PIV method measures the particle velocity by
analyzing CCD camera particle images that are exposed by
sequentially double exposure laser beams. Usually, the
particle images have been obtained by a single frame-
double exposure method, and the images have been
analyzed by an auto-correlation. However, this method
had a difficulty in determining the direction of the velocity
vector. The image shifting process which uses a rotating
mirror or the two-color PIV method have been developed to
determine the direction of velocity vector more clearly [7],
but these methods require complicate experimental
apparatus.
This PIV is a well established technique for the
measurement of instantaneous planar velocity fields and
has been reviewed by a number of authors [8–13].
Especially, Adrian developed a PIV algorithm and optical
systems to obtain velocity vectors in the flow field [9].
However, it is hard to purchase the PIV because the
commercial PIV is very expensive. Thus, the Q-switch is
installed to the single pulse Nd:YAG laser in order to add
the double pulse function to the laser source and the control
Fig. 1. Experimental apparatus.
Fig. 2. Definition of injector attached angle and specification of test
injectors.
Table 1
Experimental condition
Ambient temperature (K) 298, 373
Ambient pressure (MPa) 0.1, 1
Spray
Swirl injector
A Offset (208)
B Non-offset
Fuel Gasoline
Fuel pressure 10 MPa
Injection period 3 ms
K.H. Lee et al. / Fuel 83 (2004) 971–980 973

unit is developed to synchronize the laser pulse interval with
the expose timing of CCD camera.
The PIV system used in this study is composed of the
laser source, image storage and control unit. In case of laser
source, the DPO, which could be controlled by the time of
pulse separation and Q-switch delay, is installed to the
Nd:YAG laser to generate the double pulse function and the
DPO can control the interval time between primary pulse
and main pulse. In case of image storage, the image
controller adjusted the exposure timing of double exposure
CCD and Q-switch timing to synchronize the primary frame
and main frame. Finally, the control unit is operated by the
laser and CCD trigger based on the injection timing and
crank angle signal of visualization engine. In addition, the
PIV algorithm is made by using a cross-correlation method
and the accuracy of the developed PIV algorithm is
evaluated with the standard images suggested by JPIV
[14]. From this validating procedure, we found that the
developed PIV algorithm has a good agreement with the
standard flow image.
The present study recorded particle images exposed by
each sequential laser beam at separate frames by using a
CCD camera and calculated velocity vector by a cross-
correlation PIV algorithm. The direction of particle velocity
vector could be determined clearly because the particle
images of each laser pulse were recorded at the separate
frames. Fig. 3 shows the ‘frame-straddling’ method, which
aligns laser pulse at each sequential CCD camera frame.
Fig. 4 shows the cross-correlation PIV algorithm using fast
Fourier transform, which is programmed to obtain the
velocity by calculating the coordinates of location of the
maximum cross-correlation parameter.
2.4. Measurements of fuel distribution
in the visualization engine
The fuel distribution and the process of mixing fuel with
air in a single cylinder visualization engine have been
observed. A schematic diagram of the laser beam system is
shown in Fig. 5. The sheet type laser beam is induced into
the cylinder either through a cylinder liner or through a
mirror under the piston and a transparent piston crown. A
rotary encoder is mounted at the camshaft, and the injection
timing and the ICCD are synchronized with the encoder
signal. The spray images with the crankshaft angle at the
intake stroke are obtained with this apparatus.
3. Experimental results and discussion
3.1. Analysis of fuel distribution by using the entropy
analysis algorithm
It is well known that the Mie scattering light intensity is
generally affected by the droplet diameter and the number
density. The droplet diameter of test injector is measured by
using PDPA. From the experimental result, the distribution
of droplet size is uniform and the spray droplet diameter is
Fig. 3. Schematic diagram of frame straddling and timing chart.
Fig. 4. Schematic diagram of cross-correlation PIV algorithm.
Fig. 5. The laser sheet method for observing the spray pattern.
K.H. Lee et al. / Fuel 83 (2004) 971–980974

approximately 20–30 mm. Therefore, the droplet diameter
effect is negligibly small. The details of the result are
described elsewhere [15], so they will not be discussed here.
Since it is assumed that the particle number density could be
linearly correlated to the local luminance light of an image,
the Mie scattering light intensity in this paper is only
affected by the number density.
The laser scattering images of the fuel distribution
obtained by the system are shown in Fig. 1. The images are
divided to small interrogation area of the size of 40 £ 40
pixels, and the entropy of each measuring area is calculated
by Eq. (8). Figs. 6 and 7 show the isentropic lines of the
scattering images. The main mechanisms of fuel distribution
are the momentum exchange due to viscous friction of air
and fuel and the direct diffusion due to fuel evaporation. As
shown in Figs. 6 and 7, at the downstream, the fuel spray
spreads widely and shows high entropy value. The
development of fuel spray is more progressed as time goes
on. Especially, the entropy increases clearly at the whole
area of fuel spray at a temperature of 373 K which is above
the fuel evaporation temperature. As shown in this figure,
the entropy value of the region near the injector tip showed
lower value than that of other region. This reason can be
explained by the fact that the droplet breakup does not occur
in the region close to the nozzle tip. Thus, the diffusivity of
fuel in this region could not be fully developed. On the other
hand, the entropy increased at the measuring points far from
downstream from the injector tip. An explanation could be
that the vortex is generated at the edge of spray due to higher
momentum of droplets. Since the air entrained by the vortex
pulls the smaller droplets towards the centerline, the vortex
enhanced mix the fuel with ambient air. The other reason for
high entropy value is that the viscosity is decreased by the
higher temperature (373 K), which helps the fuel to
evaporate. The region of high entropy, which represents
the uniform fuel formation, is distributed widely neat the
end of the cone region. The reason of these phenomena is
believed that the momentum change between the fuel spray
and the airflow induced by fuel spray increase mixing of two
components. To compare entropies for the ambient
Fig. 6. Comparison of spray pattern and entropy analysis at 4 ms after injection start.
K.H. Lee et al. / Fuel 83 (2004) 971–980 975

temperature of 298 K which is below the evaporating
temperature of fuel and for the temperature of 373 K, which
is above the evaporating temperature, the entropies for the
temperature of 373 K show higher values than those for the
temperature of 298 K. These phenomena can be observed
more clearly at the region near the injector tip. The direct
diffusion is believed to be more dominant mechanism than
the momentum change near the injector tip. Comparing the
analysis results for the ambient pressure of 1 MPa and those
for the ambient pressure of 0.1 MPa, the spray is less
propagated at high ambient pressure. A region of hetero-
geneous particle distribution of round shape is shown at the
edge of cone region of high ambient pressure, which is not
shown at the results of low ambient pressure. The reason of
formation of heterogeneous region at the edge of cone
region is believed that the fuel particles at the boundary of
cone go into the center of the spray because of the vortex at
the end of spray and the pressure decrease at the center
region of spray due to high velocity of spray flow.
3.2. Correlation between entropy and vorticity strength
The vorticity from the velocity fields obtained PIV
system is calculated by grid coordinate as following Fig. 8.
The vorticity is basically calculated on the left term of Eq.
(9) but is calculated by the circulation using the stoke theory
like the right term
vz ¼1
2
›v
›x2
›u
›x
� �¼ lim
A!0
G
Að9Þ
The vorticity which is basically obtained on the circulation
as following the grid coordinate of Fig. 8 is like Eq. (11).
Where Dx (mm) and Dy (mm) is corresponding to the spatial
resolutions of flow fields which are obtained from the PIV
system
þu dL ð10Þ
Fig. 7. Comparison of spray pattern and entropy analysis at 4 ms after injection start.
K.H. Lee et al. / Fuel 83 (2004) 971–980976
vzði; jÞ ¼1
4DxDyuði; j 2 1ÞDx þ 1
2ðuði þ 1; j 2 1ÞDx
nþ vði þ 1; j 2 1ÞDyÞ þ vði þ 1; jÞDy
2 12ðuði þ 1; j þ 1ÞDx 2 vði þ 1; j þ 1ÞDyÞ
2 uði; j þ 1ÞDx 2 12ðuði 2 1; j þ 1ÞDx
þ vði 2 1; j þ 1ÞDyÞ2 vði 2 1; jÞDy
þ 12ðuði 2 1; j 2 1ÞDx 2 vði 2 1; j 2 1ÞDyÞ
oð11Þ
As we investigated in Section 3.1, the main mechanisms to
increase entropy are the viscous friction due to velocity
gradient and the vaporization. Because the velocity gradient
can be referred as the vorticity, this study quantifies the
velocity gradient as the vorticity strength. The vorticity
strength in this study is defined as the absolute vorticity
value at each interrogation area (A, B and C) divided by
their total value, as shown in Eq. (12)
vz ¼
Xi
lvz;ilPXi
lvz;ilð12Þ
where Z is interrogation area of the A, B and C region, i
mean the image number at each interrogation area.
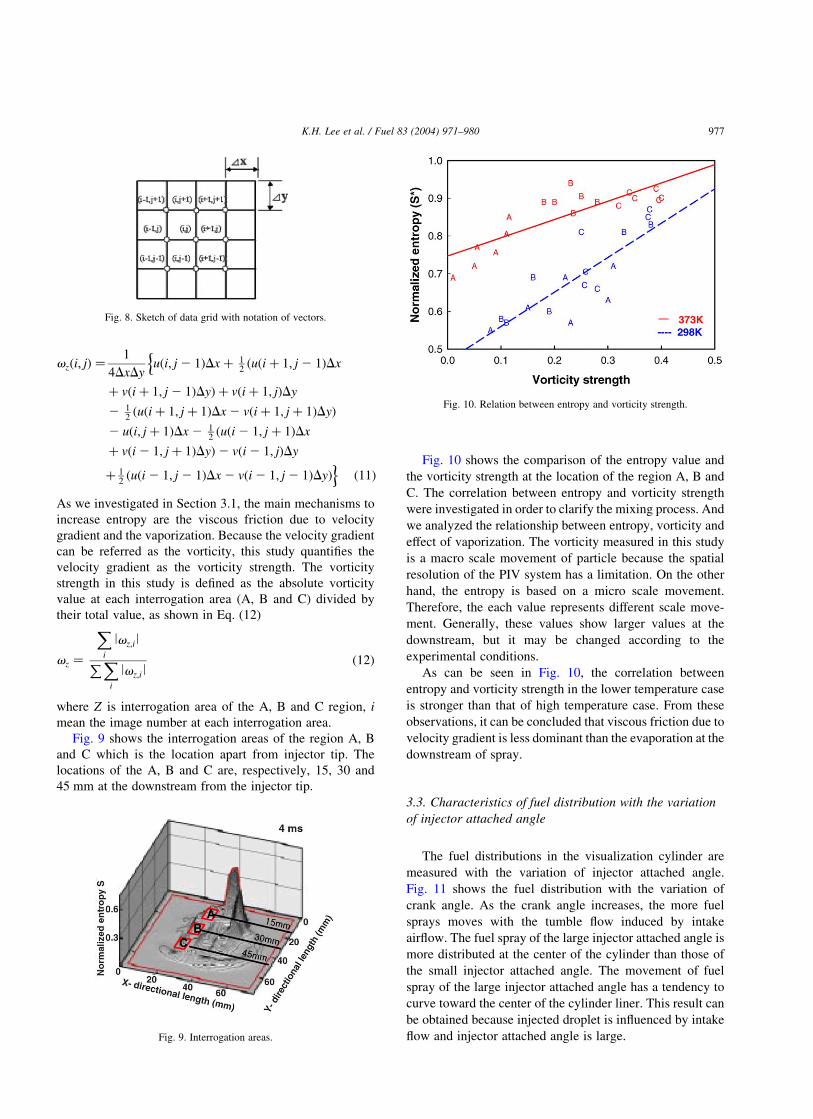
Fig. 9 shows the interrogation areas of the region A, B
and C which is the location apart from injector tip. The
locations of the A, B and C are, respectively, 15, 30 and
45 mm at the downstream from the injector tip.
Fig. 10 shows the comparison of the entropy value and
the vorticity strength at the location of the region A, B and
C. The correlation between entropy and vorticity strength
were investigated in order to clarify the mixing process. And
we analyzed the relationship between entropy, vorticity and
effect of vaporization. The vorticity measured in this study
is a macro scale movement of particle because the spatial
resolution of the PIV system has a limitation. On the other
hand, the entropy is based on a micro scale movement.
Therefore, the each value represents different scale move-
ment. Generally, these values show larger values at the
downstream, but it may be changed according to the
experimental conditions.
As can be seen in Fig. 10, the correlation between
entropy and vorticity strength in the lower temperature case
is stronger than that of high temperature case. From these
observations, it can be concluded that viscous friction due to
velocity gradient is less dominant than the evaporation at the
downstream of spray.
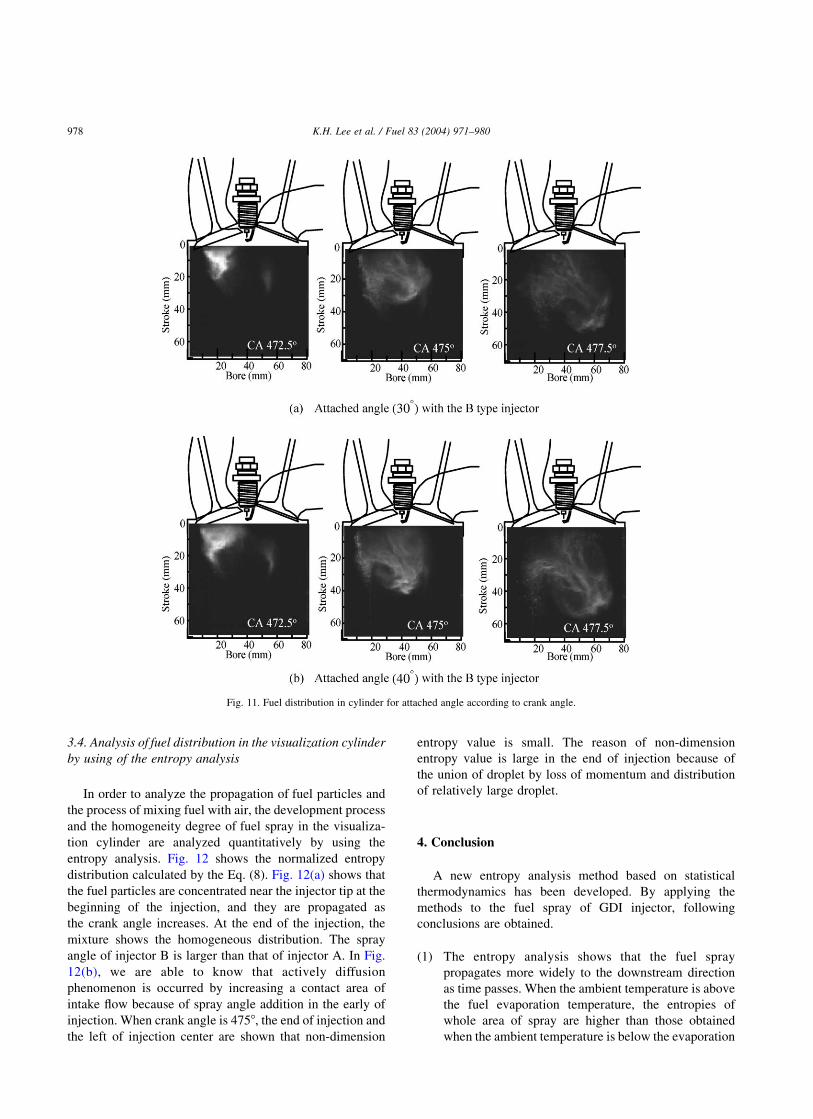
3.3. Characteristics of fuel distribution with the variation
of injector attached angle
The fuel distributions in the visualization cylinder are
measured with the variation of injector attached angle.
Fig. 11 shows the fuel distribution with the variation of
crank angle. As the crank angle increases, the more fuel
sprays moves with the tumble flow induced by intake
airflow. The fuel spray of the large injector attached angle is
more distributed at the center of the cylinder than those of
the small injector attached angle. The movement of fuel
spray of the large injector attached angle has a tendency to
curve toward the center of the cylinder liner. This result can
be obtained because injected droplet is influenced by intake
flow and injector attached angle is large.
Fig. 8. Sketch of data grid with notation of vectors.
Fig. 9. Interrogation areas.
Fig. 10. Relation between entropy and vorticity strength.
K.H. Lee et al. / Fuel 83 (2004) 971–980 977
3.4. Analysis of fuel distribution in the visualization cylinder
by using of the entropy analysis
In order to analyze the propagation of fuel particles and
the process of mixing fuel with air, the development process
and the homogeneity degree of fuel spray in the visualiza-
tion cylinder are analyzed quantitatively by using the
entropy analysis. Fig. 12 shows the normalized entropy
distribution calculated by the Eq. (8). Fig. 12(a) shows that
the fuel particles are concentrated near the injector tip at the
beginning of the injection, and they are propagated as
the crank angle increases. At the end of the injection, the
mixture shows the homogeneous distribution. The spray
angle of injector B is larger than that of injector A. In Fig.
12(b), we are able to know that actively diffusion
phenomenon is occurred by increasing a contact area of
intake flow because of spray angle addition in the early of
injection. When crank angle is 4758, the end of injection and
the left of injection center are shown that non-dimension
entropy value is small. The reason of non-dimension
entropy value is large in the end of injection because of
the union of droplet by loss of momentum and distribution
of relatively large droplet.
4. Conclusion
A new entropy analysis method based on statistical
thermodynamics has been developed. By applying the
methods to the fuel spray of GDI injector, following
conclusions are obtained.
(1) The entropy analysis shows that the fuel spray
propagates more widely to the downstream direction
as time passes. When the ambient temperature is above
the fuel evaporation temperature, the entropies of
whole area of spray are higher than those obtained
when the ambient temperature is below the evaporation
Fig. 11. Fuel distribution in cylinder for attached angle according to crank angle.
K.H. Lee et al. / Fuel 83 (2004) 971–980978

temperature. When the ambient pressure is increased,
fuel spray shows a macro scale heterogeneous
distribution.
(2) By comparing the entropy and the vorticity strength, it
can be concluded that viscous friction due to velocity
gradient is less dominant than the evaporation at the
downstream of spray.
(3) The spray of the large injector attached angle is more
distributed at the center of the cylinder than those of the
small injector attached angle. This means that the spray
behavior of the large injector attached angle has a
tendency to curve toward the center of the cylinder
liner.
(4) The droplets are concentrated near the injector tip at
the beginning of the injection, and they are propagated
as the crank angle increases. At the end of the injection,
the mixture shows the homogeneous distribution.
(5) From the entropy analysis results, it is known that the
spray is widely distributed according to the elapsed
time after injection. Especially, in vaporization con-
dition (373 K), entropy value is increased in a whole
spray area. Besides, as ambient pressure increases, the
fuel distribution becomes heterogeneous condition.
(6) According to compare entropy value with vorticity
strength, a velocity gradient by viscosity fraction does
not affect uniform mixing process of fuel spray than
entropy increase by evaporation of the spray.
Acknowledgements
We would like to thank Combustion Engine Research
Center (CERC) for financial support for this work.
Fig. 12. Fuel distribution I cylinder about two injectors using the entropy analysis.
K.H. Lee et al. / Fuel 83 (2004) 971–980 979

References
[1] Zhao F-Q, Yoo J-H, Lai M-C. Spray dynamics of high pressure fuel
injectors for DI gasoline engines. SAE technical paper, No. 961925;
1996.
[2] Yamauchi T, Wakisaka T. Computation of the hollow-cone sprays
from a high-pressure swirl injector for a gasoline direct-injection SI
engine. SAE technical paper, No. 962016; 1996.
[3] Yamakawa M, Isshiki S, Yoshizaki T, Nishida K. Measurement of
ambient air motion of D.I. gasoline spray by LIF-PIV. COMODIA
2001;499–504.
[4] Preussner C, Doring C, Fehler S, Kampmann S. GDI: interaction
between mixture preparation, combustion system and injector
performance. SAE paper No. 980498; 1998.
[5] Yuyama R, Chikahisa T, Kikuta K, Hishinuma Y. Entropy analysis of
microscopic diffusion phenomena in diesel sprays. COMODIA 2001;
542–50.
[6] Lee K-H, Woo Y-W, Park S-C, Lee C-S. An analysis of intake flow in
a 5-valve gasoline engine by two color PIV. A volume of D of the
KSME 2001 Spring Papers; 2001.
[7] Lee K-H, Lee C-h, Woo Y-W, Lee C-S. A study on the spray
characteristics for a gasoline direct injector by using entropy analysis
and PIV method. KSME 2002;1047–54.
[8] Hinsch KD. Particle image velocimetry. In: Rajpal SS, editor. Speckle
metrology. New York: Marcel Dekker; 1993.
[9] Keane RD, Adrian RJ. Theory of cross-correlation analysis of PIV
images. J Appl Sci Res 1992;49:191–215.
[10] Lecordier B, Mouqallid M, Trinite M. Simultaneous 2D measure-
ments of flame front propagation by high-speed tomography and
velocity field by cross correlation. Proceedings of the Eighth
International Symposium on Application of Laser Techniques to
Fluid Mechanics Lisbon, Portugal; 1994.
[11] Stolz W, Kohler J, Lawrenz W, Meier F, Bloss WH, Maly RR,
Herweg R, Zahn M. Cycle resolved flow field measurements using
a PIV movie technique in a SI engine. SAE International Fuels
and Lubricants Meeting and Exposition, San Francisco, Paper
922354; 1992.
[12] Wormell DC, Sopchak JL. A particle image velocimetry system using
a high resolution CCD camera. Conference on Optical methods and
Data Processing in Heat and Fluid Flow, City University, London,
UK; 1994. IMechE C485/014.
[13] Stereoscopic WC. Digital particle image velocimetry for appli-
cation in wind tunnel flows. Meas Sci Technol 1997;8(12):
1465–79.
[14] Stanislas M, okamoto K, Kaher C. Main results of the first
international PIV challenge. Meas Sci Technol 2003;14:63–89.
[15] Lee K, Reitz RD. Investigation of spray characteristics from a low-
pressure common rail injection system for use in a HCCI engine.
ILASS Americas, 16th Annual Conference on Liquid Atomization
and Spray Systems, Monterey, CA; 2003.
K.H. Lee et al. / Fuel 83 (2004) 971–980980