an exploration of process variability and its management...
TRANSCRIPT

AN EXPLORATION OF PROCESS VARIABILITY
AND ITS MANAGEMENT: A CASE STUDY OF
FOUR STAR HOTELS
By
Timothy William Eggins
A thesis submitted to the University of Birmingham for the degree of DOCTOR OF
BUSINESS ADMINISTRATION
Birmingham Business School
University of Birmingham
February 2013

University of Birmingham Research Archive
e-theses repository This unpublished thesis/dissertation is copyright of the author and/or third parties. The intellectual property rights of the author or third parties in respect of this work are as defined by The Copyright Designs and Patents Act 1988 or as modified by any successor legislation. Any use made of information contained in this thesis/dissertation must be in accordance with that legislation and must be properly acknowledged. Further distribution or reproduction in any format is prohibited without the permission of the copyright holder.

Intentionally blank

Abstract
This thesis suggests how service operations that experience arrival time and process duration
variability can configure resources and design processes so that a throughput time appropriate
for customers is maintained. It does this by exploring four star hotel operations, an under-
researched area and uses observation, an under-used research method, to identify causes and
reasons for variable throughput time. Several theories are brought together in a unique way to
categorise and analyse the findings. The conclusion is that four star hotels can focus on
reducing variability arising from their actions but that customer variability generally needs to
be accommodated.
Customer variability is accommodated by using flexible capacity in the form of labour, space
and equipment. Service encounters are shortened to allow employees to process customers
more rapidly when demand is high. Physical space to contain customers is provided to allow
them to exercise choice as to the length of time that they spend on activities. Labour is
flexible and cross-trained; moving labour to satisfy demands of customers present is a key
operational aim in hospitality. This is supported by ensuring that sufficient equipment and
materials are provided to meet the needs of customers. Future research could be conducted to
investigate approaches to influencing customer variability while maintaining perceived
satisfaction with service.
The findings reveal useful insights for operations that experience variable arrival and
processing rates. People are the greatest source and least controllable source of variability. It
also confirms the utility of some key operations and service management theories.

List of Contents
Contents Chapter 1: Introduction .......................................................................................................... 1
1.1: Background to research................................................................................................ 4
1.1.1: The Aim .............................................................................................................. 14
Chapter 2: Conceptualisation of key concepts ..................................................................... 18
2.1: Introduction ................................................................................................................ 18
2.2: The Process Management Triangle ............................................................................ 18
2.3: Time ........................................................................................................................... 22
2.4: Capacity ..................................................................................................................... 25
2.5: Conceptualisation of processes and resources ........................................................... 36
2.5.1: Process as causal mechanism ............................................................................. 41
2.5.2: Transformation model of process ....................................................................... 45
2.5.3: Process hierarchy ................................................................................................ 52
2.5.4: Process stages and customer contact .................................................................. 53
2.5.5: Process as a capability (RBV) ............................................................................ 54
2.5.6: Perspective on the process .................................................................................. 55
2.5.7: Process Conceptualisation Summary.................................................................. 63
2.6: Variability: ................................................................................................................. 64
2.6.1: Introduction ........................................................................................................ 64

2.6.2: Types of variability ............................................................................................. 67
2.6.3: Sources of variability .......................................................................................... 69
2.7: Conceptual framework ............................................................................................... 73
2.8: Summary .................................................................................................................... 75
Chapter 3: Methodology ....................................................................................................... 76
3.1: Introduction ................................................................................................................ 76
3.2: Knowledge and reality ............................................................................................... 79
3.3: Retroduction ............................................................................................................... 83
3.3.1: Causal mechanisms............................................................................................. 87
3.4: Abstract and concrete: Intensive and extensive ......................................................... 90
3.5: Methods and application ............................................................................................ 94
3.5.1: Case research ...................................................................................................... 94
3.6: Case data collected ................................................................................................... 104
3.6.1: Documents ........................................................................................................ 107
3.6.2: Direct observation............................................................................................. 107
3.6.3: Interviews ......................................................................................................... 112
3.7: Case selection........................................................................................................... 114
3.8: Process selection ...................................................................................................... 114
3.9: The Hotels ................................................................................................................ 115
3.9.1: Hotel A ............................................................................................................. 115
3.9.2: Hotel B .............................................................................................................. 117

3.9.3: Hotel C .............................................................................................................. 120
3.9.4: Hotel D ............................................................................................................. 122
3.10: Method in the Field .............................................................................................. 124
3.10.1: Breakfast Service Observations .................................................................... 125
3.10.2: Front Desk Observations............................................................................... 127
3.10.3: Field Research Summary .............................................................................. 128
3.11: Chapter Summary ................................................................................................. 128
Chapter 4: Findings ............................................................................................................ 130
4.1: Introduction .............................................................................................................. 130
4.2: Quantitative Findings of Arrival and Duration: Breakfast ...................................... 131
4.3: Quantitative Findings of Arrival and Duration: Front desk ..................................... 139
4.3.1: Quantitative Data Summary ............................................................................. 147
4.4: Qualitative Findings: Customer Variability ............................................................. 148
4.4.1: Customer Variability Observations: Breakfast ................................................. 149
4.4.2: Customer Behaviour at Breakfast: Interview Findings .................................... 151
4.4.3: Customer Variability Observations: Front desk ............................................... 152
4.5: Findings Summary ................................................................................................... 157
Chapter 5: Discussion of findings and reflection on theory ............................................... 159
5.1: Introduction .............................................................................................................. 159
5.2: Variability ................................................................................................................ 161
5.2.1: Breakfast Variability......................................................................................... 162

5.2.2: Front Desk Variability ...................................................................................... 164
5.2.3: Justifying Accommodation of Variability: ....................................................... 170
5.2.4: System Variability ............................................................................................ 176
5.2.5: Variability Summary ........................................................................................ 179
5.3: Process categorisation .............................................................................................. 180
5.4: Summary Comparison of the nature of the two processes ....................................... 185
5.5: Capacity of Labour and Capital ............................................................................... 187
5.5.1: Process Design .................................................................................................. 190
5.5.2: Removing time in-process ................................................................................ 203
5.5.3: Capital: The role of facilities and equipment ................................................... 213
5.6: Supporting the front-line .......................................................................................... 219
5.6.1: Management style ............................................................................................. 220
5.6.2: Equipment Reliability ....................................................................................... 221
5.6.3: Demand Management and Demand Forecasting .............................................. 221
5.7: Summary .................................................................................................................. 223
Chapter 6: Concluding section ........................................................................................... 226
6.1: Main contribution of the thesis to practice .............................................................. 227
6.1.1: Key Findings and conclusions: Breakfast Service ........................................... 228
6.1.2: Key Findings and conclusions: Front Desk ...................................................... 229
6.1.3: Capacity: Coping with variability.................................................................... 231
6.1.4: Removing Time ................................................................................................ 235

6.2: Main Contribution of the thesis to theory ................................................................ 237
6.3: The extent to which the aim and objectives have been achieved ............................ 239
6.4: Weaknesses of the thesis .......................................................................................... 244
6.5: Recommendations for further research .................................................................... 245
References .............................................................................................................................. 247
Appendices ............................................................................................................................. 260
Appendix 1: Proforma of questions .................................................................................... 261
Appendix 2: Email example of research aims and data to be collected ............................. 263
Appendix 3: Example of a briefing sheet ........................................................................... 265
Appendix 4: Example of a report sent to a hotel ................................................................ 268
Conclusions and recommendations for capacity management ....................................... 284
References ...................................................................................................................... 288
Appendix: Breakfast ....................................................................................................... 290
The XXXX, Breakfast Notes .......................................................................................... 290
Appendix: Front Desk .................................................................................................... 298
XXXX Hotel Reception Notes ....................................................................................... 298
Check-in procedure......................................................................................................... 303
Appendix: Interviews ..................................................................................................... 304
Interviews XXXX ........................................................................................................... 304
Appendix : Reception observation ................................................................................. 308
Appendix 5: Breakfast data collection sheet example ........................................................ 311

Appendix 6: Front desk data collection sheet example ...................................................... 312

List of Tables
Table 2.1: Short-term capacity management approaches (Pullman & Rodgers, 2009). .......... 28
Table 2.2: Interpreting Armistead & Clarke’s capacity tasks. ................................................. 30
Table 2.3: Selected business process design principles derived from best practices (Ponsignon
et al, 2012). ............................................................................................................................... 33
Table 2.4: Examples of sources of waste (Ohno, 1988; 58). .................................................... 34
Table 2.5: The seven sources of waste identified by Toyota (Slack, 2010; 435). .................... 34
Table 2.6: Examples of process type conversions (Armistead et al, 1995; Anupindi et al,
2012). ........................................................................................................................................ 48
Table 2.7: Examples of objects................................................................................................. 49
Table 2.8: Examples of degrees of customisation (Schmenner, 1986) ................................... 60
Table 2.9: Sources of variability affecting capacity. Adapted from Armistead & Clarke
(1994)........................................................................................................................................ 70
Table 3.1: Examples of modes of reality. ................................................................................ 82
Table 3.2: Evaluation or testing of causal hypotheses (Sayer, 1992; 213). .............................. 86
Table 3.3: Intensive and extensive research: a summary. (Sayer, 2000; 21). .......................... 93
Table 3.4: Case Study Tactics for Four Design Tests (adapted). (Yin, 2009; 41). ................. 97
Table 3.5: Main breakfast service factors to examine. .......................................................... 105
Table 3.6: Main check-in factors to examine. ........................................................................ 106
Table 3.7: Strengths and weaknesses of documentation. (Yin, 2009; 102). ........................... 107
Table 3.8: Strengths and weaknesses of direct observation. (Yin, 2009; 102). ...................... 109
Table 3.9: Pre-service and in-service activities likely to affect measured and perceived
throughput time....................................................................................................................... 111
Table 3.10: Strengths and weaknesses of interviews. (Yin, 2009; 102). ................................ 113

Table 4.1: Key observed breakfast duration statistics. .......................................................... 134
Table 4.2: Table showing the cumulative distribution of breakfast duration as a percentage.
................................................................................................................................................ 137
Table 4.3: Statistics for durations of tables that gave hot food orders and those that did not
from hotels C and D................................................................................................................ 139
Table 4.4: Key observed check-in duration statistics. ........................................................... 140
Table 4.5: Table showing the cumulative frequency of check-in times as percentages. ....... 143
Table 4.6: Customer activities observed at breakfast. ........................................................... 151
Table 4.7: Comments from staff relating to customer behaviour that speeds of slows
breakfast service. .................................................................................................................... 152
Table 4.8: Observed task variety, excluding check-in........................................................... 155
Table 4.9: Observed sources of task variety in the check-in process. ................................... 156
Table 5.1: Observed table and cover provision in the hotels................................................. 162
Table 5.2: Examples of Sources of customer variability at breakfast after Frei (2006). ....... 163
Table 5.3: Examples of Sources of customer variability on check-in after Frei (2006). ........ 166
Table 5.4: Table showing the number of check-ins that took more than four minutes. ........ 167
Table 5.5: Table showing reasons noted for check-ins that took more than four minutes. ... 169
Table 5.6: Strategies for managing customer-introduced variability (Frei 2006). ................. 171
Table 5.7: Reported and observed system events that slow throughput at different stages of
the check-in and breakfast processes. ..................................................................................... 177
Table 5.8: Sources of capacity leakage, adapted from Armistead & Clark (1994) and
Johnston et al (2012)............................................................................................................... 178
Table 5.9: Process characteristics. ......................................................................................... 186

Table 5.10: Principles to reduce or accommodate variability so that appropriate throughput
time is achieved. ..................................................................................................................... 189
Table 5.11: General process for breakfast service. ................................................................ 193
Table 5.12: General check-in process.................................................................................... 197
Table 5.13: Steps frequently observed during check-in. ....................................................... 199
Table 5.14: Observed in-service actions to cope with increased demand. ............................. 205
Table 5.15: Reported and observed system actions that speed throughput at different stages of
the check-in and breakfast processes. ..................................................................................... 208
Table 5.16: Comments about equipment that relate to speeding and slowing throughput. ... 217

List of figures
Figure 2.1: The Process Management, or Operation Management Triangle, adapted from
Klassen & Menor (2006). ......................................................................................................... 19
Figure 2.2: Capacity Management. Adapted from Armistead & Clarke (1994). .................... 29
Figure 2.3: The transformation model. Based on Armistead et al (1995). ............................... 45
Figure 2.4: A process as a network of activities and buffers (Anupindi et al, 2012). .............. 47
Figure 2.5: Business process views vs. paradigms (Melão & Pidd, 2000)............................... 56
Figure 2.6: Classifying Services. Schmenner (2004). ............................................................. 58
Figure 2.7: A contingency-based model for business process design in service organisations
(Ponsignon et al, 2012). ............................................................................................................ 62
Figure 2.8: Average queue time at different capacity utilisations and levels of variability in
arrival and processing times (Slack et al, 2010). ...................................................................... 66
Figure 2.9: Key Causal links to achieve appropriate throughput time. .................................... 74
Figure 4.1: Frequency chart for breakfast arrival times in hotel C. ........................................ 132
Figure 4.2: Scatter chart of breakfast durations overlaid with lines showing the mean and one
standard deviation. .................................................................................................................. 136
Figure 4.3: Frequency chart of observed breakfast dwell times. ........................................... 138
Figure 4.4: Observed check-in duration frequency. .............................................................. 141
Figure 4.5: Scatter chart of check-in durations overlaid with lines displaying the mean and
one standard deviation. ........................................................................................................... 142
Figure 4.6: Check-in arrival time frequency. ........................................................................ 144
Figure 4.7: Inter-arrival times for check-in. .......................................................................... 145
Figure 4.8: Illustrative Throughput Delay Curve. ................................................................. 146

Figure 5.1: Features of different process types (adapted from Slack, 2009 and Schmenner,
2004). ...................................................................................................................................... 181
Figure 5.2: Volume-variety matrix (Johnston et al, 2012:197). ............................................. 184

1
CHAPTER 1: INTRODUCTION
All operations experience variability (Slack, 2012). Variability affects throughput rates and
can lead to increased work-in-process. In service organisations the work-in-process is often
customers. Generally customers have a limited tolerance for waiting and excessive waiting
can adversely affect customer satisfaction. This thesis focuses on hotel operations and reveals
how some hotels are configuring their resources and processes to cope with variability in
customer arrival and processing rates. It explores how to efficiently and effectively manage
capacity in services to cope with uncontrollable variability in arrival and processing times.
This thesis adds to knowledge by revealing the extent and type of customer variability at the
front desk and breakfast. Different types of variability dominate in each situation requiring
different approaches to resource configuration and process design. This thesis reveals how
hotels configure their resources and processes to efficiently cope with variability while,
generally, avoiding unacceptable waiting times for customers.
Chapter 2 introduces the Process Management Triangle, based on Little’s Law (Klassen &
Menor, 2007), to show the link between the level of inventory, variability and capacity
utilisation. Basically a change in any of the three will have an effect on at least one of the
others. This principle underlies the thesis; the processes examined experience great
variability, customers are inventory and need to flow at a rate acceptable to them, to do this
there needs to be spare or flexible capacity to absorb the changing volume of customers in the
system. The chapter then explores key concepts such as time, variability and capacity.

2
Capacity consists of time and tangible resources such as facilities, equipment and people.
Every event consumes time and everything is in process and the outcome of process is
change. The concept of process is explored in depth with processes being viewed as causal
mechanisms. A conceptual model is presented that represents the causal links between the
causes of variability and the main principles that can be applied to cope with it.
Chapter 3 discusses the methodology and the methods used in the field. Managers have a
tendency to be pragmatic (Lundberg, 2004), they want to know how to achieve goals.
Pragmatism is about problem solving, about learning from experience and can be seen in
principles such as continuous improvement (Calaveri, 2008). Critical Realism, as expounded
mainly by Sayer (1992) adopts a pragmatic view of knowledge and is used to justify an
intensive research design. The case study research strategy, as described by Yin (2009) is
used to justify research methods and approaches to analysis. Most of the data is collected by
observation and supplemented with short interviews and documentation. Observation is
highlighted as an infrequently used method in business research. Case studies of hotel
practice also rarely appear in journals.
Chapter 4 sets out quantitative and qualitative findings. Quantitative data about throughput
time was collected and analysed for check-in and breakfast service. Great variability in
arrival and throughput time was observed. As well as recording timings observations
recorded observable causes of throughput time. These were supplemented with questions to
staff and short interviews. Observations are used throughout the findings and analysis
chapters to provide examples of causes of delay and activities that reduced throughput time.
Customers were not questioned, only observed behaviour was recorded.

3
There was clear evidence that the breakfast process was almost completely self-service,
service encounters were very brief, there was little waiting for service, and employees were
there mainly to serve beverages and clear tables. Customer time was spent either selecting
and consuming food or passing the time in other activities. Physical capacity was limited,
self-service and the randomness of arrival times was relied on to maintain throughput. High
task variety remained at the front desk requiring staff to have a wide knowledge. Flexible
labour and task engagement were the main tactics used to cope with variable demand. Staff
would save up tasks or engage in tasks that did not require the presence of customers when
there was no customer demanding service. Customers occasionally had to wait for service
but, once at the front desk, were actively engaged with an employee throughout the process.
While some variability was due to the system, customer variability was the most significant
source of variability in the processes observed. Chapter 5 applies Frei’s (2006) categorisation
of customer variability and highlights that request variability dominated at the front desk and
subjective preference variability at breakfast. The two processes are then analysed to judge
the extent to which they have the features expected by the categorisation models of
Schmenner (1984 & 2004) as modified by Slack et al (2009) and Johnston et al (2012),
generally they were both judged to fit the service shop category but front desk has some
features of a professional / capability service while breakfast has some features of a mass /
commodity service. Principles to manage capacity (Pullman & Rodgers, 2009) and
throughput time (Anupindi et al, 2012) were summarised and set out in table 5.10 and
evidence for their application assessed.

4
Chapter 6 states the main contributions of the thesis for theory and practice and reviews the
aim and objectives to assess the extent to which they have been achieved. The main
contribution to practice is a measurement of the extent of variability in arrival and processing
times and the confirmation of principles that can be applied to accommodate this variability
while remaining efficient.
The key contribution to theory is confirmation of the utility and validity of a range of
operations and service management theories. Evidence from practice is presented of how
resources and processes in services are being configured to accommodate variability in
customer arrival times and process duration. The Process Management Triangle places a
focus on the role of flexible and spare capacity in variability accommodation. Interaction
frequency and duration is reduced, this both improves efficiency and the ability to
accommodate variability. The drive for efficiency is moderated by the requirement to satisfy
the emotional needs of customers for social interaction and control of service duration.
1.1: BACKGROUND TO RESEARCH
The aim of this introductory section is to “set the scene”, to position and justify the research
topic in relation first, to operations and service management literature and then to the study of
hospitality operations. It introduces the strands of theory that have been brought together to
address the basic issue of coping with variability in arrival and processing rates and situates
them in the context of managing hotels.
5
Operations and process management is about managing the resources and processes that
produce products and services (Slack et al, 2009). Essentially this thesis conceptualises the
research problem using concepts and theories from the field of operations management. This
views organisations as systems of overlapping processes that employ resources to transform
inputs into outputs. Jones et al (2003) adopted a similar approach to hospitality operations.
Resources and processes have the capability to do things. If hotels can reduce waiting time
for customers for little or no additional cost then it may be a contributory factor to the
satisfaction of customers. Activity consumes time, this thesis explores how four star hotels
are removing time from activities and flexing their resources to cope with the variability in
customer arrival and processing times.
The origins of operations management theory are not clear. Voss (2007) traces western
sources back to a text on mining and metallurgy published in 1556 which discusses the
activity as a continuous flow process. Scientific management is generally thought to have
been formalised with the work of Taylor (Voss, 2007) and his 1911 publication of the
principles of scientific management. The scientific approach to management continued to
dominate in the 1940s and 50s with management often being referred to as a science (Chopra
et al, 2004). Levitt (1972) highlighted the growth of services and urged operators to follow
the lead of companies like McDonald’s and apply techniques found in manufacturing. At the
same time Ohno and others were developing new approaches to manufacturing, most
famously, in the Toyota factories of Japan. Ironically Ohno (1988) claims that the ideas
behind the Toyota Production System are actually based on the writings of Henry Ford. In
the late 1980s, following the publication of books such as that by Ohno (1988) and Womack
et al (originally 1990) researchers rediscovered the role of time in manufacturing.

6
In 1991 Blackburn, as editor, published a book about time-based competition in
manufacturing. Blackburn asserted that customers were demanding increasing variety and
wanted fast delivery. Speed from order to delivery was being recognised as a competitive
advantage for some industries, the apparel industry for example. Japanese manufacturers
were good at this, most American manufacturers focused on cost and quality (Blackburn,
1991). The orientation of production to remove time used ideas coming out of research in
Japan, such as Just-In-Time (JIT), reduction of set-up time, reduction of work-in-process and
waste elimination. Schmenner (1988) suggested that the key was to keep things moving
rather than work as fast as possible, productivity can be achieved through smooth even flow
(Schmenner, 2004), this is partly achieved by reducing the duration of employee interactions
with customers. Suri (1999) put forward his ideas as Quick Response Manufacturing (QRM).
Blackburn and Suri make reference to the publication on Industrial Dynamics by Forrester
(1958). QRM moves beyond Lean and Six Sigma (Suri, 2010) because it makes the
distinction between desirable and undesirable variability. Achieving quick response is mainly
a matter of company mindset and organisation. The ability to offer variety and customisation
needs to be retained as it can be an advantage in small companies, spare production capacity
is desirable because it can be used to accommodate variability. Labour costs in
manufacturing are a small proportion of total costs. QRM tackles the overhead and inventory
costs (Suri, 2010).
The lean paradigm is better suited to level production, manufacturers that experience
fluctuating volume and variety of demand may benefit by adopting the agile paradigm
(Naylor et al, 1999). Agile Manufacturing is the capability of the manufacturer to quickly
respond to market requirements (Ramesh & Devadasan, 2007). Agility is also related to

7
principles of lean and time-based competition. It focuses on postponing product
differentiation in the supply chain. The key idea is to have a limited range of products that
can be quickly customised in response to customer demand. This is very similar to mass
customisation in which processes are agile and the output flexible (Jones et al, 2003), Suri
(2010) argues that manufacturing can achieve this by reorganising to speed the flow of orders
through the system. A frequent example given is Benetton and its change from making
jumpers from dyed wool to dying jumpers in response to demand for colours (Naylor et al,
1999). This is, essentially, what quick service and fast food restaurants do; they stock a
limited range of items that can be quickly assembled in a variety of ways. Indeed this notion
could also be extended to the breakfast buffet. The idea is to be able to respond to demand
variability while reducing the inventory of finished goods, some of which may prove
unpopular and remain unsold.
While manufacturing was developing systems responsive to variable demand, service
companies, such as McDonald’s were highlighted as ‘trailblazers’ in time reduction by
Blackburn (1991). In 1972 Levitt was using McDonald’s to illustrate the application of
industrial principles to what was seen as a service and commented that there are no such
things as service industries, all industries offer some services; it is a matter of degree (Levitt,
1972). He advised that, to improve efficiency and quality, services need to apply technocratic
thinking to service design. Being efficient is related to productivity, efficiency can be viewed
as addressing mainly the inputs as a proportion of the outputs (Tangen, 2005). Chase (1978)
argued that the extent of customer contact is the key factor that sets limits to how efficient a
service operation can be. He defines the extent of customer contact as “the percentage of time
the customer must be in the system relative to the total time it takes to serve him” (Chase,

8
1978;138). In high contact systems, such as hotels and restaurants, the customer can affect
the timing, nature and quality of service. Capacity and demand are in balance only by chance,
delays and customer input leave high contact systems “at the mercy of time” (Chase,
1978;140). Chase suggested that control could be improved by moving as many tasks as
possible to the back office to remove the influence of customers. Fitzsimmons (1985) argued
that, rather than being a hindrance to productivity, the customer should be viewed as a
productive resource that can contribute effort in the service process. Customers create the
demand for service by their presence and thus arrive just at the right time to carry out some of
the tasks themselves.
According to Heineke and Davis (2007:365), “Prior to 1970, no business schools offered
courses that focused on services; there were no textbooks on services; there had been no
research conducted on services.” Levitt, Sasser, Chase and Fitzsimmons are cited as
influential writers of the 1970s. Johnston and Clark (2012) remark that there is no agreed
definition of what a service is. Generally it is an activity in which the output or outcome is
intangible. Vargo and Lusch (2004) define services as “the application of specialized
competences (knowledge and skills) through deeds, processes and performances for the
benefit of another entity or the entity itself”.
A key difference between activities that manufacture and services is that services cannot be
created and stored in advance of their consumption (Fitzsimmons and Fitzsimmons, 2011).
Operations management theory has its roots and development in manufacturing and has a
tendency to assume that the customer has no role in production and that human labour can be
viewed largely as controllable and mechanical. Service operations texts (for example

9
Johnston & Clark 2012; Fitzsimmons & Fitzsimmons, 2011) take account of the properties of
the customer. The customer is conscious, emotional and self-reflective and does not view
themselves as a unit of production but as a person using the operation for their ends, for the
satisfaction of some customer need.
Service cannot be stored and are frequently delivered with the customer present as a co-
producer (Vargo and Lusch, 2004). Service providers therefore need employees to be
responsive, to make necessary adjustments (however minor) to the contents and pace of the
process so that the customer gets what they want. Sometimes a service process requires
guidelines rather than an inflexible procedure (Jones et al, 2003). Service delivery in many
circumstances is not of a fixed duration, the smooth flow desired by operators (Schmenner,
2004) is largely unachievable. When the customer co-produces the service the pace and
duration is greatly influenced by customer choice rather than being decided by the
organisation.
Responsiveness is one of the five dimensions of service quality (responsiveness, reliability,
assurance, empathy and tangibles) identified by Parasuraman et al (1985) and is still
considered so today (Johnston et al, 2012). It is defined as the willingness to help customers
and to provide prompt service (Fitzsimmons & Fitzsimmons, 2011; Wilson et al, 2008).
Operational responsiveness is defined in Wu et al (2010:729) as “the differentiated skills,
processes, and routines for reacting quickly and easily to changes in input and output
requirements, so that a process can consistently meet customer requirements with little time or
10
cost penalty.” This definition is drawn from a study by Swink et al (2005) that defines
flexibility as “the demonstrated ability to adapt or change plant-level operations with
relatively little time or cost penalties (p. 432), being responsive therefore means having
operations that have flexible resources that can be deployed at short notice. If maintaining
prompt service under conditions of variable demand is a problem for managers and prompt
service is a contributory factor in customer satisfaction then investigating how this operational
capability can be achieved is worthwhile.
Being responsive means configuring processes and resources so that customers can pass into
and through the process at an appropriate speed. In the context of this thesis appropriate
speed refers to the activity duration chosen or regarded as acceptable by the customer. If the
service is delivered without scheduling it also means that the operational system needs to be
able to quickly adapt to short term changes in demand. If an operation adapts consistently
with little time or cost penalty then it may have developed an operational capability that
delivers an advantage.
The hospitality industry is a service industry, it provides food, drink and accommodation
away from home (Davis et al, 2008), whereas a hotel is “an operation that provides
accommodation and ancillary services away from home” (Jones & Lockwood, 2004:1).
Hotels are a mixture of tangible facilities and products and intangible services. Some
processes are more like manufacturing, such as food production and housekeeping where,
although work is initiated in response to customer demand, the customer plays little direct
role in the activity. Services and products are consumed on the premises and, generally, the
customer takes nothing tangible with them when they leave, except perhaps a few toiletries!

11
Hotels can be viewed as systems (Jones et al, 2003; Tesone, 2010) and principles of service
and operations management applied to the analysis of those systems (Jones et al, 2003).
Principles developed in the study of service and operations management can therefore be
applied in hotel operations. In this thesis customers are viewed as flow units in a system, they
occupy time and space and thus conform to physical laws. Products and services are created
in response to customer demand. The customers are less uniform or controllable than
products. Customers are co-creating value for themselves and thus have an input into each
process. The behaviour of customers therefore introduces variability into the duration of
activities within the system. This time variability, in process and arrival rates, results in a
system with an uneven flow. This can result in periods when the number of customers
demanding service is higher than the system can cope with, and periods when the system has
lower demand than it is capable of processing. When demand is high, or rather when the
effective capacity of the system is highly utilised, customers are forced to wait for service.
This thesis explores how hotels can configure resources and processes to cope with this
variability so that customers wait for service less frequently and for less time.
Given the vast number of hotels and the number of people that use them it could be expected
that hospitality operations are a focus for researchers. A search of the EBSCO Hospitality
and Tourism database returned only 128 peer reviewed articles containing the words
hospitality, process and improvement, this reduced to 32 when the word hotel was substituted
for hospitality. There were even fewer focussing on the delivery of hotel operations. There
were no articles investigating the relationship between variability and process design in hotels
or restaurants.

12
Service and operations management books, such as Fitzsimmons and Fitzsimmons (2011) and
Slack et al (2010), introduce queuing models and discuss the impact of variability on
throughput time, Maister’s (1985) psychology of waiting lines is also frequently mentioned.
Hospitality management textbooks generally mention the importance of service speed and the
unpredictability of customer arrivals (for example, Jones et al, 2003; Jones & Lockwood,
2004; Kasavana & Brooks, 2005; Davis et al, 2008; Lillicrap & Cousins, 2010) but do not
investigate the extent or sources of variability, or the impact of variability on throughput time.
Following from this there is little advice as to how resources and processes can be arranged to
cope with variability and reduce the likelihood that customers will be kept waiting. There is
therefore, arguably, a gap in the provision of useful knowledge to hospitality operators.
Some journal articles have explored customer satisfaction with waiting time in meal service
(Hwang & Lambert, 2009; Sheu et al, 2003; Hensley & Sulek, 2007). Noone (2007 and
2009) explored how meal pace affected satisfaction. Noone (2010) also supplied the only
study on the check-in process. It is uncontroversial to state that hospitality customers have a
limited tolerance for waiting on most occasions. It is likely that most people who stay in
hotels even occasionally have been required to queue at the front desk or entrance to the
restaurant. There are many alternative hotels for customers to choose from (Barrows &
Powers, 2008) and if reduced waiting time can be assumed to be a small factor in customer
evaluations then examining ways to reduce actual or perceived waiting time for customers is
worthwhile.
Some research has been published in relation to capacity management and productivity in
commercial restaurant brands. Sill (1991, 1999, 2004, 2010) developed an approach to
13
managing capacity that he calls Throughput Capacity Management, the approach aims to
achieve faster and more consistent order to delivery times for quick-service restaurants (Sill,
2010). Kimes (2004) reported on a study to improve the management of revenue at a
midscale Mexican-style restaurant. Changes were made to layout, process design and
employee roles, essential capacity, that resulted in improved capacity utilisation and
throughput time.
As already indicated, a focus of this thesis is on time. One of the interviewees commented
“most things relate to speed”. Delivering service promptly and minimising the wait of
customers is a basic requirement of managing operations successfully. Activity consumes
time and it is the perspective on time that is discussed in Blackburn (1991), Seddon (2005)
and Suri (2010), for example, that provides a different perspective here for the analysis of
hotel operations with the aim of improving efficiency and effectiveness. Put simply, it is
about removing service encounter time, reducing the interaction between employees and
customers. This spreads the labour cost among a greater number of customers. The short
interaction time means that, if customers are required to wait, perhaps due to an increase in
the arrival rate, then their wait is likely to be brief.
In summary, activity consumes time and the objects being acted on occupy space. Process
improvement is partly about identifying resources and activities that add cost but no value.
By removing them throughput time is also reduced, this increases the capacity to produce. In
some services, such as hotels, customers co-create value and this can require them to occupy
space in the operation while they create value for themselves. The fundamental question to be

14
addressed here is; how do hotels efficiently cope with variable arrival and processing rates
and avoid unacceptable waiting time for customers?
1.1.1: The Aim
The overall aim of this study is to explore what theory says about how resources and
processes can be configured to achieve appropriate throughput time or to quickly adapt to
cope with short term increases in demand and to investigate the actual tactics used in hotels.
It is expected that different solutions have been invented for similar problems and it is hoped
that the research will identify sets of conditions that hoteliers can create to improve their
ability to achieve appropriate throughput time in different contexts.
The main research aims are therefore as follows:
1. To explore literature to review appropriate research and theories about how resources
and processes can be configured to:
a. Achieve appropriate throughput, and
b. Make short term changes to effective service capacity to cope with short term
peaks in demand.

15
2. To explore literature to identify preconditions to achieve the above. The objective is
to suggest the necessary and contingent conditions that increase the likelihood that 1a
& 1b will occur.
3. To select and investigate a number of mid-market, full-service hotels to identify the
actual tactics used to achieve the above.
4. To discuss the findings in relation to theory derived from previous research.
5. To conclude and make recommendations for appropriate resource configurations to
apply that are likely to lead to appropriate speed of service.
This research topic has been selected for a number of reasons. The researcher has had
connections with hotels all of his life, after being a manager of a fifty bedroom full-service
mid-market hotel for a number of years he is now a lecturer in hospitality operations
management and wants to explore a topic relevant to his experience and work. Many ideas
have been explored and rejected, some were too complex for an individual researcher with
very limited time, others seemed to lead towards marketing or strategic management issues, or
seemed more suitable to a quantitative approach. Thinking back to his days as a manager his
experience indicates that, whilst quantitative methods are very useful for the analysis volumes
and values and for pointing to the possible presence of a problem, they uncover very little
about the causes of a situation. At this point the manager needs to start analysing the
processes and resources to make sense of the event, to uncover a probable explanation for it.

16
The concept of a full-service, mid-market hotel is applied loosely, it is simply meant to refer
to the concept of somewhere that provides accommodation, food and drink that is considered
by most customers at neither extreme of budget or luxury. Based on UK standards this is
intended to include hotels awarded four stars by the AA (Automobile Association) or RAC
(Royal Automobile Club).
According to the Hotels –UK – 2012 report (Mintel) 150 million nights were spent in UK
hotels in 2011 and research indicated that a little over 40% of leisure and business customers
stayed in four star hotels. There is no international classification of hotel standards, each
country, develops its own classification, as do tour companies such as Thomson and
FirstChoice. The Automobile Association (AA) started inspecting UK hotels in 1912
(theaa.com) and, until recently, the AA and RAC were the only UK wide common standards.
According to the AA (www.theaa.com) there are 14 four star hotels in Birmingham. Four
were visited by this researcher.
The focus is on time from the customer’s point of view, this includes both chronological and
perceived time. Consideration will be limited to occasions when the customer is on the
premises either waiting for or experiencing service. Whilst a passing consideration will be
given to objects and conditions within the structure and infrastructure of the organisation that
affect process speed research will concentrate on what is within the control of the
departmental manager, supervisor, employee or customer.

17
Four star hotels were chosen for this study for several reasons. They are neither budget nor
luxury and are thus seeking ways to maintain high levels of service but at reduced cost. They
are branded hotels, it was assumed that they would employ better educated and trained
employees, and may have examples of suitable good practice. Finally, for convenience; there
are 14 four star hotels within easy travelling distance of the researcher’s base. It will be
argued however that there are necessary properties of people and activity that mean that the
principles of process design applied have relevance for all operations faced with variable
arrival and processing rates.
It was decided to examine two processes to contrast that are observable and directly involve
customers. All customers check-in or check-out and many more have breakfast than dinner
hotels. Breakfast service and check-out overlap in time so it was decided to focus on check-in
and breakfast. The researcher had previously observed and experienced unacceptable waiting
time in these processes and considered that it would be of benefit to investigate what could be
done to reduce unnecessary waiting time for customers.
18
CHAPTER 2: CONCEPTUALISATION OF KEY CONCEPTS
2.1: INTRODUCTION
This chapter will conceptualise the key operations management theories that lie behind this
thesis. It will introduce the concept of the process management triangle as a framework that
represents the relationship between variability and capacity utilisation. It will then explore
the concept of time and capacity. The concept of the process will be explored in detail before
moving on to consider variability. Finally it will present a causal framework outlining key
principles for reducing or accommodating variability in a customer focused context.
2.2: THE PROCESS MANAGEMENT TRIANGLE
The concept that could be said to have inspired this thesis is the process management triangle
and it is briefly considered here by way of introduction. Klassen and Menor (2007: 1016)
stress “the continued relevance and urgency for greater managerial understanding of process
management fundamentals”. The triangle highlights the causal interaction between the
amount of variability, the amount of inventory in the system and the utilisation of capacity. It
demonstrates why, if flow units are not to be kept waiting, there must be spare or flexible
capacity in systems that experience variable arrival and processing rates. This thesis develops
understanding of process management fundamentals.
19
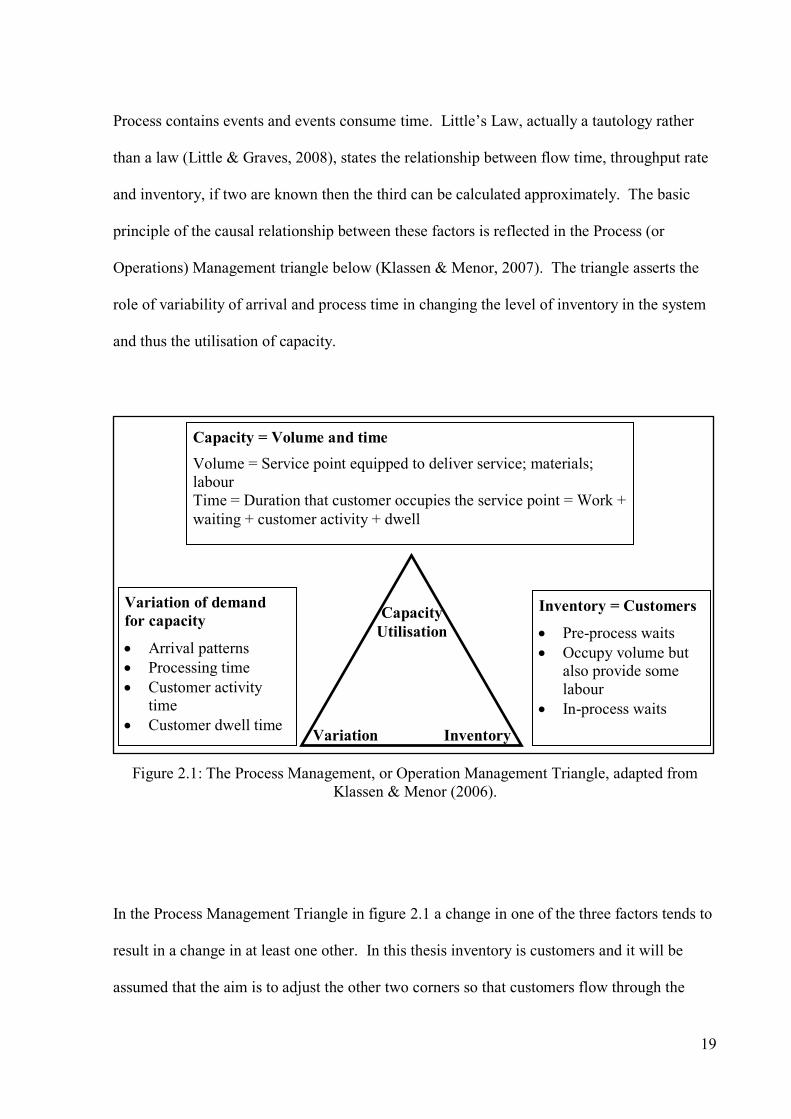
Process contains events and events consume time. Little’s Law, actually a tautology rather
than a law (Little & Graves, 2008), states the relationship between flow time, throughput rate
and inventory, if two are known then the third can be calculated approximately. The basic
principle of the causal relationship between these factors is reflected in the Process (or
Operations) Management triangle below (Klassen & Menor, 2007). The triangle asserts the
role of variability of arrival and process time in changing the level of inventory in the system
and thus the utilisation of capacity.
In the Process Management Triangle in figure 2.1 a change in one of the three factors tends to
result in a change in at least one other. In this thesis inventory is customers and it will be
assumed that the aim is to adjust the other two corners so that customers flow through the
Variation Inventory
Capacity
Utilisation
Capacity = Volume and time
Volume = Service point equipped to deliver service; materials;
labour
Time = Duration that customer occupies the service point = Work +
waiting + customer activity + dwell
Variation of demand
for capacity
Arrival patterns
Processing time
Customer activity time
Customer dwell time
Inventory = Customers
Pre-process waits
Occupy volume but also provide some
labour
In-process waits
Figure 2.1: The Process Management, or Operation Management Triangle, adapted from
Klassen & Menor (2006).

20
process at a speed that is appropriate for them. Where ‘buffering’ (queuing or waiting in line)
of customers does occur it is to be viewed as an undesirable situation.
Variation in arrival time means that the arrival rate of inventory wanting to enter the process
is lumpy rather than smooth. At times, therefore, the capacity of the system will be under-
utilised or idle, at other times inventory (customers) may have to wait in line. Variation in
activity time means that the volume of inventory in the system would vary even if the arrival
rate were smooth. At times the resources of some activities in the process may be fully
utilised and require flow units (customers) exiting previous activities to wait for service,
activities downstream of this delay may then be under-utilised. The main flow units in a
service are people, and people (unlike inanimate objects) experience the passing of time and
have a limited tolerance for waiting. It can, however, be noted that some inanimate objects
quickly degrade or spoil and so cannot be kept waiting. If the operation cannot smooth the
arrival rate, and the inventory of customers cannot be buffered for long without generating
dissatisfaction, then capacity must be manipulated to ensure that customers continue to flow
at a rate appropriate to them. Smooth flow can never be achieved in systems where customers
arrive at a time convenient for them and have varying desire or need for interaction with staff.
This includes industries such as hotels, restaurants, retail, and telephone support services.
An underlying assumption here is that capacity is a cost and that a goal of managing
operations is to be productive and efficient by minimising the cost of input resources.
Capacity to contain and process must ‘breathe’ with rather than ‘chase’ after changes in
demand. As the number of customers increases service staff have to share their labour among
a greater number of customers, perhaps being forced to shorten service encounters and to give
21
less attention to each customer. Physical capacity, like the capacity of a river system, is
largely fixed and must be sufficient to contain demand on most occasions. Capacity to
process is provided by labour and equipment, speed is determined by process duration and
processing pace.
The importance of this simple causal relationship seems to be underplayed in most Operations
Management literature (Suri, 2010). This framework summarises the operations view of the
physical mechanisms that determine throughput time.
If process management fundamentals are to be understood then the key concepts of process,
variability and capacity need to be explored in depth. Time, or activity duration, is a theme
that needs to be discussed under the topics of capacity and variation. If the duration of an
activity can be shortened, then effective process capacity is increased as more flow units can
be processed with no increase in processing resources (Anupindi et al, 2012). The nature of
variation means that it affects activity duration, therefore, reducing variation makes activity
duration less variable, more predictable. Following from this units flow through the system at
a more regular rate reducing variations in demand for capacity, higher rates of capacity
utilisation can be achieved with reduced probability of queues forming or capacity being idle.
A smoother, more even flow is achieved (Schmenner, 2004).
If waiting time (buffering) is to be eliminated then the processing capacity of the system
needs to be flexible to both absorb the variation in inventory caused by arrival time and
processing time variability and the varying time demands of inventory within the system. The

22
two basic options are to maintain spare capacity or to have flexible capacity, that is, resources
that can be either made available to, or removed from, the activity or process as demand
fluctuates.
In summary, the Process Management Triangle is presented as way of illustrating the
necessary relationship between time variability and capacity utilisation. As with time-based
competition, the focus is on keeping inventory, in this case customers, to a level that
maintains an acceptable flow time from the customers’ point of view. The passing of time is
experienced by customers and their experience of it needs to be appropriate to their needs,
they need some control of process duration. This means that capacity, as the final corner of
the triangle, must adapt to the variable demands placed upon it.
2.3: TIME
Chronological time is measured using clocks, it is an artificial construct and just one way of
sensing duration (Davis, 1994). For most of the developed world everyday work and life is
organised around chronological time. It provides an objective reference point around which
activities can be organised; it also provides an objective measure of their duration. Without
reference to a clock human assessment of time of day and duration is inaccurate and context
dependent. Maister (1985) discussed perceived time and suggested that, generally,
unoccupied time, or time when people are anxious, is perceived to pass more slowly than
occupied time. If people are worrying or do not have something to keep their minds occupied
then time seems to pass more slowly.
23
Chronological time is important in operations because it is a limited resource, activity
consumes it and labour time is a direct cost. The lean approach wants to eliminate quality
defects and remove waste partly because they both consume time that could instead be used to
add value (Ohno, 1988). The identification and elimination of activities that do not add value
so that throughput time can be reduced is the key to the concept of time-based competition
(Blackburn, 1991: Suri, 2010). It is also assumed that items flow through the system in the
order in which they arrive. Time spent waiting between activities does not add value and is a
waste. For most service systems time spent waiting is regarded as a cost for the customer
(Fitzsimmons & Fitzsimmons, 2011). Some operators, however, try and make waiting part of
the service experience (such as theme parks) or provide activities (such as entertainment) to
fill time, or generate additional income (such as a seat in the bar).
Services are time-bound experiences that are generated and consumed at a location. There are
some enjoyable experiences that customers may say they wish to extend. There are also
unpleasant or boring experiences that customers may wish to curtail. Customers are paying
for an experience and hope for one that is pleasurable in consumption, or where it cannot be
(such as surgery), the outcome is as hoped. Hensley & Sulkek (2007) investigated satisfaction
with waiting time at different stages of the meal process and concluded that service entry (pre-
process) waits are more important than in-process and post-process waits (bill payment and
departure. Hwang & Lambert (2009) however conclude that customers like a faster pace
post-process. Both studies agree that customers may choose to linger (dwell) and that meal
service must be at a pace that is acceptable to customers. Customers may feel dissatisfied if
they feel either rushed or delayed, perceived time was thought to be more important than

24
chronological time (Hwang & Lambert, 2009). If customers are to be satisfied then it seems
advisable for operators to let customers control the pace of consumption.
Services therefore need to give customers some control over the duration of their own
experience. This thesis uses the term ‘appropriate duration’; this means customers are
generally permitted to perceive that they are deciding the duration of the experience within
certain operational limits; or, if kept waiting, that waiting time is of an acceptable duration. It
is a customer-centric view of process time in which the customer perceives that they are in
control of the chronological time spent in each activity.
The role of the organisation is to deliver products and services within a time-frame that is set
by the organisation. It is assumed that the organisation has service time standards or an
awareness of waiting time tolerated by customers. Vallen & Vallen (2009) and Jones & Dent
(1994), for example, suggest a four minute target for check-in, while Sill (2004) and Hwang
& Lambert (2009) suggests various durations for restaurant throughput times. Obviously
customers cannot extend previously agreed limits to time-bound experiences without
agreement of the operation. It assumes that they will submit to social conventions, such as
vacating the restaurant if requested when the normal meal period has passed, even this can be
handled diplomatically by, for example, suggesting that guests may be more comfortable in
the lounge.
Capacity includes physical facilities and employees, customers occupy space and time but not
all process time involves interaction with employees. At times customers are engaged in

25
purposeful activities, such as asking questions, listening to responses, consuming food etc.
All time at the front desk is occupied or waiting for either the operator or customer to
complete a task, it is an interaction between employee and customer. At meal times
customers ‘dwell’, they are involved in activities of value to themselves, such as chatting,
reading a book, or just staring out of the window but they are not consuming food or engaging
with employees.
It will be seen that operators of mass services reduce the amount of interaction time between
employees and customers (Schmenner 1986, 2004). Customers, however, need to be allowed
to consume the product or service at a pace that they feel is appropriate for them.
2.4: CAPACITY
Capacity is a way of describing either the volume that can be contained by the physical
resources at a point in time or the processing rate. As a simple example a 100 seat fast food
restaurant has the capacity to process many more customers than a 100 seat gourmet
restaurant simply because of the difference in the time it takes for each customer to complete
the meal process. The concept of processing capacity thus contains volume and process
duration. Capacity utilisation, one of the corners of the process management triangle,
describes the proportion of physical capacity that is being used at a point in time, or for a time
period.

26
The maximum capacity of an operation is equal to the maximum throughput rate (Anupindi et
al, 2012) and describes the maximum volume of units that can complete an activity or
sequence of activities (a process) over a given time period. The effective level of capacity is
limited by the volume and capability of resources available and the time required by each unit
(flow unit) to pass through the process. Every system has at least one capacity limiting
resource (Armistead & Clark, 1994), labour available for example. Two key variables that
affect the utilisation of capacity are the arrival rate and processing rate of each flow unit. A
river provides a good metaphor here; the water represents demand and the customers flowing
through the system; if the amount of water flowing increases then the amount of capacity
occupied also increases unless the flow speed increases to accommodate it.
When the arrival rate exceeds the processing rate an ever growing queue forms, but rarely
does the arrival rate equal the processing rate. Variations in arrival and processing times
mean that at times capacity is either not fully utilised or flow units are waiting in line for their
turn to be processed. In river systems lakes and flood plains help accommodate the variation
in flow volume over time. Any variation in the volume or performance of resources can
impact on the effective capacity of the processing system. Any variation in the arrival rate of
flow units or the time that they require to complete an activity can impact on the throughput
rate (output of capacity) of the processing system. Queues of arrivals waiting to enter the
system and flow units in the system, either being processed or waiting for processing, are
inventory. If the volume capacity of the system is not sufficient to absorb the variation in
inventory arrival or processing then queues will form. If the process cycle time cannot be
shortened to increase the processing capacity then queues will form.
27
Capacity management is about balancing supply and demand, some attempt at demand
forecasting is required if this is to be achieved. Demand forecasting is difficult especially
when demand is variable or lumpy (Kalchschmidt et al, 2006). Generally where demand is
variable capacity needs to vary, or chase (Slack et al, 2010) demand, if resources are to be
used efficiently and customer demand is to be met with acceptable waiting time.
Capacity slack and flexible capacity are required to absorb variability. Capacity slack
represents idle capacity that can be utilised at short notice to accommodate a short term
increase in demand whereas flexible capacity refers to capacity that has more than one use.
Pullman & Rodgers (2009) reviewed approaches to capacity management in the hospitality
and tourism sectors and created a list of short-term approaches to capacity management, see
table 2.1. Capacity is categorised as physical and human, the human capacity being sub-
divided into labour and customers, the management approaches are described as being sources
of flexibility.

28
Physical Capacity
Physical Flexibility
Rent capacity
Share capacity
Hire sub-contractors
Change resource allocations
Change hours of operation
Provide off-site access
Use automation
Price / Segment Flexibility
Partition visitors (status & length of transaction)
Yield management
Revenue management
Human Capacity
Labour Flexibility
Schedule employees
Allow overtime
Allow idle time
Cross-train employees
Change work speed and process
Hire permanent employees
Lay-off employees
Use temporary employees
Use part-time employees
Visitor Flexibility
Allow waiting
Allow balking
Turn away visitors
Provide rewards or incentives
Provide diversions or complementary services
Camouflage the queue
Pay for VIP queues
Change level of visitor participation
Schedule visitors / take reservations
Inform / educate about alternative options
Table 2.1: Short-term capacity management approaches (Pullman & Rodgers, 2009).
Armistead and Clarke (1994; 6) define the role of capacity management as “the ability to
balance the demand from customers and the capability of the service delivery system to

29
satisfy demand”. Capacity management therefore involves the management of processes and
customer demand so that there is a balance between the ability of the organisation to supply
products and services and the demand for those products and services. The resources of the
organisation, such as facilities, labour and equipment, provide the processing capacity. When
supply exceeds demand some resources are idle or under-utilised and the organisation
perceives that it is losing money. When demand exceeds supply customers may be kept
waiting or turned away leading to a possible loss of profit and goodwill.
Service Load
Service variety
Variation in demand
Resource absorption per service
Demand Management
Capacity leakage
Labour-lateness/absenteeism
Quality failures
Scheduling losses
Labour underperformance
Change-overs
Capacity task
Priority setting
Bottleneck identification
Forecasting demand
Scheduling
Coping strategies
Controlling capacity
Service output,
e.g.
Calls per day
Guests per night
Served per hour
Resource capacity
Capacity depends on a
rate limiting resource,
e.g.
Labour hours
Equipment
Space
Materials
Figure 2.2: Capacity Management. Adapted from Armistead & Clarke (1994).

30
Table 2.2 interprets the key terms used in figure 2.2.
Capacity task Interpretation
Priority setting Where there are conflicting demands from customers decisions
need to be made about which customer is served first, for example,
does the employee answer the telephone or serve the customer in
front of them?
Bottleneck
identification
Identify and treat the rate limiting resource.
Forecasting demand Forecasting customer demand so that the necessary resources to
meet demand can be acquired and deployed.
Scheduling Smoothing demand by scheduling it, taking restaurant reservations
for example.
Coping strategies Strategies to implement in services as available capacity becomes
insufficient to meet demand in the time frame expected by
customers, or when demand is insufficient to keep capacity
utilised.
Controlling capacity Changing capacity in response to predicted and actual demand, i.e.
having spare or flexible capacity.
Table 2.2: Interpreting Armistead & Clarke’s capacity tasks.
A key concept of capacity management is that effective capacity is set by the rate limiting
resource (Armistead & Clark, 1994), the bottleneck. Resources are finite, for example the
number of tables in a restaurant, or the number of staff available. There will always be a
resource that limits the number of units that can be processed. If an improvement to capacity
is to be made then the bottleneck needs to be identified and treated (Anupindi et al, 2012).
Once one bottleneck has been treated another will become apparent. Available capacity is
also affected by service load and capacity leakage (see figure 2.2), these are sources of
variation and will be discussed in that section.

31
Four actions to increase capacity of a bottleneck are suggested by Anupindi et al (2012).
Firstly, the work content of each activity can be reduced. This reduces the load that each flow
unit places on the bottleneck resource by reducing the amount of time required. Secondly,
increase the processing resources, in batch processing this may mean replacing equipment (an
oven for example) with equipment that can process more flow units. Thirdly, if the batch size
can’t be increased then perhaps the number of processing resources can be increased,
additional labour for example. Finally, the scheduled availability of the resource could be
increased, by increasing the duration of the service period for example.
Capacity is volume over time therefore it also changes with process cycle time. Effective
capacity can be increased, with no change to resources making up capacity volume, by
reducing the process cycle time. Low cost airlines, such as Ryanair and Southwest Airlines,
are constantly trying to reduce turnaround time because it reduces the number of flights that
can be made (Slack et al, 2010); it is a change-over or resetting activity and as such it does not
add value. Process redesign involves mapping and analysing the process to identify activities
that can be eliminated or have their duration shortened (Mansar & Reijers, 2007). It may also
be possible to identify sequential processes that can either overlap or be carried out in parallel
(Anupindi et al, 2012; Mansar & Reijers, 2007). Lastly, it may be possible to move or
complete some tasks either before the flow units enter the process (pre-process) or after they
have left the process (post-process) (Anupindi et al, 2012).
If all waiting time is eliminated theoretical flow time remains (Anupindi et al, 2012). The
critical path in a process represents the activities that fix the duration of the process - if flow
time is to be reduced an activity on the critical path must be eliminated or have its duration

32
reduced. There are three broad approaches to reducing theoretical flow time (Anupinid et al,
2012):
1. Redesign the process to eliminate errors, remove activities that don’t add value and
find faster ways of working.
2. Move some activities so that they can be completed in parallel instead of serially.
3. Modify the product or product mix so that it requires less production time.
Ponsignon et al (2012) assembled a list of best practice design principles for processes (table
2.3 and figure 2.7) and argued that some principles are generic while others are dependent on
the context. As the goals of different processes may be different the most appropriate design
solution is one that best achieves the goals. The paucity of law like principles in operations is
not surprising, they are open social systems where a multitude of contextual variables make
exact prediction and control difficult (Sayer, 1992). Some principles can be applied to all
processes (Posignon et al, 2012) such as the identification and removal of activities that don’t
add value. These stem from the necessity rather than contextual conditions (Sayer, 1992), in
that, by necessity activity consumes time and the removal of an activity on the critical path
must necessarily reduce process duration. On the other hand the impact of the replacement of
staff by equipment, for example self-check-in, is more conditional on the customer having the
capability to use it and the unknown judgement of the experience by that customer. At best,
most of the time, conclusions can be drawn about tendencies rather than certainties.

33
Design practice Definition and illustration
Eliminate tasks Eliminate non-value adding tasks from a business
process (e.g. checks and verification tasks)
Automate task Replace employees with automated systems to execute
process tasks. For instance, implement automatic cashier
systems in supermarkets
Empower employees Give employees more decision-making authority. For
instance, allow sales staff to change the offering to
accommodate the needs of high-profile customers
Assign order to whole case
worker
Let one employee perform as many steps as possible for
single customer requests
Re-sequence tasks (i.e. optimise
process sequence)
Change the sequence of tasks. For instance, a retail bank
has moved credit scoring to the front end of the loan
application process
Make resources more specialised
or more generalist
Turn generalist employees into specialists or transform
specialised employees into generalists. For instance, at a
retail bank, specialist jobs such as credit scorer and
pricer were combined into a single position ‘deal
structurer’
Reduce customer contact Minimise the number of contact points between the
customer and the service provider. For instance, an
accounts payable process reduced from three customer
touchpoints to two
Table 2.3: Selected business process design principles derived from
best practices (Ponsignon et al, 2012).
Lean production, developed in the Toyota factories, is lean because it uses less of everything
(Womack et al, 2007), it aims for, though never achieves, continuously declining costs, zero
defects, zero inventories and endless variety. A key developer of lean thinking, Ohno,
presents the formula “Present capacity = work + waste” (1988; 19). By removing waste the
production capacity is increased without the necessity of additional transforming resources.
Ohno divides waste into two types, “not needed at all in doing the work”, and “No added
value but must be done under the present work conditions”, the types of waste are listed in
table 2.4. Slack (2010) (table 2.5) presents a list of seven types of waste.

34
Not needed at all in doing the work No added value but must be done under
present work conditions
Time on hand
Meaningless transport
Stockpiling of intermediate products
Changing hands
Transporting to a place other than the
destination
Walking over to another location to receive
parts
Removing wrappers from parts purchased
from subcontractors
Removing parts in small quantity from a
large pallet
Handling a push button already in position
Table 2.4: Examples of sources of waste (Ohno, 1988; 58).
The seven types of waste
Over-production. Producing more than is immediately needed by the next process in the
operation.
Waiting time. Equipment and labour waiting. Work-in-process waiting for the next stage
Transport. Moving items around the operation, including moving work-in-process.
Process. Perhaps the process can be eliminated.
Inventory. All inventory can be viewed as waste.
Motion. An operator may look busy but may not be adding value, perhaps the process can be
simplified.
Defectives. Items that need to be reworked or scrapped because they don’t meet quality
standards.
Table 2.5: The seven sources of waste identified by Toyota (Slack, 2010; 435).
Most of the waste types directly affect throughput time, for example, motion, transport,
waiting, rework, idleness, set-ups, unwrapping and quality defects. Inventory can affect
throughput time when first-in-first-out is in operation. Customers waiting for service, orders
on the board in the kitchen waiting for preparation and rooms waiting to be serviced can be
viewed as inventory. On occasions however jobs can be batched or prioritised, for example, it
may be possible to prepare several orders for a dish at the same time, and rooms do not have
to be serviced in a set sequence.

35
Some organisations may have customers whose choice is driven by product availability, and
the organisation may have high product variety and volatile demand. The key here is to be
flexible, responsive to changes in demand. Aitkins et al (2002) refer to this as being Agile
rather than being Lean, spare manufacturing inventory is required to cope with immediate and
volatile demand (Naylor et al, 1999; Aitkins et al, 2002). Customers are the inventory in this
study. Their arrival time is unpredictable and thus volatile, and they cannot be stored for any
length of time. The only other factor that can be used to cope with variability in the Process
Management Triangle is capacity.
In summary, systems have a capacity to contain a volume of flow units and a capacity to
process a certain number of flow units in a given time period. Capital capacity in the form of
facilities and equipment is largely fixed but spare and flexible physical capacity can be
designed into the operation. Labour capacity can be provided by employees and customers
and can be flexed over the short term in response to actual or predicted demand. Systems can
suffer a loss or leakage of capacity, effective capacity is what is actually available to the
system at a given time. Process duration and pace affect processing capacity. Identifying
activities that can be eliminated or shortened can enable an increase in processing capacity.
Flow units that have the capability to complete some of the process activities reduce the load
on system resources and enable them to cope with greater variations in demand.
36
2.5: CONCEPTUALISATION OF PROCESSES AND RESOURCES
Objects are defined by us by their physical separation, but they can also be seen as bundles of
processes. The use of an object is in what it does, in its properties; its properties are exhibited
within processes (events), they are exercised, or not, by the stimulation (or lack of) the powers
of other objects. All objects have arrived at their present state as a result of processes and
continue to be subject to processes.
“A process consists in an integrated series of connected developments unfolding in
conjoint coordination in line with a definite program. Processes are correlated with
occurrences or events: Processes always involve various events, and events exist
only in and through processes.
Processes develop over time. Even as there can be no instantaneous wail or drought,
so there can be no such thing as an instantaneous process. Processes will always
involve a variety of subordinate processes and events.” (Rescher, 1996:38)
Time moves in one direction (the eggs in an omelette can’t be uncooked and reconstructed).
Process time represents how long it takes for any particular interaction of powers to complete
the event or outcome defined by the process or describes how much chronological time has
passed before the present state of the process has been arrived at. Duration can be said to be
generated by the need of process to take time. Time is a property of process.

37
Rescher (1996) moves beyond the process view of operations to view everything as clusters
of actual and potential processes, “things simply are what they can do – or rather, what they
dispositionally can do and normally would do” (p47). Properties of objects represent
responses that are elicited by their interaction with other objects (clusters of processes).
The powers of entities such as resources are emergent (Sayer, 1992). It could be enough, for
example, to say that customer arrivals are stochastic, rather than get involved in a recursive
investigation of what led customers to arrive at different times, or their mental processes that
drive their decisions, or the biology of the brain that enables decision making to take place.
There are principles that hold, by necessity, across all processes because of the space that
objects occupy and the time that process requires. There is no such thing as an instantaneous
process, “a process is a coordinated group of changes in the complexion of reality, an
organized family of occurrences that are systematically linked to one another either casually
or functionally” (Rescher, 1996:38). Changes occur within processes and are as a result of the
powers and liabilities of objects, changes are sequential in the sense that one state is required
to exist before another can occur. Process is a way of conceptualising, cause and effect,
change and events, by necessity it consumes time.
The Oxford Reference Online defines process as follows:
“a series of actions or steps taken in order to achieve a particular end: military
operations could jeopardize the peace process. a natural series of changes: the

38
ageing process. a systematic series of mechanized or chemical operations that are
performed in order to produce something: the manufacturing process is relatively
simple. ‘a series of interdependent operations carried out by computer.’ [as modifier]
(Printing) relating to or denoting printing using ink in three colours (cyan, magenta,
and yellow) and black to produce a complete range of colour: process inks.”
("process, noun" Oxford Dictionary of English)
There are types of process, some of which involve human action, interaction and decision
making, such as the military operations example in the definition above, or business processes
as defined below. The other definitions of process are orientated around natural physical
principles; they are rooted in the mechanical, biological and chemical sciences. Physical
processes often feature as part of an activity or stage in a business process. In the above
definition the manufacturing process is cited as an example of mechanized or chemical
operations. However production can be viewed as part of a larger business process, for
example, order fulfilment. The fulfilment of a food order will require a series of actions
following a procedure that has been developed over time and perhaps written down.
Supervision or performance measurements may be in place to ensure that the procedure is
followed and thus the desired outcome attained. In response to the order an item, perhaps a
dish of food, needs to be manufactured and information about the order needs to be recorded,
perhaps by being processed on a computer. Thus a process can involve the transformation of
people (customers), information and materials.
An activity can also be conceptualised as an event and as such has causes and effects (Sayer,
1992), an event brings about, or causes, a change in another object. Activities require objects

39
to perform them. Some of these objects are transformed or consumed by the activities,
becoming an output; others remain and can be reused. The activities that are identified with
the production of an output can be conceptualised as a process, a process is therefore a series
of events with causes and effects. The cause may be physical in the sense of mechanical,
biological or chemical. It may also be the result of a human decision. This decision may be
driven by the innate tendency to follow social norms, or may be the result of the expression of
some other motivation. If reasons can be causes (Sayer, 1992), then mental states that are
used to justify reasons are also causes, for example, desires, needs and beliefs. Reasons can
be internal states that motivate action.
Lindsay et al (2003) and Vergidis (2008) explored literature for definitions of business
processes and conclude that there is no agreement on the precise definition of the concept.
Processes are not necessarily linear and do not always end in a material output. Generally
definitions indicate that processes are activities structured to achieve a goal. Vergidis (2008)
concludes that most definitions cite either Hammer and Champy or Davenport. Hammer and
Champy define processes as “a collection of activities that takes one or more kinds of input
and creates an output that is of value to the customer.” (Hammer & Champy, 1995; 35).
Davenport defines processes as “A set of logically related tasks performed to achieve a
defined business outcome.” (Davenport, 1990: 12). Later Davenport (2005) defines processes
as “simply how an organisation does its work – the set of activities it pursues to achieve a
particular objective for a particular customer, either internal or external” (p102). Palmberg
(2009) conducted a structured literature review to identify definitions and models of process
management; the search was eventually narrowed down to 77 articles. The various

40
definitions of process are distilled to “A horizontal sequence of activities that transforms an
input (need) to an output (result) to meet the needs of customers” (ibid: 208).
It is assumed that organisations are goal orientated in their activities (Davenport 1990),
perhaps it makes more sense to start with the goals and ask how work needs to be arranged in
order to arrive at the goals. Organisations exist for at least one purpose; a purpose can be
viewed as an intended output or outcome. The word output is more suited to describe
something tangible or easily measurable whereas the word outcome infers a change in state
that may not be tangible, such as satisfaction or a financial target. Outputs and outcomes do
not appear spontaneously, they are preceded by activities (procedures, tasks, routines)
designed to produce them, for the sake of brevity the word output will be used to refer to both
output and outcome.
If everything that exists is undergoing change, being transformed, in something described as a
process (Rescher, 1996), then it is a word that encompasses much. The concept needs
refining by the use of different or additional words, adding the word ‘business’ places the
term in the context of production and exchange but still leaves the researcher with something
vague that is supposed to give meaning to a very large variety of activities. The short
definitions of what a business process is do little more than boil down the great variety of
process manifestations to a few key characteristics. It is rather like settling on a definition of
technology only to reflect that the great variety of the nature of technology renders the
definition of little practical use. The components of a process and their properties, if planned,
will at least be required to have the capability to produce the required outcome. At least one
41
role of theory is conceptualisation (Sayer, 1992), the vague concept of ‘business process’ and
its relationship to throughput time needs to be explored.
2.5.1: Process as causal mechanism
Managers are supposed to be able to exercise some control over the resources and processes
of the organisation (Slack et al, 2010). The act of controlling must involve knowledge about
cause and effect. The manager looks into the future and predicts the likely behaviours of the
components of the process so that the desired outcome of the decision is achieved.
The effects that objects can exhibit are defined by the nature of that object - objects can be
tangible or intangible. The nature of an object includes the attributes that describe it and the
actions that it is able to perform. The effects that they do exhibit depend upon the nature of
the objects that interact with them (Sayer, 1992). Water, for example, can be used to cook an
egg but only when heat is applied to bring it to the boil for several minutes. The process may
have been initiated, or caused, in response to a human need but the execution utilises physical
properties of the objects to transform the state of the egg to the planned state. A discussion of
the nature of causation is contained in the methodology. Tangible objects that, by their
nature, are able to contribute to the construction of the planned output are pre-selected for the
process. A hotel reception area, for example, is conventionally used to check guests into and
out of the hotel. To the arriving guest it must be recognisable as such and contain the
equipment and materials necessary for the activities for which it is designed. Humans have

42
made use of the powers of natural objects and processes to create objects that they can utilise
for their satisfaction.
Humans can be regarded as physical objects that are general in design; that can be adapted for
more than one purpose. There is an important difference between physical objects and
humans; humans are conscious objects that have the ability to reflect on and make choices
about their behaviour (George & Bennett, 2005; Sayer, 1992). Organisations exist because of
this ability; they define rules and procedures and provide examples of desirable behaviours in
an attempt to channel behaviour so that it contributes to the achievement of the purpose of the
organisation (Sayer, 1992). Business processes need to be designed, directed and controlled
(Slack et al, 2009). Policies and procedures are developed to guide behaviour, but people
react with their subjective interpretation of ‘the world out there’ which may not be the same
as how the world ‘really’ is, or how another interprets it (Gilbert, 2007). Because of the
flexible design, heterogeneous knowledge, values and abilities and the reflective nature of
humans, exposure to the same stimuli may be followed by different analyses and different
conclusions. Thus the outcome of processes that involve human objects can be more variable
and be assessed subjectively by varying criteria.
To examine process speed it is insufficient just to look at the nature of the physical resources
and processes. Hotel processes frequently involve a sustained interaction between customers
and employees. Social interaction requires interpretation and negotiation of meaning and
reasons can be causes of events (Sayer, 1992). Employees are required to learn scripts and
procedures to follow, they are also expected to be flexible and adapt ‘on the fly’ to any
particular social situation. The customer is sometimes required to adapt their behaviour to the

43
particular procedures of the hotel. The control over the exact form of the product or service is
ultimately in the hands of the front-line employee and not in the control of the supervisor or
manager. The interaction between people is thus very different to the interaction between
materials and machines.
Fleetwood (2004) talks about causal configurations and describes them as “a cluster of causal
factors or components, which in this context (labour process theory) are, typically, social
structures, positioned practices, relations, rules, resources, and so on.”, further, “Causal
configurations are emergent phenomena. That is, when certain components are assembled,
they give rise to properties that are not found in any of the components.” (p48). Causal
configurations have a tendency or typical way of acting. A process can perhaps be regarded
as a causal configuration, an assembly of objects with their own powers that interact to create
a tendency for certain effects or events to occur. A goal of management is to manage the
configuration, and any interacting configurations, so that the effect or event (output and
outcome) of the tendency is as the organisation expects. Tendency implies probability rather
than certainty of outcome; managers seek to improve control to reduce the variability implied
in a tendency.
A process is thus a causal mechanism:
“… we define causal mechanisms as ultimately unobservable physical, social, or
psychological processes through which agents with causal capacities operate, but only
in specific contexts or conditions, to transfer energy, information, or matter to other

44
entities. In doing so the causal agent changes the affected entity’s characteristics,
capacities, or propensities in ways that persist until subsequent causal mechanisms act
upon it.”
(George & Bennett, 2005: 137)
If mechanisms are the events that link effects to cause (McAdam et al, 2008) and mechanisms
are a type of process then a process view of operations and an understanding of the concept of
causal mechanisms could be applied to explain the causes of throughput time.
If, as Punch (2005; 8) suggests, “the aim of social science is to build explanatory theory about
people and their behaviour”, then this research aims to explain how an organisation such as a
hotel can deliver products and services at a speed that satisfies customers. It is adopting an
operations and process view and as such is investigating how resources and processes can be
configured so that a causal link is created between that arrangement and the outcome of
satisfactory time duration from the customer’s viewpoint. The concept of causal mechanisms
appears to fit with the operations and process management view of the world.

45
2.5.2: Transformation model of process
The conventional way of presenting the role of processes in operations is by means of the
transformation diagram (Anupindi, 2012; Johnston et al, 2012; Slack et al, 2010). The input
objects are referred to as resources in operations management, objects of value to the
organisation. The activities of the process consume time and are referred to as a
transformation processes, transforming or converting the nature of resources. Figure 2.3
shows the basic transformation model in which inputs are transformed, or converted, by a
process to produce an output or outcome in the form of goods or services.
Figure 2.3: The transformation model. Based on Armistead et al (1995).
The transformation model includes resources transformed but not always consumed, such as
information, with each cycle of the process a copy of the information may be retained and
Transforming
Resources
Transformed Resources
Facilities
Equipment
Staff
Materials Customers
Information
Transformation Process Outputs/ Outcomes
Inputs

46
added to a record. It is clear, however, that even the transforming resources that appear intact
after they have carried out the transforming may have undergone some change themselves.
Transforming materials experience wear and tear and eventually need to be replaced.
Humans may gain knowledge from their experience enabling them to improve their
performance when they repeat the process.
Anupindi et al (2012: 3) adopt the same input-process-output sequence but list five elements
that characterise the transformation (see figure 2.4):
1. Inputs and outputs
2. Flow units
3. Network of activities and buffers
4. Resources
5. Information structure
The transformed resources are conceptualised as the inputs that flow into the process and are
the objects that the process is transforming. The transformed flow unit is the output. The
transformation process is referred to as a network of activities and buffers (work-in-process
inventories or queues). Resources (capital and labour) and the information structure equate
with the transforming resources. Conceptualising inputs as flow units triggers an analogy to
the behaviour of liquids.

47
Three categories of object are transformed; customer, material, and information (Armistead et
al, 1995; Morris and Johnston, 1987; Slack et al, 2009). Armistead provides examples of the
transformations that each category might undergo while Morris and Johnston (1987) argue
that what the process transforms can be an important source of variability that impacts upon
process duration. Anupindi et al (2012) categorise the transformed resources as flow units,
the items in the process and list them as orders, products, supplies, customers, projects and
cash. This categorisation can be regrouped to conform to the three categories, (see table 2.6).
Inputs Outputs
Goods
Services
Labor & Capital
Resources
Information structure
Flow units
(customers, data,
material, cash, etc.)
Process Management
Network of
Activities and Buffers
Figure 2.4: A process as a network of activities and buffers (Anupindi et al, 2012).

48
Type of
process
Flow unit Conversion & examples
Customer Customers Physical: Hairdressing
Location: Airline or rail travel
Physiological: Health care
Psychological: Entertainment
Material Products
Supplies
Physical: Steel strip into car bodies
Location: Postal delivery
Storage: Warehousing
Information Orders
Projects
Cash
Reconfiguration: Financial services
Location: Telecommunication
Storage: Records
Table 2.6: Examples of process type conversions (Armistead et al,
1995; Anupindi et al, 2012).
The figures showing processes summarise the categories of objects that comprise the process.
The objects shown, however, are really groups of objects of a certain type. Anupindi et al
(2012), for example, summarise resources as labour and capital but break capital down into
land, buildings, facilities, equipment, machines and information systems. Labour is
categorised by the roles of employees. Slack et al (2009) describe operational processes as
flows between resources consisting of people and facilities and reproduce the Armistead
model (figure 2.3)

49
Object Collection Object Object
Input Flow Units Customers
Materials
Information
Activities
(By time relationship to
the flow unit)
Pre-service encounter
Service encounter
Post-service encounter
Buffer Store
Queue
Resources
Capital Facilities
Layout
Equipment
Stock
Labour Employees
Customers
Knowledge Tacit
Explicit (concrete)
Information
Organisation Positions
Rules (policies)
Powers (control)
Culture
Table 2.7: Examples of objects.
Objects have properties. Table 2.7 lists examples of objects showing that something does not
have to be tangible to have properties and effects. The definition, from computer
programming, following splits these into attributes, such as size and colour, and methods as
actions that it can perform:
“A property is an attribute of an object or an aspect of its behaviour. …To change the
characteristics of an object, you change the values of its properties.

50
A method is an action that an object can perform. For example, just as a document
can be printed, the Document object has a PrintOut method. Methods often have
arguments that qualify how the action is performed
In most cases, methods are actions and properties are qualities. Using a method
causes something to happen to an object, while using a property returns information
about the object or it causes a quality about the object to change.”
http://msdn.microsoft.com/en-us/library/office/aa211958(v=office.11).aspx
The objects that take part in the process have properties. Some of these properties describe
the physical attributes of the object, such as size, age, origin or tangibility. Other properties
have the power to cause events, to bring about transformations in the process flow units. It is
through the identification of correlated events that a process is identified and “events exist
only in and through processes” (Rescher, 1996:38). A process is a series of events with
causal links. For practical purposes, events are caused by interaction with the properties of
another object. The power of a human to select and push a button on the computer keyboard,
for example, initiates (causes) a series of events within the machine. The events that that the
machine can cause depend upon the properties of the machine parts, for example, it may cause
a customer to be registered as the occupant of a specific bedroom. Human objects are
physical objects but they also think and feel. They tend to exercise certain properties but they
are heterogeneous and different individuals may exercise different properties in the same
circumstance.
51
In this view business processes are a series of events designed to produce a certain outcome.
The objects, or resources, used can be substituted for others as long as the substitute can act in
a way that produces the desired event or outcome.
Non-human objects are usually designed or pre-selected to be as uniform as possible.
Employees are preselected for their actual or potential abilities to exercise (or restrain) certain
powers in a controlled fashion. One of the properties of being human is the power to enter
into a contract with an organisation and agree to exercise some powers and not others.
Organisations have only limited control over the properties of customers and the properties
that they choose to exercise. Customers are therefore usually the greatest source of variability
in any process.
A key feature of processes that involve the customer is the variability that the customer brings
into the process (Chase, 1978, 1981; Morris & Johnston, 1987; Schmenner, 2004). The key
difference between managing services and manufacturing is the behaviour of the customer in
the system. Materials tend to have less variability than customers and thus production time
can usually be more easily controlled, conformance of a tangible product to a specification
can be checked before the customer becomes involved. The main material transformation
processes that directly affect customers in hotels are food and beverage production and room
servicing. Information can be held in a digital format on computers, by their nature
computers can process quickly and accurately (O’Connor, 2000). Often processes involve a
combination of process types, for example, the check-in process usually involves the
customer and information.

52
2.5.3: Process hierarchy
A process can be ‘exploded’ into more detailed descriptions of the components that comprise
it. Palmberg (2008) lists these in increasing level of detail as process, sub-process, activity
and task. A step or series of steps, such as seating a customer in the restaurant, might be
described as a task; this could be viewed as part of the general activity of restaurant service,
which itself could be viewed as a process consisting of sub-processes. The application of
these labels is subjective and the differentiation is only important when the terms are used in
conjunction with each other. Other words are also used to describe processes or parts of
processes, such as procedure and routine. Organisations often prepare Standard Operating
Procedures that describe the way in which a process is to be performed.
Armistead et al (1995) describe a similar four tier structure, or ‘process breakdown structure’
(p50); in levels of increasing detail these levels are process, process elements, element
activities and activity tasks. They attempt to be prescriptive about the application of the
terms; process refers to the main business processes (strategic, customer service, operations
flow and administration flow), process elements refer to the main activities of the
organisation, such as health and safety or managing materials. Activity tasks are assembled
into Standard Operating Procedures.

53
2.5.4: Process stages and customer contact
High customer contact services are inefficient because of the behaviour of customers (Chase,
1981, Schmenner, 2004). A process can be broken down into sub-processes or activities and
categorised as pre-process, in-process and post-process (Maister, 1985; Dubé et al, 1991;
Noone et al, 2008). Pre-process activities are generally categorised as the period after
customers have arrived but while they are waiting for service to start (Maister, 1985; Dubé et
al, 1991; Kimes, 2004; Noone, 2008). Anupindi et al (2012) suggest moving activities off the
critical path. Some activities required to complete the process may either not involve the flow
unit (e.g. the customer) or may not require the physical presence of the flow unit in the
system. Sometimes activities can be completed before the flow unit arrives to be processed or
after it has been processed. By identifying activities that can be completed without the
presence of the customer the time spent ‘in-process’ by the customer can be reduced. If the
arrival time of customers is variable then resources can be gainfully employed in pre-process
and post-process tasks while waiting for customers to process.
The in-process stage is characterised by the interaction between the flow unit and at least one
of the resources required for the process. If the resource and flow unit are human, service
literature frequently refers to this as a moment of truth or service encounter. The in-process
stage does not always need to be tightly bounded by time. Customers may be able to fill out
forms remotely at a time and of a duration that suits their needs.

54
2.5.5: Process as a capability (RBV)
The Resource Based View (RBV) argues that the selection and arrangement of resources can
result in capabilities that provide an advantage in the market. Resources consist of “all assets,
capabilities, organizational processes, firm attributes, information, knowledge, etc. controlled
by a firm that enable the firm to conceive of and implement strategies that improve its
efficiency and effectiveness” (Daft, 1983 cited in Barney, 1991:101). In other words a
resource is any entity that the organisation can use that has properties that help achieve its
performance objectives.
While a process can be viewed as a resource it is also the object that provides the recipe for
resource application, the routines that utilise resources to achieve desired outcomes (Peng et
al, 2008). The term ‘routine’ may be used to describe a process or a number of interrelated
processes. As capabilities arise from the nature of resources and processes the RBV is
compatible with a process view of organisations. The performance outcomes of a process
represent the expression of capabilities. Peng et al define a capability as “the strength or
proficiency of a bundle of interrelated routines for performing specific tasks” (2008; 734).
Klassen and Menor (2007:1030) propose that “strategic alignment between market and
process establishes the basis for the relative levels of capacity utilization, variability and
inventory. However, developing capabilities that reduce variability or increase flexibility are
necessary to make a corresponding reduction in inventory and improve responsiveness and
cost”. If a role of management and operations strategy is to align operations with market need

55
(Slack and Lewis, 2011) then it is important to configure resources and processes in a way
that satisfies the needs of customers, in this case, for appropriate throughput time.
2.5.6: Perspective on the process
The world is interpreted and conceptualised and the perspective that is held of a concept may
vary depending upon one’s point of view. The understanding of the nature of a process can
be influenced by the ontology of the researcher. Melão and Pidd (2000) provide four
classifications of business process ranging from a deterministic, positivist view as mechanical
closed systems through to an interpretivist view of processes as social constructs. Business
processes have a “mixed and conflicting nature. They have technical and social, tangible and
intangible, objective and subjective, qualitative and quantitative dimensions” (Melão and
Pidd, 2000: 123). Different processes are likely to fit more comfortably into different
classifications, Melão and Pidd, for example suggest that bureaucratic paper based and fast
food processes are largely deterministic and infer that many front and back office processes
are more like complex dynamic systems.

56
Figure 2.5: Business process views vs. paradigms (Melão & Pidd, 2000).
The greater the contribution of the customer to the creation of the output of the process the
less it can be deterministic, in other words, the more their needs and motivations shape the
progress of activities. The perspective on the process will vary with the reasons for the
actor’s involvement, reasons may be goals. The organisation may be pursuing goals of
efficiency by attempting to control the resources consumed by the process. The employee
may be motivated by the personal benefit gained, such as money, personal development or
just getting through the day so that they can go home. The customer may be motivated by the
desire to satisfy an emotion, or simply, for example, to get on an airplane as soon as possible
so that they can secure overhead locker space near their seat!
Deterministic Machines
Fixed sequence of well
defined activities
Emphasises efficiency
Interacting Feedback Loops
Flows of resources regulated by
policies
Information fed back to adjust
action to achieve goals
Dynamic Complex Systems
Open systems adapting to a changing environment.
Emphasises effectiveness
Social Constructs
A subjective view may not see work as a process.
Subjective (role based)
views on the desired
outcome of the activity.
Positivism Interpretivism
Managemen
t
57
The characteristics of the service being offered will shape the properties of the processes.
Schmenner (2004) argues that organisations have a tendency to seek increases in productivity
and that productivity increases with the speed by which units flow through the process. An
unchanging level of capital and labour resources can increase the number of flow units it
processes and be more productive by process time reduction. Throughput time variability
needs to be eliminated, it represents a waste that disrupts swift even flow causing delays and
reducing productivity. Schmenner (2004) argues that productivity falls with increased
variability in process flow “Throughput time is indicative of the waste in a process. The
longer the throughput time, the more likely waste of all types bogs down the swift flow of
materials.” (p335). The sources of waste are considered in a later section. Processes are
classified by their degree of time variability and the amount of customer interaction. The
interaction with staff is often referred to as the service encounter in services literature.
Generally the more opportunity the customer has to interact the more time they consume.
Hospitality operations are characterised by high fixed costs, as much as three quarters of total
cost (Kotas, 1999), the variable cost of any service is therefore low. The more customers that
a business processes the more flow units there are that can share the large fixed costs. As
long as average unit variable costs and price are not increased, by shortening process duration
the organisation can increase the number of customers that it processes in a given time period
and improve its contribution margin. The contribution margin represents what is left over
from the value of a sale once the variable costs have been removed. Essentially this is fixed
costs and profit. The more customers there are the more the fixed cost can be spread out
among them, the lower it becomes per transaction, as fixed cost per transaction decrease,
profit per transaction increases. Using existing fixed capacity to process more flow units

58
generates only variable costs. Thus organisations want to serve more customers with few or
no additional resources. Generally operations only have control over variable costs but by
processing more customers with the same (or lower) value of resources the operation reduces
the proportion of fixed costs per unit and contributes to productivity and profitability.
The service factory (see figure 2.6) is where encounters with customers are short and there is
little product customisation, fast food restaurants for example. An alternative is to give
customers control of customisation while still keeping service encounters brief, a buffet
restaurant for example. The key feature of both is allowing customers to choose how long
they take to consume the product while keeping encounters brief so that a greater volume of
Low
Low
Low
Low
High
High
High
Service
Factory Service
Shop
Mass
Service
Professional
Service
Degree of Variation
(Customisation for and interaction with customers)
Relative
Throughput Time
Compared with
others in the
industry. Increasing
importance of
managing time
perception
High
Figure 2.6: Classifying Services. Schmenner (2004).
59
customers can be served by each server. In some material processing systems, for example,
distilleries and dairies, physical capacity must be provided for materials to process
themselves. When customers are ‘self-processing’ sufficient physical capacity in the form of
space, furnishings, fittings and equipment needs to be provided to allow the customers to
dwell while they consume (process).
Parasuraman (2002) argues that quality suffers when this “producer-orientated” view of
productivity dominates. Services are experiences in which the customer co-creates
simultaneously with the producer (Vargo and Lusch, 2006). Customers input their own
resources such as time, effort and emotional energy. The producer can calculate the cost of
the input resources. The cost from the customer’s perspective is generally perceived and does
not have a constant objective value. Customers put a value on their time but this subjective
valuation varies between customers and the context of the wait. Processes in which the
customer participates are affected by customer behaviour. The differing needs and skills of
customers results in time variability in the duration of the activities of the process disrupting
smooth, even flow (Schmenner, 2004).
Interaction with customers and customisation of the service varies in degree between types of
operation. Schmenner (1986:23) defines high interaction as “where customers can actively
intervene in the service process, at will, often to demand additional service of a particular kind
or request that some aspects of service be deleted.” He defines high customisation (p24) as a
service that “will work to satisfy an individual’s particular, and perhaps full range, of personal
preferences. A physician typically gives a very individual customized service.” He then uses
food service operations to give an indication of degrees of customisation (table 2.8). The

60
labels given to the degrees of customisation and the actual categorisation is vague, clearly
Schmenner does not intend a rigid classification of levels of customisation or interaction.
Generally he seems to indicate that, at least in food service, higher customisation is
accompanied by higher interaction.
Degree of
customisation
Food service example
Low
Some
Even more
Next in line
Finally
KFC, McDonalds.
BurgerKing, Wendy’s.
Cafeterias.
Restaurants with salad bars that
have some waiter assistance.
Restaurants with extensive
waiter service.
Table 2.8: Examples of degrees of customisation (Schmenner, 1986)
By reducing customer process and waiting time or by moving towards the features of a
service factory the operation becomes more productive. Organisations are therefore more
likely to consider changes that achieve appropriate throughput times if those changes also
improve productivity.
The service classification by Schmenner can also be interpreted as operations adopting
different strategic positions. Ponsignon et al (2012) suggest that service operations are either
generally cost leaders or focused differentiators, key characteristics of processes differ
depending on the strategy. The appropriate process design principles for each strategy are
different, see figure 2.7. To avoid competing on cost an organisation needs sufficient
differentiation to attract a pool of customers, even within an organisation some processes will
have a cost focus while others will be there to provide a source of difference. Process is the

61
object that provides the recipe for resource application, the routines that utilise resources to
achieve desired outcomes (Peng et al, 2008). The term ‘routine’ may be used to describe a
process or a number of interrelated processes. As capabilities arise from the nature of
resources and processes the RBV is compatible with a process view of organisations. The
performance outcomes of a process represent the expression of capabilities. Peng et al define
a capability as “the strength or proficiency of a bundle of interrelated routines for performing
specific tasks” (2008; 734). Wu et al (2011) argue that generic principles such as the
universals in figure 2.7 cannot be a source of competitive advantage, whereas context
dependent operational capabilities are derived from organisational capabilities and can be rare
or unique. Generalised theory is extracted from the common points of contexts so may
exclude context specific factors. The grouping of businesses by strategy context is not helpful
when considering hotels where different design principles are applied to different processes
depending on the level of variability in customer inputs.

62
Figure 2.7: A contingency-based model for business process design in service organisations
(Ponsignon et al, 2012).
The reasons for involvement in a process and what participants want to get out of it are often
heterogeneous, perhaps even conflicting. If organisations are seeking productivity
improvements then, in processes that affect the customer, they need to think carefully about
what adds value for the customer. There is a need for there to be an alignment between the
planned outcomes of the process and the needs of those who pay for it, the customer. The
appropriate process design depends on the extent to which it needs to satisfy the goals of each
participant to achieve the performance objectives of the organisation.
COST LEADER
Standardised service concept
High volume of customers
Low variability in customer
inputs
Transaction-based relationship
Automate tasks
Use specialist
employees with a
low skill level
Reduce customer
contact
Transaction-
based
relationship
Empower
employees
Use generalist
employees with a
high skill level
Eliminate non-
value adding
tasks
Re-sequence
tasks FOCUS
Customised service concept
Low volume of customers
High variability in customer
inputs
Long-term customer
relationship
Context dependent Universal
Prof
essi
onal
Serv
ice
SERVICE STRATEGY CONTEXT BUSINESS PROCESS DESIGN PRINCIPLES
Compared with others in the industry.
Increasing importance of managing time
perception

63
2.5.7: Process Conceptualisation Summary
Theory is an attempt to organise, categorise or make sense of the way the world works. This
understanding enables humans to predict the effects of combinations of resources and actions;
it gives them the control that they seek.
Everything changes, everything is in process, properties of objects and the events triggered by
their interactions bring about change. Time can be said to be caused by process. At a more
practical level it is common to talk about operations and process management and to
conceptualise business processes as a particular type of ‘man made’ process. Man has created
the world today by predicting the links between cause and effect and designing routines to
follow that combine resources and activities that cause the effect desired.
Essentially a business process is a goal orientated configuration of resources and activities.
Beyond that it can be argued that there are many ways of conceptualising and classifying
processes. Essentially the goal of the process decides the nature of the resources and
activities, or vice versa! The management goal is to shape the processes and resources so that
they produce events that satisfy the needs of the market. They also need to balance customer
satisfaction with the need to control or reduce resource costs. What a process looks like
depends on what it is for and how ingenious the designer has been in finding ways to achieve
the sometimes competing goals of customer satisfaction and cost control.

64
2.6: VARIABILITY:
2.6.1: Introduction
The aim of this section is to discuss variability and its effect on throughput time. Time
variability in the production and delivery of goods and services can be caused by a number of
factors. Some of these causes can be found in the behaviour exhibited by the nature of the
resources and flow units, others in the activities that represent the processes. Where
uniformity of resource, activity or flow unit does not exist variability must exist. Generally
the less uniformity and predictability there is then the more variability there is. This section
will explore the types, sources and treatments for variability but will first discuss why
variability can be a problem.
The key difference between services and manufacturing lies in what is being transformed in
the process (Morris & Johnston, 1987; Frei, 2006), the flow unit. The amount of variability in
customer processing operations is higher than in information and material processing
operations (Morris & Johnston, 1987). Restaurants combine customer and material
processing (Jones et al, 2003). The front desk combines customer processing with
information processing. The more customer contact during a process the less is its potential
efficiency because of the variability that the customer introduces (Chase, 1981).
65
Vargo and Lusch (2006) argue that in services the customer is a co-creator and that service
only comes into being at the request of the customer. Customers are inherently variable so the
process needs to be capable of coping with the variability (Frei, 2006). Seddon (2005)
bemoans how customer service centres are driven by volume and duration targets rather than
the variety of time needs of customers. Variation is inherent in business systems (Seddon,
2005; Anupindi, 2012; Slack, 2010).
All systems contain some level of variability in process duration. This is especially true for
situations in which the customer is a co-producer. Quantitative queuing theory asserts that as
the capacity utilisation of a process increases, waiting time increases exponentially (Anupindi
et al, 2012; Slack et al, 2010; Suri, 2010). Suri (2010) suggests that manufacturing systems
should consider keeping their resource load to 75%, services experience more sources of
variability than manufacturing systems. In systems where variability is greater waiting times
start to rise at lower capacity utilisations (see figure 2.8). Armistead & Clark (1994) suggest
that in service industries managers do not monitor or recognise the onset of what they call ‘the
coping zone’. The key to obtaining a shallow curve and thus short in-process waiting times at
higher capacity utilisations is reducing in-process time variability. Because the curve is
exponential the application of modest additional resources, spare capacity, or capacity slack
can be used to absorb at least some of the variability (Ohno, 1988; Seddon, 2005).

66
Figure 2.8: Average queue time at different capacity utilisations and levels of variability in
arrival and processing times (Slack et al, 2010).
In systems that produce products and services in response to customer demand there is often
variability in the timing of that demand, it may be ‘lumpy’, the lunch time rush for example,
or afternoon check-in. In hospitality the customer is often present when the product or service
is ordered or may join a queue prior to ordering, patience is limited so queue time must be
kept short. During the process different customers may place different demands on the
resources available, one customer may have more questions to ask, or may not understand
instructions immediately; some customers will request only one course at a meal time, others
may request more; customers may eat at different speeds or dwell at the table for different
periods of time. The mix of products may also affect duration, for example, it is unlikely that
every dish on the menu requires equal preparation time, walk-in customers may require more
time at the front desk than those with reservations. Capacity can be viewed as representing
the resources available for processing (Anupindi et al, 2012; Slack et al, 2010).

67
Staff may also have different abilities that introduce time variability into the process. Staff
with superior training or more experience may be able to work faster or be able to carry more.
An experienced restaurant manager may be able to manage the flow of customers, for
example by encouraging guests to order or leave the table, or monitoring tables to ensure
service is being received.
2.6.2: Types of variability
Variability that leads to variations in throughput time is partly due to the behaviour of
customers and partly due to the system as a process (Bicheno, 2008). Customers are arriving
in a stochastic pattern hoping to enter a system to receive a product or service. The nature of
the product or service may require the involvement of customers and may allow them choices
as to how much service or product they consume, some will consume a lot others a little. The
amount consumed and the time constraints of the customer will influence duration. In such a
system entry to the system needs to be controlled and an amount of capacity slack is required
to absorb the variation. Even though the number of steps or stages of the process may be set,
each may be of a variable duration.
Time variability can also be caused by adverse events. These may take the form, for example,
of equipment breakdowns, staff absence, inaccurate orders or product quality failures. Some
time is consumed by addressing failure demand (Bicheno, 2008; Seddon, 2005), failure
demand represents a waste because it is time and additional resources spent correcting
mistakes (quality defects) made by the organisation.
68
Anupindi et al (2012: 241) identify two types of variability affecting production time:
“Normal variability is statistically predictable and includes both structural variability
and stochastic variability.
“Abnormal variability is unpredictable and disturbs the state of statistical equilibrium of the process by changing parameters of its distribution in an unexpected way.
Abnormal variability results from assignable or special causes that are externally
superimposed from time to time.”
Normal variability, as defined above by Anupindi, is something that operations managers
should drive to bring under control and reduce. It consists of “system causes” which are
factors beyond a worker’s control, such as seasonality and stochastic sources that arise from
chance. Abnormal variability can be due to an unpredictable but usually treatable cause such
as employee absenteeism, machine breakdown or sub-standard materials.
Suri (2010) identifies two types of variability, dysfunctional and strategic. Dysfunctional
variability is similar to the abnormal variability cited by Anupindi and “is caused by errors,
ineffective systems, and poor organisation. Examples of dysfunctional variability are:
rework, constantly changing priorities and due dates, and lumpy demand due to poor
interfaces between sales and customers” (p4). This type of variability should be eliminated.
Strategic variability however refers to variability that may supply a competitive advantage, for
example the ability to cope with unexpected changes in demand or the ability to offer the
customer more choice. Suri argues that the lean approach aims to eliminate all variability but
that organisations should discriminate and retain variability that delivers an advantage. Lean
(The Toyota Production System), however, as explained by Ohno (1988), is really only trying
to eliminate variability that generates waste. Suri and Ohno both recognise the value of

69
retaining spare production capacity to maintain flow when there is a variation in the arrival
volume or processing time of jobs.
Seddon (2005) argues that service processes experience much greater variety than
manufacturing processes because the customer is involved as a co-producer. Seddon takes his
inspiration from Ohno and the Toyota Production System and adapts principles of systems
thinking and system dynamics to services, specifically a form of service factory he calls the
service centre (call centre). He identifies two sources of variation, demand and flow.
Customer demand varies by type and frequency of type, flow refers to the capability of the
system to handle the demand. Seddon (p61) asserts that “by revealing variation we invite
questioning of its causes.”
The following sections will show that it is neither possible nor desirable for services to
achieve the reductions in variability sought by manufacturing. The low unit volume of
hospitality services also means that the costs of reducing and controlling some types of
variability may simply be too high.
2.6.3: Sources of variability
Customer-introduced variability and internal process variability are the two basic types of
variability (Bicheno, 2008). Internal variability is found in the activities and resources
(labour, equipment and materials) that the organisation brings to the process.

70
Variability affects throughput time and the level of effective capacity. Armistead and Clarke
(1994) (see figure 2.2) present a capacity management model and group variability by service
load and capacity leakage. The article does not explain in any detail what they mean by the
terms. Table 2.2 below interprets the terms to suit the nature of the study.
Service Load
Service variety The range of tasks or activities that may be
available, each of which may require
different resources from different locations.
Variation in demand Lumpy arrival patterns leading to variations
in capacity utilisation and possibly queues.
Variation in customer behaviour as suggested
by Frei (2006).
Resource absorption per
service
The nature of a service task or actions of the
customer that result in varying time
requirements for part or all of a process.
Demand management The effectiveness of any demand
management strategies in matching demand
with capacity.
Capacity Leakage
Labour lateness / absenteeism Insufficient labour resulting in reduced
effective capacity and perhaps bottlenecks.
Quality failures Imprecise equipment, substandard materials
or employee errors, perhaps due to lack of
training or insufficient operating procedures.
Scheduling losses Demand cannot be satisfied due to late
delivery or shortage of materials, equipment
shortages or breakdowns.
Labour underperformance Varying knowledge, motivation or capability
of the workforce.
Change-overs Capacity unavailable while it is prepared for
the next customer.
Table 2.9: Sources of variability affecting capacity.
Adapted from Armistead & Clarke (1994).

71
Sources of variability in table 2.3 can be grouped by source. Service variety (at least partly),
resource absorption per service and change-overs can be viewed as originating in the design
of the task, activity or process. All capacity leakage (including change-overs) can be viewed
as originating in the capacity resources. Variation in demand can be viewed as originating
with the customer. Demand variation can also result in varying demand for particular services
and varying resource absorption per service.
A distinction needs to be made between variety and variability. Variety refers to the range
products and services provided by the operation, each of which may consume varying
amounts of resources, including time. Customers may also demand a variable number of
products or services, a customer with fewer demands will occupy capacity for less time.
Some services are similar to the ‘all-you-can-eat’ buffet concept, where the organisation
places no limit on the number of requests at each service encounter or the number of times
that the customer can return to the service point. The variation due to variety is therefore
customer request variability. Where the variety on offer is sequential (this and that) rather
than parallel (either or) time will be added to the process.
Variety can be seen as a compensation for self-service. In exchange for doing some of the
work customers are rewarded with a wider variety of product choice and given more freedom
to consume.

72
Customers often take part in the process as a co-producer and are perhaps the source of the
greatest amount of variety and are the least controllable source. Frei (2006) identifies 5 types
of customer variability in service processes;
Arrival variability: Arrivals may follow a pattern but guests arrive when in suits them.
Request variability: Variation from the standard service or product and varying demand for the number of products or services.
Capability variability: Abilities of customers vary with knowledge, skill or physical ability. This is particularly important where the customer is a co-producer.
Effort variability: Different customers are willing to put in different amounts of effort as co-producers.
Subjective preference variability: Derives from a subjective opinion and valuation of
the different elements of a service.
The first four types identified by Frei have an impact on waiting and process times. Effort
variability refers to the amount of work that a customer is willing to do themselves and affects
their preference for service method, as some customers would rather wait to be served than do
the work themselves. This categorisation is helpful but, unless the customer is questioned, it
may be unclear whether an action is due to a preference not to exert effort or a lack of
capability. Likewise a preference to be served in a certain way may exhibit itself in an
increased number of requests.
If an appropriate throughput time is to be achieved and maintained an organisation needs to
consider how it is going to deal with variety and variation.

73
2.7: CONCEPTUAL FRAMEWORK
Figure 2.9 illustrates the causal links underlying the thesis. Variability in arrival and
processing time can be due to behaviours of the customer or the system, variability causes
variable demand for capacity. In order to cope with variable demand capacity must also vary,
either by addressing the volume of available capacity or the amount of time consumed by
operator activities. Over time the operator needs to select and develop tangible resources that
have the competences and capabilities to achieve the process objectives. There are limits to
the reduction of process duration, customer satisfaction must be maintained.

74
Figure 2.9: Key Causal links to achieve appropriate throughput time.
Variable
capacity
demand
Variable
arrival
times
Variable
process
duration
Customer Arrival
Schedule
Choice
Chance
Customer Request
Preference
Capability
Effort
System
Error
Information need
Task duration
Chance
Vary
capacity
Accommodate by
flexing resource volume
Facilities
Equipment
Labour
Materials
Reduce time duration of
operator’s activities
Average encounter
duration
Average variability in
encounter duration
Match capacity to demand by varying
capacity volume of the rate limiting resource:
Sufficient & dual-use capacity
Sufficient, flexible & self-service equipment
Cross-trained & time-flexible labour
Sufficient materials
Move tasks off the critical path
Eliminate non-value-adding tasks
Reduce duration of tasks
Do it right the first time
Give more work to customers
Work faster
Variability of
Modify to maintain satisfaction:
Customer retains choice and control
Opportunity for social interaction
Select and develop tangible resources to have
the competences and capabilities to achieve
process objectives
75
2.8: SUMMARY
This chapter has set out a view of the organisation as a system of interrelated activities and
processes through which objects flow and are transformed either by the resources of the
organisation or, if human, by themselves with the help of organisation resources. The arrival
times and processing times of flow units is not uniform resulting in uneven demands on
resources and processes. Theories have been discussed that suggest how activities and
resources may be configured to cope with this variability so that customers flow at a rate that
is appropriate to their desires or needs.

76
CHAPTER 3: METHODOLOGY
3.1: INTRODUCTION
The aim of this research was to explore what theory says about how resources and processes
can be configured to achieve appropriate throughput time or to quickly adapt to cope with
short term increases in demand and to investigate the actual tactics used in hotels. The review
of literature has emphasised the role of variability in affecting throughput time. To achieve
the aim it was necessary to visit hotels, observe processes, talk to employees and read internal
documents. This chapter will justify the use of the case study research strategy and consider
issues of validity, reliability and generalisability of findings.
Scientific research seeks “the causes of effects, events or phenomena” (Punch, 2005; 48). The
aims of social science are “the development of a ‘scientific’ objective, propositional
knowledge which provides a coherent description and explanation of the way the social world
is” (Sayer, 1992; 233). Explanations are incomplete and open to revision; the social objects
studied are constantly changing (Sayer, 1992). One way in which knowledge is developed is
through work (Sayer, 1992), human activity is the practical application of knowledge to
“transform, modify, move or manipulate any part of nature” (Sayer, 1992; 17). Humans learn
through doing, learning is a form of change. This research records some events and offers an
explanation for them through the lens of operations management theory. Perhaps the way
work is carried out can be explained by theory, or perhaps it has something to add to theory.

77
Punch (2005) argues that “the methods we use follow from the questions we seek to answer”
(p20), while Sayer (1992) says “what (method) is or isn’t appropriate can only be decided by
reference to judgements about the nature of the thing to be explained” (p232). The words
used in the research question suggest an approach, words such as ‘variables’ and ‘factors that
affect’ suggest a quantitative approach, whereas words such as ‘seek to understand’ and
‘explore a process’ suggest a qualitative approach. Punch argues that even when the question
is qualitative there may be occasions when researcher constructed measures, such as rating
scales, may have a role in the research. He advises that, a decision should be taken on a case
by case basis and suggests that a decision to reject the validity of all quantitative methods may
disadvantage the research. Sayer suggests that the nature of the objects means that social
sciences are studying systems that are not closed; single facets cannot be isolated and studied
under laboratory conditions. Social sciences are internal to the object that they are studying,
the subject of study usually involves people whose “causal powers are considerably more
diverse and changeable (even volatile) than those of non-human objects” (Sayer, 1992; 234).
Humans are self-interpreting and their actions are context dependent. Any explanation
therefore is incomplete and knowledge is constantly revisable.
This research seeks to explain events through retroduction. “Events are causally explained by
retroducing and confirming the existence of mechanisms, and in turn the existence of
mechanisms is explained by reference to the structure and constitution of the objects which
possess them” (Sayer, 1992; 235). The explanation for mechanisms is to be found in the
nature of the objects that produce the events or in the conditions created when the objects are
placed together. Events are outputs or outcomes of activity. Inputs have an effect on each
other and cause the event. Processes consume chronological time, the cycle time of the

78
process is dependent upon the time it takes for the constituent activities to be completed.
Changes to the number of serial activities and the duration of activities on the critical path
will therefore affect process cycle time. Arrival time and throughput time are variable in the
processes under investigation, generally customers arrive at a time that suits them and their
needs will affect the demands that they place on the system and the amount of time that they
remain in the system. Flexible capacity is required to absorb demand variation if the
customer is not to be kept waiting. The research aims to explain what hotels do with their
processes and capacity in order to maintain an acceptable throughput time for the customer.
Voss et al (2002) review the use of case studies in operations management research. They
point out that operations management addresses both the physical and human elements of the
organisation and proceed to assert that most research methods are quantitative,
acknowledging that the construction of theory based on quantitative data requires
interpretation (qualitative understanding). They suggest that case studies can have different
purposes; exploration to uncover areas for research; theory building in which key variables
and their linkages are identified; theory testing; and theory extension / refinement to better
structure theories in the light of results. Different research methods are suggested.
This chapter will argue that Critical Realism as expounded by mainly by Sayer (1992, 2000)
offers an interpretation of knowledge and reality that is appropriate for managers of
operations. Critical Realism also provides an underpinning and convincing justification for
the use of the case study method to contribute to an understanding of the causes of events.
Later the design and implementation of the case studies will be explained and justified.

79
Secondary research has expounded a particular view of the nature of business processes in
operations and highlighted the nature of hotel operations that involve the customer. The
causal mechanisms of process time have been explored and reported tactics for dealing with
variability to keep process time to an acceptable level have been identified. The role of
primary research is to investigate the extent to which theory can be observed in a particular
context. It seeks to explain practice in the light of theory discussed and suggest changes to
processes so that they better achieve time objectives.
3.2: KNOWLEDGE AND REALITY
A doctoral thesis is required to represent an original contribution to knowledge. Much time
and paper has been consumed in the discussion of the nature of both knowledge and reality.
This research seeks to answer a question situated at the operational end of a business
organisation, the point where the product or service is created by the practical application and
transformation of knowledge and resources. Something is produced through an interaction of
information, materials and customers with the capital and labour of the organisation. Any
claim to knowledge therefore is knowledge of a type that is useful to managers of operations,
useful in the sense that it informs them about ways in which they can organise their resources
and processes to improve efficiency and effectiveness.
Lundberg (2004) suggests that both managers and scientists are trying to understand how and
why something works or not. The main difference is that managers are interested in
pragmatic solutions that tell them what they need to do in order to achieve their goals,

80
whereas scientists are looking for descriptions of the world. A better theory is seen as one
which is based on more sophisticated frameworks, that is more nuanced and situation
dependent. It develops over time as the solutions it suggests are closer to the outcome that the
manager seeks. Cavaleri (2008) argues that much management theory is pragmatic, about
finding out what works best in practice, and that the influence of important management
thinkers, such as Deming can be traced back through Lewis and Dewey to the ideas of Charles
Sanders Peirce (1839-1914). According to Dewey (1916) Pierce considered that doubt creates
an uneasy state that stimulates enquiry so that we can return to our state about what we
believe to be true in the world. In a sense knowledge is what we believe, with some
justification, to be true about the world (Boisot & MacMillan, 2004) and, in management at
least, it is a belief that works when put into practice.
Knowledge can make a difference to the actions of an individual and is often expressed in
action (Tsoukas & Valdimirou, 2001). For organisations the knowledge of how to do
something so that a predetermined objective is achieved is useful knowledge. Tsoukas &
Valdimirou define organisational knowledge as “the capability members of an organization
have developed to draw distinctions in the process of carrying out their work, in particular
concrete contexts, by enacting sets of generalizations (propositional statements) whose
application depends upon historically evolved collective understandings and experiences” (p
983, authors’ italics). New knowledge is about learning to make sense of our perceptions
(Polanyi, 1962). Deeper insight and ever more sophisticated theoretical explanations of a
topic of interest advance the understanding of organisational knowledge (Tsoukas &
Valdimirou, 2001).
81
Knowledge can be thought of as a means of doing things in the world rather than as a
representation of the world (Sayer, 1992). Practically adequate knowledge “must generate
expectations about the world and about the results of our actions which are actually realized”
(Sayer, 1992; 69). Practical adequacy varies according to context. Better knowledge in the
context of operations is that which, when applied, results in a movement towards achieving or
exceeding the desired outcomes of the process. By identifying and explaining the necessary
and contingent connections between cause and effect this research will better explain how
managers can manipulate and control the system so that it delivers appropriate throughput
time.
What people believe to be real affects the way that they act. For business managers this is
more important than whether experiment can provide proof of the existence of a phenomenon,
“something is real if it has an effect or makes a difference” (Fleetwood & Ackroyd, 2004; 29).
There are different modes of reality, Fleetwood (in Fleetwood & Ackroyd, 2004) suggests that
there are at least four (see table 3.1). There are materially real objects that exist in the natural
world and would continue to do so even if humans were not here to experience them. These
objects have no intrinsic meaning but often humans attribute significance or meaning to them,
for example, different flowers have different social meanings in different societies.
Materially real objects are processed by humans and turned into artifactually real objects that
are conceptually mediated, these are the objects that have a purpose or use for us such as
tools, equipment, clothes and furniture. They exist in physical form but also have no intrinsic
meaning. Ideally real entities are defined as discursive; the language, symbols and theories
that humans use to represent and communicate their understanding of the world. Socially real
entities refer to social practices and structures, they have no material reality but they exist

82
independently of any individual. The delivery of products and services in hospitality involves
objects that fit all four descriptions of modes of reality. Material objects have powers and
liabilities that are almost entirely predictable and unchanging over time, though some natural
variation is present in the quality of raw materials and in the operation of equipment. People
impose meaning on and extract it from objects and situations, so service applies social
knowledge as well as technical knowledge.
Materially real The natural world of tangible objects.
Artifactually real Buildings, furnishings, fittings, equipment,
tangible flow units
Ideally real
(discursive
entities)
Communication, theory, explanation
Socially real Hotel, customer & server, subordinate &
supervisor, policies, objectives, laws, time
Table 3.1: Examples of modes of reality.
Meaning is inter-subjectively negotiated and changes over time, people are reflective and
heterogeneous in terms of their values, knowledge and ability. Experiences are often given
meaning and judgements are made about the degree of satisfaction with the experience. An
experience that has different meanings in different cultures or situations indicates that the
meaning is socially negotiated rather than derived from the physical nature of the person.
Services marketing literature tends to focus much more on how the processes and outcomes of
an organisation impact on the customer and their interpretation of the experience.
Observation is ‘conceptually saturated’ (Sayer, 1992). A world separate from human
experience exists, some of it is capable of being sensed but only a small part actually
83
perceived and conceived. Humans need to make sense of the world and this is done through
conceptual filters. Thus two people may receive the same sensations but interpret them
differently depending upon their conceptions of the world (Archer in Lawson et al, 2007). A
human resource manager, in other words, may pay attention to different information and
interpret a situation differently to an operations manager. Customers perceive service quality
and make judgements by comparing expectation with perception. Different customers have
developed different expectations based on their personal values, knowledge and previous
experiences. In addition different characters mean that different customers have different
levels of tolerance to variations in service quality (Wilson et al, 2008). Humans are reflective
and their course of action is not determined, empirical investigation uncovers tendencies
rather than certainties (Archer in Lawson et al, 2007).
3.3: RETRODUCTION
If humans waited for certainty before they acted then little action would take place. Thus
action is on the basis of either what is believed to be true or what is thought to be practically
adequate. Because the world is an open system few circumstances are identical and thus
when theories are applied the outcome may not always be as hoped or predicted. The more
that a system is open, the harder it is to predict the events that will be generated by the
interaction of the objects, thus, “The use of a recommended strategy does not guarantee the
achievement of a goal” (Simon, 1973; 474).

84
Retroduction (sometimes called abduction) can be traced back to the ideas of Charles Sanders
Peirce. “Induction is an inference from a sample to a whole, while abduction is an inference
from a body of data to an explaining hypothesis. … Induction is the method of testing
hypotheses, whereas abduction includes the method of discovering them” (Burks, 1946; 301).
Induction suggests that the more frequently events have been observed in the past the more
probable it is that they will occur together in the future (Bertilsson, 2004). Induction reflects
the natural tendency to assume that a conjunction of events will continue and that this is
sufficient in terms of an explanation. Probability, however, is just an expression of likelihood
and does not contain any explanation of causes. Risk management may talk about the
likelihood or probability of outcomes but suggests that it is the causes of the event that need
to be identified and treated (Lewis, 2003). Sayer (1992) defines retroduction as “The mode of
inference in which events are explained by postulating (and identifying) mechanisms which
are capable of producing them” (p107). The explanation for events is not found in the
frequency with which variables occur together but in the conditions created when the powers
and liabilities of objects come together. Management selects objects (resources) and creates
conditions (system of production) with the aim of controlling the outcome, or event.
Essentially retroduction works back from the event to identify the causal mechanisms and
conditions deriving from the interaction of the nature of the objects. Operations managers
also start from the desired outcomes and work backwards to make decisions about the
selection and configuration of resources that, in their understanding, will produce the desired
outcomes.
It is possible that an outcome can be achieved, or explained by different mechanisms,
especially in very complex open systems where the path of causality may be difficult to trace

85
(George & Bennett, 2005). This makes it very difficult to establish generalised laws in social
sciences. Business consultants and academics continue to offer differing and competing
solutions for businesses, each claiming to be a better explanation of how the organisation can
be changed to better achieve the strategic goals. The theories offered, however, are an
abstraction, a simplification to common features of the contexts from which they were
formulated. When these theories are then applied to a new context they may not work as
expected because social systems are more heterogeneous than the generalised theory
indicates. The exposure of systems to a large number of factors that are themselves not
immutable means that explanations offered may only achieve partial or temporary utility. At
the operations level the system is less open, exposed to fewer factors, outcomes of events are
closer in time and space to the mechanisms that generated them, causality is less
controversial.
What an object can or cannot do is dependent upon its nature. It is a necessary feature of the
object. What the object actually does is dependent upon how the nature of other objects
affects it. Sayer (1992) calls these latter conditions ‘contingent’. The front desk clerk in a
hotel has necessary powers (and liabilities) as a human being and is acting in an accepted role
that places limits and expectations on behaviour. The ability to take on that social role and
learn the competencies is a necessary feature of the person and the role. The role and the
learned behaviours are not expressed until a guest arrives, creating the conditions in which the
clerk’s powers are exercised. Taking an example from non-human objects, the oven by its
nature has the power to heat (and the liability to burn) and bread dough has the power to be
transformed by heat into bread (under the right conditions). Sayer (1992) expresses this in a
diagram (p109 and see table 3.2) as Object ‘X’ having structure ‘S’, necessarily possessing

86
causal powers (p) and liabilities (l), under specific conditions (c1) will produce event ‘e1’,
while conditions (c2) will produce event ‘e2’, etc. The causal powers are expressed as causal
mechanisms, or “ways-of-acting” (Sayer, 1992; 105).
Type ‘A’ tests
Causal (necessary) explanations
Type ‘B’ tests
Contingent explanations
Object Causal powers and
liabilities
Conditions (other
objects with powers
and liabilities)
Events
An object has a
certain structure
That necessarily
possesses named
causal powers
Which under
specific conditions
Will:
1. Not be activated
and hence
produce no
change
2. Produce this
change under
these conditions
3. Produce a
different change
under other
conditions
Table 3.2: Evaluation or testing of causal hypotheses (Sayer, 1992; 213).
The aim of retroduction is not to predict when an event will happen but to offer an
explanation of how it happens when it does (Sayer, 1992). Verification of a causal
explanation is to be achieved by identifying the objects, their properties and their ways of
working (mechanisms). Explanatory evaluation of events in social sciences can be easier than
in natural sciences because “we have ‘internal access’ through practice to many structures and
mechanisms, and reasons and beliefs similar to our own may function as causes. Transitive
verb causal explanations are particularly open to check. Much more difficult are causal
explanations in which it is claimed that reasons function as causes” (p214).

87
3.3.1: Causal mechanisms
Causal mechanism have been discussed at length in both sociology and political science
(McAdam et al, 2008) and mechanisms as explanation have “the same ontological dignity as
correlation” (p308). George and Bennett (2005) define causal mechanisms as:
“ultimately unobservable physical, social, or psychological processes through which
agents with causal capacities operate, but only in specific contexts or conditions, to
transfer energy, information, or matter to other entities. In so doing, the causal agent
changes the affected entity’s characteristics, capacities, or propensities in ways that
persist until subsequent causal mechanisms act upon it.” (p137)
The definition of processes offered by Palmberg (2009) as “A horizontal sequence of
activities that transforms an input (need) to an output (result) to meet the needs of customers”
(p208), and the observation by Armistead (1995) that processes utilise facilities, materials
information and people indicates that there is great similarity between the concept of a
business process and a causal mechanism. Mechanisms are the events that link effects to
cause (McAdam et al, 2008). The purpose of a business process is to effect change in a
planned and controlled way to achieve pre-determined outcomes. Business processes can be
viewed as causal mechanisms designed and managed to produce events with consequences
that achieve the planned outcomes.
88
Traditionally an aim of research has been to find the “causes of effects, events or phenomena”
(Punch, 2005: 48). Essentially the aim of this research is to explain throughput time. Sayer
(1992: 107) defines retroduction as a “mode of inference in which events are explained by
postulating (and identifying) mechanisms which are capable of producing them”. The
essential event is process duration. Bunge (2004: 203) asserts that “to explain is to exhibit or
assume a (lawful) mechanism. This is the process – whether causal, random or mixed – that
makes the system work the way it does”. The process is the mechanism that ‘transduces’ the
input into the output (Bunge, 2004: 201). Similarly McAdam et al (2008: 309) describe
mechanisms as “transforming events”. Anderson et al (2006: 103) assert that “mechanisms
explain how and/or why one thing leads to another”. Thus the activities that comprise a
process can be regarded as the mechanisms that explain how the input variable was
transformed.
The mechanisms are an expression of the powers of the objects involved. Successful baking,
for example, cannot take place without the power of an oven to generate heat to a chosen
temperature and maintain that temperature for a required duration. “We try to get beyond the
recognition that something produces some change to an understanding of what it is about the
object that enables it to do this” (Sayer 1992: 106). This research therefore attempts to
understand the nature of the objects that affect and effect process duration. To do this is to
assume something about the nature of reality and what constitutes knowledge (explanation).
Operations research is generally functional, publishing quantitative based studies that expose
correlations but do not investigate causal mechanisms. Quantitative tools such as correlation
expose the frequency with which two variables occur together but do not supply an

89
explanation. “mechanisms allow us to see beyond the surface-level description of a
phenomenon. If we observe two variables, X and Y and some association between them, we
know little more than that X and Y are correlated. Does X cause Y? Does Y cause X? Or are
we observing a spurious correlation between the two brought about by a third unobserved
variable, Z? Answering this question requires one to move beyond studying the X-Y
relationship to addressing the question of why and how the relationship occurs.” Anderson et
al (2006: 103).
For a process to be regarded as useful its parts must be assembled in a thoughtful way so that
it can be said that they cause, or generate, the desired output or outcome. It is this generative
interpretation of causation as explained by Sayer (1992) that is used to help explain events.
Transitive verbs provide causal descriptions, accounts of what generated change: for example,
‘the desk clerk checked in the customer’. Check-in is an action that represents a change in the
status of the customer from someone without position in the hotel to an in-house guest. The
causal power to execute the action is to be found in the structure of an object. An exercised
power or liability is called a mechanism (Sayer, 1992). The social positions of customer and
server need to be recognised and accepted by those in the situation. Society has negotiated
(and continuously renegotiates) the meaning of these roles and assigned an acceptable range
of behaviours to each. Thus social positions can express a range of powers that are necessary
to that role. The individual adopts different roles in different situations.
The mechanism is triggered by an event, such as a customer request for service. If the process
is to be controlled and predictable it is important to distinguish between the mechanisms
exhibited by necessity because of the nature of the objects and those generated by the

90
presence of other objects unique to the particular context or situation (Sayer, 1992). Non-
human objects have limited and identifiable powers. Generally in operations these objects
can be arranged and controlled to exhibit the desired powers in a predictable way. Humans
are much more complex and can behave or interact in undesired or unpredicted ways. The
range of possible contingent behaviours can make processes involving them much less
predictable.
The aim is not to arrive at an ‘objectively true for all time’ explanation of throughput time, a
set of principles that when applied will always deliver the required throughput time. The
nature of human action as being subject to free will precludes this. The aim is to suggest how
an understanding of the nature (powers) of objects and their ways of behaving (mechanisms)
can be applied practically to create conditions that suggest that the desired outcome will
occur. A view of knowledge is adopted that fits with the attitude of working managers, as
something that is practically adequate, until something even more adequate is suggested.
3.4: ABSTRACT AND CONCRETE: INTENSIVE AND EXTENSIVE
Abstract research studies structures and mechanisms while empirical generalisations are
established by seeking to identify regularities and common properties in a large number of
real life events. Concrete intensive research studies a small number of real life events and
uses retroduction to identify mechanisms and structures that explain the events (Sayer, 1992).
An abstraction “isolates in thought a one-sided or partial aspect of an object” (Sayer, 1992;
87). This research represents a partial view of the desirable outcomes of process performance
91
and in that sense it is abstracting from the concrete world. Appropriate waiting (or
throughput) time is just one process outcome sought by customers. In many circumstances
delays may be a minor irritation rather than a major factor in judgements of satisfaction. The
influences and properties of objects that deliver throughput time are “isolated in thought by
means of abstraction, as a first step towards conceptualising their combined effect” (ibid; 87).
Understanding concrete events involves deconstructing the concrete, examining it and
recombining it.
Abstractions help to distinguish between “’substantial’ relations of connection and interaction
and ‘formal’ relations of similarity or dissimilarity” (op cite; 88). Substantial relations here
indicate a material connection between objects where one object has a direct effect on another
or passes something between them, such as the customer passing information to the server.
Another form of relation is described above as necessary (internal) or contingent (external).
The relation between the role of customer and server is necessary because one depends on the
other. The role of server requires customers and customers require servers (generally). The
relation between customers is contingent. It is neither impossible nor necessary that, for any
particular customer, other customers exist. The relationship between customers can also be
either formal or substantial. Customer behaviour may have a direct effect on other customers
and thus have substantial relations, but when customers are analysed and put into market
segments their relationship is formal. Substantial relations, therefore, indicate a causal
relationship, but the powers expressed may derive either from the internal and necessary
nature of the object or from the contingent and external presence of powers of other
interacting objects.

92
The reason for considering relations is to answer questions such as “What does the existence
of this object (in this form) presuppose? Can it exist on its own as such? If not what else
must be present? What is it about the object that makes it do such and such” (op cite; 91).
Relations help identify whether causal mechanisms lie in the nature of the objects or the
contingent conditions created by the presence of other objects.

93
Intensive Extensive
Research question How does a process work in a
particular case or a small
number of cases?
What produces a certain change?
What did the agents actually do?
What are the regularities, common
patterns, distinguishing features of
a population?
How widely are certain
characteristics or processes
distributed or represented?
Relations Substantial relations of
connection
Formal relations of similarity
Type of group
studied
Causal groups Taxonomic groups
Type of account
produced
Causal explanation of the
production of certain objects or
events, though not necessarily
representative ones.
Descriptive representative
generalizations, lacking in
explanatory penetration.
Typical methods Study of individual agents in
their causal contexts, interactive
interviews, ethnography.
Qualitative analysis.
Large-scale survey of population
or representative sample, formal
questionnaires, standardized
interviews.
Statistical analysis.
Limitations Actual concrete patterns and
contingent relations are unlikely
to be representative, average, or
generalizable. Necessary
relations discovered will exist
wherever their relata are present,
e.g. causal powers of objects are
generalizable to other contexts
as they are necessary features of
these objects.
Although representative of a whole
population, they are unlikely to be
generalizable to other populations
at different times and places.
Problem of ecological fallacy in
making references about
individuals.
Limited explanatory power.
Appropriate tests Corroboration Replication
Table 3.3: Intensive and extensive research: a summary. (Sayer, 2000; 21).
Table 3.3 Summarises the differences between extensive and intensive research as adapted by
Sayer from the work of Harré. Discussions so far clearly indicate that the appropriate
approach to research here is intensive rather than extensive. This model indicates that causal
explanations are best established in social research by looking at a particular case or a small

94
number of cases, therefore the case research method will be used and a qualitative approach
will mainly be applied.
3.5: METHODS AND APPLICATION
3.5.1: Case research
The case study approach can be viewed as a research strategy (Eisenhardt, 1989; Verschuren,
2003; Yin, 2009; Punch, 2005; Easton, 2010). Verschuren (2003; 122) states that a research
strategy refers to “a coherent set of methods, techniques and procedures for generating and
analysing the research material as well as to the way the researcher looks at reality and
conceptually designs the research project”. Punch and Verschuren suggest that a case has a
holistic focus, looking at a case in its natural setting “aiming to preserve and understand the
wholeness and unity of the case” (Punch, 2005; 144). Yin (2009) is frequently cited in
articles about case study method, his book “Case study research: design and methods” was
first published in 1984. The preface to the 4th
edition, published in 2009, makes reference to
the ideas and contributions of numerous academics that have been incorporated into the text.
Although authors continue to cite and debate slight variations in the definition of what case
research is, Yin’s definition will be used here:

95
“A case study is an empirical enquiry that investigates a contemporary phenomenon
within its real-life context, especially when the boundaries between phenomena and
context are not clearly evident” (Yin, 2009; 18)
The key point is that a phenomenon, throughput time, is being examined within its real life
context, in this research the context is mid-market hotels in one part of the UK. Case studies
are particularly useful where contextual conditions may be pertinent to what is being studied
(Yin, 2003). This is in contrast to experiments which try to create a closed system in which
objects are isolated from ‘extraneous’ influences. Businesses operate open to many powers
and liabilities, examining events in context is clearly what this research intends to do, so it
seems that the case approach is a relevant strategy to adopt. Context “is vital for explanation”
(Sayer, 1992; 248) as it contains the objects that create the conditions that realise the events -
it may be the key to explaining why a particular event occurred.
Case studies have been used in operations management for a number of purposes and they
provide:
An understanding of the conditions under which theory is applicable (Stuart et al,
2002).
Evidence of causal relationships through direct observation (Stuart et al, 2002).
A critical means for examining time dependent relationships (Stuart et al, 2002).
The possibility of studying a problem in great detail (Easton, 2010).
Develop new ideas by working in close contact with multiple case studies (Voss et al,
2002).

96
Investigating explanatory ‘how’ and ‘why’ questions (Voss et al, 2002).
It is an all-encompassing method covering the logic of design, data collection
techniques and specific approaches to data analysis (Xiao & Smith, 2006).
A concern about case studies highlighted by Yin (2009; 14) is that “too many times, the case
study investigator has been sloppy, has not followed systematic procedures, or has allowed
equivocal evidence or biased views to influence the direction of the findings and
conclusions.” He suggests how four design tests (table 3.4) can be applied to judge the
quality of case study research. These will be discussed in the sections following.
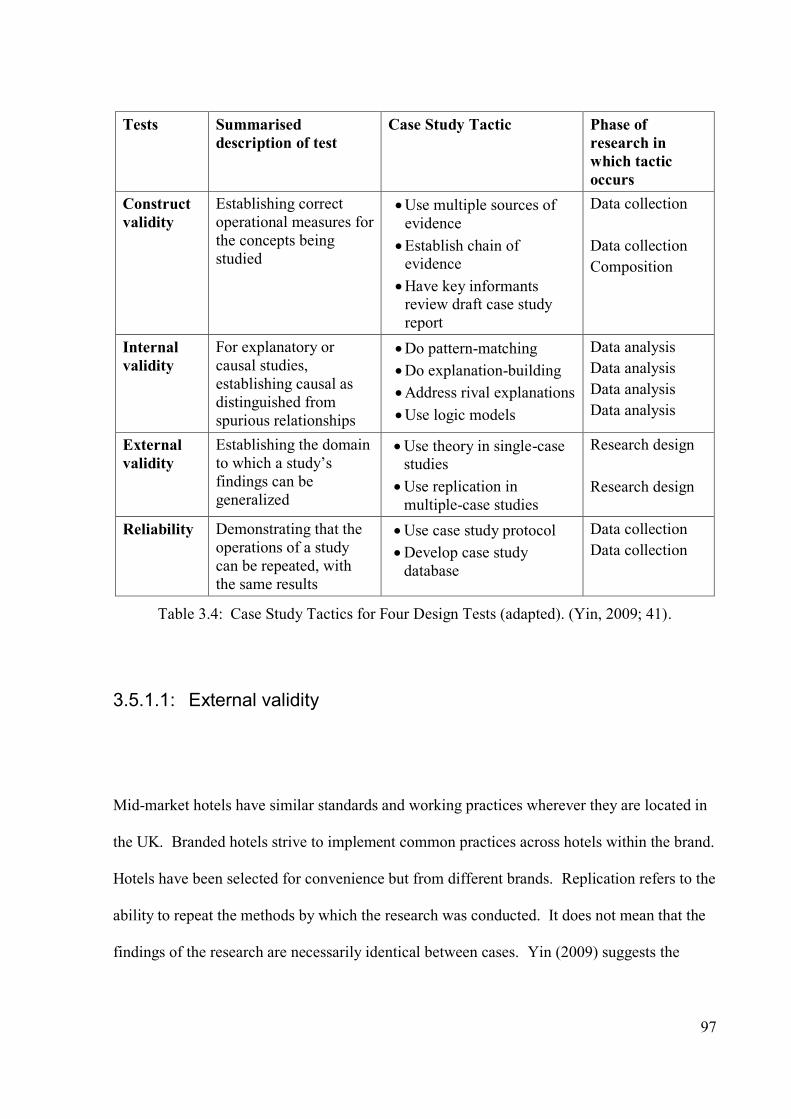
97
Tests Summarised
description of test
Case Study Tactic Phase of
research in
which tactic
occurs
Construct
validity
Establishing correct
operational measures for
the concepts being
studied
Use multiple sources of
evidence
Establish chain of evidence
Have key informants review draft case study
report
Data collection
Data collection
Composition
Internal
validity
For explanatory or
causal studies,
establishing causal as
distinguished from
spurious relationships
Do pattern-matching
Do explanation-building
Address rival explanations
Use logic models
Data analysis
Data analysis
Data analysis
Data analysis
External
validity
Establishing the domain
to which a study’s
findings can be
generalized
Use theory in single-case studies
Use replication in
multiple-case studies
Research design
Research design
Reliability Demonstrating that the
operations of a study
can be repeated, with
the same results
Use case study protocol
Develop case study
database
Data collection
Data collection
Table 3.4: Case Study Tactics for Four Design Tests (adapted). (Yin, 2009; 41).
3.5.1.1: External validity
Mid-market hotels have similar standards and working practices wherever they are located in
the UK. Branded hotels strive to implement common practices across hotels within the brand.
Hotels have been selected for convenience but from different brands. Replication refers to the
ability to repeat the methods by which the research was conducted. It does not mean that the
findings of the research are necessarily identical between cases. Yin (2009) suggests the

98
development of a research protocol that can be followed in each case, or used by other
researchers wanting to replicate the research.
One desired outcome of research is that the findings should produce some theory or
generalisations that can be applied to other similar cases or contexts. One frequent criticism
of cases studies is that the small number of cases studied means that the findings are not
generalisable (Verschuren, 2003; Yin, 2009). This criticism assumes that causation is
established by examining the frequency with which variables occur together. When causation
is viewed as being rooted in the necessary nature of the objects and their contingent relations
the need to examine large numbers of cases disappears. The goal of case studies is to “expand
and generalize theories (analytic generalization) and not to enumerate frequencies (statistical
generalization)” (Yin, 2009; 15).
Theory presents a simplified or abstracted view of situations, by seeking similarities and
regularities it must abandon some of the contextual conditions of open systems that may have
played a part in generating the outcome. “Abstraction seeks necessary relations, conditions
and properties and does not expect to find successful generalizations at the concrete level”
(Sayer, 1992; 239). Causal mechanisms often do not produce empirical regularities due to the
complexity of open systems. By their nature open systems are open to variability, a key
factor in affecting throughput time. The extent to which case findings may be similar or point
to generalities will depend partly therefore on exactly how open and complex the systems are.
A key goal of the research must be to distinguish between necessary (internal) relations and
contingent (external) relations.

99
The summary of intensive research in table 3.3 suggests corroboration rather than replication
as a test. Sayer (1992) describes this as a within-case activity of checking “with others in the
same institution to corroborate information about common practices” (p246). In this sense it
is more closely related to construct validity as described in table 3.4.
3.5.1.2: Construct validity and reliability
Construct validity and reliability are established largely through the collection and recording
of data. This refers to the choice of data, its collection method and how it is stored.
A case study protocol was used in preparation for and during data collection, it made explicit
what information was being collected and the procedures and rules that were to be followed
(Yin, 2009). The purpose of this was to improve the consistency with which multiple cases
were explored and allow a subsequent researcher to repeat the research. The protocol should
have the following sections (Yin, 2009; 81):
An overview of the case study project (project objectives and auspices, case study
issues and relevant readings about the topic being investigated.
Field procedures (presentation of credentials, access to the case study ‘sites’,
language pertaining to the protection of human subjects, sources of data, and
procedural reminders).

100
Case study questions (the specific questions that the case study investigator must
keep in mind in collecting data, ‘table shells’ for specific arrays of data, and the
potential sources of information for answering each question.
A guide for the case study report (outline, format for the data, use and presentation
of other documentation, and bibliographical information).
There are six sources of evidence for case research; documentation, archival records,
interviews, direct observations, participant observation and physical artefacts (Yin, 2009).
Documents, interviews and direct observation are used here. Documents recording objectives
and procedures represent a codified form of knowledge accessible to all. Tacit knowledge,
representing craft knowledge and experience, is not recorded and needs to be discovered
through questioning and observation. Direct observation of the processes is required to record
whether the documented and tacit knowledge is put into practice. In addition the observation
of practice may reveal tactics that were not revealed by documentation or interviews. Practice
needs to be observed to assess whether there is a causal link between and action or
arrangement of resources and throughput time.
A more detailed discussion of the data to be collected and a copy of the research protocol can
be found a little further on in this chapter.
101
3.5.1.3: Internal validity
Internal validity is established by the way in which data is analysed. It is of particular
concern in explanatory studies where an attempt is being made to identify causal relationships
(Yin, 2009). It is, therefore, of particular relevance for this research. Case study research is
time consuming so usually only a small number of cases are examined. A case can be valid
even if its findings cannot be generalised when internal validity is demonstrated by
persuasively arguing a causal connection (Sayer, 2000).
It is argued that the particular view of knowledge and reality discussed above provides a basis
for establishing internal validity. A process is an event that takes place over time, the
constituent parts are put together on the basis that they cause an effect that moves the process
towards achieving its objective. Patterns of cause and effect are established. Yin (2009)
suggests the use of an organizational-level logic model as an analytical technique. The logic
model “stipulates a complex chain of events over an extended period of time. The events are
staged in repeated cause-effect-cause-effect patterns, whereby a dependant variable (event) at
an earlier stage becomes the independent variable (causal event) for the next stage” (p149).
This is similar to process-tracing which “focuses on sequential processes within a particular
historical case, not on correlations of data across cases” (George & Bennett, 2005; 13). An
assumed property of reality is that time is unidirectional, prior decisions or events affect the
range of subsequent decisions or events that may occur. As a simple example, a fast-food
kitchen is designed to efficiently produce a certain type of food and could not be used
unchanged to regularly produce food of a Michelin star standard. A hotel designed for the

102
budget market could not be easily converted to a luxury hotel simply because of the bedroom
sizes.
The main focus for this research is day to day operations where the causal effect can generally
be observed immediately. Yin (2009) suggests explanation building as a suitable technique,
“To ‘explain’ a phenomenon is to stipulate a presumed set of causal links about it, or ‘how’ or
‘why’ something happened.” (p141). The findings of research are analysed using existing
theory about the nature of processes derived from peer reviewed publications and academic
publications from reputable and long established publishers.
The intensive approach to research suggests that corroboration is an appropriate test. Sayer
(1992; 246) describes an example of what he means by corroboration: “if an intensive study
of an institution were based on interviews we might want to check with others in the same
institution to corroborate information about common practices”. It was proposed that at least
four staff in each hotel and process would be interviewed; two customer servers, a supervisor
and the departmental manager. Unfortunately this number of staff was not always available.
Documents such as Standard Operating Procedures provide another form of corroboration.
They represent a codification of how the organisation thinks the processes should be carried
out in order to meet the performance aims. Conformance to standards is often assessed by
mystery customers and the level of conformance fed back to staff. It was found that Standard
Operating procedures sometimes did not exist or were generally not referred to in practice.
Looking back on the research experience, it can be seen that these documents were regarded
more as guidelines; actual service delivery needed to adapt to the needs of the situation and
customers present.

103
Different methods can reveal different perspectives on a phenomenon, “Indeed, different
methods can be seen to be necessary to reveal different aspects of the constituency of
phenomena, that is their ontic character, as structural, that is cause and effect, relations more
broadly. Thus, the concept of cause in Critical Realism is tied to emergence from the
interaction of human agency and institutions or structures. In this regard, the motivational (or
otherwise) dimension of agency needs to be elaborated, as well as the mechanisms that
facilitate action, or behaviour, coupled with the relational context of that behaviour. Each of
these components clearly requires different methods of analysis to reveal their nature and
action.” (Downward & Merriman, 2007; 91)
Examining more than one case provides the opportunity for cross-case analysis. Combining
cross-case and within-case analysis “greatly reduces the inferential errors that can arise from
using either method alone” (George & Bennett, 2005; 234). The identification of a causal link
in more than one case generally makes the argument for that link more persuasive, it is
another form of corroboration. It is important to remember that the corroboration is not
declared using principals of statistical frequency. Additional cases may also indicate that a
particular configuration of objects may not have a repeatable outcome. The interaction of the
powers of objects involved may be so complex that they never occur in the same mix,
sequence or strength. A general tendency rather than a specific outcome may be observed.

104
3.6: CASE DATA COLLECTED
A pilot case can help refine the research question and help establish the data collection needs
and methods (Yin, 2009). Geographical proximity and convenient access can be reasons for
case selection. A more prolonged and less structured process is likely as, perhaps, different
data and data collection methods are experimented with. Data is collected from a variety of
sources; documents, observation and interviews.
Two common processes in which customers are involved were examined, breakfast service
and check-in. Check-in is (at present) an administrative necessity. It is an exchange of
information and a formal transition of the person from an ‘outsider’ to a guest. Breakfast is,
hopefully, a more pleasurable experience and one involving more resources and more
variables. It includes tangible goods that must be consumed at the location. The check-out
process is not examined explicitly because it overlaps with the breakfast process and would
thus require the researcher to commit separate days to observe each process. Dinner service is
not observed because hotels contain a great variety of dinner service concepts, a variety
similar to that seen in the restaurant sector generally. There would therefore be little
justification for choosing hotels as a focus of study.
Table 3.5 shows the main factors investigated in the pilot study. These represent the major
factors that the researcher, prior to field research, believed affect service throughput in the
restaurant.

105
Pre-service
Facilities design and
layout
Capacity (volume over time)
Table size mix / flexibility
Layout of service point (all round access versus
against wall)
Service equipment Generally the use of technology to aid and speed
production or hold items
Acceptable processing capacity (e.g. toaster
speed)
Range of / purpose per service point (e.g. hot &
cold)
Materials Calculation for volumes of product
Policies for managing customisation and
variability of demand
Staff Evidence of training
Deciding numbers required
Task allocation
Activity Actions to influence demand (e.g. pricing,
advisory notices, room service, segregated
restaurants)
Organisation Service method (buffet or waiter)
Standard Operating Procedures
In-service
Facilities design &
layout
Control access
Re-set tables
Service equipment Monitor condition and queuing
Materials Monitor consumption and restock
Staff Supervisory roles & actions
Service staff roles & actions (specialisation versus
multiple)
Actions taken to speed throughput
Customers Variability in arrival
Accounting for variability in service time
Accounting for variability in dwell time
Activity Actions to mitigate actual and perceived waiting
time
Observations Evidence of waiting for service (entry, hot items,
drinks, toaster, restocking)
Table 3.5: Main breakfast service factors to examine.

106
Table 3.6 shows the main factors that the researcher believed affected throughput time at
check-in (out).
Pre-service
Facilities design and
layout
Capacity (volume over time)
Layout of service point
Service equipment In general the range and aims of technology
Types / purpose per service point (e.g. express,
self-check-out)
Equipment speed
Materials Calculation for volumes of customer
Staff Deciding numbers required
Task allocation
Evidence of training
Activity Actions to spread demand
Organisation Standard Operating Procedures
In-service
Facilities design &
layout
Queue management
Service equipment Number of steps and speed of operation
Materials Ensure availability
Staff Supervisory roles & actions
Service staff roles & actions (specialisation
versus multiple)
Evidence of task speed
Actions taken to speed throughput
Customers Variability in arrival
Accounting for variability in service time
Activity Actions to mitigate perceived waiting time
Observations Evidence of waiting for service
Table 3.6: Main check-in factors to examine.

107
3.6.1: Documents
Documents provide a record that does not depend upon the observations and recording ability
of the researcher. Table 3.7 lists the strengths and weaknesses of documents as a source of
evidence. The type of documents of interest here relate to those indicating performance
objectives, procedures and policies of the work place.
Strengths Weaknesses
Stable – can be viewed repeatedly
Unobtrusive – not created as a result of the
case study
Exact – contains exact names, references, and details of an event
Broad coverage – long span of time, many events, and many settings
Retrievability – can be difficult to find
Biased selectivity, if collection is
incomplete
Reporting bias – reflects (unknown) bias of author
Access – may be deliberately withheld
Table 3.7: Strengths and weaknesses of documentation. (Yin, 2009; 102).
The key documents were Standard Operating Procedures (SOPs). SOPs are expected to
contain instructions and guidance for pre-service and in-service actions. Documentary
evidence proved to be sparse.
3.6.2: Direct observation
Observational methods are underused in business and management research; there is too
much reliance on verbal information and quantitative data (Gummesson, 2007).

108
Observational research captures action but not motive (Gummesson, 2007). Interviews can be
used to uncover the reasoning behind the observed actions (Rundle-Thiele, 2009). Interviews
and documents can present the official position of the organisation while observation can
reveal the extent to which practice conforms to the official position (Graham, 1985). It is
action that affects the outcome of a process so it is this that must be observed and mapped.
Observation of professionals at work is common. Medical and educational professionals, for
example, are frequently observed to ensure that they are performing competently and
providing an acceptable quality of service. The role of the observer varies over a continuum
from covert (for example a mystery shopper) to participant (for example a doctor stepping in
to correct the work of a junior).
Knowledge does not always take a written form, craft knowledge, or ‘know-how’ can be
difficult to communicate in words and is often best communicated through demonstration
(Polanyi, 1962; Sayer, 1992). Attempting to uncover knowledge purely through documents
or questioning may not reveal craft knowledge. A person may even be unaware of that
knowledge (Sayer, 1992), or may regard it as common sense and not knowledge. Craft
knowledge can be observed.
There are two aspects to this observation. Firstly, the tangible objects that create the working
space need to be surveyed to make note of their physical capacity and arrangement as these
impact throughput time. Secondly, during service the actions of staff and customers that
affect actual and perceived throughput time need to be noticed and noted.

109
Strengths Weaknesses
Reality – covers events in real time
Contextual – covers context of ‘case’
Time-consuming
Selectivity – broad coverage difficult without team of observers
Reflexivity – event may proceed differently because it is being observed
Cost – hours needed by human observers
Table 3.8: Strengths and weaknesses of direct observation. (Yin, 2009; 102).
In spite of the weaknesses of observation given by Yin (2009) in table 3.8, it is an essential
requirement to attempt to observe the link between cause and effect and to corroborate the
statements made in interviews and documents (Graham, 1985). Delays need to be observed
and accounted for as do any actions taken to mitigate the situation. By focusing on only two
processes and limiting the number of organisations studied this research is being selective.
Service takes place over a time period and needs to be observed more than once in order to
establish a consistent link between cause and effect and mitigate against the tendency for
reflexivity. Three periods of observation of each process in action are made in each case and
include the busy service periods when delays in throughput time are most likely occur.
Observation methods can be divided into structured and unstructured. Structured observation
involves categorising actions and recording their frequency, or making other measurements
(Martinko and Gardner, 1985). It is largely positivistic and relies on statistical inference to
make conclusions. Unstructured observation required the researcher to enter the field with no
pre-determined theories or categorisation, the approach is to record everything. The
discussions so far clearly mark a highly structured or unstructured approach as inappropriate.
Statistical inference does not uncover causation and individuals cannot observe untainted by

110
theory. A key criticism of highly structured observation is that motivations for actions are
complex and cannot easily be fitted to a narrow range of categories (Martinko and Gardner,
1985). Observation can be a mixed method with quantities observed where appropriate.
Boote & Mathews (1999) conducted research that involved structured activities such as
carrying out pedestrian traffic counts and assessing location against a limited list of features,
later qualitative judgements were made as to the type of person eating in a restaurant.
Observation requires concentration on what is to be observed. In this case it is actions that
affect the actual or perceived waiting time of customers before or during service. Typically
these are actions that treat bottlenecks or shorten process duration for situations in which the
customer is waiting for an action or outcome. The speed with which the action is completed
and the effectiveness of the supervisory activities are both likely to impact throughput time.
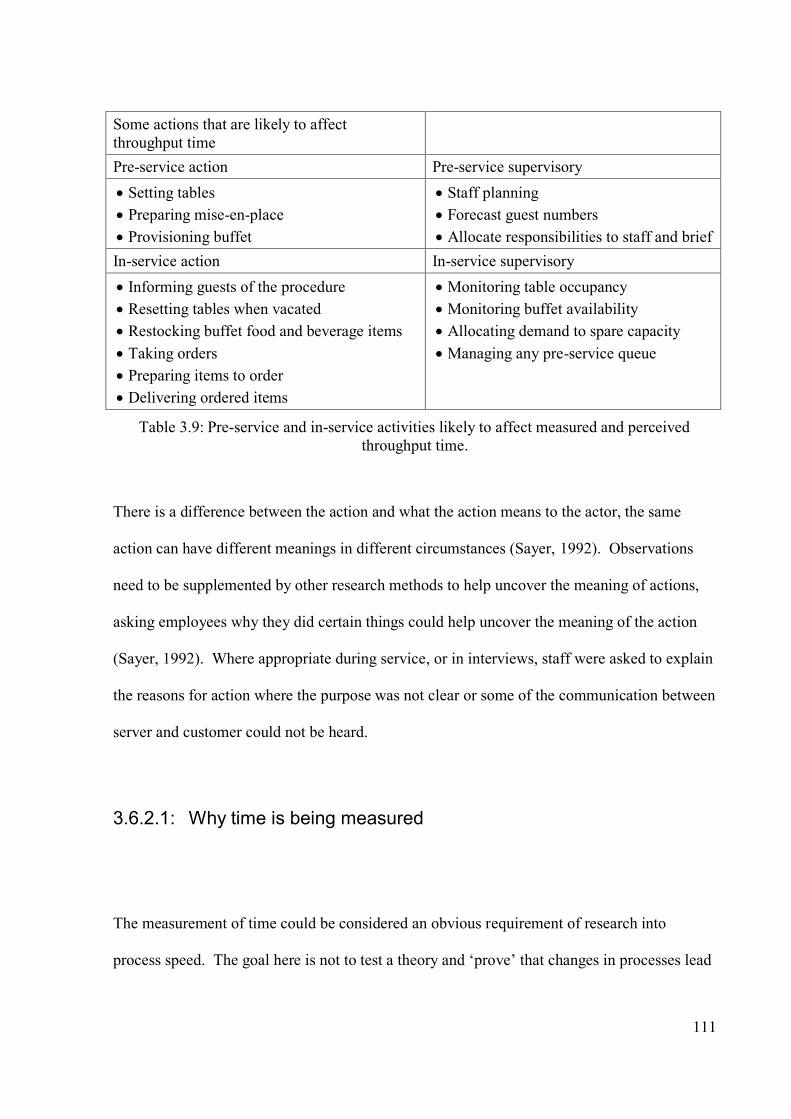
111
Some actions that are likely to affect
throughput time
Pre-service action Pre-service supervisory
Setting tables
Preparing mise-en-place
Provisioning buffet
Staff planning
Forecast guest numbers
Allocate responsibilities to staff and brief
In-service action In-service supervisory
Informing guests of the procedure
Resetting tables when vacated
Restocking buffet food and beverage items
Taking orders
Preparing items to order
Delivering ordered items
Monitoring table occupancy
Monitoring buffet availability
Allocating demand to spare capacity
Managing any pre-service queue
Table 3.9: Pre-service and in-service activities likely to affect measured and perceived
throughput time.
There is a difference between the action and what the action means to the actor, the same
action can have different meanings in different circumstances (Sayer, 1992). Observations
need to be supplemented by other research methods to help uncover the meaning of actions,
asking employees why they did certain things could help uncover the meaning of the action
(Sayer, 1992). Where appropriate during service, or in interviews, staff were asked to explain
the reasons for action where the purpose was not clear or some of the communication between
server and customer could not be heard.
3.6.2.1: Why time is being measured
The measurement of time could be considered an obvious requirement of research into
process speed. The goal here is not to test a theory and ‘prove’ that changes in processes lead

112
to a measureable reduction in process duration. The variability that the customer, as co-
producer, introduces into the system would make such time claims meaningless. The goal is
explanation of what, by its nature affects process duration. The question of by how much
time the process could be reduced is irrelevant. The reduction of waiting time and some of
the sources of variability will result in an improvement of throughput speed (Seddon, 2005).
The nature of hotels as service will always mean that, especially in food service, there will be
great variety in throughput time. Service duration is measured simply to build up a picture of
the extent of variability. The measurement of the extent of variability is an essential
consideration for arguments about how capacity can best be designed and managed to achieve
appropriate throughput time.
3.6.3: Interviews
The primary source of data in case research is structured interviews (Voss et al, 2002). Table
3.10 shows the main strengths and weaknesses of interviews. Bias and reflexivity is
addressed by interviewing a number of employees in different positions and identifying points
of agreement and disagreement. The questions relate to activities and problems faced
regularly in work so interviewee recall is not an issue. Key responses are written down so
that the researcher does not have to rely on recall.
Formal standardized questions used in extensive research are useful for taxonomic
comparisons but weak for researching causality (Sayer, 1992; p245). Less formal, less
standardized questions allow the interviewee to provide responses that are particularly

113
relevant to them, whereas preconceived questions can be adapted to suit the individual.
Interviews should be guided conversations (Yin, 2009). A consistent line of enquiry is
followed but in a conversational way. A friendly and non-threatening tone is recommended
by Yin (2009). Questions should be phrased as ‘how’ instead of ‘why’, as Yin claims that
‘why’ questions can make some interviewees defensive. Sayer (1992 seems to support Yin’s
approach by suggesting that “with a less formal, less standardised and more interactive kind
of interview, the researcher has a much better chance of learning from the respondents what
the different significances of circumstances are for them” (p245). Questions are used to seek
explanations for the observed actions, to encourage reflection and the expression of the tacit
knowledge of operational staff.
Strengths Weaknesses
Targeted – focuses directly on case study topics
Insightful – provides perceived causal
inferences and observations
Bias due to poorly articulated questions
Response bias
Inaccuracies due to poor recall
Reflexivity – interviewee gives what the interviewer wants to hear
Table 3.10: Strengths and weaknesses of interviews. (Yin, 2009; 102).
The responses expected from questioning were specific and short explanations that could
quickly and easily be noted by hand. Understanding was verified by repeating back key
responses to interviewees. The goal was to record their understanding of what affects
throughput time. Three levels of staff were interviewed, service delivery, supervisors and
departmental managers (where available). Service delivery staff were interviewed first
because they are more likely to raise questions that needed to be answered at a higher level.

114
Some questions were asked of all levels, others were be specific to the higher levels
depending upon the likely level at which decision responsibility lies.
3.7: CASE SELECTION
There is nothing to be gained by the search for and the selection of ‘ideal types’ for cases to
study (Sayer, 1992). It is unlikely that the ideal represents actuality any more than an average
represents and individual member of the population.
The hospitality industry has been practicing service for many generations and has well
established and recorded working practices and a mobile workforce. There was a great
similarity between organisations in the way that they achieved throughput time. There were
also company specific or contextual reasons for differences in practice. Variations in practice
suggest that there is more than one way of achieving the desired result or highlight reasons
why one organisation achieves a more appropriate throughput time than another.
3.8: PROCESS SELECTION
The desire was to investigate processes in which customers interacted with employees so that
customer and operator variability could be observed. All guests check-in and check-out and
many have breakfast. Available time for research was limited so a choice needed to be made
between observing check-out or breakfast as they occur at the same time. To enable the

115
researcher to contrast processes and to see if there were different types of and responses to
variability it was decided to focus on check-in and breakfast.
It was expected that frequent queuing would be observed at the front desk but there were no
expectations with regard to the extensiveness of process duration or request variability. It was
expected that breakfast service would experience
3.9: THE HOTELS
All the four star hotels investigated were located in the centre of Birmingham. Brief
descriptions of the hotels and the processes are given below.
3.9.1: Hotel A
The first hotel visited had over 300 rooms. Observations took place in July 2011, check-in
was observed on a Tuesday, Wednesday and Thursday. Breakfast was observed on a
Wednesday, Thursday and Sunday.

116
3.9.1.1: Hotel A Breakfast
In the morning guests would arrive at the ground floor in the lifts, to the right is the front
desk, to the left they see the restaurant, beyond the bar island. The ground floor had no
internal walls. Running down the centre of the restaurant were a set of circular seating
booths, this split the restaurant into two parts. The natural line of sight from the lifts drew
guests to enter where the greeting desk was located. Just past the restaurant entrance on the
left was the first breakfast service counter, the hot buffet. The next buffet was a cold counter
containing fruit, dairy and cold meats. Beyond that the final counter was for breads, toast and
cereals. Entrance and exit doors to the kitchen were located between buffet sections. The
restaurant had 136 covers laid on 55 tables (43x2, 11x4, 1x6).
The observer occupied a table from which the buffet and restaurant entrance could be
observed. The high backed fixed seating running down the centre of the restaurant meant that
only one half of the room could be observed.
3.9.1.2: Hotel A Front Desk
The hotel had a Concierge desk and a reception counter with five check-in desks. On most
occasions three or four staff were on duty. A large unfurnished area at the front desk merged
with seating which then became the bar, this adjoined the restaurant. The concierge desk was
just inside the front door and the front desk was adjoining it just a few paces inside and at a

117
right-angle to the main entrance. The lifts were located just beyond the front desk. There was
an office behind the front desk, activity in the foyer could be observed on a TV monitor.
Two observation sessions were made from a seat approximately five meters from the
reception, the third observation was made from behind the reception desk. The observer wore
a suit and tie throughout the observations and a badge stating that he was an observer.
On July 5th
observations took place from 3:50pm – 7:50pm. This was the first observation
period and was a little experimental. On July 6th
observations took place from the lobby
between 4:00pm and 8:00pm. The aim was to record queuing and service times for check-ins.
On July 7th
the observer was stationed behind reception to observe:
The variety of tasks undertaken by staff.
The variability in the check-in process due to labour or capital.
The variability in the check-in process due to customers.
Staff were observed for three hours from 4:00pm, occasional questions were asked to clarify
the tasks that they were engaged in.
3.9.2: Hotel B
Hotel B was a modern hotel with 211 bedrooms, observations took place in September 2011,
check-in was observed on a Tuesday, Wednesday and Thursday, breakfast on Wednesday,
Thursday and Sunday.

118
3.9.2.1: Hotel B: Breakfast
The restaurant had a narrow entrance at which guests were greeted and seated, a line of fixed
double sided seating ran down the centre of the room, it was punctuated twice to allow access.
Breakfast was served in the restaurant from 6.30am to 10.30am Monday to Friday, times
change slightly at weekends. The restaurant narrowed at the far end due to the shape of the
building, it was here that the buffet stations were located. There were three stations, the first
was for breads and cereals. Adjoining that was the hot buffet, there was space for a chef to
work behind the counter but, to save money, the station was unmanned. Beyond this and
behind a low wall was the cold buffet with juices, meats and dairy products. The restaurant
had 33 tables laid with 88 covers (1x1, 22x2, 9x4, 1x7).
There were three observation sessions, the Wednesday observation started at 6.00am and
finished at 9.30am. Service was observed form 6.30am to 9.30am on Thursday and from
7.30am to 11.00am on Sunday. The observer occupied a table near the buffet and recorded
arrival and departure times of a number of observable tables, 120 observations were recorded
over the three observation sessions. General observations were made about behaviour
observed that may affect speed of service.
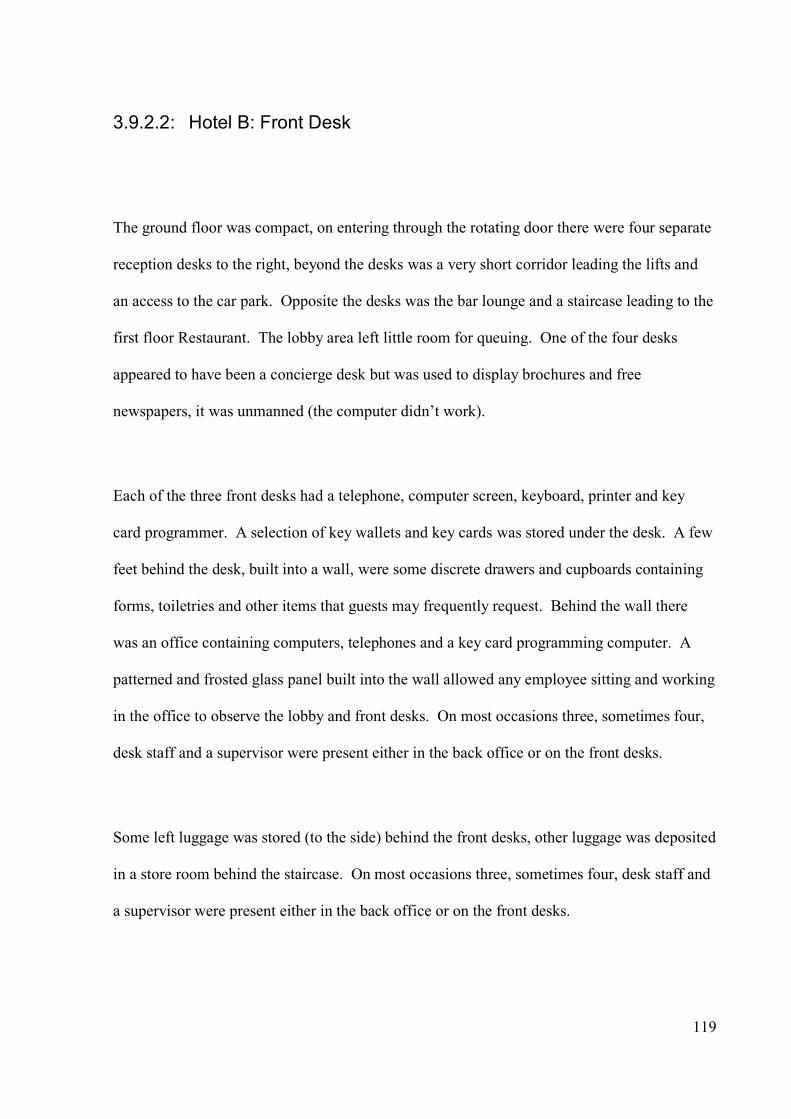
119
3.9.2.2: Hotel B: Front Desk
The ground floor was compact, on entering through the rotating door there were four separate
reception desks to the right, beyond the desks was a very short corridor leading the lifts and
an access to the car park. Opposite the desks was the bar lounge and a staircase leading to the
first floor Restaurant. The lobby area left little room for queuing. One of the four desks
appeared to have been a concierge desk but was used to display brochures and free
newspapers, it was unmanned (the computer didn’t work).
Each of the three front desks had a telephone, computer screen, keyboard, printer and key
card programmer. A selection of key wallets and key cards was stored under the desk. A few
feet behind the desk, built into a wall, were some discrete drawers and cupboards containing
forms, toiletries and other items that guests may frequently request. Behind the wall there
was an office containing computers, telephones and a key card programming computer. A
patterned and frosted glass panel built into the wall allowed any employee sitting and working
in the office to observe the lobby and front desks. On most occasions three, sometimes four,
desk staff and a supervisor were present either in the back office or on the front desks.
Some left luggage was stored (to the side) behind the front desks, other luggage was deposited
in a store room behind the staircase. On most occasions three, sometimes four, desk staff and
a supervisor were present either in the back office or on the front desks.

120
On the Tuesday the observation period ran from 15:50 to 19:50, on Wednesday from 16:00 to
19:40 and on Thursday from 15:45 to 19:36. On Tuesday and Thursday data was collected
about the duration of check-ins and sources of, mainly, customer variability. On Tuesday and
Thursday the observer sat on a stool behind the concierge desk. On Wednesday the stool was
placed close to one desk so that the actions and conversations at (mainly) that desk could be
heard and observed (see table below). On all days occasional questions were asked of desk
clerks to clarify why some check-ins seemed to be taking a long time. 100 observations of
check-in duration were recorded.
3.9.3: Hotel C
Hotel C was more of a boutique operation with 66 rooms, it had been converted from a late
nineteenth century hospital. The hotel also had a popular bistro and encouraged reservations
for dinner and breakfast from non-residents. Observations took place in November 2011,
check-in was observed on a Tuesday, Wednesday and Thursday, breakfast on a Wednesday,
Thursday and Friday. No additional useful observations had been recorded on the two
Sunday observations, so the third observation was changed to a more convenient day.
3.9.3.1: Hotel C: Breakfast
The cold buffet was located just inside the restaurant, orders were taken for hot food. There
were 20 paces and five steps between the kitchen and dining room. Two waiting staff were

121
assigned to bring cooked items from the kitchen and to clear tables while at least one member
of staff monitored arrivals and took orders. The restaurant was divided into two parts. It had
61 covers on 22 tables (15x2, 2x3, 4x4, 1x9). Only the two top tables were square and could
thus easily be joined to make bigger tables.
There were three observation sessions, the Wednesday observation started at 6.00am and
finished at 9.34am. Service was observed form 6.57am to 9.31am on Thursday and from
6.54am to 9.52am on Friday. There seemed to be a few later arrivals for Friday breakfast so
observation was extended until the guests departed. The observer occupied a table near the
buffet and recorded various timings. General observations were made about behaviour
observed that may affect speed of service.
The observer was able to record the arrival time of all guests entering the restaurant and the
departure time of the 11 tables in the most occupied section of the bistro. He also attempted
to note, as many times as possible, the time that hot food was ordered and then delivered to
each table. Observations were made of the arrival times of 105 tables, the duration of
breakfast on 78 tables and the order and delivery time of 46 tables.
3.9.3.2: Hotel C: Front Desk
The reception desk consisted of two stations. Bedrooms were given names and not numbers,
traditional keys were used, not key cards. There was no written check-in procedure. The

122
front of house manager was on duty for all three observations, she had worked in the hotel for
six and a half years, mostly on the front desk.
The front desk could be manned by up to two members of staff and was tucked under the
stairs a few yards inside the entrance. One porter had been cross-trained to check guests in
and out. Porters were always close by as the hotel offered a valet parking service. The bistro
style restaurant was just inside the entrance and next to the front desk. The observer was
seated only one metre from the desk so conversations could be heard and questions easily
asked.
Three periods of observation were carried out. On Tuesday November 15th
reception was
observed from 4.00pm to 7.44pm, on Wednesday November 16th
from 4.00pm to 7.33pm, and
on Thursday from 4.00pm to 7.30pm. 60 check-ins were observed, in all 647 minutes were
spent observing only 120 of which, or 18.5% of the time, were consumed by check-ins.
3.9.4: Hotel D
Hotel D had over 110 rooms and was opened as a hotel in the late nineteenth century, it was
very close to the main railway station. Apart from the foyer and lounge, the ground floor was
occupied by retail units. The restaurant was on the first floor. Observations took place in
March 2012, check-in was observed on Tuesday, Wednesday and Thursday, breakfast on
Tuesday, Wednesday and Friday. The manager did not want breakfast observations on the
Thursday as senior management of the company had been staying over.

123
3.9.4.1: Hotel D: Breakfast
The restaurant was located on the first floor and overlooked the main pedestrianised street in
the city centre. The room was plain with a high ceiling and wooden floor, this plainness
delivered an initial impression of a cafeteria rather than a hotel restaurant. There were 25
tables with 67 covers (17x2, 7x4, 1x5). A few additional bar tables had been laid for
breakfast in case the restaurant was full but this area could not be observed.
There were three observation sessions, the Tuesday observation started at 6.00am and finished
at 9.41am. Service was observed from 6.45am to 9.30am on Wednesday and from 6.54am to
9.33am on Friday. The observer occupied a table in the corner of the restaurant and recorded
various timings. General observations were made about behaviour observed that may affect
speed of service.
The observer was able to record the arrival and departure time of many, but not all, guests
entering the restaurant. He also attempted to note, as many times as possible, the time that hot
food was ordered and then delivered to each table. Over the three days observations were
made of the arrival and dwell duration times of 113 tables, and the hot food order and delivery
time of 61 tables. Some guests ordered hot food as they were being seated, the rest of the
time servers returned to the table after a few minutes to take the food order.

124
3.9.4.2: Hotel D: Front Desk
Two periods of observation were undertaken from a chair in the lobby and one from behind
the front desk. The time of arrival to check-in and the duration of check-in were recorded.
Notes were made of other observed reasons for guests to approach the desk. There were two
staff on duty, occasionally the general manager helped with check-in. The front desk was
observed from 15:50 to 19:10 on Tuesday, 15:40 to 19:30 on Wednesday and from 15:50 to
19:30 on Thursday.
A total of 68 check-ins were observed and timed. Apart from two check-ins all arrival times
and durations of check-ins were recorded.
3.10: METHOD IN THE FIELD
Each service in each hotel was observed for approximately three hours on three occasions. In
total 38 hours were spent observing breakfast and 44 hours observing the front desk; 284
check-in durations and 355 breakfast durations were recorded. A total of 19 staff were given
short interviews (see Appendix 1). To help triangulate the observations and interviews, the
researcher is also able to draw on 25 years of experience living and working in hotels,
lecturing on the subject, and personal experience of staying in hotels.

125
Contact with the hotel manager was made by email at least four weeks before the planned
date for research. The email outlined the aims of the research and the data that would be
collected (see Appendix 2). Four out of five hotels contacted agreed to take part. A meeting
was arranged with the manager and details discussed. A briefing sheet (See Appendix 3) was
provided which managers could use to brief staff if they so wished. On some occasions the
researcher was introduced to departmental heads or supervisors. A reminder was sent to
managers about a week before fieldwork commenced. On all occasions supervisory staff had
been briefed and were expecting the researcher.
After data had been gathered a report was prepared for each hotel providing findings and brief
analysis of quantitative and qualitative data (see Appendix 4). Managers were invited to
check the contents for factual errors and to send comments. No feedback was received.
Hotel A was originally intended as a pilot study, but the data gathered proved worthy for
inclusion in the study. The first day in each department in this hotel was rather experimental
and most of that data was discarded.
3.10.1: Breakfast Service Observations
To observe breakfast service the researcher chose and occupied a table from which the
entrance, buffet and a number of tables could be observed. It was not possible for a lone
observer to keep track of arrivals and durations of all tables. The aim was to get a picture of
the variability in arrival patterns and dwell times; the aim of the thesis does not require a

126
complete record of guest arrival and service durations. Dwell time was recorded from when
the guest(s) sat down at a table until the guest(s) rose to leave. Each table was given a code to
help the researcher remember which timing referred to which table. Guests who arrived
together were treated as one record unless they departed at different times. If a second or
additional guest joined they were given the same table code and, if necessary, a short
descriptor to enable the researcher to remember which guest arrived at which time. Only in
the smallest of the hotels was it possible for one researcher to record at least the arrival time
of all guests, even here some were seated out of sight and could not be monitored further (see
Appendix 5 for an example).
Accurate recording of timings was only one purpose of the fieldwork. It was also important
to observe behaviour of guests to account for varying dwell time. Activity consumes time and
it is mainly the activities of guests at the table that impact and determine the dwell duration,
just as their choice of when to take breakfast impacts the arrival time. One aim was also to
observe staff, to attempt to note whether any of their actions affected guest dwell time.
The first observation in each hotel started before the restaurant opened for breakfast service.
This was conducted in order to record any pre-service actions in the restaurant that may speed
service and to note any variation in the starting times of staff. Observations were limited to
front room operations, i.e. what guests could see; kitchen preparations and service were not
observed. Questions were, however, asked about kitchen practices that affect the availability
of food and the speed of service. Observation was terminated when the number of arrivals
dwindled, generally around 9.30am for all hotels.

127
3.10.2: Front Desk Observations
The aim here was to record check-in service durations and to note any causes for variation in
arrival time and service duration. Once observation started it quickly became clear that task
variety was a key feature of the front desk clerk’s job (see Appendix 6 for an example of a
data collection sheet).
In hotels A, B and D two sessions were spent observing from a chair in the foyer and one
session was spent behind the reception desk. In hotel C the researcher was behind the desk
with staff the whole time. In hotels A and B the session behind the desk involved shadowing
one employee. In hotels C and D only two clerks were working, so it was possible to observe
and interact with both throughout the session spent behind the desk. The observer wore a
badge with the UCB college logo and the word “observer” printed on it so that arriving guest
would know he was not a member of staff.
Where the researcher could not hear or see the cause of a time delay a note was made and a
question asked when the clerk was not occupied with a guest. Where the researcher could not
see or understand the task the clerk was engaged in, he asked. The list of causes of process
variability and the variety of tasks undertaken by clerks is limited to those observed. It is
certain that other tasks and causes do crop up that were not observed. However, the aim was
not to uncover an exhaustive list, but to demonstrate the existence of events and reasons that
can account for, or cause, the variability and to consider both their effect and how they might
be dealt with.

128
3.10.3: Field Research Summary
Yin (2009) acted as the main source of guidance in planning and implementing field research.
The application of case study field methods has been briefly discussed. The following chapter
will set out and discuss the main findings.
3.11: CHAPTER SUMMARY
This chapter started with a discussion of knowledge and causality and sought, briefly to argue
a certain view that seems to ‘make sense’ to someone with some years experience as a hotel
and business manager. The chapter then moved on to more practical matters by justifying the
case study approach as a tool for revealing useful knowledge. It concluded with a brief
description of the implementation of the research methods.
An aim of this thesis is to arrive at some practically adequate knowledge that managers can
apply to their operations. Future chapters try to make sense of the perceptions (Polanyi,
1962) noted to develop insight and ever more sophisticated explanations (Tsoukas &
Valdimirou, 2010) of the causes of throughput time. Causes at the operational level of
business can be discerned by the use of transitive verbs, reasons can also be causes of events.
Processes are causal mechanisms and evidence of causal relationships is sought through direct
observation (Stuart et al, 2002). Retroduction rather than induction is used to work back from
the event to the mechanisms capable of producing the event.

129
Managers try to understand the nature of objects and arrange them so that the outcomes of
their interaction lead to the desired event and outcome. Humans have a socially real world
that attaches meanings to physical objects and social encounters. Humans have the tendency
to act in certain ways (Archer in Lawson, 2007) rather than the certainty that can be observed
in physical objects. Service is created in response to human demand and the reasons for
actions can be said to be the cause. Human action that explains throughput time can therefore
said to be a cause.
The following chapters present the findings of the field research and offer an interpretation as
to the causes of throughput time. These causes can be found in the necessary behaviour of
physical objects (including humans as physical objects) and in the actions observed and the
reasons proposed.

130
CHAPTER 4: FINDINGS
4.1: INTRODUCTION
The aim of the thesis is to explore what theory says about how resources and processes can be
configured to achieve appropriate throughput time or to quickly adapt to cope with short-term
increases in demand and to investigate the actual tactics used in hotels. This chapter will
present evidence for the extent of variability in arrival and processing times and observations
of reasons for variability. This chapter will, firstly, present quantitative findings illustrating
the observed extent of arrival and duration variability and discuss the implications of this for
maintaining appropriate throughput time. Observed causes of variability will be grouped as
customer or system variability and the impact of variability on throughput time analysed. The
extent to which observed properties of resources and processes resulted in appropriate
throughput time are discussed.
The basic causal links and line of argument is illustrated in figure 2.9. Variability in arrival
times and process duration result in variable demand for capacity. If appropriate throughput
time is to be maintained capacity needs to be adjusted in anticipation of, or in response to,
varying demand. Physical demand is accommodated by flexing physical capacity. The
capacity to process customers is improved by reducing the number and duration of tasks and
encounters required of employees. The amount of time that customers occupy physical
capacity (labour and capital) is reduced or capacity in the form of capital (facilities and
131
equipment) is provided to accommodate customers and allow them to carry out some of the
tasks themselves. This line of argument is supported with data from primary and secondary
research. The particular customer-focused context requires that generalised solutions need to
be modified.
4.2: QUANTITATIVE FINDINGS OF ARRIVAL AND DURATION:
BREAKFAST
This section presents and analyses the quantitative data collected for breakfast service.
Across the four hotels 355 observations were recorded for breakfast dwell duration including
107 for hot food order to delivery time. It needs to be remembered that quantitative data was
collected to get an impression of the extent of time variability, the primary source of relevant
data is qualitative. Resources were not available to record every arrival, duration and
departure. It is likely that a greater proportion of early and late arriving guests had timings
recorded; at peak time it was simply not possible for a one researcher to record everything.
Given that the data is therefore incomplete more detailed analysis would not provide any valid
or useful additional information.
The arrival times of all breakfast guests were recorded only in hotel C, which was small
enough to note every arrival (see table 4.1). Observations of table occupancy support the
finding that, on most occasions, there are a few early arrivals for breakfast; that arrival
frequency increases towards the middle of breakfast service and, at least on weekdays, tends
to start to decline at around 8.30am.

132
Figure 4.1: Frequency chart for breakfast arrival times in hotel C.
The impact of arrival times on the capacity to serve can be illustrated by the following three
examples. On the first day in hotel D 94 guests were expected for breakfast; on the second
day 116 were expected. At one time on the first day the restaurant was nearly full and the
researcher was expecting to be asked to vacate the table. On the second day more guests were
expected but the restaurant was never more than two-thirds full.
The following observation was made during Sunday breakfast service in hotel A. At 8.25am
the restaurant was judged to be approximately half full, falling to about one-third full at
8.50am. Shortly after 9.15am the arrival rate picked up. By 9.30am the rate at which staff
0
2
4
6
8
10
12
14
16F
requen
cy o
f ar
rival
s
Customer arrival time for breakfast in hotel C

133
could reset tables was starting to limit the table choice of arriving customers. By 9.40am
customers were occupying tables that had been cleared but not reset. A few customers were
starting to leave their seats to find staff and make requests. At 9.40am the researcher could
see only one or two empty (but not reset) tables and a number of guests arriving, so he left the
table to observe from outside the restaurant. From approximately 9.40am until 10.20am the
staff struggled to cope with a full restaurant. Customer queues for entry were minimal with
waits of one or two minutes.
The following observation was made in hotel B. No queuing was observed and the restaurant
was never more than three-quarters full. On weekdays the numbers in the restaurant started to
increase shortly after 7.00am and began to decline around 8.15am. On Sunday 70 guests
staying as a group ate breakfast at 7.00am. When the observer arrived at 7.30am there were
18 guests in the restaurant. From 9.15am to 11.00am there were between 20 and 30 guests in
the restaurant at any one time.
These three examples clearly illustrate that, while there may be a period during which arrivals
peak, this and the spread of arrivals can vary from day to day. The total number of customers
expected is neither a good indication of whether there will be a time when all tables are
occupied nor of the number of staff required to cope with demand at any particular time
during service. Breakfast staff in hotels A and C commented that there were occasions when
many customers arrive at the same time. The researcher’s personal experience of managing
and staying in hotels is that on Sundays, for example, guests like to lie in and eat breakfast
towards the end of the service period, frequently leading to queues for tables. Hotels A and B

134
were observed on Sundays and this pattern was not observed. This is another indication that
there are no set patterns of arrival, only tendencies.
Dwell duration is also variable. While figure 4.1 records arrival times it does not show dwell
duration or departure times. Arrival time is not a reliable indicator of how many tables will
be occupied in, say, 25 minutes time because dwell duration is also highly variable. A final
observation is that it is not possible to predict the number of seats that will be occupied on
each table, which is discussed in greater detail in a later section. People, unlike material
objects, have a sense of personal space and are usually reluctant to share a table with someone
that they do not know. There can be occasions where there are many empty seats in a
restaurant but no spare tables.
Table 4.1 shows the key observed breakfast duration statistics.
A B C D All
Mean 00:22:57 00:26:26 00:30:01 00:26:33 00:26:44
Median 00:23:00 00:24:10 00:26:23 00:24:30 00:24:30
Standard
Deviation 00:09:47 00:12:12 00:13:15 00:10:58 00:11:52
coefficient
of variation 42.63% 46.11% 44.13% 41.29% 44.40%
Minimum 00:08:00 00:06:47 00:06:10 00:07:00 00:06:10
Maximum 00:47:00 01:03:15 01:04:25 01:04:00 01:04:25
Range 00:39:00 00:56:28 00:58:15 00:57:00 00:58:15
Table 4.1: Key observed breakfast duration statistics.

135
The difference between the mean and the median indicates a skew in the data. The median
figure is a better representation of the duration of the ‘typical’ customer as it is around this
point that most observations are recorded. The standard deviation is an indication of the
average deviation from the mean. The coefficient of variation is an expression of the standard
deviation as a proportion of the mean. A proportional figure communicates the extent of
variation more clearly. Figure 4.2 displays the breakfast durations as a scatter chart and is
overlaid with lines showing the mean and one standard deviation either side of the mean. In a
normal distribution around 67% of observations would be expected to fall within one standard
deviation of the mean, here 73% of observations do. As a rough guide managers could
assume that around three quarters of guests will spend between 15 and 40 minutes eating
breakfast. Perhaps more usefully observations revealed that half of all guest occupied tables
for less than 25 minutes and 90% of guests left within 45 minutes (see table 4.2).

136
Figure 4.2: Scatter chart of breakfast durations overlaid with lines showing the mean and one
standard deviation.
00:00:00
00:07:12
00:14:24
00:21:36
00:28:48
00:36:00
00:43:12
00:50:24
00:57:36
01:04:48
01:12:00
0 50 100 150 200 250 300 350
Bre
akfa
st d
wel
l dura
tion
Sequential observations
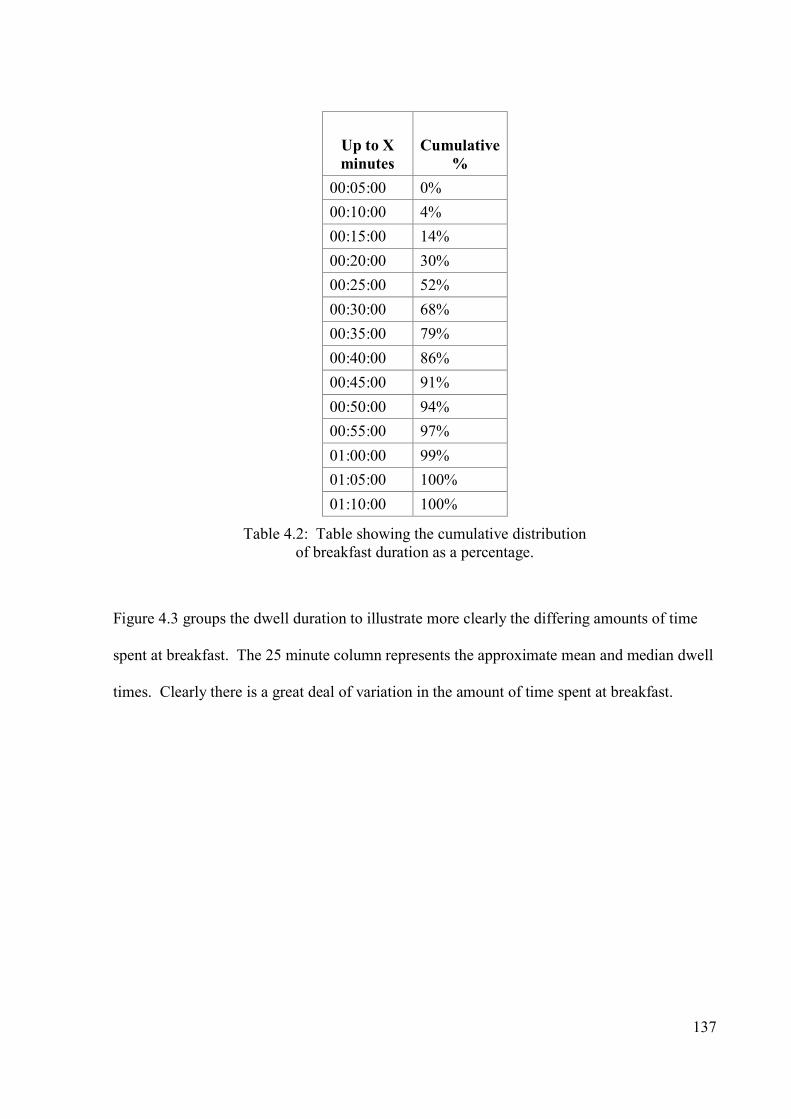
137
Up to X
minutes
Cumulative
%
00:05:00 0%
00:10:00 4%
00:15:00 14%
00:20:00 30%
00:25:00 52%
00:30:00 68%
00:35:00 79%
00:40:00 86%
00:45:00 91%
00:50:00 94%
00:55:00 97%
01:00:00 99%
01:05:00 100%
01:10:00 100%
Table 4.2: Table showing the cumulative distribution
of breakfast duration as a percentage.
Figure 4.3 groups the dwell duration to illustrate more clearly the differing amounts of time
spent at breakfast. The 25 minute column represents the approximate mean and median dwell
times. Clearly there is a great deal of variation in the amount of time spent at breakfast.
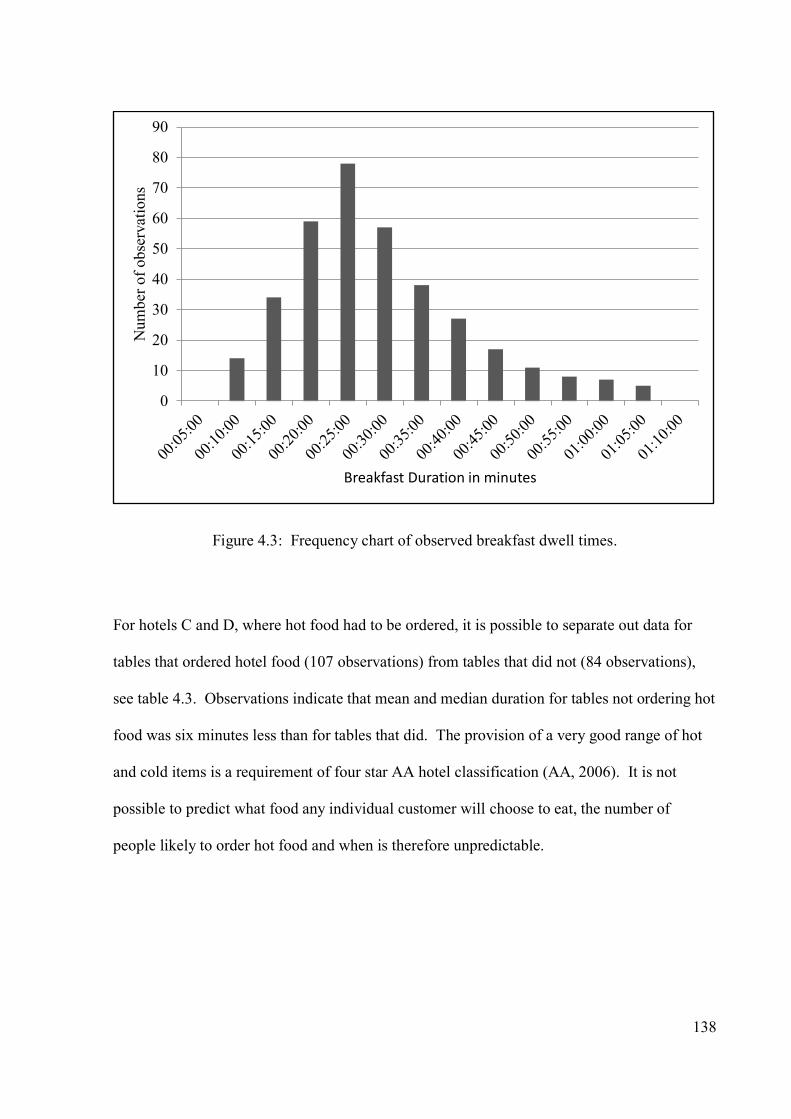
138
Figure 4.3: Frequency chart of observed breakfast dwell times.
For hotels C and D, where hot food had to be ordered, it is possible to separate out data for
tables that ordered hotel food (107 observations) from tables that did not (84 observations),
see table 4.3. Observations indicate that mean and median duration for tables not ordering hot
food was six minutes less than for tables that did. The provision of a very good range of hot
and cold items is a requirement of four star AA hotel classification (AA, 2006). It is not
possible to predict what food any individual customer will choose to eat, the number of
people likely to order hot food and when is therefore unpredictable.
0
10
20
30
40
50
60
70
80
90N
um
ber
of
obse
rvat
ions
Breakfast Duration in minutes

139
Food Ordered
Duration
(108)
Food Not
Ordered
Duration (85)
Mean 00:30:53 00:24:16
Median 00:28:30 00:22:37
Standard
Deviation 00:11:48 00:11:21
coefficient
of variation 38.23% 46.79%
Minimum 00:15:10 00:06:10
Maximum 01:04:25 01:02:50
Range 00:49:15 00:56:40
Table 4.3: Statistics for durations of tables that gave hot food orders and those that did not
from hotels C and D.
In summary, while there may be tendencies for breakfast arrivals to fit a general pattern the
actual arrival time and inter-arrival time of guests is unpredictable. The dwell time of
customers varies depending on many unpredictable factors. While average dwell time and the
frequency distribution can be established, the arrival and dwell time of any one customer
cannot be predicted. Table occupancy is also unpredictable as it depends on party size. This
last point is discussed in more detail later.
4.3: QUANTITATIVE FINDINGS OF ARRIVAL AND DURATION:
FRONT DESK
This section presents and analyses the quantitative check-in duration data collected. Across
the four hotels 284 observations were recorded for arrival time and check-in duration. As
with time data collection for breakfast, the primary reason for quantitative data collection was
to gain an impression of the extent of time variability, whilst every effort was made to record

140
the arrival time and duration of every check-in some may have been missed. Table 4.4 shows
the key observed check-in duration statistics.
A B C D All
Mean 00:02:48 00:03:50 00:02:01 00:03:08 00:03:05
Median 00:02:20 00:03:20 00:01:52 00:02:40 00:02:35
Standard
Deviation 00:01:45 00:02:34 00:01:15 00:02:45 00:02:20
coefficient
of variation 62.65% 66.65% 62.38% 87.31% 75.86%
Minimum 00:00:07 00:00:10 00:00:15 00:00:15 00:00:07
Maximum 00:08:40 00:12:20 00:07:00 00:18:50 00:18:50
Range 00:08:33 00:12:10 00:06:45 00:18:35 00:18:43
Table 4.4: Key observed check-in duration statistics.
The table shows differences between the statistics for each hotel. Hotel C appears to have the
shortest check-in duration and hotel B the longest, almost twice as long as hotel C, all hotels
used the same software programme. Reasons for these differences will be examined in a later
section. As a very approximate calculation, only around 20% of available front desk clerk
hours were spent checking people in during the observation sessions. These took place
mainly between 4.00pm and 7.00pm, the period when the majority of guests are expected to
check-in (Vallen & Vallen, 2009). Check-in duration becomes an issue if there is a queue of
people waiting for service. While queues were observed, they were so rare or brief that the
data on queue times has not been included. Another reason for the exclusion of this data is
that when queues did form it was usually because a group known to each other arrived at the
same time.

141
Figure 4.4 shows the frequency distribution for check-in duration, the average is pulled away
from the mean by the less numerous occasions when check-in duration far exceeded the
median. This is clearer on figure 4.5 which shows the data as a scatter graph. Table 4.5
shows the cumulative frequency of check-in duration as a percentage, over 75% of check-ins
were completed in less than three and a half minutes and 90% of check-ins in less than five
minutes, or approximately one standard deviation above the mean. In general check-in is a
process with a brief duration.
Figure 4.4: Observed check-in duration frequency.
0
10
20
30
40
50
60
Fre
quen
cy o
f ea
ch c
hec
k-i
n d
ura
tion
Check-in duration grouped by 30 second intervals

142
Figure 4.5: Scatter chart of check-in durations overlaid with lines displaying the mean and
one standard deviation.
00:00:00
00:02:53
00:05:46
00:08:38
00:11:31
00:14:24
0 50 100 150 200 250
Dura
tion o
f ea
ch c
hec
k-i
n
Sequential check-ins

143
Service
Duration
half
minutes
Cumulative
%
00:00:30 4%
00:01:00 10%
00:01:30 18%
00:02:00 33%
00:02:30 48%
00:03:00 65%
00:03:30 77%
00:04:00 82%
00:04:30 88%
00:05:00 90%
00:05:30 91%
00:06:00 92%
00:06:30 93%
00:07:00 97%
00:07:30 97%
00:08:00 99%
00:08:30 99%
00:09:00 99%
00:09:30 100%
00:10:00 100%
Table 4.5: Table showing the cumulative frequency of
check-in times as percentages.
Where no queue time was recorded it was assumed that the arrival time at the front desk was
the same as the start of the service process. The inter-arrival time of guests at the front desk
was lumpy. Figure 4.6 shows the frequency of arrivals to check-in by 15 minute time
intervals and indicates that guests tend to arrive for check-in between 4.30pm and 7.00pm.

144
Figure 4.6: Check-in arrival time frequency.
The observed inter-arrival pattern reveals lots of short inter-arrival times and fewer long inter-
arrival times (see figure 4.7). This pattern is similar to that expected in systems where
arrivals are random. Thus, while the likely time period for many arrivals and number of
guests due to check in may be known the arrival time of any one guest cannot be predicted.
0
5
10
15
20
25
30
35F
requen
cy o
f ar
rival
s in
eac
h t
ime
per
iod
Actual time of arrival for check-in

145
There were times when several guests were checking in and times when one or no guests were
checking-in. This pattern can partly be explained by the observation that small groups known
to each other tended to arrive at the same time; they had either travelled together or were
attending an event in the hotel that had just finished.
Figure 4.7: Inter-arrival times for check-in.
Figure 4.8 shows an illustrative throughput delay curve. The vertical axis represents times,
the horizontal axis capacity utilisation. The solid black curve is calculated using the
coefficients of variation for the observed inter-arrival and check-in duration times assuming
three servers. Each curve represents a 20% and 40% increase or decrease in both coefficients
of variability. If a maximum desirable check-in duration average of 4 minutes is assumed,
and it is further assumed that guests only come to the desk to check-in, then the intersection of
0
10
20
30
40
50
60
70
00:0
1:0
0
00:0
3:0
0
00:0
5:0
0
00:0
7:0
0
00:0
9:0
0
00:1
1:0
0
00:1
3:0
0
00:1
5:0
0
00:1
7:0
0
00:1
9:0
0
00:2
1:0
0
00:2
3:0
0
00:2
5:0
0
00:2
7:0
0
00:2
9:0
0
00:3
1:0
0
00:3
3:0
0
00:3
5:0
0
00:3
7:0
0
00:3
9:0
0
00:4
1:0
0
00:4
3:0
0
00:4
5:0
0
00:4
7:0
0
00:4
9:0
0
Fre
quen
cy o
f ea
ch i
nte
r-ar
rival
tim
e
Inter-arrival time of each observed check-in

146
each curve with the 4 minute line represents the maximum level of capacity utilisation that is
required to achieve the target. As either source of variability is reduced the level of capacity
utilisation that the system can achieve while achieving the target increases. An increase in the
number of servers is an increase in capacity and will also result in a flattening of the curve.
This chart illustrates that spare or flexible capacity (often in the form of labour) is required to
absorb variability and maintain an acceptable throughput time.
Figure 4.8: Illustrative Throughput Delay Curve.
Front desk clerks were required to respond to a wide range of queries and requests from hotel
guests and visitors. When queuing was observed it was sometimes because one of the front
desk clerks was responding to a query or request from a guest already checked-in. The
00:00:00
00:02:00
00:04:00
00:06:00
00:08:00
00:10:00
00:12:00
00:14:00
00:16:00
00:18:00
00:20:00
Expec
ted a
ver
age
thro
ughput
tim
e
Proportion of processing capacity utilised

147
subject, arrival time and duration of queries and requests cannot be predicted. The throughput
delay curve, indeed all statistical models of capacity and queuing, have little practical value in
helping make decisions about future resource levels; variability is just too unpredictable. The
processes and resources need to be arranged so that variability can be accommodated.
In summary, inter-arrival times of guests are largely random and there is great variation in
check-in duration. Checking guests into a hotel occupies only around 20% of front desk clerk
time between 4.00pm and 7.30pm. Great task variety was observed, the subject, arrival time
and duration of queries and requests cannot be predicted.
4.3.1: Quantitative Data Summary
The quantitative data and supporting observations indicate that guest arrival time and process
duration for both processes display a high degree of variability. There are tendencies for
guests to arrive at certain times of the day but the exact number arriving at any time is
unpredictable and varies from day to day. Four star hotels have mainly business customers
during the week, the lumpiness of arrival patterns is due at least partly to work colleagues
travelling and arriving together. Front desk clerks are required to deal with enquiries from
guests checked in as well as new arrivals.
There was also great variation in the duration of each process. The coefficient for variation
averaged 64% for check-in (3 out of four hotels) and 44% for breakfast. Whilst the check-in
had a median duration of 2:30 minutes, median breakfast duration was 24:30 minutes.
148
Variation percentages therefore translate into very different chronological time differences.
Observed reasons for the variation will be considered in the following section.
4.4: QUALITATIVE FINDINGS: CUSTOMER VARIABILITY
Quantitative findings describe the extent of process variation but provide little indication as to
the possible causes. By watching the processes as they happen it was possible to record
events and reasons that can be said to be the causes (Sayer, 1992, 2000) of the process
durations. The short interviews with employees provided additional insights. The causes of
variability are considered to be rooted in either customer or system behaviour. This section
categorises observations of causes of customer variability. Events that speed or slow service
that are directly in the control of the operation are reported and analysed in the following
chapter as system variability.
It is recognised that there are causes of variability that are either outside the control of, or
realistically limit the choices of, those involved in the processes, a few examples follow.
While observing the front desk in hotel A the hotel fire alarm went off at 5.50pm requiring the
hotel to be evacuated for 30 minutes. Guests may have their service time largely decided by
their work schedule or transport times. A guest may be ready to leave the table but feels
obliged to stay when joined by a colleague.

149
4.4.1: Customer Variability Observations: Breakfast
Guests arrived without a reservation at a time that suited them. Once in the restaurant they
occupied physical capacity and stayed for a duration of their choosing. Two hotels provided
both a hot and a cold buffet and two just a cold buffet; here orders were taken for hot food.
Before service the restaurant was presented with a list of names and room numbers indicating
which guests had breakfast included in their room rate. It is assumed that guests who did not
know anyone in the restaurant sat on a table on their own. Generally staff neither know
whether any guests are known to each other nor whether they will arrive for breakfast at the
same time. Table numbers are limited and cover occupancy is dictated by party size, so the
number of customers expected for breakfast is not a good indication of how many tables will
be occupied at any one time. Unless the party has arranged breakfast for a certain time, the
arrival time of any one guest or party cannot be predicted.
It was observed, however, in all hotels that many guests did know each other. All the hotels
had meeting and conference rooms and some of the delegates were staying in the hotels.
Other guests appeared to be colleagues staying in the hotel but working elsewhere. Breakfast
appeared to be an opportunity to reflect on events of the evening before or to discuss plans for
the day ahead. On the Sunday in hotel A most guests were teams of athletes, in hotel B there
was the early large tour group. Other guests in parties of four or six were observed to share
tables; it is assumed that they were friends or family. The behaviour of guests makes the

150
work of waiters more challenging as they need to monitor all tables to notice any new arrivals
at a table.
A few interesting observations that highlight the variability of human behaviour were made in
hotel A when the athletes came down for breakfast. The restaurant supervisor, contrary to
standard practice, did not take room numbers and guests selected their own tables. The
supervisor remarked that they were all on a rate that included breakfast and it was obvious
who they were. She also judged that they preferred to choose where to sit and often sat with
colleagues. Indeed breakfast seemed to be a social occasion for many athletes, they pushed
tables together and they joined other members of their team part way through their breakfasts.
Guests were assumed to be making food choices appropriate for their sport. A significant
number of guests were observed to put fruit into their bags before they left the restaurant,
bananas seemed to quickly disappear from the fruit basket (and eventually ran out).
Guests were observed engaged in other activities apart from eating (see table 4.6). Activity
was not confined to waiting to order or for order delivery. Guests were observed to engage in
activities after eating or between visits to the buffet. Frei (2006) limits preference variability
to an opinion, an assessment of the experience, the definition is extended here. Customers
who choose to engage in an activity are not making a request, or displaying effort or
capability, they seem to be displaying a preference for doing something. Their goal is not to
eat breakfast as quickly as possible. It can reasonably be suggested that guests make a
decision in advance about how much time they want to devote to breakfast and arrange their
arrival time on that basis.

151
Activities apart from eating
Talking to colleagues
Reading printed material
Using a mobile phone
Using a computer
Looking out of the window
Table 4.6: Customer activities
observed at breakfast.
The restaurant cannot know in advance what food choices guests will make once in the
restaurant. Some items can be kept at ambient temperature or chilled and returned to storage
if unused. Cooked items are perishable but stay usable for different time periods.
In summary guests decide the duration of the breakfast process and their behaviour affects
capacity utilisation. In addition due to arrival and duration time variability, the restaurant
cannot know how many covers on each table will be occupied. Thus predicted arrival
numbers is not a good indicator of whether seating capacity is sufficient. The restaurant
cannot predict the volume of different food items that will be requested or consumed. This
has implications for food preparation and ordering if over or under supply if to be avoided.
4.4.2: Customer Behaviour at Breakfast: Interview Findings
Employees made a few comments regarding variable customer behaviour that either speeds or
slows service these are shown on table 4.7 below. Clearly employees are aware of the
variability of customer behaviour and how it has an effect on the speed of service. There is
also an indication that their role is to respond to customer demands as they arise.

152
Speeds Slows or delays
Sometimes guests phone down and pre-
order because they know it takes time to
cook the food (hotel C)
Sometimes there is a rush when everyone
comes down at the same time. (hotel C)
If lots of customers come at the same
time there is not a lot you can do (hotel
A)
Sometimes if one table has eggs others
around it see and put in orders for eggs
(hotel B)
Sometimes they just walk in, especially if
they are joining colleagues (hotel B)
Lots of single customers occupying tables
for two (hotel C)
Table 4.7: Comments from staff relating to customer behaviour that speeds of slows
breakfast service.
4.4.3: Customer Variability Observations: Front desk
Front desk is generally the only customer service department that is manned all the time. The
dominant role of staff manning it may change during the day, but it is there as a point of
contact for guests day and night. Front desk variability, rather than just check-in variability,
is considered here because guests approached the front desk with many requests and occupied
capacity resulting in check-in guests having to occasionally and briefly wait for service. The
primary goals of check-in are to confirm the identity of the customer, to ensure that all the
necessary information is exchanged regarding the details of the stay and to ensure that full
payment can be secured for the hotel.
The time required for check-in varies with the information needs of the hotel and customers.
Customers are not uniform, the amount of information and the number of tasks required to

153
check them in varied with the nature of their reservation. Check-in is also a social exchange
where understanding and agreement is negotiated before the customer becomes accepted as a
guest. Guests vary in the amount of information they need to help plan their stay, or in their
need for general social interaction.
Guests approached the desk by phone as well as in person and made a variety of comments
and requests, employees also undertook activities that took them away from the desk (table
4.8). There was also a great variety of queries, requests and activities at check-in (table 4.9).
An initial categorisation of findings is made. When compared to the variety of activities
taking place at breakfast it is very clear that front desk employees need to be able to respond
to a greater variety of requests and therefore need to be much more knowledgeable than
breakfast employees.
Facilities issues WiFi signal in room is too weak
Key card problems: Two of the hotels experienced problems with key cards. In hotel B it was reportedly due to the brand of card, in hotel D it
was due to the programming on check-in
Maintenance issue reported. Hotel D was undergoing refurbishment and
some rooms were having problems with the electrical supply and paint
odours.
Chasing up on reported maintenance issue.
Moving guest to a new room because of unresolved maintenance issue.
Request room change, smells of smoke.
System unavailable. Software or hardware problem with terminals.
Printer: paper change, jam.
Guest request Doing research on the internet for a customer.
Taxi requests.
Request to speak to a guest in their room. Room numbers can’t be given out by reception, the guest room must be telephoned, then it is up to the
guest to decide whether they want to give out the room number.
Dinner reservations.

154
Give directions to meeting room.
Discussing travel times and wake-up call times to get to airport.
Recommendation for local pub.
Directions to shops and other hotels.
Hotel full, offers to phone other to find room.
Restaurant recommendations and directions.
Enquiries for location of town centre.
Show guest to car park.
Guest requests a few table cloths to be pressed. The receptionist is not sure whether that service can be offered and needs to check.
Drinks orders for the foyer lounge.
Additional towels.
Toothbrush and iron.
Service at the bar.
Request to change room.
Telephone Internal phone calls from guest rooms.
External phone calls.
Incoming call for bar manager.
Incoming call enquiring about who to talk to about weddings.
Routing in-coming telephone calls (reservations has a different line).
Hotel C with popular restaurant: taking calls for lunch and dinner reservations.
Telephone request for room service.
Incoming checking reservation details.
Incoming room rate and availability enquiry.
Luggage Loading luggage trolley.
Taking luggage to guest room.
Helping with luggage.
Retrieving bags from the store because the Concierge is engaged in other activities or there is no concierge.
Storing and retrieving left luggage.
Transaction To pay car parking fees. The car park beneath hotel A is not owned by the hotel but customers can pay their parking fees at the front desk.
Checking whether a delivery for a customer of soft drinks had been recorded.
A checked in guest disputing the refusal to allow her to use some of her
“dinner and drinks” allowance to pay for afternoon drinks without food.
Late check-outs.
Guest wants to pay bill for check-out tomorrow.
Taking payment for foyer lounge drinks.

155
Miscellaneous payment.
Check-out discussing ‘extras’ bill and what can be transferred to the company account.
Miscellaneous expense payments.
Employee Task
variety Typing a list of over one hundred names from OPERA to Microsoft
Excel so that they could be used to print names on envelopes.
Unidentified activities on OPERA.
Unidentified administration tasks.
Checking reservation and guest details on computer.
Query from registered guest about cost of extending stay.
Taking debit or credit card swipe.
Checking meeting room postings.
Validate car parking tickets.
Printing reports.
Trying to contact housekeeping.
Putting cash in the safe.
Filling in forms for petty cash expenditure.
Looking for an iron and tooth brushes.
Going out to buy tooth brushes.
Staff training.
Table 4.8: Observed task variety, excluding check-in.
System
information
request
Can’t find name; trying to check into the wrong hotel or on wrong date, under different (lead) name, under company name, receptionist can’t
spell name.
Additional details or alterations to the registration details.
Requests for repetition of guest’s name, or spelling.
Reservation
status Walk-ins require most time as need to inform of price, collect all details
and collect payment.
Pre-booked status has variable time as variable amounts of information
are on the system.
Pre-registered status is fastest check-in.
Request Directions to venue.
Request for taxi.
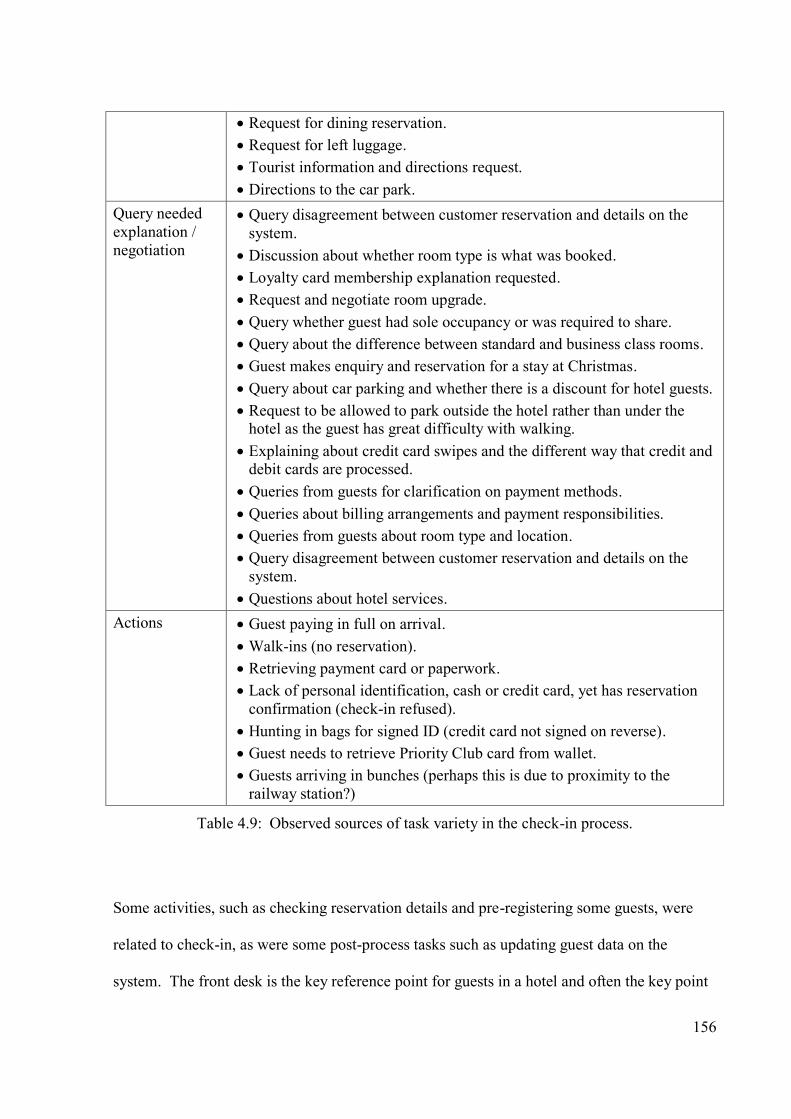
156
Request for dining reservation.
Request for left luggage.
Tourist information and directions request.
Directions to the car park.
Query needed
explanation /
negotiation
Query disagreement between customer reservation and details on the
system.
Discussion about whether room type is what was booked.
Loyalty card membership explanation requested.
Request and negotiate room upgrade.
Query whether guest had sole occupancy or was required to share.
Query about the difference between standard and business class rooms.
Guest makes enquiry and reservation for a stay at Christmas.
Query about car parking and whether there is a discount for hotel guests.
Request to be allowed to park outside the hotel rather than under the hotel as the guest has great difficulty with walking.
Explaining about credit card swipes and the different way that credit and debit cards are processed.
Queries from guests for clarification on payment methods.
Queries about billing arrangements and payment responsibilities.
Queries from guests about room type and location.
Query disagreement between customer reservation and details on the
system.
Questions about hotel services.
Actions Guest paying in full on arrival.
Walk-ins (no reservation).
Retrieving payment card or paperwork.
Lack of personal identification, cash or credit card, yet has reservation
confirmation (check-in refused).
Hunting in bags for signed ID (credit card not signed on reverse).
Guest needs to retrieve Priority Club card from wallet.
Guests arriving in bunches (perhaps this is due to proximity to the
railway station?)
Table 4.9: Observed sources of task variety in the check-in process.
Some activities, such as checking reservation details and pre-registering some guests, were
related to check-in, as were some post-process tasks such as updating guest data on the
system. The front desk is the key reference point for guests in a hotel and often the key point

157
for the collection and dissemination of information (Bardi, 2006). Check-in is just one task
for which staff are responsible.
Some requests required staff to leave the front desk reducing the effective capacity. This
included storing or retrieving luggage, taking luggage to a room, showing a guest to a room.
Historically these activities may have been the responsibility of the concierge. In two of these
hotels the concierge post had been abolished, in the other two it was being phased out and the
concierge was cross-trained to work on the front desk.
An important point to remember is that time is measured and perceived. The customer in the
process is occupied and is choosing to ask questions so their time is purposively occupied
(Maister, 1985). Customers who may be waiting for service may have different view as their
time is unoccupied; they may be wondering why it is necessary to ask so many questions on
check-in!
4.5: FINDINGS SUMMARY
Quantitative data revealed that, although there are patterns to customer arrivals, the arrival
time of customers to both processes varies and is generally unpredictable. Process duration
has also been shown to be highly variable. Time variability was largely due to customer
behaviour. At breakfast guests largely choose the time span of the process and most
variability can be assigned to customer preference for time duration. The hotel can control
the time of food order to delivery and table resetting. Guests can affect check-in duration by
158
the number of questions they ask, or by how prepared they are for the process. At check-in
there was much greater variability as a various requests were made and questions asked.
Guests continued to contact the front desk with requests and queries after check-in and non-
residents also approached the desk.

159
CHAPTER 5: DISCUSSION OF FINDINGS AND REFLECTION ON
THEORY
5.1: INTRODUCTION
The methodology argued that operations managers are pragmatic and use retroductive
thinking. They start with an idea of a desired end state and then select and assemble resources
that (they believe) have the necessary properties to generate the events that produce the
desired outcome. Rules and methods are then devised in an effort to plan and control which
properties of the objects are exercised, through activities, so that the events generated
ultimately deliver the desired outcome (output).
It has been explained that customer processing operations are inherently less controllable,
more variable, because of customer behaviour. A challenge of operations is to manage
variability so that the desired outcome is still achieved. Robustness is the capability of a
process to achieve the desired performance under actual operating conditions (Taguchi &
Clausing, 1990). Robustness in this context is efficiently coping with significant variability in
arrival and processing times so that customers can move through the activities at a pace that
suits them, while arriving customers perceive that they are not kept waiting for an
unsatisfactory period of time.

160
Variability and capacity utilisation are the two corners of the process management triangle
that managers need to manipulate to maintain an appropriate flow of the third corner,
inventory. Customers (as flow units and inventory) as well as the hotel’s resources are
sources of variability. If there is variability then, in operations that must limit available
resources, capacity or capacity utilisation needs also to vary to maintain efficiency and allow
customers to flow at an appropriate pace.
The aim of the analysis is, firstly, to identify and categorise the sources of variability in the
two processes. The implications for resources and process configuration are discussed. The
similarities and differences between the two processes are then analysed in more detail. The
analysis then focuses on how resources and processes can be configured to cope with
customer variability in the two processes.
Guiding operations management principles for managing time and variability in customer
facing service processes are given in figure 2.9 and developed further in table 5.10 below,
they are selected mainly from research into capacity management summarised by Pullman
and Rodgers (2009) and from the books by Anupindi et al (2012) and Johnston et al (2012).
Customers (inventory) have feelings and make judgements about satisfaction, partly on how
long they are kept waiting. Wait minimisation is therefore a key goal of hotel operations
management. Armistead and Clark (1995) discussed the idea of the coping zone and
suggested that as capacity utilisation increases, variability leads to increasing delays in
service. This idea is demonstrated by Slack et al (2010) using throughput delay curves (see

161
figures 2.8 and 4.8) and described as a crucial concept for managing throughput time by Suri
(2010). If variability cannot be significantly controlled then, to avoid delays for customers,
capacity to process must be sufficient to satisfy the demands placed on it.
The focus is on the rate limiting resource (Armistead & Clark, 1994), generally the service
encounter at the front desk and physical capacity at breakfast. The general principles are to
minimise activities that consume labour time and provide facilities, equipment and materials
to allow customer to process themselves at a pace that suits them. Mostly, spare and flexible
labour is used to increase capacity at times of high demand.
5.2: VARIABILITY
Frei (2006) proposed that causes of customer variability could be grouped into five categories;
arrival, preference, request, capability and effort. Arrival variability has been described in the
quantitative analysis. Suri (2010) characterises variability as dysfunctional or strategic.
Dysfunctional variability is caused by “errors, ineffective systems and poor organisation”
(p.4). This can include some of the sources of waste identified under the Lean paradigm or
those categorised by Armistead and Clark (1994) as capacity leakage.
The following sections discuss observed customer variability and variability arising from the
system. It groups customer variability using Frei’s framework and looks at dysfunctional
system variability as capacity leakage.
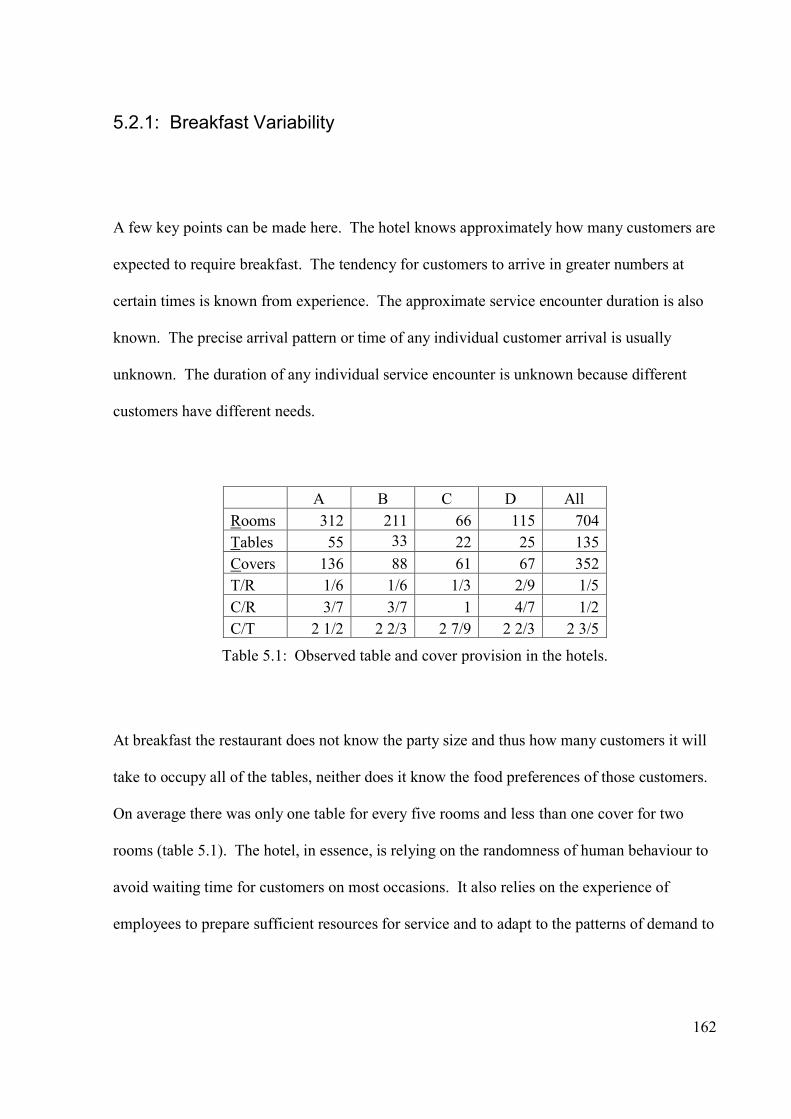
162
5.2.1: Breakfast Variability
A few key points can be made here. The hotel knows approximately how many customers are
expected to require breakfast. The tendency for customers to arrive in greater numbers at
certain times is known from experience. The approximate service encounter duration is also
known. The precise arrival pattern or time of any individual customer arrival is usually
unknown. The duration of any individual service encounter is unknown because different
customers have different needs.
A B C D All
Rooms 312 211 66 115 704
Tables 55 33 22 25 135
Covers 136 88 61 67 352
T/R 1/6 1/6 1/3 2/9 1/5
C/R 3/7 3/7 1 4/7 1/2
C/T 2 1/2 2 2/3 2 7/9 2 2/3 2 3/5
Table 5.1: Observed table and cover provision in the hotels.
At breakfast the restaurant does not know the party size and thus how many customers it will
take to occupy all of the tables, neither does it know the food preferences of those customers.
On average there was only one table for every five rooms and less than one cover for two
rooms (table 5.1). The hotel, in essence, is relying on the randomness of human behaviour to
avoid waiting time for customers on most occasions. It also relies on the experience of
employees to prepare sufficient resources for service and to adapt to the patterns of demand to

163
attempt to maintain service quality. In this situation the main tool for coping is spare and
flexible capacity (resources) in the form of facilities, equipment, materials and labour.
Arrival
Activity Weekday tendency for arrivals to increase from around
7:15am and peak at around 8:30am.
No Sunday pattern observed.
Preference
Activity Interaction with partners or colleagues. Reading, texting
Volume Amount of food consumed
Choice Food and beverage preference
Duration Dwell time in the restaurant
Request
Seating With colleagues, by window, table size
Resource, food Number of requests for cooked items or condiments
Resource, beverage Number of requests for hot beverages
Capability
Speed Of consumption
Activity Ability to self-serve
Effort
Seating location Unobserved
Food choice Unobserved
Table 5.2: Examples of Sources of customer variability at breakfast after Frei (2006).
Table 5.2 groups observed customer variability according to the categories suggested by Frei
(2006). Some observations do not fit neatly into one category. For example, speed of
consumption may be a preference rather than a capability. Effort capability was difficult to
observe and would perhaps require interviews with customers. Customers may have wanted
more food or different food but they were not willing to make the effort to ask for it or queue
164
at the buffet, some may have requested tables close to the buffet to save the effort of walking
too far. An indication of effort variability was noted in hotel D. As the cold buffet was
passed on the way to the restaurant, some guests were observed to have selected food from the
buffet before being seated in the restaurant. As Gummesson (2007) suggests, observational
research captures action but not motive. There is some assumption about motive and its
categorisation.
Customer arrival and duration variability was examined in the quantitative analysis. While
tendencies for patterns of arrivals and a mean for duration can be identified the extent of
variability is asserted here to mean that it is impossible to predict staffing or capacity
requirements at any particular time during service. Hotels cope with this by;
Simplifying the service encounter. A brief service encounter means that each member
of staff can deal with many customers with minimal waiting time.
Providing other options for delivery, such as room service, ‘grab ‘n go’, limited
service delivery in another location (business lounge or meeting room for example).
Extending tables to adjoining areas.
Making customers wait.
5.2.2: Front Desk Variability
Employees on the front desk are aware of the level of business in the hotel and the number of
check-ins or check-outs that can be expected. They do not know the timing, number or
165
variety of other requests that will be made and they do not know the arrival or departure time
of most customers. Table 5.3 uses Frei’s (2006) categorisation to re-group the types of
customer variability recorded at check-in and reported in tables 4.8 and 4.9. A key feature is
the volume and variety of requests, each of which also requires different amounts of time to
complete.

166
Arrival
Activity Arrivals for check-in tend to peak between 4:30pm
and 6:30pm.
Preference
Activity Social interaction with front desk clerk
Request
Information Tourist Directions, times, recommendations, advice
Hotel services and
facilities.
Availability, location, times
Transaction Negotiating
understanding
Clarification of reservation details and billing
arrangements
Negotiating
agreement
Disputed billing and allowance arrangements
Payment Pay on arrival, bar, afternoon tea, departure, ticket
validation.
Reservation Room Walk-in or telephone request for a room
Restaurant Hotel restaurant
Other Taxi request, book a restaurant
Services Luggage Storage or collection of luggage or other items on
check-in or departure
Other departments Ironing, toothbrush, early breakfast, access to gym,
bar or lounge service
Defect Room Noise, odours, equipment not working, key card
Capability
Activity Transport luggage to room
Information Finding answers to queries
Effort
Activity Transport luggage to room
Information Search or act on behalf of customer
Table 5.3: Examples of Sources of customer variability on check-in after Frei (2006).
Customer variability at the front desk is not only related to the unpredictable arrival and
variety of tasks but the unpredictable duration of each task. Only duration of check-in was

167
recorded. There is no set duration for check-in because the hotel requires different amounts
of information from each customer and each customer may require different amounts of
information from the hotel.
The request variety and the difficulty of categorising requests as preference, effort or
capability weakens the utility of Frei’s categorisation. An attempt has been made in table 5.3
so subdivide requests into categories of request. Most of these requests can be dealt with
from the front desk, either directly or by forwarding requests to other departments, but they all
consume an indeterminate length of time. Customers could be capable of carrying out some
of the information request tasks themselves but may prefer to ask staff to do it for them,
alternatively they may not know how to find out the information.
Hotel Total check-ins
observed
Check-ins over
four minutes
% of check-ins over
four minutes
A 56 8 14.3%
B 100 33 33%
C 60 3 5%
D 68 12 17.6%
Total 284 55 19.4%
Table 5.4: Table showing the number of check-ins that took
more than four minutes.
Table 5.4 shows the number and proportion of check-ins that took more than four minutes.
Jones and Dent (1994) commented that a target time of four minutes, including the pre-service
wait, was set by Forte Hotels, Vallen & Vallen (1990) and the front office manager of hotel A
also mentioned four minutes as an acceptable target time.

168
Looking more deeply into the check-in duration figures and considering only the longer
check-ins (i.e. the 55 instances that took longer than four minutes) an interesting picture
emerges as shown in table 5.4. For 28 of those observations field notes were recorded that
indicate why the check-in took more than four minutes (see table 5.5). Although the table
splits the observations into individual categories, on some occasions more than one activity
extended the check-in time. On one occasion in hotel C the reservation could not be found
and the hotel was fully booked. The customer, however, was a regular client from a local
company that brought in significant business, so a room was found for the customer. As a
result, the front desk clerk had to make calls to other hotels to check availability to be
prepared to book-out a guest if all reservations were honoured. The guest later returned to the
front desk to request a room upgrade, reminding the front desk clerk how much business their
company brings to the hotel! On one occasion in hotel B it was noted that a guest took time
to find a credit card, then had an enquiry about food and drink allowances and finally asked
about the gym. As the gym in hotel B is unsupervised guests are required to sign a disclaimer
form before being given a key for access. In hotel D one check-in involved a family with
three rooms staying for fourteen nights. One family member arrived at the desk, the front
desk clerk requested full payment on check-in which involved some discussion, and one front
desk clerk then went with the guest to help bring in the luggage. When the rest of the family
arrived there were a number of questions about the rooms and hotel services.
Twenty one of the observed check-ins of over four minutes were generally due to customer
behaviour, mainly requests for additional information. The four occasions that involved
discussions about taking deposits on arrival from credit and debit cards can be viewed as
variability due to customer capability. Once the reason has been explained and understood

169
then, on future occasions, the customer has no need to question the practice. The customer is
learning how the system works.
Cause due to customer behaviour Cause due to system
Number of questions asked on check-in
(thirteen times).
About need for credit or debit card
swipe and the difference between the
two (four times).
Discuss details of reservation, what is
included in the price, upgrades,
breakfast (six times).
General tourism enquiries or just chit chat.
Can’t find name on the computer system
(seven times).
Perhaps several rooms have been
booked and only one name recorded
(three times).
The reservation was booked through a
third party site and not transferred to the
hotel system (twice).
Room booked with another hotel department but not on the system.
Walk-ins. Room availability and rates need
to be discussed, all personal details taken
and full payment (three times).
Left the front desk before check-in
completed then returned a little later (twice).
Searching bags for proof of identity (once).
Paying cash on arrival for reservation
(once).
In response to guest request, hotel loyalty
scheme explained in a little detail (once).
Table 5.5: Table showing reasons noted for check-ins that took more than four minutes.
Remember also that check-ins consumed only about 20% of time during the observations and
that a large variety of queries and requests were made by non-residents and guests already
checked in (see table 4.8). The immediacy and unpredictability of request variety and the
indeterminate length of time required to deal with each request means that front desk
employees need wide knowledge and high levels of social skills. Staffing levels need to be
flexible to deliver the responsiveness required by customers.

170
5.2.3: Justifying Accommodation of Variability:
It is asserted that the customer-focussed nature of service, with the goal of effectiveness
taking priority over the goal of efficiency, and the fact that service can only be created at the
point of delivery and usually requires some contribution from the customer, means that
resources and processes are best configured to accommodate customer variability. The nature
of four star hotels and the view of the customer as a transient employee suggests that
customers are more likely to be satisfied by strategies that accommodate rather than reduce
their choices (Namasivayam, 2002).
Frei (2006) suggests that accommodation of customer-induced variability can be categorised
as ‘classic accommodation’ and ‘low-cost accommodation’. Classic accommodation is
described as providing human resources with the skills to recognise and act on the different
sources of customer variability. Low-cost accommodation includes tactics such as employing
low-cost labour, creating self-service options and automating some activities. Yang (2011)
interviewed 97 managers of service firms in Taiwan and concluded that, in general, service
firms preferred to use tactics in the classic accommodation strategy rather than low-cost or
variability reduction strategies. The sample included 16 hotels but Yang provides no
breakdown by industry and makes no suggestions as to the reasons for the preference. Table
5.6 shows the strategies suggested by Frei (2006) for managing customer variability, items
highlighted in bold were observed (or attempted) at the hotels.

171
Classic
Accommodation
Low-Cost
Accommodation
Classic
Reduction
Uncompromised
Reduction
Arrival Make sure plenty
of employees are
on hand
Hire lower-cost
labour
Automate tasks
Outsource
customer contact
Create self-
service options
Require
reservations
Provide off-peak
pricing
Limit service
availability
Create
complementary
demand to
smooth arrivals
without requiring
customers to
change their
behaviour
Request Make sure many
employees with
specialized skills
are on hand
Train employees
to handle many
kinds of requests
Hire lower-cost
specialized labour
Automate tasks
Create self-
service options
Require
customers to
make
reservations for
particular types
of service
Persuade
customers to
compromise their
requests
Limit service
breadth
Limit service
breadth
Target customers
on the basis of
their requests
Capability Make sure
employees are on
hand who can
compensate for
customers’
varied skill levels
Do work for
customers
Hire lower-cost
labour
Create self-
service options
that require no
special skills
Require
customers to
increase their
level of
capability before
they use the
service
Target customers
on the basis of
their capability
Effort Make sure
employees are on
hand who can
compensate for
customers’ lack
of effort
Do work for
customers
Hire lower-cost
labour
Create self-service
options with
extensive
automation
Use rewards and
penalties to get
customers to
increase their
effort
Target customers
on the basis of
their motivation
Use a normative
approach to get
customers to
increase their
effort
Subjective
Preference
Make sure
employees are on
hand who can
diagnose
differences in
expectations and
adapt
accordingly
Create self-
service options
that permit
customisation
Persuade
customers to
adjust their
expectations to
match the value
proposition
Target customers
on the basis of
their subjective
preferences
Table 5.6: Strategies for managing customer-introduced variability (Frei 2006).

172
There is some evidence that low-cost accommodation tactics are also used. The frontline
service staff in hotels who interact with customers and ensure their satisfaction have always
been low-paid. Self-service is common nowadays at breakfast, indeed it may be the preferred
option for most customers. Some hotel chains, such as Premier Inn, are already installing
kiosks to allow self-check-in, as has a recently opened independent four star hotel in
Birmingham. There was an attempt to limit the breadth of service by the removal of menus
from tables at busy times in hotel A and the omission of menus from tables in hotel B. Ideally
hotels, of whatever star rating, are driven to find ways to reduce the cost of service and
accommodate variability while avoiding a negative impact on customer satisfaction.
Generally eating can be regarded as a pleasurable experience rather than a functional activity.
Restaurant experiences purchased for pleasure can be viewed as hedonic rather than utilitarian
(Noone et al, 2008). Dahr and Wertenbroch (2000) describe hedonic goods as those
consumed more for their experiential values such as fun, pleasure and excitement.
Social interaction and engagement in other activities have been shown to influence dwell
duration. Time is perceived as well as measured and the passing of time may be noticed less
by those engaged in activity (Maister, 1985). Generally guests sharing a table arrived at
different times but left at the same time. Joining another person at a table to share a meal has
social meaning and psychological effects (Nyberg and Olsen, 2010). Likewise, entering a
restaurant and not sitting near or joining with a colleague may result in an unfavourable
interpretation of behaviour. It is not surprising therefore that guests were observed to join
colleagues part way through their breakfast and occasionally to move themselves to another
table when a colleague was spotted (sometimes after an order had been given to the waiter).

173
Sometimes guests even pushed tables together to be closer to colleagues. People, however,
do not like to be placed close to people they don’t know and may experience stress. Robson
et al (2011) investigated the emotional effect of table spacing on restaurant customers and
reported that 70% of respondents would ask to be re-seated if the host placed them too close
to other people.
Utilitarian goods are primarily instrumental and functional, but even these have an
experiential dimension (Holbrook & Hirschman, 1982). Arrival at the hotel and check-in, for
example, is a “critical moment of truth” and an opportunity to make a good first impression
(Vallen & Vallen, 2009:288) even though it is mainly a functional activity, a necessary step to
gain access to the hotel facilities. Encounters at the front desk customised in response to
customer capability and requests. On many occasions this required discussion and
information exchange.
Not all occupied time is pleasurable. If check-in is regarded as functional (utilitarian) rather
than hedonic then the attitude towards duration time at check-in may be different. The
customer may prefer a shortening of the process. Satisfaction is positively correlated with the
end stages of the check-in process where guests are called by name, offered luggage
assistance and thanked for choosing the hotel and negatively correlated with the stage where
customer preferences are reviewed (Noone et al, 2010). This finding can be related to
comments by Wilson et al (2008) and Gilbert (2007) that people do not remember all events
equally, unremarkable events are forgotten and events towards the end of a process have more
impact on overall assessment of satisfaction than events at the start of a process. An
important role of hospitality employees is to make guests feel special and important, to make

174
them feel welcome, even to create a home away from home (Crick and Spencer, 2010). This
is an indication that not all tasks are valued equally. The shortening or elimination of tasks
that engender desirable emotions could adversely affect customer satisfaction while the
removal of others may have either no impact or a positive impact. It is noted that all hotels
maintained the end stages of the check-in process.
A key point which can also be briefly considered here is that of control. Physical systems
have no feelings or motivation and respond only in accordance with physical laws.
Employees have entered into a contract with the hotel and have agreed to subject themselves
to the control of the employer and limit their behaviours. The control that can be exercised
over customers differs greatly among services but is generally much less than that exercised
over employees or physical objects. It is important for customers that they perceive that they
are in control (Namasivayam and Mount, 2006), that they have choices. The need for
customer choice necessarily results in service demand variety and variable duration.
What customers seek and expect from hospitality is fundamentally different to what is sought
from other services. This point is relevant because it places satisfaction of customer need
firmly before any need for cost reduction through excessive time and service reduction. In
hotels the physical capacity to contain customers each day is severely restricted and the
contribution that each room sale makes towards paying fixed costs is significant. Hospitality
has historical associations with domestic service and the traditional view of that relationship
is that the primary purpose of the hotel and employee is the satisfaction of the needs of the
customer. There are many alternatives for customers who are less than delighted with the
service. Contrast this to a bank or retail operation that has many thousands of customers each

175
contributing relatively little to the profit of the organisation. Contact with banks is brief
(mainly) is for utilitarian reasons. Generally competition is based on the need to minimise
costs. Further, in retail the primary objective of customers is the goods on sale, the behaviour
of service staff, while important, is very secondary.
This examination and comparison could be extended to other types of service, such as call
centres for ‘break-fix’ requests or services of necessity such as hospitals. The key point is
that each is different and the design of the process must be balanced to accommodate the
goals of those who hold the dominant power to ensure the long term survival of the
organisation, and will continue to do so if satisfied. Organisations are constantly trying to
balance cost control and customer satisfaction.
These factors offer an explanation for the more common decision to adopt classic
accommodation solutions for customer variability. At busy times non-essential steps can be
reduced or eliminated but customers must always be in control of when the process ends. The
breakfast process is largely open-ended. The hotel facilitates the customers’ experience
creation and leaves the customer to decide the pace and duration. Check-in is more like an
administration task, a necessity rather than a pleasure. Being hospitable, making people feel
welcome and valued is a core feature of the hospitality industry (Crick and Spencer, 2010).
This requires the expression of empathy and responsiveness (Parasuraman et al, 1985) rather
than limitation and control of customers.

176
5.2.4: System Variability
The resources and processes in the control of the hotel can also be causes of variation in
throughput time. This may be due to the properties of the resource or process or due to
resource availability. Variability affects throughput time. Time is a component of capacity,
so system variation can be viewed as capacity leakage.
Table 5.7 shows the events at the front desk and breakfast that employees reported slow
throughput time and categorises them using the capacity leakage categories in table 5.8.
Slows Leakage Category
Pre-service
Front Desk:
We used to have a dedicated telephone switchboard department,
but due to the recession, this was cut. There is a computerised
system for incoming calls that gives callers options to follow (A)
I am aware of the phone issue (phones ringing unanswered
because all desk clerks are busy). Usually we like to have
someone working in the back office to answer phones, but some
staff are away (B)
Sometimes at weekends web sites are left open to sell when the
hotel is full, resulting in overbooking and having to book out (D)
If guest has booked online but Head Office has not put the
reservation on the system (D)
Breakfast:
Job roles are not clear (A)
Lack of knowledge / training (A)
Learnt room service by trial and error (A)
Supervisor / RM does not have enough time to train (A)
Lack of inter-departmental cooperation (A)
Different chefs have different procedures (A)
Scheduling loss due to
insufficient resources.
Quality failures due to
ineffective process
design or
underperformance.
Labour
underperformance
resulting in quality
failures
In-service
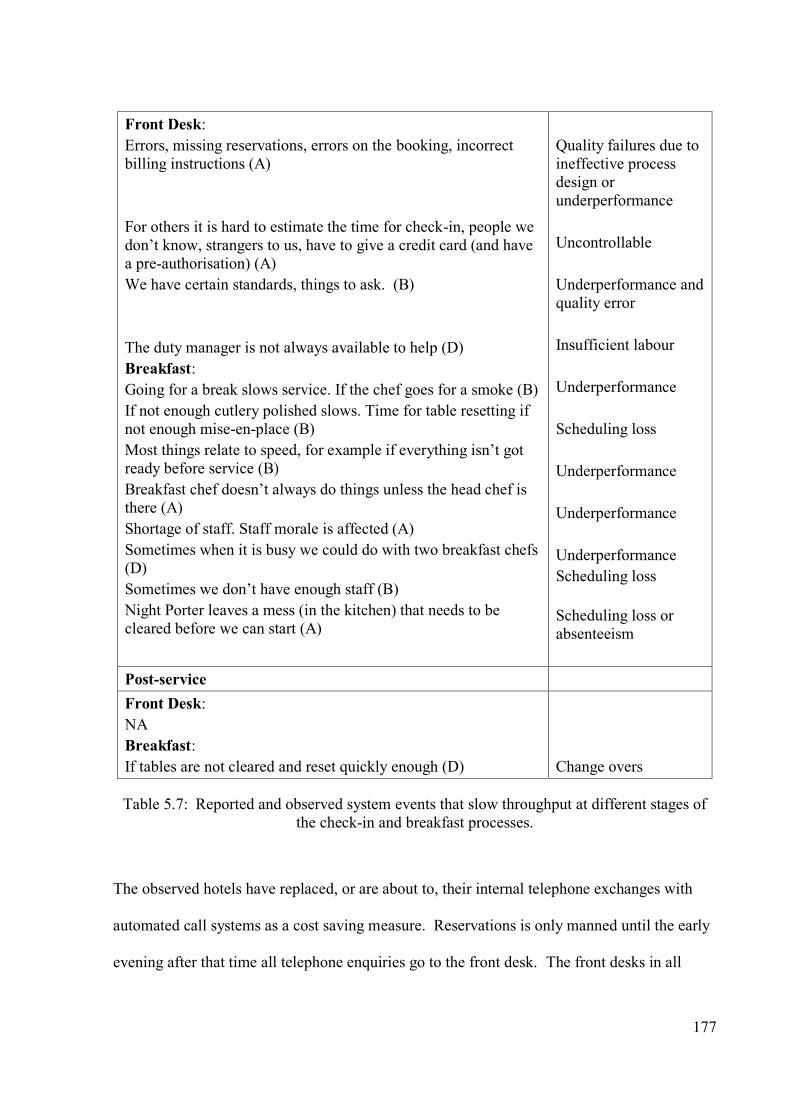
177
Front Desk:
Errors, missing reservations, errors on the booking, incorrect
billing instructions (A)
For others it is hard to estimate the time for check-in, people we
don’t know, strangers to us, have to give a credit card (and have
a pre-authorisation) (A)
We have certain standards, things to ask. (B)
The duty manager is not always available to help (D)
Breakfast:
Going for a break slows service. If the chef goes for a smoke (B)
If not enough cutlery polished slows. Time for table resetting if
not enough mise-en-place (B)
Most things relate to speed, for example if everything isn’t got
ready before service (B)
Breakfast chef doesn’t always do things unless the head chef is
there (A)
Shortage of staff. Staff morale is affected (A)
Sometimes when it is busy we could do with two breakfast chefs
(D)
Sometimes we don’t have enough staff (B)
Night Porter leaves a mess (in the kitchen) that needs to be
cleared before we can start (A)
Quality failures due to
ineffective process
design or
underperformance
Uncontrollable
Underperformance and
quality error
Insufficient labour
Underperformance
Scheduling loss
Underperformance
Underperformance
Underperformance
Scheduling loss
Scheduling loss or
absenteeism
Post-service
Front Desk:
NA
Breakfast:
If tables are not cleared and reset quickly enough (D)
Change overs
Table 5.7: Reported and observed system events that slow throughput at different stages of
the check-in and breakfast processes.
The observed hotels have replaced, or are about to, their internal telephone exchanges with
automated call systems as a cost saving measure. Reservations is only manned until the early
evening after that time all telephone enquiries go to the front desk. The front desks in all

178
hotels were receiving internal and external calls. If front desk clerks were occupied with
guests the telephones were unanswered and no opportunity was provided for callers to leave a
message. This is an issue connected with customer service and only affects throughput time
of check-in if the clerk is talking on the telephone instead of serving the guest present.
System events affecting throughput time were mainly due to ineffective organisation of tasks
leading to underperformance or quality failures. Insufficient resources resulted in delays or
non-service for those on the telephone.
Armistead and Clark (1994) presented a model of capacity management (see figure 2.2) Table
5.8 adapts this model to include categories of capacity leakage in Johnston et al (2012).
Capacity Leakage
Labour lateness /
absenteeism.
Insufficient labour resulting in reduced effective capacity
and perhaps bottlenecks.
Labour
underperformance.
Varying knowledge, motivation or capability of the
workforce.
Quality failures. Rework due to imprecise equipment, substandard
materials or employee errors, perhaps due to lack of
training or insufficient operating procedures.
Scheduling losses. An imbalance between supply and demand resulting in
idle capacity or more demand than capacity can satisfy.
Complexity A broad range of services may mean that staff may
experience requests that are not part of their daily
routine. This may require help from others or re-
learning.
Change-overs. Capacity unavailable while it is prepared for the next
customer.
Table 5.8: Sources of capacity leakage, adapted from Armistead & Clark (1994) and
Johnston et al (2012).

179
The capacity leakage section of the table indicates sources of variability introduced by the
operational system. The findings do not represent an exhaustive list of possible causes. Table
5.5 reported observed reasons for check-ins of over four minutes, some of which were due to
the system, errors also generated requests at the front desk (see table 5.3).
System errors, such as faulty key cards, missing reservations or faults in bedrooms can affect
customer satisfaction but were not a major source of observed time duration variability.
System errors are dysfunctional (Suri, 2010) and abnormal variability (Anupindi et al, 2012)
and mostly treatable and controllable over time.
5.2.5: Variability Summary
In manufacturing literature variability is regarded as the enemy of smooth flow and
productivity (Schmenner, 2004). The greater the degree of customer interaction the greater
the opportunity for customer induced variability (Chase 1981; 1983, Morris and Johnston,
1987). Findings indicate that the two greatest sources of customer variability at check-in are
arrival and request variability while at breakfast it is arrival and preference variability.
Preference and request variability directly affect throughput time, but in different ways.
Preference variability was expressed in the consumption of customers’ own time and required
facilities and materials to accommodate it. Request variability consumed employee time and
thus required constant variations in the number of employees available to satisfy requests.

180
Hotels accommodate variability at the front desk by varying the number of staff available and
ensuring that they are trained to respond to the variety of requests expressed. It will be
revealed later that employees cope with arrival variability by omitting unessential check-in
steps and by being reactive rather than proactive with customers. The main hotel resource
that customers occupy in the restaurant is space, while at the front desk it is labour time. At
breakfast service encounters are very brief, customer labour is used in the restaurant to absorb
the variable demand for labour that accompanies service. Breakfast duration is uncontrollable
and the main limiting resource is the physical capacity.
The system can also be a source of variability and resource limitations can lead to customers
being kept waiting. Generally the main system issues were the organisation of work leading
to labour underperformance and quality failures. In short, there is a variable load on services
and variable process time so there needs to be sufficient physical and labour capacity, or the
ability to vary capacity, if customers are not to be kept waiting. The physical design and thus
capacity of a hotel is fixed in the short term.
5.3: PROCESS CATEGORISATION
Service processes can be categorised as professional services, service shops, mass services
and service factories (Schmenner, 2004). Slack et al (2009) reduce the categorisation to three
as shown in figure 5.1. Tasks at the front desk more closely fit the description of professional
services with low volume and high variety, tasks are diverse and, at times, complex.
Breakfast service more closely fits the description of a mass service where task variety is low

181
and volume is periodically high, generally tasks are simple and repeated. Strategic variability
(spare capacity) is described as desirable for low volume and high variety producers because
it provides the capability to cope with unexpected changes in demand without degradation of
service, to offer product variety and customised products to customers (Suri, 2010).
Figure 5.1: Features of different process types
(adapted from Slack, 2009 and Schmenner, 2004).
Service encounters tend to be very brief in mass services (Schmenner, 2004) but this does not
necessarily mean that throughput time is short. Many services have little or no employee
contact but customers can occupy facilities or equipment for significant periods of time, for
example, computers in a university or internet use. Breakfast service had short encounters but
a relatively long dwell time (median of 24:30 minutes) and demand is squeezed into a short
Professional
Service
Service
shop
Mass
Service
High
Low
Low
High
Variety
Volume
Diverse/
complex
Process
tasks
Repeated/ divided
High Low
Customisation for and interaction with customers

182
period, peak breakfast arrival time was noted as between 7.15am and 8.30am. While
breakfast could be delivered to the room or consumed as ‘grab ‘n go’ the vast majority of
guests preferred to eat in the restaurant.
In contrast at the front desk information is being processed one-to-one with the customer,
only check-in duration was recorded (median of 2:35 minutes) but most requests required
only a brief amount of employee time. Flexible labour and flexible task engagement are used
to accommodate the arrival variability. Requests for service were not confined to a short time
period and were intermittent, employees were able to engage in tasks that do not require the
presence of the customer, thus when no customers are being served staff are still gainfully
employed. The customer also occupies labour capacity throughout the process.
Thus at breakfast one flow unit occupies up to one table (unit of physical capacity) but
demands very little labour capacity; one employee serves many simultaneously. In contrast
each flow unit at check-in occupies one unit of labour and one unit of physical capacity
throughout the process.
Johnston et al (2012) use a slightly different framework for process classification as shown in
figure 5.2. High capability processes tend to be those associated with professional and luxury
services, commodity processes share the features of mass and budget services. Breakfast
service is closer to the description of a commodity process with high volume and low process
variety. While it may appear that there is variety of choice at the buffet, this variety is
delivered by customers to themselves. The style of breakfast service experienced in a variety
183
of types of hotel is very similar to that observed in the four star hotels, however, in cheaper
accommodation the variety of product choice for customers tends to be less. Self-service can
therefore be used to accommodate variety and customisation in low interaction services.
The front desk is closer to the description of a capability process. It experiences high request
variety which necessitates less definition of processes (to allow customisation to the needs of
the customer and activity) and a higher knowledge capability of operators to adapt to the
process variety. Figure 5.1 indicates that task division and repetition are process features that
increase as processes move from being professional to mass services. As noted, some hotels
either had no official check-in procedure or only guidelines. The variety of requests makes it
unlikely that a set procedure could be prepared for each. Task and request variety at breakfast
was much less and staff were allocated different responsibilities during service.

184
Figure 5.2: Volume-variety matrix (Johnston et al, 2012:197).
The contingency-based model (figure 2.7) presented by Posignon et al (2012) categorises
processes as following either a focus or cost leader strategy. The cost leader strategy shares
the features of the mass service and commodity categorisations above and suggests that there
should be reduced customer contact and specialist employees with a low skill level. The
focus strategy is very similar to the professional service and capability categorisations and
recommends employee empowerment and employees with a high level of skill. Generally
this was what was found in the observed processes. But service processes need to be
responsive, especially when the customer is present and experiencing the passing of time.
Johnston et al (2012) recognise that both capability and commodity processes need to be
responsive and, even in commodity processes, this can require some empowerment of
employees to deviate from the standard.
High
Low
Decreasing unit cost Low
Increasing
process
definition
High Volume per unit
Process
variety
‘Simplicity’
‘Complexity’
‘Commodity’
‘Capability’
Many processes lie close
to this spectrum

185
It is clear that the processes observed can be categorised in different ways and that some
processes in a four star hotel may have very similar features to those expected in a budget
hotel. In fact it requires some ‘shoe horning’ to place full service hotels of any standard into a
single category in any categorisation model. The dominant need in mass services is for
physical capacity, in professional services it is for labour capacity. All hotels need to retain a
level of responsiveness and, except perhaps at the budget end, a willingness to customise to
some extent.
5.4: SUMMARY COMPARISON OF THE NATURE OF THE TWO
PROCESSES
As discussed in previous sections there are similarities between the two processes
investigated, for example, unpredictable patterns of arrival and variable process duration.
There are also fundamental differences in how the customer views the process which impact
on appropriate actions towards throughput time (see table 5.9).
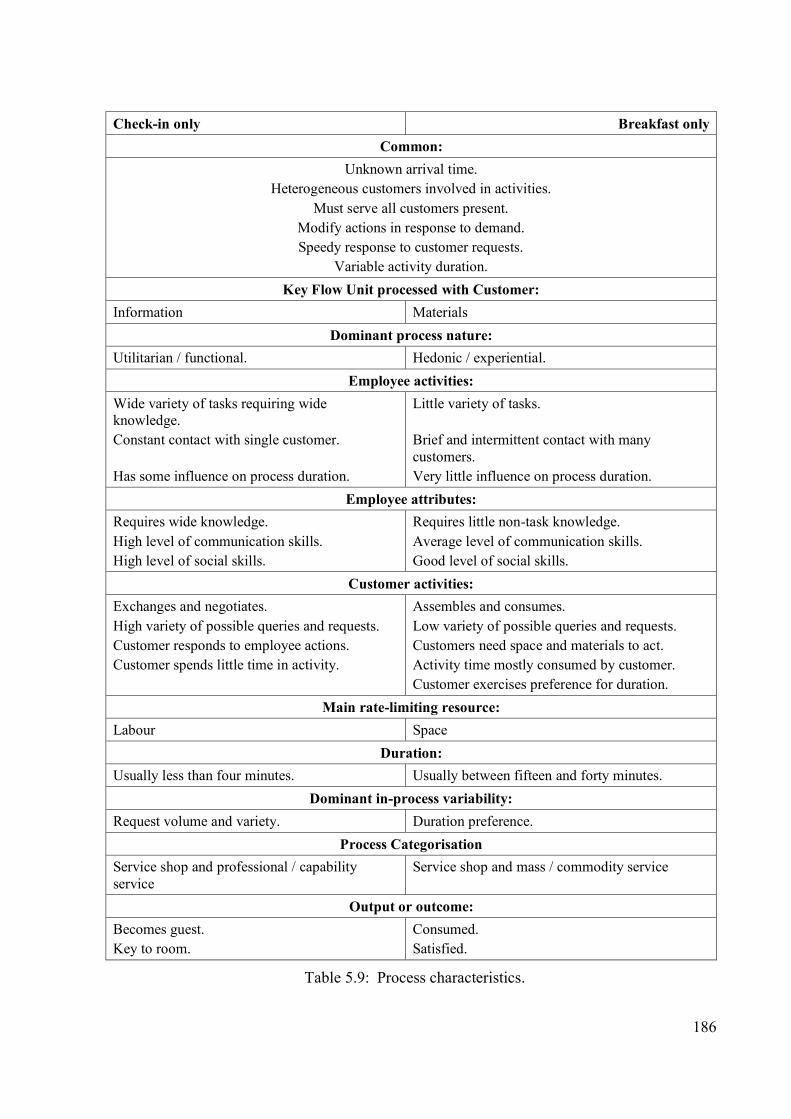
186
Check-in only Breakfast only
Common:
Unknown arrival time.
Heterogeneous customers involved in activities.
Must serve all customers present.
Modify actions in response to demand.
Speedy response to customer requests.
Variable activity duration.
Key Flow Unit processed with Customer:
Information Materials
Dominant process nature:
Utilitarian / functional. Hedonic / experiential.
Employee activities:
Wide variety of tasks requiring wide
knowledge.
Constant contact with single customer.
Has some influence on process duration.
Little variety of tasks.
Brief and intermittent contact with many
customers.
Very little influence on process duration.
Employee attributes:
Requires wide knowledge.
High level of communication skills.
High level of social skills.
Requires little non-task knowledge.
Average level of communication skills.
Good level of social skills.
Customer activities:
Exchanges and negotiates.
High variety of possible queries and requests.
Customer responds to employee actions.
Customer spends little time in activity.
Assembles and consumes.
Low variety of possible queries and requests.
Customers need space and materials to act.
Activity time mostly consumed by customer.
Customer exercises preference for duration.
Main rate-limiting resource:
Labour Space
Duration:
Usually less than four minutes. Usually between fifteen and forty minutes.
Dominant in-process variability:
Request volume and variety. Duration preference.
Process Categorisation
Service shop and professional / capability
service
Service shop and mass / commodity service
Output or outcome:
Becomes guest.
Key to room.
Consumed.
Satisfied.
Table 5.9: Process characteristics.

187
5.5: CAPACITY OF LABOUR AND CAPITAL
The three corners of the process management triangle are variability, capacity utilisation and
inventory (Klassen and Menor, 2007). The sources of variability in process duration have
been revealed and some differences between the processes discussed. There is high variety in
arrival and process duration in both processes. Customers need to feel that their various needs
are met so the aim is to accommodate the variable flow of customers (inventory) rather than
make them wait in buffers (queues). This means that capacity must be designed to cope with
the variability in arrival and processing rates.
Figure 2.9 summarises the key sources of variability uncovered and illustrates the two basic
responses required to manage variable demand. There needs to be spare or flexible capacity
available in the form of capital and labour. Activity consumes time so the number or duration
of the operator’s activities needs to be contained or reduced. Actions implemented to achieve
this are illustrated and important modifications highlighted. Customers and processes are
goal orientated so solutions must be designed to achieve the goals. Generally, for the
understanding of the figure, humans can be thought of as having competences while facilities
and equipment have capabilities. Different services satisfy different needs of customers.
Hospitality customers feel that the operation is there to satisfy them, allowing them to feel
that they have choice and control is an important moderator of time reduction initiatives. The
process must also accommodate the human need for social interaction.
Observations suggest that the hotels largely responded to customer variability by using
flexible labour, space and queuing. At busy times staff in all hotels attempted to reduce the
interaction time by limiting the information given and questions asked to guests. At quieter

188
times staff were able to respond to perceived customer need for ‘chit-chat’. One receptionist
in hotel B was observed to enter a lengthy conversation with a guest about their common
home country.
Capacity consists of the resources available to the operation, generally labour and capital.
Capital is provided in the form of facilities and equipment. Capacity is also defined by the
rate at which flow units are processed. Table 5.15 lists principles that can be applied pre-
process and in-process to remove time and thus increase the capacity to process.
Activity has duration and pace (Noone et al, 2008). The two basic options are to remove an
activity or do it more quickly. According to Seddon (2005), Ohno relates that the principles
he applied to the Toyota Production System were designed to speed up the production
process, this was achieved by the removal of waste, waste being anything that does not add
value (Ohno, 1988). Classing an activity as waste and removing it increases the time
available to employees for work that does add value. In simple terms this is what all the
duration reduction and process simplification tactics are also aiming to achieve.

189
Capacity improvement: Removing time:
Service encounter brevity (process design):
o Move activities off the critical path:
o Move activities to pre-service encounter or post-service encounter.
o Reduce the duration of activities:
o Identify and eliminate non-value-adding activities.
o Simplify the product or service.
o Reduce the frequency of service encounters.
o Give more work to customers.
Capacity improvement: Labour and capital
Employee labour:
o Pre & in-service tactics affecting duration:
o Allocation of tasks to employees to ensure process objectives are achieved.
o Monitor service load and adjust resources and activities as required. Concentrate on the
critical path and bottleneck.
o Do it right the first time:
Conformance standards: Standard way of doing the job.
o Shorten the duration of activities:
Omit activities that are not essential but may be part of the standard operating
procedure.
Do not seek queries from, or interaction with, customers.
Complete activities in parallel instead of serially.
o Work faster, increase the pace.
o Vary labour volume by using:
o Trained part-time and casual staff.
o Cross-trained (flexible) labour.
o Properties: Responsive, reliable, empathic, competent, motivated.
Capital: Facilities and equipment:
Facilities:
o Sufficient space to accommodate all customers on most occasions, this may include rooms
that have more than one use.
o Alternative location of delivery, for example, room service.
o Properties: Layout for ease of access and minimal travelling.
Equipment:
o Sufficient well maintained equipment to serve all customers on most occasions.
o Flexible (e.g. table size) to adapt to party size.
o Self-service equipment.
o Properties: Ease of use, speed of processing, reliability.
Materials:
o Sufficient materials to meet demand.
Supporting the front-line (pre-service planning and organisation):
o Recruitment and training: Select capable employees and train them.
o Maintenance procedures: Keep equipment working.
o Demand management: Influence arrival times to reduce waiting in line.
o Demand forecasting to identify required resources and put them in place.
Table 5.10: Principles to reduce or accommodate variability so that appropriate throughput
time is achieved.

190
5.5.1: Process Design
The role of process design here is to think about the removal of time from processes at the
design stage so that the normal way of working consumes less time. The focus is mainly on
reducing service encounter time so that the customer processing capacity of employees is
increased.
5.5.1.1: Move activities off the critical path
The service encounter is the point at which employees and customers interact; it is on the
critical path. Encounter brevity does not necessarily mean a shortening of the whole process,
instead it focuses on reducing the amount of time that each employee spends with the
customer. Reducing the amount of time spent with a customer increases the processing
capacity of employees.
Where arrivals are lumpy systems experience times when there are no customers waiting for
service and employees need other activities to keep them occupied. Activities can be moved
to pre-encounter or post-encounter. If the activities are uncomplicated then it may be possible
to give them to customers or capture the knowledge in equipment. At breakfast the service
encounter consumes only one or two minutes of a process with a median observed duration of
a little less than 25 minutes (see table 4.1), mostly duration is controlled by the customer. At
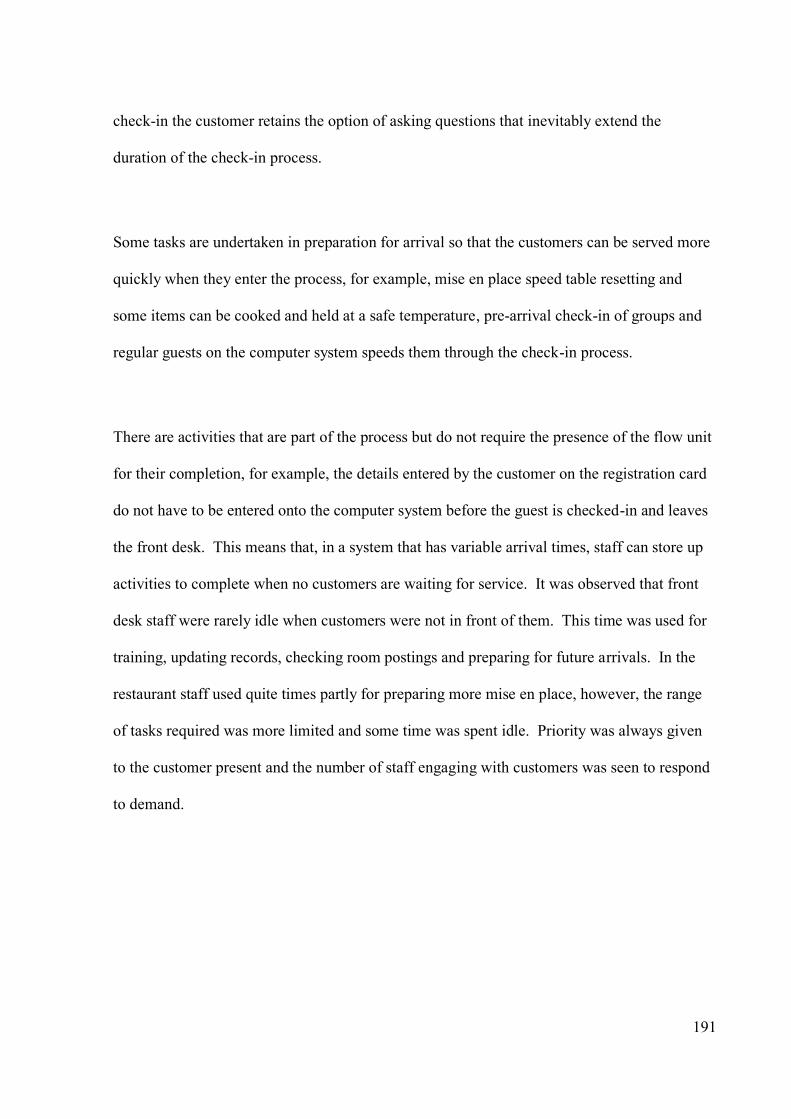
191
check-in the customer retains the option of asking questions that inevitably extend the
duration of the check-in process.
Some tasks are undertaken in preparation for arrival so that the customers can be served more
quickly when they enter the process, for example, mise en place speed table resetting and
some items can be cooked and held at a safe temperature, pre-arrival check-in of groups and
regular guests on the computer system speeds them through the check-in process.
There are activities that are part of the process but do not require the presence of the flow unit
for their completion, for example, the details entered by the customer on the registration card
do not have to be entered onto the computer system before the guest is checked-in and leaves
the front desk. This means that, in a system that has variable arrival times, staff can store up
activities to complete when no customers are waiting for service. It was observed that front
desk staff were rarely idle when customers were not in front of them. This time was used for
training, updating records, checking room postings and preparing for future arrivals. In the
restaurant staff used quite times partly for preparing more mise en place, however, the range
of tasks required was more limited and some time was spent idle. Priority was always given
to the customer present and the number of staff engaging with customers was seen to respond
to demand.

192
5.5.1.2: Reduce the duration of activities
Simplifying the process is about reducing the amount of knowledge and level of skill, making
it more like a commodity process. Reducing the duration of activities is about finding a way
to deliver the same outcome in less time. Each of these tactics may also involve waste
identification and elimination. Simpler processes are also less prone to error and may be
straight-forward enough to either give to customers or incorporate into equipment.
Processes can also be categorised in terms of their frequency and complexity as runners,
repeaters or strangers (Bicheno, 2008 and Johnston et al, 2012). A simpler process, such as
breakfast service that is more of a commodity has uncomplicated tasks that are frequently
repeated. The process variety observed at the front desk indicates that there is much more of
a mix of the three types. Being a stranger (rarely occurring) does not necessarily mean that it
is a complex task, as indicated by the simple request in hotel D for a toothbrush, after much
searching one front desk clerk had to go to the supermarket to buy one. Generally,
simplifying a process reduces the opportunity for error and enables the operation to consider
giving it to the customer to complete.
Tables 5.11 and 5.12 describe the observed common elements of each process to build up a
picture of the process in action rather than as it is described in any of the SOPs. The process
in action is a list of the activities commonly observed to make up the process.
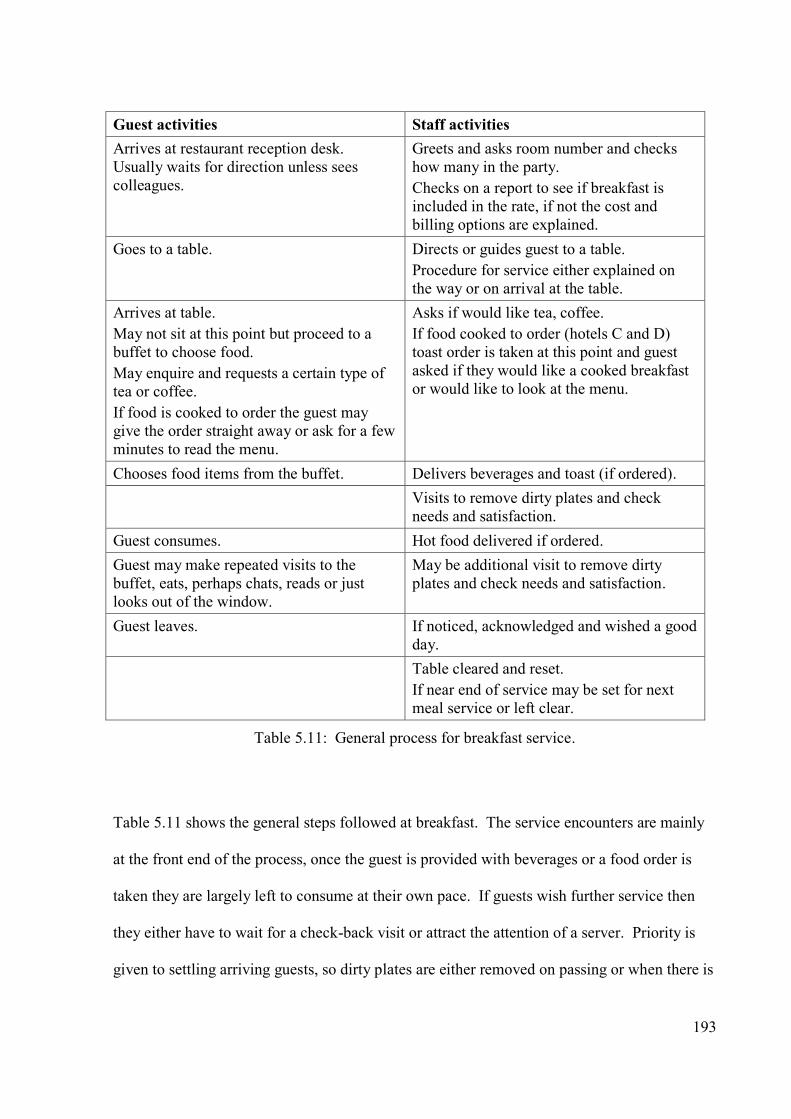
193
Guest activities Staff activities
Arrives at restaurant reception desk.
Usually waits for direction unless sees
colleagues.
Greets and asks room number and checks
how many in the party.
Checks on a report to see if breakfast is
included in the rate, if not the cost and
billing options are explained.
Goes to a table. Directs or guides guest to a table.
Procedure for service either explained on
the way or on arrival at the table.
Arrives at table.
May not sit at this point but proceed to a
buffet to choose food.
May enquire and requests a certain type of
tea or coffee.
If food is cooked to order the guest may
give the order straight away or ask for a few
minutes to read the menu.
Asks if would like tea, coffee.
If food cooked to order (hotels C and D)
toast order is taken at this point and guest
asked if they would like a cooked breakfast
or would like to look at the menu.
Chooses food items from the buffet. Delivers beverages and toast (if ordered).
Visits to remove dirty plates and check
needs and satisfaction.
Guest consumes. Hot food delivered if ordered.
Guest may make repeated visits to the
buffet, eats, perhaps chats, reads or just
looks out of the window.
May be additional visit to remove dirty
plates and check needs and satisfaction.
Guest leaves. If noticed, acknowledged and wished a good
day.
Table cleared and reset.
If near end of service may be set for next
meal service or left clear.
Table 5.11: General process for breakfast service.
Table 5.11 shows the general steps followed at breakfast. The service encounters are mainly
at the front end of the process, once the guest is provided with beverages or a food order is
taken they are largely left to consume at their own pace. If guests wish further service then
they either have to wait for a check-back visit or attract the attention of a server. Priority is
given to settling arriving guests, so dirty plates are either removed on passing or when there is
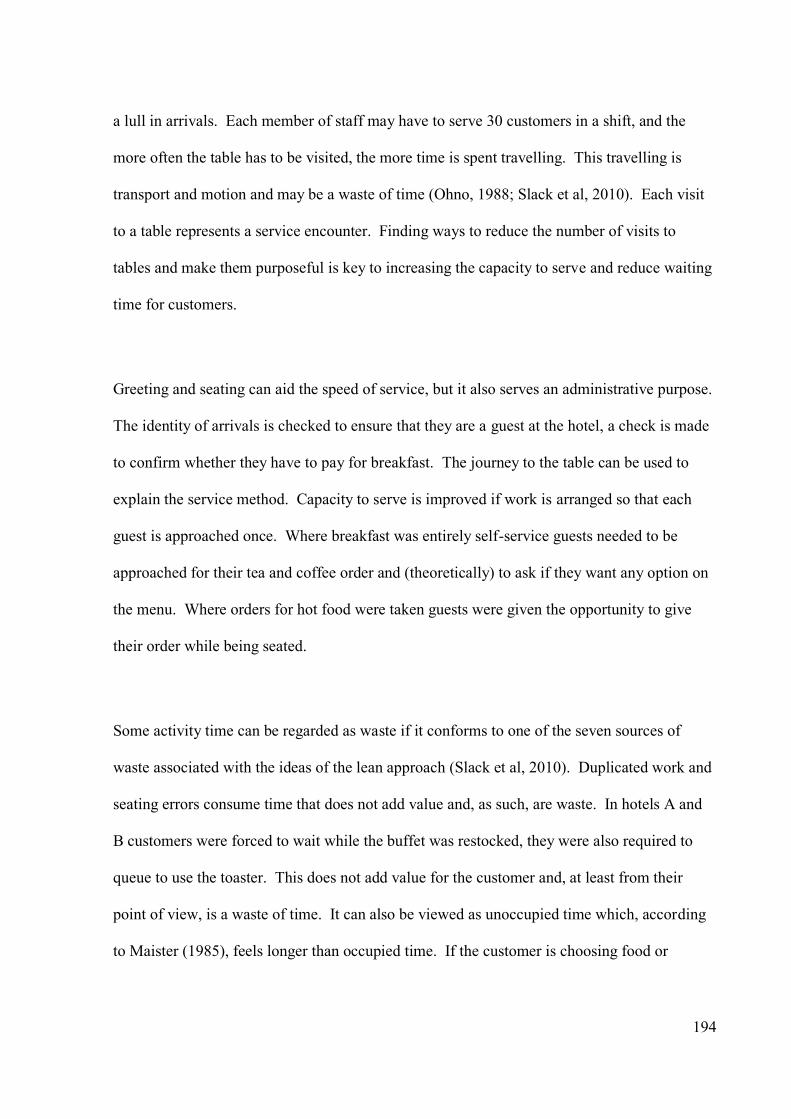
194
a lull in arrivals. Each member of staff may have to serve 30 customers in a shift, and the
more often the table has to be visited, the more time is spent travelling. This travelling is
transport and motion and may be a waste of time (Ohno, 1988; Slack et al, 2010). Each visit
to a table represents a service encounter. Finding ways to reduce the number of visits to
tables and make them purposeful is key to increasing the capacity to serve and reduce waiting
time for customers.
Greeting and seating can aid the speed of service, but it also serves an administrative purpose.
The identity of arrivals is checked to ensure that they are a guest at the hotel, a check is made
to confirm whether they have to pay for breakfast. The journey to the table can be used to
explain the service method. Capacity to serve is improved if work is arranged so that each
guest is approached once. Where breakfast was entirely self-service guests needed to be
approached for their tea and coffee order and (theoretically) to ask if they want any option on
the menu. Where orders for hot food were taken guests were given the opportunity to give
their order while being seated.
Some activity time can be regarded as waste if it conforms to one of the seven sources of
waste associated with the ideas of the lean approach (Slack et al, 2010). Duplicated work and
seating errors consume time that does not add value and, as such, are waste. In hotels A and
B customers were forced to wait while the buffet was restocked, they were also required to
queue to use the toaster. This does not add value for the customer and, at least from their
point of view, is a waste of time. It can also be viewed as unoccupied time which, according
to Maister (1985), feels longer than occupied time. If the customer is choosing food or

195
consuming food while waiting for the delivery of an order then that time is not waste from
their viewpoint.
Mostly in hotels A, B and D checking in a guest started with finding the name of the guest on
the reservations system. Software acts as a guide and rigidly imposes steps on the user. All
hotels used the same software on the front desk so the sequence and steps followed are very
similar. Hotel C followed a different tactic, generally rooms were pre-assigned and
registration cards pre-printed, system check-in was generally conducted after the guest had
left to go to the room. Note that hotel C had a median check-in time of 1 minute and 52
seconds, 30 seconds faster than hotel A and 90 seconds faster than hotel B, however it should
also be noted that 4 minutes was regarded as an acceptable time target by Vallen & Vallen
(2009) and the front office manager in hotel A. Table 5.12 shows the general check-in
process, although this did vary slightly between hotels. The guest is guided through the
process, interacting with the employee until the process is complete.

196
Guest activities Staff activities
Arrives in foyer and either joins the queue
or approaches the front desk.
If the clerk is busy eye contact is avoided
until ready for the next guest.
At the front desk.
Guests usually announce the reason for
being there and give their name or the name
under which they think the reservation may
be made.
Eye contact, smile, greet.
Will ask how they can help if no reason is
given.
May ask the guest to repeat or spell the
name.
If system does not indicate, may ask at this
point if they have stayed before.
Guest finds card, says no to loyalty offer or
asks more about it.
Ask if guest has a loyalty card, if not
whether they would like to join.
May need to respond to guest questions or
find leaflet about the scheme.
Respond to any comments or questions.
If been before a preferred room or location
may be requested.
Check-in screen selected and loaded.
Part of name typed in and a list starting with
those letters appears. If the name appears
more than once the first initial is requested.
May ask about their journey or comment on
the weather to avoid silence while the
system finds the reservation.
Guest may be offered a choice of room
location.
Guest may do one of the following;
Enquire if under a company or lead booker
name.
Search self or phone for reservation
confirmation.
Make a telephone call.
If not found the guest is asked for a copy of
the reservation confirmation.
May need to search under a different name
or call a reservations agent just in case the
reservation has not been transferred to the
hotel system.
Guest confirms or disputes details.
Guest may need to think a moment about
breakfast before giving response.
Details are checked verbally.
If address is missing a post code is
requested; system looks up addresses at that
post code; guest is asked to confirm house
number.
If breakfast is not included in the rate they
may be offered opportunity to add it at
check-in.
May require phone call to a reservations
agent or booking agent to check details.
Guest finds and produces passport. If non-UK guest a passport may be
requested and photocopied.
Checks and signs, usually in two places, the
registration and the key card wallet.
Registration card printed. Guests asked to
check details and fill in any missing contact
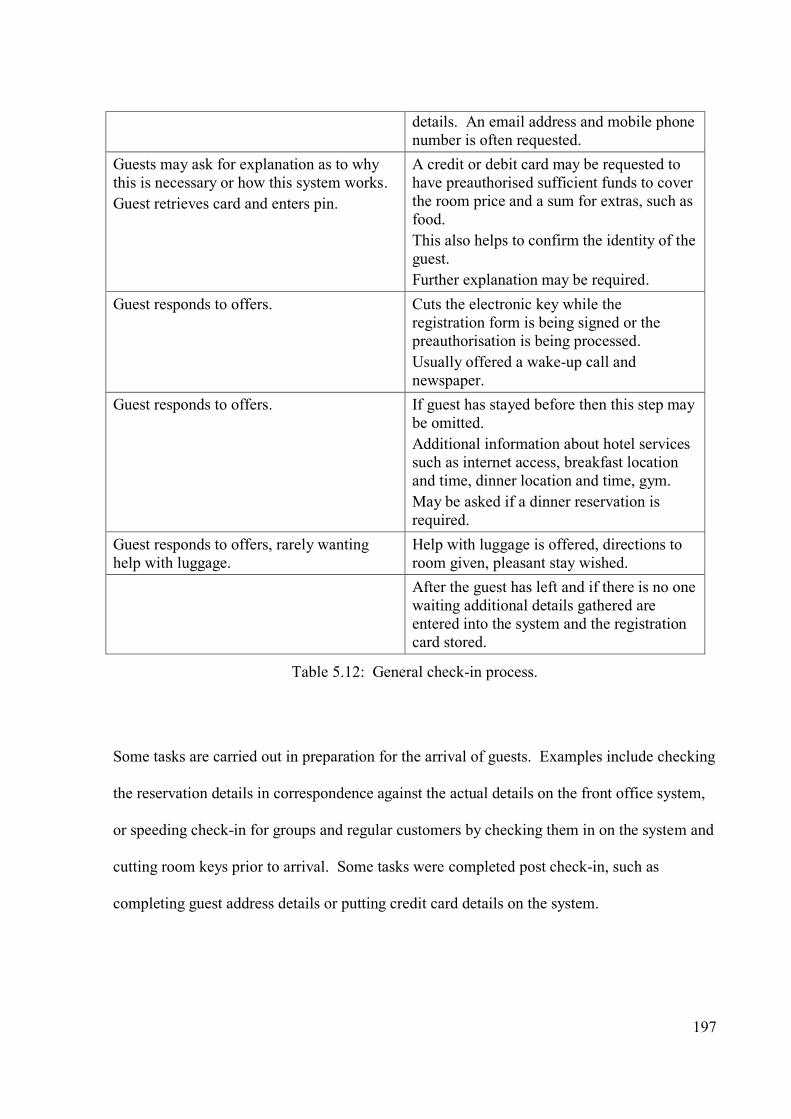
197
details. An email address and mobile phone
number is often requested.
Guests may ask for explanation as to why
this is necessary or how this system works.
Guest retrieves card and enters pin.
A credit or debit card may be requested to
have preauthorised sufficient funds to cover
the room price and a sum for extras, such as
food.
This also helps to confirm the identity of the
guest.
Further explanation may be required.
Guest responds to offers. Cuts the electronic key while the
registration form is being signed or the
preauthorisation is being processed.
Usually offered a wake-up call and
newspaper.
Guest responds to offers. If guest has stayed before then this step may
be omitted.
Additional information about hotel services
such as internet access, breakfast location
and time, dinner location and time, gym.
May be asked if a dinner reservation is
required.
Guest responds to offers, rarely wanting
help with luggage.
Help with luggage is offered, directions to
room given, pleasant stay wished.
After the guest has left and if there is no one
waiting additional details gathered are
entered into the system and the registration
card stored.
Table 5.12: General check-in process.
Some tasks are carried out in preparation for the arrival of guests. Examples include checking
the reservation details in correspondence against the actual details on the front office system,
or speeding check-in for groups and regular customers by checking them in on the system and
cutting room keys prior to arrival. Some tasks were completed post check-in, such as
completing guest address details or putting credit card details on the system.

198
There are several objectives of the check-in process, most of which are administrative. It is
important to confirm the identity of the guest to ensure that they are who they claim to be and
that they are matched to the correct reservation. The hotel also wants to minimise the risk of
loss, preauthorisation both helps confirm the identity of a guest and ensures that the hotel will
receive payment for goods and services provided. Some guests have pre-paid for the
accommodation, whilst others have arrangements in place for the bill to be settled by a third
party. A few guests have an arrangement that gives them an allowance for additional
expenditure, usually this is limited to food but may also include an allowance for drinks.
Once the process was explained guests were compliant and allowed preauthorisation. Guests
are learning the expectations of the system.
Group guests are usually pre-registered to speed check-in. The mini bar is locked and the
room telephone barred from making external calls (hotel A and B), if guests want these
services then they have to return to the front desk and offer a card for preauthorisation. When
group guests arrive they are usually presented with a registration slip to sign and are given a
pre-cut key for their room. If the group is from overseas then at least one passport may be
requested for copying (hotel B).

199
A B C D
Acknowledge and greet X X X X
Name X X X X
Stayed before? X X X
Loyalty Club member? X X
Want to join? X X
Check room type and duration X X X X
Request passport X X X
Add breakfast? X X X
Request payment card to swipe X X X X
Print registration card X X X
Ask guest to check details and
sign
X X X X
Cut key X X X
Describe hotel services, facilities
and times
X X X
Dinner reservation? X X X X
Newspaper? X X X X
Wake-up call? X X X X
Direction to room X X X X
Help with luggage? X X X X
Table 5.13: Steps frequently observed during check-in.
Table 5.13 shows the frequently observed check-in steps in each hotel. Observations noted
that hotel C had the shortest median check-in duration (see table 4.4). It can be seen from
table 5.13 that it had reduced the number of check-in steps. The registration card was pre-
printed, there is no loyalty scheme to communicate. No key was cut because traditional keys
were used, details of the hotel's facilities were not given and (contrary to statutory instrument
1972/1689) details of passports were not recorded.

200
There is evidence that the check-in process has been standardised over time by the application
of technology. Information and Communications Technology standardises processes as
software and thus captures some of the knowledge of how to perform a process. The software
captures tacit knowledge making it easier to learn the check-in process and reduces the
opportunity for employee error. All hotels used the same front office software so software
differences cannot account for different mean check-in times. Booking systems can pass
reservation information to hotel systems reducing the need to collect or re-key data such as
address details. It was observed however on frequent occasions that guest addresses and even
names were not presented on the check-in screen on arrival. Insufficient or incomplete
information is being keyed into the system by other departments, speeding their tasks but
slowing check-in.
Observations indicate that hotels take action to reduce the number of activities and the
duration of activities using the tactics in table 5.10. Employees make further reductions when
they perceive that customers are being required to wait for service. Customers are permitted
to set their own pace at breakfast but may be subtly discouraged from extending the check-in
process.
5.5.1.3: Customer Labour
Self-service allows the organisation to substitute employee labour with equipment and
customer labour. Process activities are passed from the employee to the customer reducing
the time that each employee is required to spend interacting with customers or completing

201
tasks on their behalf. This reduces service encounter duration allowing fewer staff to cope
with a larger number of customers. In the case of food self-service it removes the time
required to read menus, the wait for the order to be taken and the wait for food preparation.
Potentially this shortens meal duration and increases table turnover. Self-service requires that
customers are capable of doing the work and are motivated to do it themselves. Frei (2006)
reported that the preference for customers at one bank was to be served rather than to serve
themselves. A detailed discussion of motivation and capability is beyond the scope of this
paper. Utility (control, saving time, saving money), social acceptance and enjoyment can be
motivators according to Curran and Meuter (2007). Kim et al (2012) suggest ease of use,
saved time and overall convenience are important.
None of the hotels had facilities for self-service check-in. All four provided self-service for
cold breakfast items, hotels A and B provided self-service for hot items while hotels C and D
had waiter service. Table 4.3 revealed that guests who ordered cooked breakfast stayed a
median time of twenty eight and a half minutes while guests who did not order hot breakfast
stayed for a little over twenty two and a half minutes. These findings indicate that self-service
of hot food at breakfast has little impact on dwell time.
Hot food service is designed to be speedy. Some food items can be cooked in batches in
advance (pre-service) and held at a safe temperature for some time, these tend to be the items
that take longer to cook. It is mainly eggs that need to be cooked to order. Hotel A placed a
cook behind the hot counter to fry eggs; other orders were directed to the kitchen. Research
by Hwang and Lambert (2009) reported that customers report being satisfied with order to
delivery waits of up to fifteen minutes in a casual dining restaurant. Approximately 10% of
202
breakfast orders took more than fifteen minutes to deliver, the longest wait being twenty two
minutes. It was reported that hotels had only one breakfast chef, so a number of orders in
quick succession can quickly lead to a backlog and delays. To keep customers occupied
during the wait employees attempted to take hot food orders at the time of seating, customers
could then pass the time eating cold items or toast. Hotel C reported that some regular guests
telephone the restaurant with their order so that it can be ready shortly after their arrival. It
was noted that a very few guests started to appear a little agitated after 10 minutes waiting. It
also needs to be remembered the researcher was surprised how many guests did not appear to
be in a hurry and spent significant amounts of time occupied but not eating.
Check-in occupied only around 20% of front office staff time, the most observed source of
variation was the range of customer requests. If time is to be removed from front office
processes then the reduction or elimination of other front office tasks also needs to be
considered. Where the service requires only information then information technology is the
required self-service tool.
Research into self-service technology assumes the cost saving benefits and concentrates
mainly on the suitability of technology and its effect on customer satisfaction, for example
Kim el al (2012). Technology that moves parts of the check-in process to the time before the
guest arrives at the hotel clearly can have an impact on check-in time. Technology that allows
guests to use mobile phones as room keys has existed for several years. Openways
(www.openways.com), for example claims that its technology is compatible with over 5.8
billion phones. Guests can check-in by computer, mobile phone or telephone before arriving
at the hotel. A text and an acoustic key are sent to the customer.

203
In summary self-service can pass tasks to the customer reducing employee labour input.
Consumable items can be self-selected by customers but only if they are not immediately
perishable. Technology offers the scope for passing information tasks to customers.
5.5.2: Removing time in-process
Observations suggested that employees respond to the increasing arrival rate by adjusting they
content of work. Sometimes steps were omitted from the check-in procedure. Employees
‘cut the chit-chat’, and focused on essential conversation.
Noone et al (2010) observed 165 check-ins at a 399 room full-service city centre hotel and
were concerned with conformance with a standard procedure rather than process duration.
None of the observed check-ins completed all steps in the standard procedure. No guests
were asked about pillow preference or offered enrolment in the loyalty scheme. Generally
only those steps, for which staff could be held accountable, such as swiping a credit card,
were completed on most occasions. As observed in Birmingham hotels, staff cut steps when
check-in queues were long, supporting Noone et al (2010) who suggested that queues were a
main reason for cutting steps.
If an activity does not add value for the customer and is not required by the system it can be
classified as waste (Ohno, 1988). Assessment of customer satisfaction can be regarded as a
judgement of value. Noone et al (2010) assessed the satisfaction of customers with different
elements of the process. Information exchanged in the preferences stage included room type,

204
pillow type, newspaper and smoking preference. The lasting impression group included
offering luggage assistance, using the guest’s name, smiling, maintaining eye contact, thank
for choosing the hotel and wishing a pleasant stay (Noone et al, 2010). The steps that seemed
to have no effect on satisfaction are mainly the necessary transactional steps of check-in.
Displaying behaviours that communicate to the guests that they are welcome and valued
appear to contribute to feelings of satisfaction. Employees appear to be aware of this
indicating an empathy with customers and an understanding of what really matters to them:
all observed hotels completed the essential steps and the ‘lasting impression’ actions.
Appropriate throughput time therefore includes essential procedural activities and activities
that have a positive impact on customer satisfaction, but excludes activities that don’t add
value for the customer. Standard operating procedures can be revised to reflect this and
perhaps alternative ways of communicating additional information explored.
Table 5.14 shows short-term in-service actions taken to cope with demand peaks during
service. The key tactics were to ensure that all check-in points were staffed and the check-in
process was restricted to essential actions. In hotel B a staff member also went into the queue
to identify queries that did not require the use of the front desk system.

205
Action Evidence
Let queues form or control entry
to the system. Front desk customers organised their own queuing
system, they can see when servers are occupied.
Restaurant used ‘please wait here to be seated’ sign, so staff can note entry to the system.
Allocate more labour and
equipment if available. Staff taken off back-office jobs.
Staff brought in from other departments.
Table settings borrowed from another department.
Prioritise to focus on customers
present. Tables initially not cleaned and reset.
Initially neglect buffet re-stock.
Telephones unanswered.
Store up administration tasks for later.
Allocate task specialisations to
organise work and avoid
duplication.
Greet and seat.
Split restaurant into stations.
Table busser (clears and resets tables).
Deal with enquires in the queue that don’t need the
check-in terminal.
Shorten the encounter and reduce
the number of steps or encounters. Reduced conversation with guests.
Fewer check-back visits to tables.
Encourage food order on seating guest at table.
Let group guests seat themselves.
Leave out non-essential check-in steps.
Work at faster pace.
Respond to a guest request rather than offering the normal range of services.
Generally reactive rather than proactive response
to service provision.
Table 5.14: Observed in-service actions to cope with increased demand.
Service is created in response to demand and in the presence of the customer so employees
must also have the authority and capability to be responsive to the varying levels of demand
and the varying personal needs of customers as they perceive them during service.

206
5.5.2.1: Increase pace
Hotels are different from other services and hospitality generally, they need to make guests
feel important, valued and welcome and create a feeling of a home away from home (Crick
and Spencer, 2011), remember customers also need to feel in control (Namasivayam and
Mount, 2006). This cannot be achieved by forcing the pace of customers. While working in
industry the researcher experienced many late nights waiting for guests to leave the bar and go
to bed. As in many situations, the duration and pace of service is set by the customer who
consumes at the slowest pace. Customers assess their satisfaction with services - satisfying
customers consistently can be a source of differentiation and an essential ingredient for
success (Kandampully, 2006).
Research into customer satisfaction with meal duration indicates that customers may choose
to linger and be in control of departure time (Hensley and Sulek, 2007). Reducing dining
time may change the nature of the experience, but speeding up activities may result in
customers feeling rushed which can impact adversely on satisfaction (Noone et al, 2007).
Self-service allows customers to select a pace that suits their needs. Providing sufficient
facilities, materials and equipment allows customers control of duration.
One of the tactics mentioned in table 5.10 suggests that more customers can be served by
working faster. Noone et al (2009) indicate that both slow pace and fast pace can be
detrimental to customer satisfaction when delivering hedonic services. This is further
evidence that actions to improve throughput time should focus on what is appropriate from
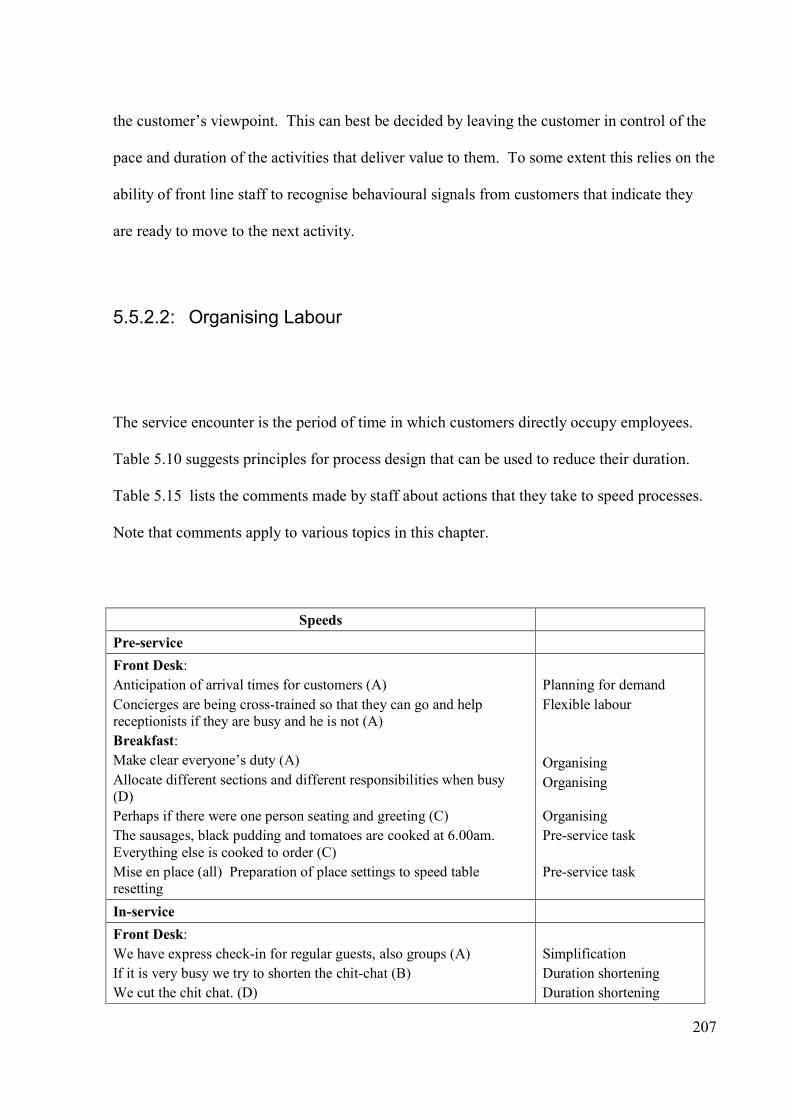
207
the customer’s viewpoint. This can best be decided by leaving the customer in control of the
pace and duration of the activities that deliver value to them. To some extent this relies on the
ability of front line staff to recognise behavioural signals from customers that indicate they
are ready to move to the next activity.
5.5.2.2: Organising Labour
The service encounter is the period of time in which customers directly occupy employees.
Table 5.10 suggests principles for process design that can be used to reduce their duration.
Table 5.15 lists the comments made by staff about actions that they take to speed processes.
Note that comments apply to various topics in this chapter.
Speeds
Pre-service
Front Desk:
Anticipation of arrival times for customers (A)
Concierges are being cross-trained so that they can go and help
receptionists if they are busy and he is not (A)
Breakfast:
Make clear everyone’s duty (A)
Allocate different sections and different responsibilities when busy
(D)
Perhaps if there were one person seating and greeting (C)
The sausages, black pudding and tomatoes are cooked at 6.00am.
Everything else is cooked to order (C)
Mise en place (all) Preparation of place settings to speed table
resetting
Planning for demand
Flexible labour
Organising
Organising
Organising
Pre-service task
Pre-service task
In-service
Front Desk:
We have express check-in for regular guests, also groups (A)
If it is very busy we try to shorten the chit-chat (B)
We cut the chit chat. (D)
Simplification
Duration shortening
Duration shortening
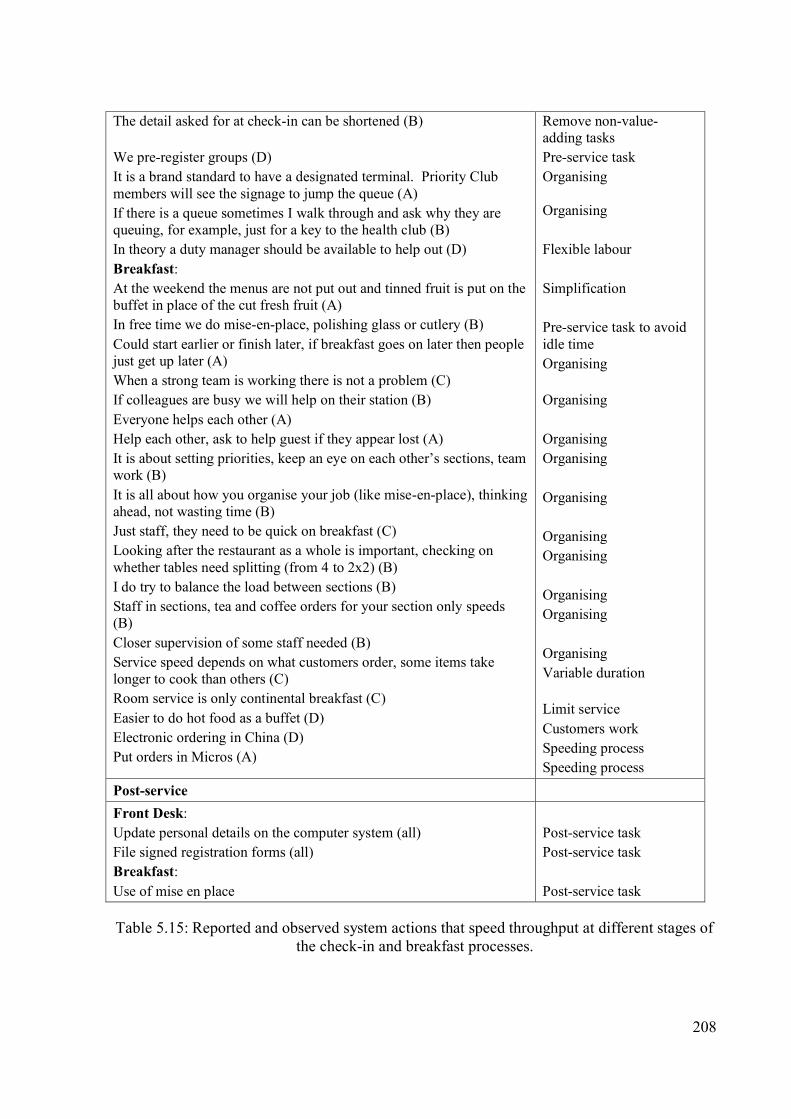
208
The detail asked for at check-in can be shortened (B)
We pre-register groups (D)
It is a brand standard to have a designated terminal. Priority Club
members will see the signage to jump the queue (A)
If there is a queue sometimes I walk through and ask why they are
queuing, for example, just for a key to the health club (B)
In theory a duty manager should be available to help out (D)
Breakfast:
At the weekend the menus are not put out and tinned fruit is put on the
buffet in place of the cut fresh fruit (A)
In free time we do mise-en-place, polishing glass or cutlery (B)
Could start earlier or finish later, if breakfast goes on later then people
just get up later (A)
When a strong team is working there is not a problem (C)
If colleagues are busy we will help on their station (B)
Everyone helps each other (A)
Help each other, ask to help guest if they appear lost (A)
It is about setting priorities, keep an eye on each other’s sections, team
work (B)
It is all about how you organise your job (like mise-en-place), thinking
ahead, not wasting time (B)
Just staff, they need to be quick on breakfast (C)
Looking after the restaurant as a whole is important, checking on
whether tables need splitting (from 4 to 2x2) (B)
I do try to balance the load between sections (B)
Staff in sections, tea and coffee orders for your section only speeds
(B)
Closer supervision of some staff needed (B)
Service speed depends on what customers order, some items take
longer to cook than others (C)
Room service is only continental breakfast (C)
Easier to do hot food as a buffet (D)
Electronic ordering in China (D)
Put orders in Micros (A)
Remove non-value-
adding tasks
Pre-service task
Organising
Organising
Flexible labour
Simplification
Pre-service task to avoid
idle time
Organising
Organising
Organising
Organising
Organising
Organising
Organising
Organising
Organising
Organising
Variable duration
Limit service
Customers work
Speeding process
Speeding process
Post-service
Front Desk:
Update personal details on the computer system (all)
File signed registration forms (all)
Breakfast:
Use of mise en place
Post-service task
Post-service task
Post-service task
Table 5.15: Reported and observed system actions that speed throughput at different stages of
the check-in and breakfast processes.

209
The effect of employees on throughput time is due to much more than task competence.
People are a reflective resource with the power to predict the likely effect of changes in
behaviour on the outcome of a situation. The observations and interviews reveal that the
division and distribution of activities among employees has an effect on throughput time (see
table 5.15). The achievement of objectives relies on the division of work. Supervisors are in
the front line of ensuring that work gets done as management requires (Mullins, 1998; Evans,
1999). Employees need to be able to monitor the demands on the system and take immediate
action to adjust resources or processes, “to be responsive by ensuring that the necessary rules
of order within an organization do not interfere with the performance of a task which the
customer requires” (Riley, 1996:171).
Ineffective task allocation or execution can result in task repetition, a task repeated is waste.
At one time in hotel D, when the restaurant was quite busy, the role of allocating tables was
assigned to one person, at one point he lost track and assigned a table to an arriving guest
while the guest previously assigned the table was visiting the buffet. On another occasion a
table was approached twice for a food order. These situations can be avoided by making
changes on the table as signals for occupancy or activity completion. Hotel A turned over
cups when a decision had been made about beverage ordering, in hotel C menus were
removed after hot food was offered or an order taken. Other signs experienced include
shaking the napkin into the guest’s lap to indicate occupancy or turning the menu upside
down. The lack of the comprehensive use of signals is an indication that either the knowledge
of supervisors is incomplete or staff can manage without the need for signals.

210
Employees need to be responsive, another term for having the authority to be responsive to
customer requirements is ‘empowered’ (Riley, 1996). Although Gazzoli et al (2010) found
that empowerment does not have a direct effect on the perception of service quality it is clear
that, in the processes observed, if staff did not demonstrate responsiveness and reliability then
delays in throughput time may have impacted on perceived service quality. Perhaps
customers do not always perceive empowerment or the effect that it has. According to Ro and
Chen (2011) empowerment involves bending the rules to please customers and providing a
fast response to customer requests and service failures. Kildas (2007) adds that this is
particular important in luxury hotels where the expectations of customers are higher. Changes
to service delivery were observed that indicate front-line staff either take the power or are
empowered to alter service to suit the situation. In hotel A the breakfast supervisor appeared
to be selective when it came to showing guests to tables or checking their room numbers. In
hotel B front desk staff were observed to shorten the check-in process when customers were
waiting. Hotel C took no copies of overseas guest’s passports while the observation of this
legal requirement appeared to be applied patchily in all other observed hotels. Discretion to
make decisions on resource usage is an important power in situations where service is created
and consumed simultaneously but discussion of it in any detail is beyond the brief of this
thesis.
It appeared that arrivals were monitored and in-service action was taken to respond to the
arrival rate. On most occasions arrivals were required to wait at the entry point to the process.
Asking customers to wait on service entry aids speed of service by ensuring that employees
are aware that a new customer has arrived and requires service. Some customers waited at the
restaurant entrance even when no notice was present while a few ignored the notice. The

211
main exception to this was when hotel A was occupied by athletic teams when self-seating
achieved the appropriate goal of maximising seat occupancy. Another purpose of greeting
and seating guests is to establish the expected party size and allocate a table of a suitable size.
If parties occupy tables with more seats than they need then capacity is left unoccupied while
guests may need to wait for a table, waiting extends throughput time.
One more reason for the ‘greet and seat’ model in restaurants is to distribute the service load
among stations. Frequently employees are assigned a section of the restaurant to look after.
Spreading the load among sections aids throughput time. If employees have too many tables
to look after they may lose track of who has been served or may leave tables waiting for
service.
5.5.2.3: Vary labour volume in response to demand
There are limits to the extent to which tasks can be given to customers, steps cut from
processes or work pace increased, sometimes the volume of labour needs to vary. Labour has
the capacity to produce and absent labour can be seen as a leakage of capacity (Armistead &
Clark, 1995). A common response to demand variability is to employ staff on a part-time and
casual basis (Pullman and Rodgers, 2009). Although the question was not asked it was
discovered that many non-supervisory staff are students employed on a ‘zero hours’ contract,
meaning that they are not guaranteed any hours but are brought in as required. Having labour
that is capable of fulfilling more than one role enables organisations to move labour around to
where it is needed most. It can also mean that some labour can experience multiple requests

212
for its services. Examples of this include the receptionist called away to serve at the bar
(hotel B), the receptionist called to find items for a guest (iron and toothbrush in hotel D), the
need to be a luggage porter and receptionist (all hotels), the need to serve in the restaurant and
respond to room service requests (all hotels). Hotel B reported that staff had been brought
into the restaurant from other departments to help with breakfast. This was also observed in
hotel D. In hotel D it was noted that management are supposed to come and support reception
as needed. Hotels A and C were cross-training the concierge to help with check-in. The
knowledge and skill requirements of front office tasks means that there is a lot to learn before
an employee can be deemed competent, in contrast little knowledge or skill is required to
serve breakfast, perhaps because of this only management were observed helping at the front
desk.
There is some debate over the difference in meaning between competence and capability
(Slack and Lewis, 2011) and the words are sometimes used interchangeably. Capability can
be a description of the necessary competences required to complete the activities of the job
(Lawson in Fleetwood and Ackroyd, 2004). Work is the application of knowledge, only some
of this knowledge is acquired in training. Knowledge develops through the experience of
doing the task (Polanyi, 1962). It can therefore be expected that less experienced staff will
take longer to complete activities or may not have the confidence to ‘crash’ the task.
A vivid example of this was noted in hotel C where bedrooms have names and not numbers,
and traditional keys are used rather than key cards. One receptionist had only been a short
time in the post and took a noticeable amount of time to locate the requested bedroom key
while the experienced receptionist knew immediately where the key could be located. In

213
hotel A it was noted that the observed receptionist followed the standard procedure for check-
in on most occasions, while in hotels B and C it was noted that the steps followed varied
depending on the number of guests waiting and whether the guest was recognised as a repeat
customer. Chapman and Lovell (2006) argue that the hospitality service encounter is often in
the hands of poorly trained front-line employees and inexperienced supervisors. Breakfast
staff in hotel A reported that the supervisor did not have time to train staff. The front desk
offers more opportunities for on the job training. Lulls in service were used in hotels C and D
to train novice employees. Chapman’s assertion must be taken as a generalisation, restaurant
supervisors in hotels A and D had been in the posts for at least 10 years, while the front office
supervisor in hotel C had been in the post for four years.
5.5.3: Capital: The role of facilities and equipment
Facilities and equipment represent capital and are part of the physical capacity. Customers
come to the facility and it is a site for production and consumption. This section identifies the
key properties of facilities and equipment that affect throughput time. Facilities and
equipment are created by combining and shaping physical entities to achieve stated objectives
(Stipanuk, 2006). Equipment is a tool, and knowledge is embedded in the functionality of the
tool (Polanyi, 1962). One of the considerations in the shaping of tools is their utility in
reducing the amount of effort required: generally animals regard effort as a cost. Reduced
effort often means reduced activity time.

214
The size of spaces and the amount of space that each flow unit (customer) needs fixes the
maximum capacity volume at a point in time. Hotels advertise different maximum function
room occupancies based on different setups, the equipment occupies space that could be
occupied by customers. Ohno’s (1988) sources of waste include the time consuming wastes
of movement and transport, these are directly attributable to the proximity of related functions
and the layout of equipment.
5.5.3.1: Facility size and placement of functional spaces.
The size of physical facilities and the placement of activities in relation to each other can have
an impact on throughput time. Physical capacity in the form of internal space is fixed in the
short and medium term (Wild, 2002; Pullman and Rogers, 2009). Physical capacity can have
some flexibility by having partitioned or adjoining spaces that can be pressed into service in
response to forecast demand Transport is a waste (Ohno, 1988), having to carry items over a
distance is non-value-adding time.
Hotels are often in old buildings (such as hotel D) or in buildings adapted from other uses
(such as hotel C). Facility design decisions may have been made at a time when service
methods or expectations were different. In hotel C the kitchen was located approximated 30
meters from the restaurant. In hotels A, B and D the buffets were placed close to the kitchen
to reduce the travelling distance of staff. Travelling distance of the customer does not appear
to have been taken into account. The restaurant supervisor in hotel D commented that a hot
self-service buffet was desirable but that it would take away space needed for tables. Space is
215
required to allow guests time to consume at their chosen pace. Decisions about the service
method are therefore influenced by the requirement to balance the spatial needs of the
customer and those of the operation. Operational performance may also be compromised by
the design of the building.
The number of tables and covers that can be fitted into the breakfast restaurant limit the
number of customers that can be served at any one time. Table 5.1, however, showed little
commonality in the relationship between the number of bedrooms and the size of the
restaurant. The impossibility of predicting arrival times, party size and dining duration must
mean that the required room to table ratio to avoid queuing can hardly be known. Where
demand is known capacity is not designed to accommodate all high demand periods (Dickson
et al, 2005). Occasional waiting and degradation of service is therefore inevitable.
Check-in requires sufficient physical space for customers to gather. The presence, layout and
speed of equipment plays a significant role in throughput time. Breakfast, however, does not
have to be delivered in the restaurant and check-in does not have to take place at the front
desk. Room service absorbs labour capacity but serves breakfast in a different location.
Varying the service method, for example ‘grab ‘n’ go’, may also tempt some customers to
change their consumption location. The nature of check-in and advances in technology mean
that check-in can take place before arrival at the hotel. Operators can, therefore, consider
reducing the load on limited capacity by moving the delivery of the service to a different
location. This can involve a change to the nature of the service and, to be attractive to
customers, the change must deliver them sufficient benefit.

216
5.5.3.2: Equipment presence, layout and speed
The role of technology in self-service was discussed in an earlier section. The term
equipment is used here to mean all of the reusable items that support service creation and
delivery; it includes furniture, service equipment, tableware and machinery. Equipment needs
to be sufficient and in a usable condition, it forms part of the physical capacity. The speed
with which machines can complete a task can also impact on the throughput rate. The role of
maintenance will be discussed in a later section.
Staff in some hotels reported that insufficient glassware, crockery and cutlery required staff to
occasionally spend time washing-up instead of serving customers. Crockery and glassware
are fragile, cutlery sometimes gets dropped in the waste bin as plates are scraped. Interviews
in hotel A indicated that management were slow to make-up shortfalls. Table 5.16 shows the
comments made at interviews regarding the role of equipment in speeding or slowing
throughput.
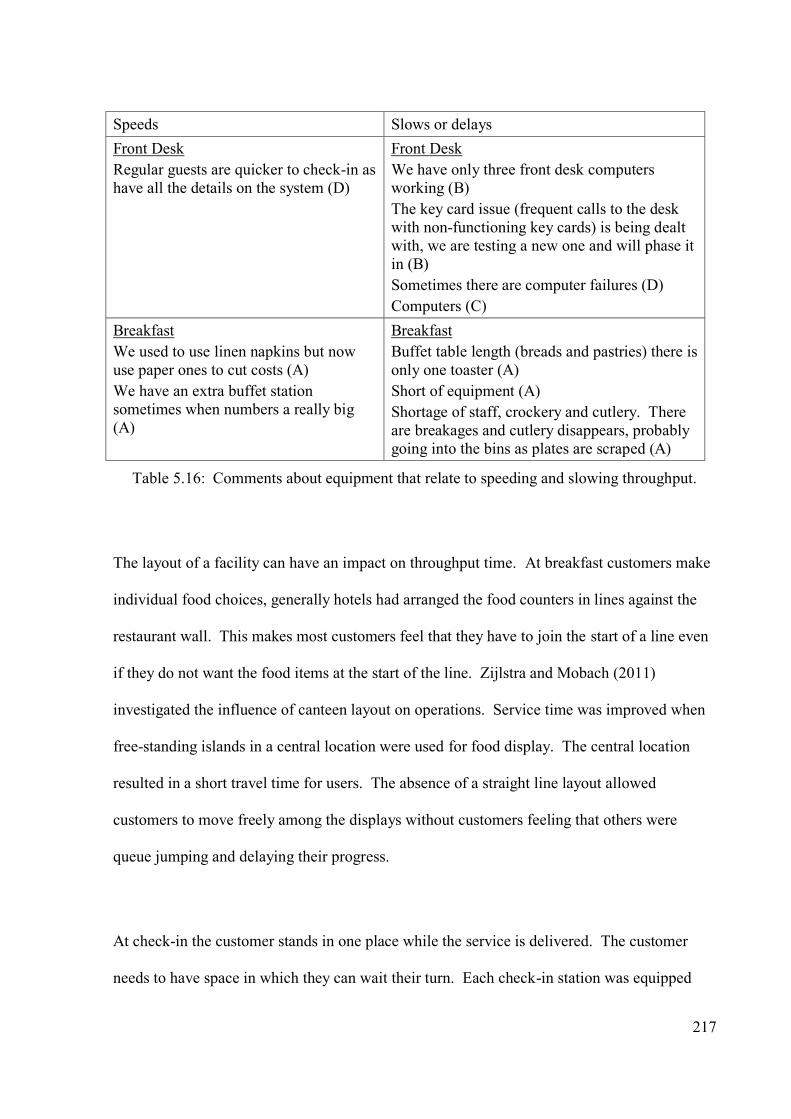
217
Speeds Slows or delays
Front Desk
Regular guests are quicker to check-in as
have all the details on the system (D)
Front Desk
We have only three front desk computers
working (B)
The key card issue (frequent calls to the desk
with non-functioning key cards) is being dealt
with, we are testing a new one and will phase it
in (B)
Sometimes there are computer failures (D)
Computers (C)
Breakfast
We used to use linen napkins but now
use paper ones to cut costs (A)
We have an extra buffet station
sometimes when numbers a really big
(A)
Breakfast
Buffet table length (breads and pastries) there is
only one toaster (A)
Short of equipment (A)
Shortage of staff, crockery and cutlery. There
are breakages and cutlery disappears, probably
going into the bins as plates are scraped (A)
Table 5.16: Comments about equipment that relate to speeding and slowing throughput.
The layout of a facility can have an impact on throughput time. At breakfast customers make
individual food choices, generally hotels had arranged the food counters in lines against the
restaurant wall. This makes most customers feel that they have to join the start of a line even
if they do not want the food items at the start of the line. Zijlstra and Mobach (2011)
investigated the influence of canteen layout on operations. Service time was improved when
free-standing islands in a central location were used for food display. The central location
resulted in a short travel time for users. The absence of a straight line layout allowed
customers to move freely among the displays without customers feeling that others were
queue jumping and delaying their progress.
At check-in the customer stands in one place while the service is delivered. The customer
needs to have space in which they can wait their turn. Each check-in station was equipped

218
with all the materials and equipment necessary (but not always working properly) to check a
guest into the hotel minimising the need for staff to waste time moving around or transporting
items.
All observed hotels provided cold buffets, hotels A and B also provided hot buffets. In hotel
A the buffets were lined against the wall on one side of the restaurant, but divided into three
hot and cold sections. Short queues were observed at each section. Hotel B had a similar
arrangement at one end of the restaurant. The cold buffet in hotel C was arranged just inside
the restaurant entrance, in hotel D it was in an adjoining room. Queues for the cold buffet
were not observed in hotel C, the buffet was unobservable in hotel D. Clearly self-service
time could be reduced in hotels A and B if the food service buffets were rearranged as
suggested in the study by Zijlstra and Mobach.
Equipment can sometimes process at higher speeds or volumes and make fewer errors than
people. Machines can be designed or programmed to contain knowledge as instructions that
either complete the task or guide the operator through all the necessary steps. Computers are
very good at storing vast amounts of information, working quickly to find it and repeatedly
following procedures without error (O’Connor, 2000). Information about guests and their
reservations can be quickly passed between machines without the risk of errors due to
rekeying or lost pieces of paper. The check-in process presents screens laid out in a logical
order to guide employees through the check-in process. Information technology can
contribute to productivity and enhance the experience for the guest (Bilgihan et al, 2011).
Kitchen equipment innovations proceed at a slower rate, however, some equipment cooks
more quickly and more dependably (Rodgers, 2007).

219
In summary, facilities and equipment provide the space and tools to deliver service to
customers. Sufficiency of space and a layout that minimises transport, movement and waiting
impacts on throughput time. Equipment needs to be sufficient for the expected number of
customers and functioning. Equipment can also speed throughput and reduce the likelihood
of errors.
5.6: SUPPORTING THE FRONT-LINE
It is the front-line staff that create the product or service with the customer; they are the
organisation as far as the customer is concerned. While the focus of this thesis is on
operational processes it is felt that it is necessary to say a few words about key activities that
can support throughput time. One role of management is to support front-line staff (Ohno,
1988). Various activities support front-line staff by providing:
An environment in which they are trained, empowered and motivated,
Information that helps them plan service and,
Preventative maintenance practices that ensure equipment functions as it is supposed
to.
Employees need to give instant responses to customers if speed of service is to be attained.
The role of empowerment was discussed in an earlier section. This section briefly considers
the management style and organisational culture that supports empowerment. In response to
forecast demand hotels vary the resources deployed. Equipment that is broken, error prone or
does not function as designed represents a capacity leakage that could lead to bottlenecks or
delays.

220
5.6.1: Management style
The opinion has been expressed that hotels have features that make them a little bit different
from hospitality, which in turn is different from many other services (Crick and Spencer,
2010). Seddon (2005) criticises the ‘command and control’ culture of many services that
leads to a top down approach. He uses his extensive experience as a business consultant to
champion the reorientation of process design to a focus on the needs of the customer. This is
supported by the influential reconceptualization of marketing from a goods dominated to a
service dominated logic (Vargo and Lusch, 2004, 2006). Bitner (1992) developed the
servicescape model highlighting the impact of the physical environment on the emotions of
employees and customers. Pine and Gilmore (1999) popularised the idea that consumers
valued experiences. Parasuraman et al (1985) identified responsiveness and empathy as two
of the five determinants of service quality.
The key point here is that the hospitality industry has been around a very long time, it
emerged from the human need to gather in social groups. Successful hospitality operations
have always been customer-focussed, designed to satisfy functional and emotional needs of
customers. It is the culture of being hospitable; a culture that always puts the guest first
(within certain limits) that permeates successful operations. This requires some devolvement
of decision making to the front line. It requires managers as supporters of the front line staff,
ensuring that they have the knowledge, ability and equipment to be responsive to customer
need. Ro and Chen (2011) suggest that it is important to hire customer-focused employees.
The organisation can support them through training, rewards and the communication of
service standards. Kildas et al (2007) add the need for a customer-orientated non-blame
221
organisational culture and a supportive management style. Employees need to be praised for
showing initiative and mistakes should be viewed as learning opportunities.
5.6.2: Equipment Reliability
Equipment is an element of capacity. Faulty or inoperative equipment represents a leakage or
reduction in capacity and can either cause errors requiring activities to be repeated or lead
bottlenecks and delays in service. Chan et al (2001) noted that equipment failure in hotels can
lead to a degradation of performance. Clearly procedures for preventing equipment failures
can have an impact on performance generally (Stipanuk, 2006) and throughput time.
Hotels A, B and D issued key cards for access to rooms, on a number of occasions it was
noted that guests were forced to return to the front desk because their key had stopped
working. This fault was particularly noticeable in hotel B and they were taking steps to
address it. Hotels B and D also had one front desk work station out of order. Equipment out
of order can lead to a situation where there are sufficient staff to serve customers but
insufficient equipment. Staff queuing to use equipment is a waste. Problems with key cutting
machines were noted in hotels B and D, in hotel B staff on one check-in desk had to walk into
the back office to cut the key card. For a time in hotel D only one key cutter was working
meaning that guests could be checked-in on only one work station.
5.6.3: Demand Management and Demand Forecasting
It was observed that customers selected their own arrival time for check-in and breakfast.
Group arrivals are encouraged to give an estimated time of arrival so that resources can be in

222
place to cope with the volume. It is also common for in-house groups to reserve a time for
breakfast for the same reason. Customers are heterogeneous and demand is lumpy, to
improve the accuracy of forecasts more information is required about customer
characteristics. It takes time and money to collect information and a trade-off needs to be
made between the cost of collecting information and the accuracy of the forecast
(Kalchschmidt et al, 2006).
Forecasting is mainly used to ensure that sufficient resources are in place to meet the expected
level of demand. It was noted earlier that although the number of arrivals is known, the
number that will arrive at any particular time is not. Operations generally do not provide
sufficient resources to meet expected peak demand. Dickson et al (2005) claim that
hospitality and service organisations set their capacity level at between 60% and 80% of
expected demand, meaning that on 40%-20% of occasions capacity will be insufficient to
provide an appropriate level of service. Table 5.1 shows the relationship between the number
of rooms, tables and covers in each hotel. Although the number of rooms is given it is
assumed that in most modern hotels all rooms have the capacity to sleep at least two people.
Capacity planning is a strategic decision (Pullman and Rodgers, 2009). This thesis is
concerned more with short-term capacity management tactics.
Demand forecasting helps with resource allocation and can be used in the restaurant where
breakfast numbers can be known in advance. The arrival time of guests in both processes is
unknown, at breakfast party size and the food item demand is also unknown. If guests are not
to be subject to significant delays then there must be flexible or spare capacity to absorb
demand as it occurs and brief service encounter times so that staff can process more

223
customers with minimal delay to any one customer. Flexible table design, where two tops
dominate and can be easily combined, gives flexibility to accommodate party size without
splitting or keeping parties waiting (Kimes, 2004). This could also be said to have
implications for the way in which guests are seated, ‘how many in your party’ is asked at
seating, ones and twos need to be placed where they don’t prevent the possibility of
combining neighbouring tables should a larger party arrive.
5.7: SUMMARY
Both processes experience high variability in arrival and processing times. They display most
of the features expected by Schmenner (1986, 2004), Slack et al (2009) and Johnston (2012).
Only relative rather than exact positioning of an operation on these categorisation models is
possible. Customer variability was classified using Frei’s (2006) classification, generally
request variety was a feature of the front desk and preference variety a feature of breakfast.
System variability was looked at as capacity leakage and largely controllable.
At the front desk there is extensive request variety as well as variability in arrival times and
process durations. Request variety is mainly information processing, this requires
knowledgeable employees, labour is generally the rate-limiting resource. Process duration is
generally short and intermittent so employees need other tasks to keep them occupied when
customers are not demanding service. Generally the characteristics of front office define it
more as a service shop with features of a professional service.

224
At breakfast the arrival times and table demand of customers is not known. Variability is also
expressed in preference for different dishes and different consumption durations. The main
rate limiting resource is space to put tables. Staff have little interaction with customers,
customers mainly process themselves. Generally the characteristics of breakfast define it as a
service shop with features of a mass service.
In both processes it was evident that principles had been applied to reduce the duration of
service encounters. Care is taken not to hurry customers as this has been shown to affect
satisfaction. Customers need to be largely in control of process duration and thus pass
through the process at a pace appropriate for them. The key strategy is therefore variability
accommodation. Self-service is used at breakfast to substitute for paid labour and
accommodate variability. Although some front desk requests and some check-ins could be
handled by customers the four star hotels visited did not seem to be encouraging customers to
do more of the work.
To accommodate this variability and keep costs under control, capacity needs to vary. Labour
is a controllable cost, flexible and part time labour can be used. In addition staff arrange their
work so that they move from tasks that do not involve customers to service encounters as
customer demand arises. At periods of high demand they have been seen to cut inessential
steps from procedures to speed the service encounter. At breakfast space is the main limiting
factor, if the design of the hotel permits it, hotels can expand the restaurant my making use of
adjoining spaces. Breakfast service requires little technical skill so most employees can be
pressed into service providing they are dressed appropriately.

225
The allocation of certain tasks to different members of staff was observed at breakfast. When
the task is identifiable (e.g. seat, order, restock, clear) and demand sufficient, task
specialisation improves flow. At the front desk request variety and task duration are less easy
to predict and the most appropriate approach seems to be to have generalists who can deal
with a wide variety of requests.
Responsiveness is enhanced by devolving some decision making powers to the front line.
This needs to be supported by a suitable management style and a culture of putting the needs
of customers first. To ensure that labour and materials are present when required an attempt
must be made to forecast demand for products and services by market segment. The facilities
and equipment need support in the form of maintenance to ensure that the planned physical
capacity is maintained.
226
CHAPTER 6: CONCLUDING SECTION
The concluding section will review the extent to which the aim and objectives of the research
have been achieved and will offer some reflections on the process, the contribution to
knowledge and suggestions for future research. This thesis has been prepared as part of a
Doctorate in Business Administration. According to The Association of Business Schools
(2005) the DBA is a professional doctorate and should not only make a contribution to
knowledge but also inform and impact on practice. This section therefore considers
contribution to practice as well as contribution to theory. Data and theories in this thesis are
already being passed onto future hospitality managers through lectures delivered by the
researcher.
This fresh view of the causes and treatments for variability makes a small contribution to the
vast output of operations management knowledge. It has taken up Klassen and Menor’s
(2007) challenge to increase understanding of process management fundamentals through the
investigation of the relationship between capacity utilisation, variability and inventory (CVI).
This research has presented “means to either attenuate or accommodate CVI trade-offs”
(Klassen and Menor, 2007: 1031) and advanced understanding of process management. It has
explored hotel operations, an under-researched area and used observation, an under-used
research method.

227
6.1: MAIN CONTRIBUTION OF THE THESIS TO PRACTICE
This thesis has drawn attention to the uncontrollable level of customer variability in some
service operations. Services that need to satisfy customers must consider, therefore, how they
can accommodate variability and remain efficient.
The Process Management Triangle provides a simple illustration of the link between
variability, capacity utilisation and inventory. The basic management principle is that, if
variability is uncontrollable and a steady flow of customers needs to be maintained then
operators need to think about manipulating capacity. Capacity consists mainly of physical
facilities and equipment, labour and activity time. In the short term physical facilities and
equipment are largely fixed and invariable. The main elements of capacity that can be
manipulated by operations managers are labour and time.
This thesis distils principles from theory and practice that can be applied to efficiently
configure resources and processes (capacity) so that customers can flow through the operation
at a speed appropriate for them.
Process consumes time and various principles can be applied to rearrange activities or
eliminate those that do not add value. The figure at the close of the chapter discussing
literature (figure 2.9) presents an overview of the causes of variability and the key principles
to apply to process and resource design. These throughput time principles are developed
further in table 5.10. A key focus needs to be on the activities that are part of the service

228
encounter. If the number or duration of service encounters can be reduced then, essentially,
the labour processing capacity is increased. A short encounter time also means a short wait
time when the operation is busy. It also means that, if queues do form, then they will reduce
quickly. This does not mean that labour is idle when customer numbers are lower, they can
be occupied with tasks that do not require the physical presence of the customer.
6.1.1: Key Findings and conclusions: Breakfast Service
Guests arrived at breakfast without a reservation at a time that suited them. Once in the
restaurant they occupied physical capacity and stayed for a duration of their choosing. While
there may be a period during which arrivals peak, this and the spread of arrivals can vary from
day to day. The total number of customers expected is neither a good indication of whether
there will be a time when all tables are occupied nor of the number of staff required to cope
with demand at any particular time during service. Arrival time is not a reliable indicator of
how many tables will be occupied in, say, 25 minutes time because dwell duration is also
highly variable.
People, unlike material objects, have a sense of personal space and are usually reluctant to
share a table with someone that they do not know. The restaurant cannot know how many
covers on each table will be occupied. There can be occasions where there are many empty
seats in a restaurant but no spare tables. Thus predicted arrival numbers is not a good
indicator of whether seating capacity is sufficient. The restaurant cannot predict the volume of

229
different food items that will be requested or consumed. This has implications for staffing
and food preparation if over or under supply is to be avoided.
The two greatest sources of customer variability at breakfast were arrival and preference
variability. Preference variability was expressed in the consumption of customers’ own time
and required facilities and materials to accommodate it.
As a rough guide managers could assume that around three quarters of guests will spend
between 15 and 40 minutes eating breakfast. Perhaps more usefully observations revealed
that half of all guest occupied tables for less than 25 minutes and 90% of guests left within 45
minutes.
6.1.2: Key Findings and conclusions: Front Desk
Front desk clerks were required to respond to a wide range of queries and requests from hotel
guests and visitors. When queuing was observed it was sometimes because one of the front
desk clerks was responding to a query or request from a guest already checked-in. As a very
approximate calculation, only around 20% of available front desk clerk hours between
4.00pm and 7pm were spent checking people in.
Over 75% of check-ins were completed in less than three and a half minutes and 90% of
check-ins in less than five minutes, or approximately one standard deviation above the mean.
230
In general check-in is a process with a brief duration. However, twenty one of the observed
check-ins of over four minutes were generally due to customer behaviour, mainly requests for
additional information.
The time required for check-in varied with the information needs of the hotel and customers.
Customers are not uniform, the amount of information and the number of tasks required to
check them in varied with the nature of their reservation. Check-in is also a social exchange
where understanding and agreement is negotiated before the customer becomes accepted as a
guest. Guests varied in the amount of information they needed to help plan their stay, or in
their need for general social interaction.
Table 5.3 uses Frei’s (2006) categorisation to re-group the types of customer variability
recorded at check-in and reported in tables 4.8 and 4.9. A key feature was the volume and
variety of requests, each of which also required different amounts of time to complete.
Findings indicate that the two greatest sources of customer variability at check-in were arrival
and request variability. Request variability consumed employee time and thus required
constant variations in the number of employees available to satisfy requests.
Some requests required staff to leave the front desk reducing the effective capacity. This
included storing or retrieving luggage, taking luggage to a room, showing a guest to a room.
Historically these activities may have been the responsibility of the concierge. In two of these
hotels the concierge post had been abolished, in the other two it was being phased out and the
concierge was cross-trained to work on the front desk.

231
6.1.3: Capacity: Coping with variability
The quantitative data and supporting observations indicate that guest arrival time and process
duration for both processes display a high degree of variability. There was also great
variation in the duration of breakfast and check-in. The coefficient for variation averaged
64% for check-in (3 out of four hotels) and 44% for breakfast. Whilst the check-in had a
median duration of 2:30 minutes, median breakfast duration was 24:30 minutes.
Armistead and Clark (1995) discussed the idea of the coping zone and suggested that as
capacity utilisation increases, variability can result in an exponential increase in waiting time.
They indicated that the higher the coefficient of variation the sooner queues start to form and
the longer waiting time becomes. This idea is demonstrated by Slack et al (2010) using
throughput delay curves (see figures 2.8 and 4.8) and described as a crucial concept for
managing throughput time by Suri (2010). If variability cannot be significantly controlled
then, to avoid delays for customers, processing capacity must be sufficient to satisfy the
demands placed on it. Increases in processing capacity are achieved by adding physical
capacity in the form of labour, facilities or equipment, or by speeding throughput.
The focus needs to be on the rate limiting resource (Armistead & Clark, 1994), generally the
service encounter at the front desk and physical capacity at breakfast. The general principles
are to minimise activities that consume labour time and provide facilities, equipment and
materials to allow customer to process themselves at a pace that suits them. Mostly, the
hotels used spare and flexible labour to increase capacity to adapt to changes in demand.

232
Check-in requires sufficient physical space for customers to gather. The presence, layout and
speed of equipment plays a significant role in throughput time. Breakfast, however, does not
have to be delivered in the restaurant and check-in does not have to take place at the front
desk. Room service absorbs labour capacity but serves breakfast in a different location.
Varying the service method, for example ‘grab ‘n’ go’, may also tempt some customers to
change their consumption location. The nature of check-in and advances in technology mean
that check-in can take place before arrival at the hotel. Operators can, therefore, consider
reducing the load on limited physical capacity by moving the delivery of the service to a
different location.
Equipment needs to be sufficient and in a usable condition, it forms part of the physical
capacity. The speed with which machines can complete a task can also impact on the
throughput rate.
The layout of a facility can have an impact on throughput time. At breakfast customers make
individual food choices, generally hotels had arranged the food counters in lines against the
restaurant wall. This makes most customers feel that they have to join the start of a line even
if they do not want the food items at the start of the line. Zijlstra and Mobach (2011)
investigated the influence of canteen layout on operations. Service time was improved when
free-standing islands in a central location were used for food display.

233
6.1.3.1: Moderating Factors
It is asserted that the customer-focussed nature of service, with the goal of effectiveness
taking priority over the goal of efficiency, and the fact that service can only be created at the
point of delivery and usually requires some contribution from the customer, means that
resources and processes are best configured to accommodate customer variability.
There is some evidence that low-cost accommodation tactics (Frei, 2006) were also used. The
frontline service staff in hotels who interact with customers and ensure their satisfaction have
always been low-paid. Self-service is common nowadays at breakfast, indeed it may be the
preferred option for most customers.
Social interaction and engagement in other activities have been shown to influence dwell
duration. Time is perceived as well as measured and the passing of time may be noticed less
by those engaged in activity (Maister, 1985). Generally guests sharing a table arrived at
different times but left at the same time. Joining another person at a table to share a meal has
social meaning and psychological effects (Nyberg and Olsen, 2010). Customers should be
left to consume at a pace of their choosing.
Utilitarian goods are primarily instrumental and functional, but even these have an
experiential dimension (Holbrook & Hirschman, 1982). Arrival at the hotel and check-in, for
example, is a “critical moment of truth” and an opportunity to make a good first impression
(Vallen & Vallen, 2009:288) even though it is mainly a functional activity, a necessary step to

234
gain access to the hotel facilities. Encounters at the front desk were customised in response to
customer capability and requests. On many occasions this required discussion and
information exchange. Restaurant experiences purchased for pleasure can be viewed as
hedonic rather than functional (Noone et al, 2008). People experience emotions and are
attracted to situations that generate positive emotions. It is likely to be beneficial for
operators to consider the emotional impact of activities that involve the customer and to
reduce the frequency and duration of those that are unlikely to generate positive emotions.
One of the tactics mentioned in table 5.10 suggests that more customers can be served by
working faster. Noone et al (2009) indicate that both slow pace and fast pace can be
detrimental to customer satisfaction when delivering hedonic services. This is further
evidence that actions to improve throughput time should focus on what is appropriate from
the customer’s viewpoint. This can best be decided by leaving the customer in control of the
pace and duration of the activities that deliver value to them. To some extent this relies on the
ability of front line staff to recognise behavioural signals from customers that indicate they
are ready to move to the next activity.
At busy times non-essential steps can be reduced or eliminated but customers must always be
in control of when the process ends. The breakfast process is largely open-ended. The hotel
facilitates the customers’ experience creation and leaves the customer to decide the pace and
duration. Check-in is more like an administration task, a necessity rather than a pleasure.
Being hospitable, making people feel welcome and valued is a core feature of the hospitality
industry (Crick and Spencer, 2010). This requires the expression of empathy and
responsiveness (Parasuraman et al, 1985) rather than limitation and control of customers.
235
It is important for customers that they perceive that they are in control (Namasivayam and
Mount, 2006), that they have choices. The need for customer choice necessarily results in
service demand variety and variable duration. Vigorous attempts to reduce customer requests
or preferences may therefore result in them feeling a loss of choice and thus control.
6.1.4: Removing Time
Removing time from service encounters speeds customer throughput and increases processing
capacity. Employee activity and the service encounter consume time; time is a cost to the
organisation. The more time spent with each customer the fewer customers an employee can
serve. A key to managing variable demand, therefore, is to reduce the amount of employee
activity time per customer, especially the service encounter.
Observations indicate that hotels took action to reduce the number of activities and the
duration of activities using the tactics in table 5.10. Employees made further reductions when
they perceived that customers were being required to wait for service. Customers were
permitted to set their own pace at breakfast but were, occasionally, subtly discouraged from
extending the check-in process.
Simplifying the process is about reducing the amount of knowledge and level of skill, making
it more like a commodity process (see figures 5.1 and 5.2). Reducing the duration of
activities is about finding a way to deliver the same outcome in less time. Each of these
tactics may also involve waste identification and elimination. Simpler processes are also less
236
prone to error and may be straight-forward enough to either give to customers or incorporate
into equipment.
There are limits to the extent to which tasks can be given to customers, steps cut from
processes or work pace increased, sometimes the volume of labour needs to vary. Labour has
the capacity to produce and absent labour can be seen as a leakage of capacity (Armistead &
Clark, 1995). A common response to demand variability is to employ staff on a part-time and
casual basis (Pullman and Rodgers, 2009).
The effect of employees on throughput time is due to much more than task competence. The
observations and interviews reveal that the division and distribution of activities among
employees has an effect on throughput time (see table 5.15). The achievement of objectives
relies on the division of work. Supervisors are in the front line of ensuring that work gets
done as management requires (Mullins, 1998; Evans, 1999). Employees need to be able to
monitor the demands on the system and take immediate action to adjust resources or
processes, “to be responsive by ensuring that the necessary rules of order within an
organization do not interfere with the performance of a task which the customer requires”
(Riley, 1996:171), another term for having the authority to be responsive to customer
requirements is ‘empowered’ (Riley, 1996).

237
6.2: MAIN CONTRIBUTION OF THE THESIS TO THEORY
The key contribution to theory is evidence from practice of how resources and processes in
services in which the customer is a co-producer are being configured to accommodate
variability in customer arrival times and process duration. The Process Management Triangle
places a focus on the role of flexible and spare capacity in variability accommodation.
Interaction frequency and duration is reduced, this both improves efficiency and the ability to
accommodate variability. The drive for efficiency is moderated by the requirement to satisfy
the emotional needs of customers for social interaction and control of service duration.
The world is interpreted, made sense of, by applying conceptualisations to perceptions. In
this case conceptualisations were largely drawn from Operations and Process Management
texts so, inevitably, perceptions were interpreted through that ‘theory filter’. The key useful
theories were; the Process Management Triangle (Klassen & Menor, 2007); Frei’s (2006)
categorisation of types of and treatments for customer variability; Schmenner’s (1986, 2004)
categorisation of services; Armistead and Clark’s (1994) model of capacity management; Key
levers for managing flows summarised in Anupindi et al (2012).
This thesis has added weight to the utility and validity of the theories applied here to analyse
operations and processes. It has demonstrated that what hotels do in practice can be
interpreted using these models. In addition, apart from arrival variability, it has highlighted
the difficulty of categorising customer variability (Frei, 2006). Effort variability can be
expressed as a request or a preference, often it is not clear whether a request is made due to a

238
lack of capability or a lack of effort. The two basic choices are for the customer to do it
themselves, or for them to request that someone else does it for them. From an operator’s
viewpoint it is the effect of the variability on demand for resources that is more important
than the customer’s reason for expressing that demand.
It has highlighted the utility of and commonalities between the models of Schmmener (1986,
2004), Slack et al (2009) and Johnston et al (2012) (figures 5.1 and 5.2) and suggests that
individual processes within an organisation or industry sector may be categorised differently.
The move towards features of a mass service can be seen as necessary to be both efficient and
accommodate customer variability. These models highlight how the nature of the process,
such as the degree of interaction and customisation demanded, dictate necessary features of
resource and process configuration, such as self-service or employee delivery.
The literature review conducted an in-depth conceptualisation of the term ‘process’. It
suggested that operations management adopts a systems and process view of organisations
and that everything is ‘in process’ (Rescher, 1996), it is just that some processes are very
slow. In this view there is no stable and unchanging state. Processes are causal mechanisms
consisting of objects with properties that are mainly expressed in relation to how they interact
with the properties of objects around them.
Managers learn the properties of objects and retroduce the configuration of resources and the
necessary controls from a view of a desired end state. Because of the complexity of most
systems the events generated by the interaction of objects cannot always be precisely

239
predicted or controlled. The uncertainty that this generates is called risk management.
Managers are pragmatic and will adjust objects and controls so that the outcome is closer to
what was envisioned. This pragmatic view of knowledge and causality is shared by Critical
Realists (Sayer, 1992).
6.3: THE EXTENT TO WHICH THE AIM AND OBJECTIVES HAVE
BEEN ACHIEVED
The overall aim of this thesis was to explore what theory says about how resources and
processes can be configured to achieve appropriate throughput time or to quickly adapt to
cope with short term increases in demand and to investigate the actual tactics used in hotels.
This section will consider the extent to which the aim and objectives have been achieved.
The first research objective was as follows:
1. To explore literature to review appropriate research and theories about how resources and
processes can be configured to:
a. Achieve appropriate throughput, and
b. Make short term changes to effective service capacity to cope with short term
peaks in demand.
Concepts, such as ‘process’, ‘cause and effect’, and ‘knowledge’ were investigated in some
depth in the hope of generating a shared conceptualisation. The argument can only progress
successfully if all sides share a similar conception of reality.
240
With this in mind it can be added that there is no such thing as an objective view of the world,
everyone is burdened with their standpoint and may struggle to interpret the world from a new
or different perspective. The perspective adopted here was that of a systems view of the
world as processes in which objects with properties cause events to take place. Man, as do
other animals, attempts to identify, understand and harness causal relationships to achieve
benefits. It is at the operational level of business that a concerted effort is made to shape
objects and events so that they achieve some predetermined aim. The fundamental questions
being asked here are ‘what causes event duration?’ and ‘how can the objects within our
influence be shaped to produce an appropriate event duration?’ Appropriate is used loosely to
mean that which is acceptable to the person who judges the success of the event, in this case
the customer.
Operations management literature was explored to identify key theories that could be used to
explain how resources and processes could be configured to achieve appropriate throughput
time or adapt to short-term changes in demand. The process management triangle, based on
Little’s Law, formed the basis for a conceptualisation of what was meant by process, capacity
and variability. Categories of system variability were common in operations texts. Frei
(2006) categorised customer variability and, from her research, suggested approaches for
accommodating or reducing it. A conceptual framework of suggested tactics to apply to
process and resource design was presented.
The second objective was as follows:

241
2. To explore literature to identify preconditions to achieve the above. The objective is to
suggest the necessary and contingent conditions that increase the likelihood that 1a & 1b
will occur.
As part of the literature review and methodology it was proposed that operations are open
systems and that the involvement of the customer as a co-creator introduces significant
unpredictability into the system. While tendencies for events to occur and improved
likelihood can be achieved by the configuration of processes and resources, actually very little
can be said to be attributed to law-like necessities.
The ideas of Critical Realism are rooted in the pragmatism of Peirce as are some of the key
management thinkers of the 20th century. Conceptualisation of knowledge, causation and
reality from thinkers such as Sayer, Polyani, Archer, Fleetwood and Mingers has helped the
researcher make sense of readings and findings and sits comfortably with the researcher’s
view of business knowledge more as the search for something practically adequate rather than
a search for immutable laws.
Theories on process flow management (Anupindi et al, 2012) and the summary of research
into capacity management (Pullman & Rodgers, 2009) provided the basis for a list of
principles to apply to achieve appropriate throughput time. Armistead and Clark ‘s (1994)
model of capacity management and concept of the coping zone helped conceptualise some
sources of variability and methods of dealing with it. Capacity leakage is waste, the concept
of waste from the lean paradigm helped the researcher identify additional factors affecting
throughput time. The identification of necessary and contingent conditions has been limited.

242
Evidence has been presented about the actual and necessary properties of objects that impact
on throughput time.
The third objective was as follows:
3. To select and investigate a number of mid-market, full-service hotels to identify the actual
tactics used to achieve the above.
The extent of variability was observed and recorded. The steps of each process were recorded
and activities that speeded or delayed throughput were identified.
The most surprising finding was the extent of variability in customer arrival and processing
time which made in-service demands virtually unpredictable. Deviation from the mean was
so great that the use of average duration times would be of no practical use. The inter-arrival
time was just as unpredictable, making resource planning difficult. There was added
complexity in the restaurant because it was not possible to predict how many seats on each
table would be occupied at any time. Operations Management is closely linked with
Operations Research and tends to assume that business systems can be modelled and
simulated. This research revealed that, at least in some circumstances, customer behaviour is
so unpredictable that it cannot be predicted or easily simulated; instead processes and
resources need to be designed to cope with unpredictability. This requires short service
encounter times combined with flexible resources and responsive cross-trained staff.
Hotels acknowledged that the customer is a co-producer in the process and needs to be
permitted to express preferences and have their needs satisfied. Time limits on processes in
243
which the customer is involved are inappropriate. Instead the hotels concentrate on
improving their capacity to process by reducing their labour content, largely through
shortening service encounters and giving more work to customers. Where possible, flexible
labour and capacity is used to cope with short-term changes in demand. Lulls in demand are
used as rest periods and for carrying out activities that do not require the presence of the
customer.
The fourth objective was as follows:
4. To discuss the findings in relation to theory derived from previous research.
Most previous research into operations in hotels looks at meal service, only one article was
found that focussed on performance at check-in. There was very little research into the causes
of customer variability and its extent. Seddon (2005) and Frei (2006) supplied good insights
into customer variability and approaches to managing it in services. Anupindi et al (2012),
although mainly concerned with manufacturing, supplied a useful set of principles to apply to
improve process flow. All these authors seemed to draw at least some inspiration from
principles of Lean Manufacturing. The hotels were seen to be applying tactics for reducing
process duration identified in literature.
Coping with variability can be considered a capacity management issue. However, capacity
management literature is traditionally focused on variability reduction and maximising
capacity utilisation. Smooth even flow and improved productivity are the aims. This
mechanical view needs to be modified for customer-focused operations. Their long term

244
success is more concerned with satisfying customers. This can mean embracing variability as
a key feature of operations.
The hotels seem to be working to control and reduce variability that arises from the system.
They were also trying to use flexible and spare capacity to accommodate variability with
some degree of efficiency. Other key principles seen in action were simplification of the
processes and giving more of the process activities to the customer.
The final objective was as follows:
5. To conclude and make recommendations for appropriate resource configurations to apply
that are likely to lead to appropriate speed of service.
This objective relates to this section of the thesis and is achieved in the previous sections.
6.4: WEAKNESSES OF THE THESIS
This is a good point at which to reflect upon the researcher’s perceived weaknesses and fears.
There are the, assumed, common ones of limited resources and time. There is only so much a
lone researcher can achieve given personal and resource limitations. Also inevitably a person
is trapped by their own limits of intellectual capacity and character. The researcher prefers to
view his lack of genius as a positive advantage in that it requires him to express things in a
way that may be more understandable to the majority!

245
There is always a nagging suspicion that a pertinent article has been overlooked. The
sophistication of arguments can always be improved by adding references from additional
reading. Perhaps some key finding has not been uncovered, or some important point in the
analysis overlooked. Basically, this thesis could be developed for another year and still not be
perfect.
There is always a reason to criticise the research design and to the generalizability or validity
of the outcomes. These points have been addressed in the methodology. Yes, given more
time perhaps another hotel or two could have been visited. Perhaps other processes, such as
room servicing or kitchen breakfast service, could have been added as a contrasting process.
Perhaps more and lengthier interviews would have revealed deeper insights into sources of
system variability. Certainly if two observers had been available more table dwell time data
could have been collected, or check-out could have been observed. The researcher is,
however, satisfied that sufficient has been done to say that useful knowledge has been created.
6.5: RECOMMENDATIONS FOR FURTHER RESEARCH
Hospitality operations consist of processes with different features. Processes such as food
production and housekeeping have perhaps more in common with manufacturing in that they
are repetitive and the tangible output means that quality can be more objectively assessed.
Different performance objectives will take prominence in hotels of different prices. There is
therefore scope to investigate throughput time for other hospitality processes or process
design in hotels with higher or lower quality ratings.

246
The focus has been on accommodating variability. There is scope to investigate ways to
influence customer behaviour so that variability can be reduced without a perceived reduction
in service quality. It is suspected that elements of the servicescape could be considered in
combination with the psychology of consumers. Perhaps hospitality can learn something
about influencing customer behaviour from supermarkets.
The researcher found that talking to employees and watching the process in action enabled the
identification of causal explanations that could not be discovered by questionnaires or desk-
bound research. Observation maybe time consuming but it is also rewarding. It is
recommended that researchers give more consideration to discovering causes by watching
rather than inferring them from the analysis of questionnaires and interviews.

247
REFERENCES
AA (2006) AA Quality Standards for AA Recognised Hotels AA
http://www.theaa.com/travel_editorial/pdf/Hotel_Standards_FINAL.pdf accessed 08.09.2011.
Abend, G. (2008) The Meaning of 'Theory' Sociological Theory, Vol. 26, No. 2, pp. 173-199.
Adenso-Diaz, B., González-Torre, P., Garcias, V. (2002) A Capacity Management Model in
Service Industries International Journal of Service Industry Management Vol. 13, No. 3, pp.
286-302.
Aitken, J., Christopher, M., Towill, D. (2002) Understanding, Implementing and Exploiting
Agility and Leanness International Journal of Logistics: Research and Applications Vol. 5,
No. 1, pp. 59-74.
Anderson, P., et al (2006) Understanding mechanisms in organizational research: A collective
journey Journal Of Management Inquiry Vol. 15, No. 2, pp. 102-113.
Anupindi, R. et al (2012) Managing Business Process Flows: Principles of Operations
Management. 3rd
Ed. New Jersey. Pearson Prentice Hall.
Armistead, C & Clark, G. (1994) The “coping” capacity management strategy in service in
services and the influence on quality International Journal of Service Industry Management
Vol.5, No.2, pp5-22.
Armistead, C. et al (1995) Business process re-engineering: lessons from operations
management International Journal of Production & Operations Management. Vol. 15, No. 12,
pp. 46-58.
Baker, J. & Cameron, M. (1996) The Effects of the Service Environment on Affect and
Consumer Perception of Waiting Time: An Integrative Review and Research Propositions
Journal of the Academy of Marketing Science Vol.24, No.4, pp.338-349.
Bamford, D., & Forrester, P. (2009) Essential Guide to Operations Management Wiley.
Bardi, J.A. (2006) Hotel Front Office Management 4th
ed, John Wiley & Sons.
Barney, J.B. (1991) Firm Resources and Sustained Competitive Advantage Journal of
Management Vol. 17, No. 1, pp. 99-120.
Barrows, C.W. & Powers, T. (2008) Introduction to Management in the Hospitality Industry
John Wiley & Sons
248
Bertilsson, T.M., (2004) The Elementary Forms of Pragmatism: On Different Types of
Abduction European Journal of Social Theory Vol.7, No.3, pp.371-389.
Bielen, F. & Demoulin, N. (2007) Waiting time influence on the satisfaction-loyalty
relationship in services Managing Service Quality Vol.17, No.2, pp.174-193.
Bicheno, J. (2008) The Lean Toolbox for Service Systems England. PICSIE Books.
Bilgihan, A., Okumus, F., Nusair, K, and Joon-Wuk Kwun, D. (2011) Information
technology applications and competitive advantage in hotel companies Journal of Hospitality
and Tourism Technology Vol. 2, No. 2, pp. 139-154.
Bitner, M.J., Ostrom, A.L., Morgan, F.N. (2008) Service Blueprinting: A practical technique
For service innovation California Management Review Vol.50, No.3, pp.66-94.
Blackburn, J.D. (Ed) (1991) Time-based competition: the next battleground in American
manufacturing. USA. Irwin.
Boisot, M. & MacMillan, I.C. (2004) Crossing Epistemological Boundaries: Managerial and
Entrepreneurial Approaches to Knowledge Management Long Range Planning Vol. 37, pp.
505 – 524.
Boote, J. & Mathews, A. (1999) Saying is one thing; Doing is another: the role of observation
in marketing research Qualitative Market Research: An International Journal, Vol. 2, No. 1,
pp. 15–21.
Brunner-Sperdin, A. & Peters, M. (2009) What influences guests’ emotions? The case of
high-quality hotels International Journal of Tourism Research Vol. 11, pp. 171-183.
Bunge, M. (2004) How does it work? The search for explanatory mechanisms Philosophy of
The Social Sciences Vol.34, No.2, pp. 182-210.
Burks, A.W. (1946) Peirce's Theory of Abduction Philosophy of Science, Vol. 13, No. 4, pp.
301-306.
Calaveri, S.A. (2008) Are learning organizations pragmatic? The Learning Organization Vol.
15, No. 6, pp. 474-485.
Chan, K.T., Lee, R.H.K. and Burnett, J. (2001) Maintenance performance: A case study of
hospitality engineering systems Facilities Vol. 19, No. 13, pp. 494-503.
Chapman, J.A. and Lovell, G. (2006), The competency model of hospitality service: why it
doesn't deliver International Journal of Contemporary Hospitality Management Vol. 18, No.
1, pp. 78 – 88.
Chase, R.B. (1978) Where does the customer fit in a service operation? Harvard Business
Review November – December, pp. 137-142.

249
Chase, R.B. (1981) The Customer Contact Approach to Services: Theoretical Bases and
Practical Extensions Operations Research Vol. 29, No. 4, pp. 698-706.
Chopra, S., Lovejoy, W. and Candace, Y. (2004) Five Decades of Operations Management
and the Prospects Ahead Management Science Vol. 50, No. 1, pp. 8-14.
Collins (2009) http://dictionary.reference.com/browse/capacity accessed 06.09.2011.
Craighead, C.W. & Meredith, J. (2008) Operations management research: evolution and
alternative future paths International Journal of Operations & Production Management Vol.
28, No. 8, pp. 710-726.
Crick, A.P. & Spencer, A. (2010) Hospitality quality: new directions and new challenges
International Journal of Contemporary Hospitality Management Vol. 23, No. 4, pp. 463-478.
Curran, J.M. and Meuter, M.L. (2007) Encouraging Existing Customers to Switch to Self-
service Technologies: Put a Little Fun into Their Lives Journal of Marketing Theory and
Practice Vol. 15, No. 4, pp. 283-298.
Czepiel, J.A., Solomon, M.R., and Suprenant, C. (Eds) (1985) The Service Encounter USA. D.C.
Heath and Company, Lexington Books.
Davenport, T.H. & Short, J.E. (1990) The New Industrial Engineering: Information
Technology and Business Process Redesign Sloan Management Review Vol.31, No.4, pp.11-
27.
Davis, G. (1994) What should time be? European Journal of Marketing Vol.28, No.8/9,
pp.100-113.
Denzin, N. K. & Lincoln, Y.S., Eds, (2005) The SAGE handbook of qualitative research
USA, 3rd
Ed. Sage.
Dewey, J. (1916) The Pragmatism of Peirce The Journal of Philosophy, Psychology and
Scientific Methods, Vol. 13, No. 26, pp. 709-715.
Dhar, R. & Wertenbroch, K. (2000) Customer Choice Between Hedonic and Utilitarian
Goods Journal of Marketing Research Vol. 37, February , pp. 60-71.
Dickson, D., Ford, R.C., Laval, B (2005) Managing Real and Virtual Waits in Hospitality and
Service Organizations Cornell Hotel and Restaurant Administration Quarterly Vol. 46, No 1,
pp. 52-68.
Downward, P. & Merriman, A. (2007) Retroduction as mixed-methods triangulation in
economic research: reorienting economics into social science Cambridge Journal of
Economics, Vol.31, pp.77–99.
Davis, B., Lockwood, A., Pantelidis, I and Alcott, P. (2008) Food and Beverage Management
4th
ed, Elsevier.

250
Dube´, L., Schmitt, B.H. and Leclerc, F. (1991) Consumers’ affective responses to delays at
different phases of a service delivery Journal of Applied Social Psychology, Vol. 21, No. 10,
pp. 810-20.
Durrande-Moreau, A. (1999) Waiting for service: ten years of empirical research International
Journal of Service Management Vol.10, No.2, pp. 171-189.
Easton, G., (2010) Critical realism in case study research Industrial Marketing Management
Vol. 39, pp. 118-128.
Eisenhardt, K.M., (1989) Building theories from case study research Academy of
Management Review Vol.14, No.4, pp.532-550.
Evans, D. (1999) Supervisory Management Principles and Practices 5th
ed, Continuum.
Fasolo, B et al (2009) The effect of choice complexity on perception of time spent choosing:
When choice takes longer but feels shorter Psychology & Marketing Vol.26, No.3, pp.213-
228.
Fitzsimmons, J.A. (1985) Consumer participation and productivity in service operations
Interfaces Vol. 15, No. 3, pp. 60-67.
Fitzsimmons, J.A. & Fitzsimmons, M.J. (2011) Service Management: Operations, Strategy,
Information Technology 7th
International edition, McGraw Hill.
Fleetwood, S., & Ackroyd, S. (Eds) (2004) Critical Realist Applications in Organisation and
Management Studies. London. Routledge.
Fleetwood, S. (2005) Ontology in Organization and Management Studies: A Critical Realist
Perspective Organization Vol. 12, pp. 197 – 222.
Forrester, J. (1958) Industrial Dynamics: A major breakthrough for decision-makers Harvard
Business Review July/August, pp. 37-66.
Fraisse, P. (1984) Perception and estimation of time Annual Review of Psychology Vol.35,
pp.1-36.
Frei, F. (2006) Breaking the trade-off between efficiency and service Harvard Business
Review November. pp. 93-101.
Frei, F. & Morriss, A. (2012) Uncommon service: how to win by putting customers at the
core of your business Harvard Business Review Press.
Gazzoli, G., Hancer, M. and Park, Y. (2010) The Role and Effect of Job Satisfaction and
Empowerment On Customers’ Perception of Service Quality: a Study in the Restaurant
Industry Journal of Hospitality and Tourism Research Vol. 34, No. 1, pp. 56-77.

251
George, A.L., & Bennett, A. (2005) Case Studies and Theory Development in the Social
Sciences MIT Press.
Gilbert, D. (2007) Stumbling on happiness UK, Harper Perennial.
Graham, R.J. (1981) The Role of Perception of Time in Consumer Research The Journal of
Consumer Research, Vol.7, No. 4, pp. 335-342.
Graham, R.J. (1985) Anthropology and O.R.: The Place of Observation in Management
Science Process The Journal of the Operational Research Society, Vol.35, No.6, pp.527-536.
Grant, P. & Perren, L. (2002) Small Business and Enterprise Research: Meta-theories,
Paradigms and Prejudices International Small Business Journal Vol.20, No.2, pp.185-211.
Grönroos, C. (2008) Service logic revisited: who creates value? And who co-creates?
European Business Review Vol. 20, No. 4, pp. 298-314.
Grössler, A. & Grübner, A. (2006) An empirical model of the relationships between
manufacturing capabilities International Journal of Operations & Production Management
Vol. 26, No. 5, pp. 458-485.
Gummesson, E. (2007) Access to reality: Observations on observational methods Qualitative
Market Research: An International Journal Vol.10, No.2, pp. 130-134.
Hammer, M. & Champy, J. (1995) Reengineering the Corporation: A Manifesto For Business
Revolution London. Nicholas Brealey.
Heineke J. & Davis, M.M. (2007) The emergence of service operations management as an
academic discipline Journal of Operations Management Vol.25, pp. 364–374.
Hensley, R.L. & Sulek, J. (2007) Customer satisfaction with waits in multi-stage services
Managing Service Quality Vol.17, No.2, pp.152-173.
Holbrook, M.B. & Hirschman, E.C. (1982) The Experiential Aspects of Consumption:
Consumer Fantasies, Feelings, and Fun Journal of Consumer Research Vol. 9, No. 2, pp. 132-
140.
Htmagazine.com (a) http://hospitalitytechnology.edgl.com/news/Aloft-Hotels-Expands--
Smart-Check-In--Program72719 accessed 21.07.2011.
Hwang, J. and Lambert, C.U. (2009) The use of acceptable customer waiting times for
capacity management in a multi-stage restaurant Journal of Hospitality and Tourism Research
Vol. 33, No. 4, pp. 547-561.
Johnston, R., Clark, G. & Shulver, M. (2012) Service Operations Management: Improving
Service Delivery 4th
ed, UK, Pearson Education Limited.
252
Jones, P., Dent, M. (1994) Improving service: Managing response time in hospitality
operations International Journal of Operations & Production Management Vol. 14, No. 5; pp.
52-59.
Jones, P., Ball, S., Kirk, D. & Lockwood, A. (2003) Hospitality Operations: A Systems
Approach Continuum Books.
Jones, P. & Lockwood, A. (2004) The Management of Hotel Operations Thomson Learning.
Kalargyrou, V. & Woods, R.H. (2011) Wanted: training competencies for the twenty-first
century International Journal of Contemporary Hospitality Management Vol. 23, No. 3, pp.
361-376.
Kalchschmidt, M., Verganti, R., Zotteri, G. (2006) Forecasting demand from heterogeneous
customers International Journal of Operations & Production Management Vol. 26, No. 6, pp.
619-638.
Kandampully, J. (2006) The new customer-centred business model for the hospitality industry
International Journal of Contemporary Hospitality Management Vol. 18, No. 3, pp. 173-187.
Kaplan, R.S. & Norton, D.P. (2004) The strategy map: guide to aligning intangible assets
Strategy & Leadership Vol.32, No.5, pp.10-17.
Klidas, A., Van den Berg, P.T. and Wilderom, C.P.M. (2007) Managing employee
empowerment in luxury hotels in Europe International Journal of Service Industry
Management Vol. 18, No. 1, pp. 70 – 88.
Kim, J. S., Christodoulidou, N. and Brewer, P. (2012) Impact of Individual Differences and
Consumers' Readiness on Likelihood of Using Self-Service Technologies at Hospitality
Settings Journal of Hospitality & Tourism Research Vol. 36, No. 1, pp. 85-114.
Kimes, S.E. (2004) Restaurant revenue Management Implementation at Chevy’s Arrowhead
Cornell Hotel and Restaurant Administration Quarterly Vol. 45, No. 1, pp. 52-67.
Klassen, R.D. & Menor, L.J. (2006) The process management triangle: An empirical
investigation of process trade-offs Journal of Operations Management Vol.25, pp. 1015–1034.
Klassen, K.J. & Rohleder, T.R. (2002) Demand and capacity management decisions in
services. How they impact on one another International Journal of Operations and Production
Management Vol. 22, No. 5, pp. 527-548.
Kotas, R. (1999) Management Accounting for Hospitality & Tourism 3rd
Ed, International
Thomson Business Press.
Kvale, S. & Brinkman, S. (2009) Interviews: Learning the craft of qualitative research 2nd
ed,
USA, SAGE publications.

253
Lawson, C., Latsis, J., & Martins, N. (Eds) (2007) Contributions to Social Ontology
Routledge.
Levitt, T. (1972) The Industrialization of Service Harvard Business Review September-
October, pp.63-74.
Lewis, M.A., (2003) Cause, consequence and control: towards a theoretical and practical
model of operational risk Journal of Operations Management Vol.21, pp. 205–224.
Lillicrap, D. and Cousins, J. (2010) Food and Beverage Service 8th
Ed, Hodder Education.
Liman Mansar, S.L. & Reijers, L.J. (2007) Best practices in business process redesign: use
and impact Business Process Management Journal Vol. 13, No. 2, pp. 193-213.
Lindsay, A., Downs, D. & Lunn, K. (2003) Business processes—attempts to find a definition
Information and Software Technology Vol.45, pp. 1015–1019.
Little, J. D.C. & Graves, S.C. (2008), Chapter 5 in Building Intuition: Insights from Basic
Operations Management Models and Principles, edited by D. Chhajed and T. J. Lowe,
Springer Science + Business Media, LLC, New York, pp. 81 – 100.
Little, J.D.C. (2011) Little’s Law as viewed on its 50th
anniversary Operations Research Vol.
59, No. 3, pp. 536-549.
Lowson, R. H. (2003) The nature of operations strategy: Combining strategic decisions from
the resource-based and market-driven viewpoints Management Decision Vol. 41, No. 6,
pp.538-439.
Lundberg, C. (2004) Is there really nothing so practical as a good theory? Business Horizons
Vol.47, No.5, pp7-14.
Lundberg, C. & Mossberg, L. (2008) Learning by Sharing: waiters’ and bartenders’
experiences of service encounters Journal of Foodservice Vol. 19, pp. 44-52.
Mabey, C. & Finch-Lees, T. (2008) Management and Leadership Development Sage
Publications.
Maister (1985) The Psychology of Waiting Lines http://davidmaister.com/articles/5/52/
accessed 18.05.12. Originally published in: Czepiel, J.A., Solomon, M.R., and Suprenant, C.
(1985) The Service Encounter, D.C. Heath and Company, Lexington Books.
Martinko, M.T. & Gardner, W.L. (1985) Beyond Structured Observation: Methodological
Issues and New Directions The Academy of Management Review Vol.10, No.4, pp676-695.
McAdam, D., Tarrow, S. & Tilly, C. (2008) Methods for Measuring Mechanisms of
Contention Qualitative Sociology Vol.31, pp.307-331.

254
Melão, N & Pidd, M (2000) A conceptual framework for understanding business processes
and business modelling Information Systems Journal Vol. 10, pp. 105-129.
Meredith, J.R., and Mantel Jr, S.J. (2006) Project Management. A managerial Approach 6th
ed, John Wiley & Sons, Asia.
Mingers, J. (2006) A critique of statistical modelling in management science from a critical
realist perspective: its role within multimethodology Journal of the Operational Research
Society Vol. 57, pp. 202–219.
Morris, B. & Johnston, R. (1987) Dealing with inherent variability: The difference between
Manufacturing and Service? International Journal of Production Management (IIJOPM)
Vol.7, No.4, pp.13-22.
Mullins, J. (1998) Managing People in the Hospitality Industry 3rd
ed, Longman.
Namasivayam, K. (2003) The consumer as "transient employee": Consumer satisfaction
through the lens of job-performance models International Journal of Service Industry
Management, Vol. 14, No. 4, pp. 420 – 435.
Namasivayam, K. and Mount, D.J. (2006) A Field Investigation of the Mediating Effects of
Perceived Fairness on the Relationship between Perceived Control and Consumer Satisfaction
Journal of Hospitality and Tourism Research Vol. 30, No. 4, pp. 494-506.
Naylor, J.B., Naim, M.M., Berry, D. (1999) Leagility: Integrating the lean and agile
manufacturing paradigms in the total supply chain International Journal of Production
Economics Vol.62, pp. 107-118.
Noone, B.M. Kimes, S.E., Mattila, A.S, Wirtz, J. (2007) The effect of meal pace on customer
satisfaction Cornell Hotel and Restaurant Administration Quarterly Vol.48, No.3, pp. 231-
245.
Noone, B.M, Kimes, S.E., Mattila, A.S, Wirtz, J. (2009), Perceived service encounter pace
and customer satisfaction: An empirical study of restaurant experiences Journal of Service
Management Vol. 20, No. 4, pp. 380 -403.
Noone, B.M., Namasivayam, K., & Tomlinson, H. S. (2010) Examining the application of six
sigma in the service exchange Managing Service Quality Vol. 20, No. 3, pp. 273-293.
Northcraft, G.B., & Chase, R.B. (1985) Managing Service Demand at the Point of Delivery
The Academy of Management Review, Vol. 10, No. 1, pp. 66-75.
Nyberg, M. and Olsen, T.D. (2010), Meals at work: integrating social and architectural
aspects International Journal of Workplace Health Management Vol. 3, No. 3, pp. 222 – 232.
O’Connor, P. (2000) Using Computers in Hospitality 2nd
Ed. London. Continuum.

255
Ohno, T. (1988) Toyota Production System: Beyond Large-scale Production USA,
Productivity Press.
Palmberg, K. (2009) Exploring process management: are there any widespread models or
definitions The TQM Journal Vol. 21, No. 2, pp. 203-215.
Parasuraman, A., Zeithaml, V.A., Berry, L.L. (1985) A conceptual model of service quality
and its implications for research Journal of Marketing Vol. 45, Fall, pp.41-50.
Parasuraman, A, Zeithaml, V.A., Berry, L.L. (1988) SERVQUAL: A multiple-item scale for
measuring consumer perceptions of service quality Journal of Retailing Vol. 64, No. 1, pp.
12-40.
Parasuraman, A. (2002) Service quality and productivity: A synergistic perspective Managing
Service Quality Vol.12, No.1, pp.6-9.
Peng, D.X., Schroeder, R. G., Shah, R., (2008) Linking routines to operations capabilities: A
new perspective Journal of Operations Management Vol. 26, pp. 730–748.
Peteraf, M. (1993) The Corner-stones of Competitive Advantage: The Resource Based View
Strategic Management Journal Vol. 14, pp. 179-191.
Pine, B.J. and Gilmore, J.H. (1999) The Experience Economy Harvard Business School Press.
Polanyi, M. (1962) Personal Knowledge. Towards a post-critical philosophy The University
of Chicago Press.
Ponsignon, F., Smart, P.A. & Maull, R.S. (2012): Process design principles in service firms:
Universal or context dependent? A literature review and new research directions Total Quality
Management & Business Excellence DOI: 10.1080/14783363.2011.637797 (No volume
given) Vol. , No. , pp. 1-24.
Prahalad, C.K. & Hamel, G. (1990) The Core Competence of the Corporation Harvard
Business Review May-June, pp. 79-91.
"process" The Oxford Dictionary of English Grammar. Sylvia Chalker and Edmund Weiner.
Oxford University Press, 1998. Oxford Reference Online. Oxford University Press.
University College Birmingham. 3 March 2011
http://www.oxfordreference.com/views/ENTRY.html?subview=Main&entry=t28.e1181.
"process, noun" Oxford Dictionary of English. Edited by Angus Stevenson. Oxford
University Press, 2010. Oxford Reference Online. Oxford University Press. University
College Birmingham. 24 February 2011
<http://www.oxfordreference.com/views/ENTRY.html?subview=Main&entry=t140.e066391
0>.

256
Pullman, M. & Rodgers, S. (2009) Capacity Management for Hospitality and Tourism:
Current Approaches International Journal of Hospitality Management Vol. 29, No. 1, pp. 177-
187.
Punch, K.F. (2005) Introduction to Social Research: Quantitative and Qualitative Approaches
2nd
Ed. London. Sage.
Ramesh, G. & Devadasan, S.R. (2007) Literature review on the agile manufacturing criteria
Journal of Manufacturing Technology Management Vol. 18, No. 2, pp. 182-201.
Rescher, N. (1996) Process Metaphysics State University of New York Press.
Riley, M. (1996) Human Resource Management in the Hospitality and Tourism Industries 2nd
ed, Butterworth Heinemann.
Ro, H.J. and Chen, P.J. (2011) Empowerment in hospitality organizations: Customer
orientation and organizational support International Journal of Hospitality Management Vol.
30, pp. 422–428.
Rodgers, S. (2007) Innovation in food service technology and its strategic role Hospitality
Management Vol. 26, pp. 899-912.
Robson, S.K.A, Kimes, S.E., Becker, F.D., Evans, G.W. (2011) Customers’ Responses to
Table Spacing in Restaurants Cornell Hospitality Quarterly Vol. 52, No. 3, pp. 253-264.
Rundle-Thiele, S. (2009) Bridging the gap between claimed and actual behaviour. The role of
observational research Qualitative Market Research: An International Journal Vol.12, No.3,
pp.295-306.
Sayer, A. (1992) Method in social science: A realist approach 2nd
Ed, London, Routledge.
Sayer, A. (2000) Realism and Social Science London, Sage Publications.
Schmenner, R.W. (1986) How can service businesses survive and prosper? Sloan
Management Review Vol. 27, No. 3, pp. 21-32.
Schmenner, R. W (1988), The Merit of Making Things Fast Sloan Management Review
Vol.30, No.1, pp.11-17.
Schmenner, R.W. (2004) Service Businesses and Productivity Decision Sciences Vol.35,
No.3, pp.333-347.
Seddon, J. (2005) Freedom from Command and Control 2nd
Ed, UK, Vanguard Education
Ltd.
Sheu, C., McHaney, R. and Babbar, S. (2003) Service process design flexibility and customer
waiting time International Journal of Operations and Production Management Vol. 23, No. 8,
pp. 901-917.

257
Sill, B.T (1991) Capacity Management: Making your service delivery more productive The
Cornell Hotel and Restaurant Administration Quarterly Vol. 31, No. 4, pp. 77-88
Sill, B.T. & Decker, R. (1999) Applying Capacity-management Science : The Case of Browns
Restaurants Cornell Hotel and Restaurant Administration Quarterly Vol. 40, No. 3, 22-30
Sill, B.T. (2004) 10 Commandments of Service Design theconsultant
http://www.deterministics.com/pdfs/10-Commandments-of-Food-Service.pdf accessed
27/07/2013
Sill, B.T. (2010) Managing Capacity Properly The Peach Report Issue 8, pp. 27
http://www.deterministics.com/pdfs/managing-capacity-properly.pdf accessed 27/07/2013
Simon, H.A. (1973) Does Scientific Discovery Have a Logic? Philosophy of Science, Vol. 40,
No. 4, pp. 471-480.
Slack, N., Chambers, S., Johnson, R. & Betts, A. (2009) Operations and Process Management
2nd
Ed. UK, Prentice Hall.
Slack, N., Chambers, S., Johnson, R. (2010) Operations Management 6th
Ed. UK, Pearson
Education.
Slack, N & Lewis, M. (2008) Operations Strategy 2nd
ed., Prentice Hall.
Stipanuk, D.M. (2006) Hospitality Facilities Management and Design 3rd
ed., Educational
Institute of the American Hotel and Lodging Association.
Stuart, I., et al (2002) Effective case research in operations management: a process
perspective Journal of Operations Management Vol.20, pp. 419-433.
Suri, R. (1999) How Quick Response Manufacturing takes the wait out The Journal for
Quality and Participation May/June, pp. 46-49.
Suri, R. (2010) It’s About Time: The Competitive Advantage of Quick Response
Manufacturing USA, Productivity Press.
Swink, M., Narasimhan, R. and Kim, S.W. (2005) Manufacturing Practices and Strategy
Integration: Effects on Cost Efficiency, Flexibility, and Market-Based Performance Decision
Sciences Vol. 36, No. 3, pp. 427-457.
Tangen, S. (2005) Demystifying productivity and performance International Journal of
Productivity and Performance Management Vol. 54, No. 1, pp. 34-46.
Taylor, S. (1994) The effects of filled waiting time and service provider control over the delay
on evaluations of service Journal of the Academy of Marketing Sciences Vol. 23, No. 1, pp.
38-48.

258
Teece, D.J. Pisano, G. & Shuen, A. (1997) Dynamic Capabilities And Strategic Management
Strategic Management Journal , Vol. 18, No. 7, pp. 509-533.
Tesone, D. (2010) Principles of Management for the Hospitality Industry Elsevier
The Association of Business Schools (2005) Guidelines for the Doctor of Business
Administration
Vallen, G.K. and Vallen, J. J. (2009) Check-in Check-out: Managing hotel operations 8th
ed,
Pearson Prentice Hall, USA.
Van de Ven, A.H. & Scott Poole, M. (2005) Alternative approaches for studying
organizational change Organization Studies Vol. 26, No. 9, pp. 1377-1404.
Vargo, S.L. & Lusch, R.F. (2004) The Four Service Marketing Myths: Remnants of a Goods-
Based, Manufacturing Model Journal of Service Research Vol. 6; pp.324 – 335.
Vargo, S.L. & Lusch, R.F. (2006) Service-dominant logic: reactions, reflections and
refinements Marketing Theory Vol. 6, No. 3, pp. 281-288.
Vergidis, K., C.J. Turner, C.J. & Tiwari, A. (2008) Business process perspectives: Theoretical
developments vs. real-world practice International Journal of Production Economics Vol.114,
pp. 91–104.
Verschuren, P.J.M., (2003) Case study as a research strategy: Some ambiguities and
opportunities International Journal of Social Science Research Methodology Vol.6, No.2,
pp.121-139.
Voss, C. et al (2002) Case research in operations management International Journal of
Production and Operations Management Vol.22 No.2 pp. 195-219.
Voss, C. (2007) Learning from the first Operations Management textbook Journal of
Operations Management Vol. 25, pp. 239–247.
Wild, R. (2002) Operations Management 6th
Ed, Continuum.
Womack, J.P., et al (2007) The Machine that Changed the World Paperback edition, UK,
Simon & Schuster.
Wilson, A. et al (2008) Services Marketing: Integrating Customer Focus Across the Firm UK,
First European edition, McGraw-Hill.
Wu, S.J., Melnyk, S.A., & Flynn, B.B. (2010) Operational Capabilities: The secret Ingredient
Decision Sciences Journal Vol.41 , No.4 , pp.721-754.
Wu, S.J., Melnuk, S.A. & Swink, M. (2011) An empirical investigation of the combinatorial
nature of operational practices and operational capabilities Compensatory or additive?
International Journal of Operations & Production Management Vol. 32, No. 2, pp. 121-155.
259
www.webelements.com/ Home of the periodic table accessed 30/11/10.
www.openways.com, accessed 06.11.12.
Xiao, H. & Smith, S.L.J. (2006) Case studies in tourism research: A state-of-the-art analysis
Tourism Management Vol.27, pp. 738–749.
Yang, C. (2011): Implementation and effectiveness of strategic actions used to reduce
customer variability, The Service Industries Journal, Vol.31, No.4, pp.527-544.
Yang, Z., Wang, X., & Su, C. (2006) A review of research methodologies in international
business International Business Review Vol. 15, pp. 601-617.
Yin, R.K. (2009) Case study research: design London, 4th
Ed, Sage.
Zijlstra, E. and Mobach, M.P. (2011) The influence of facility layout on operations explored
Journal of Facilities Management Vol. 9, No. 2, pp. 127-144.

260
APPENDICES
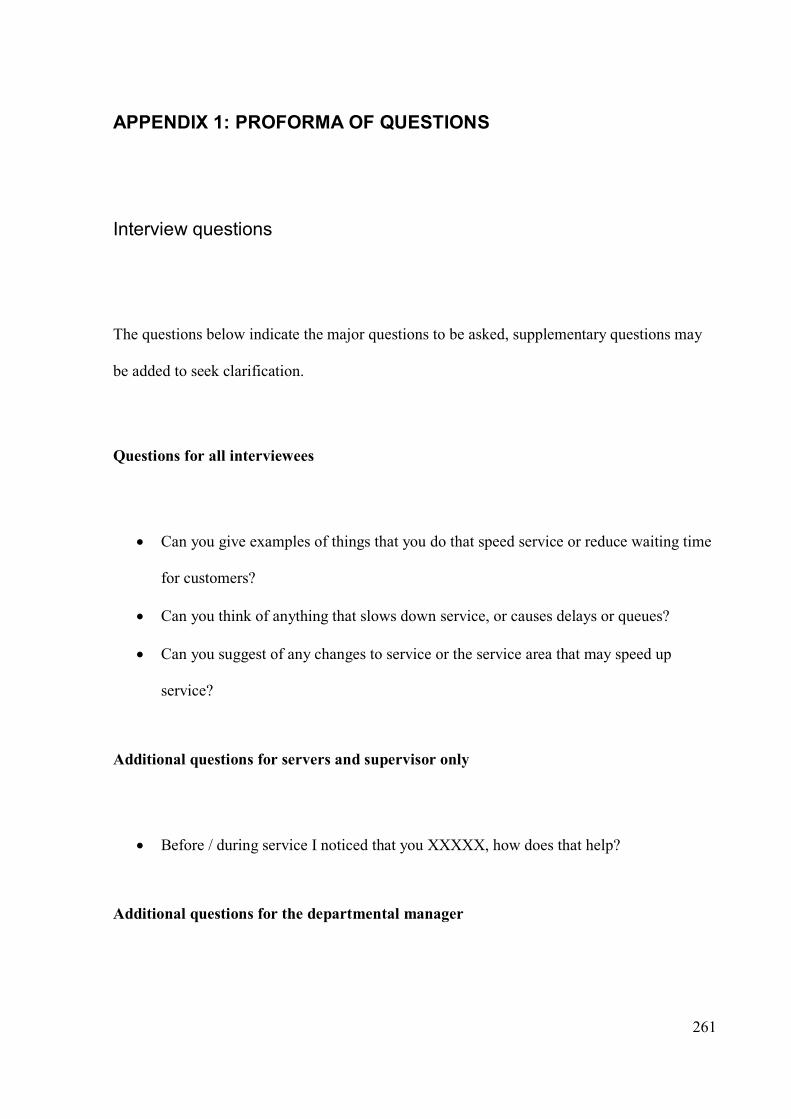
261
APPENDIX 1: PROFORMA OF QUESTIONS
Interview questions
The questions below indicate the major questions to be asked, supplementary questions may
be added to seek clarification.
Questions for all interviewees
Can you give examples of things that you do that speed service or reduce waiting time
for customers?
Can you think of anything that slows down service, or causes delays or queues?
Can you suggest of any changes to service or the service area that may speed up
service?
Additional questions for servers and supervisor only
Before / during service I noticed that you XXXXX, how does that help?
Additional questions for the departmental manager

262
As arise in the context of each case

263
APPENDIX 2: EMAIL EXAMPLE OF RESEARCH AIMS AND DATA TO
BE COLLECTED
Dear XXXXX
I have been a lecturer in hospitality operations management at University College
Birmingham for eight years and am working towards a Doctorate at Birmingham
University. I am collecting data on how customers and the service system influence the
duration of the service encounter. I am focussing on check-in and breakfast service.
I would like to use your hotel as one of my case studies. I do not need to interview or
question customers. The majority of the time would be spent sitting, observing service and
taking notes on service duration, sources of duration variation and front desk task variety.
I have visited three four star hotels in Birmingham and plan to visit two more, the names of
the hotels and staff will not be revealed in the final report, a copy of which will be sent to all
participating hotels in late 2012.
Please allow me the opportunity of meeting with you to discuss the planned research
procedures in detail, answer any questions that you may have and, hopefully, gain your
commitment to this research. To give you an idea of the time frame, I am hoping to be
permitted to conduct research in your hotel from Tuesday March 27th
2012.

264
Tuesday March 27th Check-in
Wednesday Breakfast & Check-in
Thursday Breakfast & Check-in
Friday Breakfast
Check-in would be observed from 4.00pm to approximately 7.30pm and breakfast service
from the start until around 9.30am. Occasional questions may be asked of staff at during
service if they are not busy serving customers. Formal interviews of no more than 15 minutes
with approximately five staff would be conducted on the Thursday or at a convenient time
during the following week.
Please email or telephone me so that we can arrange a mutually convenient time to meet so
that I can answer any questions that you may have and hopefully persuade you to allow me
access to your hotel. I have no teaching on Wednesday afternoons, Thursday afternoons and
Friday mornings. I hope to hear from you soon, if I don’t hear from you within a few days
then I will send you a gentle reminder.
Regards,
XXXXXXXX

265
APPENDIX 3: EXAMPLE OF A BRIEFING SHEET
The broad question is – how far can we go in eliminating queues and waiting time?
The basic purpose is to explore and explain how the way you work and the facilities and
equipment that you use helps or hinders the flow of customers. So as well as working
practices it is about the physical facilities and equipment that are available.
There is a lot of research and theory from other industries but I am interested in the approach
of hotels to the problem.
To help answer the question I need to watch you work and talk to you. There are a few
questions that I would like you to think about. I will chat to you and other staff during the
week to gather some answers:
Can you give examples of things that you do that speed service or reduce waiting time for customers?
Can you think of anything that slows down service, or causes delays or queues?
Can you suggest of any changes to service or the service area that may speed up service?
I also need to look at any documents that you have that set standards for working or
performance.
266
Most time will be spent sitting and observing. There may be occasions during service when I
ask a question or two. The proposed schedule is below.
Tuesday Check-in
Wednesday Breakfast & Check-in
Thursday Breakfast & Check-in
Friday Possibly talk to staff
Saturday
Sunday Breakfast
I will observe reception from 4.00pm to 8.00pm. I am mainly concerned with check-in
duration and what affects it, but I will also need to list the other tasks that occupy front desk
staff. For two observations I will observe from the lobby area, I need to have one observation
session from behind reception so that I can observe and hear what is being said.
I will observe breakfast service from start to finish, or for at least three hours. Ideally I will
observe from a small table in the restaurant. I don’t want to take tables away from customers
so if all tables are occupied I will move to a location where I can observe and make notes
without occupying a table.
Although I am observing service I will also be chatting to you about what you do to prepare
for service. As I observe I may ask the occasional question to seek clarification about
procedures or actions taken. I would like to talk to operations supervisors and managers and a
few operations staff individually after I have spent some time observing. Perhaps after

267
breakfast on Thursday I can have a team meeting with three servers and ask a few questions.
I will arrange mutually suitable times to chat to the breakfast supervisor, the front office
manager and the operations manager
268
APPENDIX 4: EXAMPLE OF A REPORT SENT TO A HOTEL
Analysis of findings (XXXX)
Managers are under pressure to meet financial targets. To do this they need to use their
capacity to maximise revenue (usually by maximising capacity utilisation) and to control or
reduce the input resources that create the costs. Capacity consists of volume and time.
Capacity volume is made up of capital in the form of physical facilities and equipment and
labour in the form of people and their capabilities. Work is activity and is often described as a
process, activity takes time to complete, some activities require the customer to be present,
others can be completed without the customer.
Maximum capacity is equal to the maximum throughput rate. Effective (available) capacity is
set by the resource that limits the throughput rate (Armistead & Clarke, 1994). Effective
capacity can be adjusted by changing the volume limiting capacity resource or the required
duration of volume limiting activities. Activities that do not require the customer to be
present can be completed pre-process (encounter) or post process (encounter). If demand is
variable then there may be the opportunity to complete pre and post process tasks during
periods of low demand, alternatively the task can be moved to back office and completed by a
person not involved in the customer interaction (Anupindi et al, 2012).
Time variability in task completion is rooted in the system and the customer. Activities that
consume more time also reduce effective processing capacity because more time is consumed
269
per transaction. Reducing or accommodating variability can therefore either increase
effective capacity or smooth the flow of customers through the system. This is important
because reduced effective processing capacity can lead to delays or queues for customers or
even lead to potential customers either leaving or being turned away. The potential result is
for customer dissatisfaction and reduced revenue. Thus there is a causal relationship between
variability, capacity utilisation and inventory (in the form of customers). If the goal is to
control the level of inventory and ensure its unimpeded flow through the system then
variability must be reduced or capacity designed and managed to absorb it (Klassen & Menor,
2006).
Two models will be used to categorise the sources of variability. Armistead and Clarke’s
(1994) model of capacity will be used to categorise observed sources of variation stemming
largely from the resources and processes of the organisation. Observed short-term capacity
management approaches will be plotted against the list compiled by Pullman & Rodgers
(2009). Frei’s (2006) sources of customer variability will be used to categorise observed
customer variability. Observed customer arrival times and durations of service will be
analysed. Commentary will highlight and analyse the main causes of variation in process
duration and explain the extent to which the nature of the resources and activities of the two
processes are arranged to achieve appropriate throughput time and quickly adapt to cope with
short term changes in demand.
Two parts of Armistead & Clarke’s model are used here, capacity task and service leakage
(tables 1 and 2). Capacity tasks are tasks that help management balance supply and demand.
The short-term capacity management strategies of Pullman and Rogers (table 3) are actions

270
that can be categorised mainly as scheduling, controlling and coping tasks. These tasks can
be viewed as responses to forecast demand or identified bottlenecks. Arranging to use
flexible capacity assumes that demand forecasting has taken place and the ability of existing
capacity to cope with demand assessed. Attempts to schedule or influence patterns of demand
indicate an understanding of the limitations of capacity. The use of automation or customer
participation indicates an understanding that labour bottlenecks can be treated by allowing
customers and machines to be substitutes for labour.

271
Capacity task Interpretation Observed
Priority setting Where there are conflicting
demands from customers
decisions need to be made
about which customer is
served first.
Priority given to customers present
over table clearing.
Priority given to customers present
over telephone calls.
Bottleneck
identification
Identify and treat the rate
limiting resource.
Labour flexibility observed (events
server brought in to help at breakfast),
and priority setting was observed.
Forecasting demand Forecasting customer
demand so that only the
necessary resources to meet
demand are acquired and
deployed.
Forecasting appeared to be largely
based on an assumed guest numbers.
The variety of tasks in front office
means that the demand for labour
cannot be forecast.
In both cases the arrival pattern of
customers is unpredictable.
Scheduling Smoothing demand by
scheduling it, taking
restaurant reservations for
example.
Demand for check-in and breakfast
cannot be scheduled.
Coping strategies Strategies to implement in
services as available
capacity becomes
insufficient to meet
demand in the time frame
expected by customers, or
when demand is
insufficient to keep
capacity utilised.
The number of staff working varied
with demand. It was reported that
specific tasks are allocated during
busy breakfast service.
Management are supposed to add
labour capacity to the front desk at
busy times.
Customers are required to wait when
capacity is occupied or unavailable.
Controlling capacity Changing capacity in
response to predicted and
actual demand, i.e. having
spare or flexible capacity.
Physical capacity seemed fixed,
labour capacity was flexible.
Clerks switched from pre / post
process tasks and admin tasks to deal
with customers present.
Table 1: Armistead & Clarke’s capacity tasks at the XXXX.
Variation in service time due to the design or delivery of service was evident, table Error!
Reference source not found. lists some sources in the capacity leakage section, details are
given in the appendices. Priority setting strategies were observed to attempt to speed service
for the customers. Labour underperformance is a very negative term and suggests that there

272
are clear performance targets that employees are expected to achieve, for example a check-in
duration or an upsell target. Differences in labour capability is a perhaps more appropriate
term. The differences stem from different characters and length of experience and different
knowledge and skills. Noone et al (2010) observed 165 check-ins at a hotel and observed
frequent non-compliance with the Standard Operating Procedures. There was high
compliance with steps for which staff could be held accountable, such as swiping a credit
card. They also observed that the order of tasks varied, partly due to staff behaviour and
partly due to customer involvement and preference.
Service Load Observed
Service variety The variety of tasks or
activities that may be
available, each of which
may require different
lengths of time to complete.
Front desk clerks were observed
responding to a wide variety of
requests each requiring different
lengths of time.
Breakfast items cooked to order were
the main source of variety. A breakfast
menu was presented but guests
sometimes requested a slight variation
from the dishes described.
Variation in demand Lumpy arrival patterns
leading to variations in
capacity utilisation and
possibly queues. Variation
in customer behaviour as
suggested by Frei (2006).
Arrivals were unscheduled and demand
was lumpy in both processes.
No queuing was observed at breakfast.
Only brief queues at the front desk.
Customers who wanted hot food were
required to wait for it to be cooked.
Resource absorption
per service
The nature of a service task
or actions of the customer
that result in varying time
requirements for part or all
of a process.
Front desk tasks varied greatly in the
amount of time required and each
required the presence of an employee
throughout the process.
The time required for a task varied.
Breakfast service encounters were
brief, physical capacity largely
absorbed customer time variation. The
length of time required to cook
different menu items may have meant
that customers were kept waiting
different lengths of time.

273
Demand
management
The effectiveness of any
demand management
strategies in matching
demand with capacity.
No demand management strategies
observed.
Capacity Leakage
Labour lateness /
absenteeism
Insufficient labour resulting
in customers waiting.
No labour shortage observed, however
on occasions front desk clerks were
called away from the desk to do other
tasks, leaving customers waiting
briefly (either in person or on the
phone).
Quality failures Imprecise equipment,
substandard materials or
employee errors, perhaps
due to lack of training or
lack of standard operating
procedures (SOPs).
No quality failures were observed at
breakfast.
No service failures were observed on
the front desk. There were SOPs for
check-in and training was evident and
most staff appeared experienced.
There were failures in maintenance and
housekeeping that made demands on
the time of front office staff.
Scheduling losses Demand cannot be satisfied
due to late delivery or
shortage of materials,
equipment shortages or
breakdowns.
No scheduling losses were observed at
breakfast.
Demand from customers present was
always satisfied
Labour
underperformance
Varying knowledge,
motivation or capability of
the workforce.
No labour underperformance was
observed at breakfast.
Less experienced clerk appeared to
take longer to complete guest requests
and more often had to seek support.
Change-overs Capacity unavailable while
it is prepared for the next
customer.
No physical change-over at the front
desk.
Physical capacity was limited. The
need to reset tables did not cause any
significant delays to service but may
have limited their choice of where to
sit.
Table 2: Sources of variability affecting capacity at the XXXX. Adapted from Armistead &
Clarke (1994).
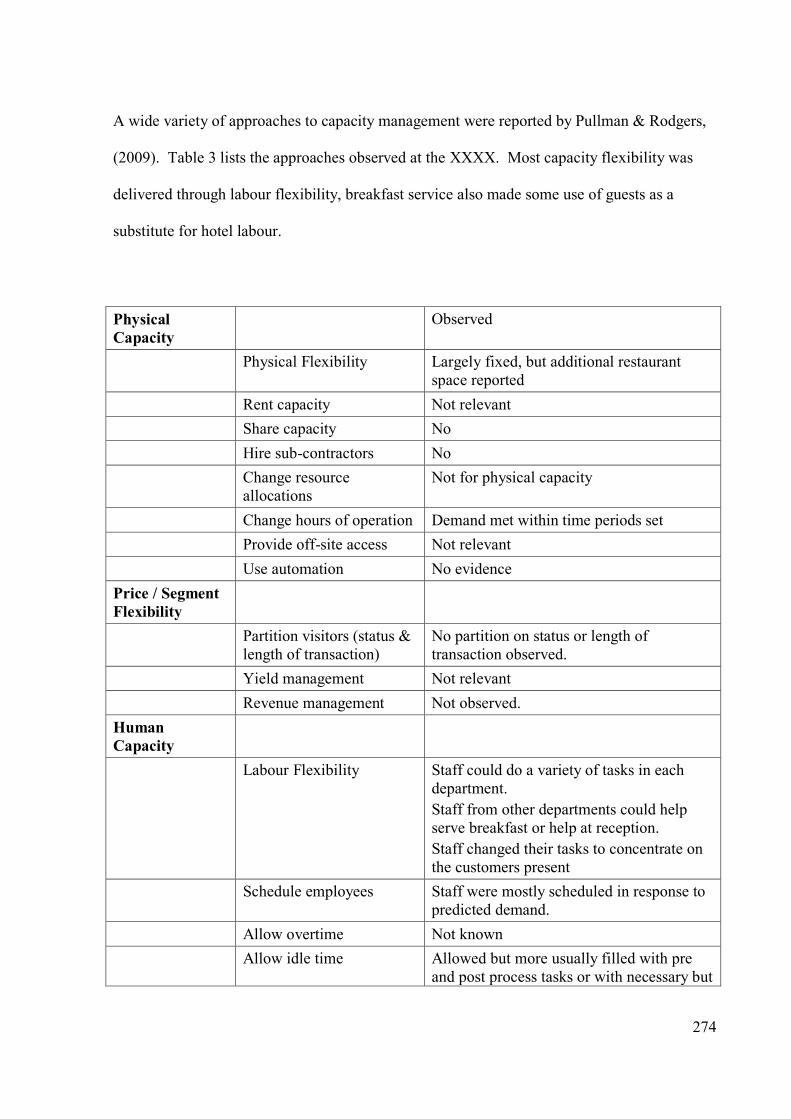
274
A wide variety of approaches to capacity management were reported by Pullman & Rodgers,
(2009). Table 3 lists the approaches observed at the XXXX. Most capacity flexibility was
delivered through labour flexibility, breakfast service also made some use of guests as a
substitute for hotel labour.
Physical
Capacity
Observed
Physical Flexibility Largely fixed, but additional restaurant
space reported
Rent capacity Not relevant
Share capacity No
Hire sub-contractors No
Change resource
allocations
Not for physical capacity
Change hours of operation Demand met within time periods set
Provide off-site access Not relevant
Use automation No evidence
Price / Segment
Flexibility
Partition visitors (status &
length of transaction)
No partition on status or length of
transaction observed.
Yield management Not relevant
Revenue management Not observed.
Human
Capacity
Labour Flexibility Staff could do a variety of tasks in each
department.
Staff from other departments could help
serve breakfast or help at reception.
Staff changed their tasks to concentrate on
the customers present
Schedule employees Staff were mostly scheduled in response to
predicted demand.
Allow overtime Not known
Allow idle time Allowed but more usually filled with pre
and post process tasks or with necessary but
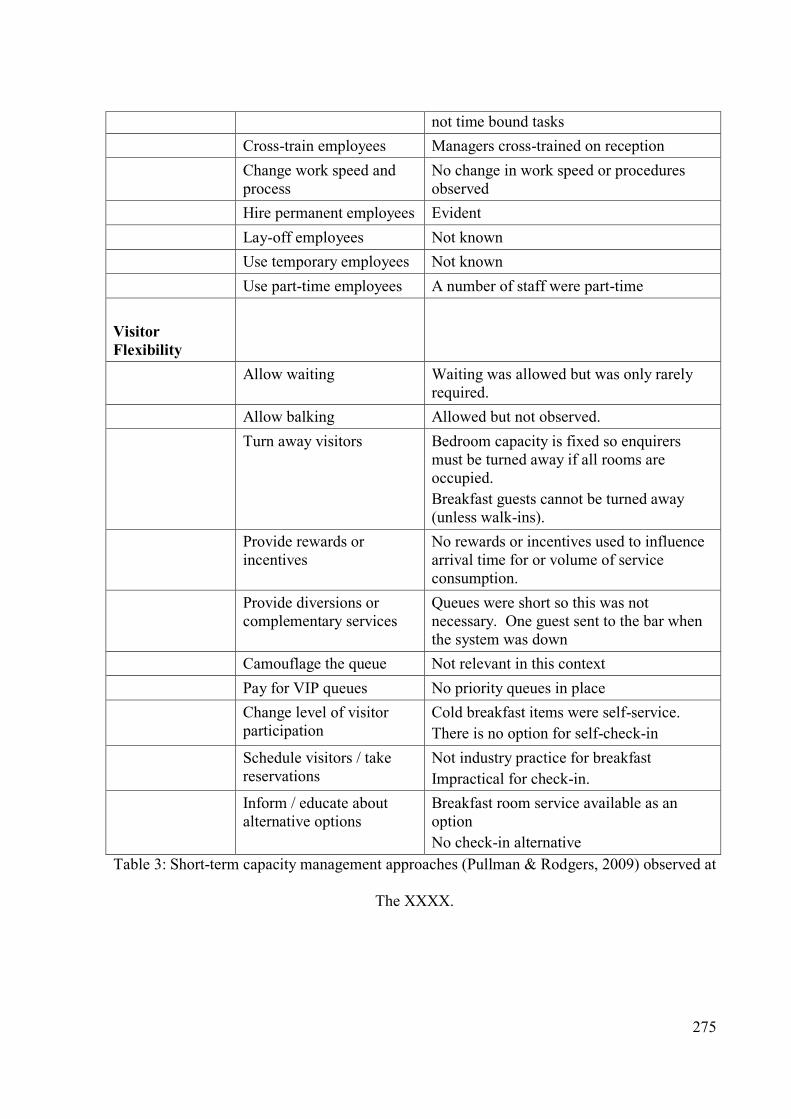
275
not time bound tasks
Cross-train employees Managers cross-trained on reception
Change work speed and
process
No change in work speed or procedures
observed
Hire permanent employees Evident
Lay-off employees Not known
Use temporary employees Not known
Use part-time employees A number of staff were part-time
Visitor
Flexibility
Allow waiting Waiting was allowed but was only rarely
required.
Allow balking Allowed but not observed.
Turn away visitors Bedroom capacity is fixed so enquirers
must be turned away if all rooms are
occupied.
Breakfast guests cannot be turned away
(unless walk-ins).
Provide rewards or
incentives
No rewards or incentives used to influence
arrival time for or volume of service
consumption.
Provide diversions or
complementary services
Queues were short so this was not
necessary. One guest sent to the bar when
the system was down
Camouflage the queue Not relevant in this context
Pay for VIP queues No priority queues in place
Change level of visitor
participation
Cold breakfast items were self-service.
There is no option for self-check-in
Schedule visitors / take
reservations
Not industry practice for breakfast
Impractical for check-in.
Inform / educate about
alternative options
Breakfast room service available as an
option
No check-in alternative
Table 3: Short-term capacity management approaches (Pullman & Rodgers, 2009) observed at
The XXXX.

276
In the two departments service encounters are generally brief, the servers interact with a large
number of different customers during their shift. Servers are there to fulfil a need of the
customer, there is an exchange of information and the server performs a task that allows the
customer to fulfil the need that they seek to satisfy. While the number of customers due to
arrive can be forecast, the actual time of their arrival cannot. These unscheduled, or random,
arrivals mean that capacity experiences variable demand. At times capacity may be fully
utilised and customers forced to queue or be turned away, at other times it may be under-
utilised.
It is important to note a key feature of systems where events are random, i.e. not scheduled.
While it may be possible to identify the total level of demand and the general pattern the exact
arrival time of each customer cannot be predicted. Arrival times of customers (events) are not
evenly distributed, such systems are characterised by more short inter-arrival times and fewer
longer arrival times and generally conform to an exponential distribution, for example,
customers arriving at an event. If customer waiting time is to be minimised then the system
must be designed so that processing capacity can be quickly increased or decreased in
response to customer demand, for example, the number of open check-outs in a supermarket.
Queuing theory incorporates the assumption of an exponential distribution of customer inter-
arrival times (Slack et al, 2010).
Basically, the more time that each customer interacts with staff the greater the number of staff
required. To ensure that customers are not kept waiting the hotel needs to ensure that
sufficient physical and labour capacity is available and that process duration that involves the
customer (the service encounter) is controlled. To achieve a short service encounter only

277
those tasks that have to be carried out with the customer present should be carried out with the
customer present, other tasks should be moved to pre-encounter or post-encounter (Anupindi
et al, 2012). A short service encounter enables servers to serve more customers in a given
time period, this is particularly appropriate where demand is variable, during periods with few
or no customers servers can carry out the pre and post encounter tasks. This was evident in
both departments. At the front desk there was a great variety of tasks to complete and no way
of predicting when demands for service from customers would arrive. A great deal of variety
in the type of task and task duration was observed on the front desk, refer to appendix XX for
a full list. The variety of tasks required of restaurant staff is more limited, when not
interacting with customers servers cleared and reset tables, restocked mise-en-place and the
cold buffet. Physical capacity provides the necessary space for customers to consume or act
when not interacting with staff.
Customers often take part in the process as a co-producer and are perhaps the source of the
greatest amount of time variability and the least controllable source. The five types of
customer variability in service processes identified by Frei (2006) are considered in table 4.
The two most frequently observed sources of customer variability were arrival and request
variability. Arrival variability has already been discussed. There is no industry standard for
the service variety offered and the willingness to be flexible or customise in response to
customer requests, it is a policy choice for the hotel. Request variability can add to process
time in two ways. Firstly, if it takes time to change over from delivering one service to
another, for example, preparing a continental breakfast tray and delivering it. Secondly, the
time demands (resource absorption) for a request vary, for example, some items take longer to
cook than others, some customers request more server attention than others. If service variety

278
and request variability result in variable demands on server time then sufficient labour
capacity needs to be provided to absorb this variation, otherwise customers may have to wait.
The server can be removed from the process by requiring the customer to do some of the
work. Breakfast is a consumption activity, servers are there to provide products for customer
consumption. The contact time with customers is minimal and duration is in the control of
customers. Physical capacity needs to be sufficient to absorb the variation in demand and
duration patterns for most occasions. It is not economic to design physical capacity to cope
with the infrequent high demand occasions (Dickson et al, 2005), for example, when everyone
‘decides’ to come down for breakfast at the same time. It must be accepted that, on some
occasions at least, customers will have to wait.
The check-in process is more complex than breakfast service, there appears to be a security
element (checking and confirming of identity), an information exchange and confirmation
element (duration, room type and payment), an offer of services (newspaper, wake-up, dinner)
and (sometimes) an information provision element (hotel services, and locations). The
customer and server occupy physical capacity and remain together until the process is
completed. Check-in is an information exchange in which the arriving customer is
transformed into, and accepted as, a hotel guest by the provision of a room key, only time is
consumed. The customer can influence the length of the service process by the speed with
which responses are given and the number and complexity of additional questions asked.

279
Check-in duration can be reduced by removing all but the most necessary transactions and
exchanges, the XXXX believes that it has achieved this. If customers had prior access to all
the information about their reservation and the hotel they could complete (pre-process) all
essential activities without the need for a server. Hotels that use electronic door locks are in a
position to allow remote check-in, at least for regular or loyal customers. Information about
guest services could be provided in the room. The decision to maintain a face-to-face check-
in needs to be made on the basis of whether the organisation considers that the opportunity for
social interaction adds value for the customer.
Guests arrive at breakfast, at a time that suits them. Arrivals gradually increased with the
peak time being roughly between about 7.30am and 8.45am. They can then stay at the tables
for as long as they choose and ‘self-request’ among the wide variety of food items. Although
the average observed duration for breakfast was 26:33 minutes, the standard deviation was
about 11 minutes. It is clear from figure Error! Reference source not found. that there was
a wide variety in the observed dwell frequency. It was observed that customers were not only
occupied with eating breakfast but carried out a variety of tasks such as, reading newspapers
or mobile phones and chatting to colleagues or partners. Sufficient physical capacity is
required to absorb the variation in dwell time so that customers are not kept waiting due to the
unavailability of physical capacity. Where customers occupy physical capacity for a duration
of their choice the amount of capacity available should reflect the volume and time demands
placed on it. For more statistics please see appendix XX.

280
Figure 9. Recorded breakfast dwell time frequency
Customers arrive for check-in at a time that suits them and they influence the speed of check-
in by the detail and speed of response to questions asked and the number and complexity of
questions that they ask to servers.
0
5
10
15
20
25
30

281
Variability
type
Description Observed
Arrival
variability
Arrivals may follow a
pattern but guests
arrive when in suits
them.
Arrival times followed a rough pattern, the busiest
breakfast period was between 7:40am and 8:40am.
There was no observable pattern to arrival times of
check-in customers, except that there seemed to be
lots of short inter-arrival times.
Guests arrived at both services at a time that suited
them.
Request
variability
Variation from the
standard service or
product and varying
demand for the
number of products or
services.
The provision of a breakfast buffet with a variety
of cold food options enabled guests to self-select
items of their choice as frequently as they wished.
Cooked food was offered, customisation of orders
was permitted. Different dishes required different
preparation times.
A wide variety of requests were made at the front
desk apart from check-in. Customers request
variety appeared to be the main source of time
variation in all front desk activities.
Capability
variability
Abilities of customers
vary with knowledge,
skill or physical
ability. This is
particularly important
where the customer is
a co-producer.
Most customers had either stayed in hotels before
or at this particular hotel and seemed be familiar
with what was required of them.
Customers appeared to understand the convention
of waiting their turn for service and the need to
wait for items to be cooked.
Help with luggage was offered on occasions and,
when there was a significant amount, accepted.
Effort
variability
Different customers
are willing to put in
different amounts of
effort as co-producers.
Not observed.
Subjective
preference
variability
Derives from a
subjective opinion and
valuation of the
different elements of a
service.
This was difficult to observe and perhaps was
expressed in request variability.
Customers who do not like the way service is
delivered may not express this but may simply try
a different hotel next time.
Table 4: Evidence of customer variability at the XXXX.
Front desk clerks are required to carry out a variety of tasks, the duration of all tasks,
including check-in, was very variable. A key difference between the breakfast process and
the front desk is that here customers occupy capacity for the duration of the service encounter,

282
they do not require physical capacity to sit and consume. Another difference is the time
service is available, breakfast service is limited to a four hour slot, generally hotels prefer
guests not to check-in before 2.00pm, but after that time they can check-in at any time, thus
demand for service is spread out over a longer time period.
The strategies used to cope with customer variability differed in each department. In table
Error! Reference source not found. the observed strategies are highlighted in bold text. The
predominant strategy was Classic Accommodation, this uses labour to accommodate the
variability. Only breakfast service made some use of other strategies, this mainly took the
form of self-service. Deciding which strategy to adopt is context dependent. The XXXX is
an AA four star hotel and uses adjectives such as “luxurious”, “comfortable”, “delicious” and
“glamorous” (XXXX accessed 03.04.12), in addition the company claims that “we're run by
real hoteliers who have the genuine passion and the experience to make our service, dining
and accommodation the very best it can be” (XXXX accessed 03.04.12). Reduction and low-
cost strategies may be perceived by the customer as detracting from the level of service
offered and thus the perception of the brand that the company is trying to maintain. Product
and service options by their nature have limitations and thus there is always a limit to service
breadth and some customers may be forced to limit their expectations to what can be
provided. It is therefore not a question of which strategy is best but which best helps the
operation achieve its objectives.

283
Classic
Accommodation
Low-Cost
Accommodation
Classic
Reduction
Uncompromised
Reduction
Arrival Make sure plenty
of employees are
on hand
Hire lower-cost
labour
Automate tasks
Outsource
customer contact
Create self-service
options
Require
reservations
Provide off-peak
pricing
Limit service
availability
Create
complementary
demand to
smooth arrivals
without requiring
customers to
change their
behaviour
Request Make sure many
employees with
specialized skills
are on hand
Train employees
to handle many
kinds of requests
Hire lower-cost
specialized labour
Automate tasks
Create self-
service options
Require customers
to make
reservations for
particular types of
service
Persuade
customers to
compromise their
requests
Limit service
breadth
Limit service
breadth
Target customers
on the basis of
their requests
Capability Make sure
employees are on
hand who can
compensate for
customers’ varied
skill levels
Do work for
customers
Hire lower-cost
labour
Create self-
service options
that require no
special skills
Require customers
to increase their
level of capability
before they use the
service
Target customers
on the basis of
their capability
Effort Make sure
employees are on
hand who can
compensate for
customers’ lack
of effort
Do work for
customers
Hire lower-cost
labour
Create self-service
options with
extensive
automation
Use rewards and
penalties to get
customers to
increase their
effort
Target customers
on the basis of
their motivation
Use a normative
approach to get
customers to
increase their
effort
Subjective
Preference
Make sure
employees are on
hand who can
diagnose
differences in
expectations and
adapt accordingly
Create self-service
options that permit
customisation
Persuade
customers to adjust
their expectations
to match the value
proposition
Target customers
on the basis of
their subjective
preferences
Table 5. Strategies for managing customer-introduced variability (Frei 2006) at the XXXX.

284
Conclusions and recommendations for capacity management
Effective capacity describes the maximum throughput rate which is an expression of volume
over time. Increasing effective capacity therefore requires operators to either increase the
volume that can be processed or shorten activity time per flow unit on the critical path of the
process, the critical path being the sequence of activities that define the minimum possible
duration of the process.
All systems have resource limits that set how many flow items can be processed. An obvious
example is the number of bedrooms in a hotel or the number of tables in a restaurant, at times
the front desk rate limiting resource was the availability of labour. If a resource limits the rate
of processing then it is on the critical path of the process. Activities that are not on the critical
path may be lengthened or delayed without any impact on process duration. Observations
revealed that physical capacity is the main limiting factor at breakfast; labour and equipment
are the main limiting resources at the front desk. Flow time at breakfast is represented by the
actual time that servers spend serving customers and resetting tables, this is already brief. The
hotel cannot control how long customers choose to spend over breakfast or when they arrive
to demand service. Flow time at check-in is dependent only partly on the standard check-in
procedure; customer request variability can be a significant source of variability.

285
Anupindi et al (2012) recommend the following strategies to increase throughput and
capacity:
Increase the processing capacity of the rate limiting resource.
o Shorten flow time at the bottleneck.
o Add capacity (space, labour, equipment, materials, time).
Shorten flow time: Concentrate on the critical path. o Reduce the number or duration of activities.
o Identify and eliminate waste.
o Complete activities in parallel instead of serially.
o Move activities to pre-process or post-process.
Variability results in variable process time and variable resource demand for each activity or
flow unit. Variability is inherent in all processes, however, those that involve people are
subject to more variability. Given the customer-orientated service culture of hospitality the
main aim should be to accommodate customer variability. The main aim should be to reduce
variation that is within the control of the hotel, such as labour capability, ill-defined or over-
complicated operating procedures and waste (errors and equipment break-downs for
example). Inevitably the hotel has to find a suitable balance between cost and customer
satisfaction, but there may be ways to make capacity more flexible or more absorbent at little
or no extra cost. Actions for addressing the two broad categorisations of variation are given
below.
Accommodate (mainly customer):
Flexible capacity:

286
o Space: Allows a varying number of customers to co-produce, but give them
enough space.
o Equipment: As a replacement for labour.
o Labour: Casual and part-time, task variety so all time filled.
Shorten and reduce frequency of service encounters: Less opportunity for variation,
greater absorption of arrival variation by labour.
Demand forecasting to identify required resources and put them in place.
Reduce (mainly resource and activity):
Limit service variety: Less opportunity for variation.
Simplify product or service: Less opportunity for variation.
Conformance standards: Standard way of doing the job.
Recruitment and training: Select suitable staff and train them.
Maintenance procedures: Keep equipment working.
Demand management: Influence arrival times.
Labour capacity was observed to be flexible in both services. Space in the restaurant was
limited. A rearrangement of space and activities could allow the provision of a hot buffet,
while this may free labour for other tasks it may have no impact on dwell time (therefore also
throughput rate). Demand forecasting does help plan resource acquisition and allocation but
actual arrival times and patterns of arrival are not predictable this requires flexible capacity,
mainly in the form of labour, to absorb the variability.
Operations management theory has its roots in agriculture and manufacturing, it emphasises
the minimisation of input resources and the maximisation of the difference between the cost
of inputs and the value of outputs. This can mean that the elements of service that are
difficult to value, such as the value of social interaction, end up being given no value and are
stripped out. The end result can be an anonymous and soulless experience for customers. If
social interaction is valued by customers then available labour must be sufficient to allow

287
time for social interaction and the substitution of labour by equipment may not satisfy the
needs of customers.
Generally the more complex activities are, or the greater the variety of activities required of
employees, then the longer it takes them to learn how to get them more correct more of the
time. Activity repetition / familiarity also tends to result in activity time reduction (Bicheno,
2008). Improvements to process design can be achieved by using techniques such as Service
Blueprinting (Bitner et al, 2008). By analysing the activities in the processes the necessary
knowledge, skills and equipment can be identified. A standard way of doing a job in service
needs to represent an ideal rather than a performance measure, the needs of the customer need
to remain the top priority and flexibility in process delivery needs to be retained. The server
needs to guide and respond to the customer rather than confining themselves to a set script.
There is little scope for using demand management tools (mainly pricing and promotion) to
influence arrival times in the observed processes. The number of observations were limited,
if there are regular times at which demand for capacity exceeds available capacity then
customers could be advised of this so that they have the choice to avoid those times and are
psychologically prepared for delays if they cannot.

288
References
Anupindi, R. et al (2012) Managing Business Process Flows: Principles of Operations
Management. 2nd
Ed. New Jersey. Pearson Prentice Hall
Armistead, C & Clarke, G. (1994) The “coping” capacity management strategy in service in
services and the influence on quality International Journal of Service Industry Management
Vol.5, No.2, pp5-22
Bicheno, J. (2008) The Lean Toolbox for Service Systems England. PICSIE Books
Bitner, M.J., Ostrom, A.L., Morgan, F.N. (2008) Service Blueprinting: A practical technique
For service innovation California Management Review Vol.50, No.3, pp.66-94
Dickson, D., Ford, R.C., Laval, B (2005) Managing Real and Virtual Waits in Hospitality and
Service Organizations Cornell Hotel and Restaurant Administration Quarterly Vol. 46, No 1,
pp. 52-68
Frei, F. (2006) Breaking the trade-off between efficiency and service Harvard Business
Review November. pp. 93-101

289
Klassen, R.D., Menor, L.J. (2006) The process management triangle: An empirical
investigation of process trade-offs Journal of Operations Management Vol.25, pp.1015–1034
Noone, B.M., & Kimes, F.E. (2005) Dining duration and customer satisfaction CHR Reports
Vol.5. No.9. pp. 6-21.
Pullman, M., Rodgers, S. (2009) Capacity Management for Hospitality and Tourism: Current
Approaches International Journal of Hospitality Management Vol. 29, No. 1, pp. 177-187
Schmenner, R.W. (2004) Service Businesses and Productivity Decision Sciences Vol.35,
No.3, pp.333-347
Slack, N., Chambers, S., Johnson, R. (2010) Operations Management 6th
Ed. UK, Pearson
Education.

290
Appendix: Breakfast
The XXXX, Breakfast Notes
Breakfast is served in the restaurant from 6.30am to 10.00am Monday to Friday, times change
slightly at weekends. The restaurant observed had 67 covers arranged as shown in the table
below.
Tables and
size
Covers
17x2 34
7x4 28
1x5 5
Total 67
There were three observation sessions, the Tuesday observation started at 6.00am and finished
at 9.41am. Service was observed from 6.45am to 9.30am on Wednesday and from 6.54am to
9.33am on Friday. The observer occupied a table in the corner of the restaurant and recorded
various timings. General observations were made about behaviour observed that may affect
speed of service.

291
Breakfast is self-service for cold items, such as pastries, cereals, yoghurts and juices. The
buffet is located in the bar approximately 15 metres outside the restaurant. Menus are placed
on each table and orders are taken for hot beverages, toast and cooked items.
Tables are set for breakfast the night before, each setting consists of a side plate, cutlery, a
cup, saucer and teaspoon, salt & pepper, sugar bowl, pots of jam, pats of butter, jugs of milk,
a linen napkin (paper on Friday) and a menu. One member of staff arrives at 5.30am to start
setting up the buffet, a second joins at 6.00am, any remaining staff arrive at 7.00am.
Additional staff can be called in from conference and banqueting as demand dictates. At peak
service on Tuesday a total of six staff were working, on Wednesday four staff and on Friday
two staff.
There appeared to be no clear division of labour, all staff showed guests to tables, took orders,
delivered orders and reset tables. One interviewee however indicated that at busy times
specific roles were allocated to different members of staff. The basic service process as
observed is shown in table 6.

292
Task with customer
Welcome guests at the restaurant entrance
(but not always), ask how many in their party
and show them to a table.
Ask their room number.
Ask if they would like tea or coffee and toast.
Draw attention to the buffet and menu.
Ask if they would like to place an order for
cooked items. Leave and return if guest
wishes to browse the menu
Clear dirty items from occupied tables and
check satisfaction
Table 6: Basic observed service procedure
A report of expected numbers for breakfast was provided. The house count was reported as
follows: Tuesday 107 with 94 having breakfast included in the rate; Wednesday, 116 with 105
inclusive of breakfast; Friday, 73 with 49 inclusive.
The observer was able to record the arrival and departure time of many, but not all, guests
entering the restaurant. At the busiest times it is not possible for one observer to keep an eye
on all arrivals, departures and tables. This task is made more difficult as often a guest is
joined by a colleague part way through their breakfast. He also attempted to note, as many
times as possible, the time that hot food was ordered and then delivered to each table. Over
the three days observations were made of the arrival and dwell duration times of 113 tables,
and the hot food order and delivery time of 61 tables. It should be noted that results were
mainly recorded by table, on occasions when a guest joined a table that was already occupied

293
times were recorded individually. Some guests ordered hot food as they were being seated,
the rest of the time servers returned to the table after a few minutes to take the food order.
No queuing was observed, apart from the occasional brief wait to be seated. The restaurant
was nearly full at the peak time on Tuesday, however, there were a number of empty dirty
tables. From the observers viewpoint staff were slow to clear and reset tables on Tuesday, at
07.14am 21 dirty settings were counted. The numbers in the restaurant started to increase
shortly after 7.30am and began to decline around 8.45am. The breakfast supervisor
commented that she placed a particular emphasis on clearing and resetting tables, staff were
not observed to be idle, it is thus assumed that they were engaged on other tasks.
On Wednesday more guests had breakfast included in the rate and the observer was expecting
to be asked to vacate the table, however, at the busiest time there were less than 40 guests in
the restaurant. Instead of there being a peak arrival time the arrival time of guests was more
evenly spread throughout the service period. It was also noticed that staff were able to
quickly clear and reset tables. This finding emphasises that it is not just the number of guests
or their dwell time that affects how full the restaurant is, it is also the spread of arrival times.
Tue (35 obs) Wed (47 obs) Fri (31 obs) All (113 obs) All (61 obs)
Dwell
Duration
Dwell
Duration
Dwell
Duration
Dwell
Duration
Order to
delivery
Average 00:27:09 00:22:59 00:31:18 00:26:33 00:09:19
Median 00:25:05 00:23:05 00:33:05 00:24:30 00:08:55
Standard
Deviation 00:12:22 00:07:41 00:11:53 00:10:58 00:03:28

294
coefficient
of
variation 45.55% 33.46% 37.97% 41.29% 37.22%
Minimum 00:07:00 00:07:00 00:12:50 00:07:00 00:02:20
Maximum 01:04:00 00:48:00 01:02:50 01:04:00 00:19:00
Range 00:57:00 00:41:00 00:50:00 00:57:00 00:16:40
Table 7: Summary breakfast observation statistics.
Figure 10: Chart showing frequency of dwell duration.
Table 7 shows the summary statistics for dwell times and the elapsed time between food
ordering and delivery. The average dwell time over the three days was 26:33 minutes,
however the median figure was a little less indicating that a few tables with a long dwell time
have skewed the data, the frequency chart (figure 10) illustrates this. Guests seemed to spend
0
5
10
15
20
25
30

295
longer at their tables on Friday. Customers are in control of their arrival and dwell times for
breakfast, the main limitation is that, if they want hot food, then they need to wait for it to be
cooked and delivered. Guests were observed chatting to others on their table, reading or
staring out of the window. It was not uncommon for a guest to be joined by a colleague part
way through their breakfast.
If it is assumed that the dwell data conform roughly to a normal distribution then it can be
assumed that on 66% of occasions the actual times falls within one standard deviation above
or below the average (mean) time. The coefficient of variation is the standard deviation
expressed as a percentage of the mean, the greater this figure is the greater the amount of time
variability in the data. Table 7 and figure 10 indicate that there is significant variation in the
dwell time of customers.
frequency
00:05:00 5
00:06:00 2
00:07:00 7
00:08:00 8
00:09:00 9
00:10:00 10
00:11:00 5
00:12:00 5
00:13:00 1
00:14:00 2
00:15:00 4
00:16:00 0
00:17:00 0
00:18:00 2
00:19:00 1
00:20:00 0
00:21:00 0

296
Table 8: Frequency of hot food order to delivery times.
Table 8 shows the frequency of order to delivery times observed. Most food orders took more
than 6 minutes but less than 12 to prepare and deliver. The average order to delivery time was
9:19 with a median time of 8:55 indicating a slight skew towards shorter delivery times. In
the final report data from this hotel will be compared with data from other hotels, at that point
it may be possible to conclude whether waiter service of hot food adds to the average dwell
time. As noted earlier, however, it is not just how long guests occupy the tables that matters,
it is the pattern of arrival. Guests decide this for themselves and, as noted above, on
occasions their arrival times may be spread, at other times they may be bunched together.
While average dwell times and variance can be measured arrival times are unpredictable.
The XXXX Hotel has 115 bedrooms and the restaurant has 67 covers. If all rooms were
occupied by two guests and all had breakfast then 230 breakfasts would be demanded. If 80%
of rooms were occupied by only one guest then 138 breakfasts would be demanded. It has
been noted that frequently guests stay in the same hotel as a colleague, thus even though the
room may have single occupancy a table may be shared at breakfast. On occasions it was
observed that four, six or even more guests appeared to know each other and ate together at
breakfast. This also impacts on the demand for tables.
Observed sources of time variation that can be attributed to the organisation were as follows:
Mise-en-place preparation
Time from arrival to food order

297
Time from food order to delivery
Time resetting tables / availability of set tables
Observed sources of time variation that can be attributed to the customer were as follows:
Arrival time
Volume consumed
Time to order food
Chatting to colleagues
No glasses, waitress reads menu to customer
Dwell time
The restaurant supervisor (XXXX), who has worked breakfast in the hotel for 10 years,
revealed that there is also a dining room on the floor above and that, on occasions, breakfast
service is extended over the two floors. For practical reasons this restaurant is provided with
a hot and cold self-service buffet. In response to the question as to why there was not hot
buffet in the observed restaurant she replied that there is insufficient space. XXX, was also
interviewed, she is a hospitality graduate and has been working in this hotel for about five
months. XXX suggested that, in her experience, service can be speeded up if guests are
allowed to serve themselves from a buffet. XXXX mentioned that, on occasions she had
politely encouraged guests to leave tables, explaining that they were needed for waiting
guests.
Capacity can be viewed as consisting of space and time (Slack, 2010). If the amount of time
spent with customers is shortened more customers can be served with the staff available
(Schmenner, 2004; Anupinidi, 2012). Sufficient physical capacity (space) needs to be
provided for customers to consume at a pace that suits them. The main limitation for the
298
XXXX is that, on occasions of high demand, the restaurant may not be of sufficient size to
absorb the physical demand. It is beyond the scope of this project to suggest solutions,
however theory is presented in the report that may be used to generate and evaluate solutions.
Appendix: Front Desk
XXXX Hotel Reception Notes
The XXXX Hotel has 115 bedrooms and is located in the centre of Birmingham. Two
periods of observation were undertaken from a chair in the lobby and one from behind the
front desk. The time of arrival to check-in and the duration of check-in were recorded. Notes
were made of other observed reasons for guests to approach the desk. The front desk was
observed from 15:50 to 19:10 on Tuesday, 15:40 to 19:30 on Wednesday and from 15:50 to
19:30 on Thursday.
A total of 68 check-ins were observed and timed, the summary statistics are shown in table 9.
Apart from two check-ins all arrival times and durations of check-ins were recorded.

299
Queue Service Interarrival
Average 00:01:13 00:03:08 00:07:24
Median 00:00:00 00:02:40 00:03:30
Standard
Deviation 00:02:39 00:02:45 00:10:23
coefficient
of variation 218.11% 87.31% 140.53%
Minimum 00:00:00 00:00:15
Maximum 00:11:30 00:18:50
Range 00:11:30 00:18:35
Table 9: Key summary statistics from check-in observations.
The average check-in time was a little over three minutes with a median figure of 2:40
minutes. This suggests that there were a lot of shorter check-in times and a few very long
check-in times, the frequency table (table 10) illustrates this. Note one check-in of 14 minutes
and one of nearly 19 minutes were recorded but excluded from the frequency data. The 14
minute check-in was due to a misunderstanding between the customer and the hotel over the
status of the booking and involved a search for the booking and time re-booking the guest.
The 19 minute check-in was because timing started when the customer reported to the desk,
but then requested help with luggage from the taxi rank. In addition this was a reservation for
three rooms for 14 nights.
Service
Duration
half mins
Service
Duration
Frequency Cumulative
%
00:00:30 3 4.55%
00:01:00 1 6.06%
00:01:30 5 13.64%
00:02:00 8 25.76%
00:02:30 8 37.88%
00:03:00 21 69.70%
00:03:30 9 83.33%
00:04:00 2 86.36%

300
00:04:30 4 92.42%
00:05:00 2 95.45%
00:05:30 0 95.45%
00:06:00 0 95.45%
00:06:30 0 95.45%
00:07:00 3 100.00%
Table 10: Check-in duration grouped by frequency.
There was some queuing for check-in, this is because the inter-arrival pattern was
characterised by a lot of short inter-arrival times (table 11) and, on occasions, only one
member of staff was available. Random events are characterised by having a lot of short
inter-arrival times for events and fewer events further apart, generally they conform to an
exponential distribution, this is illustrated in table 11. If queuing is to be avoided in systems
where guests arrive at a time of their own choosing (randomly) then capacity must be
provided to absorb the variation. This can be either in the form of spare physical capacity
(such as staff or equipment), or flexible physical capacity (such as cross-trained staff or dual
use equipment).
Inter-
arrival
times
Inter-
arrival
time
frequency
00:01:00 25
00:02:00 5
00:03:00 1
00:04:00 7
00:05:00 2
00:06:00 4
00:07:00 3
00:08:00 2
00:09:00 0
00:10:00 0
00:11:00 3

301
00:12:00 0
00:13:00 0
00:14:00 3
00:15:00 0
00:16:00 0
00:17:00 1
00:18:00 0
00:19:00 1
00:20:00 1
Table 11: Inter-arrival frequency of most arrivals.
It was noted that there are three counters at the front desk but only two are equipped. There
were generally two staff on duty but many occasions when one was unavailable to check-in
customers. The manager was observed to help if he happened to be close to the desk when
there was demand for service, no other staff were observed helping. The statistics record one
customer having to wait over 11 minutes to check-in, however, it should be noted that they
were part of a group of several guests who arrived simultaneously.
The front desk was observed for nearly 11 hours, the total duration of the check-ins was just
over 3:30, and some of those were simultaneous. At no time were front desk staff observed to
be idle, therefore, more of their time is spent doing tasks that do not involve checking-in
customers.
Reasons for check-in queue and time variation rooted in the organisation
Query disagreement between customer reservation and details on the system
Staff away from desk on other tasks, requiring other guests to wait
Staff engaged with enquiries of customers already checked-in

302
Taking debit or credit card swipe
Amount of information about hotels services given
Reasons for check-in queue and time variation rooted in the organisation
Guests arriving in bunches (perhaps this is due to proximity to the railway station?)
Queries from guests for clarification on payment methods
Queries from guests about room type and location
Query disagreement between customer reservation and details on the system
Retrieving payment card or paperwork
Questions about hotel services
Variety of requests and tasks observed
Check-in
Routing in-coming telephone calls (reservations has a different line)
Storing and retrieving left luggage
Reprogramming room key cards
Updating some details after check-in
Checking meeting room postings
Maintenance issue reported
Chasing up on reported maintenance issue
Giving directions to meeting rooms
Booking a taxi
Directions to shops and other hotels
Restaurant recommendations and directions
Validate car parking tickets
Answering queries about parking
Helping with luggage
Moving guest to a new room because of unresolved maintenance issue
Drinks orders for the foyer lounge
Printing reports
Trying to contact housekeeping
Taking payment for foyer lounge drinks
Taking payment for late check-out

303
Putting cash in the safe
Filling in forms for petty cash expenditure
Looking for an iron and tooth brushes
Going out to buy tooth brushes
Staff training
Check-in procedure
Micros Opera system is used in this hotel.
Observed
Eye contact, greet, ask how can help if customer does not give a purpose
Ask name if not given
Confirm details of room type, length of stay, what is included in the rate and the
payment arrangements
If address details are missing ask for the post code and house number
Ask if would like to provide an email address
If customer is to pay some or all of the account ask for a credit card to pre-authorise
payment or a debit card for pre-payment. Advise of handling fee if using credit card.
Give registration card and key card for signature
Cut key and tear off key card section of reg. card
Ask if would like newspaper or wake-up call, ask if want to make dinner reservation
Ask if stayed before;
o if yes skip to next line, if no, explain bar and restaurant locations and breakfast
times, how to use key in room, then,
o (welcome back) wish a pleasant stay, give key and key card and direct to room,
offer help with luggage.

304
Appendix: Interviews
Interviews XXXX
All interviewees were asked the three questions below:
1. Can you think of things that you do that speed service or reduce waiting time for
customers
2. Can you think of anything that slows down service, causes delays or queues?
3. Can you suggest any changes to service or the service area that may speed up service?
Reception Supervisor
Can you think of things that you do that speed service or reduce waiting time for
customers
We pre-register groups. We cut the chit chat. In theory a duty manager should be available to
help out. In practice this is not always the case.
Can you think of anything that slows down service, causes delays or queues?
If guest has booked online but Head Office has not put the reservation on the system
305
Sometimes at weekends web sites are left open to sell when the hotel is full, resulting in
overbooking and having to book out.
Sometimes there are computer failures
Actually check-outs can take longer than check-ins because some guests question items on the
bill. We are looking at ways that the night team can speed check-out, putting bills under the
bedroom door, for example.
Can you suggest any changes to service or the service area that may speed up service?
Computer screens are too low, do a lot of typing, being able to sit would be good
Insufficient staff, but not in terms of numbers it is when they can be scheduled to work – need
more at morning check-out not mid-morning after check-out.
The duty manager is not always available to help
Regular guests are quicker to check-in as have all the details on the system.
306
Breakfast supervisor
Can you think of things that you do that speed service or reduce waiting time for
customers?
Have additional dining room upstairs that can be used when busy, is equipped with hot and
cold buffet.
Sometimes politely try to move guests off tables if customers are waiting
Can you think of anything that slows down service, causes delays or queues?
Sometimes when it is busy we could do with two breakfast chefs, sometimes I pop behind to
help out
If tables are not cleared and reset quickly enough
Can you suggest any changes to service or the service area that may speed up service?
Perhaps a bigger dining space, if we could seat 100 that would be nice.

307
Breakfast servers (1)
Only one server, Yang, was available, she has worked in the post for about five months but is
a hospitality graduate.
Can you think of things that you do that speed service or reduce waiting time for
customers
Allocate different sections and different responsibilities when busy
Easier to do hot food as a buffet, in Ireland we served 30-50 guests with one member of staff
Can you think of anything that slows down service, causes delays or queuing?
Sometimes not enough chefs
Can you suggest any changes to service or the service area that may speed up service?
The layout of the building is difficult to change, the restaurant size is limited

308
In China most hotels have wireless ordering instead of paper, this speeds things up.
Staff need to prepare more things from storage, for example, de-caff coffee.
Appendix : Reception observation
XXXX Front Desk Observations
On Thursday March 29th
the observer moved behind the front desk and recorded the following
observations. A= XXXX, J = XXXX, GM = XXXX
Thursday March 29th
Time Notes
15:50 GM and engineers attempting to sort problem with fire alarm system
15:50 Trying to send fax for customer but line seems permanently engaged
15:57 Request for room change, room smells of paint.
J. doing admin, stapling paper to plastic envelopes
15:59 Guest arrives for check-in, 3 rooms for 14 nights.
A requests payment upfront or credit card to authorise full payment
Guest goes away to look for rest of party
A & J discussing why the safe cash did not balance
A answers phone
16:07 Customer asks if envelope waiting for them. A can’t find anything, makes a
phone call and sorts

309
16:08 Key to meeting room not working
16:08 Phone ringing, no one available to answer it
16:14 Query about parking costs
Earlier check-in guest and family return
J goes to help with luggage
16:18 check-in complete
16:18 Request to validate parking ticket
16:20 Customer reports glass on floor of courtyard, A phones someone to get it cleared
up.
16:20 Check-in, A answers phone while checking-in customer
16:22 A takes call, forwards it
Putting in address details for family just checked-in
16:30 A makes reservation for staff member, prints and files a copy, explains system to
me
16:39 A checking postings to a meeting room
16:39 Incoming call
16:41 Internal call, goes to check something then comes back to phone
16:43 Incoming call, forwards it
16:44 Incoming call, forwards it
16:46 Internal call, requested cot not in room, A call various extensions to find
someone who can put cot in room
16:50 Check-in – system not working, A suggest customer goes to bar while it is
sorted
A makes call to find out why system down (being worked on)
A makes call to bar to ensure comp drink
16:57 Internal call to say system back up
16:57 Internal call, maintenance, problem with telephone
16:50 Enquiry as to where to get a drink
16:59 Internal call for A to check if system working, it isn’t – it is.
17:01 Incoming call to transfer
17:01 Internal call for A
17:05 Incoming call to transfer
17:07 Internal call
Printing emergency reports, A says that this has to be done every few hours in
case of emergency or system crash.
17:10 More incoming calls to transfer
17:13 Internal call
17:13 Room key not working

310
17:15 A checking key cutter, J says it isn’t working
17:17 Check-in, takes incoming call and forwards it while checking-in
17:18 Room key not working
17:21 Person asks permission to display brochures in brochure rack
17:27 Internal call about using internet
17:29 Internal call for A
17:30 Internal call
17:32 Internal call
A explains petty cash procedure.
Also chat – when busy feel under pressure, used to be three staff plus concierge,
but sometimes was too many. Now only two staff and two terminals so too
much to do and answer phones. Commented earlier that phone system is due to
change so that more departments can be called directly.
17:38 Incoming call for directions to car park
17:39 Check-in. Not eating 6.00am to 6.00pm so any chance of a few pastries at
5.30am? A indicates that it should be possible, will let customer know
17:42 Internal call
17:44 A calls to try and sort food alternative for customer
17:48 Restaurant staff come for dining reservations book, A goes through it
17:52 Internal call
17:52 GM sorting something in diary
17:53 Check-in. Asks if swimming pool? Additional price for a double? Breakfast
included? How much extra? Asks for toothbrush, A says will arrange. Later
sends J to search for tooth brushes and iron – has trouble locating them – note
that 30 mins later guest rings down to chase up
A goes to back office to cut key as key cutter on terminal not working
17:59 GM discussing with A about which rooms to mark as unavailable because of
decorating, need to change on system
18:01 Check-in
18:09 Customer here last night, some power issues in room – has been allocated a new
room but luggage not moved. GM sends J to help customer move.
A been doing staff rota, staffing based on expected number of guests
A gives J some training on Opera system
18:31 Internal call
18:31 Incoming call
18:34 Late check-out – actually hotel company IT man, comes behind desk and
immediately notes that power cable to key cutter is disconnected, plugs in – key
cutter fixed.
All quiet Ask A questions until 7.00pm

311
APPENDIX 5: BREAKFAST DATA COLLECTION SHEET EXAMPLE
Breakfast Observation Log Sheet
Date: Location: XXXX Hotel
Table Arrive Order Deliv Depart Notes

312
APPENDIX 6: FRONT DESK DATA COLLECTION SHEET EXAMPLE
Front Office Observation Log sheet: Follow customer
Date: Location: XXXX
Queue Serve Depart Notes