an exploratory analysis of children’s daily time-use … · an exploratory analysis of...
TRANSCRIPT

An Exploratory Analysis of Children’s Daily Time-Use and Activity Patterns Using the Child Development Supplement (CDS) to the US Panel Study of Income Dynamics (PSID)
Rachel B. Copperman The University of Texas at Austin
Dept of Civil, Architectural & Environmental Engineering 1 University Station C1761, Austin TX 78712-0278
Phone: 512-471-4535, Fax: 512-475-8744 E-mail: [email protected]
and
Chandra R. Bhat *
The University of Texas at Austin Dept of Civil, Architectural & Environmental Engineering
1 University Station C1761, Austin TX 78712-0278 Phone: 512-471-4535, Fax: 512-475-8744
E-mail: [email protected]
* Corresponding author

ABSTRACT
This research paper examines the weekday and weekend activity participation characteristics of
school-going children. Specifically, the research focuses on the overall time-use of children in
different types of activities, as well as on several dimensions characterizing the context of
activity participations. These include the temporal (time-of-day and participation duration),
spatial (location), with-whom (i.e., accompanying individuals), and episode sequencing
dimensions. The data for our analysis is drawn from the 2002 Child Development Supplement to
the Panel Study of Income Dynamics.

Copperman and Bhat 1
1. INTRODUCTION
1.1 Background and Research Objective of Study
The focus of analysis in existing activity-based research has almost exclusively been on the
activity-travel patterns of adults (16-18 years of age and older; for instance, see Bhat and
Srinivasan, 2005; Koppelman and Gliebe, 2002; Bhat and Misra, 2002). One reason for this
emphasis on adults’ activity-travel patterns is ostensibly that most children do not have the
choice of driving on their own, and therefore do not “add” cars directly onto the transportation
network. However, by the same token, children depend, to a large extent, on household adults or
other adults to drive them to activity events. Such serve-passenger activities constrain adults’
activity-travel patterns in important ways. For instance, a parent driving a child to school during
the morning peak is unlikely to shift away from the morning peak because of a congestion
pricing strategy, even if the parent has a flexible work schedule. Similarly, in the case of a parent
dropping a child off at soccer practice, it is not the parent’s activity but the child’s activity, and
its location, that determines the temporal and spatial dimensions of the trip (see Kitamura,
1983).1 Further, the dimension of “who” is responsible for serving the trip for the child’s activity
determines which adult’s activity-travel pattern is impacted (see Goulias and Kim, 2005 for a
recent study emphasizing the with whom and for whom characteristics of activity participation).
Of course, in addition to serve-passenger activities, children can also impact adults’ activity-
travel patterns in the form of joint activity participation in such activities as shopping, going to
the park, walking together, and other social-recreational activities.
The intricate interactions and effects of children’s activity-travel patterns on adults’
activity-travel patterns can be captured in limited ways by the commonly used approach of
including “exogenous” variables representing the number, presence, and age distribution of
children. However, such a limited approach is not as behaviorally interesting or appropriate as
considering the activity-travel patterns of children, and explicitly inter-linking these with those
of adults’ activity-travel patterns (see Goulias and Kim, 2005). In addition, the consideration of
children’s activity-travel patterns is important in its own right. Specifically, children’s activity-
travel patterns contribute directly to travel by non-drive alone modes of transportation. Also, 1 One could argue that parents are the “true” decision-makers for the activity participations of children and, therefore, there is no need to directly consider the activity-travel needs and characteristics of children. While this argument may hold for very young children (say, less than 7 years), older children start developing their own independent activity desires (see Stefan and Hunt, 2006). In the latter case, it is the child’s activity-travel needs and patterns that expressly impact the activity-travel patterns of adults.

Copperman and Bhat 2
understanding the overall time-use patterns of children, and the context of their non-motorized
travel and physical activity participations, is important for promoting the health of children. This
is an issue that is gaining increasing attention at the interface of the transportation and public
health fields, because of the positive correlation between physically active lifestyles and the
development of strong, healthy, and intelligent children (CDC, 2006; Transportation Research
Board and Institute of Medicine, 2005).
In summary, there are several compelling reasons to examine and analyze children’s activity-
travel patterns. This motivates the objective of this research, which is to descriptively examine
the weekday and weekend activity participation characteristics of school-going children. In
doing so, we focus on the overall time-use of children in different types of activities, as well as
on several dimensions characterizing the context of activity participations. These include the
temporal (time-of-day and participation duration), spatial (location), with-whom (i.e.,
accompanying individuals), and episode sequencing dimensions.
1.2 Overview of Earlier Research Relevant to the Current Study
The earlier research efforts in the area of children’s time-use and activity-travel patterns may be
classified into two broad areas: (1) Time-use studies that provide aggregate daily or weekly
time-use statistics, with limited to no examination of the context of activity participations, and
(2) Studies that model the factors affecting children’s participation in specific activity episodes,
such as physical activity participation and hours of television viewing. We briefly discuss the
literature within each of these categories in turn in the subsequent two paragraphs.
The time-use studies have been primarily undertaken in the sociology, developmental
psychology, economics, and education fields. These studies examine children’s time-use in one
or more countries (Hofferth and Sandberg, 2001a, and Zill et al., 1995; see Larson and Verma,
1999 for a review) or study changes in time-use over time (see Hofferth and Sandberg, 2001b).
Many of these studies also examine time spent with family and friends, with an emphasis on time
spent with parents (Larson and Verma, 1999; Hofferth and Sandberg, 2001a). The latter
emphasis is a result of the desire to examine the effects of parental involvement on children’s
cognitive and social-emotional development, especially in the context of changing family
structure and maternal employment patterns (Bryant and Zick, 1996a; Asmussen and Larson,
1991; Sandberg and Hofferth, 2001). Some of the time-use studies also examine the after-school

Copperman and Bhat 3
activities of children, with the intention of assessing the need for, and benefits of, after-school
programs (see Shann, 2001; Posner and Vandell, 1999; Posner and Vandell, 1994; and Hofferth
and Jankuniene, 2001). Overall, the broad time-use studies have provided a rich basis for
understanding the social-psychological aspects of children’s development. However, they either
do not focus, or focus in only very limited ways, on the temporal, spatial, “with-whom”, and
episode sequencing contexts of children’s activity-travel participation.
A second broad area of children’s activity studies has examined the factors affecting
participation in such specific activities as physically active pursuits or sedentary activities (for
example, watching television). Many of these studies are motivated by the growing child obesity
problem in the United States (CDC, 2005), and the well established epidemiological link
between physical activity and obesity reduction/other health benefits. Studies focusing on the
correlates of physically active and inactive lifestyles in children include Zakarian et al. (1994),
Aaron et al. (2002), Sallis et al. (1999, 2000), Janz et al. (1999), Copperman and Bhat (2006),
and Gordon-Larsen et al. (2000). Some related studies have sought to identify relationships
between the time spent in physical activity and time spent in sedentary activities (see Feldman et
al., 2003) or a relationship between the time spent in both activities to unhealthy attributes in
children (see Anderson et al., 1998; Robinson et al., 1993; Durant et al., 1994). Another recent
study assessed how television viewing affects time spent in other free time activities and with
family members (Vandewater et al., 2006).
1.3 The Current Study and the Paper Structure
The current study is close to the spirit of the first category of time-use studies of the previous
section in that it examines time-use in all of the children’s activities, and not just in specific
physically active or physically inactive activity categories. However, our underlying objective of
contributing toward activity-based travel analysis requires a much more detailed analysis of the
context of activity participation than is examined in the traditional time use studies. In this regard,
our study is similar to the recent research work of Stefan and Hunt (2006), who examined
activity-travel patterns of Canadian children. But we focus on US children, adopt a more
disaggregate taxonomy of activity purposes, examine the “with whom” dimension of activity
participation, analyze the location of out-of-home activities, and explore episode sequencing
characteristics. Also, in contrast to some other studies that have focused on the travel patterns of

Copperman and Bhat 4
US children (see McDonald, 2006; Clifton, 2003), the current study adopts activity episodes as
the unit of analysis and considers the comprehensive context of activity episode participation.
We envision our exploratory analysis as an important first step toward informing the
development of joint activity-based travel models for children and adults.
The data for our analysis is drawn from the 2002 Child Development Supplement (CDS)
to the Panel Study of Income Dynamics. The CDS provides a rich base to examine the many
dimensions of activity participation. Specifically, the survey collects information on all aspects
of both in-home and out-of-home activity participation of a sample of children for one weekday
and one weekend day. The survey explicitly obtains information on all persons (both household
and non-household members) accompanying the respondent for each activity episode. The
survey also uses a disaggregate activity classification scheme and employs an extensive location
typology to capture the spatial dimension of activity episode participation. The time-use and
activity patterns of school-going children aged 5-18 years are considered in the analysis.
The rest of this paper is structured as follows. The next section describes the data source
and sample formation procedure. Section 3 presents aggregate characteristics of children’s time-
use by activity purpose and by activity location. Section 4 examines the location and with whom
dimensions of children’s participation in activity episodes. Section 5 examines the sequencing of
children’s activity episodes. Finally, Section 6 summarizes the important findings from the
research.
2. DATA SOURCE AND SAMPLE FORMATION
2.1 Data Source
The data source for this analysis is the 2002 Child Development Supplement (CDS) to the Panel
Study of Income Dynamics (PSID). The PSID is a longitudinal study that collected demographic,
employment and health information from a nationally representative sample of individuals and
households. The CDS surveyed over 2,500 children through health and achievement test surveys,
primary caregiver and child interviews, and a two-day time-use diary - one for a weekday and
the other for a weekend day. The time-use diary collected information on the type, number,
duration, and location of activities for each 24-hour survey day beginning at midnight. The diary
also collected information on who was present, and participating, and who was present, but not
participating, in each activity. Paper diaries were mailed to children, filled out on or around the

Copperman and Bhat 5
activity day, and then retrieved and reviewed by an interviewer either by phone or in person.
Older children and adolescents were expected to fill out their own diary, while primary
caregivers aided younger children.
2.2 Sample Formation
The process of generating the sample for analysis involved several steps. First, only individuals
aged five through eighteen who were enrolled in primary or secondary school were considered
for the analysis. Also, only children who filled out time diaries on both the weekday and
weekend day were included. Based on these criteria, a total of 1970 children were selected for
analysis. Second, activity types were reclassified from the 365 original purposes into 11 activity
types: (1) Work (for pay), (2) Household Chores (including non-paid child care), (3) Meals
(including snacks), (4) Organized Activities (i.e. lessons, meetings, and clubs), (5) Studying
(including non-school classes and homework), (6) Recreation (i.e. unorganized hobbies and
sports, outings, reading, playing, TV viewing, and music), (7) Social (including conversations,
being intimate, parties, visiting, and religious services), (8) Personal Business (i.e. shopping,
obtaining services, paying bills, writing e-mails or letters), (9) Personal Care, (10) Receiving
Child Care (i.e. daycare, being babysat), and (11) School.2 Additionally, because of the rather
diverse nature of the organized activities, recreation, and personal business purpose categories,
these were further classified into several finer categories for exploration. Third, activity episode
locations were collapsed into eleven location types: (1) Home, (2) Parent’s work place, (3)
Child’s work place, (4) Someone else’s home (including other parents’ home), (5) restaurant, (6)
Outdoor recreational area, (7) School, (8) Church, (9) Store/retail business, (10) Non-retail
business (including indoor recreational facilities and daycare), (11) Other. Fourth, activity
episodes were assigned to specific time periods in the day based on the start-time of the activity,
and then episodes of the same type within a time period were aggregated. For school-going
children on a weekday, the school activity is used as a “peg”, and the day is divided into two
time periods - before-school (3 a.m. to school start time) and after-school (school end time to
2 The focus in the current paper is only on non-sleep episodes. Also, because of the activity-based emphasis of the current paper, we do not expressly focus on travel episodes. Rather, the characteristics of travel episodes are indirectly considered through the context of activity participation.

Copperman and Bhat 6
midnight).3 For weekend days, the day is divided into five time periods (3 a.m. to 8 a.m., 8 a.m.
to noon, noon to 4 p.m., 4 p.m. to 8 p.m., and 8 p.m. to midnight). Activity episodes beginning
between midnight and 3 a.m. are excluded from the analysis to avoid inclusion of activities that
are a continuation of the previous day’s scheduling. Fifth, “with whom” participation categories
were created for each activity episode, based on the presence of other individuals who were
around and/or participated in each episode. The “with whom” information was grouped into ten
mutually exclusive and collectively exhaustive categories: (1) No one else (or alone), (2) Only
with Mother, (3) Only with Father, (4) Only with sibling(s), (5) Immediate family combinations
(more than one of father, mother, and siblings), (6) Only with extended family, (7) All other
family combinations (immediate and extended family combinations), (8) Only with child’s friend,
(9) Only with other non-relative, (10) Other combinations. Finally, out-of-home activity
episodes (or stops) and tours (home-to-home sojourns) were identified by re-organizing the
activity episodes based on location of performance (in-home or out-of-home), followed by the
tracing of the sequence of out-of-home and in-home episodes.
3. AGGREGATE TIME-USE CHARACTERISTICS
This section provides a broad overview of children’s time-use by presenting participation rates
and duration of time spent in (1) different types of activities across all children and by age
groupings (Section 3.1), (2) different activity types by time period of the day, and different
location types by time period of the day (Section 3.2), (3) different types of finer activity
categories within the broad activity purposes of organized activities, recreation, and personal
business (Section 3.3).4
3.1 Participation and Time Spent in Activity Purposes by Age
Table 1 presents participation percentages and average duration of participation by activity
purpose for the weekday and weekend day, respectively (the weekend numbers are in
parenthesis). In these tables, an entry of ‘–’ in any cell implies that the participation rate in the
corresponding activity purpose is less than 0.5%. Also, the average duration of participation in
3 The school activity is used as the basis for defining time periods on weekdays for school-going children because other non-school activities tend to be scheduled around the school activity (see Frusti et al., 2003). 4 The terms “activity purposes” and “activity types” will be used synonymously in this paper.

Copperman and Bhat 7
each activity purpose is computed as the mean of the total duration of participation across all
episodes of that purpose, across children who participate in the activity purpose.
The second column of the table, labeled “Total”, presents statistics for the entire sample
of children. This column indicates that, as expected, a high fraction of children participate in
school activity on weekdays (the average duration is about 6.5 hours), while almost no child
participates in school activity on weekends (see the first row corresponding to “school” in Tables
1). Also, almost every child eats, recreates, and pursues personal care activities each day (the
reason for the meal percentage being less than 100% may be attributed to meals not being
considered as the primary activity) 5 . In addition, except for the three purposes of school,
studying, and receiving child care, children participate at least as much (and generally much
more) in each of the other activity purposes over the weekend days than the weekdays. The
difference is particularly noticeable for the recreation, social, and personal business (including
shopping) purposes. For the recreation purpose, the participation rates are not very different
between weekdays and weekend days, though the average duration of participation among
children who recreate is about 3.5 hours on weekdays and 6.5 hours on weekend days. For the
social and personal business purposes, there is a substantial increase in both the participation
rates and mean durations over the weekend days (see Larson and Verma, 1999 and Hofferth and
Sandberg, 2001a for similar results).
The rest of the columns in Table 1 provide the participation rates and mean durations by
age group. The row corresponding to the “work” purpose shows that the work participation rate
is substantive only for adolescents (15 to 18 year olds). These adolescents work, on average, for
about 4.5 hours on a weekday and 6 hours on a weekend day. Finally, as children get older, the
participation rates and mean durations in organized activities, social activities, and personal
business increase, while the participation rate and duration of time spent receiving child care
decreases. This is consistent with the increased professional, social, and shopping activities
among adolescents compared to younger children (see Hofferth and Sandberg, 2001a and Bhat
and Lockwood, 2004).
5 For example, if a child eats breakfast while watching television, television may be recorded as the primary activity while eating is recorded as the secondary activity.

Copperman and Bhat 8
3.2 Participation Rates and Duration by Time-of-Day for Each Activity Purpose and Each
Activity Location
The previous section examined overall time-use patterns in different activity purposes, as well as
the variation in these patterns by age. In this section, we introduce time-of-day of participation in
different activity purposes, as well as consider the joint time-of-day and location contexts of
participation.
Table 2a provides the participation rates and mean duration by time-of-day for each non-
school activity purpose for weekdays (see footnote under Tables 2a and 2b for a precise
explanation of how the mean duration value is computed). This table is confined to the vast
fraction of children who go to school on the weekday (all subsequent analyses on weekdays is
also based only on school-going children). Table 2a indicates, not surprisingly, that children
participate in all activities except personal care at a higher rate and for a longer duration during
the after-school period than the before-school period. This is similar to the higher rate of activity
participation in the post-work period for adult workers (see Bhat and Singh, 2000), and is a result
of more time availability and the absence of a rigidly constrained activity in the post-school
period. Most of the participations in the before-school period are for meals and personal care.
Table 2b provides the time-use patterns by time-of-day for each activity purpose for
weekend days. Similar to the before-school period on weekdays, very few children participate in
activities during the early morning hours (see the column labeled “3 a.m. to 8 a.m.” in Table 2b).
The overall levels and intensity of activity participation are also on the low side during the late
evening period (8 p.m. to midnight), like in the early morning period. The dominant activities
during this late evening period are leisure type activities (meals, recreation, social, and personal
care activities). The daytime weekend time periods (8 a.m. to noon, noon to 4 p.m., and 4 p.m. to
8 p.m.) constitute the most intense activity periods, and have very similar participation
percentages in most activity purposes. The most common activity type of participation during
these periods is recreational activity, with 67%-80% of children participating in recreation for
about 2-2 ½ hours.
Tables 3a and 3b are similar to Tables 2a and 2b, respectively, except that the
classification is by activity location rather than activity purpose. Home is, by far, the most
common location for activity participation on both weekdays and weekend days, especially on

Copperman and Bhat 9
weekdays.6 The other common location for both before-school and after-school activities on
weekdays is school, presumably reflecting the prevalence of day-care arrangements available at
most schools and after-school clubs/ meetings. Interestingly, another very common location for
activity participation during the after-school period on weekdays, and on weekend days, is
someone else’s home, highlighting the importance of friends and extended family in determining
children’s daily activities and activity locations. However, during the mid-morning period (8
a.m.-noon) on weekend days, church is the most frequented location outside of home, with a
mean activity duration of 2 ½ hours. Similarly, “store/retail business” is a relatively frequent
activity location in the early afternoon period (noon-4 p.m.) of weekend days, indicating the
prevalence of out-of-home personal business (including shopping) activity during this period.
Non-retail businesses, outdoor recreational areas, and restaurants are also popular activity
locations during this early afternoon period on weekend days.
3.2 Participation Rates and Durations in Disaggregate Activity Purposes
The organized activity, recreation, and personal business purposes comprise a rather diverse set
of activity types, with potentially quite different contextual dimensions. In this section, we
examine participation rates, and durations of participation, in each of the disaggregate activity
types that make up the broader activity purposes identified above. Figure 1 presents the results.
For each of the three broad activity purposes, the figure provides the percentage of individuals
participating in the broad activity purpose who participate in each of the finer activity types. For
example, the weekday bar for “sports practice or games” for organized activities shows that
about 60% of children who participated in organized activities took part in “sports practice or
games”. In addition, the number just above the bar indicates that, among the children who
participated in “sports practice or games”, the mean duration of participation is 118 minutes.
As can be observed from the figure, the most common organized activity type
participated in during the weekday is “sports practice or games”, while the corresponding type
during weekend days is “clubs and other meetings”. As one would expect, for both “sports
practice or games” and “clubs and other meetings”, the mean duration among those who
participate in these activities is longer over the weekends than the weekdays.
6 In Table 3b for weekend days, the low participation rate in the home location in the early morning period (28.5%) reflects the low number of children reporting non-sleep activities during this period.
Copperman and Bhat 10
The recreation activity comprises many different kinds of sub-activities (see bottom panel
of figure 1). Not surprisingly, TV or movie watching is the dominant type of recreation activity
on both weekdays and weekend days, with almost 85-90% of recreators undertaking this activity.
The mean durations in this activity is also quite substantial (about 2 hours on weekdays and more
than 3 hours on weekend days). Free play, and video or computer games, also have a relatively
high percentage of participation and mean durations compared to other recreational activities.
Passive and active recreational travel are two of the most infrequently participated recreational
activities. Overall, children participate much more in physically passive recreational activities,
and spend substantial amounts of time in such activities, than in physically active recreational
activities.
In the category of personal business activities (top right figure), shopping represents the
largest percentage of personal business activities on both the weekday and weekend days, though
its share on weekend days is much higher. For all other personal business activity categories, the
participation rate on weekdays is higher. The mean durations, however, is always higher on
weekend days for all personal business activities.
In the rest of this paper, we do not maintain the disaggregate classification of this section,
to limit the scope of the study and maintain focus. However, the diverse nature of the broad
activity types should be recognized in the ensuing discussions.
4. EPISODE-LEVEL ANALYSIS
The previous section provided a descriptive analysis of children’s overall time-use patterns
during the day. In this section, we examine the detailed context of children’s activity episodes.
Specifically, the location of performance, and the type of companionship arrangement, of
episodes are analyzed. The contexts of “where” and “with whom” dimensions of episode
participation are important determinants of travel patterns and the inter-relationships between
activity-travel patterns of different individuals.
4.1 Location of Activity Episode Participations
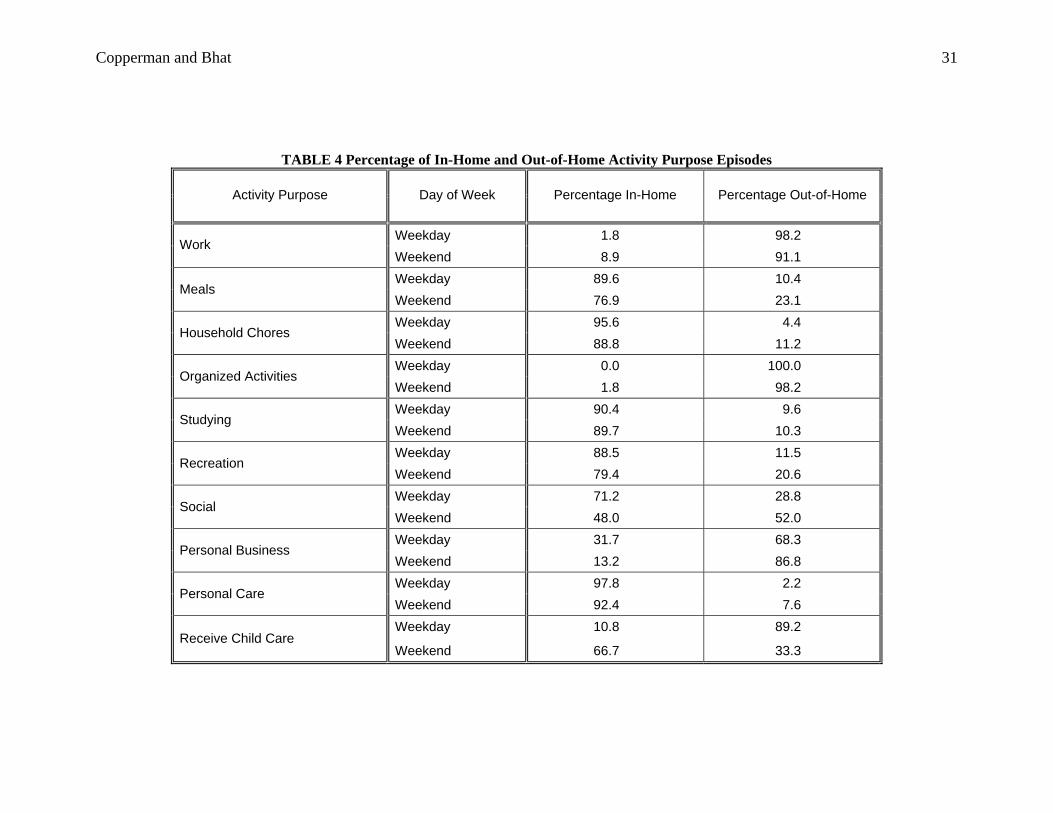
Table 4 provides the percentage of episodes in each non-school activity purpose that is pursued
in-home and out-of-home (the percentages add up to 100% for each row). The results show that
work and organized activity episodes are most likely to be pursued out-of-home on both

Copperman and Bhat 11
weekdays and weekend days, with over 90% of these episodes pursued out-of-home. In contrast,
episodes corresponding to meals, household chores, studying, recreation, and personal care are
primarily pursued in-home, particularly on weekdays. On weekend days, the absence of school-
related activity provides more flexibility to port these activities out-of-home. The predominantly
in-home nature of recreation activities is also consistent with “television or movie viewing” and
“playing video or computer games” being the primary kinds of recreational activities (see
Section 3.3).
There is a more even split between the in-home and out-of-home locations for social,
personal business, and “receive childcare” episodes, though there are also much more differences
in these splits between weekdays and weekend days compared to other episode types. For social
and personal business episodes, the location is skewed toward the out-of-home category on
weekend days. The substantially high percentage of out-of-home personal business episodes over
the weekends may be attributed to shopping being the dominant personal business activity on
weekends (see Figure 1). For the “receive childcare” episodes (last row of table), the percentage
is much higher for the out-of-home category on weekdays (when adults are likely to be at work)
and much higher for the in-home category on weekend days (when adults seek child care at
home to maximize the time gained from the child care arrangement to pursue out-of-home
activities).
Table 4 provides important information on the propensity to pursue out-of-home episodes
of each activity type, but does not examine the type of location where out-of-home episodes are
pursued. Figure 2 provides this information for all the non-school activity purposes, except for
work, household chores, and personal care (children work primarily at their work place, while
household chores and personal care are almost exclusively pursued in-home; see Table 4). The
results in Figure 2 show that someone else’s home is a very common location for participation in
all types of out-of-home episodes, except for organized activities and personal business episodes.
This is particularly the case for recreation and social episodes on both weekdays and weekend
days, and for “receiving child care” episodes on weekend days. Another very frequent location
for participation in all types of out-of-home episodes (except personal business episodes) on
weekdays is school. On the other hand, on weekends, a rather large fraction of organized activity
and social out-of-home episodes are pursued at church. Studying-related out-of-home episodes
Copperman and Bhat 12
are pursued primarily at someone else’s home or school, on both weekdays as well as weekend
days. Finally, and as expected, most personal business episodes are pursued at store locations.
4.2 Companionship Arrangement of Activity Episodes
As indicated in the introductory section of the paper, the joint activities of children with other
individuals introduce linkages in the activity-travel patterns of all the individuals involved. Thus,
it is of interest to understand the individuals who accompany children in their activity episode
participations. For in-home episodes, the only activity type whose episodes have a rather high
chance of being pursued alone is personal business (about 27% of in-home personal business
episodes are pursued alone). Among episodes pursued jointly or with other persons around, a
vast majority of in-home episodes of all types involve only the immediate family (mother, father,
sibling or combinations), or immediate family and other non-family members. In the rest of this
section, we do not present the companionship arrangement for in-home activity episodes because
of the dominance of immediate family members as accompanying individuals.
The companionship arrangement (i.e., who participated with the child) for out-of-home
non-school episodes is presented in the form of pie-charts in Figure 3, with each row
corresponding to the companion-type distribution for episodes of each activity purpose (the work
activity purpose does not appear in the figure, because, by definition, work activities are pursued
alone). There are two columns of pie-charts in Figure 3, one for weekdays and another for
weekend days. Several insights may be drawn from the figure. First, and as one would expect,
episodes for studying are the most likely to be pursued alone (see the large fraction of the “No
one else (alone)” category in the third row of the pie-charts). Among the non-study episodes,
recreation episodes are more likely to be pursued alone relative to episodes of other types.
Second, the results show that children are more likely to be accompanied by only their mother
than only their father on weekdays for all episodes except social episodes. This is consistent with
the notion that the mother bears more of the responsibility for child-care and related child
activities (Bryant and Zick, 1996b; Sayer et al., 2004). It may also be the result of men being
more likely to be employed in a household and working longer hours (Korenman et al., 2005),
which constrains their time with children. The latter explanation is compatible with the finding
that the participation levels of children with only their fathers increase between weekdays and
weekend days for all episode types, except social activity episodes (see Yeung et al., 2001 for

Copperman and Bhat 13
similar results). Third, the participation levels of children with only their mothers and with only
their fathers is substantially different for personal business (mostly shopping) episodes (see the
last row of pie-charts on the second page of Figure 3). This result reinforces the stereotype that
men are much less likely to pursue shopping-related activities compared to women (Niemeier
and Morita, 1996). Fourth, children are most likely to pursue episodes with only their siblings for
recreational episodes compared to other episode types. Fifth, children participate much more
with their immediate family (combinations of parents and siblings) in all activity episodes over
the weekends. This is particularly the case for out-of-home meals, social, and personal business
episodes. Overall, the higher participations with the immediate family over the weekend are a
clear result of more time availability to be together as a family over the weekends. Sixth,
children participate with only their friends rather substantially, particularly in social and
recreational episodes. Children also participate with only other non-relatives very substantially
(upwards of 50%) in organized activity episodes. In addition, children participate at rather high
intensity levels with combinations of family and non-family members.
Overall, it is indeed remarkable that children mostly participate with other individuals in
their activities rather than alone. Further, children participate with their immediate family
members (and no one else) at less than 50% for all episode types. The rather high fraction of
joint out-of-home episodes undertaken with non-household members (with or without family
members) emphasizes the importance of recognizing inter-household interactions in the context
of a household’s social network, in addition to intra-household interactions.
5. EPISODE SEQUENCING
The analysis thus far has focused on overall time-use during the day (Section 3) and the
location/with whom dimensions of individual episode participations (Section 4). In this section,
we examine how children organize their weekday and weekend days; i.e., we develop simple
measures associated with the organization of various out-of-home episodes into an overall daily
activity-travel pattern.
5.1 Activity Episode Chaining
This section of the paper examines the sequencing of out-of-home activity episodes (i.e., stops)
in terms of the organization of the episodes into tours (home-to-home sojourns). Specifically, we

Copperman and Bhat 14
examine the propensity of children to undertake multiple types of out-of-home activity episodes,
as a part of the same sojourn or home-based tour. The activity episode chaining for each activity
purpose T is described in terms of a chaining propensity index, which is defined as the ratio of
the number of multiple-stop tours containing an episode of T to the total number of tours
containing an episode of activity purpose T. For example, if out of 1000 home-based tours, each
comprising at least one shopping activity episode, 700 tours comprise only one or more shopping
episodes and the remaining 300 comprise one or more other (non-shopping) stops in addition to
shopping, then the chaining propensity for shopping is 300/1000 = 0.3. Thus, for activity purpose
T, a chaining propensity of 1 would indicate that all episodes of purpose T are chained with out-
of-home activity episodes of other purposes, while a chaining propensity of 0 would imply that
episodes of purpose T are never chained with out-of-home activity episodes of other purposes.
The chaining propensities by activity purpose are presented in Table 5a for both
weekdays and weekends. In the overall, 41% of all out-of-home tours involving children’s
episodes are chained (i.e. involve activity episodes of different purposes), while 43% of all tours
on weekend days are chained (see first row of Table 5a). The marginally higher chaining on
weekend days is presumably a reflection of more relaxed time constraints, and more impulsive
participations in other activity purposes when participating in a specific activity purpose. A
further examination of the chaining propensity by activity purpose reveals several interesting
results. Among all purposes, school episodes are the only ones that are more likely to be
undertaken in isolation than being chained with episodes of other activity purposes (this is
particularly the case during weekend days). For weekday work episodes, the propensity to chain
with episodes of other activity purposes is about the same as the propensity to not chain, while
weekend work episodes are more likely to be undertaken in isolation. Perhaps the relatively strict
spatial and temporal constraints within which the school/work activity is undertaken, and the
long durations invested in episodes of these purposes, make it undesirable for children to chain
these activity episodes with other out-of-home activity episodes. Among non-school and non-
work purposes, episodes for meals and personal care are the most likely to be chained. This is
quite intuitive, since out-of-home meals and personal care episodes are likely to be pursued in
combination with other episode types such as shopping. Finally, a comparison of the differences
in chaining propensities across weekdays and weekend days reveals that out-of-home episodes

Copperman and Bhat 15
for studying, social, and “receiving child care” are particularly likely to be chained with episodes
of other purposes over the weekdays relative to weekend days.
Table 5a provides a good indication of the motivation behind the sequence of episode
participations, but does not provide information about the spatial location component of chaining.
For example, a shopping episode at a shopping mall may be followed by a meal episode at the
mall, in which case both of these episodes would appear as being chained. However, there is no
spatial dislocation (i.e., no travel) between the two episodes. To examine the extent of chaining
in terms of travel, Table 5b provides the information on chaining of out-of-home episodes by
activity location. The first row clearly indicates that, while the chaining propensities by purpose
are about the same on weekdays and weekends, there is much more spatial diversity (scattering)
in the location of participation of the episodes over the weekend days. Specifically, only 26% of
weekday tours involve episode participations at multiple locations, compared to 66% of weekend
tours. This is indeed interesting, suggesting that individuals appear to be more willing to invest
time in travel, perhaps to their desired locations for participation in each type of activity, over the
weekends. On the other hand, there is a tendency to pursue activities at a single location in tours
on weekdays. Among the different activity location categories, episodes undertaken at the
parents’ work place are most likely to be chained with other locations, while those undertaken at
school and church are the least likely to be chained (especially on weekdays).
5.2 Activity Purpose of the First and Last Out-of-Home Episodes of the Day
This section examines the sequencing of out-of-home activity episodes in the context of the
entire day by examining the likelihood that out-of-home episodes of each activity purpose are
undertaken as the first and last out-of-home episode for the day, conditional on participation in
that activity purpose (Table 6). This analysis is restricted to only persons undertaking two or
more out-of-home activity episodes during the day.
The numbers in Table 6 are interpreted as follows. For the school purpose, 78.2%
(66.7%) of the episodes occur as the first episode of the weekday (weekend day) and 9.7%
(33.3%) of the episodes occur as the last episode of the weekday (weekend day). Thus, the
results indicate that school activity episodes have a very high likelihood of participation as the
first stop in the day for both weekdays and weekend days, though school episodes are unlikely to
be the last episode of weekdays. On the other hand, work episodes are unlikely to be the first

Copperman and Bhat 16
episode, and very likely to be the last episode, on weekdays. However, on weekend days, the
likelihood of work being the first episode is about the same as that of being the last episode, and
this likelihood is about 45%. Meal episodes on weekdays have about a one-fourth probability of
being the first episode and a one-fifth probability of being the last episode. However, meal
episodes are less likely to be the first episode on weekend days. For all the remaining purposes,
(see the rows corresponding to “household chores” through “receive child care”), episodes of
these types are much more likely to be the first episode, and much less likely to be the last
episode, on weekend days relative to weekdays. This is particularly the case for organized
activity and social episodes. Across both weekdays and weekend days, and among the non-
school episodes, personal care episodes are most likely to be the first episode relative to other
non-school episodes, and episodes for work, recreation, social, and personal businesses are most
likely to be the last episodes. Overall, most activities involving structure and time constraints
(school on weekdays and organized activities on weekend days) are participated earlier in the
day, and other activities are pursued later.
6. CONCLUSION
The activity-based approach to travel analysis has received substantial attention in the
transportation field. In recent years, the importance of recognizing and accommodating inter-
household and intra-household linkages in activity-travel patterns has been emphasized (see
Koppelman and Gliebe, 2002; Srinivasan and Bhat, 2006; and Goulias and Kim, 2005). However,
almost all earlier activity-based analyses have focused solely on the activity-travel patterns of
adults. In these studies, children are considered only to the extent that their demographic
characteristics (presence, number, and age distribution) impact the adults’ activity-travel patterns.
On the other hand, explicitly considering children’s activity patterns is important for
accommodating the linkages between children’s and adult’s activity-travel patterns, and for the
accurate forecasting of activity-travel patterns in general. In this research, we descriptively
examine the weekday and weekend activity participation characteristics of school-going children.
In doing so, we focus on the overall time-use of children in different types of activities, as well
as on several dimensions characterizing the context of activity participations.
There are several important findings from the study. First, the types of activities children
pursue are quite different based on age. This is particularly the case for organized activities,
Copperman and Bhat 17
social, and personal business (including shopping) activities, with older children participating
more often in these activities, and for longer durations, than younger children. As expected,
adolescents (15-18 years) are also much more likely to participate in work activities compared to
younger children. Second, there are substantial variations in time-use between weekdays and
weekend days, particularly for the recreation, social, and personal business purposes. It is
particularly interesting to note the time investment patterns in recreation. Almost all children
recreate over the weekday and weekend day, and the time investment in recreation is, on average,
3.5 hours on a weekday and 6.5 hours on weekend days. Within the category of recreation, the
dominant type of recreation among children is “TV or movie viewing” and “playing
video/computer” games. This reinforces the notion that children participate much more in
physically passive recreational activities, and spend substantial amounts of time in such activities,
than in physically active recreational activities (see Vandewater et al., 2006). Third, there are
significant variations in the intensity and type of non-school activities pursued at different times
of the day. Fourth, a rather substantial fraction of out-of-home episodes are pursued at someone
else’s home on both weekdays and weekends, and at school on weekdays. Fifth, children mostly
participate with other individuals (rather than alone) in out-of-home activity episodes, and a
significant proportion of these joint participations are with individuals who are not family
members. The rather high fraction of joint out-of-home episodes undertaken with non-household
members (with or without family members) emphasizes the importance of recognizing inter-
household interactions in the context of a household’s social network, in addition to intra-
household interactions. Sixth, the relatively strict spatial and temporal constraints within which
the school/work activity is undertaken, and the long durations invested in episodes of these
purposes, appear to make it undesirable for children to chain these activity episodes with other
out-of-home activity episodes. Seventh, there is substantial spatial scattering in the location of
participation of the episodes in tours over the weekend days, and a tendency to pursue activities
at a single location in tours on weekdays. These results perhaps reflect lesser time constraints and
more impulsive episode chaining on weekend days relative to weekdays. Finally, most activities
involving structure and time constraints (school on weekdays and organized activities on
weekend days) are participated earlier in the days, while episodes for other activities are pursued
later.
Copperman and Bhat 18
Overall, our findings provide insights into children’s time use and activity participation
characteristics, including the context of activity participations. In light of our findings, we
recommend that future travel surveys and models be suitably enhanced to (1) recognize intra-
household and inter-household interactions, (2) include multi-day data collection programs, and
(3) explicitly consider children’s activity-travel behavior characteristics.
ACKNOWLEDGEMENTS
The authors would like to thank Ipek Sener and Minkyung Kim’s help in cleaning and preparing
the dataset.

Copperman and Bhat 19
REFERENCES
Aaron, D. J., K. L. Storti, R. J. Robertson, A. M. Kriska, and R. E. LaPorte. Longitudinal Study of the Number and Choice of Leisure Time Physical Activities from Mid to Late Adolescence. Archives of Pediatric and Adolescent Medicine, Vol. 156, 2002, pp. 1075-1080.
Anderson, R. E., C. J. Crespo, S. J. Bartlett, L. J. Cheskin, and M. Pratt. Relationship of Physical
Activity and Television Watching with Body Weight and Level of Fatness Among Children. Journal of the American Medical Association, Vol. 279, No. 12, 1998, pp. 938-942.
Asmussen, L. and R. Larson. The Quality of Family Time Among Young Adolescents in Single-
Parent and Married-Parent Families. Journal of Marriage and the Family, Vol. 53, No. 4, 1991, pp. 1021-1030.
Bhat, C. R., and A. Lockwood. On Distinguishing Between Physically Active and Physically
Passive Episodes and Between Travel and Activity Episodes: An Analysis of Weekend Recreational Participation in the San Francisco Bay Area. Transportation Research Part A, Vol. 38, No. 8, 2004, pp. 573-592.
Bhat, C. R. and R. Misra. Comprehensive Activity-Travel Pattern Modeling System for Non-
Workers with Empirical Focus on the Organization of Activity Episodes. In Transportation Research Record: Journal of the Transportation Research Board, No. 1777, TRB, National Research Council, Washington, D.C., 2002, pp. 16-24.
Bhat, C. R., and S. K. Singh. A Comprehensive Daily Activity-Travel Generation Model System
for Workers. Transportation Research Part A, Vol. 34, No. 1, 2000, pp. 1-22. Bhat, C. R., and S. Srinivasan. A Multidimensional Mixed Ordered-Response Model for
Analyzing Weekend Activity Participation. Transportation Research Part B, Vol. 39, No. 3, 2005, pp. 255-278.
Bryant, W. K. and C. D. Zick. An Examination of Parent-Child Shared Time. Journal of
Marriage and the Family, Vol. 58, No. 1, 1996a, pp. 227-237. Bryant, W. K., and C. D. Zick. Are We Investing Less in the Next Generation? Historical Trends
in Time Spent Caring for Children. Journal of Family and Economic Issues, Vol. 17, 1996b, pp. 365–92.
Center for Disease Control (CDC). Youth Risk Behavior Surveillance – United States, 2005.
Morbidity and Mortality Weekly Report, Vol. 55, No. SS-5, 2006. Center for Disease Control (CDC). Physical Activity and Good Nutrition: Essential Elements to
Prevent Chronic Diseases and Obesity 2005. CDC At A Glance, 2005, http://www.cdc.gov/nccdphp/aag/aag_dnpa.htm. Accessed June 15, 2006.

Copperman and Bhat 20
Clifton, K. J. Independent mobility among teenagers: an exploration of travel to after-school activities. Presented at the 82nd Annual Meeting of the Transportation Research Board, Washington, D.C., 2003.
Copperman, R., and C. R. Bhat. An Analysis of the Determinants of Children’s Weekend
Physical Activity Participation. Forthcoming, Transportation, 2006. Durant R. H., T. Baranowski, M. Johnson, and W. O. Thompson. The Relationship Among
Television Watching, Physical Activity, and Body Composition of Young Children. Pediatrics, Vol. 94, No. 4, 1994, pp. 449–455.
Feldman, D. E., T. Barnett, I. Shrier, M. Rossigni, and L. Abenhaim. Is Physical Activity
Differentially Associated with Different Types of Sedentary Pursuits? Archives of Pediatric and Adolescent Medicine, Vol. 157, 2003, pp. 797-802.
Frusti, T., C. R. Bhat, and K. W. Axhausen, 2003. An Exploratory Analysis of Fixed
Commitments in Individual Activity-Travel Patterns. In Transportation Research Record: Journal of the Transportation Research Board, No. 1807, TRB, National Research Council, Washington, D.C., 2003, pp. 101-108.
Gordon-Larsen, P., R. G. McMurray and B. M. Popkin. Determinants of Adolescent Physical
Activity and Inactivity Patterns. Pediatrics, Vol. 105, No. 6, 2000, pp. e83. Goulias, K. G. and T. Kim. An Analysis of Activity Type Classification and Issues Related to the
With Whom and For Whom Questions of an Activity Diary. Presented at the 84th
Annual Meeting of the Transportation Research Board, Washington, D.C., 2005. Hofferth, S. L. and J. Jankuniene. Life After School. Association for Supervision and Curriculum
Development, 2001, pp.19-23. Hofferth, S. L. and J. F. Sandberg. How American Children Spend Their Time. Journal of
Marriage and Family, Vol. 63, 2001a, pp. 295-308. Hofferth, S. L., and J. F. Sandberg. Changes in American Children’s Use of Time, 1981-1997. In
T. Owens & S. Hofferth (Eds.), Advances in Life Course Research Series: Children at the Millennium: Where have we come from, where are we going?, Elsevier Science, New York, 2001b.
Janz, K. F., J. D. Dawson, and L. T. Mahoney. Tracking Physical Fitness and Physical Activity
from Childhood to Adolescence: the Muscatine Study. Medicine and Science in Sports and Exercise, 1999, pp. 1250-1257.
Kitamura, R. Serve Passenger Trips as a Determinant of Travel Behaviour. In Carpenter, S. and
P.M. Jones (eds.) Recent Advances in Travel Demand. Gower, Aldershot, UK, 1983.
Copperman and Bhat 21
Koppelman, F. S. and J. P. Gliebe. A Model of Joint Activity Participation Between Household Members. Transportation, Vol. 49, 2002, pp. 49-72.
Korenman, S., M. Liao, and J. O’Neill. Gender Differences in Time Use and Labor Market
Outcomes. Presented at the American Time Use Survey (ATUS) Early Results Conference, 2005.
Larson R. W. and S. Verma. How Children and Adolescents Spend Time Across the World:
Work, Play, and Developmental Opportunities. Psychological Bulletin. Vol. 125, No. 6, 1999, pp. 701-736.
Niemeier, D. A. and J. G. Morita. Duration of Trip-Making Activities by Men and Women A
Survival Analysis. Transportation, Vol. 23, No. 4, 1996, pp. 353-371. McDonald, N. An Exploratory Analysis of Children’s Travel Patterns. Forthcoming,
Transportation Research Record, 2006. Posner, J. K. and D. L. Vandell. After-School Activities and the Development of Low-Income
Urban Children: A Longitudinal Study. Developmental Psychology, Vol. 35, No. 3, 1999, pp. 868-879.
Posner, J. K. and D. L. Vandell. Low-Income Children’s After-School Care: Are there Beneficial
Effects of After-School Programs? Child Development, Vol. 65, No. 2, 1994, pp. 440-456. Robinson T. N., L. D. Hammer, J. D. Killen, H. C. Kraemer, D. M. Wilson, C. Hayward and C.
B. Taylor. Does Television Viewing Increase Obesity and Reduce Physical Activity? Crosssectional and Longitudinal Analyses Among Adolescent Girls. Pediatrics, Vol. 91, No. 2, 1993, pp. 273–280.
Sallis, J. F., J. E. Alcaraz, T. L. McKenzie, and M. F. Hovell. Predictors of Change in Children’s
Physical Activity Over 20 Months. American Journal of Preventive Medicine, Vol. 16, No. 3, 1999, pp. 222-228.
Sallis, J. F., J. J. Prochaska, and W. C. Taylor. A Review of Correlates of Physical Activity of
Children and Adolescents. Medicine and Science in Sports and Exercise, Vol. 32, No. 5, 2000, pp. 963-975.
Sandberg J. F. and S. L. Hofferth. Changes in Children’s Time with Parents: United States,
1981-1997. Demography, Vol. 38, No. 3, 2001, pp. 423-436. Sayer, L. C., S. M. Bianchi, J. P. Robinson. Are Parents Investing Less Time with Children?
Trends in Mothers’ and Fathers’ Time with Children. American Journal of Sociology, Vol. 110, No. 1, 2004, pp. 1-43.
Shann, M. H. Students’ Use of Time Outside of School: A Case for After School Programs for
Urban Middle School Youth. The Urban Review, Vol. 33, No. 4, 2001, pp. 339-355.

Copperman and Bhat 22
Stefan, K. J. and J. D. Hunt. Age-Based Analysis of Children in Calgary, Canada. Presented at
the 85th Annual Meeting of the Transportation Research Board, Washington, D.C., 2006.
Srinivasan, S., and C. R. Bhat. A Multiple Discrete-Continuous Model for Independent- and
Joint- Discretionary-Activity Participation Decisions. Forthcoming, TRB Special Issue of Transportation, 2006.
Transportation Research Board and Institute of Medicine. Does the Built Environment Influence
Physical Activity? Examining the Evidence. TRB Special Report 282, 2005. Vandewater, E. A., D. S. Bickham, and J. H. Lee. Time Well Spent? Relating Television Use to
Children’s Free Time Activities. Pediatrics, Vol. 117, No. 2, 2006, pp. 181-191. Yeung, W. J., J. F. Sandberg, P. E. Davis-Kean, and S. L. Hofferth. Children’s Time With
Fathers in Intact Families. Journal of Marriage and the Family, Vol. 63, No. 1, 2001, pp. 136-154.
Zakarian, J. M., M. F. Hovell, C. R. Hofstetter, J. F. Sallis, K. J. Keating. Correlates of Vigorous
Exercise in a Predominantly Low SES and Minority High School Population. Preventive Medicine, Vol. 23, 1994, pp. 314-321.
Zill, N., C. W. Nord, and L. S. Loomis. Adolescent Time Use, Risky Behavior, and Outcomes:
An Analysis of National Data. Report prepared for the Office of Human Services Policy, U.S. Department of Health and Human Services, Washington, D.C., 1995.

Copperm
an and Bhat 23
LIST OF FIGURES FIGURE 1 Children’s participation in disaggregate organized activities, personal business, and
recreational activity purposes.
FIGURE 2 Percentage of in-home activity episodes at each location.
FIGURE 3 Companion type arrangement for out-of-home activity episodes.
LIST OF TABLES TABLE 1 Weekday (Weekend) Activity Purpose Participation Percentages and Average
Minutes of Total Daily Activity
TABLE 2a Weekday Before and After School Participation Percentages and Mean Activity Duration
TABLE 2b Weekend Time of Day Participation Percentages and Mean Activity Duration
TABLE 3a Weekday Before and After School Activity Percentages and Minutes at each Location
TABLE 3b Weekend by Time of Day Percentage and Minutes at each Location
TABLE 4 Percentage of In-Home and Out-of-Home Activity Purpose Episodes
TABLE 5a Chaining of Activity Episodes by Purpose
TABLE 5b Chaining of Activity Episodes by Location
TABLE 6 The First and Last Out-of-Home Activity Purpose Episodes of the Day

Copperman and Bhat 24
Children's Participation in Recreational Activities
0.00
10.00
20.00
30.00
40.00
50.00
60.00
70.00
80.00
90.00
100.00
Television orMovie Watching
Free Play Reading PassiveRecreational
Travel
ActiveRecreational
Travel
Hobby Sports Video orcomputer
games
OtherRecreation
Perc
enta
ge o
f Chi
ldre
n w
ho P
artic
ipat
e in
. ea
ch D
isag
greg
ate
Rec
reat
iona
l Act
ivity
. Weekday Weekend
Children's Participation in Organizated Activities
0.00
10.00
20.00
30.00
40.00
50.00
60.00
70.00
80.00
90.00
100.00
Sports Lesson Sports Practiceor Games
Non-sportLesson
Clubs and otherMeetings
Perc
enta
ge o
f Chi
ldre
n w
ho P
artic
ipat
e .
in e
ach
Dis
aggr
egat
e O
rgan
ized
Act
ivity
. Weekday Weekend
Children's Participation in Personal Business Activities
0.00
10.00
20.00
30.00
40.00
50.00
60.00
70.00
80.00
90.00
100.00
Shopping ObtainingServices
UsingComputer
Other
Perc
enta
ge o
f Chi
ldre
n w
ho P
artic
ipat
e .
in e
ach
Dis
aggr
egat
e .
Pers
onal
Bus
ines
s Ac
tivity
.
Weekday Weekend
92 min.
32 min. 51
min.
63 min.
92 min.
9 min.
22 min.
41 min.
126 min.
106 min.
43 min.
60 min.
153 min.
118 min.
91 min. 65
min.
39 min.
67 min.
74 min.
143 min.
39 min. 56
min.
49 min.
111 min.
57 min.
79 min.
67 min.
78 min.
75 min.
82 min.
124 min.
126 min.
115 min.
198 min.
FIGURE 1 Children’s participation in disaggregate organized activities, personal business, and recreational activity purposes.

Copperman and Bhat 25
0% 20% 40% 60% 80% 100%
Meals Weekday
Weekend
Organized Activities Weekday
Weekend
Studying Weekday
Weekend
Recreation Weekday
Weekend
Social Weekday
Weekend
Personal Business Weekday
Weekend
Receive Child Care Weekday
Weekend
Parent's Work Location Child's Work Location Someone Else's Home RestaurantOutdoor Recreational Area School Church StoreNon-Retail Business Other
FIGURE 2 Percentage of in-home activity episodes at each location.

Copperm
an and Bhat 26
Weekday Weekend Meals Organized Activities Studying
FIGURE 3 Companion type arrangement for out-of-home activity episodes.
10.2%
5.5%
1.7%
4.1%
12.8%
5.2%
9.6%14.0%
22.4%
14.5%
64.3%
23.6%
2.7%6.7%
2.0%0.7%
27.0%
6.4%
7.8%
32.6%
13.5%
1.4%
1.4%
3.5%2.1%
4.3%
5.6%
1.9%
7.5%
52.3%
23.2%
1.3%1.9%
3.7%2.7%
22.2%
2.2%
6.7%
2.2%
8.9%
4.4%13.3%
33.3%
6.7%
6.7%
4.3%8.5%3.2%8.2%5.3%10.3% 23.0%
6.4%24.1%
Noone else (alone) Only motherOnly father Only sibling(s)Immediate family combinations Only extended familyAll other family combinations Only child's friend(s)Only non-relatives Other combinations
5.3%3.1%
2.3%
26.3%
8.8%21.0%
12.1%
3.6%
13.4% 4.1%
Copperman and Bhat 27
Weekday Weekend Recreation
11.8%
8.4%
5.7%
9.6%
5.0%27.4%
13
Social Personal Business
.9%
15.3%2.1%
0.9%
1.8%4.6%5.6%
2.5%
7.0%
6.0%
5.3%
36.1%
13.3%
17.9%
6.7%
4.3%
6.4%
24.1%
8.5%
3.2%
8.2%
5.3%
10.3%
23.0%
2.6%
7.9%
7.7%
12.2%
9.5%
29.2%
5.1%
13.8%10.6%
1.4%
19.3%
6.4%
14.9%18.4%
10.3%
19.0%2.1%
3.9%4.3%1.4%
6.3%
21.4%
6.5%
3.9%
31.0%
2.2%
11.2%
8.1%
2.6%6.9%
6.7%
4.3%6.4%24.1%8.5%3.2%8.2%5.3%10.3% 23.0%
Noone else (alone) Only motherOnly father Only sibling(s)Immediate family combinations Only extended familyAll other family combinations Only child's friend(s)Only non-relatives Other combinations
FIGURE 3 (cont.) Companion type arrangement for out-of-home activity episodes.
Copperm
an and Bhat 28
TABLE 1 Weekday (Weekend) Activity Purpose Participation Percentages and Average Minutes of Total Daily Activity
Total 5 to 10 years 11 to 14 years 15 to 18 years
(N = 1970) (N = 874) (N = 617) (N = 479)
% Minutes % Minutes* % Minutes % Minutes
School 86.8 407.0 89.8 399.3 86.1 420.7 82.3 403.7 -- -- -- -- -- -- (0.6) (311.7)Work 3.2 256.7 -- -- -- -- 12.5 265.9 (3.3) (352.3) -- -- -- -- (12.3) (363.8) Meals 94.3 57.0 97.8 60.3 94.7 56.9 87.5 50.3 (95.1) (78.4) (98.9) (85.9) (95.1) (74.0) (88.1) (68.5) Household Chores 40.2 46.8 38.7 40.2 44.4 51.8 37.6 51.5 (51.6) (76.6) (52.2) (65.5) (55.4) (82.7) (45.5) (91.5) Organized Activities 15.3 107.5 11.2 85.4 16.0 105.8 21.9 129.9 (14.3) (136.9) (13.3) (118.1) (13.9) (140.5) (16.5) (163.1)Studying 60.3 70.8 65.8 54.6 60.3 76.1 50.3 101.5 (16.4) (94.1) (12.1) (66.0) (18.2) (100.5) (22.1) (116.7)Recreation 94.5 217.1 97.9 204.3 95.6 228.2 86.8 227.7 (97.9) (384.9) (99.5) (104.4) (98.9) (395.7) (93.7) (331.9)Social 37.5 72.6 28.4 51.7 37.6 67.1 53.9 97.6 (60.1) (139.9) (53.7) (133.8) (59.5) (135.9) (72.4) (152.7)Personal Business 23.2 50.8 20.6 37.8 22.9 54.2 28.6 64.5 (41.2) (90.2) (38.7) (80.2) (41.8) (100.8) (44.9) (94.3)Personal Care 98.9 64.4 99.3 65.5 98.7 61.3 98.5 66.4 (96.1) (65.4) (98.1) (64.8) (92.9) (62.5) (96.7) (68.6) Receive Child Care 7.0 117.5 12.9 123.2 3.6 96.0 -- -- (2.2) (66.1) (3.7) (56.7) (1.1) (68.6) -- --

Copperman and Bhat 29
TABLE 2a Weekday Before and After School Participation Percentages and Mean Activity Duration*
Before School After School (N = 1708) (N = 1708) % Minutes % Minutes
Work -- -- 3.0 249.3Meals 66.9 17.5 87.6 41.5Household Chores 11.4 12.1 33.4 41.8Organized Activities 1.3 51.6 18.7 10.0Studying 1.9 29.2 67.2 68.4Recreation 26.0 28.4 93.3 175.2Social 5.4 16.6 34.7 61.5Personal Business 1.2 23.3 16.7 52.6Personal Care 99.4 34.4 82.5 35.6Receive Child Care 2.0 33.9 6.6 122.8
TABLE 2b Weekend Time of Day Participation Percentages and Mean Activity Duration by Activity Purpose*
3 a.m. to 8 a.m. 8 a.m. to Noon Noon to 4 p.m. 4 p.m. to 8 p.m. 8 p.m. to Midnight (N = 1970) (N = 1970) (N = 1970) (N = 1970) (N = 1970) % Minutes % Minutes % Minutes % Minutes % MinutesSchool -- -- -- -- -- -- -- -- -- --Work -- -- 1.2 336.8 1.2 281.8 1.2 272.8 0.1 165.0Meals 11.2 23.1 67.0 30.2 55.2 37.3 64.9 41.4 13.7 31.2Household Chores 3.2 39.1 21.6 53.0 21.3 62.2 24.4 43.6 6.3 33.8Organized Activities 0.7 134.8 8.6 120.3 4.1 122.4 2.9 114.4 0.2 61.3Studying 0.3 126.0 3.0 93.8 5.9 83.9 7.4 77.6 2.9 51.7Recreation 13.6 80.7 67.1 118.2 76.2 156.7 80.4 142.0 56.2 84.0Social 2.2 68.2 25.8 113.6 23.9 95.5 26.2 81.5 15.0 52.3Personal Business 0.4 127.1 10.5 79.9 21.3 83.4 12.3 65.7 3.2 49.0Personal Care 22.5 25.8 73.2 33.1 28.7 28.2 34.5 31.3 53.0 24.9Receive Child Care -- -- 0.7 41.9 -- -- 0.8 82.9 -- --
* For each child, the activity duration in each purpose and for each time period is computed as the total duration across all episodes of that purpose undertaken during the time period. The mean activity duration for each purpose-time of day condition is then computed as the average across all children who had one or more participations in the purpose-time of day condition.
Copperman and Bhat 30
TABLE 3a Weekday Before and After School Activity Percentages and Mean Duration at each Location Before School After School (N = 1708) (N = 1708) % Minutes % MinutesHome 99.0 54.6 98.9 417.3Parent's work location 0.2 22.7 1.2 75.5 Child's work location 0.1 95.0 2.8 253.9 Someone else's home 2.6 54.8 19.2 136.3 Restaurant 0.2 25.0 6.7 52.7Outdoor recreational area 0.9 11.9 6.9 78.3School 11.8 30.3 21.9 111.9 Church 0.2 53.0 4.7 95.5Store/Retail business 0.4 17.7 9.7 44.5 Non-retail business 0.4 53.2 1.8 70.9 Daycare 0.5 42.5 2.3 131.5Other Location 0.1 52.5 1.5 107.4
TABLE 3b Weekend by Time of Day Percentage and Mean Duration at each Location 3 a.m. to 8 a.m. 8 a.m. to Noon Noon to 4 p.m. 4 p.m. to 8 p.m. 8 p.m. to Midnight (N = 1970) (N = 1970) (N = 1970) (N = 1970) (N = 1970) % Minutes % Minutes % Minutes % Minutes % MinutesHome 28.5 88.2 84.3 140.8 75.5 168.9 81.3 182.1 88.1 195.5Parent's work location 0.0 -- 0.3 96.8 0.3 176.0 0.2 35.0 0.0 0.0Child's work location 0.4 267.0 1.2 336.8 1.1 285.3 1.0 272.5 0.2 55.0Someone else's home 3.0 126.8 12.6 121.1 26.6 150.7 23.7 144.6 8.5 142.8Restaurant 0.2 31.8 4.6 53.0 10.4 52.4 8.6 62.0 1.7 54.2Outdoor recreational area 0.4 184.4 5.0 110.9 9.6 117.4 3.9 82.3 0.5 81.7School 0.6 235.5 2.3 173.8 2.4 126.5 1.3 143.5 0.2 100.0Church 1.3 15.0 18.4 153.5 4.5 104.4 4.7 120.7 0.4 64.4Store/Retail business 0.2 160.0 8.3 84.1 18.6 93.2 9.4 70.0 1.4 30.6Non-retail business 0.4 140.7 5.2 137.0 7.5 133.6 4.6 145.0 1.6 104.2Daycare 0.1 110.0 0.0 -- 0.0 -- 0.0 -- 0.0 --Other Location 0.4 92.1 1.4 128.2 1.4 83.3 1.2 102.5 0.6 173.9
Copperman and Bhat 31
TABLE 4 Percentage of In-Home and Out-of-Home Activity Purpose Episodes
Activity Purpose Day of Week Percentage In-Home Percentage Out-of-Home
Weekday 1.8 98.2Work
Weekend 8.9 91.1Weekday 89.6 10.4
Meals Weekend 76.9 23.1Weekday 95.6 4.4
Household Chores Weekend 88.8 11.2Weekday 0.0 100.0
Organized Activities Weekend 1.8 98.2Weekday 90.4 9.6
Studying Weekend 89.7 10.3Weekday 88.5 11.5
Recreation Weekend 79.4 20.6Weekday 71.2 28.8
Social Weekend 48.0 52.0Weekday 31.7 68.3
Personal Business Weekend 13.2 86.8Weekday 97.8 2.2
Personal Care Weekend 92.4 7.6Weekday 10.8 89.2
Receive Child Care Weekend 66.7 33.3

Copperman and Bhat 32
TABLE 5a Chaining of Activity Episodes by Purpose Weekday Weekend
Overall 0.41 0.43
School 0.48 0.38
Work 0.52 0.40
Meals 0.93 0.91
Household Chores 0.77 0.80
Organized Activities 0.65 0.58
Studying 0.88 0.60
Recreation 0.62 0.62
Social 0.70 0.58
Personal Business 0.67 0.56
Personal Care 1.00 0.99
Receive Child Care 0.96 0.79
TABLE 5b Chaining of Activity Episodes by Location Weekday Weekend
Overall 0.26 0.66
Parent's work location 0.86 0.78
Child's work location 0.57 0.27
Someone else's home 0.65 0.48
Restaurant 0.70 0.82
Outdoor recreational area 0.55 0.52
School 0.25 0.34
Church 0.29 0.39
Store/Retail business 0.68 0.55
Non-retail business 0.62 0.51
Other 0.75 0.67

an and Bhat 33
TABLE 6 The First and Last Out-of-Home Activity Purpose Episodes of the Day
Copperm
Weekday Weekend
% of the First Episode
% of the Last Episode
% of the First Episode
% of the Last Episode
School 78.2 9.7 66.7 33.3
Work 8.6 72.4 43.4 45.3
Meals 27.3 20.5 13.1 25.5
Household Chores 17.5 26.3 22.1 20.0
Organized Activities 8.5 67.9 52.4 19.8
Studying 3.8 26.0 36.1 22.2
Recreation 11.4 62.1 30.0 50.4
Social 17.0 51.4 48.9 33.6
Personal Business 15.7 53.3 36.3 36.3
Personal Care 27.2 37.6 50.0 25.4
Receive Child Care 18.6 63.7 30.8 15.4