an exploratory analysis of intercity travel … · an exploratory analysis of intercity travel...
TRANSCRIPT
1
Ghahramani, Brakewood & Peters
AN EXPLORATORY ANALYSIS OF INTERCITY TRAVEL PATTERNS USING
BACKEND DATA FROM A TRANSIT SMARTPHONE APPLICATION
Word Count: 4,982 (text) + 250 * 8 (figures) = 6,982
Submission Date: November 15, 2016
Niloofar Ghahramani (Corresponding Author)
The City College of New York
160 Convent Avenue, New York, NY, 10031, USA
Email: [email protected]
Phone: 702-690-1809
Candace Brakewood, PhD
The City College of New York
160 Convent Avenue, New York, NY, 10031, USA
Email: [email protected]
Phone: 212-650-5217
Jonathan Peters, PhD
The College of Staten Island
Room 3N-220, 2800 Victory Blvd., Staten Island, NY 10314
Email: [email protected]
Phone: 718-982-2958
Ghahramani, Brakewood & Peters 2
ABSTRACT
Smartphone applications (“apps”) providing transit information are commonly used in urban 1
areas. Many of these apps are available in multiple cities and automatically detect a user’s 2
location via the location services in the smartphone. The multi-city nature of these apps provides 3
a unique opportunity to understand how transit riders seek information as they travel between 4
cities. The objective of this paper is to identify intercity travelers to/from the New York 5
metropolitan region using one month of backend data from an application called “Transit”. 6
Intercity travelers are identified based on the number of days each user has opened the app inside 7
and outside of the New York region. To further categorize intercity travelers, a manual 8
classification method is implemented and distinct subgroups of intercity travelers are identified, 9
including visitors and New York residents. Then, the manual classification method was validated 10
by comparing the results to self-reported home locations stored in the app by a small number of 11
users. However, the validation only confirmed a small number of visitors as having the correct 12
home city. This may be because only one month of the Transit app data was used or because 13
only a small number of users stored their home location in the app. In conclusion, this 14
exploratory analysis utilized a rich new data source and has identified many areas to refine the 15
methodology in future analyses, such as considering consecutive days in the same city, studying 16
travelers’ pattern by day of the week, and validating the results using travel surveys. 17
Ghahramani, Brakewood & Peters 3
INTRODUCTION 1 Data about intercity travel behavior can be difficult to collect using traditional sources, such as 2
household travel surveys. However, new datasets from mobile phones have the potential to 3
identify intercity travelers and examine their travel behavior. This exploratory study proposes a 4
new method to identify intercity travelers using backend data from a smartphone application. 5
Specifically, data from a multiple-city transit information smartphone application called 6
“Transit” are used. This dataset is unique in that it provides an opportunity to study intercity 7
movements of transit riders using automatically collected data. 8
This paper proceeds as follows. First, literature pertaining to intercity travel behavior and 9
mobile phone data is briefly reviewed. Then, the specific research objectives are set forth, and 10
the smartphone-based dataset is discussed. Next, the methodology for identifying intercity 11
travelers is presented, and a manual classification method is used to identify subgroups of 12
intercity travelers. This method is then validated using self-report home location data. Next, 13
examples of the intercity travel behavior of two app users are visualized. Finally, conclusions 14
and areas for future research are presented. 15
16
LITERATURE REVIEW 17 In this section, a brief overview of prior research related to intercity travel and mobile phone-18
based data is provided. There is a relatively large literature pertaining to intercity travel, which 19
includes developing statistical methods and intercity travel demand models to predict mode 20
choice, traffic volumes, travel time and frequency of long distance trips. Data sources used to 21
conduct such analyses primarily include surveys (such as household travel surveys, stated 22
preference surveys, revealed preference surveys, and online surveys) and data obtained from 23
public or private transportation operators (e.g., 1, 2, 3, 4, 5, 6). One recent study provides a 24
general overview of intercity travel demand models, including discussing different data 25
collection methods; however, use of cell phone data was not considered (7). 26
There is also a growing body of literature pertaining to the use of cellular phone data for 27
transportation analysis. This includes using cell phone data to estimate demand, trip times and 28
speeds (8, 9) and for extracting origin-destination matrices (10, 11, 12). NCHRP Report 775 29
provides general guidelines for using GPS data in travel demand analysis; this report suggests 30
that cell phone data are valuable in transportation planning because they can passively trace 31
activity patterns of large populations (13). Notably, only a small number of prior studies have 32
specifically aimed to assess intercity travel patterns using mobile phone data (14, 15). 33
This brief review of prior research shows that some studies have used cellular phone data 34
to estimate intercity travel patterns, but few, if any studies have used backend data from a 35
transportation information smartphone application to assess intercity travel. Also, few prior 36
studies have focused specifically on the transit travel patterns of intercity travelers. 37
38
OBJECTIVE 39 The objective of this study is to develop a method to identify intercity travelers using backend 40
data from a multi-city transit information smartphone application. This is done for app users 41
based on the number of days they have opened the app inside and outside New York region in 42
one month. Then, a manual classification method is used to further classify intercity travelers 43
into subgroups. 44
45
46
Ghahramani, Brakewood & Peters 4
DATASET 1 This section contains a general description of the data used in this analysis. The first part gives a 2
brief introduction of the smartphone app, and the second part defines the geographic area of the 3
study. Next, there is a detailed description of the data files used in the analysis and finally, an 4
overview of the cleaning process of the dataset. 5
6
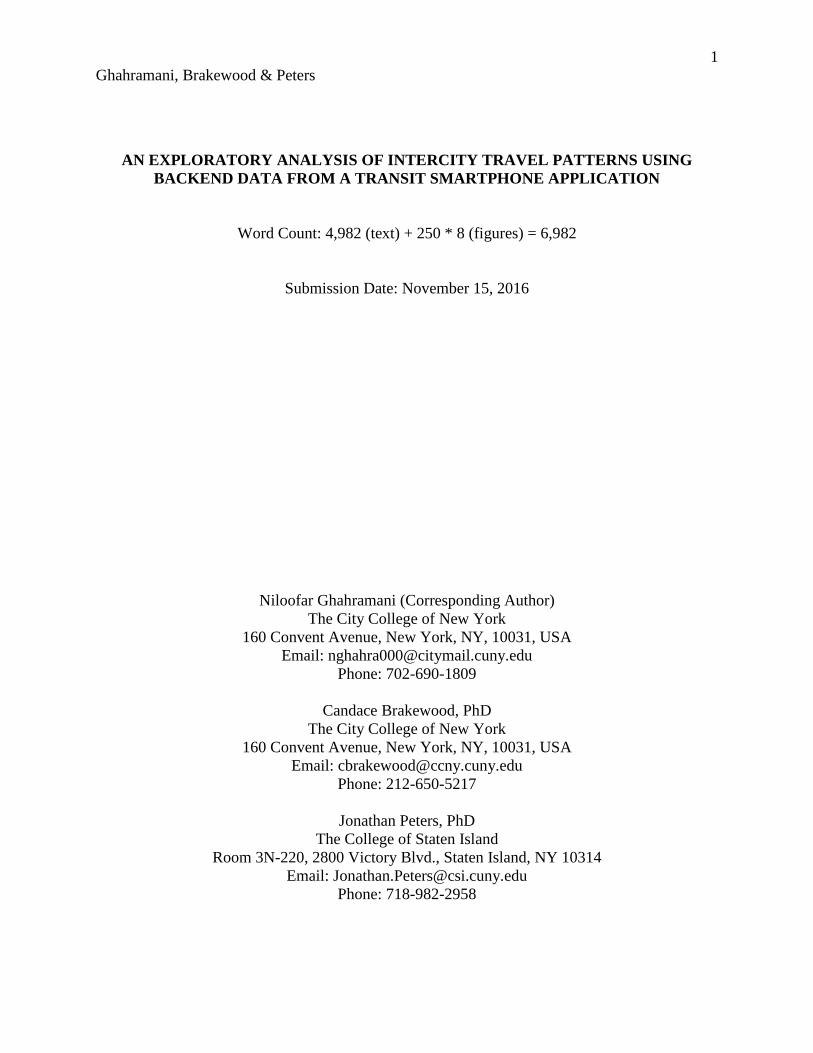
Overview of the Smartphone Application 7 “Transit” is a company based in Montreal, Canada that developed a free smartphone application 8
providing urban transportation information. Transit’s app is available on iPhone and Android 9
platforms and has widespread coverage in over 125 cities in nine countries. The app offers many 10
features, including real-time transit vehicle information, trip planning, service alerts, and 11
multimodal support (including bike-sharing, car-sharing, and Uber). The most heavily used 12
features of the app are those providing real-time transit information. Additionally, users can store 13
their favorite locations in the app, such as home or work, to facilitate quickly finding information 14
that they commonly use (16). 15
Figure 1 shows Transit’s Android interface displaying real-time transit information for 16
nearby routes (left), trip planning (center) and a stored home location (right), respectively. 17
18
19
20
21
22
23
24
25
26
27
28
29
30
31
32
33
34
35
FIGURE 1 Transit App Screenshots. 36
37
Area of Analysis 38 The geographic area selected for this study is the New York metropolitan region. New York City 39
is one of the most popular cities for tourists in the world with almost 60 million tourists annually 40
(17), suggesting that there should be many intercity travelers visiting for leisure purposes. The 41
New York City region also has the highest concentration of transit trips in the United States (18), 42
and is among the highest usage of the smartphone application, Transit, in the United States. 43
The New York metropolitan area was selected using the geographic area defined by New 44
York Metropolitan Transportation Council (NYMTC) (19). A bounding box was drawn for the 45
maximum and minimum latitude and longitude of NYMTC’s area. Figure 2 shows the area 46

Ghahramani, Brakewood & Peters 5
defined by NYMTC and the bounding box around it. As can be seen in this map, the bounding 1
box contains Philadelphia and all of Connecticut. This boundary presents roughly the dimensions 2
of the regional commuter rail network. App usage within the borders is considered to be local, 3
and usage outside of the box is considered to be in another region. 4
5
6
7
8
9
10
11
12
13
14
15
16
17
18
19
20
21
22
23
24
25
26
27
28
29
30
31
FIGURE 2 Bounding Box Defining Inside and Outside of the New York Metropolitan 32
Area. 33
34
Data Files and Description 35 The smartphone app dataset for this study was obtained directly from developers at Transit. It 36
contains data for any user that opened the app at least once during a single month in 2014 in the 37
New York City region. This dataset includes the user location (latitude/longitude), which is 38
recorded whenever the application is opened. For privacy purposes, all geographic coordinates 39
contained in these files were offset by the app developers by a random number. Anonymizing the 40
data ensured that this analysis did not contain personally identifiable information. Locations refer 41
to the anonymized version of the data point (e.g., a reference to “home locations” refers to the 42
anonymized home locations). 43
The raw dataset used for this analysis included two files in a Comma Separated Values 44
(CSV) format. The first was the locations file. Every time users open the app, regardless of what 45
feature they are using; their location is sent to Transit’s server based on the coordinates from the 46
Ghahramani, Brakewood & Peters 6
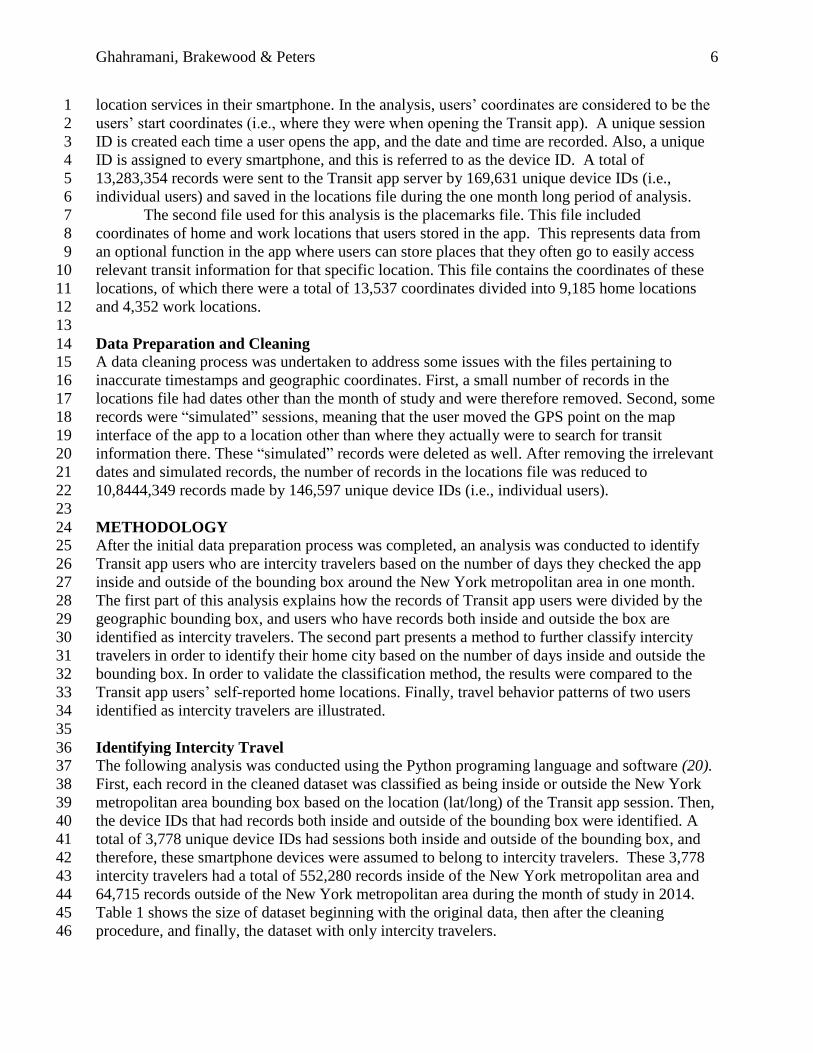
location services in their smartphone. In the analysis, users’ coordinates are considered to be the 1
users’ start coordinates (i.e., where they were when opening the Transit app). A unique session 2
ID is created each time a user opens the app, and the date and time are recorded. Also, a unique 3
ID is assigned to every smartphone, and this is referred to as the device ID. A total of 4
13,283,354 records were sent to the Transit app server by 169,631 unique device IDs (i.e., 5
individual users) and saved in the locations file during the one month long period of analysis. 6
The second file used for this analysis is the placemarks file. This file included 7
coordinates of home and work locations that users stored in the app. This represents data from 8
an optional function in the app where users can store places that they often go to easily access 9
relevant transit information for that specific location. This file contains the coordinates of these 10
locations, of which there were a total of 13,537 coordinates divided into 9,185 home locations 11
and 4,352 work locations. 12
13
Data Preparation and Cleaning 14 A data cleaning process was undertaken to address some issues with the files pertaining to 15
inaccurate timestamps and geographic coordinates. First, a small number of records in the 16
locations file had dates other than the month of study and were therefore removed. Second, some 17
records were “simulated” sessions, meaning that the user moved the GPS point on the map 18
interface of the app to a location other than where they actually were to search for transit 19
information there. These “simulated” records were deleted as well. After removing the irrelevant 20
dates and simulated records, the number of records in the locations file was reduced to 21
10,8444,349 records made by 146,597 unique device IDs (i.e., individual users). 22
23
METHODOLOGY 24 After the initial data preparation process was completed, an analysis was conducted to identify 25
Transit app users who are intercity travelers based on the number of days they checked the app 26
inside and outside of the bounding box around the New York metropolitan area in one month. 27
The first part of this analysis explains how the records of Transit app users were divided by the 28
geographic bounding box, and users who have records both inside and outside the box are 29
identified as intercity travelers. The second part presents a method to further classify intercity 30
travelers in order to identify their home city based on the number of days inside and outside the 31
bounding box. In order to validate the classification method, the results were compared to the 32
Transit app users’ self-reported home locations. Finally, travel behavior patterns of two users 33
identified as intercity travelers are illustrated. 34
35
Identifying Intercity Travel 36 The following analysis was conducted using the Python programing language and software (20). 37
First, each record in the cleaned dataset was classified as being inside or outside the New York 38
metropolitan area bounding box based on the location (lat/long) of the Transit app session. Then, 39
the device IDs that had records both inside and outside of the bounding box were identified. A 40
total of 3,778 unique device IDs had sessions both inside and outside of the bounding box, and 41
therefore, these smartphone devices were assumed to belong to intercity travelers. These 3,778 42
intercity travelers had a total of 552,280 records inside of the New York metropolitan area and 43
64,715 records outside of the New York metropolitan area during the month of study in 2014. 44
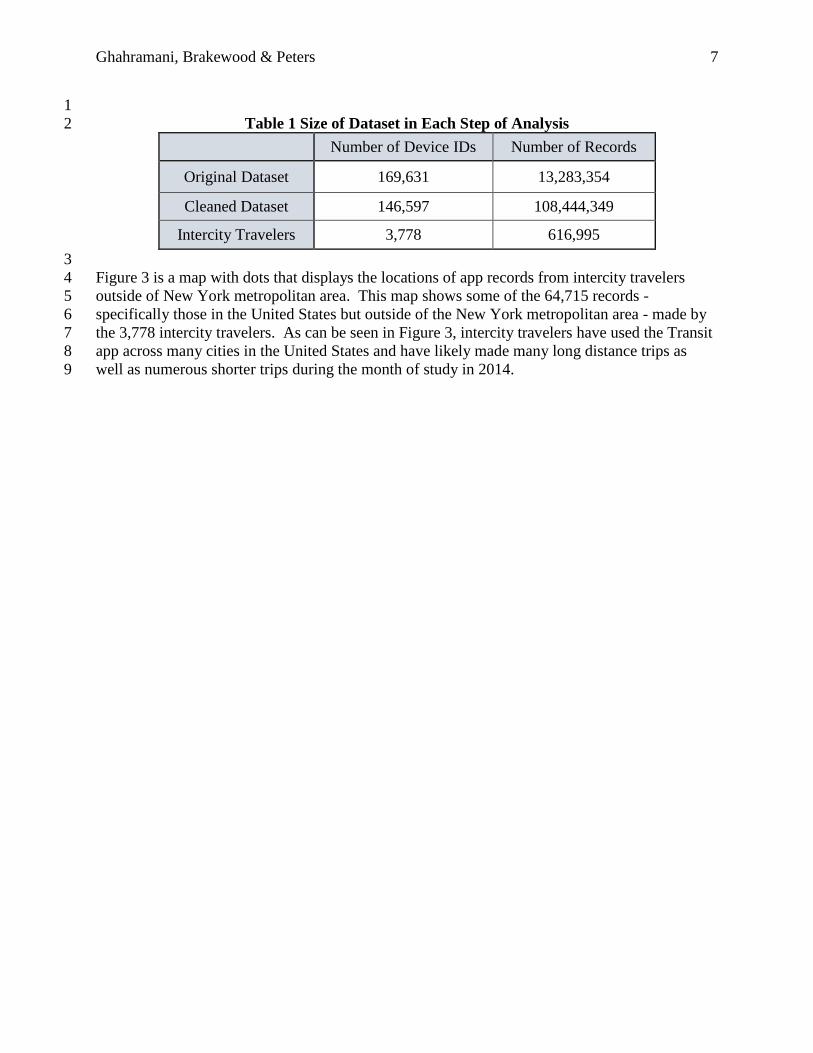
Table 1 shows the size of dataset beginning with the original data, then after the cleaning 45
procedure, and finally, the dataset with only intercity travelers. 46
Ghahramani, Brakewood & Peters 7
1
Table 1 Size of Dataset in Each Step of Analysis 2
Number of Device IDs Number of Records
Original Dataset 169,631 13,283,354
Cleaned Dataset 146,597 108,444,349
Intercity Travelers 3,778 616,995
3
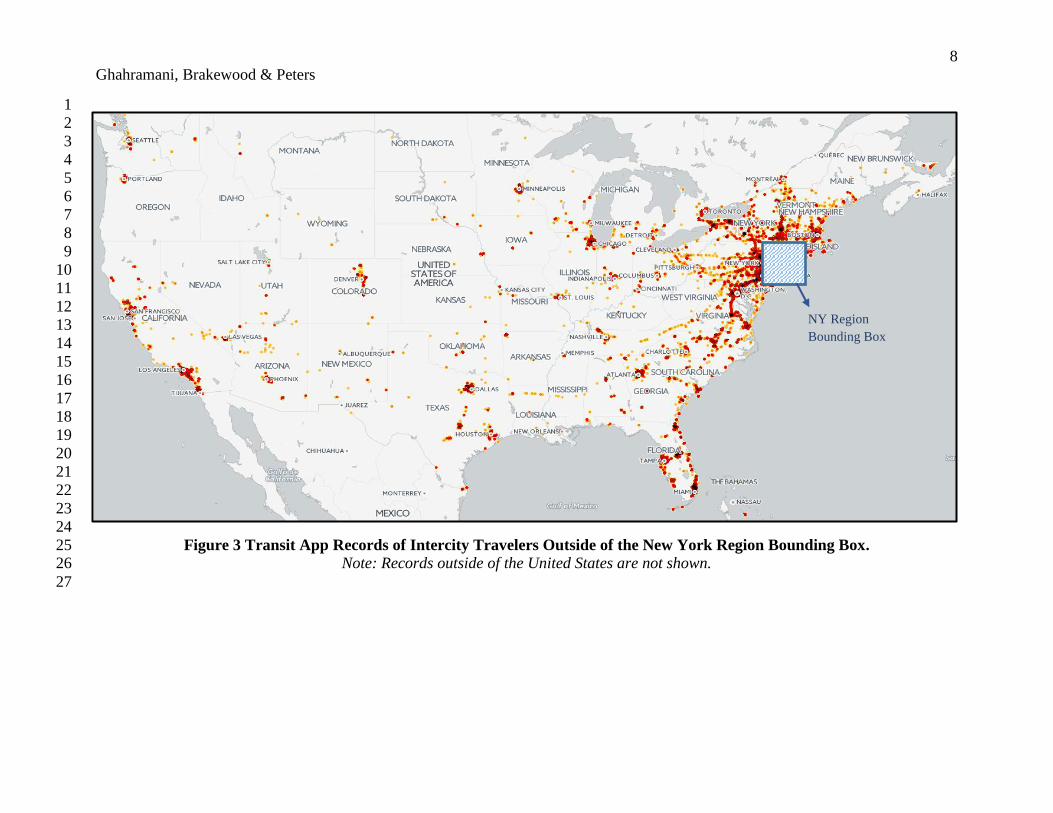
Figure 3 is a map with dots that displays the locations of app records from intercity travelers 4
outside of New York metropolitan area. This map shows some of the 64,715 records - 5
specifically those in the United States but outside of the New York metropolitan area - made by 6
the 3,778 intercity travelers. As can be seen in Figure 3, intercity travelers have used the Transit 7
app across many cities in the United States and have likely made many long distance trips as 8
well as numerous shorter trips during the month of study in 2014. 9
8
Ghahramani, Brakewood & Peters
1
2
3
4
5
6
7
8
9
10
11
12
13
14
15
16
17
18
19
20
21
22
23
24
Figure 3 Transit App Records of Intercity Travelers Outside of the New York Region Bounding Box. 25 Note: Records outside of the United States are not shown. 26
27
NY Region
Bounding Box
9
Ghahramani, Brakewood & Peters
Manual Classification 1 The 3,778 device IDs of the intercity travelers were then analyzed to further classify travel 2
behavior in an attempt to identify their home city. A manual classification of the 3,778 intercity 3
travelers was undertaken by counting the number of days each intercity traveler has used the 4
Transit app inside and outside of the New York region bounding box. Examining the timestamps 5
of sessions associated with each intercity traveler (i.e., unique device IDs) revealed that for some 6
device IDs, the same session ID was observed in two distinct locations with significant distance 7
between them in a very small time gap (e.g., five seconds). This could be due to errors sending 8
records from a smartphone to the Transit app server; if there was poor cell service or if the phone 9
was turned off before the records were sent, the time that data were received (timestamp) would 10
differ from the time that the session actually happened. To address this error, the unique session 11
IDs for each device ID were identified, and the location associated with the minimum timestamp 12
recorded for each unique session ID was identified and selected as the (likely) accurate location 13
of that session. 14
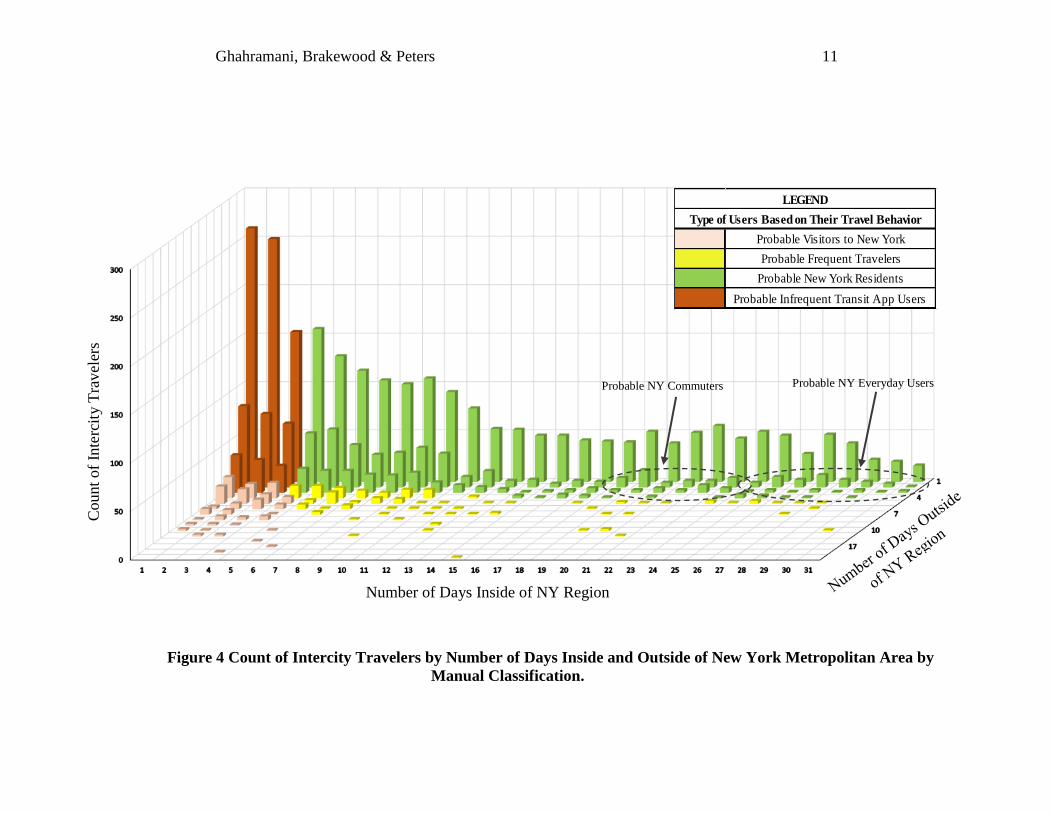
A graph showing the count of intercity travelers by the number of days inside and outside 15
of the New York region bounding box is shown in Figure 4. The x-axis in this bar chart shows 16
the number of days inside of the New York region, and the y-axis shows the number of days 17
outside of it. The value of each cell is presented on z-axis and shows the number of device IDs 18
(or individual Transit app users); the total count sums to 3,778 intercity travelers. 19
The bar chart was then used to manually categorize intercity travelers into four 20
subgroups: probable visitors to New York, probable frequent travelers, probable infrequent 21
Transit app users, and probable New York residents. Criteria for this grouping of users are 22
discussed below. 23
24
Group 1: Probable Visitors to New York 25
The first subgroup of intercity travelers are probably visitors to New York because these Transit 26
app users utilized the app on more days when they were outside New York than inside the New 27
York region. Specifically, this group was defined as the Transit app users who checked the app 28
more than 3 days outside of the bounding box and fewer days inside the box. There were 167 29
unique device IDs (or intercity travelers) in this group, which is shown in beige in Figure 4. 30
31
Group 2: Probable Frequent Travelers 32
The second subgroup of intercity travelers is considered to be frequent travelers because they 33
frequently used the Transit app both inside and outside of the New York region. Specifically, this 34
group includes users who have checked the app more than 3 days and had almost equal usage 35
outside and inside of the bounding box. In total, 159 app users were categorized as frequent 36
travelers, which is highlighted in yellow in Figure 4. 37
38
Group 3: Probable Infrequent Transit App Users 39
The third subgroup of intercity travelers is infrequent Transit app users, which makes them 40
difficult to further classify. These users checked the app less than 3 days per month either inside 41
or outside of the New York area; therefore, little information is available about them. Individuals 42
in this group are either infrequent Transit app users or infrequent transit system users. There are 43
995 individual users in this category, which is shown in dark orange in Figure 4. 44
45
46
Ghahramani, Brakewood & Peters 10
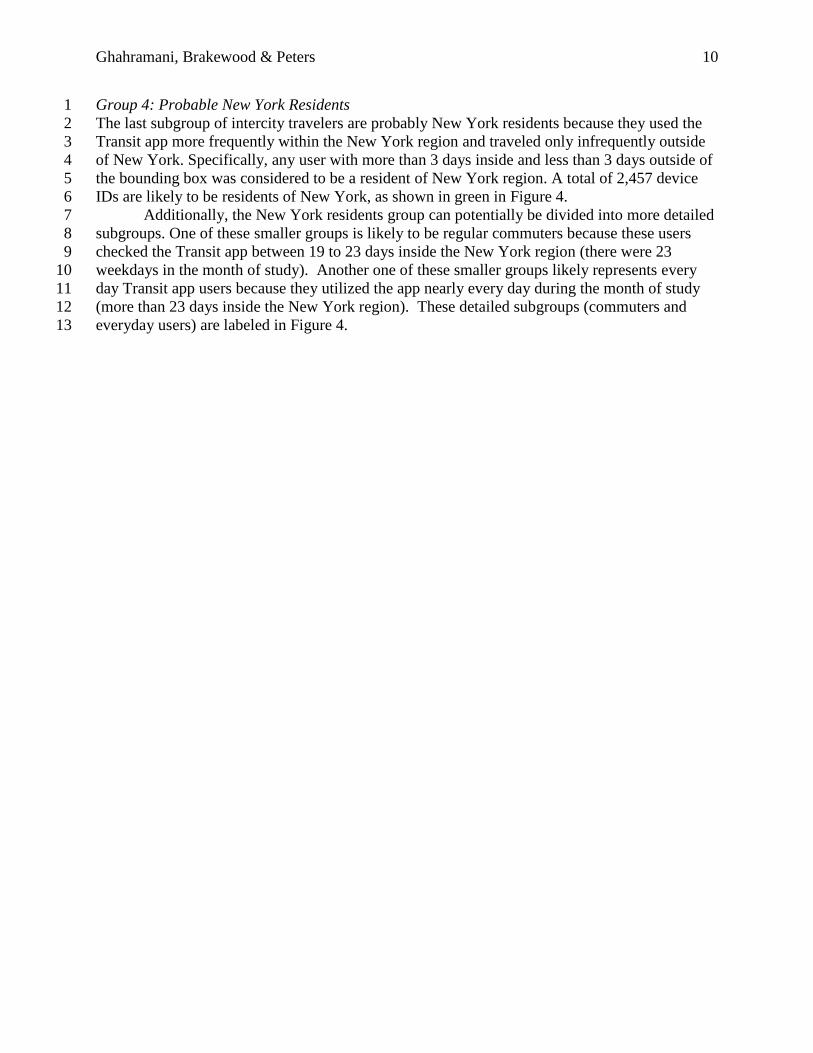
Group 4: Probable New York Residents 1
The last subgroup of intercity travelers are probably New York residents because they used the 2
Transit app more frequently within the New York region and traveled only infrequently outside 3
of New York. Specifically, any user with more than 3 days inside and less than 3 days outside of 4
the bounding box was considered to be a resident of New York region. A total of 2,457 device 5
IDs are likely to be residents of New York, as shown in green in Figure 4. 6
Additionally, the New York residents group can potentially be divided into more detailed 7
subgroups. One of these smaller groups is likely to be regular commuters because these users 8
checked the Transit app between 19 to 23 days inside the New York region (there were 23 9
weekdays in the month of study). Another one of these smaller groups likely represents every 10
day Transit app users because they utilized the app nearly every day during the month of study 11
(more than 23 days inside the New York region). These detailed subgroups (commuters and 12
everyday users) are labeled in Figure 4. 13
Ghahramani, Brakewood & Peters 11
Probable Visitors to New York
Probable Frequent Travelers
Probable New York Residents
Probable Infrequent Transit App Users
LEGEND
Type of Users Based on Their Travel Behavior
Figure 4 Count of Intercity Travelers by Number of Days Inside and Outside of New York Metropolitan Area by
Manual Classification.
Count
of
Inte
rcit
y T
rav
eler
s
Probable NY Everyday Users Probable NY Commuters
Number of Days Inside of NY Region
Ghahramani, Brakewood & Peters 12
Validation 1 In this section, the results of the manual classification are validated using the placemarks file. 2
The Transit app allows users to store favorite locations, such as their home, in the app for ease of 3
use. This self-reported home location provides a sample of data that the intercity travelers 4
groups can be compared against. Home locations of intercity travelers were obtained from the 5
placemarks file; out of 3,778 intercity travelers, only 272 users stored their home location. 6
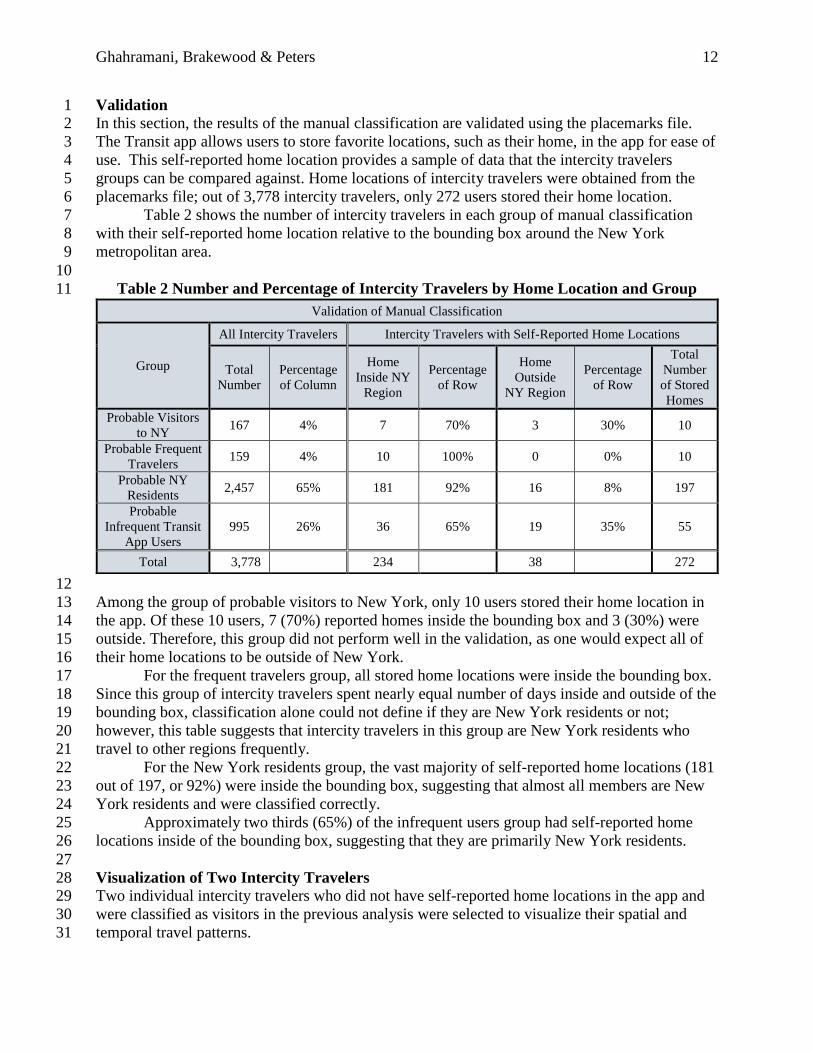
Table 2 shows the number of intercity travelers in each group of manual classification 7
with their self-reported home location relative to the bounding box around the New York 8
metropolitan area. 9
10
Table 2 Number and Percentage of Intercity Travelers by Home Location and Group 11
12
Among the group of probable visitors to New York, only 10 users stored their home location in 13
the app. Of these 10 users, 7 (70%) reported homes inside the bounding box and 3 (30%) were 14
outside. Therefore, this group did not perform well in the validation, as one would expect all of 15
their home locations to be outside of New York. 16
For the frequent travelers group, all stored home locations were inside the bounding box. 17
Since this group of intercity travelers spent nearly equal number of days inside and outside of the 18
bounding box, classification alone could not define if they are New York residents or not; 19
however, this table suggests that intercity travelers in this group are New York residents who 20
travel to other regions frequently. 21
For the New York residents group, the vast majority of self-reported home locations (181 22
out of 197, or 92%) were inside the bounding box, suggesting that almost all members are New 23
York residents and were classified correctly. 24
Approximately two thirds (65%) of the infrequent users group had self-reported home 25
locations inside of the bounding box, suggesting that they are primarily New York residents. 26
27
Visualization of Two Intercity Travelers 28 Two individual intercity travelers who did not have self-reported home locations in the app and 29
were classified as visitors in the previous analysis were selected to visualize their spatial and 30
temporal travel patterns. 31
Validation of Manual Classification
Group
All Intercity Travelers Intercity Travelers with Self-Reported Home Locations
Total
Number
Percentage
of Column
Home
Inside NY
Region
Percentage
of Row
Home
Outside
NY Region
Percentage
of Row
Total
Number
of Stored
Homes
Probable Visitors
to NY 167 4% 7 70% 3 30% 10
Probable Frequent
Travelers 159 4% 10 100% 0 0% 10
Probable NY
Residents 2,457 65% 181 92% 16 8% 197
Probable
Infrequent Transit
App Users
995 26% 36 65% 19 35% 55
Total 3,778 234 38 272
Ghahramani, Brakewood & Peters 13
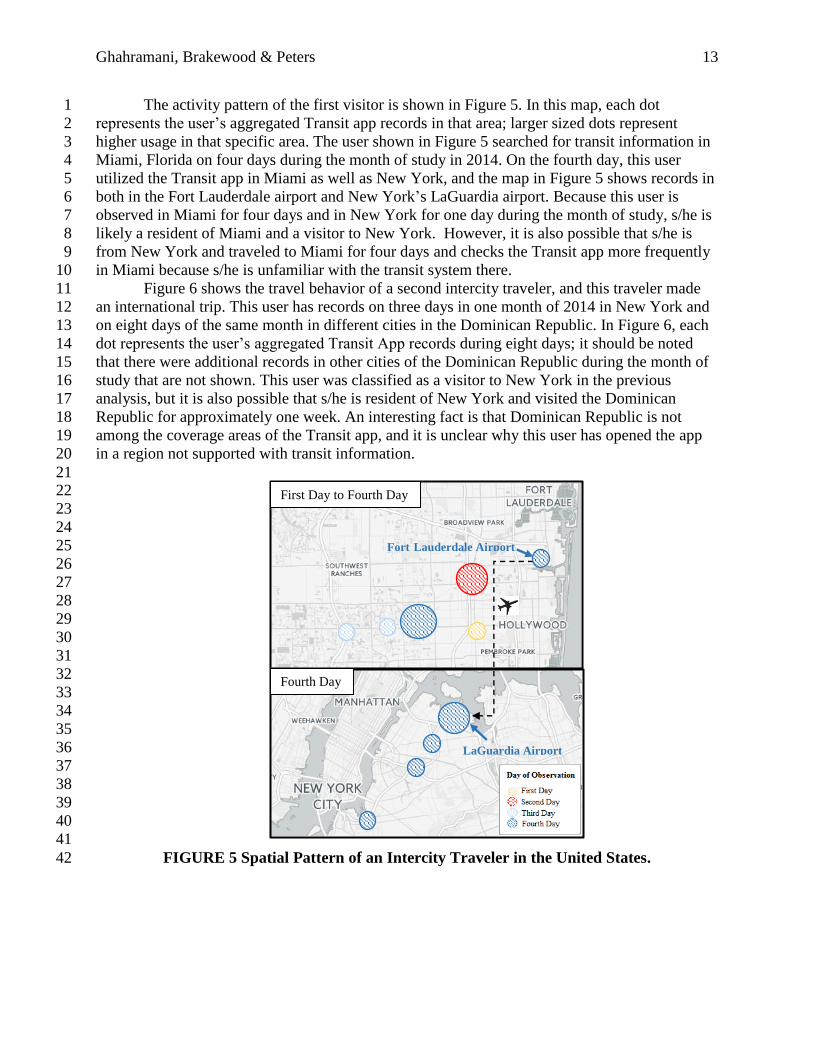
The activity pattern of the first visitor is shown in Figure 5. In this map, each dot 1
represents the user’s aggregated Transit app records in that area; larger sized dots represent 2
higher usage in that specific area. The user shown in Figure 5 searched for transit information in 3
Miami, Florida on four days during the month of study in 2014. On the fourth day, this user 4
utilized the Transit app in Miami as well as New York, and the map in Figure 5 shows records in 5
both in the Fort Lauderdale airport and New York’s LaGuardia airport. Because this user is 6
observed in Miami for four days and in New York for one day during the month of study, s/he is 7
likely a resident of Miami and a visitor to New York. However, it is also possible that s/he is 8
from New York and traveled to Miami for four days and checks the Transit app more frequently 9
in Miami because s/he is unfamiliar with the transit system there. 10
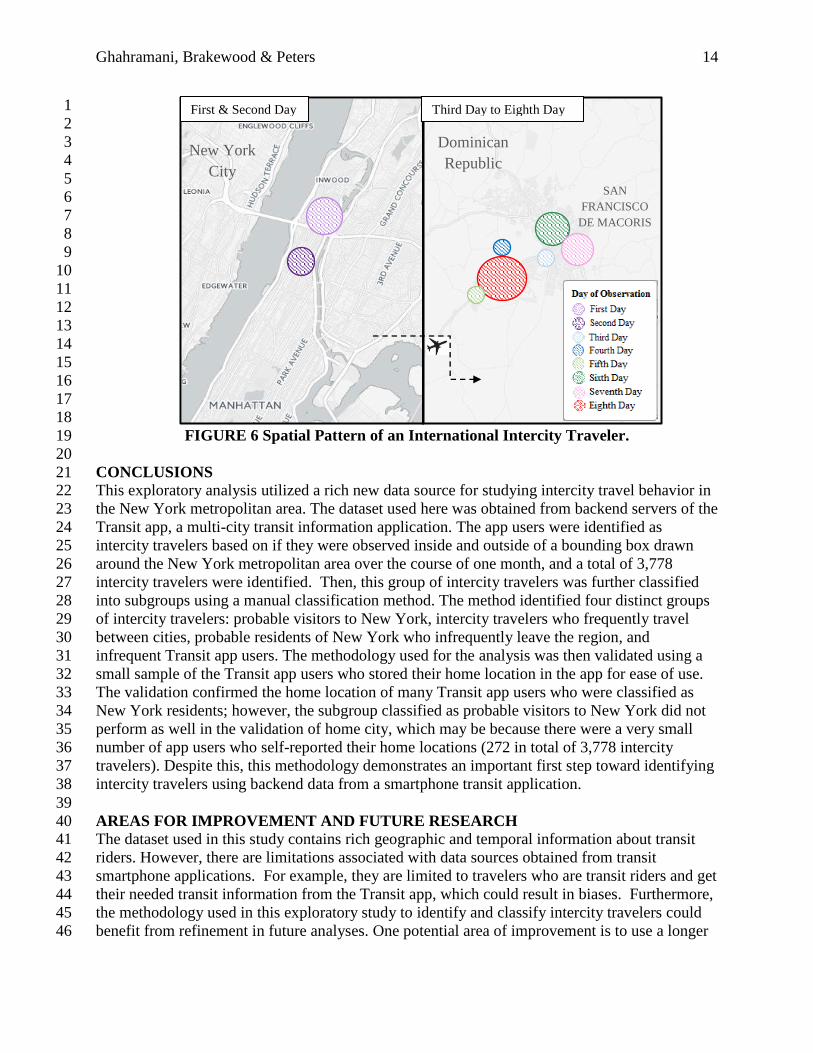
Figure 6 shows the travel behavior of a second intercity traveler, and this traveler made 11
an international trip. This user has records on three days in one month of 2014 in New York and 12
on eight days of the same month in different cities in the Dominican Republic. In Figure 6, each 13
dot represents the user’s aggregated Transit App records during eight days; it should be noted 14
that there were additional records in other cities of the Dominican Republic during the month of 15
study that are not shown. This user was classified as a visitor to New York in the previous 16
analysis, but it is also possible that s/he is resident of New York and visited the Dominican 17
Republic for approximately one week. An interesting fact is that Dominican Republic is not 18
among the coverage areas of the Transit app, and it is unclear why this user has opened the app 19
in a region not supported with transit information. 20
21 22
23
24
25
26
27
28
29
30
31
32
33
34
35
36
37
38
39
40
41
FIGURE 5 Spatial Pattern of an Intercity Traveler in the United States.42
MIAMI
First Day to Fourth Day
Fort Lauderdale Airport
Fourth Day
LaGuardia Airport
Ghahramani, Brakewood & Peters 14
1
2
3
4
5
6
7
8
9
10
11
12
13
14
15
16
17
18
FIGURE 6 Spatial Pattern of an International Intercity Traveler. 19
20
CONCLUSIONS 21 This exploratory analysis utilized a rich new data source for studying intercity travel behavior in 22
the New York metropolitan area. The dataset used here was obtained from backend servers of the 23
Transit app, a multi-city transit information application. The app users were identified as 24
intercity travelers based on if they were observed inside and outside of a bounding box drawn 25
around the New York metropolitan area over the course of one month, and a total of 3,778 26
intercity travelers were identified. Then, this group of intercity travelers was further classified 27
into subgroups using a manual classification method. The method identified four distinct groups 28
of intercity travelers: probable visitors to New York, intercity travelers who frequently travel 29
between cities, probable residents of New York who infrequently leave the region, and 30
infrequent Transit app users. The methodology used for the analysis was then validated using a 31
small sample of the Transit app users who stored their home location in the app for ease of use. 32
The validation confirmed the home location of many Transit app users who were classified as 33
New York residents; however, the subgroup classified as probable visitors to New York did not 34
perform as well in the validation of home city, which may be because there were a very small 35
number of app users who self-reported their home locations (272 in total of 3,778 intercity 36
travelers). Despite this, this methodology demonstrates an important first step toward identifying 37
intercity travelers using backend data from a smartphone transit application. 38
39
AREAS FOR IMPROVEMENT AND FUTURE RESEARCH 40 The dataset used in this study contains rich geographic and temporal information about transit 41
riders. However, there are limitations associated with data sources obtained from transit 42
smartphone applications. For example, they are limited to travelers who are transit riders and get 43
their needed transit information from the Transit app, which could result in biases. Furthermore, 44
the methodology used in this exploratory study to identify and classify intercity travelers could 45
benefit from refinement in future analyses. One potential area of improvement is to use a longer 46
First & Second Day Third Day to Eighth Day
Dominican
Republic New York
City
SAN
FRANCISCO
DE MACORIS
Ghahramani, Brakewood & Peters 15
timeframe (i.e., at least one year) to better capture the Transit app users’ activities, particularly 1
infrequent intercity travel. The manual classification methodology could also be improved if the 2
consecutive number of days in a location is used instead of the count of days inside and outside 3
of a city. For example, if a user is observed in one city on the 3rd, 4th and 5th days of a month and 4
then observed in another city on 10th and 15th days of the same month, it is likely that the user 5
spent three days in the first city and five days in the second city; however, the manual 6
classification method used in this preliminary analysis would not have identified this. Similarly, 7
analysis of travel patterns by days of the week (i.e., weekdays vs. weekends) could provide a 8
better understanding of work-related trips that are likely occurring on weekdays versus leisure 9
trips that are likely occurring on weekends. Another area for future research is to use travel 10
distance to classify intercity travelers. As a further validation method, the results could be 11
compared against a long distance travel survey. Finally, given the multi-regional nature of the 12
Transit app, these methods could be expanded to many other cities in the future. 13
14
ACKNOWLEDGEMENTS 15 The authors acknowledge the Transit app for sharing data, and we are particularly grateful to 16
Jake Sion. This research was supported in part by a 2015 City University of New York (CUNY) 17
Collaborative Incentive Research Grant (CIRG) grant and a 2016 University Transportation 18
Research Center (UTRC) faculty-initiated grant. 19
Ghahramani, Brakewood & Peters 16
REFERENCES
1. Yao, E., and Morikawa, T. A study of on integrated intercity travel demand
model. Transportation Research Part A: Policy and Practice, 39(4), 2005, pp.367-381.
2. LaMondia, J., Aultman-Hall, L. and Greene, E., Long-Distance Work and Leisure Travel
Frequencies: Ordered Probit Analysis Across Non-Distance-Based
Definitions. Transportation Research Record: Journal of the Transportation Research Board
2413, 2014, pp.1-12.
3. LaMondia, J., Moore, M. and Aultman-Hall, L., Modeling Intertrip Time Intervals Between
Individuals’ Overnight Long-Distance Trips. Transportation Research Record: Journal of
the Transportation Research Board 2495, 2015, pp.23-31.
4. Bacon, B. and LaMondia, J.J., Typology of Travelers Based on Their Annual Intercity Travel
Patterns Developed from 2013 Longitudinal Survey of Overnight Travel. Transportation
Research Record: Journal of the Transportation Research Board 2600, 2016, pp.12-19.
5. Bhat, C.R., An endogenous segmentation mode choice model with an application to intercity
travel. Transportation Science, 31(1), 1997, pp.34-48.
6. Outwater, M., Bradley, M., Ferdous, N., Trevino, S. and Lin, H., Foundational Knowledge to
Support a Long-Distance Passenger Travel Demand Modeling Framework: Implementation
Report. Publication DTFH61-10-R-00036. FHWA, U.S. Department of Transportation, 2015.
7. Miller, E., The trouble with intercity travel demand models. Transportation Research
Record: Journal of the Transportation Research Board 1895, 2004, pp.94-101.
8. Bar-Gera, H., Evaluation of a cellular phone-based system for measurements of traffic speeds
and travel times: A case study from Israel. Transportation Research Part C: Emerging
Technologies, 15(6), 2007, pp.380-391.
9. Herrera, J.C., Work, D.B., Herring, R., Ban, X.J., Jacobson, Q. and Bayen, A.M., Evaluation
of traffic data obtained via GPS-enabled mobile phones: The Mobile Century Field
Experiment. Transportation Research Part C: Emerging Technologies, 18(4), 2010, pp.568-
583.
10. Du, J. and Aultman-Hall, L., Increasing the accuracy of trip rate information from passive
multi-day GPS travel datasets: Automatic trip end identification issues. Transportation
Research Part A: Policy and Practice, 41(3), 2007, pp.220-232.
11. Jiang, S., Fiore, G.A., Yang, Y., Ferreira Jr, J., Frazzoli, E. and González, M.C., A review of
urban computing for mobile phone traces: current methods, challenges and opportunities.
In Proceedings of the 2nd ACM SIGKDD international workshop on Urban Computing (p.
2). ACM 2013.
12. Mellegard, E., Moritz, S. and Zahoor, MOrigin/Destination-estimation using cellular network
data. In 2011 IEEE 11th International Conference on Data Mining Workshops (pp. 891-896).
IEEE.2011.
13. Wolf, J., Bachman, W., Oliveira, M., Auld, J., Mohammadian, A.K., Vovsha, P. and Zmud,
J., 2014. Applying GPS data to understand travel behavior, volume II: guidelines (No.
Project 8-89), National Cooperative Highway Research Program.
14. Wu, W., Cheu, E.Y., Feng, Y., Le, D.N., Yap, G.E. and Li, X., 2013. Studying intercity
travels and traffic using cellular network data. Data for Development: Net Mobi 2013.
15. Gur, Y., Bekhor, S., Solomon, C. and Kheifits, L., Intercity person trip tables for nationwide
transportation planning in Israel obtained from massive cell phone data. Transportation
Research Record: Journal of the Transportation Research Board 2121, 2009, pp.145-151.
16. Transit, http://transitapp.com/. Accessed August 1, 2016.
Ghahramani, Brakewood & Peters 17
17. New York Times report, http://www.nytimes.com/2016/03/09/nyregion/record-number-of-
tourists-visited-new-york-city-in-2015-and-more-are-expected-this-year.html?_r=0.
Accessed August 1, 2016.
18. McKenzie, B. and Rapino, M. Commuting the United States: 2009. American Community
Survey Reports, United States Census Bureau, http://www.census.gov/prod/2011pubs/acs-
15.pdf.
19. NYMTC Website, https://www.nymtc.org/. Accessed August 1, 2016.
20. Python Software Foundation, https://www.python.org/. Accessed August 1, 2016.
21. Liu, Y., Li, Z., Xiong, H., Gao, X. and Wu, J., December. Understanding of internal
clustering validation measures. In 2010 IEEE International Conference on Data Mining (pp.
911-916). IEEE. 2010.
22. Morency, C., Trepanier, M. and Agard, B., January. Typology of carsharing members.
In Transportation Research Board 90th Annual Meeting (No. 11-1236), 2011.
23. RStudio Team. RStudio: Integrated Development for R. RStudio, Inc., Boston, MA
http://www.rstudio.com/. Accessed August 1, 2016.