an extensive set of kinematic and kinetic data for
TRANSCRIPT

Research ArticleAn Extensive Set of Kinematic and Kinetic Data forIndividuals with Intact Limbs and Transfemoral Prosthesis Users
Seyed Fakoorian ,1 Arash Roshanineshat,2 Poya Khalaf,3 Vahid Azimi,4 Dan Simon,1
and Elizabeth Hardin5
1Department of Electrical Engineering and Computer Science, Cleveland State University, Cleveland, Ohio 44115, USA2Department of Electrical Engineering and Computer Engineering, University of Arizona, Tucson, AZ 87721, USA3Department of Mechanical Engineering, Cleveland State University, Cleveland, Ohio 44115, USA4Department of Electrical Engineering and Computer Engineering, Georgia Institute of Technology, Atlanta, GA 30313, USA5Motion Study Laboratory, Cleveland VA Medical Center, Cleveland, Ohio 44106, USA
Correspondence should be addressed to Seyed Fakoorian; [email protected]
Received 22 April 2020; Revised 31 July 2020; Accepted 28 September 2020; Published 10 November 2020
Academic Editor: Andrea Cereatti
Copyright © 2020 Seyed Fakoorian et al. This is an open access article distributed under the Creative Commons AttributionLicense, which permits unrestricted use, distribution, and reproduction in any medium, provided the original work isproperly cited.
This paper introduces an extensive human motion data set for typical activities of daily living. These data are crucial for the designand control of prosthetic devices for transfemoral prosthesis users. This data set was collected from seven individuals, including fiveindividuals with intact limbs and two transfemoral prosthesis users. These data include the following types of movements: (1)walking at three different speeds; (2) walking up and down a 5-degree ramp; (3) stepping up and down; (4) sitting down andstanding up. We provide full-body marker trajectories and ground reaction forces (GRFs) as well as joint angles, joint velocities,joint torques, and joint powers. This data set is publicly available at the website referenced in this paper. Data from flexion andextension of the hip, knee, and ankle are presented in this paper. However, the data accompanying this paper (available on theinternet) include 46 distinct measurements and can be useful for validating or generating mathematical models to simulate thegait of both transfemoral prosthesis users and individuals with intact legs.
1. Introduction
A variety of kinematic and kinetic data can be collected dur-ing human motion with a well-equipped gait lab. A rich andwell-organized humanmotion data set can enable research inbiomechanics and bio-inspired control systems and signalprocessing. To develop bio-inspired control systems, mim-icking the reactions and motions of a subject with intact legsis critical. For example, such data can be used for the designof human-like prosthesis control Moore et al. [1]. These datacan also be used to verify controllers that have been designedby other means, such as those constructed from first princi-ples Geyer and Herr [2]. Furthermore, from a medical per-spective, gait data analysis can be used to identify the
overactive or underactive muscles, potential injuries, andwalking inefficiency Keenan et al. [3]; Avni [4].
Human gait data from thousands of human subjectsalready exist, but the majority of these data are not publiclyavailable. There are some notable gait data sets and databasesthat are publicly available. In 1990, DavidWinter published anormative gait data set that is widely used in biomechanicalstudies Winter [5]. These data include only a few subjectsand only a small number of gait cycles per subject, but thissmall gait data set has been important for developing designspecifications, such as in powered prosthetic control Supet al. [6]. The International Society of Biomechanics hasmaintained a website International Society of Biomechanics[7] since 1995 that includes data sets that are available for
HindawiApplied Bionics and BiomechanicsVolume 2020, Article ID 8864854, 13 pageshttps://doi.org/10.1155/2020/8864854

download. Another website, the CGA normative gait data-base Kirtley [8], curates and shares normative clinical gaitdata from multiple labs, which have been used in severalresearch studies. The repeatability of kinematic, kinetic, andelectromyographic data was investigated in Kadaba et al.[9], where 40 adult subjects with intact limbs were evaluatedthree times on each of three different test days while walkingat their preferred speed. That research was followed by thedevelopment of a simple external marker system and algo-rithms for computing lower extremity joint angle motionduring level walking (VICON) Kadaba et al. [10]. The effectof walking speed on gait was considered in Schwartz et al.[11], where three-dimensional gait data was collected on 83children (ages 4-17 years) who were given general instruc-tions to walk at several speeds during a single test session:very slow, slow, self-selected comfortable (free), and fast.Children’s gait was also studied in Bovi et al. [12], whichincludes data from both children and adults (ages 6-72 years)in different gait modes, such as normal walking, toe walking,heel walking, step ascent, and step descent.
More recent examples of biomechanists sharing theirdata through publication include the University of Wiscon-sin at LaCrosse, which has an easily accessible normative gaitdata set from 25 subjects with lower extremity marker datafrommultiple gait cycles, and force plate measurements froma single gait cycle Willson and Kernozek [13]. Other recentresearch van den Bogert et al. [14]; Moore et al. [1] includesthe availability of full-body joint kinematics and kineticsfrom multiple subjects walking on an instrumented tread-mill. That research includes over 7.5 hours of gait data from15 subjects with intact legs and includes over 25,000 gaitcycles. Those data include both perturbed and unperturbedgait cycles; perturbed gait cycles included random treadmillvariations to emulate pushing the subject. Other researchFukuchi et al. [15] includes a dataset of 3D walking kinemat-ics and kinetics from young and older adults with two intactlegs at a range of gait speeds in both treadmill and over-ground environments. The most recent research Hood et al.[16] includes 18 transfemoral prosthesis users walking at var-
ious speeds. This data set was collected using a 10-cameramotion capture system and an instrumented treadmill.
There have been many gait studies, but relatively few arepublicly available at no monetary cost. Many gait data setsare not freely accessible Tirosh et al. [17], although thereare notable exceptions Kirtley [8]. The lower body kinematicdata of single gait cycles from over 100 subjects, whichinclude a substantial amount of raw data, was published inYun et al. [18] but accessing the data requires a monetarycost. In addition, a large gait database comparison, includingone database with kinematic data of 409 gait cycles of chil-dren from 1 to 7 years old, is discussed in Chester et al.[19]. There are also some purely visual gait data sets, likethe one in Makihara et al. [20], which contains videos of sub-jects walking on a treadmill. This database is tightly securedwith an extensive release agreement for reuse.
All gait data that are currently available suffer from oneor more limitations such as too few subjects, gait cycles, orgait types, which limit the possibility of using the data forprosthesis design or other human-machine research. Otherdata sets have restrictive licensing conditions. Currentlyavailable data mostly come from humans with two intact legsduring normal walking on level ground. Although manytransfemoral prosthesis users participated in Hood et al.[16], they only collected walking data and other routineactivities were not considered. In Bergmann et al. [21], onlycontact forces in the hip joint were measured for fourpatients who had hip implants. They collected data from rou-tine activities but the data are not publicly available.
In this paper, an extensive set of data is presented fromhumanmotion in different activities of daily living. Data werecollected from five individuals with intact limbs and twotransfemoral prosthesis users. The subjects walked at threedifferent speeds on a force plate-instrumented treadmill.The key feature of the data we collected is that they are frommany activities of daily living, such as level walking, walkingup and down a five-degree ramp, stepping up and down astep, and sitting down and rising from a chair. Our resultsare publicly available at Fakoorian et al. [22]. We invite other
Table 1: Demographic and anthropometric data for the subjects with intact limbs.
AgeHeight(cm)
Weight(kg)
Left leg length(cm)
Left knee width(cm)
Left ankle width(cm)
Right leg length(cm)
Right kneewidth (cm)
Right anklewidth (cm)
AB01 28 180.3 80.9 90.5 9.4 6.9 90.0 9.4 6.6
AB02 23 185.4 83.2 98.0 10.8 7.6 98.0 10.4 7.5
AB03 22 185.4 80.9 86.0 9.7 7.4 85.0 9.0 7.4
AB04 37 188.0 79.9 98.5 10.4 6.8 97.5 10.4 7.0
AB05 20 171.5 73.9 89.5 9.5 7.0 89.0 9.9 6.7
Table 2: Demographic and anthropometric data for the subjects who were prosthesis users.
AgeHeight(cm)
Weight(kg)
Left leglength (cm)
Left kneewidth (cm)
Left anklewidth (cm)
Right leglength (cm)
Right kneewidth (cm)
Right anklewidth (cm)
Prosthesistype
PRO1 32 174.0 79.1 91.0 9.5 7.2 89.0 7.4 5.2 Ottobock
PRO2 64 177.6 99.2 85.5 11.4 7.6 86.0 7.4 7.4Freedom
innovations
2 Applied Bionics and Biomechanics

Table 3: 47 marker acronym definitions Moore et al. [1].
# Label Name Description
1 LHEAD Left head Just above the ear, in the middle.
2 THEAD Top head On top of the head, in line with the LHEAD and RHEAD.
3 RHEAD Right head Just above the ear, in the middle.
4 FHEAD Forehead Between line LHEAD/RHEAD and THEAD a bit right from center.
5 C7 C7 On the 7th cervical vertebrae.
6 T10 T10 On the 10th thoracic vertebrae.
7 SACR Sacrum bone On the sacral bone.
8 NAVE Navel On the navel.
9 XYPH Xiphoid process Xiphoid process of the sternum.
10 STRN Sternum On the jugular notch of the sternum.
11 BBAC Scapula On the inferior angle of the right scapular.
12 LSHO Left shoulder Left acromion.
13 LDELT Left deltoid muscle Apex of the deltoid muscle.
14 LLEE Left lateral elbow Left lateral epicondyle of the elbow.
15 LMEE Left medial elbow Left medial epicondyle of the elbow.
16 LFRM Left forearm On 2/3 on the line between the LLEE and LMW.
17 LMW Left medial wrist On styloid process radius, thumb side.
18 LLW Left lateral wrist On styloid process ulna, pinky side.
19 LFIN Left fingers Center of the hand. Caput metatarsal 3.
20 RSHO Right shoulder Right acromion.
21 RDELT Right deltoid muscle Apex of deltoid muscle.
22 RLEE Right lateral elbow Right lateral epicondyle of the elbow.
23 RMEE Right medial elbow Right medial epicondyle of the elbow.
24 RFRM Right forearm On 1/3 on the line between the RLEE and RMW.
25 RMW Right medial wrist On styloid process radius, thumb side.
26 RLW Right lateral wrist On styloid process ulna, pinky side.
27 RFIN Right fingers Center of the hand. Caput metatarsal 3.
28 LASIS Pelvic bone left front Left anterior superior iliac spine.
29 RASIS Pelvic bone right front Right anterior superior iliac spine.
30 LPSIS Pelvic bone left back Left posterior superior iliac spine.
31 RPSIS Pelvic bone right back Right posterior superior iliac spine.
32 LGTRO Left greater trochanter of the femur On the center of the left greater trochanter.
33 FLTHI Left thigh On 1/3 on the line between the LFTRO and LLEK.
34 LLEK Left lateral epicondyle of the knee On the lateral side of the joint axis.
35 LATI Left anterior of the tibia On 2/3 on the line between the LLEK and LLM.
36 LLM Left lateral malleolus of the ankle The center of the heel at the same height as the toe.
37 LHEE Left heel Center of the heel at the same height as the toe.
38 LTOE Left toe Tip of big toe.
39 LMT5 Left 5th metatarsal Caput of the 5th metatarsal bone, on joint line midfoot/toes.
40 RGTRO Right greater trochanter of the femur On the center of the right greater trochanter.
41 FRTHI Right thigh On 2/3 on the line between the RFTRO and RLEK.
42 RLEK Right lateral epicondyle of the knee On the lateral side of the joint axis.
43 RATI Right anterior of the tibia On 1/3 on the line between the RLEK and RLM.
44 RLM Right lateral malleolus of the ankle The center of the heel at the same height as the toe.
45 RHEE Right heel Center of the heel at the same height as the toe.
46 RTOE Right toe Tip of big toe.
47 RMT5 Right 5th metatarsal Caput of the 5th metatarsal bone, on joint line midfoot/toes.
3Applied Bionics and Biomechanics

researchers to use the MATLAB source code at the website toreproduce our signal processing results for 46 kinetic andkinematic quantities, including joint angles, joint moments,and joint powers for both left and right legs.
2. Methods
Five individuals with intact limbs and two transfemoral pros-thesis users participated in the study. The research site was
the Motion Studies Laboratory (MSL) at the ClevelandDepartment of Veterans Affairs Medical Center (VAMC) inCleveland, Ohio, whose IRB approved the study. The averageof age, height, and weight of the subjects with intact limbs are26 years, 182.1 cm, and 79.8 kg, respectively. Additionalinformation about the subjects with intact limbs can be foundin Table 1.
The prosthesis users had an average age of 48 years, anaverage height of 175.8 cm, and an average weight of
STRNSTRN
RPISRASIS LASIS
LGTRO
FLTHI
LLEK
LATI
LLMLMT5
LTOERTOERMT5
RLM
RATI
RLEK
FRTHI
RGTROSACR SACR
RPSIS
RGTRO
FRTHI
RLEK
RATI
RLM RMT5RHEELHEE
LLMLMT5
LATI
LLEK
FLTHI
LGTRO
LPSISNAVE
XYPHT10
NAVE
XYPH
RASIS
FRTHI
RLEK
RATI
RLM
RHEE
RMT5RTOE
Figure 1: Marker placement locations on the human body. The 25markers shown were needed for the hip, knee and ankle kinematic,and kinetic calculations, although some subjects in our study worethe full 47-marker set.
Figure 2: Walking kinematics and kinetics were captured on a forceinstrumented treadmill.
Figure 3: Data collection setup for the ramp walking trials.
Figure 4: Data collection setup for the stepping trials: the left figureshows a stepping down trial, and the right figure shows a steppingup trial by a prosthesis user participant.
Figure 5: Data collection setup for the sit-to-stand and stand-to-sittrials.
Table 4: The number of available trials (repetitions) is listed foreach activity except walking. STS indicates stand-to-sit or sit-to-stand. See Tables 5 and 6 for the number of walking trials.
Ramp Step STS
AB01 20 44 5
AB02 38 42 23
AB03 40 46 22
AB04 43 42 29
AB05 44 42 22
PRO1 33 31 21
PRO2 NA NA NA
4 Applied Bionics and Biomechanics

89.2 kg. The first prosthesis user used an X2 microprocessorknee (Ottobock, Duderstadt, Germany) with a Triton foot,and the second prosthesis user used a Plie 3 microprocessorknee (Freedom Innovations, Irvine, California) with ahydraulic foot. Both prosthesis users had their intact limbon the left side and their prosthesis on the right side.Table 2 gives additional details about the transfemoral pros-thesis users.
Joint angles and torques were computed from the construc-tion of an individualized human body model comprising 18body segments and 46 kinematic degrees of freedom. Thehuman body model was based on 47 markers affixed in stan-dard anatomical locations on each individual human subject(Motek, Amsterdam, NL). Acronym definitions of 47 markersare listed in Table 3. A lower body model shown in Figure 1was used for some participants due to their time restrictionsMoore et al. [1]; van den Bogert et al. [14]. The kinetic datameetthe collection and processing guidelines from the InternationalSociety of Biomechanics Derrick et al. [23].
Data were collected under the following conditions: (1)walking at three different speeds on level ground, (2) walkingup and down a ramp with a five-degree slope, (3) stepping uponto a standard-height step and stepping down from thesame step, and (4) sitting down in a standard height chairand standing up from the chair. A 16-camera motion capturesystem (Vicon, Oxford, UK) was used to record the markerpositions at 100Hz. Ground reaction force (GRF) was sam-pled at 1000Hz from several force plates (OR6-7-OP andAccuGait, AMTI, Watertown, Massachusetts; Forcelink BV,Culemborg, Netherlands). Data were collected during stand-ing to initialize each individual human body model. Raw datawere filtered with a 6Hz low-pass filter (second order Butter-worth). Finally, inverse modeling was used to calculatekinetic and kinematic data van den Bogert et al. [14]. Partof the experimental setup for both the participants withintact legs and transfemoral prosthesis user participants dur-ing the walking data collection is shown in Figure 2.
As shown in Figure 3, one force plate was used for collect-ing the ramp walking data, thus one step of GRF data exists
per ramp walking trial in this repository. The joint kinemat-ics presented in this paper are for a sample of joints, andreaders can download and plot additional joint kinematicas well as kinetic data Fakoorian et al. [22].
Stepping up and down trials are shown in Figure 4. Eachtrial consisted of stepping up on, or down from, the forceplate. One force plate was embedded on the top step and cap-tured either the left or the right foot when stepping up; twoforce plates were embedded in the ground and capturedeither the left or right foot upon stepping down.
In the sit-to-stand activity, shown in Figure 5, we col-lected data during the sit-to-stand transition and also duringthe stand-to-sit transition. We collected GRF data from twoforce plates, one under each foot, as shown in Figure 5.
During treadmill walking, shown in Figure 2, GRFs werecollected at 1000Hz using two force plates embedded underthe belts of the treadmills (ADAL3DM-F-COP-Mz, Techma-chine, France; Forcelink, Motek Medical BV, Amsterdam,NL). Research participants walked on the treadmill while datawere recorded for ten, 30-second periods. Kinematic and kinetic
Table 5: The number of trials (repetitions) is listed for each walking speed for the participants with intact limbs. Note that the preferredwalking speed varies with each subject.
Fast walking Preferred speed Slow walking1.25m/s 1.62m/s 1.44m/s 1m/s 1.1m/s 1.15m/s 0.75m/s 0.9m/s 0.86m/s
AB01 10 NA NA 10 NA NA 10 NA NA
AB02 10 NA NA 10 NA NA 10 NA NA
AB03 7 NA NA 10 NA NA 6 NA NA
AB04 NA 7 NA NA 6 NA NA 6 NA
AB05 NA NA 6 NA NA 6 NA NA 6
Table 6: The number of trials is listed for each walking speed for the prosthesis users.
Walking speeds Transition Transition0.6m/s 0.8m/s 1.1m/s From 0.6 to 1.1m/s From 1.1 to 0.6m/s
PRO1 6 3 3 NA NA
PRO2 5 6 5 2 2
Flexion
Flexion
Planter flexion
0–90
Figure 6: Angle convention for hip flexion, knee flexion, and ankleplantar flexion. The vertical axis is zero degrees and the arrowsshow the positive direction. In the normal standing positionshown, the hip angle is 0, the knee angle is 0, and the neutralankle angle is approximately -90 degrees.
5Applied Bionics and Biomechanics

data were collected at each subject’s preferred walking speed,which was determined using previously published methodsDingwell and Marin [24], and which allowed for acclimatingto the treadmill. Data were also collected at slower than pre-ferred speed and faster than preferred speed. All of the researchparticipants had previous treadmill experience.
3. Results
In this section, results are presented for the joint kinematicsand kinetics of each subject. Several movement types werecollected for every participant. Table 4 presents the numberof trials (repetitions) collected for ramp walking, steppingup and stepping down, and sit-to-stand and stand-to-sit.Table 5 shows the number of trials for walking at differentspeeds for participants with intact limbs (AB01-AB05).Walking speed transition data were collected for the transi-tion from standing to fast walking (1.5m/s), and vice versa,but only for AB02 (37 trials). For the prosthesis user partici-pants, Table 6 shows the number of trials for each walkingspeed and for each type of gait transition.
Hip flexion, knee flexion, and ankle plantar flexion forselected gait types and subjects are plotted, but additionaldata is available for all three axes of motion Fakoorianet al. [22]. These results are provided for the right leg foreach subject, except we plot data for the left leg for stepmode. Figure 6 shows the angle convention for hip flexion,
knee flexion, and ankle plantar flexion. Because this is anextensive data set, only a small sample of representativedata is plotted. However, the MATLAB code used to gener-ate the results of this paper is available at Fakoorian et al.[22] and the user can plot all joint angles, joint moments,and joint powers for each trial, each subject, each activityof daily living, and either right or left leg; available dataare summarized in Table 7.
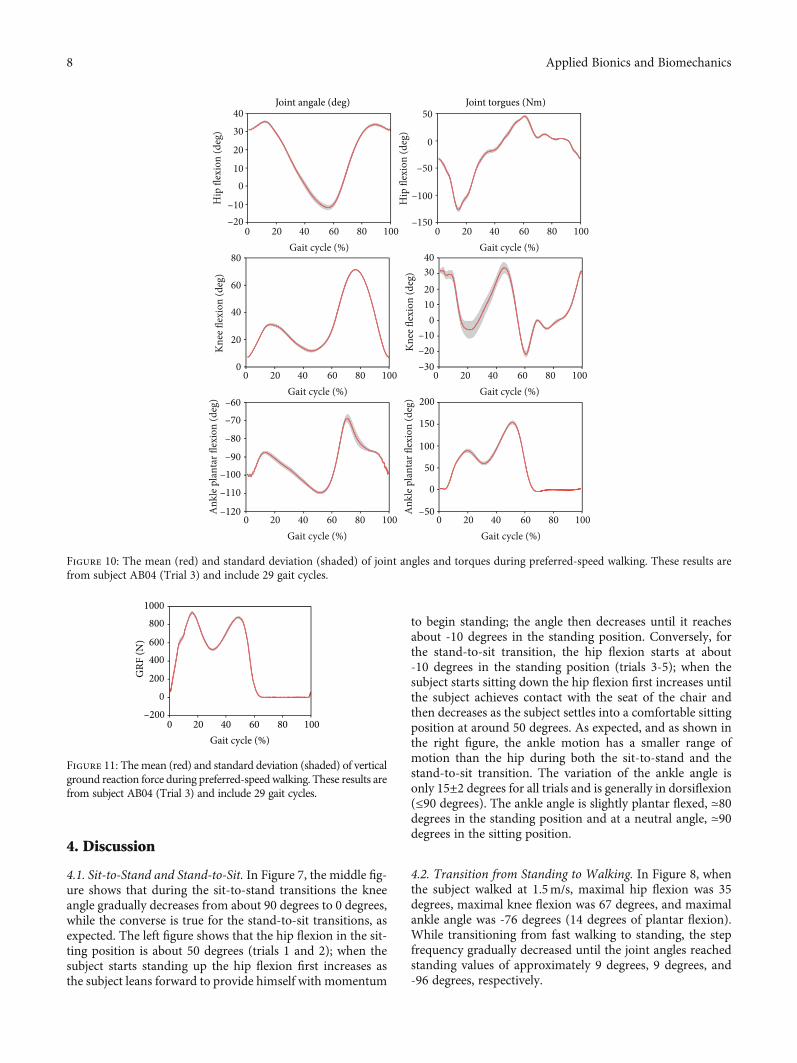
For AB01, Figure 7 shows the data from the sit-to-standand the stand-to-sit trials. As shown, the first two trials aresit-to-stand and the remaining trials are stand-to-sit. Thetransition from standing to fast walking (1.5m/s) and viceversa is presented for trials 22 and 25 for AB02 in Figure 8.Figure 9 displays joint angles when subject AB03 is walkingup and down the ramp. The figure shows that there were fourgait cycles because eight steps were collected during eachramp trial. The two middle gait cycles occurred while thesubject walked on the ramp. For subject AB04, Figure 10shows the average and standard deviation of the sagittalplane joint angles and torques during preferred-speed walk-ing, and Figure 11 shows the average and standard deviationof vertical GRF. Figure 12 shows joint angles from the step-ping up and stepping down trials for subject AB05. Thestep-up data is from trial 4 and is shown in the left columnof the figure. The step-down data is from trial 5 and is shownin the right column of the figure. In both trials, the right leg isthe leading leg and the left leg is the trailing leg.
Table 7: This is a complete list of the kinematic and kinetic measurements that the reader can plot using the database and software atFakoorian et al. [22]. There are a total of 46 kinematic and kinetic measurements that can be plotted for the full-body model.
Pelvis in x direction Head right bend Left/right wrist flexion
Pelvis in y direction Head left twist Left/right hand abduction
Pelvis in z direction Left/right shoulder up Left/right hip flexion
Pelvis yaw Left/right shoulder forward Left/right hip abduction
Pelvis forward pitch Left/right shoulder inward Left/right hip internal rotation
Pelvis right roll Left/right shoulder flexion Left/right knee flexion
Trunk flexion Left/right shoulder abduction Left/right ankle plantar flexion
Trunk right bend Left/right shoulder internal rotation Left/right foot pronation
Trunk left twist Left/right elbow flexion Left/right toe flexion
Head flexion Left/right forearm pronation
–20
0
20
40
60
80
Trial 1 Trial 4Trial 2 Trial 5Trial 3
Hip
flex
ion
(deg
)
0
20
40
60
80
100
Knee
flex
ion
(deg
)
0 1 2 3 4 5Time (s)
0 1 2 3 4 5Time (s)
0 1 2 3 4 5Time (s)
–100
–95
–90
–85
–80
–75
Ank
le p
lant
ar fl
exio
n (d
eg)
Figure 7: The first two trials are sit-to-stand transitions and the other trials are stand-to-sit transitions. These results are taken from subject AB01.
6 Applied Bionics and Biomechanics

Figure 13 shows the joint angles and torques (mean andstandard deviation) for the right leg (prosthesis side) of atransfemoral prosthesis user (PR01), trial 3, over a total of30 strides. The data are from walking at their preferred speedof 0.8m/s. Moreover, Figure 14 shows the vertical GRF(mean and standard deviation) for the same trial. Figure 15shows the joint angles during the transition from slow walk-ing (0.6m/s) to fast walking (1.1m/s), and vice versa, forprosthesis user PRO2. These data are shown in the figurefor trials 21 and 23, respectively.
Next, we compare the spatiotemporal gait parametersbetween the participants with intact limbs and the transfemoralprosthesis users at different walking speeds. A scatter plot com-bined with a box plot is used to visualize the gait parameters inFigures 16–18. Although the gait speed of each subject is differ-ent, scatter plots show the average of the gait parameters foreach individual trial for each subject, while the box plots showthe ranges of the parameters. The results are distinguishablebased on the gait speed of each subject. The gait parametersinclude stride frequency, stride length, and stride width.
0 2 4 6 8 10 12Time (s)
0 2 4 6 8 10 12Time (s)
0 2 4 6 8 10 12Time (s)
0 2 4 6 8 10 12Time (s)
0 2 4 6 8 10 12Time (s)
0 2 4 6 8 10 12Time (s)
Walking to standingStanding to standing
–10
0
10
20
30
40
Hip
flex
ion
(deg
)–10
0
10
20
30
40
Hip
flex
ion
(deg
)
010203040506070
Knee
flex
ion
(deg
)
010203040506070
Knee
flex
ion
(deg
)
–110
–100
–90
–80
–70
Ank
le p
lant
ar fl
exio
n (d
eg)
–110–105–100–95–90–85–80–75
Ank
le p
lant
ar fl
exio
n (d
eg)
Figure 8: The left figures show the joint angles during the transition from standing to fast walking at 1.5m/s (trial 22), and the right figuresshow the transition from fast walking at 1.5m/s to standing (trial 25). These results are taken from subject AB02.
0 2 4 6 8Time (s)
0 2 4 6 8Time (s)
0 2 4 6 8Time (s)
–40–30–20–10
0102030
Hip
flex
ion
(deg
)
UpDown
–20
0
20
40
60
80
Knee
flex
ion
(deg
)
–100
–90
–80
–70
–60
–50
Ank
le p
lant
ar fl
exio
n (d
eg)
Figure 9: Joint angles during walking up the ramp (trial 9) and down the ramp (trial 10). These results are taken from subject AB03.
7Applied Bionics and Biomechanics
4. Discussion
4.1. Sit-to-Stand and Stand-to-Sit. In Figure 7, the middle fig-ure shows that during the sit-to-stand transitions the kneeangle gradually decreases from about 90 degrees to 0 degrees,while the converse is true for the stand-to-sit transitions, asexpected. The left figure shows that the hip flexion in the sit-ting position is about 50 degrees (trials 1 and 2); when thesubject starts standing up the hip flexion first increases asthe subject leans forward to provide himself with momentum
to begin standing; the angle then decreases until it reachesabout -10 degrees in the standing position. Conversely, forthe stand-to-sit transition, the hip flexion starts at about-10 degrees in the standing position (trials 3-5); when thesubject starts sitting down the hip flexion first increases untilthe subject achieves contact with the seat of the chair andthen decreases as the subject settles into a comfortable sittingposition at around 50 degrees. As expected, and as shown inthe right figure, the ankle motion has a smaller range ofmotion than the hip during both the sit-to-stand and thestand-to-sit transition. The variation of the ankle angle isonly 15±2 degrees for all trials and is generally in dorsiflexion(≤90 degrees). The ankle angle is slightly plantar flexed, ≃80degrees in the standing position and at a neutral angle, ≃90degrees in the sitting position.
4.2. Transition from Standing to Walking. In Figure 8, whenthe subject walked at 1.5m/s, maximal hip flexion was 35degrees, maximal knee flexion was 67 degrees, and maximalankle angle was -76 degrees (14 degrees of plantar flexion).While transitioning from fast walking to standing, the stepfrequency gradually decreased until the joint angles reachedstanding values of approximately 9 degrees, 9 degrees, and-96 degrees, respectively.
Joint angale (deg) Joint torgues (Nm)
–20
–120
–110
–100–90
–80
–70–60
–10
010
0 20 40 60Gait cycle (%)
80 100 0 20 40 60Gait cycle (%)
80 100
0 20 40 60Gait cycle (%)
80 100 0 20 40 60Gait cycle (%)
80 100
0 20 40 60Gait cycle (%)
80 100 0 20 40 60Gait cycle (%)
80 100
20
30
40
0
20
40
60
80
Hip
flex
ion
(deg
)–150
–100
–50
0
50
Hip
flex
ion
(deg
)
Knee
flex
ion
(deg
)
–30–20–10
010203040
Knee
flex
ion
(deg
)
Ank
le p
lant
ar fl
exio
n (d
eg)
–50
50
100
150
200
0
Ank
le p
lant
ar fl
exio
n (d
eg)
Figure 10: The mean (red) and standard deviation (shaded) of joint angles and torques during preferred-speed walking. These results arefrom subject AB04 (Trial 3) and include 29 gait cycles.
–200
200
400
0 20 40 60Gait cycle (%)
80 100
GRF
(N) 600
8001000
0
Figure 11: The mean (red) and standard deviation (shaded) of verticalground reaction force during preferred-speed walking. These results arefrom subject AB04 (Trial 3) and include 29 gait cycles.
8 Applied Bionics and Biomechanics

4.3. Ramp Walking. In Figure 9, the subject’s hip flexion andankle plantar flexion were greater when the subject walked upthe ramp compared to when the subject walked down theramp. However, knee flexion while walking down the rampappears to be about the same as knee flexion while walkingup the ramp. The first and fourth gait cycles occurred duringlevel-ground walking before and after the ramp. As expected,the peak flexion angles of the first stride during ramp-upwalking were similar to the last stride during ramp-downwalking, and the peak flexion angles of the first stride duringramp-down walking were similar to those of the last strideduring ramp-up walking.
4.4. Participants with Intact Limbs Walking at PreferredSpeed. In Figure 10, the ankle torque was greater thanthe hip and knee torques between 20% and 60% of thegait cycle, showing the large amount of torque neededby the ankle during normal gait. Of all the joint torques,the knee torque had the largest standard deviation duringthe first half of the gait cycle, the stance phase, whichdemonstrates the relatively high stride-to-stride variationof knee torque. During most of the gait cycle and for
most of the quantities shown in the figure, the standarddeviations are very low, showing the high level of repeat-ability for this subject’s gait. The knee joint has the larg-est range of motion and peaks at about 75 degrees 80%through the gait cycle, when the subject lifts his leg offthe ground and needs more knee flexion to achieve toeclearance during the swing phase. The figure shows, asexpected, that the stance phase comprises about 60% ofthe gait cycle.
Figure 11 shows a typical vertical GRF curve with twopeaks that occur at heel strike and toe-off near the begin-ning and end of the stance phase. As with most of thejoint angle and torque data, the GRF standard deviationis very low, showing the high level of repeatability forthis subject’s gait.
4.5. Stepping Up and Stepping Down. Figure 12 shows thatwhen the subject stepped up, the leading leg had more hipflexion (58 degrees) and knee flexion (95 degrees) than thetrailing leg (33 degrees and 78 degrees, respectively), butmore ankle plantar flexion was exhibited in the trailing leg(-44 degrees vs. -74 degrees). When stepping down, the
–100
102030405060
Stepping up Stepping down
Hip
flex
ion
(deg
)–10
0102030405060
Hip
flex
ion
(deg
)
–20
0
20
40
60
80
100
Knee
flex
ion
(deg
)
–20
0
20
40
60
80
100
Knee
flex
ion
(deg
)
0 2 4 6 8Time (s)
0 2 31 4 5 6Time (s)
0 2 4 6 8Time (s)
0 2 31 4 5 6Time (s)
0 2 4 6 8Time (s)
0 2 31 4 5 6Time (s)
–110–100–90–80–70–60–50–40
Ank
le p
lant
ar fl
exio
n (d
eg)
–110–100–90–80–70–60–50–40
Ank
le p
lant
ar fl
exio
n (d
eg)
Right legLeft leg
Figure 12: Joint angles during stepping up (left figures, trial 4) and stepping down (right figures, trial 5). The right leg is the leading leg and theleft leg is the trailing leg for both trials. These results are from subject AB05.
9Applied Bionics and Biomechanics

leading hip and knee joint flexion (25 degrees and 53degrees, respectively) were smaller than during the step-uptrial (58 degrees and 95 degrees, respectively), but the lead-ing ankle joint plantar flexion during step-down (-42degrees) was larger than during step-up (-74 degrees). Whenstepping down, the trailing leg knee flexion is greater thanthe leading leg knee flexion (95 degrees vs. 53 degrees), butthe trailing leg ankle plantar flexion is less than in the lead-ing leg (bottom right figure). As expected, knee flexion was
greater than both hip flexion and ankle plantar flexion inboth the leading and trailing legs during both steppingmodes. Maximum knee flexion during stepping up was 95degrees and 80 degrees for the leading and trailing legs,respectively; and during stepping down, it was 53 degreesand 96 degrees, respectively.
4.6. Prosthesis User Walking at Preferred Speed. In Figure 13,in agreement with previous research, there is very little kneeflexion during stance Sup et al. [6]; Brandt et al. [25]. Compar-ing Figures 13 and 14 with Figures 10 and 11, some differencesare evident between the gait of a subject with intact legs and aprosthesis user. For the prosthesis user, the standard devia-tions of joint angles and joint torques were greater than thoseof the subject with intact legs (AB04). The standard deviationof the vertical GRF is similar for both the prosthesis user andthe subject with intact legs, but the average vertical GRF ofthe subject with intact legs is greater than that of the prosthesisuser, which agrees with previous observations that prosthesisusers placemore weight on their intact side than on their pros-thesis Koehler-McNicholas et al. [26]. That is, the maximumvertical GRF in the mid-stance phase is 930N for the subjectwith intact limbs, but only 815N for the transfemoral prosthe-sis user. This difference occurs in spite of the fact that AB04and PR01 have a similar body mass (see Tables 1 and 2).
Joint angale (deg) Joint torgues (Nm)
–120
–110
–100–90
–80
–70–60
–10
–20
0
10
0 20 40 60Gait cycle (%)
80 100 0 20 40 60Gait cycle (%)
80 100
0 20 40 60Gait cycle (%)
80 100 0 20 40 60Gait cycle (%)
80 100
0 20 40 60Gait cycle (%)
80 100 0 20 40 60Gait cycle (%)
80 100
20
30
40
0
20
40
60
80
Hip
flex
ion
(deg
)–40
–20
0
60
40
20
Hip
flex
ion
(deg
)
Knee
flex
ion
(deg
)
–10–20
01020304050
Knee
flex
ion
(deg
)
Ank
le p
lant
ar fl
exio
n (d
eg)
–20
20406080
120100
0
Ank
le p
lant
ar fl
exio
n (d
eg)
Figure 13: The mean (red) and standard deviation (shaded) of joint angles and torques for transfemoral prosthesis user PRO1, trial 3, duringthe preferred walking speed of 0.8m/s. The mean and standard deviation are calculated over 30 gait cycles.
–200
200
400
0 20 40 60Gait cycle (%)
80 100
GRF
(N) 600
8001000
0
Figure 14: The mean (red) and standard deviation (shaded) ofvertical GRF for the prosthesis user PRO1, trial 3, during thepreferred walking speed of 0.8m/s. The mean and standarddeviation are calculated over 30 gait cycles.
10 Applied Bionics and Biomechanics

The joint angle and joint torque profiles also have differentranges. Part of this differencemay be due to the different walk-ing speeds (1.1m/s for the subject with intact legs and 0.8m/s
for the prosthesis user). Throughout the gait cycle, the hipflexion is about the same, but the knee flexion and ankle plan-tar flexion are smaller for PR01 than for AB04. More joint
0 5 10 15Time (s)
0 5 10 15Time (s)
0 5 10 15Time (s)
0 5 10 15Time (s)
0 5 10 15Time (s)
0 5 10 15Time (s)
Fast to slow walkingSlow to slow walking
–20
0
20
–10
1020
3040
50
0
40
60
80
Knee
flex
ion
(deg
)
–20
0
20
40
60
80
Knee
flex
ion
(deg
)
Hip
flex
ion
(deg
)–10
1020
3040
50
0Hip
flex
ion
(deg
)
–110–120
–100–90–80–70–60–50
Ank
le p
lant
ar fl
exio
n (d
eg)
–110–120
–100–90–80–70–60–50
Ank
le p
lant
ar fl
exio
n (d
eg)
Figure 15: Joint angles of transfemoral prosthesis user PR02 during the transition from slow (0.6m/s) to fast (1.1m/s) walking (left figures),and vice versa (right figures). The left figures are taken from trial 21 and the right figures are taken from trial 23.
Slow walking
0.6
0.65
0.7
0.75
0.8
0.85
0.9
0.95
1
Normal walking
0.6
0.65
0.7
0.75
0.8
0.85
0.9
0.95
1
A T A T A TFast walking
0.6
0.65
0.7
0.75
0.8
0.85
0.9
0.95
1
Strid
e fre
quen
cy (H
Z)
Figure 16: Stride frequency of participants with intact limbs and prosthesis users at three speeds with the normal speed being their preferredspeed. The data from participants with intact limbs is shown on the left (A) and transfemoral prosthesis user data is shown on the right (T) ineach pair. The figure shows the median, along with a box that bounds the first and third quartiles of the data, and whiskers that bound theentire range of the data (apart from outliers). Moreover, the scatter plot shows the average stride frequency of each trial. The data for eachsubject are color-coded: yellow = AB01, green = AB02, red = AB03, blue = AB04, purple = AB05, brown = PR01, and gray = PR02.
11Applied Bionics and Biomechanics

torque is also needed for all joints for AB04, especially for theknee joint after about 60% through the gait cycle.
4.7. Prosthesis User Transition from Slow to Fast Walking. InFigure 15, the peak angles gradually increased during the slow-to-fast transition (left figures) and gradually decreased duringthe fast-to-slow transition (right figures). The knee angle hadthe greatest flexion of all the joints at the end of the slow-to-fast transition, when it flexed to 70 degrees (left middle figure).The ankle angle did not have much variation and its magni-tude varied by less than 35 degrees peak-to-peak.
4.8. Comparison of Gait Parameters. One can see fromFigures 16–18 that walking speed is directly related to changes
in stride frequency, length, and width in the participants withintact limbs and the variations of the stride parameters changein a predictable way with walking speed. However, for thetransfemoral prosthesis users, we do not see such predictablechanges in the gait parameter variations with respect to walk-ing speed. In general, the variation of the stride parameters isgreater in the participants with intact limbs than in the pros-thesis users, especially for stride width. The maximum stridelength is about 1.8m for the subjects with intact legs, but only0.97m for the prosthesis users. This could have been expectedbecause the maximum speed of the prosthesis users is less thanthat of any of the subjects with intact legs.
This paper presents an extensive human motion data setfrom individuals with intact limbs and transfemoral prosthesis
Slow walking
0.80.9
11.11.21.31.41.51.61.71.8
Normal walking
0.80.9
11.11.21.31.41.51.61.71.8
A T A T A TFast walking
0.80.9
11.11.21.31.41.51.61.71.8
Strid
e len
gth
(m)
Figure 17: Stride length of participants with intact limbs and prosthesis users at three speeds with the normal speed being their preferredspeed. The data from participants with intact limbs is shown on the left (A) and transfemoral prosthesis user data is shown on the right(T) in each pair. The figure shows the median, along with a box that bounds the first and third quartiles of the data, and whiskers thatbound the entire range of the data (apart from outliers). Moreover, the scatter plot shows the average stride length of each trial. The datafor each subject are color-coded: yellow = AB01, green = AB02, red = AB03, blue = AB04, purple = AB05, brown = PR01, and gray = PR02.
Slow walking
0.1
0.2
0.3
0.4
0.5
0.6
0.7
0.8
Normal walking
0.1
0.2
0.3
0.4
0.5
0.6
0.7
0.8
A T A T A TFast walking
0.1
0.2
0.3
0.4
0.5
0.6
0.7
0.8
Strid
e wid
th (m
)
Figure 18: Stride width of participants with intact limbs and prosthesis users at three speeds with the normal speed being their preferredspeed. The data from participants with intact limbs is shown on the left (A) and transfemoral prosthesis user data is shown on the right(T) in each pair. The figure shows the median, along with a box that bounds the first and third quartiles of the data, and whiskers thatbound the entire range of the data (apart from outliers). Moreover, the scatter plot shows the average stride width of each trial. The datafor each subject are color-coded: yellow = AB01, green = AB02, red = AB03, blue = AB04, purple = AB05, brown = PR01, and gray = PR02.
12 Applied Bionics and Biomechanics

users. These data include walking at different speeds, walkingup and walking down a 5-degree ramp, stepping up and step-ping down from a step, and sitting down and rising from achair. Our data set is free and available (along with plottingsoftware) at Fakoorian et al. [22], where the reader can repro-duce the results of this paper and can also plot ground reactionforces, joint kinematics, and joint kinetics.
These data can be used for generating or validating math-ematical models for the simulation of periodic human gait.They can also be useful for developing human-mimickingprosthesis controllers for prosthesis users.
Data Availability
Our data and the MATLAB code used to generate the resultsof this paper is available at http://embeddedlab.csuohio.edu/prosthetics/research/gaitdata.html
Conflicts of Interest
The authors declare that they have no conflicts of interest.
Acknowledgments
This work was supported by NSF grant 1344954.
References
[1] J. K. Moore, S. K. Hnat, and A. J. van den Bogert, “An elaboratedata set on human gait and the effect of mechanical perturba-tions,” PeerJ, vol. 3, article e918, 2015.
[2] H. Geyer and H. Herr, “A muscle-reflex model that encodesprinciples of legged mechanics produces human walkingdynamics and muscle activities,” IEEE Transactions on NeuralSystems and Rehabilitation Engineering, vol. 18, no. 3, pp. 263–273, 2010.
[3] M. A. Keenan, A. Esquenazi, and N. H. Mayer, “The use of lab-oratory gait analysis for surgical decision making in personswith upper motor neuro syndromes,” Physical Medicine andRehabilitation, vol. 16, no. 2, p. 249, 2002.
[4] C. M. C. Avni, Pelvic floor muscle function during gait, PhDthesis, Stellenbosch University, Stellenbosch, 2017.
[5] D. A. Winter, Biomechanics and Motor Control of HumanMovement, John Wiley & Sons, Hoboken, New Jersey, 2009.
[6] F. Sup, A. Bohara, and M. Goldfarb, “Design and control of apowered transfemoral prosthesis,” International Journal ofRobotics Research, vol. 27, no. 2, pp. 263–273, 2008.
[7] International Society of Biomechanics, Biomechanical DataResources, 1990, http://isbweb.org/data.
[8] C. Kirtley, CGA normative gait database, 2014, http://www.clinicalgaitanalysis.com/data.
[9] M. Kadaba, H. Ramakrishnan, M. Wootten, J. Gainey,G. Gorton, and G. Cochran, “Repeatability of kinematic, kinetic,and electromyographic data in normal adult gait,” Journal ofOrthopaedic Research, vol. 7, no. 6, pp. 849–860, 1989.
[10] M. P. Kadaba, H. Ramakrishnan, and M. Wootten, “Measure-ment of lower extremity kinematics during level walking,” Jour-nal of Orthopaedic Research, vol. 8, no. 3, pp. 383–392, 1990.
[11] M. H. Schwartz, A. Rozumalski, and J. P. Trost, “Theeffect of walking speed on the gait of typically developing
children,” Journal of Biomechanics, vol. 41, no. 8,pp. 1639–1650, 2008.
[12] G. Bovi, M. Rabuffetti, P. Mazzoleni, and M. Ferrarin, “Amultiple-task gait analysis approach: kinematic, kinetic andEMG reference data for healthy young and adult subjects,”Gait & Posture, vol. 33, no. 1, pp. 6–13, 2011.
[13] J. Willson and T. Kernozek, Gait data collected at University ofWisconsin- LaCrosse, 2014, https://www.innsport.com/related-products/data-sets/339uw-l-gait-data-set.aspx.
[14] A. J. van den Bogert, T. Geijtenbeek, O. Even-Zohar,F. Steenbrink, and E. C. Hardin, “A real-time system for bio-mechanical analysis of human movement and muscle func-tion,” Medical & Biological Engineering & Computing,vol. 51, no. 10, pp. 1069–1077, 2013.
[15] C. A. Fukuchi, R. K. Fukuchi, and M. Duarte, “A public datasetof overground and treadmill walking kinematics and kineticsin healthy individuals,” PeerJ, vol. 6, article e4640, 2018.
[16] S. Hood, M. K. Ishmael, A. Gunnell, K. Foreman, and T. Lenzi,“A kinematic and kinetic datase of 18 above-knee amputeeswalking at various speeds,” Scientific Data, vol. 7, no. 1,pp. 1–8, 2020.
[17] O. Tirosh, R. Baker, and J. McGinley, “Gaitabase: web-basedrepository system for gait analysis,” Computers in Biologyand Medicine, vol. 40, no. 2, pp. 201–207, 2010.
[18] Y. Yun, H.-C. Kim, S. Y. Shin, J. Lee, A. D. Deshpande, andC. Kim, “Statistical method for prediction of gait kinematicswith Gaussian process regression,” Journal of biomechanics,vol. 47, no. 1, pp. 186–192, 2014.
[19] V. L. Chester, M. Tingley, and E. N. Biden, “Comparison oftwo normative paediatric gait databases,” Dynamic Medicine,vol. 6, no. 1, p. 8, 2007.
[20] Y. Makihara, H. Mannami, A. Tsuji et al., “The OU-ISIRgait database comprising the treadmill dataset,” IPSJ Trans-actions on Computer Vision an Applications, vol. 4, pp. 53–62, 2012.
[21] G. Bergmann, G. Deuretzbacher, M. Heller et al., “Hip contactforces and gait patterns from routine activities,” Journal of Bio-mechanics, vol. 34, no. 7, pp. 859–871, 2001.
[22] S. Fakoorian, A. Roshanineshat, P. Khalaf, V. Azimi,E. Hardin, and D. Simon, An Extensive Set of Kinematic andKinetic Human Gait Data for Able-bodied an TransfemoralAmputee Subjects, 2019, http://embeddedlab.csuohio.edu/prosthetics/research/gaitdata.html.
[23] T. R. Derrick, A. J. van den Bogert, A. Cereatti, R. Dumas,S. Fantozzi, and A. Leardini, “ISB recommendations on thereporting of intersegmental forces and moments duringhuman motion analysis,” Journal of Biomechanics, vol. 99,p. 109533, 2020.
[24] J. B. Dingwell and L. C. Marin, “Kinematic variability and localdynamic stability of upper body motions when walking at dif-ferent speeds,” Journal of Biomechanics, vol. 39, no. 3, pp. 444–452, 2006.
[25] A. Brandt, Y. Wen, M. Liu, J. Stallings, and H. H. Huang,“Interactions between transfemoral amputees and a poweredknee prosthesis during load carriage,” Scientific Reports,vol. 7, no. 1, p. 14480, 2017.
[26] S. R. Koehler-McNicholas, R. D. Lipschutz, and S. A. Gard,“The biomechanical response of persons with transfemoralamputation to variations in prosthetic knee alignment duringlevel walking,” Journal of Rehabilitation Research and Develop-ment, vol. 53, no. 6, pp. 1089–1106, 2016.
13Applied Bionics and Biomechanics