an hypertestual tool for comfort design · a hypertextual tool for comfort design marco filippi,...
TRANSCRIPT

A HYPERTEXTUAL TOOL FOR COMFORT DESIGN
Marco Filippi, Arianna Astolfi, Gabriele Piccablotto Dipartimento di Energetica,
Politecnico di Torino Torino, Italy
ABSTRACT Environmental comfort is usually overlooked during both the design and the construction of a building. This may be due to inadequate understanding of the subject on the part of designers and builders, or to a lack of information concerning predictive design methods, the extent to which comfort requirements can be included in the contract specifications, and the methods and tools available for checking whether the results expected are achieved. A hypertextual tool devised to familiarise architects with the issues relating to the quality of an indoor environment is presented. Reference has been made to the latest rational theories about thermal, visual, acoustic and olfactory comfort in the preparation of data packages that are easy to consult in accordance with a hypertext logic, and are coupled with congruent calculation routines related to these theories for the execution of design and checking operations. User-friendly visualisation of the results has been adopted to make the comfort index data easier to understand. 1. INTRODUCTION The ISO 9000 standards state that the quality of a building can be considered as the sum of the properties and characteristics that enable it to satisfy the needs of its occupant. Primary importance is thus attached to the quality of an environment, this being understood as the set of properties and characteristics through which it meets an occupant's thermal, visual, acoustic and olfactory comfort requirements. Despite its decisive influence on an occupant's assessment of the acceptability of the confined space in which he lives or works, however, this quality is usually overlooked during both the design and the construction of a building. This may be due to inadequate understanding of the subject on the part of designers and builders, or to a lack of information concerning predictive design methods, the extent to which comfort requirements can be included in the contract specifications, and the methods and tools available for checking whether the results expected are achieved. We have been for some time engaged on an applied research project designed to provide cognitive, procedural and operating tools to serve the building process, especially in the design and works inspection stages, and to render those engaged in this process aware of the ways and means by which environmental comfort can be concretely designed and measured.
1
We are, in fact, convinced that as long as the basic knowledge and calculation methods remain in the hands of a few experts designers, no widespread improvement will be obtained in building quality, nor will it be possible to assess the validity of the theories of comfort elaborated in recent years with reference to different configuration of buildings and building services. With this aim this paper describes the work so far achieved and in progress in the elaboration of a hypertext to help building designers tackle questions of thermal, visual, acoustic and olfactory comfort. This tool both updates them and shows them the outcome of any solution they may think of adopting. It is based at this stage on the following simplifying criteria: - use is made of theories that relate human beings to their physical (thermal, visual, acoustic and olfactory) environment, irrespective of the way in which the parameters describing such environment are obtained; - visual and olfactory comfort are examined in the light of recent theories that still await validation, since greater attention is paid to the rationality of a methodological approach than its scientific soundness; - in the absence of any significant scientific results on the subject, overall environmental comfort is regarded as reached when, thermal, visual, acoustic and olfactory comfort are all individually achieved; - only "moderate environments" are considered, i.e. confined spaces in which the values of the physical quantities involved and the behaviour patterns of the occupants are not so extreme as to make it necessary to talk about a health risk rather than simple discomfort. 2. THE THEORETICAL BACKGROUND UThermal comfortU. A turning point in research on thermal comfort was reached in the early 1970s when Fanger (1) moved away from the static processing of experimental data, and hence the confinement of their applicability to the range of the physical variables used in a given experiment, to an examination of both energy exchanges between the human body and its environment and the feelings of discomfort experienced by its individual parts. Imposing certain limitative conditions, of which the thermal steady-state in which the heat exchanges between the human body and environment occur, he worked out a comfort equation expressing the thermal equilibrium of a subject in function of six parameters: the thermal insulation of his clothing, his metabolic rate, the temperature, the velocity and the relative humidity of the air, and the mean radiant temperature. He then used this equation to create a predicted mean vote (PMV) index to provide an a priori evaluation of the thermal sensation felt by a large number of persons in a given environment. The PMV was the first thermal comfort index to make simultaneous use of these two personal and four microclimate variables. It also led to the elaboration of the predicted percentage of dissatisfied (PPD) persons index. The rational nature of this method and the simplicity of its calculations resulted in the adoption of both indices in ISO standard 7730 (2) for the evaluation of moderate thermal environments. Contemporary studies in the U.S. by Gagge et al. resulted in the formulation of a new effective temperature (ET) scale (3). This was widely employed during the
2

1970s despite its limited applicability. It combines, as with the PMV index, both microclimate and personal variables to supply a value corresponding to a particular thermal state of the body. The American Society of Heating, Refrigerating and Air Conditioning Engineers (ASHRAE) global comfort standard 55-92 is based on the ET (4). Like the ISO standard, however, it also takes account of intervals of acceptability relating to local thermal discomfort, particularly asymmetric thermal radiation, contact with warm or cold floors, draught and vertical air temperature gradient. UAcoustic comfort. Many experiments have been performed to evaluate the acoustic quality of an environment, this being understood as the discomfort caused by noise in the sense of unwanted sound. The numerous evaluation criteria proposed, however, are neither definitive nor entirely satisfactory owing to the intrinsic complexity of each situation and the impossibility of applying the rational, quantitative approach used in recent investigations of thermal comfort. Omitting the complex subject of the acoustic quality indices of a concert hall, the attention is thus directed to speech communication and indices for assessment of the discomfort provoked by noise in "moderate" environments, such as homes and offices. One of the earliest indices used to quantify the discomfort caused by noise was the articulation index (AI). This was devised at the end of the 1940s in the laboratories of the Bell Telephone Co. as a means of assessing the quality of phone conversations, and was thus based on evaluation of the loss of speech intelligibility (5). As eventually extended to ordinary conversations by Beranek, the AI expresses the percentage of intelligibility of voice transmission between a speaker and a listener at a known distance apart in function of the ratio between the sound level of the speech and that of the background noise, appropriately "weighted" at the different frequencies involved. The AI, however, was difficult to apply. It was therefore partly modified and replaced by similar indices, such the SIL (speech interference level). This and an updated AI - the MAI (modified articulation index) - have formed the subject of a proposed ISO standard (DIS 9921) for the ergonomic evaluation of speech communication (6). The speech transmission index (STI) is a more scientific tool. It is based on quantification of speech intelligibility by means of a modulation transfer function that regards the environment as a low-pass filter acting on the voice signal, and was introduced by Houtgast & Steeneken in 1973 (7). A subsequent development has been the RASTI (rapid speech transmission index). This is conceptually the same as the STI, but easier to evaluate. UVisual comfort. Here, too, it has proved hard to define a comfort index founded solely on physical premises. Expression of the quantities involved in energetic terms alone, in fact, is of little significance in determining what people "feel" when they see. Research on lighting has a long history and has been primarily conducted in the English-speaking countries. Initially, the absence of visual comfort was mainly attributed to the glare produced by the excessive luminance of an environment's natural or artificial light sources. Investigation of "apparent brightness" by Hopkinson (8) and then by others in the 1950s, together with Waldram's use of geometrical diagrams to represent the luminous environment to be able to describe the
3
distribution of luminances (9), have since been followed by the current glare indices formulated by the CIE (10), the CISBE (11) and the IES (12). That introduced by the IES in the 1960s is of particular methodological interest. Known as the visual comfort probability (VCP) index, it is a significant attempt to determine the percentage of satisfied persons in a group exposed to a luminous environment. Even so, it is still confined to the question of glare. The absence of a comprehensive visual comfort index embracing the photometric quantities involved in the designing of buildings led Bean & Bell (13) to formulate their comfort, satisfaction and performance (CSP) index in accordance with the CIBSE's recommendations. Published in 1992, this index has not yet been validated and is for the moment limited to artificial lighting, but may be expected to be of importance in lighting design. It correlates horizontal and cylindrical illuminance on with the glare and colour rendering indices of lamps to provide another PPD. UOlfactory comfort. In the 19th century, people were seen as the sole source of pollution in confined spaces and the main purpose of ventilation was to dilute the toxic substances they emanated. At the beginning of the 20th, attention shifted to lowering the risk of contracting contagious diseases by reducing the concentration of micro-organisms, once again with people as the principal source. It was not until Yaglou's initial studies of indoor air quality in 1935 (14) that ventilation requirements were directed to providing olfactory comfort and thus based on perception of the air as "acceptable". By contrast with what has been done in industry, however, air purity in a civil environment has long been regarded as a matter of little consequence. Solutions have often been sought through a prescriptive approach, in which the ventilation rate is determined solely by the type of environment and the number of occupants, these being regarded (as usual) as the sole source of pollution. It is only during the last thirty years that closer studies of the effects of individual pollutants on human health have resulted in an approach based on their "performance" and hence the establishment of their maximum concentrations. The ASHRAE standard 62-1989 on building ventilation, in fact, takes account of both approaches (15). Fanger (16) has also made a notable contribution to the assessment of olfactory comfort through his use of the "performance" approach, from a perceptive point of view, introducing the olf and the decipol, two new units with which to measure perceived air quality and express it as a PPD, though this is based on rather debatable assumptions, such as simple summation of the pollutant loads perceived. Even so, Fanger's method for determining the minimum ventilation rate is the first to include both a building and its occupants as the main sources of indoor air pollution. Adoption of this approach in the CEN ENV 1752 standards project (17), however, has been the subject of much criticism. 3. THEORIES AND DESIGNING Environmental comfort theories, however, cannot be universally appropriated by the designer. This is especially true of theories that are solely based on experimental statistics and regard humans as a black box whose output of sensations in response to a known input of stimuli can be predicted empirically or probabilistically, since they supply discrete answers that cannot be adapted to the requirements of a particular design.
4

Rational, deterministic theories based on mathematical models linking stimuli, measured as physical quantities, to sensory responses expressed as the greater or lesser satisfaction of a uniform group of persons, on the other hand, can be directly employed by a building designer. It should none the less be noted that this rational, deterministic quality is a necessary, but not in itself a sufficient requisite. This is especially evident when the architect has to translate his picture of user requirements into congruent environmental conditions. These theories, in fact, always start off from known stimulus conditions to arrive at a judgement concerning environmental quality on the part of a group of persons. They make no provision for the opposite process typical of designing, namely identification of the environmental conditions that will provide a predetermined level of comfort. As matters now stand, therefore, the only logical course a designer can follow is to determine the presumable environmental conditions in the light of a set of technical solutions, and then assess the level of comfort attained. A checking sequence of this kind naturally requires the adoption of a procedure that can be repeated until this level is reached. The four theories we regarded as suitable for use in our hypertextual project are schematised in fig. 1. As already stated, they are all rational and deterministic, and lead to comfort index evaluations expressed solely as satisfaction percentages relating to a uniform groups of persons or to a single person in the case of acoustic comfort.
THERMALCOMFORT ISO 7730 PMV PPD
OLFACTORYCOMFORT CEN prENV 1752 decipol PPD
VISUALCOMFORT
A.R.Bean, R.I. Bell CSP PPD
ACOUSTICCOMFORT ISO/DIS 9921 SIL speech
intelligibility
Fig. 1 - The four theories chosen for the determination of thermal, olfactory, visual and acoustic comfort as an example of a logical path to follow in a building project.
4. A HYPERTEXTUAL TOOL FOR BUILDING COMFORT DESIGN We have elaborated a hypertextual tool called Hypercomfort. This comprises texts illustrating the four theories chosen, their hotwords, and calculation routines for their use in building design, together with graphic presentation of the results. The Toolbook 3.0 software (Asymmetrix) was used to create the hypertext. It is compatible with the Microsoft Windows environment. The general layout of Hypercomfort is illustrated in fig.2. The information text for each theory (e.g. fig.3) is followed by a design module (fig.4) and a checking module for each type of comfort (figs. 5-8).
5

The design module proceeds from known user demands to the environmental conditions. Its key feature is the use of indoor quality levels (A,B,C)), as in the CEN ENV 1752 standard project, to express high (A) to low (C) quality represented by an increase in the percentage of persons dissatisfied. The reference conditions for the indoor environment and the users are entered as inputs, and the corresponding comfort index values are automatically generated as outputs. The logical sequence of this module is not as strict as one would wish. It should none the less be of assistance to an architect in forming an overall picture of the main parameters used to assess environmental comfort. Once the range of comfort index values and their PPDs is defined with the design module for each type of building or space, category and season, the checking modules are used to reach these values by means of a repeatable procedure. These modules proceed from known environmental conditions to defined comfort index values. They have been elaborated for each type of comfort in accordance with the four theories chosen. Checking is done with the field or precalculated values assigned to the variables when calculating the comfort indices. Isocomfort curves generated by the checking simulation are then displayed on a horizontal reference plane. The flow charts for each checking module (figs.5a-8a) illustrate the input variables and calculation routines. The corresponding graphic masks are shown in figs. 5b-8b. These are handled with a user-friendly interface developed in the Windows environment. The thermal comfort module is confined to the PMV and PDD indices, local discomfort is not included.
6

DESIGNMODULE
CHECKINGMODULE
human heat balance
metabolic rate
clothing insulation
climatic values
thermal comfort indices
local thermal discomfort
THERMAL COMFORT
CHECKINGMODULE
indoor air quality
air pollution sources
perceived air quality
outdoor air quality
ventilation effectiveness
required ventilation rate
OLFACTORY COMFORT
CHECKINGMODULE
psychoacoustic
acoustic comfort parameters
acoustic comfortindices
ACOUSTIC COMFORT
visual comfort parameters
CHECKINGMODULE
visual performance
visual comfort indices(artificial lighting)
visual comfort indices(natural lighting)
VISUAL COMFORT
Fig. 2 - General scheme of the hypertextual tool.
Hypercomfort is undoubtedly a comprehensive, multipurpose tool for the solution of thermal, visual, acoustic and olfactory comfort problems in closed environments. Its applicability, however, is limited by the constraints imposed by its software and the characteristics of its underlying theories. Two points require consideration: there is a need for accessory software dedicated to calculation of the variables used in the determination of each comfort index (we are currently using the LUMEN MICRO software from Lighting Technologies Inc. Boulder, Colorado for the visual comfort checking module); comfort theories limit themselves to calculating comfort indices in parallelepiped room shape and must be extended to other configurations. With respect to the first point, something must be said about the way Hypercomfort was conceived. Since it has been primarily designed for teaching purposes, connection to calculation codes elaborated by other institutions was regarded as the easiest course. During its subsequent definition and in the light of ongoing research, there has been a tendency to offset the limitations of its software by creating a single comfort checking simulator divided into four interactive calculation modules consistent with the corresponding theories.
7

8

Fig. 3 - The information module.
9

DESIGN MODULE
INITIAL CONDITION
Type of space / building Category Season
REFERENCE CONDITION
Users Indoor environment
COMFORT CONDITION
Thermal comfort Olfactory comfort Visual comfort Acoustic comfort
Fig. 4 - The design module.
10

• room size• thermally - different surface dimensions• grid• grid height
calculation of view factors for all gridpoints
• surface temperatures
mean radiant temperaturecalculation for all grid points
• activity• thermal insulation of clothing• external work• air temperature• mean air velocity• relative humidity
operative temperaturecalculation for all grid points
calculation of PMV and PPD indicesfor all grid points
iso-operative temperature curves
iso-PMV and iso-PPD curves
Fig. 5a - Flow chart of the thermal comfort checking module.
11

12

Fig. 5b - The thermal comfort checking module.
13

• room size• ventilation rate• perceived outdoor air quality• pollution load from the building• pollution load from the occupants• ventilation effectiveness
perceived indoor air quality calculation
calculation of PPD index
PPD index
perceived indoor air quality
Fig. 6a - Flow chart of the olfactory comfort checking module.
Fig. 6b - The olfactory comfort checking module.
14
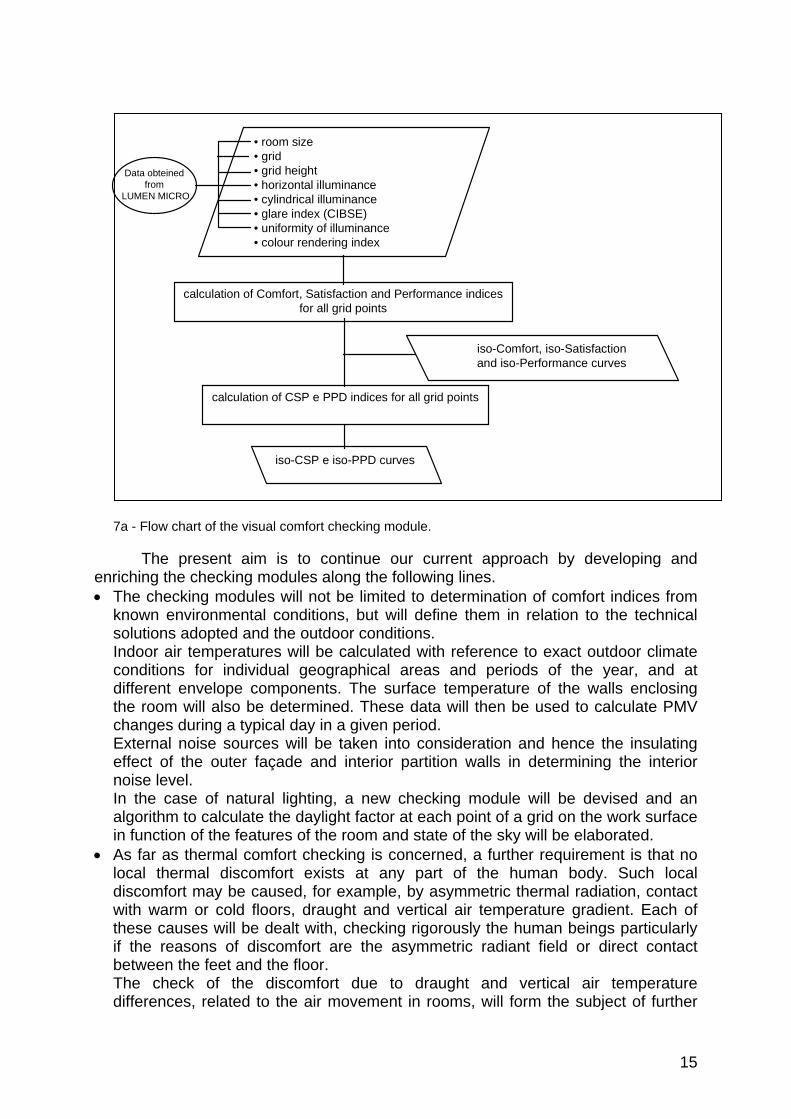
• room size• grid• grid height• horizontal illuminance• cylindrical illuminance• glare index (CIBSE)• uniformity of illuminance• colour rendering index
calculation of Comfort, Satisfaction and Performance indicesfor all grid points
calculation of CSP e PPD indices for all grid points
iso-Comfort, iso-Satisfactionand iso-Performance curves
iso-CSP e iso-PPD curves
Data obteined from
LUMEN MICRO
7a - Flow chart of the visual comfort checking module.
The present aim is to continue our current approach by developing and enriching the checking modules along the following lines. • The checking modules will not be limited to determination of comfort indices from
known environmental conditions, but will define them in relation to the technical solutions adopted and the outdoor conditions. Indoor air temperatures will be calculated with reference to exact outdoor climate conditions for individual geographical areas and periods of the year, and at different envelope components. The surface temperature of the walls enclosing the room will also be determined. These data will then be used to calculate PMV changes during a typical day in a given period. External noise sources will be taken into consideration and hence the insulating effect of the outer façade and interior partition walls in determining the interior noise level. In the case of natural lighting, a new checking module will be devised and an algorithm to calculate the daylight factor at each point of a grid on the work surface in function of the features of the room and state of the sky will be elaborated.
• As far as thermal comfort checking is concerned, a further requirement is that no local thermal discomfort exists at any part of the human body. Such local discomfort may be caused, for example, by asymmetric thermal radiation, contact with warm or cold floors, draught and vertical air temperature gradient. Each of these causes will be dealt with, checking rigorously the human beings particularly if the reasons of discomfort are the asymmetric radiant field or direct contact between the feet and the floor.
The check of the discomfort due to draught and vertical air temperature differences, related to the air movement in rooms, will form the subject of further
15

investigation. Since the use of CFD calculation codes, such us PHOENICS or FLUENT programs, would be too complex in this case, the possibility of employing simplified air movement models, for typical cases, or flow element models is being examined.
16

7b - The visual comfort checking module.
17

• room size• sound absorption in the frequency range from 500 Hz to 4 KHz• grid• height grid
reverberation time graph
reverberation time calculation by octave bands in the frequency range from500 Hz to 4 KHz
sound pressure level calculation
SIL calculation
determination of the maximum distance between speakers and listenersfor satisfactory speech communication
• number of noise sources• sources position• sound power level of each sources• background noise pressure level
iso - sound pressure level curves
iso-SIL curves
iso - distance curves
Fig. 8a - Flow chart of the acoustic comfort checking module.
18
19

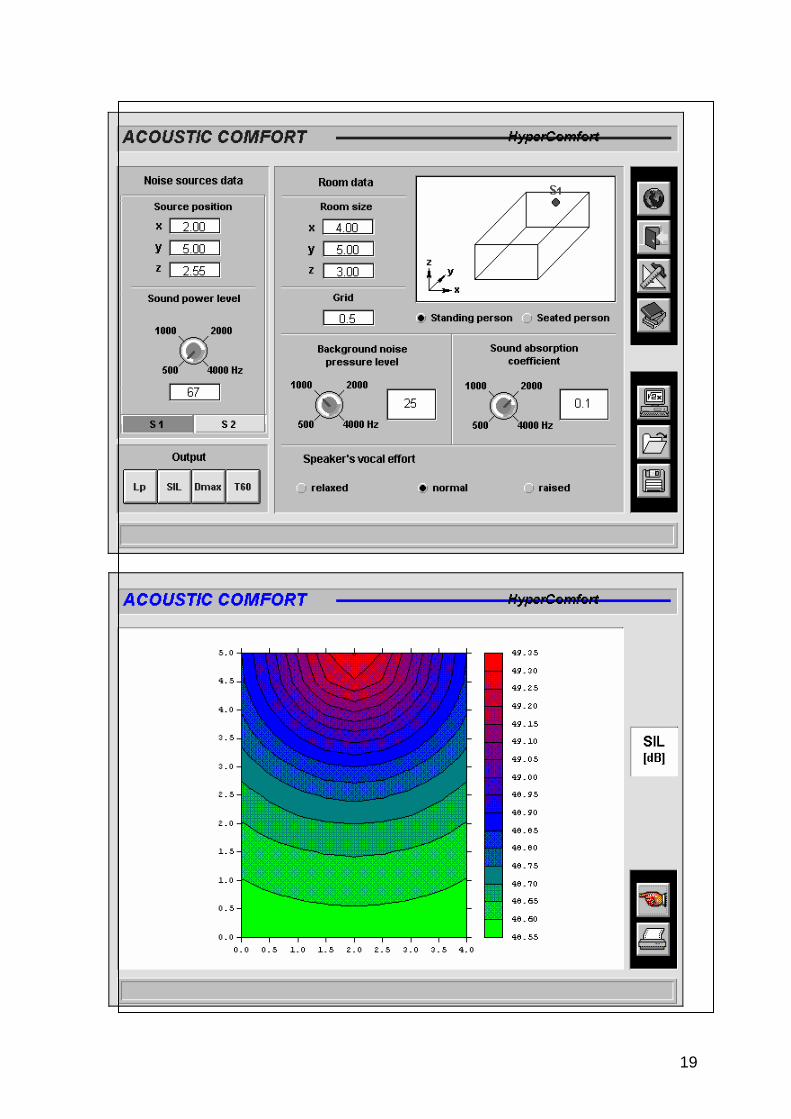
8b - The acoustic comfort checking module.
20

• When dealing with artificial lighting, the intention is to replace the present accessory software with a new calculation routine giving illumination values for points on a horizontal grid and on several vertical planes, though with certain simplifications (no consideration of cross-reflections within the room). Automatic determination of a single glare index is also envisaged.
The second line of development concerns the redefinition of the geometrical inputs of the checking modules. The isocomfort curves for the defined surface of an environment are calculated by Hypercomfort from the corresponding comfort indices. Its current algorithms, however, cannot handle the many space shapes obviously encountered in practice, and more versatile geometrical inputs are needed. Updating, therefore, will be directed to removal of the current limitation to parallelepiped shapes. Our first aim is to determine thermal comfort in complex spaces through the automatic calculation of the mean radiant temperature in a generic space. If this is successful, an analogous approach will be adopted in the determination of visual and acoustic comfort. Variation of the graphic input will eventually lead to the definition of basic types of complex spaces (initially with their walls at right angles) for use in these three checking modules. Continuous updating of the information module and the inclusion of pictures illustrating the concepts involved are also envisaged. A section on comfort measurement will be added, together with information concerning the tools and methods required and the standards in force. Provision is also being made for the generation of a building material data bank, complete with the information required for simulations. The graphic interface will continue to be simple and user-friendly to make the designer's work easier. Future developments will include the prediction and interactive modification of acoustic and lighting patterns. Optimisation of the software, in other words, will provide a dynamic representation of the effect of changing an environment's wall coverings or its light and/or sound reflection factor, varying the luminance of a light source or pointing it in a different direction, etc., through the use of 3D views from any point and angle, and the reproduction of sounds from a internal source. In conclusion, Hypercomfort's new purposes will naturally result in a marked change in its approach to comfort. Users will be able to check the condition of an environment in the light of their existing measurements and calculations, even if its shape is not parallelepiped, and also enter external data as inputs. It will thus be possible to assess the comfort of a room in a building in two ways: by feeding Hypercomfort with the real values of its variables, or through simulation based on the features of the building itself and its external climatic or acoustic conditions.
21

5. REFERENCES 1. Fanger P.O., “Thermal Comfort”, R.E. Krieger Pub. Company, Malabar, 1972.
2. ISO, “Moderate thermal environments - Determination of the PMV and PPD
indices and specification of the conditions for thermal comfort - ISO Standard
7730”, International Organization for Standardization, Geneva, 1994.
3. Gagge A.P. et al., “An effective temperature scale based on a simple model of
human physiological regulatory response”, ASHRAE Transactions n.77, 1971.
4. ASHRAE, “Thermal environmental conditions for human occupancy -
ANSI/ASHRAE Standard 55-92”, American Society of Heating, Refrigerating
and Air Conditioning Engineers Inc., Atlanta, 1992.
5. French N.R., Steinberg J.C., “Factors governing the intelligibility of speech
sounds”, Journal Acoustical Society of America, n. 19, 1947.
6. ISO, “Ergonomic assessment of speech communication - ISO/DIS 9921”,
International Organization for Standardization, Geneva, 1992.
7. Steeneken J.M., Houtgast T., “A physical method measuring speech
transmission quality”, Journal Acoustical Society of America, n. 65, 1980.
8. Hopkinson R.G. et al., “Brightness and contrast in illuminating engineering”,
Trans. Illum. Eng. Society, n.6, vol. 37, London, 1941.
9. Waldram J.M., “Design of the visual field as a routine method”, Trans. Illum.
Eng. Society, n.2, vol. 23, London, 1958.
10.CIE, “Guide on interior lighting”, Publication n. 29.2, 1986.
11.CIBSE, “Code for interior lighting”, The Chartered Institution of Building
Services Engineers, London, 1994.
12.IES, “Lighting handbook - Reference volume”, Illuminating Engineers Society,
1984.
13.Bean A.R., Bell R.I., “The CSP index”, Lighting Research and Technologies,
CIBSE, n.24, London, 1992.
14.Yaglou C.P. et al., “Ventilation requirements”, ASHRAE Transactions n.42, 1936.
15.ASHRAE, “Ventilation for acceptable indoor air quality - Standard 62/89”,
American Society of Heating, Refrigerating and Air Conditioning Engineers Inc.,
Atlanta, 1989.
16.Fanger P.O., “Introduction of the olf and the decipol units to quantify air pollution
perceived by humans indoors and outdoors”, Energy and Buildings, n.12, 1988.
22

17.CEN, “Ventilation of buildings. Design criteria for the indoor environment - ENV
1752”, European Committee for Standardization, 1996, Brussels.
23