an ict model for increased adoption of agricultural input
TRANSCRIPT
I
UNIVERSITY OF NAIROBI SCHOOL OF COMPUTING AND INFORMATICS
BY
THESIS SUBMITTED IN FULFILMENT OF THE REQUIREMENTS OF THE DEGREE OF DOCTOR OF PHILOSOPHY IN INFORMATION SYSTEMS, SCHOOL OF
COMPUTING AND INFORMATICS, UNIVERSITY OF NAIROBI
JANUARY 2018
AN ICT MODEL FOR INCREASED ADOPTION OF
AGRICULTURAL INPUT INFORMATION BY
CEREAL FARMERS IN DEVELOPING COUNTRIES:
A CASE IN SIKASSO, MALI
Macire KANTE P80/50081/2015

II
DECLARATION I hereby declare that this project is my own work and has, to the best of my knowledge, not been submitted to any other institution of higher learning. Student: Macire KANTE Registration Number: P80/50081/2015
Signature: ............................................... Date: ..................................................... This project has been submitted as the fulfilment of requirements for the PhD in Information Systems of the University of Nairobi with my approval as the University supervisor. Prof Robert Oboko Signature: ..................................................... Date: .................................................. Dr. Christopher Chepken Signature: ..................................................... Date: ..................................................

III
DEDICATION To my father Professor Nianguiry KANTE who devoted himself to my education scarifying his own life to mine. To my dear mother Niakale Kebe whose love and support was never lacking.

IV
Acknowledgements
Many people have supported me during this journey. I would like to speak about some of
them here.
First, I wish to thank my supervisors, Prof Robert Oboko and Dr Christopher Chepken. Prof
Robert Oboko believed in me and gave his selflessness to this work. I am grateful to him. My
indebtedness goes to my second supervisor Dr Christopher Chepken. He gave me his
complete and enthusiastic support. Without my supervisors, this work would not be possible.
There is no word to express how I am grateful to them.
The School of Computing and Informatics has inspired and supported me. It has set up an
environment that has permitted me to reach so far under the direction of the former SCI-
Director Professor Okello–Odongo and the current Director Dr Agnes Waussi. I would like to
express my gratitude to Professor Peter Waigancha. He believed in me from the very
beginning. I am grateful to all the staff of the school who have helped me.
I give thanks to my fellow PhD students. They offered me their support during this long way.
I would like to thank the ICTs services Senekela and Myagro (Ngasene) teams. I am grateful to
the team of Myagro in Bougouni and to all the respondents.
Many thanks to my family too. To my beloved wife Maimouna Coulibaly whose love has put up my absences and for taking care of our son Nianguiry KANTE and daughter Niame KANTE. I reiterate my gratitude and thanks to her. Special thanks to my uncle Moriba Kante, whose support was never lacking during this journey. I also thank my brothers and sisters for taking care of my wife and son and care of my Father and my mother: Silamakan, Sadio, Diogoda, Mahamadou, Niame, Fanta KANTE, thank you.
Many thanks to my friends for their support. Special thanks go to Amadou Maiga for his
support to my family and me when I was away. Special thanks to my dear friend Modibo Kane
and his lovely wife, Kane Kadiatou Niang. They had taken care of my wife and son when I was
away. My gratitude goes to Cheikhne Ahamada Hamahoullah for his guidance and his tlamid
for their support.
This material is based upon work supported by the United States Agency for International Development, as part of the Feed the Future initiative, under the CGIAR Fund, award number BFS-G-11-00002, and the predecessor fund the Food Security and Crisis Mitigation II grant, award number EEM-G-00-04-00013.

V
ABSTRACT
Use of agricultural inputs by small-scale cereal farmers constitutes the basis for an
improvement of their agricultural productivity. Such use is related to the adoption of
agricultural input information disseminated by Information and Communication Technologies
(ICTs).
ICT services have been set up in developing countries to disseminate agricultural input
information. We can cite the ICT services Senekela and MyAgro in Mali; Nokia Life in India,
Indonesia, Nigeria and China; MFarm in Kenya; IFFCO (Indian Farmers Fertilizer Cooperative
Limited) Airtel Initiative and E-choupal in India; TigoKilimo in Tanzania; Ukisaan and Kissan in
Pakistan. Hence, farmers have been exposed to ICT on agricultural input information in
developing countries.
Despite the availability of these different ICTs channels in the agricultural input information
sector, adoption of agricultural input information remains a problem for small-scale cereal
farmers. That problem is linked to the low use of these ICT services by small-scale cereal
farmers. Furthermore, the low use was restrained by certain factors. Therefore, an
investigation needed to be conducted into these factors affecting small-scale cereal farmers’
use of ICT on agricultural input information and their relationships to inform the design and
delivery of this information service in developing countries using the case of Sikasso in Mali
to gather data.
The specific objectives are:
The broad objective of this study is to propose an ICT model for increased adoption of
agricultural input information.
The specific objectives are:
1. To establish farmers’ perception of ICT on agricultural input information and to identify
the effects of this perception on the use of these ICTs.
2. To establish farmers’ influence on each other in the use of ICT on agricultural input
information and to identify the effects of this influence on the use of these ICTs.
3. To establish the challenges faced by farmers in the use of ICT on agricultural input
information and to identify the effects of these challenges in the use of these ICTs.
4. To propose an ICT model for increased adoption of agricultural input information.
This study was conducted in Sikasso, Mali through quantitative methods. A positivist
philosophical point of view was adopted for this research. A pilot study was conducted to
validate the research instrument and the proposed model. Its results were very useful in
confirming the proposed model based on the literature review in the field of use of ICT by
small-scale cereal farmers to adopt (access and use) agricultural input information in
developing countries. However, some items were dropped to enhance the instrument

VI
reliability and validity. The main study was cross-sectional. Data was collected from 222
respondents against a target of 200.
The model was analysed using Partial Least Square Structural Equation Model (PLS-SEM)
following the guidelines available in the field of Information Systems Research. The study
proposed a model for small-scale cereal farmers that was highly predictive and explicative of
use of ICT by small-scale cereal farmers in developing countries.
This research has made a theoretical contribution: It has proposed a new model in the study
of ICT adoption/use. Methodological contributions were also made by proposing an updated
guideline for the use of PLS in Information System research for an exploratory study, by
developing a method to translate a survey instrument from English into French and Bambara
(Nko), by contributing to the debate of how to establish the discriminant validity. The research
made a practical and managerial contribution by proposing to the ICT services managers a
model that they should take into account before deploying any such service to cereal farmers.
We pointed out where further inquiries could be taken from this research.
VII
RÉSUMÉ
L’utilisation des intrants agricoles par les petits exploitants producteurs de céréales est la
condition d’une meilleure rentabilité agricole. Une telle utilisation est liée à l’adoption de
l’information agricole sur ces intrants agricoles qui peut être diffusée par les technologies de
l’information et de la communication (Tics).
Dans cette optique de diffusion de l’information agricole sur les intrants agricoles, les Tics ont
été développés et déployés dans les pays en voie de développement. On peut citer Senekela
et MyAgro au Mali ; Nokia Life en Inde, Indonésie, Nigeria et en China ; MFarm au Kenya ;
IFFCO (Indian Farmers Fertilizer Cooperative Limited) Airtel Initiative et E-choupal en Inde ;
TigoKilimo en Tanzanie ; Ukisaan and Kissan au Pakistan. Par conséquent, les petits
producteurs de céréales ont été expose aux Tics sur les intrants agricoles dans les pays en
voie de développement.
Malgré l’exposition à ces différents Tics dans le secteur de l’information agricole relative aux
intrants, l’adoption de cette information est toujours problématique pour les petits
producteurs de céréales. Le déficit d’adoption de l’information agricole relative aux intrants
est réfréné par une utilisation insuffisante des TICs dans le domaine de l’information agricole
sur les intrants. Par conséquent, une recherche devrait être conduite pour déterminer les
facteurs qui affectent l’utilisation de ces TICs et les relations entre ces différents facteurs (un
modèle) dans les pays en voie de développement utilisant le cas de Sikasso au Mali pour
collecter les données.
Le principal objectif de cette recherche était de proposer un modèle Tics pour une adoption
accrue de l’information agricole sur les intrants.
Les objectifs spécifiques sont :
1. Etablir la perception des Tics par les paysans et identifier son effet sur l’utilisation de ces
Tics
2. Etablir l’influence que les paysans ont sur les uns et les autres et identifier son effet sur
l’utilisation de ces Tics
3. Etablir les défis que font faces les paysans dans l’utilisation des Tics et identifier ses effets
sur l’utilisation de ces Tics.
4. Proposer un modèle Tics pour une adoption accrue de l’information agricole sur les
intrants.
Cette étude a été conduite dans la région de Sikasso, Mali à travers des méthodes
quantitatives. Du point de vue épistémologique, une approche positiviste a été adoptée. Une
étude préliminaire a été conduite pour tester et valider le questionnaire et le proposé modèle
conceptuel. Ces résultats ont été très utiles dans la confirmation du proposé modèle qui était
base sur les données de la littérature dans le domaine de l’adoption et l’utilisation des Tics
par les paysans dans les pays en voie de développement. En plus, les résultats ont permis the

VIII
valider le questionnaire. Néanmoins, quelques questions ont été retirées de celui-ci. L’étude
proprement dite a été ainsi conduite dans la région de Sikasso. Les données ont été collectées
à partir de 222 répondants contre un objectif de 200.
Le model a été analyse en utilisant le Modèle d’Equation Structurelle et plus précisément
Moindres Carres Partiels. L’étude a proposé un modèle qui était extrêmement prédictif et
explicatif de l’utilisation des Tics par les producteurs de céréales dans les pays en voie de
développement. Cette recherche a fait des contributions théorétiques : elle a proposé un
modèle nouveau et unique, pour l’étude de l’adoption/utilisation des Tics ; Enrichie la
littérature existante. Des contributions méthodologiques ont aussi été faites en proposant un
guide mis à jour pour l’utilisation des Moindre Carrés Partiels dans le domaine des systèmes
d’information et dans un environnement exploratoire ; en développant une méthode de
traduction de questionnaire de l’anglais vers le français et Nko ; en contribuant au débat sur
comment valider une analyse discriminante. La recherche a fait des contributions pratiques
et managerielles en proposant au monde des Tics un model qu’ils doivent prendre en compte
avant de développer ou déployer tout service Tics en direction des paysans dans les pays en
voie de développement. Nous avons formulé des recommandations pour les futures
recherches à partir de la nôtre.
IX
Table of Contents
IDECLARATION -------------------------------------------------------------------------------------------------- II
DEDICATION ---------------------------------------------------------------------------------------------------- III
Acknowledgements ------------------------------------------------------------------------------------------- IV
ABSTRACT -------------------------------------------------------------------------------------------------------- V
Résumé --------------------------------------------------------------------------------------------------------- VII
Publications ---------------------------------------------------------------------------------------------------- XIII
List of Tables ---------------------------------------------------------------------------------------------------XIV
List of Figures -------------------------------------------------------------------------------------------------- XV
List of Abbreviations -----------------------------------------------------------------------------------------XVI
Chapter one ----------------------------------------------------------------------------------------------------- 17
Introduction ---------------------------------------------------------------------------------------------------- 17
STUDY AREA BACKGROUND --------------------------------------------------------------------------------------------------- 17 1.2. ICT USE IN THE AGRICULTURAL INPUT INFORMATION SECTOR ------------------------------------------------------- 18 1.2.1. AVAILABILITY OF ICTS-BASED AGRICULTURAL INPUT INFORMATION IN DEVELOPING COUNTRIES ----------------- 18 1.2.2. AGRICULTURAL INPUT INFORMATION ADOPTION AND USE OF ICTS-BASED AGRICULTURAL INPUT INFORMATION
IN DEVELOPING COUNTRIES ---------------------------------------------------------------------------------------------------- 19 1.3. STATEMENT OF THE PROBLEM ------------------------------------------------------------------------------------------ 22 1.4. RESEARCH OBJECTIVES --------------------------------------------------------------------------------------------------- 23 1.5. JUSTIFICATION ------------------------------------------------------------------------------------------------------------ 24 1.6. SCOPE --------------------------------------------------------------------------------------------------------------------- 24 1.7. SIGNIFICANCE ------------------------------------------------------------------------------------------------------------ 25 1.8. OPERATIONAL DEFINITION ---------------------------------------------------------------------------------------------- 25 1.8.1. ICTS --------------------------------------------------------------------------------------------------------------------- 25 1.8.2. HOUSEHOLD HEAD ----------------------------------------------------------------------------------------------------- 26 1.8.3. CEREAL------------------------------------------------------------------------------------------------------------------ 26 1.8.4. AGRICULTURAL INPUT INFORMATION -------------------------------------------------------------------------------- 26 1.8.5. INNOVATION, USE, ADOPTION AND DIFFUSION --------------------------------------------------------------------- 27 1.9. ASSUMPTIONS------------------------------------------------------------------------------------------------------------ 28 1.10. THESIS STRUCTURE ----------------------------------------------------------------------------------------------------- 29
CHAPTER TWO ------------------------------------------------------------------------------------------------- 31
Literature Review --------------------------------------------------------------------------------------------- 31
2.1. INTRODUCTION ----------------------------------------------------------------------------------------------------------- 31 2.2. SELECTED ICT ON AGRICULTURAL INPUT INFORMATION IN DEVELOPING COUNTRIES ------------------------------ 33 2.2.1. EXPERIENCES FROM INDIA --------------------------------------------------------------------------------------------- 33 2.2.2. EXPERIENCES FROM INDONESIA --------------------------------------------------------------------------------------- 35 2.2.3. EXPERIENCES FROM TANZANIA ---------------------------------------------------------------------------------------- 36

X
2.2.4. EXPERIENCES FROM KENYA -------------------------------------------------------------------------------------------- 37 2.2.5. EXPERIENCES FROM PAKISTAN ---------------------------------------------------------------------------------------- 37 2.2.6. EXPERIENCES FROM CHINA -------------------------------------------------------------------------------------------- 38 2.2.7. EXPERIENCES FROM MALI --------------------------------------------------------------------------------------------- 39 2.3. OBSERVATION FROM THE REVIEWED EXPERIENCES-------------------------------------------------------------------- 41 2.4. TECHNOLOGY ADOPTION THEORIES/MODELS ------------------------------------------------------------------------ 42 2.4.1. TECHNOLOGY ACCEPTANCE MODEL (TAM) ------------------------------------------------------------------------- 43 2.4.2. UNIFIED THEORY OF ACCEPTANCE AND USE OF TECHNOLOGY (UTAUT) ------------------------------------------ 44 2.4.3. DIFFUSION OF INNOVATION THEORY (DOI/IDT) -------------------------------------------------------------------- 46 2.4.4. SUMMARY OF THE REVIEWED IS TECHNOLOGY ACCEPTANCE THEORIES/MODELS -------------------------------- 50 2.4.5. THE DIKDAR MODEL ------------------------------------------------------------------------------------------------- 51 2.4.6. THEORY OF KNOWLEDGE ---------------------------------------------------------------------------------------------- 52 2.5. REVIEW OF EMPIRICAL LITERATURE USING THE GROUNDED THEORY ----------------------------------------------- 53 2.5.1. FARMERS’ PERCEPTION OF ICT ON AGRICULTURAL INPUT INFORMATION AND THE EFFECTS OF THIS PERCEPTION
ON THE USE OF THESE ICTS ---------------------------------------------------------------------------------------------------- 58 2.5.2. FARMERS’ INFLUENCE ON EACH OTHER IN THE USE OF ICT ON AGRICULTURAL INPUT INFORMATION AND THE
EFFECTS OF THIS INFLUENCE ON THE USE OF THESE ICTS -------------------------------------------------------------------- 60 2.5.3. OTHER CHALLENGES FACED BY CEREAL FARMERS IN THE USE OF ICT ON AGRICULTURAL INPUT INFORMATION
AND THE EFFECTS OF THESE CHALLENGES ON THE USE OF THESE ICTS ------------------------------------------------------ 64 2.6. THE IDENTIFIED GAPS --------------------------------------------------------------------------------------------------- 68 2.6.1. RESEARCH EMPIRICAL GAPS ------------------------------------------------------------------------------------------- 69 2.6.2. GAPS FROM THEORETICAL LITERATURE ON ICTS’ MODELS ON AGRICULTURAL INPUT INFORMATION ------------ 72 2.7. CONCEPTUAL FRAMEWORK --------------------------------------------------------------------------------------------- 77
Chapter three --------------------------------------------------------------------------------------------------- 81
Methodology --------------------------------------------------------------------------------------------------- 81
3.1. INTRODUCTION ----------------------------------------------------------------------------------------------------------- 81 3.2. RESEARCH PARADIGM --------------------------------------------------------------------------------------------------- 81 3.3. RESEARCH DESIGN: ------------------------------------------------------------------------------------------------------ 82 3.3.1. RESEARCH APPROACH ------------------------------------------------------------------------------------------------- 83 3.3.3. RESEARCH STRATEGY -------------------------------------------------------------------------------------------------- 83 3.3.4. TIME HORIZON --------------------------------------------------------------------------------------------------------- 84 3.3.5. DESCRIPTION OF STUDY AREA----------------------------------------------------------------------------------------- 84 3.4. OVERALL APPROACH ----------------------------------------------------------------------------------------------------- 84 3.4.1. RESEARCH INSTRUMENT TRANSLATION AND PRE-TEST OF THE TRANSLATED INSTRUMENT ----------------------- 85 3.4.2. VALIDATION OF THE RESEARCH INSTRUMENT AND CONCEPTUAL FRAMEWORK ----------------------------------- 87 3.4.3. MAIN STUDY ----------------------------------------------------------------------------------------------------------- 90 3.5. DATA ANALYSIS ---------------------------------------------------------------------------------------------------------- 96 3.5.1. OUTER MODEL FIT EVALUATION -------------------------------------------------------------------------------------- 96 3.5.2. STRUCTURAL MODEL EVALUATION ----------------------------------------------------------------------------------- 99 3.6. STRUCTURAL EQUATION MODELLING -------------------------------------------------------------------------------- 103 3.6.1. PHILOSOPHICAL FOUNDATION OF SEM ---------------------------------------------------------------------------- 105 3.6.2. PLS VS CB ------------------------------------------------------------------------------------------------------------ 105 3.6.3. CRITIC OF THE USE OF PLS IN INFORMATION SYSTEM ------------------------------------------------------------- 107 3.6.4. CAUSAL AND PREDICTIVE MODELS --------------------------------------------------------------------------------- 109 3.6.5. DESIGN --------------------------------------------------------------------------------------------------------------- 110 3.7. DATA MANAGEMENT -------------------------------------------------------------------------------------------------- 113 3.7.1. DATA SCREENING ---------------------------------------------------------------------------------------------------- 113 3.7.2. MISSING VALUES ----------------------------------------------------------------------------------------------------- 113 3.7.3. OUTLIER ANALYSIS --------------------------------------------------------------------------------------------------- 114 3.7.4. DATA CODING -------------------------------------------------------------------------------------------------------- 115

XI
3.7.5. MULTIVARIATE NORMALITY ----------------------------------------------------------------------------------------- 116 3.7.6. MULTICOLLINEARITY ------------------------------------------------------------------------------------------------- 118
Chapter four -------------------------------------------------------------------------------------------------- 119
Results and Discussion ------------------------------------------------------------------------------------- 119
4.1. INTRODUCTION --------------------------------------------------------------------------------------------------------- 119 4.2. DESCRIPTIVE STATISTICS AND DISCUSSION -------------------------------------------------------------------------- 119 4.2.1. ICTS’ USE ------------------------------------------------------------------------------------------------------------- 119 4.2.2. GENDER AND AGE --------------------------------------------------------------------------------------------------- 119 4.2.3. FAMILY SIZE AND ICTS’ USE ----------------------------------------------------------------------------------------- 121 4.2.4. DURATION ------------------------------------------------------------------------------------------------------------ 121 4.2.5. LITERACY AND ICT SKILLS -------------------------------------------------------------------------------------------- 122 4.3. MEASUREMENT MODEL EVALUATION AND DISCUSSION -------------------------------------------------------- 123 4.3.1. CONVERGENCE ------------------------------------------------------------------------------------------------------- 123 4.3.2. CONVERGENT VALIDITY ---------------------------------------------------------------------------------------------- 124 4.3.3. DISCRIMINANT VALIDITY--------------------------------------------------------------------------------------------- 127 4.4. STRUCTURAL MODEL EVALUATION (INNER MODEL) AND DISCUSSION ----------------------------------------- 129 4.4.1. THE COEFFICIENT OF DETERMINATION (R2) ------------------------------------------------------------------------ 129 4.4.2. THE PATH COEFFICIENT ---------------------------------------------------------------------------------------------- 130 4.4.3. EFFECT SIZE (F2) ------------------------------------------------------------------------------------------------------ 130 4.4.4. PREDICTIVE RELEVANCE (Q2)---------------------------------------------------------------------------------------- 133 4.4.5. STANDARDISED ROOT MEAN SQUARE RESIDUAL (SRMR) APPROXIMATE FIT ---------------------------------- 133 4.5. HYPOTHESIS VALIDATION AND DISCUSSION ------------------------------------------------------------------------- 134 4.5.1. MODERATING VARIABLES VALIDATION ----------------------------------------------------------------------------- 134 4.5.2. DIRECT HYPOTHESES VALIDATION ---------------------------------------------------------------------------------- 138 4.5.3. CONCLUSION ON THE HYPOTHESES --------------------------------------------------------------------------------- 145
Chapter five --------------------------------------------------------------------------------------------------- 147
Achievements, Conclusion AND Recommendations ----------------------------------------------- 147
5.1. INTRODUCTION --------------------------------------------------------------------------------------------------------- 147 5.2. ACHIEVEMENTS -------------------------------------------------------------------------------------------------------- 147 5.3. CONTRIBUTION AND IMPLICATIONS ---------------------------------------------------------------------------------- 149 5.3.1. THEORETICAL CONTRIBUTION --------------------------------------------------------------------------------------- 149 5.3.2. METHODOLOGICAL CONTRIBUTION -------------------------------------------------------------------------------- 153 5.3.3. PRACTICAL AND MANAGERIAL CONTRIBUTION -------------------------------------------------------------------- 155 5.4. STUDY LIMITATIONS --------------------------------------------------------------------------------------------------- 156 5.5. CONCLUSION ----------------------------------------------------------------------------------------------------------- 157 5.6. RECOMMENDATIONS -------------------------------------------------------------------------------------------------- 159 5.6.1. THEORETICAL RECOMMENDATIONS -------------------------------------------------------------------------------- 159 5.6.2. METHODOLOGICAL RECOMMENDATIONS -------------------------------------------------------------------------- 160 5.6.3. PRACTICAL AND MANAGERIAL RECOMMENDATION --------------------------------------------------------------- 160 5.6.4. POLICY RECOMMENDATION ----------------------------------------------------------------------------------------- 160
References ---------------------------------------------------------------------------------------------------- 161
APPENDICES -------------------------------------------------------------------------------------------------- 179
Appendix 1. Questionnaire ------------------------------------------------------------------------------- 179

XII
Appendix 2. Instrument translation and Pre-test report ------------------------------------------ 193
Appendix 3. Pilot study report --------------------------------------------------------------------------- 198
Appendix 4: Partial least square structural equation modelling’ use in information systems: an updated guideline in exploratory settings. ------------------------------------------- 216
Appendix 5. Correlations between the variables --------------------------------------------------- 232
Appendix 6. Research approval Letter ----------------------------------------------------------------- 236
Appendix 7. Mode of data collection effect on data ----------------------------------------------- 238

XIII
PUBLICATIONS The following papers have been published during this research. These contributed to enhancing knowledge on adoption/use of ICT by small-scale cereal farmers in the context of agricultural input information in developing countries. Papers
1. Kante, M., Oboko, R. & Chepken, C., 2016. Factors affecting the use of ICTs on agricultural input information by farmers in developing countries. AIMS Agriculture and Food, 1(3), pp.315–329. Available at: http://www.aimspress.com/article/10.3934/agrfood.2016.3.315
2. Kante, M., Oboko, R. & Chepken, C., 2017. Influence of Perception and quality of ICT-
based agricultural input information on the use of ICTs by farmers in developing countries: Case of Sikasso in Mali. Electronic Journal of Information Systems in Developing Countries, 83(9), 1–21. doi: 10.1002/j.1681-4835.2017.tb00617.x
3. Kante, M., Chepken, C. & Oboko, R,. 2017. Revisitant les facteurs affectant l’utilisation
des Tics sur l’information relative aux intrants agricoles par les paysans dans les pays en voie de développement. Journal of Information Systems and Technology Management, 14(2), pp. 169–189. doi: 10.4301/S1807-17752017000200003
Proceedings 1. Kante, M., Chepken, C. & Oboko, R., 2017. The influence of quality of ICT-based
agricultural input information on use of ICTs by cereal farmers in developing countries: Case of Sikasso, Mali. In ICT adoption for Africa development. Douala: ICT4AD’17, pp. 72–84.
2. Kante, M. et al., 2017. Farmers’ Perceptions of ICTs and its Effects on Access and Use of Agricultural Input Information in Developing Countries : Case of Sikasso, Mali. In P. C. and M. Cunningham, ed. IST-Africa Week 2017. Windhoek: IIMC International Information Management Corporation, pp. 1–8. Available at: www.IST-Africa.org/Conference2017.
3. Kante, M., Chepken, C., & Oboko, R. 2017. Methods for translating ICTs’ survey questionnaire into French and Bambara, Egerton University, Njoro, 29th – 31st March 2017.
4. Kante, M., Chepken, C. and Oboko, R. (2017). Partial Least Square Structural Equation Modelling ’ use in Information Systems : an updated guideline of practices in exploratory settings, in University, K. (ed.) Research, Innovation and Knowledge Translation for Community Transformation. Nakuru, p. 41.

XIV
LIST OF TABLES TABLE 1.1. AGRICULTURAL INPUT INFORMATION ................................................................................. 27
TABLE 2.2. RESEARCH SOURCE AND TERMS DEFINITION ....................................................................... 53
TABLE 2.3 CONCEPT AND CATEGORY MATRIX ..................................................................................... 55
TABLE 2.4 ICT SKILLS AND LITERACY PROPERTIES ................................................................................ 67
TABLE 2.5 RESEARCH GAPS PER CATEGORIES AND REFERENCES .............................................................. 69
TABLE 2.6 CONSTRUCTS EXTRACTED FROM THEORIES .......................................................................... 78
TABLE 3.1. SAMPLES (COMMUNES) FROM DISTRICT ............................................................................ 90
TABLE 3.2 SAMPLES DISTRIBUTION .................................................................................................. 91
TABLE 3.3. CONSTRUCTS AND INDICATORS ........................................................................................ 92
10TABLE 3.4. MEASUREMENT MODEL ASSESSMENT ........................................................................... 98
TABLE 3.5 STRUCTURAL MODEL ASSESSMENT ................................................................................. 100
TABLE 3.6: HYPOTHESES MEASUREMENT ....................................................................................... 101
TABLE 3.7. PLS-SEM DESIGN ACTIVITIES ....................................................................................... 111
TABLE 3.8. LATENT VARIABLE CORRELATION ................................................................................... 115
TABLE 3.9 STATISTICAL ANALYSIS OF THE VARIABLES ......................................................................... 116
TABLE 4.1 USE OF ICT SERVICES DISTRIBUTION ................................................................................. 119
TABLE 4.2. GENDER DISTRIBUTION BY AGE AND USE OF ICT SERVICE .................................................... 120
TABLE 4.3. USE OF ICT SERVICES DISTRIBUTION BY FAMILY SIZE ......................................................... 121
TABLE 4.4. USAGE DURATION OF ICT AND ADOPTERS’ CATEGORIES ..................................................... 121
TABLE 4.5 SKILLS DISTRIBUTION .................................................................................................... 122
TABLE 4.6 CONVERGENT VALIDITY ................................................................................................. 126
TABLE 4.7. FORNELL–LARCKER DISCRIMINANT VALIDITY CRITERION ..................................................... 127
TABLE 4.8 HTMT CRITERION ....................................................................................................... 128
TABLE 4.9 PATH COEFFICIENTS ..................................................................................................... 130
TABLE 4.10 PREDICTIVE RELEVANCE .............................................................................................. 133
TABLE 4.11 PATHS COEFFICIENT FOR LITERACY AND ILLITERACY ........................................................... 135
TABLE 4.12. WELCH-SATTERTHWAITE TEST .................................................................................... 135
TABLE 4.13. PATHS COEFFICIENT FOR ICT SKILLS ............................................................................. 136
TABLE 4.14. WELCH-SATTERTHWAITE TEST .................................................................................... 137
TABLE 4.15. HYPOTHESES TESTING ................................................................................................ 138
TABLE 5.1 STUDY’S RESULTS AND CONCLUSIONS ............................................................................... 157

XV
LIST OF FIGURES FIGURE 1.1 ICT ON AGRICULTURAL INPUT INFORMATION VALUE CHAIN .................................................. 28
FIGURE 2.1 TECHNOLOGY ACCEPTANCE MODEL (TAM) ....................................................................... 43
FIGURE 2.2 UNIFIED THEORY OF TECHNOLOGY ACCEPTANCE MODEL (UTAUT) ....................................... 45
FIGURE 2.3 DIFFUSION OF INNOVATION THEORY (DOI/IDT) ................................................................ 49
FIGURE 2.4 DIKDAR MODEL ......................................................................................................... 51
FIGURE 2.5 BOOTSTRAPPING RESULTS FROM AMIN AND LI (2014) ...................................................... 73
FIGURE 2.6 THEORETICAL FRAMEWORK OF REZAEI-MOGHADDAM & SALEHI (2010) ................................ 74
FIGURE 2.7 PATH COEFFICIENTS AND P-VALUES OF HYPOTHESES OF REZAEI-MOGHADDAM & SALEHI (2010) 75
FIGURE 2.8 CONCEPTUAL FRAMEWORK ............................................................................................. 79
FIGURE 3.1 RESEARCH DESIGN SUMMARY 1 ...................................................................................... 82
FIGURE 3.2 OVERVIEW OF REFLECTIVE/FORMATIVE MODELS ............................................................. 104
FIGURE 3.3 COMPARISON OF PLS AND CB ...................................................................................... 106
FIGURE 3.4 STEPS OF PLS-SEM SOURCE: URBACH & AHLEMANN (2010) ........................................... 110
FIGURE 4.1 DATA CONVERGENCE IN SMARTPLS 3.2.6 ................................................................... 124
FIGURE 4.2 BOOTSTRAPPING FUNCTION IN SMARTPLS 3.2.6 ........................................................... 131
FIGURE 4.3 MODEL RESULTS ........................................................................................................ 132
FIGURE 5.1 FINAL REVISED MODEL FOR USE OF ICT ON AGRICULTURAL INPUT INFORMATION .................... 152

XVI
LIST OF ABBREVIATIONS AMRTP: Autorite Malienne de Regulation des Telecommunications/TIC et des Postes
(Malian Regulatory Authority of Telecommunications /ICT and Post)
AI: Agricultural inputs
AII: Agricultural Input Information
AVE: Average Variance Extracted
CP: Compatibility
DIKDAR Model: Data delivery, Information, Decision Action and Results Model
DOI: Diffusion of Innovation Theory
IDI: ICT Development Indices
ICT: Information and Communication Technologies
ICT4D: Information and Communication Technology for Development
IS: Information System
IT: Information Technologies
ITU: International Telecommunication Union
IQ: Information Quality
OB: Observability
OMA: Agricultural Market Observatory
RA: Relative Advantage
SEM: Structural Equation Modelling
SI: Social Influence
SIMP: Simplicity
PLS-SEM: Partial Least Squares Structural Equation Modelling
TAM: Technology Acceptance Model
TIC: Technologies de l’Information et de la Communication
UTAUT: Unified Theory of Acceptance and Use of Technology
USAID: United States Aid
USSD: Unstructured Supplementary Service Data

17
CHAPTER ONE
INTRODUCTION
1.1. STUDY AREA BACKGROUND
Mali is a semi-arid country with a population of approximately 18.75 million as at 2015 (United
Nations Population Division, 2015) and a surface area of 1, 242, 248 km2. The rural population
in Mali represents 73% of the population that works in the agriculture sector (Traoré et al.,
2011). The literacy rate is approximately 33.1% for adults (15 years and above). However, in
the rural area, this rate is about 24.4% (INSTAT, 2015). The Malian agriculture, dominated by
small-scale farmers (68%), grew by 7.7% in 2010 and contributed 37% to the country’s Gross
Domestic Product in 2008 (FAO, 2013). Cereals such as millet, sorghum, maize, rice and fonio
constitute the main part of the agricultural production of the country (Aparisi & Balie, 2013).
The agricultural activities are marked by low productivity (AGRA, 2014). Nevertheless, there is
broad agreement that agricultural productivity in many developing countries needs to
improve (Batchelor et al., 2014) for better food security levels. Such objective cannot be
achieved without a greater adoption (use) of inputs, which permit the increase of the yield
(International Development Fertilizer Centre, 2004). Also, Staatz & Temé (2015) emphasise
that one of the sources of productivity increase is technological improvements through access
to improved technologies (agricultural inputs). Moreover, Dey, Prendergast and Newman
(2008) argue that lack of use of technology (farm inputs) in the production leads to lack of
productivity of farmers.
Agricultural inputs utilisation depends largely on agricultural input information’ adoption. That
is emphasised by Msoffe & Ngulube (2016) who argue that farmers’ decision to adopt input is
greatly influenced by the amount of information that is available. Also, the experience of some
rapidly growing economies such as China in achieving agricultural transformation was due to
an improvement of information services (Siyao, 2012). Therefore, Information and
Communication Technologies (ICT) services play a key role in the dissemination of Agricultural
Input Information (AII). Hence, well-informed farmers make wise decisions, which in turn are
responsible for improving agricultural productivity.

18
Developing countries have seen an incredible growth of ICT especially mobile phones. For
instance, Aker et al. (2016) report that between 1999 and 2014, the percentage of the
population with access to mobile phone coverage grew from 10% to 90%. The growth of the
worldwide subscriber base is fastest in developing countries, with four out of five new
connections being made in the developing world, and 880 million unique developing-market
subscribers estimated to register new accounts by 2020 (GSMA, 2012). In Mali, ICT (mobile
phone) rate of penetration moves from 7.14% in 2005 to 90.27% in 2012 (Diallo, 2013).
1.2. ICT USE IN THE AGRICULTURAL INPUT INFORMATION SECTOR
ICT on agricultural input information is any ICT resource that allows farmers to adopt (access,
send and utilise) information on agricultural inputs. Agricultural input information is defined
as any information on weather, best practices, crop planting, buy/use of fertiliser and seed.
This is emphasised by Dangi & Singh (2010) who argue that use of ICT adopt agricultural input
information enable farmers to access the latest local and global information on weather,
scientific farming practices as well as market prices of agricultural inputs, facilitate the sale
and buying of farm inputs. In addition, Aker (2011) suggests that agricultural input information
through an ICT service are on crop planning (better information on higher yield crop, seeds
varieties), on buying seeds (identify the best time to plant, buying inputs like fertiliser), on
planting (use better fertiliser and apply better techniques).
1.2.1. Availability of ICT on agricultural input information in developing countries
ICT services have been set up in developing countries to disseminate agricultural input
information. These services include telecentres and mobile phones mainly. For instance, more
than 60 telecentres have been created in Mali (MAIGA, 2009). The telecentres have been set
up in many other developing countries such as India, Tanzania, Uganda and Zambia
(Kameswari et al., 2011; Kaddu, 2011; Souter, 2010 ). Nevertheless, Churi et al., 2012 argue
that the mobile phones are becoming the popular method for disseminating agricultural
(input) information.

19
The mobile phone is considered to be the most widely ICT used channel to disseminate
agricultural input information in developing countries. This is emphasised by Aker (2011) who
argues that there has been a proliferation of mobile phone information services towards
farmers. Also, Scott et al. (2004) highlight the benefits of ICT (mobile phone), which include
market accessibility, the risk from disasters. They further argue that mobile phones empower
societies by enabling them to access information. Mobile applications have been used to
disseminate agricultural input information towards farmers. Examples include the ICT services
Senekela and Myagro in Mali; Nokia Life in India, Indonesia, Nigeria and China; IFFCO (Indian
Farmers Fertilizer Cooperative Limited) Airtel Initiative and E-choupal in India; TigoKilimo in
Tanzania; Ukisaan and Kissan in Pakistan (Sukhpal, 2004; Siraj, 2010; Pshenichnaya and Clause,
2013; Palmer, 2014; Chung, 2015; de la Rive Box et al., 2015; Singh et al., 2016).
1.2.2. Agricultural input information adoption and Use of ICT on agricultural input
information in developing countries
Despite the availability of different ICT services to disseminate agricultural input information,
adoption of agricultural input information remains a problem for cereal farmers. For instance,
KTM (2013) concluded that in Kenya, still, an improvement is necessary since a large number
of smallholder farmers (3.5 million) work without basic farm inputs. Also, it is estimated that
more than 45% of the cultivated areas are not fertilised in Mali (Ouedrago, 2008). The input
utilisation rates have always been low in Sub-Saharan Africa in general, and in Mali, Burkina
Faso and Ghana (Traoré et al., 2011). Thus, Wulystan and Andrew (2013) argue that the
Tanzanian agricultural sector has not gained benefit from ICT on agricultural (input)
information. Therefore, ICT on agricultural input information has not been able to increase the
adoption (access and use) of agricultural input information by cereal farmers.
The aforementioned non-increased adoption of agricultural input information is linked to the
low use of ICT on agricultural input information is due to less use of these ICTs. For instance in
Mali Senekela has 177,817 users (GSMA, 2015). This number is very small compared to the
potential users in the country where 73% of the population worked in the agricultural sector,
and the operator (Orange Mali) has two-thirds of customers in the country. Another ICT

20
service Myagro serves only 3,500 farmers in Mali and Senegal (de la Rive Box et al., 2015).
These limited users in Mali and Senegal were similar to Tanzania where Chung (2015) reports
that Tigokilimo had reached (only) 6% of its addressable market. These facts provide evidence
that the adoption (use) of the service by small-scale cereal farmers to access and use
agricultural input information is very low.
The low use of ICTs-based agricultural input information is due to certain factors. These factors
are farmers’ perception (Dey, Prendergast and Newman, 2008; Amin and Li, 2014), farmers
influence on each other (Palmer, 2015; Sathye et al., 2015), information quality (Mittal and
Mehar, 2012; Barakabitze, Fue and Sanga, 2017) and high cost of ICTs’ services (Williams,
2013; Chung, 2015; Sousa, Nicolay and Home, 2016).
1.2.2.1. Farmers’ perception of ICT and use of ICT on agricultural input information
In developing countries, studies picked out that perception of ICT services by cereal farmers
affect their use of ICT for adopting agricultural input information. For instance, in Mali Palmer
(2014) argues that the use of the ICT on agricultural (input) information was perceived as
difficult by (cereal) farmers. In addition, in Benin, Adegbidi et al. (2012) conclude that the use
of ICT needs positive outlook from the actors (farmers).
Rogers (1983) emphasised that the rate of innovation’ (ICT) adoption is affected by the
perception of the receivers. Therefore, the farmers’ perception of ICT is a factor in the use of
ICT on agricultural input information and this study will identify its effects on the use of these
ICTs by farmers.
1.2.2.2. Farmers sharing information on ICT on agricultural input information and its use
Farmers are known to share information among themselves and therefore influences each
other. For instance, Lwoga (2010) findings demonstrated that the principal origin of
information for farmers was preponderantly local (neighbours, friends and family). Also,
Midline (2015) reports that almost all users interviewed in his study on the use of a mobile
application on agricultural input information in Mali said that other farmers come to them
every month for farming advice. Dey, Prendergast and Newman (2008) conclude that the use

21
of mobile telephony (ICT) could only be effective where the technology was consistent with
the social processes and farmers’ lifestyles. Therefore, there is a need to investigate the
influence of farmers on each other (farmers’ peer influence) and its effect on use of ICT on
agricultural input information, which has to be done by this study.
1.2.2.3. Information quality and use of ICT on agricultural input information
The information delivered to farmers is important to them. For instance, Mittal & Mehar
(2012) report that farmers call for an improvement of the ICT delivered information quality.
In Mali, the incomplete content (incomplete information) was a barrier to the uptake of
Senekela (GSMA, 2015). Therefore, there is a need to improve the quality of the provided
information so that farmers can keep or start using ICT on agricultural input information.
Information is a valuable and useful tool to people in their attempts to cope with life, but the
value of information depends on many conditions including accessibility, relevance, accuracy
and currency (Chilimo and Sanga, 2006). In addition, Heeks & Molla (2009) emphasised that
the information should be complete, accurate, relevant, opportune, and appropriate.
Moreover, Msoffe & Ngulube (2016) argued that it is crucial for ICT services (information
providers) to disseminate information that satisfies farmers’ need and is appropriate to their
farming practices. Therefore, the Information Quality constitutes a challenge in the use of ICT,
and this study will identify its effect on the use of ICT on agricultural input information by
farmers.
1.2.2.4. ICT service cost and use of ICT on agricultural input information
Another challenge faced by farmers in the use of ICT on agricultural input information is the
high cost of ICT’ services. For instance in Tanzania, mobile phone services’ cost, excluded many
farmers from accessing TigoKilimo1 (Chung, 2015). In Mali, 95% of SENEKELA2 users find that
the cost is prohibitive (Palmer, 2014). Moreover, Batchelor et al. (2014) argue that even
though there is plenty of evidence that access to information can increase profits, small (scale
1 TigoKilimo is a value added service in Tanzania, disseminating information (on agricultural inputs) towards farmers. 2 SENEKELA is a value added service in Mali, disseminating information (on agricultural inputs) towards farmers.

22
cereal) farmers may not be willing to pay for information services (ICT). Therefore, Cost is a
factor in the use of ICT on agricultural input information and this study will identify its effect
on the use of these ICTs.
1.3. STATEMENT OF THE PROBLEM
Information is the secret to a knowledge base. The knowledge base is important as it enables
individuals to decide on what they are doing. Use of ICT on agricultural input information
should lead to a better adoption of agricultural input information. That was noticed by Aker,
Ghosh and Burrell (2016) who argue that ICT services such as mobile phones affect agricultural
(inputs) adoption and production via the agricultural (input) information provision. Therefore,
the use of ICT on agricultural input information leads to the adoption of agricultural input
information, which in turn will result in the use of farm inputs. Moreover, Lwoga, Stilwell and
Ngulube (2011) argue that the link between use of ICT and agricultural productivity is positive.
Nevertheless, despite the availableness of diverse ICT on agricultural input information
services, adoption of agricultural input information by cereal farmers in developing countries,
particularly Mali, is still a challenge. Many studies emphasise that there is a lack of adoption
of agricultural input information (Richardson, 2005; Heeks, Gao and Ospina, 2010; Kameswari,
Kishore and Gupta, 2011; Chung, 2015; GSMA, 2015).
The aforementioned lack of adoption of agricultural input information has resulted in a low
productivity due to the non-use of agricultural inputs. That point was highlighted by Dey,
Prendergast and Newman (2008) conclude that lack of use of technology (ICT) in the
production (by farmers) leads to lack of productivity of the farmers. Thus, the main challenge
faced by many (small-scale cereal) farmers in Mali is access to selected seeds and fertilisers
(de la Rive Box et al., 2015), which is related to the adoption of agricultural input information
(Msoffe and Ngulube, 2016). Therefore, farmers access to services and information need to
be improved on traditional crops (Wollni and Qaim, 2014), so too on ICT on agricultural input
information services.

23
Other information services for farmers are better developed in developing countries
compared to agricultural input information services. For instance, even if Mali and Burkina
Faso have a well-established phytosanitary system, a lot remains to be done in the fertiliser
and seed sector (IFDC, 2004).
Previous studies (Maumbe and Okello, 2010; Rezaei-Moghaddam and Salehi, 2010; Aker,
2011; Sanga, Kalungwizi and Msuya, 2013; AGRA, 2014; Msoffe and Ngulube, 2016) concur
that use of ICT on agricultural input information would be applicable to farmers in developing
countries if certain conditions were met. These conditions (factors) need to be established and
find a way to overcome them. Then more use of ICT services can be realised and therefore an
increased adoption of agricultural input information. That can then be the basis for increasing
the productivity of cereal crops. Hence, an investigation needs to be conducted into these
factors affecting farmers’ use of CT on agricultural input information and their relationships to
inform the design and delivery of these ICTs to small-scale cereal farmers in developing
countries.
1.4. RESEARCH OBJECTIVES
The broad objective of this study is to propose an ICT model for increased adoption of
agricultural input information.
The specific objectives are:
1. To establish farmers’ perception of ICT on agricultural input information and to
identify the effect of that perception on the use of these ICTs.
2. To establish farmers’ influence on each other in the use of ICT on agricultural input
information and to identify the effect of that influence on the use of these ICTs.
3. To establish the challenges faced by farmers in the use of ICT on agricultural input
information and to identify the effects of these challenges in the use of these ICTs.
4. To propose an ICT model for increased adoption of agricultural input information
in developing countries using a case in Sikasso, Mali.

24
1.5. JUSTIFICATION
Farmers’ adoption of agricultural input information is still limited. This adoption is restrained
by the low use of ICT on agricultural input information. Therefore, use of these ICTs needs to
be improved to enable farmers to adopt agricultural input information in developing countries
by proposing a model. Discernment of the drivers and barriers related to the use of ICTs allows
the developing of schemes to boost ICT adoption and step up the effectiveness and efficiency
of accessing and using agricultural information (Adegbidi et al., 2012) and agricultural input
information.
Models of ICT adoption/use have been proposed in developing countries in many fields such
as health, education, e-government, agriculture. However, few studies have proposed a model
in the context of agricultural input information in developing countries for cereal farmers.
Even the few proposed models have shortcomings. For instance, Adegbidi et al. (2012)
proposed a model for rice farmers in Benin. This model did not take into accounts the most
cereal crops that are millet, sorghum, maize (with wheat and rice increasing in importance) in
developing country, particularly African countries as suggested by Wood & Cowie (2001).
Moreover, this model did not take into accounts the factors Cost, Social Influence and
Information Quality that were identified as affecting use of ICT on agricultural input
information. More details of these models are discussed below in the literature review section
(section 2.6). Therefore, this study is justified in developing countries and aims at proposing
an ICT model for increased adoption of agricultural input information by small-scale cereal
farmers.
1.6. SCOPE
The overall scope of this study was to propose an ICT model for increased adoption of
agricultural input information by small-scale cereal farmers in developing countries. The study
was conducted in Sikasso (Mali) with small-scale cereal farmers.

25
1.7. SIGNIFICANCE
The outcomes of this research should be beneficial for many stakeholders. Academicians, ICT
services designers, policymakers, farmers’ organisations and farmers and development
partners.
This work will be relevant to scholars especially those undertaking studies focusing on ICT
adoption/use especially in Mali. It would be specifically relevant for scholars working on ICT
and agricultural input information in developing countries.
The model would inform the ICT on agricultural input information designers about what would
lead to more the use of these ICT services in agricultural input information sector.
Government policymakers have the responsibility to create relevant policies for the ICT-based
agricultural (input) information sector. Therefore, they need empirical evidence and
appropriate information for policy framework craftiness.
Farmers’ organisations would find this work useful whilst providing guidance for cereal
farmers and developing their guidelines. Development partners interested in enhancing farm
inputs’ use for more productivity would find this work useful.
1.8. OPERATIONAL DEFINITION
This section introduces some of the key concepts used in this study.
1.8.1. ICT
An ICT (Information and Communication Technology) is any device, tool or application that
permits the exchange or collection of data through interaction or transmission (World Bank,
2011). Wulystan & Andrew (2013) quoting Shetto (2008) argued that computers, radio,
television, the internet, CD-ROMs and telecommunication networks constitute ICTs in
agriculture. Aker (2011) distinguishes two ICTs: the traditional ICTs (radio and television) and
the new ICTs (mobile phone, computer). The scholar further argues that in developing

26
countries, many ICTs initiative have moved away from traditional to the use of mobile phones,
including SMS and the Internet-based services.
In this study, ICT services include mobile phone applications and services on agricultural input
information and telecentres that permit farmers to access and use agricultural input
information.
1.8.2. Household Head
The head of the household is an individual in one family setting who supplies actual support
and maintenance to one or more individuals who are connected to him/her (Advameg, 2016).
Domestic units are barely limited to the nuclear family in ‘collectivist societies’ that
characterise most societies of developing countries (Sathye et al., 2015; Advameg, 2016). In
such societies, the family consists of an extended patrilineal family (father, his brothers and
their wife/ves and children, his wife (ves), his sons, their wives and children, and unmarried
daughters). The household head in this study is anyone who is leading the agricultural
activities of the family and using ICT on agricultural input information, i.e. headed mother,
headed son, headed wife, headed small brother.
1.8.3. Cereal
Maize, sorghum and millet are the important cereal crops in Africa (Wood and Cowie, 2001).
The authors further report that wheat and rice are increasing in importance. This study refers
to cereals as millet, sorghum, maize and fonio.
1.8.4. Agricultural Input Information
Table 1.1 defines agricultural input information as used in this study. Access is defined as a
way of reaching something and in this case a way of reaching information on agricultural
inputs. Use of agricultural input information is to act according to that information. This study
refers to adoption as that access and use of agricultural input information.

27
Table 1.1. Agricultural input information
Stage Information
Crop planning Information on yield
Information on crops
Information on seed
Buying seeds Information on best time to plant
Information on inputs (e.g. fertilisers)
Planting Information on how to use fertiliser
Information on how to plant a specific seed
Information on the best technique for a seed, fertiliser….
Source: adapted from Aker (2011)
1.8.5. Innovation, Use, Adoption and Diffusion
Innovation can be defined in many ways. Bui (2015) argues that there is a lack of consistency
across research regarding the constructs such as ‘innovation’ or ‘innovatinness’. Therefore, for
any study using such terms, there is a need to define them regarding the undergoing study.
Scholars recognise innovation as a new way of conducting or carrying out activities, whether
in the form of new ideas, new productions combinations, or new technological process (Bui,
2015). In the studies of Information Technology and Individuals, the term innovation is used
as Information and Communication Technologies (ICT) use or adoption by individuals (Lim et
al., 2009). Therefore, ICT use or adoption is considered as an innovation. That applies to a case
whereby the study is looking at the factors that affect the using of ICT on agricultural input
information.
Use is defined in this study as the decision to start using ICT. In this study, Adoption and Use
are used to specify that decision. Diffusion refers to adoption in innovation research (Simin
and Janković, 2014). In conclusion, Diffusion of Innovation is used as Technology (ICT on
agricultural input information) acceptance or adoption by individuals. That was noticed by

28
(Bui, 2015) who argues that examples of innovation studies include technology acceptance or
appropriateness. Diffusion of Innovation Theory (IDT/DOI) refers to use of ICT. The Use is
defined in the DOI at the persuasion level, which is Behavioural Intention (BI) in other
technology acceptance models/theories such as UTAUT or TAM. Therefore, Use of DOI refers
to BI. The DOI is more discussed in chapter 2 (section 2.4.3).
1.9. ASSUMPTIONS
This study has some assumptions. An assumption is any significant fact presumed to be true
but not verified (Gay, 1976). It does not need testing, unlike the hypothesis. This study
assumes that:
1. The use of agricultural inputs will increase the agricultural productivity.
2. There exist other factors not covered in this work, which can affect the agricultural
productivity.
3. Other factors affect the adoption of agricultural input information.
The figure below gives an overview of the ICT on agricultural input information value chain.
Figure 1.1 ICT on agricultural input information value chain
Source: Adapted from Heeks & Alemayehu Molla (2009)
Factors Relative advantage Simplicity Compatibility Observability Social Influence Cost Information Quality
Use of ICT on agricultural input information
Increased adoption of agricultural
input information
Use of inputs
Impact Productivity
1 2 3 4
5

29
This study is focussed on stage 1, 2 and 3. It identified the factors (stage 1) that have an effect
on Use of ICT on agricultural input information (stage 2) for an increased adoption of
agricultural input information (stage 3). As stated in the scope above, this study does not cover
the stage 4 (use of agricultural inputs) and 5 (productivity). In addition, other factors are a
source of increased adoption of agricultural input information. For instance, agricultural
extension officers can disseminate agricultural input information.
1.10. THESIS STRUCTURE
This thesis comprises five chapters. Chapter 1 introduces the problem under investigation, i.e.
the lack of adoption of agricultural input information due to the low use of ICT on agricultural
input information focussing on Mali. The chapter links:
agricultural productivity to use of agricultural inputs
use of farm inputs to the adoption of agricultural input information
adoption of agricultural input information to the use of ICT on agricultural input
information
Afterwards, Chapter 1 defines the research problem, objective, justification, scope,
significance, the operational definition of the keys terms, assumptions and structure of this
thesis.
Chapter 2 deals with the literature that relates to the context of this study. It reviews the
theories and models in the field of Information and Communication Technologies (ICT) use or
adoption by individuals. Chapter two goes on by extracting the empirical constructs in
accordance with the research objectives using the Grounded Theory as suggested by Urquhart
and Fernández (2013) from related studies in developing the country in general and
particularly in Mali. The framework of Müller-Bloch and Kranz (2015) was followed in the
chapter to find out the empirical and theoretical gaps. These resulted in a conceptual
framework with hypotheses related to the objectives. The results of this chapter were
validated through a peer review publication.
Chapter 3 focusses on the study’s methodology. It starts with the research paradigm that
underlines the philosophical point of view of this study. It continuous by presenting the study

30
design, the study area, sampling method and procedure, the data collection and the data
analysis. In addition, the research instrument formulation, translation and validation are
presented in chapter two.
Chapter 4 reports the results of the main study. Descriptive statistics are reported using SPSS
v 20. It goes on by presenting the model (measurement and structural) assessment achieved
by following the steps of the Partial Least Squares Structural Equation Modelling (PLS-SEM).
The chapter first reports and discusses the descriptive statistics. It then presents the
assessments of the two model of the PLS-SEM by research. This chapter also compares the
findings with the current literature.
Finally, chapter 5 discusses the achievements, contributions and implications, limitations,
conclusion and recommendation of this research.

31
CHAPTER TWO
LITERATURE REVIEW
This chapter reviews the literature on ICT on agricultural input information’ use by small-scale
cereal farmers. The first section starts by linking the low agricultural productivity to the lack
of adoption of agricultural input information, which can be disseminated by ICT.
To show that ICT on agricultural input information services have been deployed in developing
countries, we reviewed experiences from India, Indonesia, Tanzania, Kenya, Pakistan, China
and Mali. That is done under section 2 of the chapter. Section 3 presents the observations
from these experiences. The chapter goes on by reviewing in section 4 the theoretical
literature. The next section that is section 5 discusses the empirical literature. Section 6
presents the identified Gaps. The chapter finishes by drawing the conceptual framework and
hypotheses in section 7.
2.1. INTRODUCTION
Agriculture constitutes the backbone of the economy many developing countries. For
instance, Bwalya (2009) argues that agriculture is the mainstay of the Ethiopian economy.
Also, in Mali, it contributed to 37% of the country’s Gross Domestic Product in 2008 (Angelucci
et al., 2013). Furthermore, Siyao (2012) argues that the Tanzanian economy’s mainstay has
been the agricultural sector. Moreover, Agriculture is the key sector of the Indian economy
(Kameswari, Kishore and Gupta, 2011).
Small-scale farmers dominate the agricultural activities in developing countries. For instance,
the Tanzanian agricultural activities are dominated by small-scale farmers (Siyao, 2012). Also,
these farmers predominate the agricultural production in India (Kameswari, Kishore and
Gupta, 2011). Furthermore, in Mali, the agriculture sector is dominated by small family farms
(68%) (Angelucci et al., 2013).

32
Cereals such as millet, maize, rice, sorghum and fonio constitute the main agricultural
production in these countries. For instance, in Mali, cereals constitute the main part of the
agricultural production (Aparisi and Balie, 2013). Also, in Ethiopia, in the year 2010/11, over
96 percent of cereals were produced by smallholder farmers (Bwalya, Asenso-Okyere and
Tefera, 2012). Cereal crops are essential for better food security in Africa (Murage et al.,
2013). Maize is Ghana's most important cereal crop (Doss, 2006).
However, studies argue that these agricultural activities are marked by low productivity
(Traoré et al., 2011; Murage et al., 2013; AGRA, 2014). Agricultural inputs such as seeds,
fertiliser and advice are essential to increase yields and hence production. The International
Development Fertilizer Centre (2004) concludes that a sustainable agricultural intensification
cannot be achieved without the greater adoption of appropriate inputs, which permit an
increase of the yield. That was also confirmed by Kinyangi (2014) who argues that the use of
agricultural technologies affects the rate of growth in agricultural output. In general, farmers
should be able to accomplish higher yields if they use good practices, have access to inputs
and use them.
How can farmers have access to these inputs? They should have information on agricultural
inputs and use that information. As it is right for most sectors, information is one of the key
inputs in agriculture (Kameswari, Kishore and Gupta, 2011). In addition, the experience from
China shows that the agricultural transformation of this rapidly growing economy is due to an
improvement of its information services (Siyao, 2012). That was emphasised by Lwoga et al.
(2011), who argue that an improved agricultural (input) information is the key element to
ameliorate the agricultural production of small-scale agricultural. Lio & Liu (2006) argue that
ICT especially mobile phones helped raise farm output prices and lower input prices through
the mechanism of information diffusion. Therefore, ICT play a core function in disseminating
agricultural input information for more access and use of these agricultural inputs, which in
turn will increase productivity and hence production.
ICT services have been set up in developing countries in the agricultural field. That was noticed
by Aker, Ghosh and Burrell (2016) who argue that numerous ICT initiatives have been designed
and disseminated in developing countries. More than 140 ICT services have been deployed in

33
developing countries as per 2015 (Aker, 2011; Nakasone, Torero and Minten, 2014).
Therefore, farmers have been exposed to ICT on agricultural input information in developing
countries, and developing countries’ access to ICT has increased considerably in the last
decade.
Despite that growth and farmers’ exposition, the adoption of agricultural input information is
restrained by ICT on agricultural input information due to certain factors. For instance, Aker
et al. (2016) argue that many factors mediated the potential impacts (increased adoption of
agricultural information) of information technology in the agricultural sector. The question
that can be asked now is Have ICT on agricultural input information increased the adoption of
agricultural input information. If yes, to what extent? If no, what can be done? The next section
discusses ICT on agricultural input information services deployed in this sector in developing
countries to answer these questions (gaps) and address them (conceptual framework and
hypotheses).
2.2. SELECTED ICT ON AGRICULTURAL INPUT INFORMATION IN
DEVELOPING COUNTRIES
This section reviews some ICT on agricultural input information deployed some developing
countries. The mode of access (technology used), the model of business and the description
of each one of these reviewed ICT on agricultural input information is presented. The aim is to
show that developing countries have set up ICT services to disseminate agricultural input
information. Experiences from eight developing countries are reviewed. Nevertheless, more
than fifteen developing countries are covered in this work.
2.2.1. Experiences from India
ICT services are important in the dissemination of agricultural input information. Information
and communication technology is expected to play a central role in improving the farm’s
operations, facilitating inputs procurement transactions, overcoming the low rural agricultural
production (Mittal and Mehar, 2012). An increase in convenience and cost savings were

34
reported by farmers with their mobile phones to look for farm inputs’ information (ibid.). In
India, various ICT services are used to provide agricultural (input) information to farmers
(Kameswari, Kishore and Gupta, 2011). Some of them are presented below.
2.2.1.1. E-choupal
Technology used: Mobile Phone, Personal Computer, information systems
Model: Subscription based (consumers pay)
Description: The ITC (Indian Tobacco Company) Limited's e-choupal project is an ICT-based
project, which aims at building effective farmer-agribusiness linkages. The model has been
designed to tackle the problems of fragmented farms, weak infrastructure and a large number
of intermediaries in the Indian farming sector (Sukhpal, 2004). The system permits:
Delivery of current and appropriate information that help farmers to ameliorate their
decision-making on farm inputs and hence better productivity.
Aggregation of demand at the village level for accessing higher quality inputs and
knowledge at lower costs.
Agricultural input information: weather information, advice on the activities in the farming
life cycle, agricultural best practices organised by crop type and buying inputs such as seeds,
fertiliser and pesticides in local languages (Dangi and Singh, 2010).
2.2.1.2. IFFCO Airtel
Technology used: Mobile Phone (Siraj, 2010)
Model: Subscription based (consumers pay)
Description: Indian Farmers Fertiliser Cooperative Limited (IFFCO) and Airtel3 launched a
service for Indian farmers on agricultural input information in 2008 (Singh et al., 2016).
Farmers can buy a mobile phone that is already registered for the initiative and look for
agricultural input information through SMS (Short Message Service) or a call centre.
3Airtel is a telecom operator in India

35
IFFCO Airtel provides the best time to plan, the weather information, prices of farm inputs
(fertilisers and seeds) as agricultural input information to farmers in all local languages (Singh
et al., 2016).
2.2.2. Experiences from Indonesia
Like the previous developing country, some experiences in the dissemination of agricultural
input information to farmers have been set up in Indonesia.
2.2.2.1. Nokia life:
Technology used: Nokia Mobile Phones
Model of business: Subscription based (consumers pay)
Description: Nokia life suite is an information service through mobile phone (Nokia) launched
in India in 2009 and scaled the same year in Indonesia, and currently used in Nigeria and China.
In the four countries, the service is cheaper in Indonesia than the others. In a report on Nokia
Life, Pshenichnaya & Clause (2013) found that the service cost is: 5 Chinese Yuan (0.76 US$) in
China per month, 60 Indian Rupee (0.88 US$) in India per month, 500 Indonesian Rupiah (0.03
US$) in Indonesia per month and 250 Nigerian Naira (1.25 US$) in Nigeria per month. In
Indonesia, Nokia heads the ranking as reported by Ueno & Yoshida (2012). The Indonesian
experience on this service is therefore different from the three other countries in terms of
cost of the service. Thus we have chosen to review Indonesian experience of that ICT service.
Nokia Life delivers Education, Health, Agriculture and infotainment services to address the
information gap and enable consumers in emerging societies to be better informed and to
improve their livelihoods (Pshenichnaya and Clause, 2013). The service delivers information
on agricultural inputs via SMS.
Agricultural input information: crop tips, agriculture news, market prices, weather
information and advisory.

36
2.2.3. Experiences from Tanzania
2.2.3.1. TigoKilimo
Technology used: Mobile phone
Model of business: Subscription base (consumers pay)
Description: this agricultural value-added service (Agri VAS) in Tanzania provides relevant,
timely and actionable information on farm inputs and market intelligence. Farmers can use
Unstructured Supplementary Service Data (USSD), Interactive Voice Response (IVR) and
helpline to access Content (Chung, 2015). The services are available in Kiswahili and English
(http://www.tigo.co.tz). Moreover, as a result, respondents (88%) reported that they were
making changes thanks to TigoKilimo information. These changes occur in realising for farmers
higher yield that was auctioned by more access and use of farming practices (37%), and
current and relevant weather (23%)(Chung, 2015).
Some farmers gave their testimonial on this ICT. For instance, ‘previously I used to weed the
field, remove all grasses, and take them away from the field. However, through TigoKilimo, I
obtained knowledge that I should not collect the weeds away from the field but to leave them
there.so, now I do as they advised me to.’ (Chung, 2015).
Agricultural input information: farm input prices, weather forecasts, agronomy advice
2.2.3.2. Z-Kilimo
Technology used: Mobile phones
Model of business: Subscription based (consumers pay)
Description: Z-Kilimo is an SMS-based application in Tanzania, utilising mobile phone
capability and ubiquity to provide access to comprehensive farming methods operated by
Zantel (a network provider in Tanzania).
Agricultural input information: daily weather forecast, details on soil management, pest
control methods and information on livestock knowledge and bird flu (Zantel, 2013).

37
2.2.4. Experiences from Kenya
The Kenyan Markets Trust (2013) reports that Kenya made substantial steps in improving
agricultural productivity with agricultural inputs by farmers. We review below some of the ICT
services set up in the country to disseminate agricultural (input) information to farmers.
2.2.4.1.M-FARM
Technology used: Mobile phone and web platform
Model of Business: Subscription based (consumers pay)
Description: M-farm is a mobile service and a web platform that aims to improve Kenya’s
agricultural sector by connecting farmers with one another because peer-to-peer
collaboration can improve market information (World Bank, 2011). The service assists farmers
to know when to plant and connect to sell as reported by mfarm (2016).
Agricultural input information: farm inputs prices, where to buy farm inputs, weather
forecasts, the best time to plant.
2.2.5. Experiences from Pakistan
In the recent years, Pakistan made tremendous strides in improving ICT services for masses
(Siraj, 2010). In the field of agricultural input information dissemination, some ICT services
have been set up in the country.
2.2.5.1. Ukisaan
Technology used: Mobile phones, web portal
Model of Business: Subscription based (consumers pay)
Description: Ukisaan is an agricultural value-added service launched by Ufone4 towards
farmers. It provides information on a call made by the peasants. It is only available for the
users of this telecom operator.
Agricultural input information: agricultural crops, livestock farming, non-conventional crops,
poultry and fruit farming, weather alerts, in regional languages.
4Ufone is an operator telecom in Pakistan

38
2.2.6. Experiences from China
ICT brought a new chance for two-way information flow between farmers and service
providers (Sylvester, 2013). Asian examples of ICT services are becoming a primary source of
information for farmers by providing them information and advice, and giving them the option
to speak to an agricultural expert (ibid.). Some of this agricultural VAS are reviewed below.
2.2.6.1. NOVA
Technology used: Mobile phones, web portal
Model of Business: Subscription based (consumers pay)
Description: The agricultural information dissemination is done by NOVA (agriculture and
production information system (CICC, 2003). It is a web-based agricultural service. Some
farmers achieved significant productivity thanks to the use of information on agricultural
products including farm inputs. Some farmers even claimed that they could no longer work
without the system. Farmers on site, proving that it gives the assistance required, generally
accept the system. In particular, the system of installing a help centre, which provides the
same services on the telephone as online in environments without PC access was highly
assessed, as was the function of achieving immediate results of exploring new sales channels
to farmers (CICC, 2003).
Agricultural input information: weather forecasts, best practices, farm inputs prices, where
to buy inputs (seeds, fertilisers)
2.2.6.2. SOUNOUNG
Technology used: Mobile phones, web portal
Model of business: Subscription based (consumers pay)
Description: SOUNOUNG disseminates agricultural input in China. Harrod & Jamsen (2010)
argued that the project provide an aggregated information from a search engine to farmers.
They further reported that in 2009, 1276 households were using the website and by 2010, that
figure doubled indicating an indisputable success for the project. What is the source of this
achievement? The project works with farmers’ organisations as partners that are well
structured and functional. Farmer organisations’ members can access information from the
service using their computers, mobile phones and personal digital assistants (PDAs). Farmers

39
can access agricultural input information according to their farm characteristics. Farmers of
the organisation who may not have computers, mobile phones or PDAs, the farmers’
organisation (cooperative) can also print information and recommended actions (Harrod and
Jamsen, 2010). The cell phone was found to be the most ICT service used in China because of
its timeliness and convenience (Harrod and Jamsen, 2010).
Agricultural input information: weather forecasts, best practices, farm inputs prices, where
to buy inputs (seeds, fertilisers).
2.2.7. Experiences from Mali
The most ICT-based agricultural input information tool in Mali and elsewhere is the mobile
phone. It was brought in Mali in the 1990s with only one network provider. The use of that ICT
has arisen since then in terms of the number of network providers, coverage, subscriptions
and services offered. For instance, in 1999, there were 6,375 mobile phone subscribers, 4.5
million subscribers in 2009 and 10.3 million in 2014 (Issa FOFANA, 2010; GSMA, 2015).
The mobile phone based agricultural input information can be traced to 2011. A private
extension service Myagro (N’gasene) started to disseminate farm inputs information towards
farmers around the district of Bamako (Kante, Oboko and Chepken, 2017). Thereafter, Myagro
launched its services in Sikasso, considered as the granary of Mali (DRPSIAP, 2011). These ICT-
based agricultural input information tools are presented below.
2.2.7.1. Senekela
Technology used: Mobile phones
Model of business: Subscription based (consumers pay)
Description: “SENEKELA” is an ICT’ service provided by Orange Mali to help the Malian farmers
to increase their farm productivity and to provide the ingredients, which can assist them to
commercialise their production better. The project uses an SMS service for farmers to access
market information. It is currently deployed in two regions out of eight. However, the cereals
concern is addressed only in the Sikasso region while the shea nut is dealt with in Koulikoro
(Palmer, 2015).
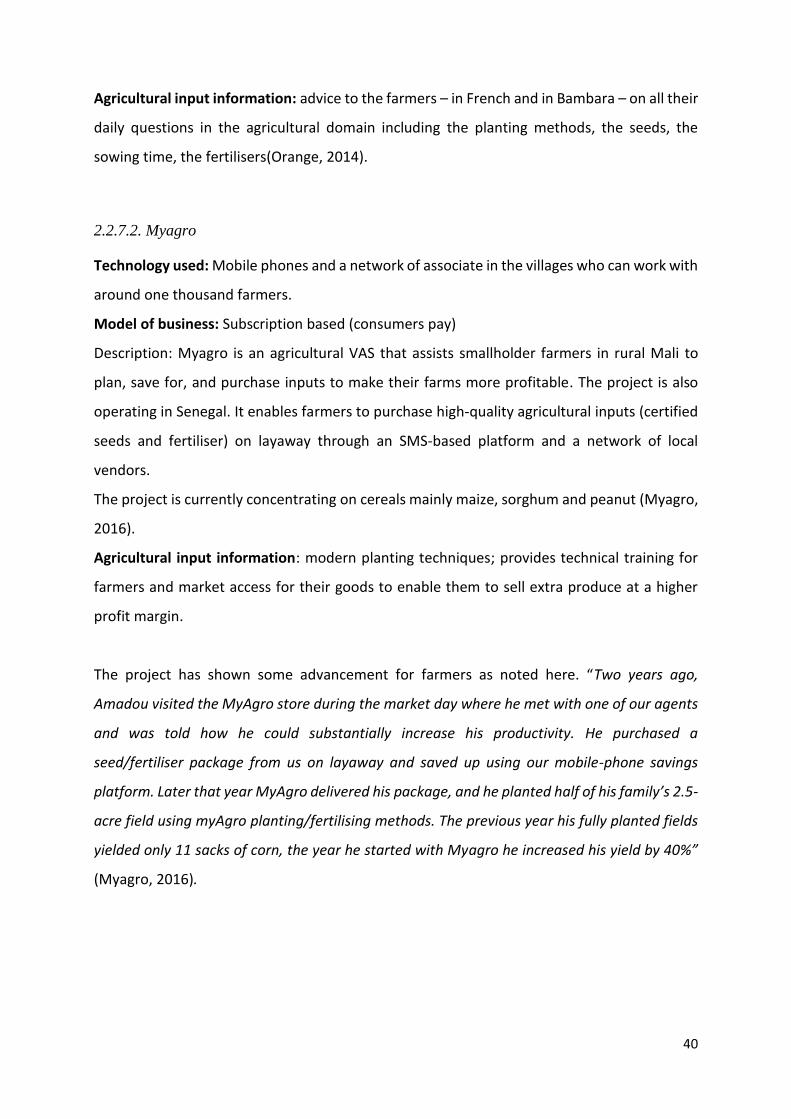
40
Agricultural input information: advice to the farmers – in French and in Bambara – on all their
daily questions in the agricultural domain including the planting methods, the seeds, the
sowing time, the fertilisers(Orange, 2014).
2.2.7.2. Myagro
Technology used: Mobile phones and a network of associate in the villages who can work with
around one thousand farmers.
Model of business: Subscription based (consumers pay)
Description: Myagro is an agricultural VAS that assists smallholder farmers in rural Mali to
plan, save for, and purchase inputs to make their farms more profitable. The project is also
operating in Senegal. It enables farmers to purchase high-quality agricultural inputs (certified
seeds and fertiliser) on layaway through an SMS-based platform and a network of local
vendors.
The project is currently concentrating on cereals mainly maize, sorghum and peanut (Myagro,
2016).
Agricultural input information: modern planting techniques; provides technical training for
farmers and market access for their goods to enable them to sell extra produce at a higher
profit margin.
The project has shown some advancement for farmers as noted here. “Two years ago,
Amadou visited the MyAgro store during the market day where he met with one of our agents
and was told how he could substantially increase his productivity. He purchased a
seed/fertiliser package from us on layaway and saved up using our mobile-phone savings
platform. Later that year MyAgro delivered his package, and he planted half of his family’s 2.5-
acre field using myAgro planting/fertilising methods. The previous year his fully planted fields
yielded only 11 sacks of corn, the year he started with Myagro he increased his yield by 40%”
(Myagro, 2016).

41
2.3. OBSERVATION OF THE REVIEWED EXPERIENCES
The experiences from developing countries conclude that ICT services have assisted in
adopting agricultural input information to farmers. For instance, the Chinese experience was
a success in achieving a transformation of the agricultural activities according to Siyao (2012).
We can conclude from the Chinese experience that the timeliness, the relevancy and the
appropriateness of the information, which are information quality characteristics, were the
key factors for the success of the ICT service. It was also found that the use of Personal Digital
Assistant (PDA) and computer were the most ICT means used to get agricultural input
information.
The question to ask now is that can we implement the Chinese experience in developing
countries? In most of developing countries, the ICT Skills and Illiteracy are barriers to the use
of PDAs or computers. The cost of such devices is another factor to take into account for
farmers. The answer to that question is therefore that the Chinese experience cannot be
applied in most of developing countries.
On the other hand, in China, giving the agricultural input information in a printed form is an
appropriate manner of presenting the information to the farmers who do not have the ICT
Skills. Nevertheless, they have to read it, which is re-challenged by the illiteracy in most
developing countries. The fact that farmer organisations help farmers to access and use
agricultural input information can be helpful for most of the developing countries. However,
it supposes that the farmers have to travel from their farm to get the information. That would
be a waste of time for the farmers. Therefore, again, the ICT models from the Chinese
experience on agricultural input information cannot be applied to most developing countries.
The main conclusion is that three issues come up: 1) farmers are still facing a lack of
agricultural input information; 2) This lack of information is restrained by the low use of ICT
on agricultural input information and 3) that low use is due to certain factors. The next section
discusses these factors.

42
2.4. TECHNOLOGY ADOPTION THEORIES/MODELS
This section describes some of the relevant models for ICT on agricultural (input) information
adoption. In Information System Research, theories and models have been developed to
explain users’ use (adoption) of technology. IS research was built upon the use of theories (Lim
et al., 2009).
Attempts were made to define a theory. Mittelstraß (2004) argues that generalisation of
empirical evidence constitutes a theory. It is an important vessel to document our
interpretation of the world. Bacharach (1989) defines theory as a system of statements
targeted at describing, explaining, and predicting real-world phenomena. A scientific theory is
a system composed of two core constituents: (1) factors and (2) hypotheses (Mueller and
Urbach, 2013). Therefore, a tested conceptual framework with constructs and relationship
between these constructs constitutes a model.
Doing a literature review from 1998 to 2006, covering 386 research articles, Lim et al. (2009)
identified 154 theories in the field of IS research. Among these, there were ten widely used
theories. Concerning Information Technology and Individual study, they identified five most
used models. The Technology Acceptance Model (TAM) was the most used with 20% of the
papers using it; Theory of Reasoned Action (TRA) followed it as the second; Diffusion of
Innovation Theory (DOI/IDT) was third and the fourth and fifth widely used were the Theory
of Planned Behavior (TPB) and the Social Cognitive Theory (SCT) (Lim et al., 2009).
In the field of agricultural input information and technology adoption research, the DOI has
been applied in Benin (Adebedi et al, 2012) to propose a model of ICT’ adoption by rice
farmers. In Iran, TAM and DOI have been applied to predict the construct that affects ICT’
adoption in Iran (Rezaei-Moghaddam & Salehi, 2010). In addition, Zewge and Dittrich (2017)
also report the TAM and DOI as the most used theory in developing countries in explanation
and prediction studies on agriculture. However, Woosley and Ashia (2011) argue that TAM,
DOI and the Unified Theory of Technology Acceptance Model (UTAUT) are the three most
technology acceptance models. The TAM, DOI and UTAUT can be categorized as belonging to
the stream of thought that is based on the intention of usage as the dependent variable
(Woosley and Ashia, 2011). TAM, UTAUT and DOI are presented below.

43
2.4.1. Technology Acceptance Model (TAM)
TAM adapted from the Theory of Reasoned Action (TRA) is an information system theory that
models how users come to accept a technology and how they use that technology. Kondo et
al. (2013) argue that amidst the well-developed theories, TAM received extensive empirical
documentation on the validations, applications, and replications of its power to forecast the
behaviour of adoption.
Perceived Usefulness and Perceived Ease of Use determine an individual's intention to use a
system with the intention to use serving as a mediator of actual system use according to the
TAM (Surendran, 2012). It includes beliefs about usefulness and ease of use as the primary
determinants of ICT adoption in organisations. The two most important individual beliefs of
TAM in using information technology is the Perceived usefulness and the Perceived ease of
use (Li, 2010). The literature defines Perceived usefulness is defined as the degree to which a
person believes that using a particular system would enhance his or her job performance (Li,
2010; Kondo, Ishida and Ghyas, 2013). In addition, perceived ease of use is defined as the
degree to which a person believes that using a particular system would be free of effort. The
two behavioural beliefs, perceived usefulness and perceived ease of use, then lead to
individual behaviour intention and actual behaviour (Figure 2.1). Ventkatesh et al. (2003)
argued that perceived usefulness is also seen as being directly impacted by perceived ease of
use.
Figure 2.1 Technology Acceptance Model (TAM)
Source: Davis et al. (1998), Venkatesh et al. (2003)
Researchers have also extended the model. For instance, many other factors such as
subjective norm perceived behavioural control, and self-efficacy have added to the model

44
(Hartwick and Barki, 1994; Mathieson et al., 2001; Taylor and Todd, 1995). Other researchers
introduce additional belief factors from the diffusion of innovation literature, such as
trialability, visibility, or result demonstrability (Agarwal and Prasad, 1997; Karahanna et al.,
1999; Plouffe et al., 2001). However, Li (2010) argues that the structure and major
presupposition of these theories rest the same as those of the TAM.
Despite being the widely used theory, shortcomings have been pointed out about TAM. Li
(2010) argues though TAM is a useful model, it needs to be expanded to include social and
human factors. Among the critics of TAM, Bagozzi (2007) has highlighted perhaps the most
shortcomings. The researcher noted that the issues with TAM are not entirely peculiar to it,
but in here as well in the TRA and the TPB, which should bring interruption to accepting any
proposal suggesting that the TRA and TPB constitute panaceas for the field. In addition, that
for purposes of organization, he maintains that the primary shortcomings of TAM (and the
TRA and TPB) reside in (1) two critical gaps in the framework, (2) the absence of a sound theory
and method for identifying the determinants of PU and PEU, as well as other bases for decision
making, (3) the neglect of group, social, and cultural aspects of decision making, (4) the
reliance on naïve and over-simplified notions of affect or emotions, and finally (5) the over-
dependence on a purely deterministic framework without consideration of self-regulation
processes (Bagozzi, 2007).
Moreover, (Li, 2010) argues that many other researchers found no empirical evidence to
support the relationship between perceived ease of use and perceived usefulness (Chau and
Hu, 2001; Bajaj and Nidumolu, 1998; Hu et al., 1999; Jackson et al., 1997; Subramanian, 1994).
The researcher concludes that though TAM is useful, it needs to be expanded to include social
and human factors.
2.4.2. Unified Theory of Acceptance and Use of Technology (UTAUT)
Venkatesh et al. (2003) examined eight technology acceptance models. They formulated a
model that integrates and unifies the characteristics and elements of these eight models. This
proposal is labelled the UTAUT Model. The theories that were incorporated into the UTAUT
are the Theory of reasoned action (TRA), Theory of Planned Behaviour (TPB), Technology

45
Acceptance Model (TAM), Combination of TPB and TAM, Motivational Model, Personal
Computer (PC) Utilization, Diffusion of Innovation (DOI), and the Social Cognitive Theory. The
UTAUT integrates the common elements of these eight theories (Ventkatesh et al., 2003). The
validation of the UTAUT was conducted to conclude a 70% variance in usage intention
(Venkatesh et al., 2003). UTAUT suggests that three constructs are the main determinants of
intention to use an information technology (Figure 2.2). The three constructs are performance
expectancy, effort expectancy, and social influence (Li, 2010). The fourth construct
(Facilitating conditions) affects user behaviour. Ventkatesh et al. (2003) define Performance
expectancy as the degree to which an individual believes that using the system will help him
or her to attain gains in job performance. They argue that Effort expectancy is the level of ease
associated with the utilization of the scheme. Social influence is defined as the extent to which
an individual perceives that important others believe he or she should use the new system.
Finally, they argue that Facilitating conditions are defined as the degree to which an individual
believes that an organisational and technical infrastructure exists to support the use of the
system. The theory has been extended to UTAUT 2, which has the construct price as affecting
the behavioural intention.
Figure 2.2 Unified Theory of Technology Acceptance Model (UTAUT)3
Source: Ventkatesh et al. (2003)
The model and its extensions were criticised. Bagozzi (2007) criticised the model and its
subsequent extensions. The researcher argues that UTAUT is a well-meaning and thoughtful
presentation, but that it presents a model with 41 independent variables for predicting

46
intentions and at least eight independent variables for predicting behaviour, and that it
contributed to the study of technology adoption “reaching a stage of chaos.”
In addition, van Raaij & Schepers (2008) argue that the grouping and labelling of items and
constructs are problematic because a variety of different items were combined to reflect a
single psychometric construct. For instance, the facilitating conditions construct integrates
perceived behavioural control (Ajzen, 1991), facilitating conditions (Thompson, Higgins, &
Howell, 1991) and compatibility (Moore & Benbasat, 1991). It thus combines items on the fit
between the technology and the individual’s work style, the availability of assistance, and the
availability of required resources. It is hard to understand how such a wide variety of items
can reflect one single psychometric construct (van Raaij and Schepers, 2008). They further
argued that UTAUT’s high R2 is only achieved when moderating the key relationships with up
to four variables (gender, age, experience and voluntariness) to yield coefficients that are
more significant.
2.4.3. Diffusion of Innovation Theory (DOI/IDT)
The Diffusion of Innovation (or Innovation Diffusion Theory –IDT-) of Rogers (1983) is one of
the theories used in Information System to study the adoption or use of ICT service by users.
In such settings, it is used as a technology acceptance model. Many studies (Carter and
Belanger, 2004; Atkinson, 2007; Li, 2010; MacVaugh and Schiavone, 2010; Woosley and Ashia,
2011) have emphasised that in the field of information systems, DOI is used as technology
acceptance model. Simin & Janković (2014) argue that the theory attempts to predict the
behaviour of individuals and social groups in the process of adoption of innovation,
considering their characteristics, their social relations, the time factor and the features of the
innovation. They further argue that in the study of Innovation, which, individuals, most often
use the term diffusion to describe the process of adoption of innovation or replace the old one
with the new. Moreover, Kapoor et al. (2013) report that many researchers argue that the
classic Diffusion of Innovation based on Rogers (1983) diffusion of Innovation model may be
used to assist our understanding of technology adoption. Therefore, the Diffusion of
Innovation Theory is used as a Technology acceptance model. The advantage of using the DOI

47
is that it provides the contextual sets that drive the acceptance of the technological innovation
(Ituma-aleke and Egwu, 2014) such as the use of ICT on agricultural input information.
Explaining the theory, Rogers (1983) argues that the characteristics which determine the rate
of adoption are: Relative Advantage, Compatibility, Complexity, Trialability and Observability
(Table 2.1).
Table 2.1. Core Perceived Attributes of Innovation
Source : Rogers (1983); Atkinson (2007); author (2016)
Attribute Definition Application
Relative
advantage
The degree to which an
innovation is perceived as
better than the idea it
supersedes
Innovation that appear to be beneficial when
compared to others, both previous and
current, are more likely to be adopted and
used. The perception by the farmer that using
ICT on agricultural input information would
enhance his/her knowledge (access and use)
on agricultural input information.
Compatibility The degree to which an
innovation is perceived as
consistent with the existing
values, past experiences
and needs of potential
users.
Adoption and use are more likely when the
innovation is consistent with the economic,
sociocultural, and philosophical value system
of the users and the users’ expectations
needs.
Complexity
/simplicity
The degree to which an
innovation is perceived as
relatively difficult to
understand and use
Innovations that are perceived as more
complex are less likely to be adopted and
used. ICT on agricultural input information
that perceived as simple to use would be
more likely used.
Trialability The degree to which an
innovation may be
experimented with on a
limited basis
ICT on agricultural input information that can
be tested before adoption are adopted more
rapidly than those that cannot.
Observability The degree to which the
results of an innovation are
visible to others
An ICT that realised benefits are visible to
potential users through an interaction with a
fellow ICT user are more likely to be used

48
The Diffusion of Innovation Theory (DOI) explains how over time ICT (innovation) gains
momentum and diffuses. There is a time dimension in the diffusion process. The time involved
in diffusion is in the innovativeness of an individual or another unit of adoption (Rogers, 1995).
Innovativeness is the degree to which an individual or another unit of adoption is relatively
earlier in adopting new ideas than other members of a social system (Rogers, 1983). According
to (Rogers, 1983), there are five adopter categories, or classifications of the members of a
social system on the basis of their innovativeness:
i. Innovators: They are the first to test an innovation. Very willing to take a risk.
ii. Early adopters: these people represent opinion leaders.
iii. Early majority: This category of adopters are rarely leaders. However, these people
do adopt adoption before the average person. That said, they typically need to see
evidence that the innovation works before they are willing to use it.
iv. Late majority: these people are sceptical of change. They will only adopt an
innovation after the majority has tried it.
v. Laggards: these people are bound by tradition and very conservative (to change by
using a new system such as ICT)
The theory has been widely used in adoption/use studies. For instance, Harindranath & Berna
(2009) used the Diffusion of Innovation theory to investigate the challenges of ICT adoption
by South African SMEs. It was also tested in Benin (Adegbidi et al., 2012), in Iran (Rezaei-
Moghaddam and Salehi, 2010) and Saudi Arabia (Al-Ghaith, Sanzogni and Sandhu, 2010).
The DOI has been criticised. For instance (Wainwright and Waring, 2007) argue that the theory
put different and vague statements afore that therefore requires an address. However, it can
be considered adequate within a research context of use of ICT by small-scale farmers to
access and use farm input information for three reasons. Firstly, the development of the DOI
began in the agricultural input sector with research on ameliorated hybrid seed technologies
(innovation). For that ground, it is a beginning point for studies on the innovative use of ICT
on agricultural input information. Secondly, it fits well the identified constructs, i.e. Relative
Advantage, Compatibility, Simplicity, Observability and Use of ICT on agricultural input
information than any other technology acceptance model, which include UTAUT, TAM, TPB
and TRA. Thirdly, it has been applied in the agricultural information services’ adoption/use by

49
farmers in developing countries than any other theory/model. Figure 2.3 displays the DOI
theory.
Figure 2.3 Diffusion of Innovation Theory (DOI/IDT) 4
Source: (Rogers, 1995)
Another critic of the Diffusion of Innovation Theory is from Honor (1998) who argues that the
theory does not take into account an individual's resources or social support to adopt the new
behaviour (or innovation). In addition, Woosley (2011) also argues that though the DOI has
been comprehensively applied and documented, it still presents some deficiencies. To address
these issues coming from Honor (1998) and Woosley (2011), we rely on other theories to
extract some of the identified constructs such the information quality and the ICT service cost
that were not taken into account by the DOI. These theories are discussed below in section
2.4.5.
50
2.4.4. Summary of the Reviewed IS Technology Acceptance Theories/Models
In conclusion, from the literature on the reviewed theories/models, Carter & Belanger (2004)
quoting Tornatzky & Klein (1982) argue that the Relative Advantage, Compatibility, and
Complexity are the most relevant constructs to adoption research. Nevertheless, Adegbidi et
al. (2012) reported Observability as having a positive effect on use of ICT on agricultural input
information. Their findings were similar to another one conducted by Atkinson (2007) on ICTs’
adoption. Hence, the construct can be considered in a study on ICT on agricultural input
information adoption by small-scale cereal farmers. However, Atkinson (2007) argued that
some researchers use the term Simplicity so that the attributes would have the same
directionality regarding their relationship with adoption, thus a study on ICT-based agricultural
input information should use Simplicity instead of Complexity.
As argued by van Raaij & Schepers (2008), the grouping and labelling of items and constructs
in UTAUT are problematic. The relative advantage, compatibility and simplicity are captured
respectively in the UTAUT as Performance Expectancy, Facilitating Conditions, and Effort
Expectancy. Moreover, Woosley (2011) argued that the Ease of Use variable from TAM and
Simplicity from the DOI capture the essence of the construct Effort Expectancy. However, the
Social Influence construct can be extracted from the UTAUT.
These three theories stopped at the intention of usage of ICT on agricultural input information.
They did not go beyond, for instance, to look at the adoption of agricultural input information.
Some other theories/models have been proposed by researchers (Foucault, 1977; Heeks and
Alemayehu Molla, 2009) that goes beyond the intention of usage of IT/ICT. Some of these
relevant theories/models are reported below.

51
2.4.5. The DIKDAR Model
The DIKDAR model (Heeks and Alemayehua Molla, 2009) propose an information
needs/mapping approach. The approach proposes two variants: linking information to
development and intended information requirements analysis. The model is an adaption of
the information need/map approach which is sensitive to the specific information needs of
individual communities and maps these against ICT4D impacts.
The approach is that lack of access to information exposes individual and communities to
vulnerabilities. It is peculiarly suitable for ICT4D given its emphasis on information delivery
capabilities. The DIKDAR model specifies that ICT services are the mean for farmers to access
and use information. AS shown in figure 2.4, the Decision and Action are behaviours and they
are taken only after the exposition of information and knowledge. However, to access
information, the user needs information resources and that includes the cost (Heeks and
Alemayehu Molla, 2009).
Figure 2.4 DIKDAR Model 5
Source: Heeks and Alemayehua Molla (2009)

52
2.4.6. Theory of Knowledge
The information got through an ICT service should lead to more access and use of agricultural
inputs. The theory of Knowledge seems to drive towards that. Foucault (1977) draws a close
link between knowledge and power. The scholar maintains that human experience is based
on communication, with structures arising from the rules of the communication. Further,
knowledge gives way to power that generates further knowledge through the process of
surveillance and new discourse.
It is assumed that whoever has knowledge or information is empowered and whoever lacks it,
is incapacitated. In the case of the current study, the agricultural input information provided
by an ICT service to farmers will lead to an increased adoption of agricultural input
information, which will be more knowledge on agricultural inputs. The use of Foucault theory
is because of the link between knowledge and power. In a study of ICT on agricultural input
information’ use by small-scale cereal farmers, the power can be labelled as an increased
adoption of agricultural input information.
The theory was empirically tested and validated in the same settings. For instance, Kaddu
(2011) using the Foucault’s theory to study rural women adoption of ICT on agricultural
information in Uganda. The scholar found evidence that agricultural information empowers
rural women.
In addition, there is a link between ICT Skills, Illiteracy and the information quality. For instance
in India, Mittal & Mehar (2012) found that farmers in Bihar and Punjab State, farmers having
access to information on farm inputs (seed, best cultivation practices, protection from
weather-related damage and handling plant disease) have seen a yield increase of respectively
63.82% and 76.64%. Further, they argue that Bihar has a literacy rate of 21.1% and Punjab a
literacy rate of 49.2%. Therefore, the use of ICT on agricultural input information is higher in
Punjab where the illiteracy is lower than Bihar where the illiteracy is high. However,
Glendenning & Ficarelli (2012) argue that the appropriateness, usability, relevancy of
information are mediated by the users (farmers) capacity (literacy and skills). Therefore, ICT
Skills and Literacy moderate information quality effect on the Use of ICT on agricultural input
information.
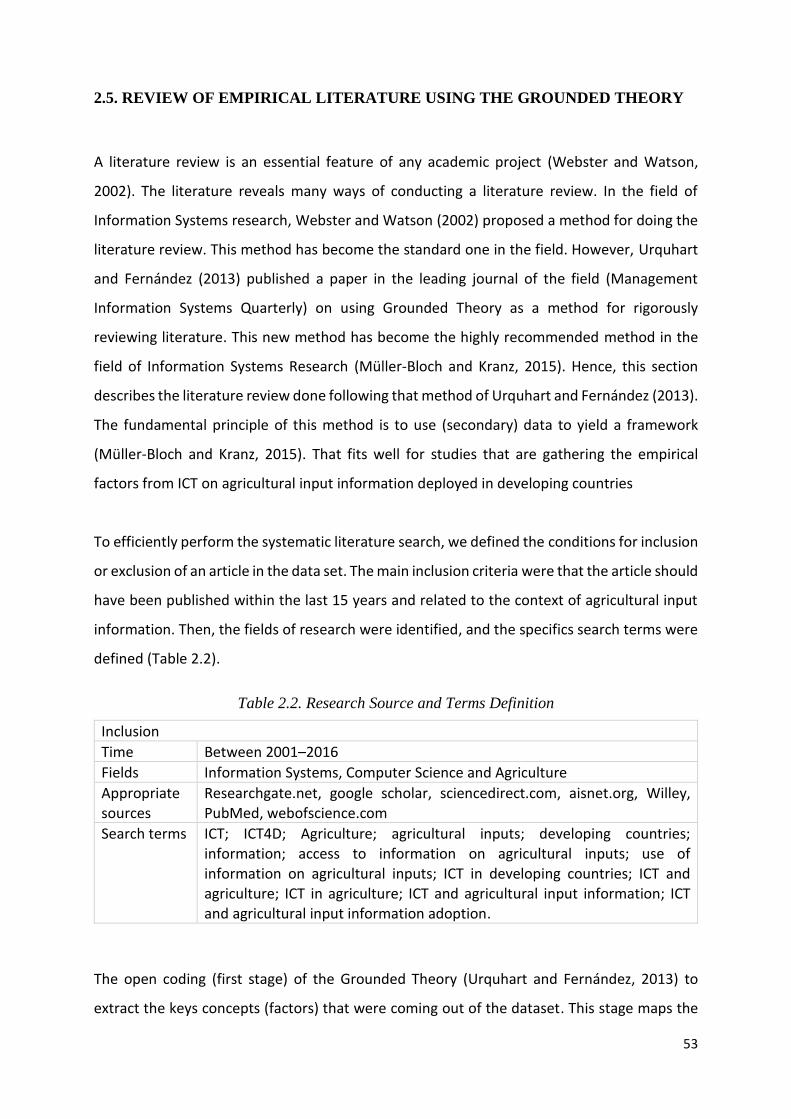
53
2.5. REVIEW OF EMPIRICAL LITERATURE USING THE GROUNDED THEORY
A literature review is an essential feature of any academic project (Webster and Watson,
2002). The literature reveals many ways of conducting a literature review. In the field of
Information Systems research, Webster and Watson (2002) proposed a method for doing the
literature review. This method has become the standard one in the field. However, Urquhart
and Fernández (2013) published a paper in the leading journal of the field (Management
Information Systems Quarterly) on using Grounded Theory as a method for rigorously
reviewing literature. This new method has become the highly recommended method in the
field of Information Systems Research (Müller-Bloch and Kranz, 2015). Hence, this section
describes the literature review done following that method of Urquhart and Fernández (2013).
The fundamental principle of this method is to use (secondary) data to yield a framework
(Müller-Bloch and Kranz, 2015). That fits well for studies that are gathering the empirical
factors from ICT on agricultural input information deployed in developing countries
To efficiently perform the systematic literature search, we defined the conditions for inclusion
or exclusion of an article in the data set. The main inclusion criteria were that the article should
have been published within the last 15 years and related to the context of agricultural input
information. Then, the fields of research were identified, and the specifics search terms were
defined (Table 2.2).
Table 2.2. Research Source and Terms Definition
Inclusion
Time Between 2001–2016
Fields Information Systems, Computer Science and Agriculture
Appropriate sources
Researchgate.net, google scholar, sciencedirect.com, aisnet.org, Willey, PubMed, webofscience.com
Search terms ICT; ICT4D; Agriculture; agricultural inputs; developing countries; information; access to information on agricultural inputs; use of
information on agricultural inputs; ICT in developing countries; ICT and agriculture; ICT in agriculture; ICT and agricultural input information; ICT and agricultural input information adoption.
The open coding (first stage) of the Grounded Theory (Urquhart and Fernández, 2013) to
extract the keys concepts (factors) that were coming out of the dataset. This stage maps the

54
reviewed ICT services with the literature and comes up with the concepts (factors) that are
affecting use of ICT by small-scale cereal farmers. Each paper was picked and skimmed and
spotlighted any discovery and insights in the article (text) that seemed pertinent to the scope
and research questions of the current study. Each word, sentence or paragraph that was
spotlighted in every one of the paper represented a pertinent (relevant) selection. We started
then to re-read selection after selection. While perusing through them some of the concepts
that capture parts of the selection data set and their respective studies were analysed and
synthesised. That led us to incorporate each group of selection into a group of concepts and
insights. The concepts (factors) that came up are presented in Table 2.2.
After finishing with the open coding, the emerged concepts were grouped into categories
according to the defined research objectives. The categories that came out are Farmers’
Perception of ICT, Farmers’ influence on each other, and Challenges in the use of ICT on
agricultural input information. They are referred to in Table 2.2. as Category. These categories
were also the research objectives as defined in section 1.4. of this thesis.
The selective coding consisted of identifying the properties of these categories that were
identified. In other words, it was to determine the direction of effects of these identified
categories according to the literature. The selective coding was also the basis for the
generation of the hypotheses and therefore, was aligned to the objective 4 of the research as
defined in section 1.4.

55
Table 2.3 Concept and Category Matrix
Category Concept Empirical evidence Developing
country
Farmers’
perception of
ICT on
agricultural
input
information
Relative Advantage (Carter and Belanger, 2004; Dey,
Prendergast and Newman, 2008;
Al-Ghaith, Sanzogni and Sandhu,
2010; Pick and Gollakota, 2010;
Rezaei-Moghaddam and Salehi,
2010; Adegbidi et al., 2012;
Surendran, 2012; Wulystan and
Andrew, 2013; Amin and Li,
2014)
Benin, India,
Indonesia, Iran,
Kenya, Mali,
Nigeria, Pakistan,
Tanzania, Uganda,
Senegal, China,
Bangladesh
Compatibility (Dey, Prendergast and Newman,
2008; Rezaei-Moghaddam and
Salehi, 2010; Adegbidi et al.,
2012; Pshenichnaya and Clause,
2013; Palmer, 2015; Sousa,
Nicolay and Home, 2016)
Benin, India,
Indonesia, Iran,
Kenya, Mali,
Nigeria, Pakistan,
Tanzania, Uganda,
Senegal,
Bangladesh,
Burkina Faso
Complexity/Simplicity (Dey, Prendergast and Newman,
2008; Al-Ghaith, Sanzogni and
Sandhu, 2010; Rezaei-
Moghaddam and Salehi, 2010;
Adegbidi et al., 2012;
Dandedjrohoun, Diagne and
Benin, India,
Indonesia, Iran,
Kenya, Mali,
Nigeria, Pakistan,
Tanzania, Uganda,
Senegal, China,
Bangladesh

56
Biaou, 2012; Amin and Li, 2014;
de la Rive Box et al., 2015)
Trialability (Rezaei-Moghaddam and Salehi,
2010)
Iran
Farmers’
influence on
each other in
the use of ICT
on agricultural
input
Social Influence (Ventkatesh et al., 2003; Kaba,
Diallo and Plaisent, 2006; Lwoga,
2010; Pick and Gollakota, 2010;
Siraj, 2010; Lwoga, Stilwell and
Ngulube, 2011; Palmer, 2011;
Wulystan and Andrew, 2013;
Aleke, Egwu and N, 2015;
GSMA, 2015; Sathye et al., 2015;
Sousa, Nicolay and Home, 2016)
Guinea Conakry,
Iran, Mali,
Tanzania, Uganda,
Pakistan, Fiji,
Nigeria, India,
Burkina Faso
Observability (Pick and Gollakota, 2010;
Rezaei-Moghaddam and Salehi,
2010; Adegbidi et al., 2012;
Palmer, 2015; Sathye et al., 2015;
Singh et al., 2016; Sousa, Nicolay
and Home, 2016)
Benin, Iran, Mali,
Tanzania, Uganda,
Fiji, India, Burkina
Faso
Challenges
faced by
farmers in the
use of ICT on
agricultural
input
information
Information Quality (Wang and Peng, 2008; Heeks and
Alemayehua Molla, 2009;
Atajeromavwo et al., 2010;
Lwoga, 2010; Hatakka and De,
2011; Lwoga, Stilwell and
Ngulube, 2011; Mittal and Mehar,
2012; Williams, 2013; Wulystan
and Andrew, 2013; Palmer, 2015,
India, Kenya, Mali,
Nigeria, Tanzania,
Pakistan, Uganda,
China

57
2014; Msoffe and Ngulube, 2016;
Myagro, 2016; Barakabitze, Fue
and Sanga, 2017)
Cost (Sukhpal, 2004; Dey, Prendergast
and Newman, 2008; Lwoga, 2010;
Siraj, 2010; Kaddu, 2011;
Williams, 2013; Wulystan and
Andrew, 2013; Mwombe et al.,
2014; Palmer, 2014; Chung, 2015;
GSMA, 2015; Haug and Tumbo,
2016; Kilima, Sife and Sang,
2016)
Mali, Tanzania,
Uganda, Kenya,
Pakistan,
Jamaica,
Bangladesh,
India, Trinidad
and Tobacco
ICT Skills (Kaddu, 2011; Kameswari,
Kishore and Gupta, 2011;
Williams, 2013; Palmer, 2014;
Chung, 2015; Sousa, Nicolay and
Home, 2016)
Uganda, Mali,
Tanzania, India,
Jamaica, Burkina
Faso
Literacy/Illiteracy (Siraj, 2010; Adegbidi et al., 2012;
Glendenning and Ficarelli, 2012;
Sanga, Kalungwizi and Msuya,
2013; Williams, 2013; Palmer,
2014; Chung, 2015; Kilima, Sife
and Sang, 2016; Sousa, Nicolay
and Home, 2016)
Benin, Tanzania,
Mali, Pakistan,
Burkina Faso

58
2.5.1. Farmers’ Perception of ICT on agricultural input information and the effects of
this perception on the use of these ICTs
The use of ICT depends on the perceptions of their users. It was highlighted by many studies
on ICT adoption/use and in different fields such as education (Jorge et al., 2003), health
(Atkinson, 2007), e-government (Carter and Belanger, 2004) and others.
In the agricultural sector, researchers have emphasised that the perception is positively
related to ICT adoption/use (Siraj, 2010; Kaddu, 2011; Sen and Choudhary, 2011; Bosch et al.,
2012; Barakabitze et al., 2015). In addition, studies related to agricultural input report the
same relationship between ICT’s use and user’s perception (Kaba, Diallo and Plaisent, 2006;
Rezaei-Moghaddam and Salehi, 2010; Adegbidi et al., 2012). Nevertheless, what are these
perceptions and to what extent are they influencing use of ICT by small-scale cereal farmers
remain two questions that were not answered by these studies?
The perceived attitudes (relative advantage, simplicity, observability, compatibility and
trialability) are necessary for the adoption and use of ICT/Innovation (Rogers, 1983; Atkinson,
2007). However, Carter & Belanger (2004) quoting Tornatzky and Klein (1982) emphasised that
compatibility, relative advantage and complexity are the most perceived construct in the use
of ICT. The open coding also empirically supported relative Advantage, Compatibility and
Simplicity. Therefore, they were categorised as farmers’ perception of ICT on agricultural input
information.
In terms of effect, the perception was found to be positively affecting use of ICTs on
agricultural input information. Atkinson (2007) argues that simplicity is positively related to
the use of ICT. Adegbidi et al. (2012) conclude that rice farmers’ perception of ICTs is positively
affecting their use of them. Thus, Farmers’ Perception of ICT is positively associated with their
use of ICT on agricultural input information. The factors are explained below.

59
2.5.1.1. Relative Advantage (RA)
Relative advantage (or superiority) is the degree to which an innovation is perceived as being
better than the idea it supersedes (Rogers, 2003; Kotler, 1991), and is often expressed in terms
of economic profitability and/ or social prestige (Rogers, 2003; Kyewalabye, 2001); in terms of
productivity (Sentamu, 2001); in terms of convenience and/ or satisfaction (Kyewalabye,
2001); and so on. Adegbidi et al. (2012) quoting Lunkuse (2004), refer to the relative advantage
of innovation as its perceived usefulness, that is "the degree to which the user's subjective
probability that using a specific system will enhance his or her productivity". Further, they
found an effect of Relative Advantage on rice farmers’ use of ICT. This concept has been
identified in many developing countries from the conducted literature review (Table 2.3).
However, the remaining question is to what extent it is affecting ICT on agricultural input
information by cereal farmers.
2.5.1.2. Compatibility
Adegbidi et al. (2012) argue that another important characteristic of an innovation affecting
its rate of adoption is its perceived compatibility or acceptability (Kotler, 1991; Rogers, 2003;
Sentamu, 2001). Atkinson (2007) reports that Compatibility is the degree to which an
innovation is perceived as consistent with the existing values, past experiences, and needs of
potential adopters. Rogers (2014) concluded that a more compatible idea is less uncertain to
the potential adopter and fits more closely with the situation of the individual. Compatibility
assists the individual give meaning to the new idea so that it is regarded as more familiar
(Bakkabulindi, 2012).
This concept (factor) was highlighted in many studies in developing countries as affecting use
of ICT on agricultural input information (Table 2.3). To what extend compatibility is affecting
ICT on agricultural input information is a question that needs to be addressed.
2.5.1.3. Complexity/Simplicity
The complexity/simplicity was found to be affecting use of ICT by farmers. For instance, the
use of TigoKilimo was perceived as complicated by farmers (Chung, 2015). A similar finding in

60
the use of Senekela in Mali was reported by (GSMA, 2015; Palmer, 2015). In Kenya, Odhiambo
(2013) noticed that farmers found the access to production information via mobile phone
complicated. Wulystan & Andrew (2013) argue that in their survey, the respondents
considered some ICTs simpler than others did. This point implies that the perception simplicity
has became reality.
Some researchers prefer to use Simplicity instead of Complexity. For instance, Atkinson (2007)
uses simplicity instead of complexity. Hence, Simplicity is recommended in studies on farmers
use of ICT on agricultural input information. This concept has been identified in many
developing countries from the literature review (Table 2.3).
2.5.1.4. Trialability
Trialability is the degree to which an innovation may be experimented with on a limited basis
(Rogers, 1983). Trialability of innovation is important in minimising risk, uncertainty and
adverse consequences of innovation (Rezaei-Moghaddam and Salehi, 2010). It was found to
affect innovation’ use (ICT) in Iran. However, the undertaken systematic literature review did
not come across any other study supporting the finding of Rezaei-Moghaddam and Salehi
(2010) in the field of agricultural input information. Moreover, Tornatzky and Klein (1982)
found that Trialability was not affecting Use. Likewise, Carter and Belanger (2004) also agreed
with them. Similarly, this researcher agrees with them in not taking Trialability as a factor in
this case.
2.5.2. Farmers’ influence on each other in the use of ICT on agricultural input
information and the effects of this influence on the use of these ICTs
Farmers share information among themselves. Each community is comprised of people who
regularly act around a respective set of issues, profits or needs (Benard, 2013). That was also
emphasised by the findings of Lwoga et al. (2011) which demonstrated that the primary
sources of information for farmers were predominantly local (neighbours, friends and family).
In addition, they further concluded that 67% of farmers found families, friends and
neighbours’ information very efficiently. That hence means that sharing information about a

61
new technology or new idea on agricultural input information accessed through an ICT service
is a major key to the success of an innovation especially ICT.
Palmer (2015) conducting a study on ICT on agricultural input information services in Mali
observed that almost all users interviewed in the field said that other farmers come to them
every month for farming advice. This finding means that the information seekers were
satisfied with the information given to them by their fellow farmers who were using Senekela.
Satisfaction of farmers affects information usage because farmers who are satisfied with the
information are likely to adopt it (Msoffe and Ngulube, 2016) or keep using it. Therefore, the
non-ICT users would try to get the information directly from the source, which is use of ICT.
Moreover, due to the satisfied information that they receive, farmers also received advice to
use ICT. That was highlighted by Palmer (2015) whose findings concluded that most repeat
users recommend the service and share the information they receive with other farmers. 74%
of repeat users in the phone survey said they had recommended the ICT service Senekela to
farmers outside of their household, and 63% reported sharing the advice they received with
other farmers –both are good indicators of satisfaction with the service (Palmer, 2015). In
addition, the customers who used agronomic advice from the service and have seen an
increase in yield, share the information they receive with other farmers (ibid.). Further, the
same study reports that these farmers recommended to others (non-users) to use the service.
Therefore, farmers peer’ influence affects use ICT for increased adoption of agricultural input
information.
This influence is among the community. Repeat users are influential in their communities,
providing advice to other farmers (Palmer, 2015). That can be interpreted as the way the
influential ICT users can describe (Observability) their achieved results to other farmers.
Thereby, the non-users get knowledge of the ICT and its benefit (Observability). It can also be
interpreted as the community pressure (Social Influence) on non-users to use ICT. That is
emphasised by Pick and Gollakota (2010), who argue that if people in a person’s social or
reference groups who use the technology report satisfaction and advocate its use to non-
users, they motivate non-users to try the system. In conclusion, there is a relation between
observability, social influence and the use of ICT on agricultural input information. Hence, the

62
study categorises Observability and Social Influence as Farmers’ influence on each other with
respect to use of ICT on agricultural input information.
Farmers influence on each other has a positive effect on their use of ICT on agricultural input
information. For instance, observability was positively related to the use of ICT by rice
producer in Benin (Adegbidi et al., 2012). Rezaei-Moghaddam & Salehi (2010) argue that the
observability affects the intention to the adoption of ICT on precision farming in Iran positively.
Precision agriculture is an understandable approach to the management of the farm. That
includes farm input management and therefore farm input information (Grisso et al., 2002).
These two studies in Benin by Adegbidi et al. (2012) and in Iran by Moghaddam & Salehi (2010)
were similar to the current study. Thus this study concludes that the Observability has a
positive effect on the use of ICT on agricultural input information (Table 2.3). The social
influence was also found to be positively affecting farmers’ adoption of ICT in Guinea (Kaba,
Diallo and Plaisent, 2006). The two concepts are more explained below.
2.5.2.1. Observability
Observability has been involved in many studies related to developing countries. It is the
degree to which the results of an innovation are visible to others (Rogers, 1983). Observability
was used to measure people’s knowledge of e-service and its gains in Saudi Arabia (Al-Ghaith,
Sanzogni and Sandhu, 2010). The study found a significant relationship between Observability
and Adoption of the e-service. Is Observability significantly affecting ICT on agricultural input
information used by cereal farmers in Mali?
In the field of agricultural input information, Adegbidi et al. (2012) argue that Observability,
also known as communicability, demonstrability or describability, is the degree to which
results of an innovation are visible to others. Some studies have used Observability as a
perception. For instance, Al-Ghaith et al. (2010) used the Observability as a perception factor.
However, Moore and Benbasat (1991) found that Observability was not simple (Rezaei-
Moghaddam and Salehi, 2010). They consequently divided the construct into two separate
constructs that they called visibility and result in demonstrability. Result demonstrability

63
points to “the tangibility of the results of using an innovation”. Visibility points to “the extent
to which potential adopters see the innovation as being visible in the adoption context.”
Applying this to a context such as use of ICT on agricultural input information, the “tangibility
of the results of using an innovation” would be “tangibility of the increased knowledge gained
by using ICT on agricultural input information”. The “extent to which potential adopters see
the innovation as being visible in the adoption context” would be “the increased knowledge
of a fellow farmer using ICT on agricultural input information visible to other farmers due to
an interaction between them”. Also, Pick and Gollakota (2010) used Observability and
Subjective Norm to measure the Social Influence in their study. Moreover, Rogers (2003)
identified the dimension of Observability to the society using it. In conclusion, it is a perception
but gotten after an interaction with others. Table 2.3 gives more details of the studies that
found an effect of Observability on use of ICT.
2.5.2.2. Social Influence
Rogers (1995) defines pressure or social norms as the values or behaviours, which are the
most, accepted by the members of society. Social pressure refers to an individual’s belief that
he should adhere to the same practices agreed to by the people enjoying a high social status
in an environment. Ventkatesh et al. (2003) argued that Social influence is defined as the
degree to which an individual perceives that important others believe he or she should use a
new system.
The social influence has been found in related studies to affect the use of ICT. For instance in
Guinea, Kaba et al. (2006) found that Social Influence was a key determinant in the use of ICT
(cellular phone). Social Influence as defined by (Ventkatesh et al., 2003) should be utilized in
the context of cereal production by small-scale farmers. The remaining question that should
be addressed is to what extent is it affecting the use of ICT on agricultural input information
for an increased adoption of agricultural input information. Table 2.3 summarises studies that
linked Social Influence to use of ICT in developing countries.

64
2.5.3. Other Challenges faced by cereal farmers in the use of ICT on agricultural input
information and the effects of these challenges on the use of these ICTs
The concepts ICT’ services Cost is a challenge for farmers in their use of ICT on agricultural
input information. That was reported by the literature in many developing countries (Table
2.3). The provided Information Quality was also a challenge as shown in Table 2.3. The ICT
Skills and Literacy were also challenging farmers in their use of ICT on agricultural input
information. Hence, these concepts are grouped to form the category other challenges in
accordance with the research objective 3.
The high’ cost is a barrier to the use of ICT on agricultural input information in developing
countries. For instance, in Tanzania, the cost was an obstacle to the uptake of ICT on
agricultural input (information) by farmers (Barakabitze et al., 2015). Therefore, this study
identifies the high cost as a barrier to the use ICT in the context of agricultural input
information. In contrast to that high cost, lower ICT services cost has a positive effect on the
use of ICT on agricultural input information.
On the other hand, the delivered information quality was found to positively affect farmers’
use of ICT on agricultural input information. For instance, since farmers are likely to use
information that has immediate gains, the information usage’ effect may result in foster
utilisation (of ICT on agricultural input information) because of the realised benefits (Msoffe
and Ngulube, 2016).
2.5.3.1. Cost
The high cost of ICT services constitutes a factor to its use on agricultural input information.
For instance in Bangladesh, the high cost was one of the factors that can dilute the advantages
of accessing information through mobile phone (Dey, Prendergast and Newman, 2008). This
finding was confirmed by many other studies (Wulystan and Andrew, 2013; Haug and Tumbo,
2016; Kilima, Sife and Sang, 2016) in Tanzania. In Mali, 95% of SENEKELA users find that the
cost is prohibitive (Palmer, 2014). In India, a case study on e-choupal by Sukhpal (2004) argues
that low cost leads to use of ICT by farmers. In Bangladesh, Dey, Prendergast and Newman
65
(2008) noted that high costs are one of the factors that can dilute the advantages of having
access to information through ICT.
This study referred to cost as the search and use of information on agricultural inputs through
ICT. Table 2.3 provides empirical evidence in developing countries.
2.5.3.2. Information Quality
Farmers question the effectiveness of the provided information for use. For instance, in India,
studying the ICT in Agriculture development Meera et al. (2004) argue that information on
agricultural inputs (availability and prices) was sensed as inappropriate by farmers. This finding
was similar to another study on an agricultural value-added service (VAS) conducted in Mali
by Palmer (2014) who found that the information provided was incomplete. Also, Wang and
Peng (2008) report that the information content (quality) was a problem in China. Moreover,
Lwoga (2010) reports that relevant and local content were barriers to the use of telecentres
in Tanzania by farmers. Therefore, the provided information quality constitutes a challenge
for farmers in their use of ICT on agricultural input information.
There are some characteristics related to the agricultural input information quality affecting
its use. For instance, in Uganda, Kaddu (2011) argues that the value of information depends
upon many factors including accessibility, relevance, accuracy and currency. In addition, in a
study on ICT services for development in developing countries, Beardon (2005) argues that
the participants said that for information to be useful or valuable, it should be well-timed and
comprehensible.
Agricultural input information completeness means that all the data necessary to meet the
current need for farm input information was provided by the ICT services (Siyao, 2012). The
accuracy means that the information on agricultural inputs was correct for the farmers’ need
for information on agricultural inputs. Siyao (2012) argues that accuracy implies that
information is free from bias. Timeliness means that the farmers are able to get the
agricultural inputs’ information when they need it (ibid.). Relevance means that the
information is suitable for the current information need of farm inputs. Appropriateness

66
means that the information is appropriate for the present need of agricultural input
information (ibid.).
Heeks & Alemayehu Molla (2009) argue that the lack of access to complete, accurate, reliable,
timely and appropriate information endanger individuals and communities. Accuracy,
precision, timeliness, relevance and format were again highlighted by Ndiege et al. (2012) as
Information Quality in a case study in Kenya on IS in SMEs. The same observation was made
by Mittal & Mehar (2012). Therefore, the quality of the information contributes to the
frequent use of ICT services in the agricultural inputs sector, which leads to an increased
adoption of agricultural input information.
However, what are these characteristics of the information quality and to what extent do they
influence small-scale cereal farmers to use of ICT remains questions that need to be
addressed. This concept has been identified in many developing countries from the
undertaken literature review (Table 2.3).
2.5.3.3. Literacy and ICT Skills
It is important to know how to access and to have the skills to use ICT to adopt information.
Dutta et al. (2004) argue that an educated and ICT aware population is the condition for any
community to participate in the networked world fully. In addition, Sanga, Kalungwizi and
Msuya (2013) reported that illiteracy remains a challenge for farmers in their use of ICT on
agricultural information. The same observation was made by (Kaddu, 2011). Therefore,
Illiteracy is a major concern (a challenge for farmers in their use of ICT on agricultural input
information.
The low ICT Skills also constitutes a challenge to the use of ICT on agricultural input
information. For instance, the GSMA (2015) reports that illiteracy and low technical skills are
a major barrier to uptake. In addition, the USSD channel of TigoKilimo5 in Tanzania
necessitates farmers to navigate through a comprehended interface menu text-based
information. Msoffe & Ngulube (2016) also argue that low levels of literacy were a barrier to
5TigoKilimo is an ICT service that disseminate agricultural (input) information in Tanzania.

67
access to information. Another study in India on the use of ICT services in agriculture
conducted by Meera et al. (2004) reported that frequent use of the internet services was
positively associated with education. In Serbia, Simin & Janković (2014) argued that the level
of education has a positive effect on Innovations’ adoption in agriculture. Finally, in Saudi
Arabia, Al-Ghaith et al. (2010) also argued that the adopter of new technology has the
appropriate level of education.
Several metrics can be used to measure the educational achievements. These are Illiteracy
and the percentage of the population that has a second-degree education (Garcia-Murillo,
2003). Singh et al. (2016) emphasise that the use of ICT such as mobile phone requires basic
literacy. Therefore, this study used the Literacy as the metric to measure the educational
achievements instead of education Level. This concept has been identified in many developing
countries from the literature review (Table 2.3). The category ICT Skills and Literacy were
found to be moderating the effects of some of the identified construct. It is detailed in Table
2.4.
Table 2.4 ICT Skills and Literacy Properties
Concept Moderating Empirical Support
ICT Skills Simplicity/Complexity (Kaddu, 2011; Kameswari, Kishore and Gupta, 2011;
Palmer, 2014; Chung, 2015)
Information Quality (Atajeromavwo et al., 2010; Kaddu, 2011; Palmer,
2014; Chung, 2015)
Literacy Simplicity/ Complexity (Siraj, 2010; Palmer, 2014; Chung, 2015)
Observability (Adegbidi et al., 2012)
Information Quality (Glendenning and Ficarelli, 2012; Chung, 2015)

68
2.6. THE IDENTIFIED GAPS
An indispensable feature of an academic project is the literature review (Müller-Bloch and
Kranz, 2015). This researcher follows the guidelines of (Webster and Watson, 2002;
Wolfswinkel, Furtmueller and Wilderom, 2011) to do the literature review systematically. This
method is highly recommended in the field of Information Systems according to Müller-Bloch
and Kranz (2015).
Furthermore, Müller-Bloch and Kranz (2015) proposed a framework on how to identify
research gaps in IS research. This framework is built on the existing guidelines (Webster and
Watson, 2002; Wolfswinkel, Furtmueller and Wilderom, 2011) that were followed.
Nevertheless, this researcher agrees with Müller-Bloch and Kranz (2015) that it is important
to identify research gaps rigorously and to characterise them. These research gaps should be
based on the systematic literature review. That systematic review has provided the factors
and their properties (effects) on the use of ICT on agricultural input information in developing
countries.
After systematically identifying the factors affecting use of ICT on agricultural input
information, there is a need to look for research gaps in this literature. A set of information
gap deriving from a literature synthesis and requiring further inquiry to be solved constitutes
a research gap (Müller-Bloch and Kranz, 2015). This section discusses the research gaps
following the framework of Müller-Bloch and Kranz (2015). It starts with a characterisation of
the investigation gaps followed by the related ICT model to address the adoption of ICT
services in the field of agricultural input information. It lastly goes on and presents these
research gaps.

69
2.6.1. Research Empirical Gaps
Jacobs (2011) identifies six categories of gaps that are the interesting exception, contradictory
evidence, knowledge void, action knowledge conflict, methodological conflict and theoretical
conflict. Müller-Bloch and Kranz (2015) refined these gaps and came up in their framework
with the following type of research gaps: methodological conflict, contradictory evidence,
knowledge void, action-knowledge-void, evaluation void and theory application void.
A dataset of 24 empirical studies related to adoption/use of ICT on agricultural input
information in developing countries were analysed using the framework for rigorously
identifying the research gaps (Müller-Bloch and Kranz, 2015) related to ICT on agricultural
input information use. Table 2.5 presents the categories of the identified research gaps and
their definition, as well as the frequency with which they occur.
Table 2.5 Research Gaps per Categories and References
Research Gap
Category
Definition Gaps References
Contradictory
evidence
Results from studies allow for conclusions in their right but are contradictory when examined from a more abstract point of view. Another way to look at that issue is that the study’s (or some) findings have not been confirmed by any other study.
2 (Amin and Li, 2014; Cox and
Sseguya, 2016; Kilima, Sife
and Sang, 2016)
Knowledge void Desired research findings do not exist. (the study finds something else instead of what it was looking for)
5 (Dey, Prendergast and
Newman, 2008; Lwoga,
2010; Pick and Gollakota,
2010; Aleke, Egwu and N,
2015)
Action-knowledge
Conflict
Professional behaviour or
practices deviate from
research findings or are not
covered by the research.
4 (Dangi and Singh, 2010;
Rezaei-Moghaddam and
Salehi, 2010; Lwoga, Stilwell
and Ngulube, 2011; Adegbidi

70
et al., 2012; Sanga,
Kalungwizi and Msuya, 2013)
Methodological conflict
A variation of research methods is necessary to
generate new insights or to
avoid distorted findings.
10 (Dangi and Singh, 2010; Siraj,
2010; Adegbidi et al., 2012;
Sanga, Kalungwizi and
Msuya, 2013; Williams,
2013; Amin and Li, 2014;
Njelekela and Sanga, 2015;
Singh et al., 2016)
Evaluation void
Research findings or propositions need to be evaluated or empirically verified.
25 (Dey, Prendergast and
Newman, 2008; Wang and
Peng, 2008; Dangi and Singh,
2010; Lwoga, 2010; Pick and
Gollakota, 2010; Rezaei-
Moghaddam and Salehi,
2010; Siraj, 2010; Lwoga,
Stilwell and Ngulube, 2011;
Williams, 2013; Wulystan
and Andrew, 2013; Ituma-
aleke and Egwu, 2014; Haug
and Tumbo, 2016)
Theory application void
Theory should be applied to certain research issues to generate new insights.
8 (Dey, Prendergast and
Newman, 2008; Rezaei-
Moghaddam and Salehi,
2010; Adegbidi et al., 2012;
Sanga, Kalungwizi and
Msuya, 2013; Amin and Li,
2014; Ituma-aleke and Egwu,
2014; Aleke, Egwu and N,
2015)
The research gap that occurs almost in all the reviewed studies was the Evaluation void. It
occurs 25 times. For instance, Pick and Gollakota (2010) have proposed an ICT adoption model
by farmers. They came up with some factors such as Perceived outcomes. This perceived
outcome need to be empirically tested and defined regarding meaning. Another example of
evaluation void is the finding of Wang and Peng (2008) who came up with the information

71
content as a factor in the use (adoption) of ICT services in China by farmers. Nevertheless, they
did not explain the extent to which this content affects ICT adoption. Therefore, this finding
also needs to be confirmed. It is also necessary to define “information content”. This goes
almost for all of the factors that came up in Table 2.3. To what extent these factors are
affecting use of ICT by (small-scale cereal) farmers is a gap that needs to be filled by this study.
The second research gap that occurs mostly after the evaluation void was the methodological
conflict (10 times). For instance, Amin and Li (2014) proposed a model for ICT adoption by
farmers in a comparative case study between Bangladesh and China. However, they use PLS-
SEM to analyse a sample size of 80 respondents. That was below the recommended sample
size for any study using Structural Equation Modelling, which is 200 as suggested by (Kline,
2013). Even if they were applying the rule of ten by Hair, Ringle and Sarstedt (2011), their
sample size would have been 90 instead of 80 (nine latent variables * 10 = 90). In addition, it
was recommended not to use that rule of ten (Oodhue et al., 2012). This is a methodological
conflict gap that needs to be filled by this study.
Another significant research gap coming up was the theory application void. This gap occurred
eight times in the reviewed studies. Such a major gap is for instance in the paper of Dey,
Prendergast and Newman (2008), which draws a conceptual framework using the Technology
Acceptance Model (TAM), the Theory of Reasoned Action (TRA) and the Theory of Planned
Behaviour (TPB) and yet the results are presented using the Social Structural Theory. Another
example of that theory application void is from Adegbidi et al. (2012), who use the Diffusion
of Innovation Theory to investigate ICT adoption by rice farmers. Nevertheless, the findings
are not consistent with the DOI that was used. These gaps need to be filled.
The research gap knowledge void occurred five times during this process. An example of that
gap is that of Amin and Li (2014), where the desired research hypothesis (Relative advantage
positively affecting ICT adoption) was not supported by the study’s results in Bangladesh. In
addition, the same survey did support its desired hypothesis (Ease of use has a positive effect
on intention to use) in China. These findings also lead us to contradictory evidence. Indeed,
there is broad agreement among IS researchers that Relative advantage, Compatibility and
Simplicity are the most perception factors that affect ICT adoption (Carter and Belanger, 2004;

72
Weigel et al., 2014). Another example of that gap is the study of Rezaei-Moghaddam and
Salehi (2010) in Iran. They found a relationship between Observability and Ease of Use,
Observability and Perceived Usefulness. No other study, to this researcher knowledge, has
confirmed these findings yet. Moreover, the systematic literature review (Table 2.3) reveals
also that many studies have found these factors to affect use of ICT by farmers in developing
countries.
Lastly, the action-knowledge conflict appeared four times in the reviewed papers. For
instance, the model by Amin and Li (2014) did not take into account the factors information
quality or cost, which were identified in the systematic literature review. This is a gap that
needs to be filled.
2.6.2. Gaps from Theoretical Literature on ICT adoption models on agricultural input
information
Researchers have developed models to address use of ICT by farmers in developing countries.
This researcher identifies four models that were related to the current study’s context. These
models are discussed in this subsection.

73
2.6.2.1. Farmer Technology Acceptance Model (FTAM) in Bangladesh and China
Amin and Li (2014) designed a conceptual framework based on the Technology Acceptance
Model (TAM) of Davis (1989). The study concentres on the development and adoption process
of ICT enabled products and services by low-income group (farmer) fostering the rural
development of developing country like Bangladesh, and China based on the Technology
Acceptance Model. The hypotheses testing and results are shown in Figure 2.5.
Figure 2.5 Bootstrapping results from Amin and Li (2014) 6
There is knowledge void gap in this study of Amin and Li (2014). That is that the desired
research hypothesis (Relative advantage having a positive effect on intention to use ICT) was
not supported by the study’s results in Bangladesh. Also, the same study did support its
desired hypothesis (Ease of use has a positive effect on intention to use) in China.
In addition to the knowledge gap, a contradictory evidence also occurred about that study.
Indeed, there is broad agreement among IS researchers that Relative advantage, Compatibility
and Simplicity are the most perception factors that affect ICT adoption (Carter and Belanger,
2004; Weigel et al., 2014). Moreover, the undertaken systematic literature review (Table 2.3)
reveals also that many studies have found these factors to affect use of ICT by farmers in
developing countries.

74
The action-knowledge conflict appeared in this study when it fails to identify some factors
such as Cost or Information Quality. These factors were identified by the systematic literature
review (Table 2.3). Furthermore, this study was not done in the context of cereal production
that is the principal interest of the current study
2.6.2.2. The model by Rezaei-Moghaddam & Salehi (2010) in Iran
Predicting the determinant of intention to adopt precision agriculture technologies among
agricultural specialists was the purpose of the study (Rezaei-Moghaddam and Salehi, 2010).
The study uses the Diffusion of Innovation Theory, Theory of Planned Behaviour and
Technology Acceptance Model to propose a theoretical framework (Figure 2.6).
Figure 2.6 Theoretical Framework of Rezaei-Moghaddam & Salehi (2010)7
This model has three research gaps that have been identified. There was a knowledge void
when the study did not confirm some hypotheses. For instance, as shown in Figure 2.6., the
desired research hypothesis H7 was not supported. That can be that Perceived ease of use is
not a determinant for agricultural extension officers’ intention to adopt ICT on agricultural
input information. Nevertheless, the study did not indicate Perceived Ease of Use nor as a
driver or a barrier. In addition, farmers’ utilization and usage of ICT factors differ from
extension officers.

75
The second gap that was found in the study is an evaluation void. The factors Observability,
Perceived Ease of Use (Simplicity), Perceived usefulness (Relative Advantage) should be
further investigated to see if they are drivers or barriers for use of ICT by farmers.
The third and last gap is the contradictory evidence. The relationship between Observability
and the factors Perceived Ease of Use and Perceived Usefulness, seems contradictory. We did
not come across any study that has confirmed them. The hypotheses validation of the model
are displayed in figure 2.7
Figure 2.7 Path Coefficients and p-values of Hypotheses of Rezaei-Moghaddam & Salehi
(2010)8
2.6.2.3. The model of Miraj (2010) in Pakistan
In Pakistan, Miraj (2010) designed an ICT service for agriculture extension. The service
provides to agricultural (input) information to farmers. This model was not a conceptual
model. However, it was informed by four factors: farmers’ lack of adaptable information
(relevancy), economics barriers (ICT services cost), social and motivational issues and farmers’
perception. The information needs identified by the model were on farm inputs. This model
did not take into account all the characteristics of the information quality. That action-
knowledge conflict gap needs to be filled. The experiences from Mali, Kenya and Tanzania

76
showed that the information characteristics such as completeness, timeliness and accuracy
are major concerns for farmers in their use of ICT on agricultural input information. Moreover,
the model did not take into account the influence of farmers on each other in the use of ICT
to disseminate agricultural input information. Palmer (2015) reports that farmers do share
agricultural input information.
2.6.2.4. The model of Adegbidi et al. (2012) in Benin
In Benin, the model by Adegbidi et al. (2012) identified User friendliness (simplicity),
Observability, Relative Advantage, Compatibility as drivers in the use of ICT by rice farmers.
There is an evaluation gap on the drivers that were identified. Also, the model did not address
the Information Quality and the Cost that is an action -knowledge conflict gap to address. The
literature review showed that Information Quality and Cost are important in the use of ICT on
agricultural input information. Moreover, the targeted cereal crop was only rice while it was
argued that the most cereal crops were maize, sorghum and millet in Africa (Wood and Cowie,
2001).
The study has an Evaluation void gap. It identified from the literature these factors but fail to
hypothesise them. In addition to that gap, there is a methodological conflict deficit. The study
indeed did not provide any statistical significance for the identified factors (relative advantage,
compatibility, simplicity, observability, and use of ICT). This study needs to fill these gaps.
Another gap in this study is an action-knowledge gap. The study did not cover some factors
that were identified in the systematic literature review. These factors were Information quality
and Social Influence. This shortcoming also needs to be filled.

77
2.7. CONCEPTUAL FRAMEWORK
Vaughan (2008) defines a conceptual framework as a written or visual presentation that: a)
explains either graphically, or in narrative form, the main things to be studied –the keys
factors, concepts or variables-, b) and the presumed relationship among them.
The Diffusion of Innovation theory was the main theory of this study as it fits well the identified
empirical constructs and has been applied in similar context. To the DOI, we have added some
constructs from other theories/models supported by empirical evidence in the agricultural
input information. The DOI extensions are not included in this study. According to DOI, the
rate of diffusion is affected by an innovation’s relative advantage, complexity, compatibility,
trialability and observability. All the factors are included in this study except the trialability. In
a study on ICT adoption among rice producers in Benin, Adegbidi et al. (2012) did not find any
evidence supporting that the construct trialability affects the use of ICT. That is comparable to
another study by Carter & Belanger (2004) who argued that it was dubious that perceived
trialability would display adequate variance to offer explanatory power. The literature review
did not show any empirical evidence of any relationship between trialability and use of ICT on
agricultural input information. Therefore, the construct trialability was not included in this
study.
As the DOI did not have all the empirical constructs, this study borrows three new theoretical
constructs from other theories/models. Table 2.6 gives the theoretical constructs distribution
by theory/model and the name to be used in this study. In addition, Table 2.4 also provides
empirical evidence as discussed in the literature of the moderating variables. The conceptual
framework is displayed in figure 2.8.

78
Table 2.6 Constructs Extracted from Theories
The conceptual framework is composed of nine theoretical constructs (Table 2.6) that were
obtained from empirical constructs (Table 2.3). In addition, we have five moderating variables
that were also empirically supported (Table 2.4).
Theory Construct extracted Name to be used
Diffusion of Innovation Theory (DOI) Relative Advantage Relative advantage
Compatibility Compatibility
Complexity/Simplicity Simplicity
Observability Observability
DIKDAR MODEL Information Quality Information Quality
Information resources (economic) Cost
Unified Theory of Acceptance and
Use of Technology
Social Influence Social influence
Theory of Knowledge Power Increased adoption
agricultural input
information

79
Figure 2.8 Conceptual Framework 9
A hypothesis is a testable proposition about the relationship between two or more concepts
or variables. Based on the conceptual framework above and the theoretical and empirical
argument, hypotheses were formulated.
Objective 1. To establish farmers’ perception of ICT on agricultural input information and to
identify the effects of that perception on the use of ICT on agricultural input information.
H1: Relative Advantage has a positive effect on the use of ICT on agricultural input information.
H2: Compatibility has a positive effect on the use of ICT on agricultural input information.
H3: Simplicity has a positive effect on the use of ICT on agricultural input information.
H3a: ICT Skills moderates the positive effect of simplicity on the use of ICT on agricultural input
information.

80
H3b: Literacy moderates the positive effect of Simplicity on the use of ICT on agricultural input
information.
Objective 2. To establish farmers’ influence on each other in the use of ICT on agricultural
input information and to identify the effects of this influence on the use of ICT on
agricultural input information.
H4: Observability has a positive effect on the use of ICT on agricultural input information.
H4a: Literacy moderates the positive effect of Observability on the use of ICT on agricultural
input information.
H5: Social influence has a positive effect on the use of ICT on agricultural input information.
Objective 3. To establish the challenges faced by farmers in the use of ICT on agricultural input
information and to identify the effects of these challenges in the use of ICT on agricultural
input information.
H6: Cost has a positive effect on the use of ICT on agricultural input information.
H7: Information quality has a positive effect on the use of ICT on agricultural input information.
H7a: ICT Skills moderates the positive effect of Information Quality on the use of ICT on
agricultural input information.
H7b: Literacy moderates the positive effect of Information Quality on the use of ICT on
agricultural input information.
Objective 4. To propose an ICT model for increased adoption of agricultural input information
in developing countries using the case of Sikasso, Mali.
H8: Use of ICT on agricultural input information has a positive effect on an increased adoption
of agricultural input information.

81
CHAPTER THREE
METHODOLOGY
3.1. INTRODUCTION
Research methodology is divided broadly in two: quantitative and qualitative. The Oxford
University Press (2008) reports traditional scientific methods that yield numerical data and
look for establishing the qualitative relationship among variables using statistical tools to
validate this relationship is the quantitative research. On the other hand, Michael D Myers and
David Avison (2002) report that qualitative research is interested in the conduct of interviews,
collect of documents and observation data to explain a social phenomenon. This study was
conducted through quantitative methods. The first section describes the research philosophy
while the second one discusses the research design. The next section gives an overview of the
overall approach of this study. In section four, the steps taken to analyse the data are
described. Section five follows that and present the technique that was used for data analysis
namely the Partial Least Square Structural Equation Modelling (PLS-SEM). Finally, the last
section describes the data management.
3.2. RESEARCH PARADIGM
Myers (2015) argues that all research is supported by some assumptions that define what
constitutes 'valid' research and which research methods are suitable. A paradigm is a way of
examining social phenomena from which particular understandings of these phenomena can
be gained, and explanations attempted (Saunders et al., 2009).
Four research philosophies can be applied in information management research (Positivism,
realism, interpretivism and pragmatism). Nevertheless, Michael D Myers & David Avison
(2002) quoting Orlikowski and Baroudi (1991) classified IS research as positivism if there was
evidence of formal propositions, quantifiable measures of variables, hypothesis testing, and
the drawing of inferences about a phenomenon from the sample to a stated population. Thus,
this study adopted a positivist paradigm.

82
3.3. RESEARCH DESIGN:
The research design is the overall plan for connecting the conceptual research problems to
the pertinent (and achievable) empirical research (Wyk, 2012). In this study, the steps that
were to arrive at the study’s conclusions are presented below in Figure 3.1.
Figure 3.1 Research Design Summary 10

83
3.3.1. Research Approach
The extent to which the researcher is evident about the theory at the beginning of his/her
research raises an important question concerning the design of his/her research project
(Saunders, Lewis and Thornhill, 2009). That is whether the research should use the deductive
approach, in which one can develop a theory and hypothesis (or hypotheses) and design a
research strategy to test the hypothesis, or the inductive approach, in which you would collect
data and develop a theory as a result of your data analysis (ibid.). This research developed
hypotheses based on a conceptual framework that was based on some theories/models. It
needed to test these hypotheses, which therefore was a deductive approach. It is the
dominant research approach in the natural sciences, where laws present the basis of
explanation, allow the anticipation of phenomena, predict their occurrence and therefore
permit them to be controlled (Collis and Hussey 2003).
3.3.3. Research Strategy
Saunders et al. (2009) argued that survey is a popular and shared strategy in business and
management research and is most frequently used to answer who, what, where, how much
and how many questions. It, therefore, tends to be used for exploratory and descriptive
research. Surveys are popular as they allow the collection of a large amount of data from a
sizeable population in a highly economical way. They further argued that the survey strategy
permit the collection of quantitative data that can be analysed using statistical tools. In
addition, the data collected using a survey strategy can be used to suggest possible reasons
for particular relationships between variables and to produce models of these relationships.
Using a survey strategy should give the researcher more control over the research process
and, when sampling is used, it is possible to generate findings that are representative of the
whole population at a lower cost than collecting the data for the entire population. In this
study, the survey strategy was used to gather data. The survey strategy is usually associated
with the deductive approach (Saunders, Lewis and Thornhill, 2009).

84
3.3.4. Time Horizon
Saunders et al. (2009) argue that Cross-sectional studies often employ the survey strategy. The
survey strategy with cross-sectional was used for the current study.
3.3.5. Description of Study Area
This study was done in the region of Sikasso, the third administrative region of Mali. It has a
surface area of 71,790 km2 and a population of 2,643,179 and 406,774 households in 2009
(RGPH, 2013). The region had seven districts that are Sikasso, Bougouni, Kadiolo, Kolondieba,
Koutiala, Yanfolila and Yorosso. Sikasso is the most populated region of Mali with 18.3% of the
country’s population.
Each district had some communes, which was constituted of villages. The region had three
urban communes (Sikasso, Bougouni, and Koutiala) and 144 rural communes. It counted 1831
villages. The agricultural production falls under three products: cotton, cereals and
horticulture (Csa, 2007). The literacy rate of the household head of the region is about 39.7%
(INSTAT, 2014).
Data was specifically collected from the district of Bougouni. The district of Bougouni has a
population of 458, 546 and a surface area of 20 028 km2 (RGPH, 2013). Cereal, dominated by
small-scale farmers constitutes the main agricultural production of Bougouni (Promisam,
2007). The district is the most exposed district in the region of Sikasso to ICT on agricultural
input information (KANTE and Myagro, 2016).
3.4. OVERALL APPROACH
The research approach is a plan and procedure that first involves making broad assumptions
and then moves to a detailed method of data collection, analysis and interpretation (Saunders,
Lewis and Thornhill, 2009). The steps that were followed to arrive at the conclusion of this
study are presented below.

85
3.4.1. Research Instrument Translation and Pre-test of the Translated Instrument
Information and Communication Technologies (ICT) has seen an exponential development in
the dissemination of information, especially in agriculture. Researchers have used many tools
to gather data on the subject. These tools are based on some theories. The most technology
acceptance models are Technology Acceptance Model (TAM), Diffusion of Innovation Theory
(DOI) and the Unified Theory of Acceptance and Use of Technology (UTAUT) (Woosley and
Ashia, 2011). The data collection instrument (questionnaire) of these models are in English.
For other speaking languages especially French and Bambara6, these instruments need to be
translated. There is an increasing demand for non-English language tools to collect data (Pan
and de la Puente, 2005). Information on ICT survey translation methods or procedures is
limited to the translation process from English to French and Bambara. For instance,
developing a guideline for translation from English to Spanish, a study arguing that there is
limited information on the translation procedure (Pan & de la Puente, 2005). Therefore, there
is need to provide a method to translate ICT survey instrument into French and Bambara.
Factors that are affecting use of ICT on agricultural input information in developing countries
was provided by researchers (Kante, Oboko and Chepken, 2016). The Diffusion of Innovation
Theory was the basis of the proposed model. This researcher needed to collect data in Sikasso,
Mali using the data collection instrument adapted from researchers (Ventkatesh et al., 2003;
Atkinson, 2007). Nevertheless, there were two remaining questions: a) Can we propose a
method for translating this questionnaire into French and Bambara? b) What lessons have we
learned?
The literature (Pan and de la Puente, 2005; Forsyth et al., 2006a) describes two approaches,
which is adoption and adaptation to translate a survey questionnaire. The adoption method
is where the instrument to collect data is directly translated from the original language to the
targeted one regardless to the linguistic-cultural nuances, which can impact the intended
meaning of the question (Carrasco, 2003). In contrast to the adoption, the adaptation takes
into account the cultural differences to make the translated instrument suitable and
6 Bambara is a language spoken in Mali.

86
appropriate (Hoffmeyer-Zlotnik and Harkness, 2006). Adaptation admits and answers for any
differences that exist crosswise languages.
We used the Census Bureau Guidelines (Pan and de la Puente, 2005) and the model ASQ (Ask
the Same Question) (Zavala-Rojas, 2014) to translate the DOI’s instrument adapted from
(Ventkatesh et al., 2003; Atkinson, 2007) into French and Bambara. We modified the
guidelines to integrate some translating rules from TRAPD (Translation, Review, Adjudication,
Pre-testing and Documentation) and the model Ask the Same Question (Harkness, 2000;
Presser et al., 2004). The translation process is described in details in appendix 5. The results
were published in a conference (Kante, Chepken and Oboko, 2017).
The cognitive interview technique was used to pre-test the survey instrument for biases. We
purposively selected six respondents (6) who were grounded in the field of ICT4D so that we
can have their insight into the choice of words and phrase. These respondents were chosen
on the basis that they were familiar with the field in Mali. They were asked to delineate the
way they understood the specific question and determine whether they had difficulty in
understanding. The pre-test was done after the translation process and was part of the
method that we proposed for translating into French and Bambara. It helped us to
contextualise the instrument. The cognitive interview and the review suggest the target
languages French and Bambara translations effectively represent the source questionnaire. As
argued by Hoffmeyer-Zlotnik and Harkness (2006), the review and cognitive interview permit
to effectively translate a survey questionnaire from one language to another. In addition, we
replaced the phrase ‘ICT on Agricultural Input Information’ by ‘Ngasene/Senekela’ because
Ngasene/Senekela provides ICT-based agricultural input information in Sikasso. More details
of this process are available in appendix 3.

87
3.4.2. Validation of the Research Instrument and Conceptual Framework
As mentioned above, a pilot study was conducted in the village of Lobougoula, which was in
the study area of Sikasso. It was done from 12 May 2016 to 12 June 2016 in the village of
Lobougoula, commune of Lobougoula and district of Sikasso. Forty (40) respondents were
interviewed at this stage. Each indicator (item) was written in English, French and Bambara.
Some of the constructs had more than four items. That was voluntarily done so that we could
later choose the most appropriate indicators. This approach also confirmed to the PLS-SEM
design. In IS research, Ringle, Sarstedt and Straub, (2012) reported a median of 3.5 indicators
for a construct of a reflective model. The objectives of the pilot study were to validate the
survey instrument and to establish model predictability.
3.4.2.1. Research Survey Instrument Validation
The instrument is validated when the measurement model is established. PLS-SEM algorithm
was run, and the results such as convergent validity and discriminant validity were reported.
The type of reliability coefficient that the literature most often write up is the Cronbach’s alpha
(Kline, 2013). It is a statistic that measures the internal consistency reliability, which is the
degree to which responses are consistent across the items within a construct. It varies
between 0.4 to 0.7 for exploratory study (Urbach and Ahlemann, 2010). The extent to which
a given construct is different from other constructs also known as discriminant validity in PLS-
SEM was measured. Each construct AVE (Average Variance construct) should be larger than
its correlation with other constructs, and each item should load more highly on its assigned
construct than on the other constructs (Gefen, Straub and Boudreau, 2000).
The discriminant validity measures the extent to which constructs differ from each other.
Many methods have been used to assess the discriminant validity. In PLS-SEM, methods such
as AVE of Fornell-Larcker, Cross-loading, Heterotrait-Monotrait Ratio (HTMT) are used to
evaluate the discriminant validity (Garson, 2016). Nevertheless, it is not recommended to use
the cross-loadings and the Fornell-Larcker criterion for assessing discriminant validity in
studies that use PLS-SEM (Garson, 2016). Simulation studies demonstrated that the
heterotrait-monotrait (HTMT) detect better the lack of discriminant validity than those criteria
88
(Henseler, Ringle and Sarstedt, 2014). Moreover, in Information System research, it was
argued that Discriminant validity should be assessed by the Heterotrait-Monotrait Ratio
(HTMT) (Henseler, Hubona and Ash, 2016). The recommended threshold for a well-fitted
model is an HTMT ratio below 1.0 (Garson, 2016), below 0.90 or 0.80 (Henseler, Ringle and
Sarstedt, 2014).
3.4.2.2. Structural Model
Many steps should be taken to assess the structural model after the assessment and validation
of the measurement model. The model’s quality evaluation is based on its ability to anticipate
the endogenous constructs. The evaluation of the structural model taken through some
criteria such as Coefficient of Determination (R2) (Urbach and Ahlemann, 2010), Predictive
Relevance (Q2) (Evermann and Tate, 2014), and Path Coefficients (Garson, 2016).
As stated, this is an exploratory study. PLS path modelling can be used both for explanatory
and predictive research. Depending on the analyst’s aim – either explanation or prediction –
the model assessment will be different. If the analyst seeks to predict, the assessment should
focus on blindfolding and the model’s performance about holding out samples (Evermann and
Tate, 2014).
It was argued that while in traditional regression models the R2 proportion of explained
variance is an indicator of the predictive strength of the model, researchers have recently
advocated the use of blindfolding for assessing the predictive strength of structural equation
models (Evermann and Tate, 2014). The Blindfolding reports four statistics for the model
predictive reliability that is the construct cross-validated redundancy, the construct cross-
validated communality, the indicator cross-validated redundancy and the indicator cross-
validated communality. However, in IS research, it is recommended to use redundancy-based
blindfolding to assert the model’s theoretical/structural predictability (p. 680) and suggests a
threshold of value above 0.5 (Evermann and Tate, 2012). Hence, this pilot study assessed the
structural model validity by the predictive relevance.

89
3.4.2.3. Results and Discussion
The survey instrument was validated. However, nine items were dropped due to lack of
reliability and predictability and due to the cognitive pre-test results (more details on appendix
3). In addition, the name of some the constructs was changed. The construct ICT Contribution
the access and use of agricultural input information was changed to Increased Adoption of
agricultural input information. In addition, the study area was re-specified to only one district
instead of three. The ICT-based agricultural input information on cereals was used only in two
out of the seven districts of Sikasso region. These districts were Bougouni and Koutiala. We
gathered this information after interacting with the team of Myagro and Senekela. Therefore,
the study area was refined after the pilot study.
On the structural model, the results showed that the constructs Relative Advantage,
Compatibility, Observability, Simplicity, Cost, Information Quality were highly predictive of
the endogenous latent variable Use of ICT on agricultural input information (0.715) and the
Use was highly predicting the Contribution of ICT to the access and use of agricultural input
information (0.594) in the outer and inner model through Q2. It is detailed in appendix 3.
In addition, the assessment of R2 suggested the same highly prediction of these two
endogenous latent variables 95.8% and 70.9%. However, the tiny sample of this pilot-study
phase could be biased. Nonetheless, it helped us to refine the research instrument for the
phase of this research, which is to gather data from 300 households in the Sikasso region, Mali.
This sample should enable us to test moderating effects such as Literacy and ICT Skills.
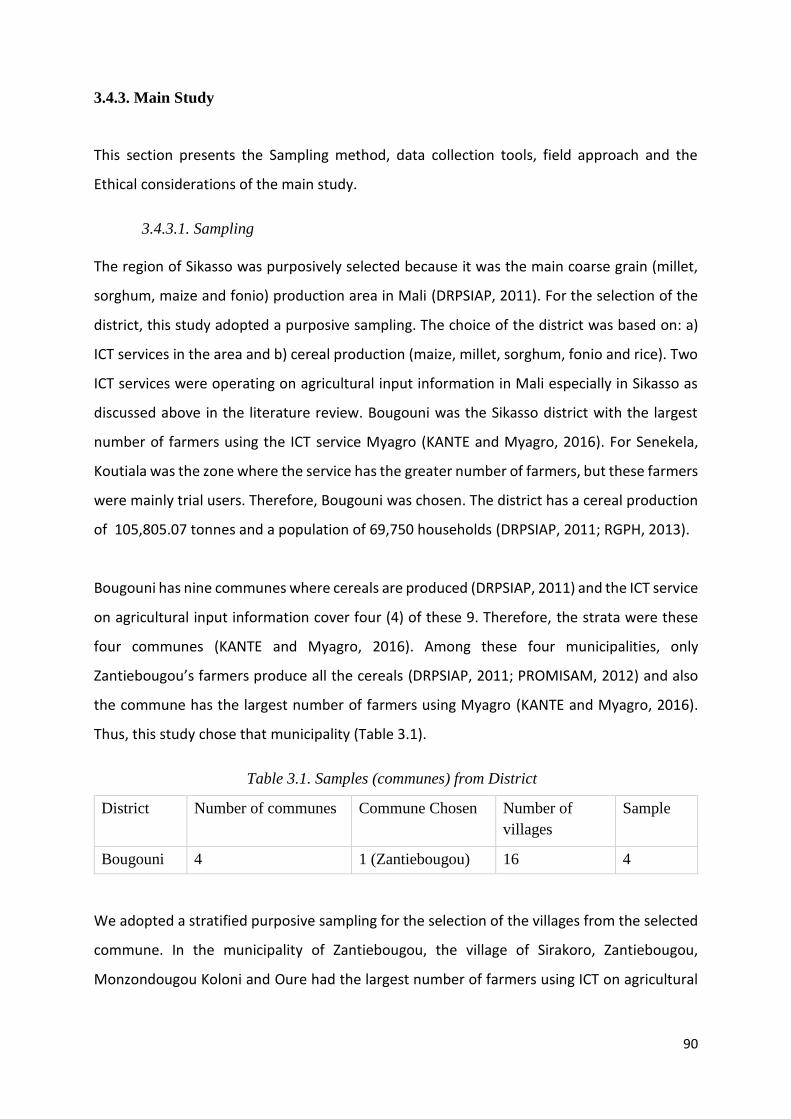
90
3.4.3. Main Study
This section presents the Sampling method, data collection tools, field approach and the
Ethical considerations of the main study.
3.4.3.1. Sampling
The region of Sikasso was purposively selected because it was the main coarse grain (millet,
sorghum, maize and fonio) production area in Mali (DRPSIAP, 2011). For the selection of the
district, this study adopted a purposive sampling. The choice of the district was based on: a)
ICT services in the area and b) cereal production (maize, millet, sorghum, fonio and rice). Two
ICT services were operating on agricultural input information in Mali especially in Sikasso as
discussed above in the literature review. Bougouni was the Sikasso district with the largest
number of farmers using the ICT service Myagro (KANTE and Myagro, 2016). For Senekela,
Koutiala was the zone where the service has the greater number of farmers, but these farmers
were mainly trial users. Therefore, Bougouni was chosen. The district has a cereal production
of 105,805.07 tonnes and a population of 69,750 households (DRPSIAP, 2011; RGPH, 2013).
Bougouni has nine communes where cereals are produced (DRPSIAP, 2011) and the ICT service
on agricultural input information cover four (4) of these 9. Therefore, the strata were these
four communes (KANTE and Myagro, 2016). Among these four municipalities, only
Zantiebougou’s farmers produce all the cereals (DRPSIAP, 2011; PROMISAM, 2012) and also
the commune has the largest number of farmers using Myagro (KANTE and Myagro, 2016).
Thus, this study chose that municipality (Table 3.1).
Table 3.1. Samples (communes) from District7 District Number of communes Commune Chosen Number of
villages
Sample
Bougouni 4 1 (Zantiebougou) 16 4
We adopted a stratified purposive sampling for the selection of the villages from the selected
commune. In the municipality of Zantiebougou, the village of Sirakoro, Zantiebougou,
Monzondougou Koloni and Oure had the largest number of farmers using ICT on agricultural

91
input information. They respectively had 152, 473, 194 and 139 households (RGPH, 2013). A
random sampling was adopted for the selection of the respondents.
The sampling frame was a list of households who were cereal farmers. Kline (2013) argues
that about a good sample size for SEM’s studies should be around 200 cases. In addition,
Garson (2016) agrees to that 200 cases for PLS-SEM. Data were collected from 300
respondents, which was at least 50% above the required number of 200. This was also conform
to the sample size by Hair et al. (2006) that is between 30 and 500. This figure was spread out
to the selected sites proportionally (Table 3.2).
Table 3.2 Samples Distribution 8
District Commune Village Household
s
Sample
Bougouni
Zantiebougou
Zantiebougou 473 473*300/958 = 148.12 ≈ 148
Monzondougou
koloni
194 194*300/958 = 60.75 ≈ 61
Sirakoro 152 152*300/958 = 47.59 ≈ 48
Oure 139 139*300/958 = 43.52 ≈ 43
1 district 1 commune 4 villages 958 300
3.4.3.2. Data Collection Tools and Methods
This study used and adapted the survey instrument from Atkinson (2007) and Ventkatesh et
al. (2003) to refer to ICT on agricultural input information. These instruments are provided in
Table 3.3.
Literature revealed essentially two methods of data collecting in a survey a self-administered
questionnaire and face-to-face interview. Bowling (2005) concluded that the legitimacy of a
study is difficult to establish with some methods than others (more details in appendix 7).
With a low rate of Literacy that did not allow the farmers to fill out the form, enumerators
were formed on how to record an agreement/disagreement scale answer from a respondent.
This was based on the framework of Villar (2009).

92
However, some of the respondents were able to fill out the form. The questionnaire was given
to respondents to fill and return them to enumerators as appropriate. If they could not fill,
statements were read out to them, and they were asked to indicate their level of agreement
or disagreement on a 5-point Likert scale from strongly agree to disagree strongly. Table 3.3
provides an overview of the indicators.
Table 3.3. Constructs and Indicators 9
Section A. Moderators
Literacy
1. I can read and understand alphabets letters
2. I can read to learn and apply my understanding
3. I can write the alphabet letters and numbers
4. I can write a personal letter, a brief description of an event or image
5. I can fill out a simple form
ICT Skills (for all the respondents)
6. I can turn on a computer
7. I can name parts of a computer and connect devices to a computer
8. I can create, modify and delete a folder on a computer
9. I can use Word processing
10. I have an email address
11. I can read and write an email
12. I can use a browser and find online the information I am looking for

93
13. I can write an SMS on a mobile phone
14. I can a follow up procedure given by a customer care on a mobile phone
15. I can take pictures with my mobile phone or download a video on my phone
Section B: Determinants (for ICT users)
Cost
16. The transaction cost such as airtime, bundles for N’gasene/Senekela is not expensive
17. I use N’gasene/Senekela because they are cheaper
18. Getting agricultural input information through other means such as radio, TV, community meetings,
newspaper is expensive than using N’gasene/Senekela
Relative Advantage (RA)
19. N’gasene/Senekela is better than using books or newspaper to get AII
20. N’gasene/Senekela is more interesting than another source of information that I have used to get AII
21. Using N’gasene/Senekela contributed to the access and use of AII than it would not be possible without
them for me
Compatibility
22. N’gasene/Senekela is suitable to the way that I like to get information on agricultural inputs
23. I think other farmers should use N’gasene/Senekela to access/use AII
24. Using N’gasene/Senekela made what I was doing about AII seem more relevant
Simplicity (Simp)
25. When using N’gasene/Senekela, I had no difficulty finding the information that I wanted

94
26. I had no difficulty understanding how to get around in N’gasene/Senekela
27. When using N’gasene/Senekela, I had no difficulty implementing the information that I got
Observability
28. Other farmers were/seemed interested in N’gasene/Senekela when they saw me using it (them)
(because I discuss with them sometimes)
29. People can tell that I know more about access and use of agricultural input information since I have
started using N’gasene/Senekela (because I discuss with them sometimes on these ICTs)
30. Other farmers using N’gasene/Senekela liked using them, i.e. they found them (it) satisfactory (because
I discuss with them sometimes on these ICTs)
Social influence (for all the respondents)
31. My neighbours (village mates, friends) think I should start using/keep using N’gasene/Senekela
32. My friends and parents use N’gasene/Senekela
33. I feel that using N’gasene/Senekela gives me a particular status than those who do not
Information Quality
34. The information I got from N’gasene/Senekela was complete, i.e. all the data necessary to meet my
current need for farm input information was provided
35. The information I got from N’gasene/Senekela was relevant, i.e. the information is suitable for the
current need
36. The information I got from N’gasene/Senekela was appropriate, i.e. in the suitable format and quantity
Section C: Endogenous variables Use of N’gasene/Senekela (All the respondents)
37. I use/plan to use N’gasene/Senekela regularly when preparing to plant my crops
38. I intend to use/continue to use N’gasene/Senekela

95
39. I recommend farmers to use N’gasene/Senekela
Increased adoption of agricultural input information (For those using ICT)
40. Before I started using N’gasene/Senekela, I found it difficult to access agricultural input information
41. Before I started using N’gasene/Senekela, I found it difficult to use agricultural input information
42. After I started using N’gasene/Senekela, I found it easier to access agricultural input information, and I
have more access to agricultural input information
43. After I started using N’gasene/Senekela, I found it easier to use agricultural input information, and I have
improved the use of agricultural input information
3.4.3.3. Field Approach
The field approach describes the way data collection was achieved in the field. The procedure
is explained below:
Once in the village, we identified the community leader(s) who was then visited (including
local agriculture officer).
We then explained to him/her (them) the aim of the study.
We scheduled with him/her (them) the best time to conduct the study in the village.
The best time to conduct the interview or drop the questionnaire to be filled was in the
evening. It was the rainy season, and farmers were in the field during the day.
3.4.3.4. Ethical Considerations
During the survey and before the interviews, this researcher informed the respondents of the
aims of the research. It was stated that the interviews were not part of a supervision process.
The letter provided by the University of Nairobi (see appendix 6) was enough to collect data
using a survey questionnaire. The letter was translated into French and presented to the local
executives in the study area.

96
3.5. DATA ANALYSIS
SPSS V20 was used for descriptive statistics, and SMARTPLS 3.2.6 was used to assess the
model. SEM model contains two models that are also related to each other: the measurement
model and the structural model.
3.5.1. Outer Model Fit Evaluation
Internal Consistency Reliability, Indicator Reliability, Convergent Validity, and Discriminant
Validity were tested to establish the Constructs’ validity of the measurement (outer model)
validity by using the guidelines from the IS research literature.
Urbach & Ahlemann (2010) argue that the traditional criterion for assessing internal
consistency reliability is Cronbach’s alpha (CA), whereas a high alpha value assumes that the
scores of all items with one construct have the same range and meaning (Cronbach 1951).
However, Garson (2016) reports that in the reflective model, Composite Reliability is a
favoured criterion in assessing the convergent validity than Cronbach's alpha. Values above
.700 are desirable for exploratory research either using Cronbach’s Alpha or Composite
Reliability (Urbach and Ahlemann, 2010).
Convergent Validity represents the extent to which individual items reflecting a construct
converge in comparison to items measuring different constructs. Urbach & Ahlemann (2010)
argued that an average variance extracted (AVE) proposed by Fornell and Larcker (1981) is a
commonly applied technique for assessing the convergent validity. It measures the percent of
variance captured by a construct by showing the ratio of the sum of the variance captured by
the construct and measurement variance (Gefen, Straub and Boudreau, 2000). A value above
0.5 of this measure indicates that an LV is on average able to explain more than half of the
variance of its indicators and, thus, indicating a sufficient convergent validity (Urbach and
Ahlemann, 2010; Garson, 2016).

97
The discriminant Validity represents the extent to which the measures of different constructs
differ from each other. Whereas convergent validity tests whether a particular item measures
the construct it is supposed to measure, discriminant validity tests whether the items do not
unintentionally measure something else (Urbach and Ahlemann, 2010). In SEM using PLS, two
measures of discriminant validity are commonly used: Cross loading criterion and Fornell–
Larcker (Urbach and Ahlemann, 2010). However, simulation studies demonstrated that the
discriminant validity could be well assessed by the heterotrait-monotrait (HTMT) than the
other techniques (Henseler, Ringle and Sarstedt, 2014). Moreover, in Information System
research, it was argued that Discriminant validity should be assessed by the Heterotrait-
Monotrait Ratio (HTMT) (Henseler, Hubona and Ash, 2016). Table 3.4 summarises the
measurement model assessment.

98
Table 3.4 Measurement Model Assessment
10Validness Measure Characterisation
Indicator
reliability
Indicator
loading > .600
Loadings represent the absolute effect of the indicator
to the definition of its latent variable (Urbach and
Ahlemann, 2010).
Internal
consistency
reliability
Cronbach’s α >
0.6
Measures the degree to which the MVs load
simultaneously when the LV increases (Urbach and
Ahlemann, 2010; Garson, 2016).
Internal
consistency
reliability
Composite
reliability > 0.6
Attempts to measure the sum of an LV’s factor loadings
relative to the sum of the factor loadings plus error
variance. Leads to values between 0 (completely
unreliable) and 1 (perfectly reliable).
Convergent
validity
Average
Variance
Extracted (AVE)
> 0.5
the degree to which individual items reflecting a
construct converge in comparison to items measuring
different constructs (Urbach and Ahlemann, 2010;
Garson, 2016; Henseler, Hubona and Ash, 2016).
Discriminant
validity
Cross-loadings requires that the loadings of each indicator on its
construct are higher than the cross-loadings on other
constructs (Gefen, Straub and Boudreau, 2000; Urbach
and Ahlemann, 2010).
Discriminant
validity
Fornell-Larcker Requires an LV to share more variance with its assigned
indicators than with any other LV. Accordingly, the AVE
of each LV should be greater than the LV’s highest
squared correlation with any other LV (Urbach and
Ahlemann, 2010).
Discriminant
validity
Heterotrait-
Monotrait Ratio
(HTMT) less
than 1
In Information System research, it was argued that
Discriminant validity should be assessed by the
Heterotrait-Monotrait Ratio (HTMT) (Henseler, Hubona
and Ash, 2016). Its ratio is the geometric mean of the
heterotrait-hetero-method correlations (i.e., the
correlations of indicators across constructs measuring
different phenomena) divided by the average of the
monotrait-hetero-method correlations (i.e., the
correlations of indicators within the same construct)
(Garson, 2016).

99
3.5.2. Structural Model Evaluation
The assessment of the structural model is based on the model capacity to anticipate the
endogenous constructs. Some criteria are assessed to establish the model predictability and
interpretability: Coefficient of Determination (R2) (Urbach and Ahlemann, 2010), Predictive
Relevance (Q2) (Evermann and Tate, 2014), and Path Coefficients (Garson, 2016).
As stated, this is an exploratory study. PLS path modelling can be used both for explanatory
and predictive research. Depending on the analyst’s aim – either explanation or prediction –
the model assessment will be different. If the analyst seeks to predict, the assessment should
focus on blindfolding (Tenenhaus et al., 2005) and the model’s performance about holding out
samples (Evermann and Tate, 2014).
While in traditional regression models the R2 proportion of explained variance is an indicator
of the predictive strength of the model, researchers have recently advocated the use of
blindfolding for assessing the predictive strength of structural equation models (Chin, 2010;
Ringle et al., 2012). Garson (2016) reported that Blindfolding utilises a cross-validation
strategy and reports cross-validated communality and cross-validated redundancy for
constructs as well as indicators.
In IS research, Evermann & Tate (2012) quoting Chin (2010) recommends using redundancy-
based blindfolding to evaluate the structural model predictive relevance with a value of Q2 >
0.5.
R2 is the measure of the proportion of the variance of the dependent variable about its mean
that is explained by the independent variable(s) (Gefen, Straub and Boudreau, 2000). Urbach
& Ahlemann (2010) report that path coefficients exceeding .100 can be considered as having
an impact on the model. The paths coefficient significance test and p-value were done through
the bootstrapping technique.
Finally, we assessed the model fitness. Henseler et al. (2016) argued that currently, the only
approximate model fit criterion implemented for PLS path modelling is the standardised root

100
mean square residual (SRMR). They further claimed that as can be derived from its name, the
SRMR is the square root of the sum of the squared differences between the model-implied
and the empirical correlation matrix, i.e. the Euclidean distance between the two matrices.
Scholars also recommend the cut-off of less than .1 (Garson, 2016). Table 3.5. summarises the
structural model assessment.
Table 3.5 Structural Model Assessment 11
Validness Measure Characterisation
Model
Predictability
Predictive relevance
Q2 > 0.05
By systematically assuming that a certain
number of cases are missing from the
sample, the model parameters are
estimated and used to predict the
omitted values. Q2 measures the extent
to which this prediction is successful
(Urbach and Ahlemann, 2010; Garson,
2016; Henseler, Hubona and Ash, 2016).
Model validity Model fit
SRMR < 0.08
SRMR is a measure of close fit of the
researcher’s model (Garson, 2016;
Henseler, Hubona and Ash, 2016).
Model validity R2 > 0.100 Coefficient of determination (Urbach and
Ahlemann, 2010)
Model validity Path coefficients
Critical t-values for a two-
tailed test are 1.65
(significance level = 10 per
cent), 1.96 (significance
level = 5 per cent), and 2.58
(significance level = 1 per
cent).
Structural path coefficients are the path
weights connecting the factors to each
other (Garson, 2016).

101
Table 3.6 summarises an operationalisation of the research hypotheses. For each one of the
hypothesis, six hundred (600) responses are expected as the hypothesis is constituted of a
dependent and independent variable.
Table 3.6: Hypotheses Measurement 12
Hypotheses Variables Measurements
of Scale
Expected
Responses
Data
Analysis
technique
Hypotheses
Support
H1 Dependent Use of ICT on
agricultural
input
information
Ordinal 600 Bootstrap
technique
Paths
coefficients
significant (t-
statistics; β)
(Urbach and
Ahlemann,
2010; Garson,
2016)
Independent Relative
advantage
Ordinal
H2 Dependent Use of ICT on
agricultural
input
information
Ordinal 600 Bootstrap
technique
Paths
coefficients
significant (t-
statistics; β)
(Urbach and
Ahlemann,
2010; Garson,
2016)
Independent Compatibility Ordinal
H3 Dependent Use of ICT on
agricultural
input
information
Ordinal 600 Bootstrap
technique
Paths
coefficients
significant (t-
statistics; β)
(Urbach and
Ahlemann,
2010; Garson,
2016)
Independent
Simplicity
Ordinal
H4 Dependent Use of ICT on
agricultural
input
information
Ordinal 600 Bootstrap
technique
Paths
coefficients
significant (t-
statistics; β)
(Urbach and
Ahlemann,
2010; Garson,
2016)
Independent
Observability
Ordinal

102
H5 Dependent Use of ICT on
agricultural
input
information
Ordinal 600 Bootstrap
technique
Paths
coefficients
significant (t-
statistics; β)
(Urbach and
Ahlemann,
2010; Garson,
2016)
Independent Social influence Ordinal
H6 Dependent Use of ICT on
agricultural
input
information
Ordinal 600 Bootstrap
technique
Paths
coefficients
significant (t-
statistics; β)
(Urbach and
Ahlemann,
2010; Garson,
2016)
Independent Cost Ordinal
H7 Dependent Use of ICT on
agricultural
input
information
Ordinal 600 Bootstrap
technique
Paths
coefficients
significant
(t- statistics;
β)
(Urbach and
Ahlemann,
2010; Garson,
2016)
Independent
Information
quality
Ordinal
H8 Dependent Increased
adoption of
agricultural
input
information
Ordinal 600 Bootstrap
technique
Paths
coefficients
significant (t-
statistics; β)
; Q2 > 0.05
(Urbach and
Ahlemann,
2010; Garson,
2016)
Independent Use of ICT on
agricultural
input
information
Ordinal

103
3.6. STRUCTURAL EQUATION MODELLING
March & Smith (1995) argue that a model is a set of propositions or statements expressing
relationships among constructs. After proposing a model, it is necessary to evaluate the
model. Evaluation requires the development of metrics and the measurements of artefacts
according to those metrics. The many types of research aim to analyse causal relationship
among variables. Several techniques allow researchers to evaluate their models such as
regression and structural equation modelling (SEM).
SEM is highly recommended and applied in the field of IS Research. For instance,
Gefen et al. (2000) argue that SEM techniques are second-generation data analyses
techniques that can be used to test the extent to which IS research meets recognised
standards for high-quality analysis. In addition, Evermann & Tate (2014) argue that
quantitative research in Information System (IS) frequently uses structural equation
modelling, allowing researchers to represent latent constructs, observations and their
relationship in a single statistical model. Moreover, in contrast to the first generation of
statistical tools such as regression, SEM allows researchers to respond to a set of the
interrelated research question in a single, systematic, and comprehensive analysis by
modelling the relationship between multiple independent and dependent constructs
simultaneously. This capability for simultaneous analysis differs greatly from most first
generation regression models such as linear regression, LOGIT, ANOVA, and MANOVA, which
can analyse only one layer of linkages between independent and dependent variables at a
time (Gefen, Straub and Boudreau, 2000).
There are two models in a Structural Equation Model. The model that represents the
hypotheses, i.e. linking the latent variables is called the structural or inner model. The second
model is known as the measurement model (or outer model). This model deal with how do
you measure your latent variables.

104
Two types of indicators measure the Latent Variables (LV) in the outer models. The outer
model can be composed of Reflective or Formative LV. Each one of these LVs is explained
below in Figure 3.2. This study used the reflective model.
Figure 3.2 Overview of Reflective/Formative Models 11
Source: adapted from Urbach & Ahlemann (2010)
The inner model (structural model) also had two types of variables: Exogenous and
Endogenous. A latent variable is qualified exogenous when there is no other latent variable
affecting it in the model. It is qualified as endogenous if there is another (others) latent
variable affecting it (it has at least one arrow that comes from another LV) (Garson, 2016). In
the case of this study, the model had only two endogenous latent variables (Use of ICT on
agricultural input information and increased adoption of agricultural input information). As no
other variables predict the other latent variables, they are exogenous latent variables.

105
3.6.1. Philosophical Foundation of SEM
Many philosophical positions characterise Information System Research. Saunders et al.
(2009) draw a comparison of the four research philosophies, which can be applied in
information management research (Positivism, realism, interpretivism and pragmatism). As
argued in the paradigm section, this research was a positivist one.
In Information System research, Urbach & Ahlemann (2010) claim that a positivist
epistemological belief is the commonly used philosophical point of view adopted by studies
using SEM. Furthermore, they claimed that the positivist researcher plays a passive, neutral
role and does not intervene in the phenomenon of interest. Epistemologically, the positivist
perspective is concerned with the empirical testability of theories. In other words, these
theories are either confirmed or rejected. The paradigm is, therefore consistent with the
philosophical foundations of SEM.
3.6.2. PLS vs CB
There are two major techniques in SEM. The Partial Least Squares (PLS) and the Covariance
Based (CB). These techniques are different in their analyses’ objectives, their underlying
statistical assumptions, and the nature of the fit statistics they produce (Gefen, Straub and
Boudreau, 2000). The two techniques are compared in Figure 3.3. This figure applies to
information system research.

106
Figure 3.3 Comparison of PLS and CB 12
Source: Urbach & Ahlemann (2010)
PLS can be an adequate alternative to CBSEM if the problem has the following characteristics:
The phenomenon to be investigated is relatively new, and measurement models need
to be newly developed (Urbach & Ahlemann, 2010). That is relevant to this study. A
model for cereal farmers in developing countries is a new model that has to be
developed.
The structural equation model is complex with a large number of LVs and indicator
variables. This argument is also suitable for the proposed model, which has twelve
latent variables with forty-two items.
Relationships between the indicators and LVs have to be modelled in different modes
(i.e., formative and reflective measurement models). The proposed model has only

107
reflective variables. However, Hair et al. (2011) argued that reflective models should
use PLS instead of CB-SEM.
The conditions relating to sample size, independence, or normal distribution are not
met, and. CB requires a large sample size while PLS does not require large sample size.
If the sample size is small, PLS is recommended in Information System research
(Evermann and Tate, 2014), in Marketing research (Hair, Ringle and Sarstedt, 2011).
Moreover, PLS is well developed and used in IS research than CB. Evermann & Tate (2010)
identify IS as the primary user of PLS. In a survey of four IS journals (Management Information
System Quarterly, Information System research, Journal of management of Information
System and Journal of the Association for information system) from 2004 through 2008, they
identified 76 studies using PLS, 54 studies using CB-SEM and six studies using both PLS and CB-
SEM. That was similar to another study conducted by Henseler et al. (2016). PLS is widely used
in information systems research (Marcoulides and Saunders, 2006), strategic management
(Hair et al., 2012a), marketing (Hair et al., 2012b), and beyond. Therefore, this study used PLS.
3.6.3. Critic of the use of PLS in Information System
There are some critics against PLS and its use in the IS research field. Rönkkö et al. (2012)
argued that the use of partial least squares path modelling as a tool for theory testing has
been increasing in the late 90’s and PLS is one of the most common quantitative data analysis
methods in the top IS journals. However, they argued that reliance on PLS method has possibly
resulted in producing and publishing a large number of studies, whose results are invalid. In a
paper entitled ‘Comments on Ronkko and Evermann in (2013), J. Henseler et al. (2014)
concluded that PLS should continue to be used as a valuable statistical tool for management
and organisational research, as well as other social science disciplines.
Specifics critics have been identified, and the literature has addressed them in IS research.
Rönkkö et al. (2012) argue that PLS is not truly an SEM method because it produces
inconsistent and biased estimates and lacks an overidentification test. To this critic, J. Henseler
et al. (2014) argued that hence, bias cannot be a reason for PLS not to be seen as an SEM
method. Moreover, while the lack of an overidentification test in PLS has repeatedly been
108
criticised (e.g., Gefen et al., 2011; Hair et al., 2011), there is in fact no reason that prevents the
testing of the discrepancy between the observed covariance matrix and PLS’s model-implied
covariance matrix (and, indeed, we do this later when addressing Critique 3). They concluded,
therefore, that PLS is an SEM method. Moreover, it is designed to estimate composite factor
models.
Another critic from Rönkkö et al. (2012) is that PLS reduces the effect of measurement error.
In addition, they argued that ‘the idea that PLS results can be used to validate a measurement
model is a myth. Their critics were pointed out on composite reliability, AVE, and the Fornell–
Larcker criterion. However, it was concluded that PLS reduces measurement error but does
not eliminate it (Henseler et al., 2014). Moreover, Researchers can rely on PLS-based
assessment criteria such as the test of exact fit (i.e., statistical inference on the discrepancy
between the empirical covariance matrix and the covariance matrix implied by the composite
factor model) or the SRMR to determine to what extent the composite factor model fits the
data (Henseler et al., 2014). In addressing these critics and comments on them, this research
used in addition to the composite reliability, AVE, Fornell-lacker criterion, and Cronbach’s
alpha, the SRMR.
PLS should not be used for null hypothesis testing or path coefficient (Rönkkö, Parkkila and
Ylitalo, 2012). J. Henseler et al. (2014) concluded that PLS is suitable for null hypotheses
significance test, even if the interrelated constructs are not embedded in a wider nomological
net, if the sample size is relatively low, and if expected effects are small. They further argue
that there is a need for researchers to take care only that they use normal, percentile, or BCa
bootstrapping, but not basic bootstrapping. Given that the dominant PLS software
implementations of SmartPLS (Ringle, Wende, & Will, 2005) and PLS-Graph (Chin & Frye, 2003)
already use normal bootstrapping (Temme, Kreis, & Hildebrandt, 2010), it is unlikely that
researchers using this software have faced or will face problems with Null Hypothesis
Significance Test. Therefore, this research chose to use SMARTPLS for analysis.
Using PLS as an exploratory or early-stage theory testing tool does not feature strongly in the
early PLS articles (Rönkkö, Parkkila and Ylitalo, 2012). However, the inventor of the PLS,
Herman Wold argued that PLS is primarily intended for research contexts that are

109
simultaneously data-rich and theory- skeletal. In addition, PLS can be a valuable tool for
exploratory research because it estimates a less restricted model (the composite factor
model), because it reliably provides estimates even in situations in which other methods fail,
and because as a limited-information approach it is less prone to consequences of
misspecification in subparts of the model (Henseler et al., 2014).
3.6.4. Causal and Predictive Models
PLS has been applied mainly in Information System, Management and Marketing. Rouse &
Corbitt (2008) report the IS discipline as the main user of PLS, Management as the second user
and marketing as third one. In a review in the IS research discipline, Ringle et al. (2012)
reported 65 studies in the top journal of IS over the period 2001 to 2011. They further argue
that this was more than three times the combined number of PLS research in the top three
marketing journals (JMR, JM, JAMS) in the same period.
The literature provides three purposes of any research: exploratory, descriptive or explanatory
(confirmatory). An exploratory study is a valuable means of finding out what is happening; to
seek new insights; to ask questions and to assess phenomena in a new light (Saunders, Lewis,
& Thornhill, 2009). Exploratory research goes with a predictive model (Evermann & Tate,
2014). The object of descriptive research is to portray an accurate profile of persons, events
or situations (Saunders et al., 2009). Studies that establish causal relationships between
variables may be termed explanatory research (Saunders et al., 2009). Explanatory research
goes with the causal model (confirmatory) model (Kante, Oboko, & Chepken, 2017).
However, Evermann & Tate (2014) argued that the causal and predictive modelling does not
form a dichotomy but that there is a middle-ground between the two extreme positions. A
predictive model may be easier to accept by decision makers and other stakeholders when it
can be plausibly interpreted. Further, it may be simpler to determine the prediction
boundaries, i.e. determine under what situations the model will hold and under what
situations the model will break when a plausible substantive interpretation is available. Users
of predictive models have more trust in its results, especially for unexpected or
counterintuitive predictions, when there is a plausible interpretation possible. In contrast to

110
explanatory modelling, the plausible interpretations in this context do not entail a rigorous
formal statistical testing of all posited relationships and model constraints as in causal-
explanatory modelling (Evermann and Tate, 2014).
PLS path modelling was developed to occupy this middle ground and to straddle the traditional
divide between causal-explanatory and predictive modelling at the extremes. It aims to
maintain interpretability while engaging in predictive modelling (Evermann and Tate, 2014).
This technique is characterised as a technique most appropriate where the research purpose
is a prediction or an exploratory modelling (Garson, 2016). This study is exploratory; therefore,
it is predictive rather than explanatory or confirmatory. However, as argued above, it
maintained the interpretability.
3.6.5. Design
Kline (2013) suggests a flowchart of basic steps of SEM that has six steps: model specification;
identification; measure selection and data collection; estimation; re-specification and
reporting the results. Urbach & Ahlemann (2010) proposed a guideline of six steps too when
using PLS-SEM in IS research as the case of this study (Figure 3.4). In addition, Henseler et al.
(2016) proposed a revised guidelines for IS research. This research, therefore, combined these
guidelines.
Figure 3.4 Steps of PLS-SEM Source: Urbach & Ahlemann (2010) 13
The activities that were done following the design of PLS-SEM are reported in Table 3.7.

111
Table 3.7. PLS-SEM Design Activities 13
Problem definition and
research design
Research Objectives To establish farmers’ perception of ICT on agricultural input information
and to identify the effect of that perception on the use of these ICTs.
To establish farmers’ influence on each other in the use of ICT on
agricultural input information and to identify the effect of that influence
on the use of these ICTs.
To establish the challenges faced by farmers in the use of ICT on
agricultural input information and to identify the effects of these
challenges in the use of these ICTs.
To propose an ICT model for increased adoption of agricultural input
information in developing countries using the case of Sikasso in Mali.
Research design A review of some relevant theories/model set the basis for ICT-based
agricultural input information used by cereal farmers
A literature review was conducted in more than 15 developing countries
over 2001 to 2016 to extract Empirical constructs
The empirical constructs were transformed into theoretical constructs by
meaning and definition
The constructs were transformed into a structural equation model
Theoretical foundation Literature review Diffusion of innovation theory (DOI/IDT)
Unified Theory of Acceptance and Use of Technology (UTAUT) and its
extensions TAM and its extensions DIKDAR model
Theory of Knowledge Conceptual Framework and Hypotheses
Model construction and
instrument development
Structural Model Extraction from the theories of factors affecting use of ICT
Eight direct Hypotheses and five moderating effects were developed
Measurement model Adaptation of 36 items
Operationalisation of the variables in reflective models
Instrument: Questionnaire
Instrument translation into French and Nko (Bambara)
Pre-/pilot test: The instrument was validated through a pretest, and a
pilot study and nine items were dropped
Data collection Target 300 (200 required) cereal farmers in Sikasso

112
Mode of administration
Self-administered/interview face to face
Collected
222
Quality assessment
screening, missing values, outliers, Multivariate Normality and
Multicollinearity
Model validation Measurement model (outer model) Indicator reliability
Convergent validity
Discriminant validity
Structural model (inner model)
Q2
R2
Paths coefficients
SRMR
Interpretation Results and Discussion Measurement model fit
Convergence
Convergent validity
Discriminant validity
Structural Model fit (inner model)
The Standardized Root Mean Square Residual (SRMR)
The coefficient of determination (R2)
The path coefficient
Predictive relevance (Q2)
Hypothesis validation
Moderating variables validation
Results Discussion
Source: adapted from Urbach & Ahlemann (2010)

113
3.7. DATA MANAGEMENT
The dataset was entered into SPSS v 20 for Screening, Missing Values, Outliers, Multivariate
Normality and Multicollinearity. The findings and adjustments are presented in this section.
3.7.1. Data screening
The goal of the screening was to establish the accuracy of the data. The data screening showed
that 40 questionnaires were partially filled disqualifying them for analyses. In addition, 38
responses had a low rate of responses. Thus, we had 222 valid responses.
For the 222 valid responses, we compared the data to the original questionnaires to check
that items had been entered correctly. There were no incorrect data but missing values.
3.7.2. Missing values
Missing data analysis was carried out using SPSS. The topic how to analyse dataset with
missing observations is complicated. Kline (2013) argued that prevention is the recommended
approach. For example, items that are clear and unambiguous may prevent missing answers
(Kline, 2013). The translation of the current survey instrument from English to French and
Bambara helped us in this view.
There are many techniques to deal with missing values. PLS-SEM offers three-technique to
deal with missing values (Kline, 2013; Garson, 2016). These are Imputation, Casewise Deletion
and Pairwise deletion. The method of imputation involves placing estimated scores into the
data set in the location of the missing data (Carter, 2006). A variation is a group-mean
substitution, in which a missing score in a particular group is replaced by the group mean
(Kline, 2013). In PLS-SEM, the group-mean technique is known as Mean Replacement whereby
all missing data points are replaced with the average value of all remaining data points per
column (i.e. indicator or variable). In Casewise Deletion or Listwise Deletion, cases with missing
scores on any variable are excluded from all analyses (Carter, 2006; Kline, 2013). Based on the
sample size and number of variables this can result in a considerable reduction in the sample
size available for data analysis (Carter, 2006). An advantage of listwise deletion is that all
analyses are conducted with the same number of cases. That is not so with Pairwise Deletion,

114
in which cases are excluded if they have missing data on variables involved in a particular
analysis (Kline, 2013). Accordingly, pairwise deletion is not recommended for use in SEM
unless the number of missing observations is small (Carter, 2006; Kline, 2013).
Bovaird et al. (2007) argued that Listwise Deletion, Pairwise Deletion and Single Imputation
are not recommended in PLS-SEM. They recommend the Multiple Imputation. As a rule of
thumb, they further suggested that imputation of a variable is often called for when more than
5% of its values are missing. However, the variable should simply be dropped from the analysis
if there too missing values (Bovaird et al., 2007). In contrast, other researchers suggested that
“too numerous” is greater than 15%, but researchers vary on the appropriate cut off (Hair et
al., 2014).
For the 222 records, there were eight missing values throughout three variables. We applied
the Mean Replacement (group imputation) technique.
3.7.3. Outlier Analysis
An outlying observation, or outlier, is one that appears to deviate markedly from other
members of the sample in which it occurs (Hodge and Austin, 2004). Outliers are scores that
are different from the rest (Kline, 2013). The objective of this analysis was to detect these
outliers.
For the outliers’ detection, the software used SmartPLS 3.2.6 was used rather than SPSS. We
designed the study according to PLS-SEM, and we think that a PLS-SEM tool such because
SMARTPLS is more suitable for detecting outliers in this case. Garson (2016) argued that as
with other procedures, PLS results might be distorted due to the presence of outliers.
Using SMARTPLS, the function Residuals was analysed to identify outliers in the data. Since
residuals reflect the difference between observed and expected values, there is good model
fit when residuals are low, and also since data are standardised and assuming a normal
distribution of scores, residuals greater than absolute 1.96 may be considered outliers at the
.05 level (Garson, 2016). In the case of this study, as no value was higher than 1.96 at the level

115
of 0.05, this researcher concluded that there were no outliers. These results are reported in
appendix 5. In addition, the coefficients in the Table 3.8 showed that there were not outliers
as the values were not greater than 1.96.
Table 3.8. Latent Variable Correlation 14
SI Increased
adoption
cost cp iq ob ra simp u_i_aif
SI 1.000
Increased
adoption
0.059 1.000
cost 0.032 0.576 1.000
cp 0.037 0.808 0.756 1.000
iq 0.040 0.799 0.741 0.819 1.000
ob -
0.032
0.809 0.767 0.867 0.825 1.000
ra 0.035 0.752 0.729 0.827 0.811 0.803 1.000
simp 0.088 0.410 0.447 0.429 0.406 0.404 0.487 1.000
u_i_aif 0.087 0.827 0.768 0.836 0.818 0.841 0.805 0.501 1.000
3.7.4. Data Coding
Data were coded as follows:
The village was coded as 1, 2 and 3
The gender was coded as 1 for male and 2 for female
The head of household was coded as 1 for yes or 2 for no
The cereal farmers as 1 for yes or 2 for no
Each cereal was coded as 1 for producing and 2 for not producing that one,
The use of ICT was coded as 1 for yes and 2 for no,
The use of Ngasene was coded as 1, Senekela as 2 and 3 as telecentre
Time of use was coded as 1 for less than a year, 2 for one year and 3 for more than
a year
For each of the constructs, a number between 1 and 5 was used for each of the
Likert scale choice (from strongly agree to disagree strongly).

116
There were missing data that was coded as 0. This was the data part of the design, and they
were to be ignored according to Schafer (1997). The missing value that was not part of the
design was left empty so that they could be detected and treated.
3.7.5. Multivariate Normality
Multivariate normality assumes that the joint effect of two variables is usually distributed
(Gupta, 2014). Many instances of multivariate nonnormality are detectable through inspection
of univariate distributions (Kline, 2013). We determined the Skew and kurtosis of the data.
There are two ways that a distribution can be non-normal, and they can occur either
separately or together in a single variable (Kline, 2013). Skew implies that the shape of a
unimodal distribution is asymmetrical about its mean. Positive skew indicates that most of the
scores are below the average, and negative skew indicates just the opposite. The Kurtosis
measures the relative peak of the average in distribution. For a unimodal, symmetrical
distribution, positive kurtosis indicates heavier tails and a higher peak and negative kurtosis
indicates just the opposite, both relative to a normal distribution with the same variance
(Kline, 2013) (Table 3.9).
Table 3.9 Statistical Analysis of the Variables 15
Mean Std. Skewness Kurtosis Construct
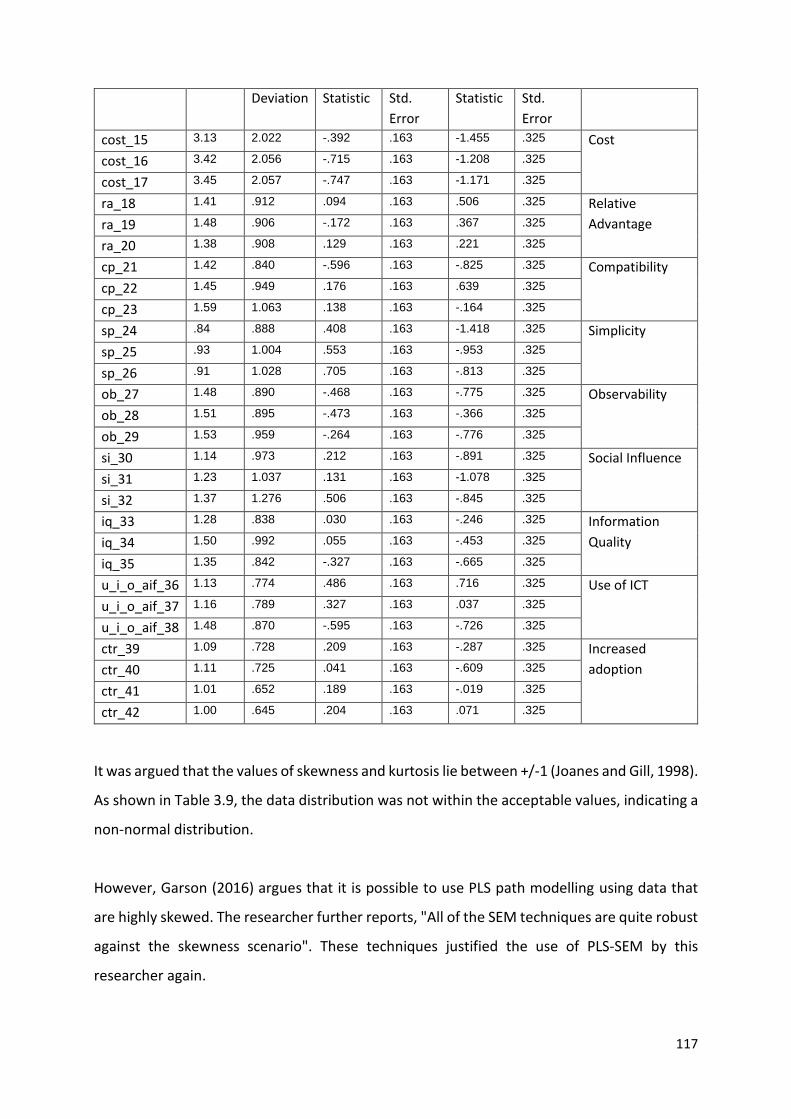
117
Deviation Statistic Std.
Error
Statistic Std.
Error
cost_15 3.13 2.022 -.392 .163 -1.455 .325 Cost
cost_16 3.42 2.056 -.715 .163 -1.208 .325
cost_17 3.45 2.057 -.747 .163 -1.171 .325
ra_18 1.41 .912 .094 .163 .506 .325 Relative
Advantage ra_19 1.48 .906 -.172 .163 .367 .325
ra_20 1.38 .908 .129 .163 .221 .325
cp_21 1.42 .840 -.596 .163 -.825 .325 Compatibility
cp_22 1.45 .949 .176 .163 .639 .325
cp_23 1.59 1.063 .138 .163 -.164 .325
sp_24 .84 .888 .408 .163 -1.418 .325 Simplicity
sp_25 .93 1.004 .553 .163 -.953 .325
sp_26 .91 1.028 .705 .163 -.813 .325
ob_27 1.48 .890 -.468 .163 -.775 .325 Observability
ob_28 1.51 .895 -.473 .163 -.366 .325
ob_29 1.53 .959 -.264 .163 -.776 .325
si_30 1.14 .973 .212 .163 -.891 .325 Social Influence
si_31 1.23 1.037 .131 .163 -1.078 .325
si_32 1.37 1.276 .506 .163 -.845 .325
iq_33 1.28 .838 .030 .163 -.246 .325 Information
Quality iq_34 1.50 .992 .055 .163 -.453 .325
iq_35 1.35 .842 -.327 .163 -.665 .325
u_i_o_aif_36 1.13 .774 .486 .163 .716 .325 Use of ICT
u_i_o_aif_37 1.16 .789 .327 .163 .037 .325
u_i_o_aif_38 1.48 .870 -.595 .163 -.726 .325
ctr_39 1.09 .728 .209 .163 -.287 .325 Increased
adoption ctr_40 1.11 .725 .041 .163 -.609 .325
ctr_41 1.01 .652 .189 .163 -.019 .325
ctr_42 1.00 .645 .204 .163 .071 .325
It was argued that the values of skewness and kurtosis lie between +/-1 (Joanes and Gill, 1998).
As shown in Table 3.9, the data distribution was not within the acceptable values, indicating a
non-normal distribution.
However, Garson (2016) argues that it is possible to use PLS path modelling using data that
are highly skewed. The researcher further reports, "All of the SEM techniques are quite robust
against the skewness scenario". These techniques justified the use of PLS-SEM by this
researcher again.
118
3.7.6. Multicollinearity
Multicollinearity is not a problem in PLS (Garson, 2016). However, Gustafsson & Johnson
(2004) noted that this does not mean that multicollinearity just "goes away." The factor
indicators multicollinearity in the outer model remains a problem for high correlations
between indicators for one factor and indicators for another. PLS might miss a simple factor
structure, and the factor cross-loadings will mean PLS factors will be difficult to label, interpret,
and distinguish to the degree this type of multicollinearity exists (Garson, 2016).
We run a bivariate correlation between the variables of the study. The results showed that
there was no Multicollinearity between the variables (Appendix 5).

119
CHAPTER FOUR
RESULTS AND DISCUSSION
4.1. INTRODUCTION
This chapter presents the results SMARTPLS 3.2.6 (Ringle, C. M., Wende, S., and Becker, 2015)
and discusses them. The first section (4.2.) describes the descriptive statistics of the
respondent. The section 4.3. discusses the outer model assessment (measurement model),
and the section 4.4. addresses the inner model (structural model). The section 4.5. addresses
the study’s objectives by hypotheses. It also compares the findings with the current literature.
4.2. DESCRIPTIVE STATISTICS AND DISCUSSION
The descriptive statistics are reported and discussed in this section.
4.2.1. USE OF ICT
Table 4.1 summarises the ICT services’ distribution among the respondents. Over 80% of the
respondents were using ICT on agricultural input information.
Table 4.1 use of ICT services distribution 16
Frequency Percentage
Farmers using ICT services 178 80.18%
Farmers not using ICT services 44 19.82%
Total 222 100%
4.2.2. Gender and Age
The results of Table 4.2 showed that 75.23% of the respondents were female. In addition,
there were more female farmers using ICT on agricultural input information: 74.72% female
ICT users against 25.28% male. Although the man was the head of the household in most
cases, the woman was chosen by the household head to address the questionnaire if she
wanted to.

120
Large payment of seeds and fertilisers as expected by farmers in most cases is almost an
unattainable task for them. The Layaway plan of the mobile phone (myagro) helps small-scale
farmers to pay for agricultural inputs (fertilisers, seeds, and training packages) on a layaway
basis, using their cell phone (de la Rive Box et al., 2015). This phenomenon is like the way
people buy talk-time for telephone conversations. Users (registered farmers) can save easily
when continuously topping up their Myagro (the most used ICT’ service in the area) accounts
via the purchase of additional cards. The Mobile Layaway plan makes saving for these larger
purchases as easy as buying a bar of soap or cup of oil. This method of payment (small amount)
attract women than men. It explains the high number of Women using the service to adopt
agricultural input information for the household.
A study entitled “Information technologies as a tool for agricultural extension and farmer-to-
farmer exchange: Mobile-phone video use in Mali and Burkina Faso’ by Sousa et al. (2016)
argue that older male farmers have privileged access to agricultural information (including
agricultural input information). Our findings on the gender and use of ICT on agricultural input
information are in contrast with that finding of Sousa et al. (2016). However, they supported
the conclusion of a study (Njelekela and Sanga, 2015) in Tanzania whose results revealed that
females tend to be more adopting ICT on agricultural services compared to male.
Regarding age distribution, over 51% of the respondents were between 30 to 45 years old. A
high rate 66.09% of these respondents were using ICT services was observed among women
between 30 to 45 years (see Table 4.2).
Table 4.2. Gender Distribution by Age and use of ICT service 17
Age Use of ICT Total
Yes No
Female Male Female Male Frequency Percentage
< 30 27 5 5 0 37 16.67%
30-45 76
17 18 4 115 51.80%
> 45 30 23 11 6 70 31.53%
Total 133 45 34 10 222 100%

121
4.2.3. Family size and Use of ICT
Table 4.3 showed that majority of ICT services users was the family where the family size
is between four and eight. The second are families where the size is more than eight
members. It was also noticed that the families where the members are below four were
very few to use ICT on agricultural input information. Perhaps, there is a need to conduct
further inquiry to see if the factor family size has any moderating effect on use of ICT.
Table 4.3. Use of ICT Services Distribution by Family Size 18
Family size bracket USE OF ICT Frequency Percentage
yes no
< 4 30 1 31 13.96%
4 - 8 81 27 108 48.65%
>8 67 16 83 37.39%
Total 178 44 222 100%
4.2.4. Duration
Use of ICT (adoption) duration is provided in Table 4.4
Table 4.4. Usage Duration of ICT and Adopters’ Categories19
Duration Category Frequency Percentage
Less than a year Late majority adopters 57 32.02%
A year Early majority adopters 77 43.26%
More than a year Early adopters 44 24.72%
Total 178 100%
People in a social system do not adopt an innovation at the same time. Rather, they adopt in
a time sequence, and they may be classified into adopter categories by when they first begin
using a new idea (Rogers, 1983). The results revealed three categories of adopters (users):
early adopters, early majority adopters and late majority adopters. The early adopter is
considered by many as "the individual to check with" before using a new idea or ICT on
agricultural input information. The early majority may deliberate for some time before
completely adopting a new idea. Their innovation-decision period is relatively longer than that
of the innovator and the early adopter. This time in the case of this study was likely one year.

122
In this study, the late majority adopt ICT services when more than 67% used ICT services on
agricultural input information.
These results are shown in Table 4.4. confirmed this time dimension of the Diffusion of
Innovation Theory (DOI/IDT). Moreover, the time dimension was highlighted to be the missing
link in many theories of technology adoption such as TAM (and its extensions) and UTAUT (and
its extensions). For instance, Kiwanuka (2015) reports that UTAUT fails to measure traits of
individuals like innovativeness. That justifies the use of Diffusion of Innovation Theory again
as the basis for this study.
4.2.5. Literacy and ICT Skills
Table 4.5 summarises the Literacy and ICT (mobile phone) Skills among the respondents. High
level of Skills in both Literacy and Mobile phone are observed in the ICT’s user category. Only
3.15% reported that they could turn on a computer.
Table 4.5 Skills Distribution 20
Skills Yes No
Total
ICT
services’
user
ICT
services’
non-user
Literacy Basic Able to read and
write alphabet
letters and
numbers
67.56%
13.51%
18.93%
100%
Mean Able to write a
personal letter or a
brief description of
an event
10.36%
4.50% 85.14% 100%
Advanced Fill out a form
7.65%
4.05% 88.30% 100%
Mobile
phone
skill
Write an SMS
29.28% 16.22% 54.5% 100%
Call and follow up instruction given by a
customer care centre
72.52%
16.22%
8.26%
100%
Take a picture or download a video 51.80% 15.77% 67.57% 32.43%
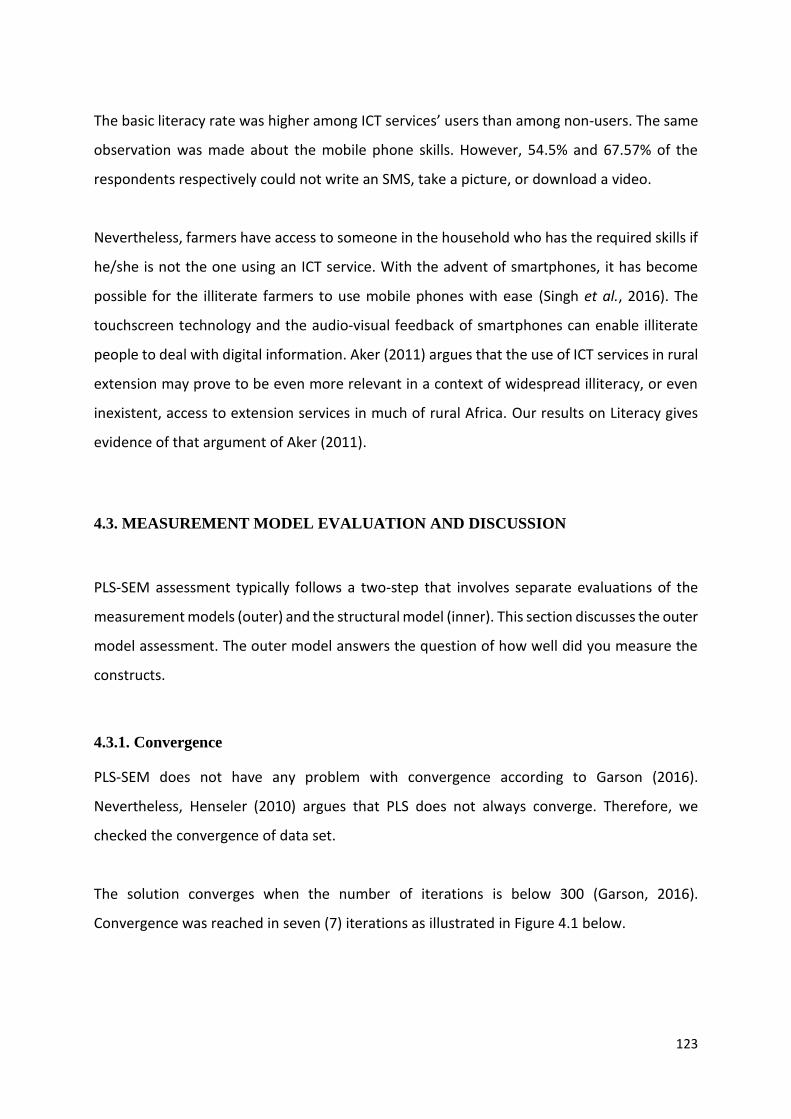
123
The basic literacy rate was higher among ICT services’ users than among non-users. The same
observation was made about the mobile phone skills. However, 54.5% and 67.57% of the
respondents respectively could not write an SMS, take a picture, or download a video.
Nevertheless, farmers have access to someone in the household who has the required skills if
he/she is not the one using an ICT service. With the advent of smartphones, it has become
possible for the illiterate farmers to use mobile phones with ease (Singh et al., 2016). The
touchscreen technology and the audio-visual feedback of smartphones can enable illiterate
people to deal with digital information. Aker (2011) argues that the use of ICT services in rural
extension may prove to be even more relevant in a context of widespread illiteracy, or even
inexistent, access to extension services in much of rural Africa. Our results on Literacy gives
evidence of that argument of Aker (2011).
4.3. MEASUREMENT MODEL EVALUATION AND DISCUSSION
PLS-SEM assessment typically follows a two-step that involves separate evaluations of the
measurement models (outer) and the structural model (inner). This section discusses the outer
model assessment. The outer model answers the question of how well did you measure the
constructs.
4.3.1. Convergence
PLS-SEM does not have any problem with convergence according to Garson (2016).
Nevertheless, Henseler (2010) argues that PLS does not always converge. Therefore, we
checked the convergence of data set.
The solution converges when the number of iterations is below 300 (Garson, 2016).
Convergence was reached in seven (7) iterations as illustrated in Figure 4.1 below.

124
Figure 4.1 Data Convergence in SMARTPLS 3.2.6 14
4.3.2. Convergent Validity
A group of variables presumed to measure the same construct shows convergent validity if
their inter-correlations are at least moderate in magnitude (Kline, 2013). In PLS-SEM, some
actions are used to assess the convergent validity.
Composite reliability
The reliability is defined as the truthiness to which a question extends in its claim to
measure what it intended to measure. Construct reliability assessment routinely focuses
on composite reliability as an estimate of a construct’s internal consistency (Hair, Ringle
and Sarstedt, 2011). Unlike Cronbach’s alpha, composite reliability does not assume that
all indicators are equally reliable, making it more suitable for PLS-SEM, which prioritises
indicators according to their reliability during model estimation (Hair et al., 2014). The
Composite reliability should be equal or greater than.6 for exploratory research (Hair,
Ringle and Sarstedt, 2011; Kline, 2013; Garson, 2016). Table 4.6 shows that the Composite
Reliability of each one of the constructs under study was greater than 0.8.
Cronbach’s Alpha
It also assesses the question of reliability of the indicators for latent variables. Table 4.6
shows that the Cronbach’s alpha of each one of the construct was greater than 0.8 that
was right scale according to scholars (Hair, Ringle and Sarstedt, 2011; Kline, 2013; Garson,
2016).
Average Variance Extracted (AVE)
The AVE measures the percent of variance captured by a construct

125
by showing the ratio of the sum of the variance captured by the construct and
measurement variance (Gefen, Straub and Boudreau, 2000). For a model to be qualified as
adequate, the value this measure (AVE) should be above .5 (Urbach and Ahlemann, 2010;
Garson, 2016). Table 4.6 shows that the AVE of each one of the construct was greater than
0.6.
Indicator reliability
The loadings squared represent the indicator reliability value. They represent the path
weights linking up factors and indicator variables. Table 4.6 shows that the indicator
reliability of each one of the items was greater than 0.7 except three items: si_30 (0.353),
si_32 (0.661) and u_i_o_aif_36 (0.696). Nevertheless, low cutoffs such as 0.4 can be
accepted in exploratory setting (Urbach and Ahlemann, 2010).

126
Table 4.6 Convergent Validity 21
Construct Items Loadings Indicator
reliability
Cronbach’s
alpha
Composite
reliability
AVE
Cost cost_15 0.837 0.701 0.891 0.933 0.823
cost_16 0.938 0.880
cost_17 0.943 0.889
Compatibility cp_21 0.89 0.792 0.864 0.917 0.785
cp_22 0.887 0.787
cp_23 0.882 0.778
Increased
adoption
ctr_39 0.884 0.781 0.908 0.935 0.784
ctr_40 0.858 0.736
ctr_41 0.894 0.799
ctr_42 0.904 0.817
Information
Quality
iq_33 0.882 0.778 0.869 0.919 0.792
iq_34 0.891 0.794
iq_35 0.897 0.805
Observability ob_27 0.916 0.839 0.913 0.945 0.852
ob_28 0.929 0.863
ob_29 0.924 0.854
Relative
Advantage
ra_18 0.932 0.869 0.922 0.950 0.864
ra_19 0.936 0.876
ra_20 0.921 0.848
Social
Influence
si_30 -0.594 0.353 0.909 0.827 0.621
si_31 -0.922 0.850
si_32 -0.813 0.661
Simplicity sp_24 0.945 0.893 0.928 0.954 0.874
sp_25 0.933 0.870
sp_26 0.927 0.859
Use of ICT on
AII
u_i_o_aif_36 0.834 0.696 0.820 0.893 0.735
u_i_o_aif_37 0.843 0.711
u_i_o_aif_38 0.894 0.799
Based on the Indicator Reliability, Cronbach’s Alpha, Composite Reliability and Average
Variance Extracted, the study concluded that the convergent validity of each one of the
constructs under study was established.

127
4.3.3. Discriminant Validity
Discriminant validity and Convergent validity are measures of Construct validity. Hair et al.
(2014) argued that Discriminant validity corresponds to the extent to which the construct
measures what it is intended to measure compared to other constructs in the model. The
results of this assessment are reported below.
The Fornell–Larcker criterion
This method is successful in achieving discriminant validity only if the construct shares more
variance with its indicators than with any other construct (Hair et al., 2014; Garson, 2016). To
test this requirement, the AVE of each construct should be higher than the highest squared
correlation with any other construct (Gefen, Straub and Boudreau, 2000; Hair et al., 2014). As
shown in Table 4.7, the discriminant validity of each one of the construct under study was
established according to this criterion.
Table 4.7. Fornell–Larcker Discriminant Validity criterion 22
Heterotrait-Monotrait Ratio (HTMT)
In PLS-SEM, methods such as AVE of Fornell-Larcker, Cross-loading, Heterotrait-Monotrait
Ratio (HTMT) are used to assess the discriminant validity (Hair, Ringle and Sarstedt, 2011; Hair
SI Increased
adoption cost cp iq ob ra simp u_i_aif
SI 0.788
Increased
adoption 0.059 0.885
cost 0.032 0.576 0.907
cp 0.037 0.808 0.756 0.886
iq 0.040 0.799 0.741 0.819 0.890
ob -0.032 0.809 0.767 0.867 0.825 0.923
ra 0.035 0.752 0.729 0.827 0.811 0.803 0.930
simp 0.088 0.410 0.447 0.429 0.406 0.404 0.487 0.935
u_i_aif 0.087 0.827 0.768 0.836 0.818 0.841 0.805 0.501 0.858

128
et al., 2014; Garson, 2016). However, the use of the heterotrait-monotrait (HTMT) is
recommended in assessing discriminant validity (Henseler, Ringle and Sarstedt, 2014).
In Covariance Based Structural Equation Modelling (CB-SEM), Henseler et al., (2014) argue that
the HTMT should be lower than 0.85 or at least 0.90. The values could be used in PLS-SEM in
confirmatory settings. However, Garson (2016) argues that the HTMT ratio should be below
1.0. The constructs of this study passed the heterotrait-monotrait ratio test (Table 4.8).
Table 4.8 HTMT Criterion 23
SI INCREASED
ADOPTION
COST CP IQ OB RA SIMP U_I_AIF
Social Influence 0.000
Increased
adoption
0.038 0.000
Cost 0.048 0.641 0.000
Compatibility 0.053 0.911 0.860 0.000
Information
Quality
0.052 0.898 0.841 0.942 0.000
Observability 0.114 0.887 0.849 0.974 0.924 0.000
Relative
Advantage
0.052 0.822 0.803 0.926 0.906 0.874 0.000
Simplicity 0.131 0.447 0.491 0.479 0.452 0.437 0.525 0.000
Use of ICT on
AII
0.053 0.958 0.896 0.991 0.968 0.969 0.925 0.575 0.000
It was concluded that the discriminant validity of the construct of this study was established.
After establishing the Convergent and Discriminant validity, this researcher argued that the
Construct Validity was established for each one of the latent variables.

129
4.4. STRUCTURAL MODEL EVALUATION (INNER MODEL) AND DISCUSSION
Structural model or Inner model is assessed if the measurement model or outer model
assessment was acceptable. The outer model defines the meaning of the constructs in the
structural model/inner model (Garson, 2016). The structural model or inner model represents
the causal model. The primary criterion for the evaluation of the causal model is the coefficient
of determination (R2). The second criterion is the path coefficient (β), and the third is the effect
size. The fourth criterion is the Predictive relevance (Q2). The last criterion is to test the
moderating variables if there is any. The results of these assessments are described in this
section.
4.4.1. The Coefficient of Determination (R2)
It measures the proportion of the variance of the dependent variable about its mean that is
explained by the independent variable(s) (Gefen, Straub and Boudreau, 2000). As shown in
Figure 4.3, the variance for the first endogenous variable (Use of ICT on agricultural input
information –u_i_aif) was 0.807. That means that the Relative Advantage, Compatibility,
Simplicity, Cost, Information Quality, Observability and Social Influence explained 80.7% of the
variance in Use of ICT on agricultural input information. This R2 value of Use of ICT on
agricultural input information was higher than previous studies in this context and beyond.
For instance, R2 values of 0.437 by Ajjan & Hartshorne (2008), 0.35 by Lin (2008), 0.14 by
Gumussoy & Calisir (2009), 0.269 by Hartshorne & Ajjan (2009), 0.69 by Moghaddam & Salehi
(2010) and 0.584 by Kapoor et al. (2013) were less than that of this study, which is 0.807. This
value shows that the R2 value of this study is good and that the validated model (variables) of
this study explains more clearly the adoption or use of ICT services than these previous studies
in the agricultural input information field and beyond. Urbach and Ahlemann (2010) quoting
chin (1998b) argue that values of approximately .670 are substantial, values approximately
.333 are average, and values of .190 and lower are weak. As the model’s R2 was greater than
0.670, it was again substantial in explaining use of ICT by small-scale cereal farmers. The latent
variable Use of ICT on agricultural input information explained 68.4% the variance of Increased
Adoption of agricultural input information.

130
4.4.2. The Path Coefficient
Weights closest to absolute 1 reflect the strongest paths while weights closest to 0 reflect the
weakest paths (Garson, 2016).
On the first endogenous variable, it was found that Observability has the strongest effect on
Use of ICT on agricultural input information (0.286), followed by Compatibility (0.191). The
Information Quality and Cost come as the third and fourth latent variable having the strongest
effect on Use of ICT on agricultural input information (0.190) and (0.132).
On the last endogenous variable, the Use of ICT on agricultural input information has a strong
effect (0.827) on an increased adoption of agricultural input information. The path coefficient
β of the entire model’s construct was greater than 0.1 except for the Social Influence (0.064).
Using SMARTPLS 3.2.6, we run the bootstrapping function as suggested by Garson (2016)
(Figure 4.2). In Figure 4.2., the recommended values for running the bootstrapping technique
can be seen as suggested by (Garson, 2016). In addition to the path coefficient β, we reported
the path coefficient value significance (t statistics) in Table 4.9.
Table 4.9 Path Coefficients 24
β T Statistics P Values
SI -> U_I_AIF 0.064 1.089 0.277
COST -> U_I_AIF 0.132 2.299** 0.022
CP -> U_I_AIF 0.191 2.806*** 0.005
IQ -> U_I_AIF 0.190 3.068*** 0.002
OB -> U_I_AIF 0.286 3.726*** 0.000
RA -> U_I_AIF 0.114 1.667* 0.096
SIMP -> U_I_AIF 0.107 2.736*** 0.006
U_I_AIF -> INCREASED ADOPTION 0.827 33.590*** 0.000
Critical t-values for a two-tailed test are 1.65* (significance level = 10 per cent), 1.96**
(significance level = 5 per cent), and 2.58*** (significance level = 1 per cent).
4.4.3. Effect Size (f2)
The effect size measures if an independent LV has a substantial impact on a dependent LV. It
is calculated as the increase in R2 of the LV to which the path is connected, relative to the LV’s
proportion of unexplained variance (Chin 1998). Values for f between .020 and .150, between

131
.150 and .350, and exceeding .350 indicate that an exogenous LV has a small, medium, or large
effect on an endogenous LV (Urbach and Ahlemann, 2010; Garson, 2016). The effect size is
part of the hypotheses validation and is therefore reported in Table 4.15.
Figure 4.2 Bootstrapping function in SMARTPLS 3.2.6

132
15
Figure 4.3 Model Results 16

133
4.4.4. Predictive Relevance (Q2)
Another assessment of the structural model involves the model’s capability to predict. Table
4.10 displays the results of the predictive relevance done using the Blindfolding function of
SmartPLS 3.2.6 following Garson (2016).
The Cost, Compatibility (cp), Information Quality (IQ), Observability (ob), Relative Advantage
(ra), Social Influence (si) and Simplicity (simp) are highly predictive of the use of ICT on
agricultural input information with a high Q2 (0.555). The Use of AII (u_i_aif) is also highly
predictive of its endogenous latent variable Increased Adoption with a strong Q2 (0.504).
Table 4.10 Predictive Relevance 25
SSO SSE Q² (=1-SSE/SSO)
SI 666.000 666.000 0.000
INCREASED ADOPTION 888.000 440.514 0.504
COST 666.000 666.000 0.000
CP 666.000 666.000 0.000
IQ 666.000 666.000 0.000
OB 666.000 666.000 0.000
RA 666.000 666.000 0.000
SIMP 666.000 666.000 0.000
U_I_AIF 666.000 292.945 0.555
4.4.5. Standardised Root Mean Square Residual (SRMR) Approximate Fit
It measures the approximate fit of the model under study. Using SMARTPLS, the function
Model fit provided us with the SRMR value, 0.055. The understudy model passed this test. An
SRMR value less than 0.08 is adequate for PLS (Garson, 2016; Henseler, Hubona and Ash,
2016).

134
4.5. HYPOTHESIS VALIDATION AND DISCUSSION
This section reports the results of the hypotheses assessment. This section begins with the
moderating variables and then continues by reporting the evaluation of the direct hypotheses.
4.5.1. Moderating Variables Validation
The moderating variables were tested using the Multi-Group Analysis function. The
significance of a moderating variable is established if the p-value is less than .05 or greater
than .95 (Garson, 2016). It is the most commonly used in assessing moderating effect using
PLS-SEM (Garson, 2016).
Using SMARTPLS 3.2.6, we created two data groups Literacy (Literacy and Illiteracy) and ICT
Skills (Skilled and Unskilled) as suggested by Garson (2016). The function MGA was used to
analyse the two groups for each variable. The results are reported in this section.
The multi-group analysis in SmartPLS 3.2.6 reports three techniques in this analysis (Asyraf
Afthanorhan, Nazim and Ahmad, 2014).
The parametric approach, which assumes that the data are normally distributed (Asyraf
Afthanorhan et al., 2014). The data were not satisfying this condition; thus, it was
excluded.
Equal Variance, which often assumes the analyses are usually distributed (Asyraf
Afthanorhan et al., 2014). This approach also was rejected because our data distribution
was not normal.
Unequal variance known as the Satterthwaite test is appropriate to try once to apply
multi-group analysis (modelling the moderating effect). This approach is perceived more
relevant compared with the equal variance because this test does not assume that all the
data are usually distributed (Asyraf Afthanorhan et al., 2014). Therefore, this researcher
chose to rely on the Satterthwaite test.

135
4.5.1.1. Literacy
As shown in Table 4.11 below, there is a difference in the paths between the two groups
(Literacy and Illiteracy). However, these differences cannot be the source of any statistical
significance.
Table 4.11 Paths coefficient for Literacy and Illiteracy 26
The Welch-Satterthwaite Test was run and the results are reported in Table 4.12.
Table 4.12. Welch-Satterthwaite Test 27
Path Coefficients-diff
( Literacy - Illiteracy )
p-Value
(Literacy vs Illiteracy)
Hypothesis
SI -> u_i_aif 0.046 0.722
cost -> u_i_aif 0.018 0.949
cp -> u_i_aif 0.245 0.684
iq -> u_i_aif 0.422 0.530 H7b
ob -> u_i_aif 0.146 0.802 H4a
ra -> u_i_aif 0.377 0.556
simp -> u_i_aif 0.007 0.970 H3b
The Welch-Satterthwaite supported the hypothesis H3b. Thus, the conclusion was that
hypothesis H3b is supported. However, H4a and H7b were not supported as their respective
p-value showed in Table 4.12 was neither below 0.05 nor above 0.950 as recommended
Path
Coefficients
Original
(Illiteracy)
Path
Coefficients
Original
(Literacy)
t-Values
(Illiteracy)
t-Values
(Literacy)
p-Values
(Illiteracy)
p-Values
(Literacy)
SI -> u_i_aif 0.024 -0.022 0.204 0.399 0.838 0.690
cost -> u_i_aif 0.238 0.220 0.858 2.998 0.391 0.003
cp -> u_i_aif -0.074 0.172 0.123 2.157 0.902 0.031
iq -> u_i_aif 0.554 0.132 0.825 1.867 0.410 0.063
ob -> u_i_aif 0.401 0.255 0.689 3.462 0.491 0.001
ra -> u_i_aif -0.235 0.142 0.368 1.709 0.713 0.088
simp -> u_i_aif 0.108 0.115 0.554 2.790 0.580 0.005
u_i_aif ->
Increased
adoption
0.900 0.814 25.102 26.489 0.000 0.000

136
(Garson, 2016). In addition, the p-value (0.949) of Literacy on the positive effect of Lower Cost
on Use of ICT on agricultural input information is close enough to the recommended value of
0.950.
H3b. Literacy moderates the positive effect of Simplicity on Use of ICT on agricultural input
information (supported).
H4a. Literacy moderates the positive effect of Observability on Use of ICT on agricultural input
information (rejected)
H7b. Literacy moderates the positive effect of Information Quality on Use of ICT on agricultural
input information (rejected).
The Welch-Satterthwaite Test reveals a new moderating effect.
H6b. Literacy moderates the positive effect of Lower Cost on Use of ICT on agricultural input
information.
The transaction cost (such as airtime or communication time) is less for a literate farmer
than for an illiterate one.
4.5.1.2. ICT Skills
Table 4.13 shows that there is a difference between the paths of these two groups.
Table 4.13. Paths Coefficient for ICT Skills 28
Path
Coefficients
(SKILLED)
Path
Coefficient
s
(UNSKILLE
D)
t-Values
(SKILLED)
t-Values
(UNSKILLE
D)
p-Values
(SKILLED)
p-Values
(UNSKILL
ED)
SI -> u_i_aif 0.002 0.053 0.031 1.035 0.976 0.301
cost -> u_i_aif 0.190 0.195 2.685 2.820 0.007 0.005
cp -> u_i_aif 0.149 0.163 1.834 2.195 0.067 0.028
iq -> u_i_aif 0.188 0.168 2.775 2.483 0.006 0.013
ob -> u_i_aif 0.275 0.269 3.715 3.662 0.000 0.000
ra -> u_i_aif 0.109 0.115 1.390 1.500 0.165 0.134
simp -> u_i_aif 0.121 0.114 3.173 3.040 0.002 0.002
u_i_aif ->
Increased
adoption
0.826 0.827 29.596 31.173 0.000 0.000
However, the aforementioned should be tested using Welch-Satterthwaite to see which
factor is significantly moderating the effects. The results of that test is reported in Table 4.14

137
Table 4.14. Welch-Satterthwaite Test 29
Path Coefficients-diff
( UNSKILLED - SKILLED )
p-Value
(UNSKILLED vs SKILLED)
Hypothesis
SI -> u_i_aif 0.052 0.477
cost -> u_i_aif 0.006 0.954
cp -> u_i_aif 0.014 0.899
iq -> u_i_aif 0.020 0.832 H7a
ob -> u_i_aif 0.006 0.957
ra -> u_i_aif 0.006 0.959
simp -> u_i_aif 0.007 0.893 H3a
As shown in Table 4.14, the Welch-Satterthwaite failed to support the hypotheses H7a and
H3a. Thus, this study rejected these hypotheses. However, the Welch-Satterthwaite showed
in Table 4.14 that the p-values of the Cost, Observability and Relative Advantage are greater
than 0.95. In other words, the ICT SKILLS moderated the effect of these constructs on the use
of ICT.
H3a: ICT Skills moderates the positive effect of simplicity on use of ICT on agricultural input
information (rejected).
H7a: ICT Skills moderates the positive effect of information quality on use of ICT on agricultural
input information (rejected).
The new findings are as follows:
H6a: ICT Skills moderates the positive effect of Cost on the Use of ICT on agricultural input
information. The transaction cost (such as airtime, communication time) is less for a farmer
who has more ICT skills than that who is lacking ICT Skills.
H4a: ICT Skill moderates the positive effect of Observability on the Use of ICT on agricultural
input information.
The results of the use of ICT on agricultural input information are more visible, that is, can be
more easily described by/to a farmer with more ICT Skills by/to one with fewer ICT Skills.
H1a: ICT Skills moderates the positive effect of Relative Advantage on the Use of ICT on
agricultural input information.
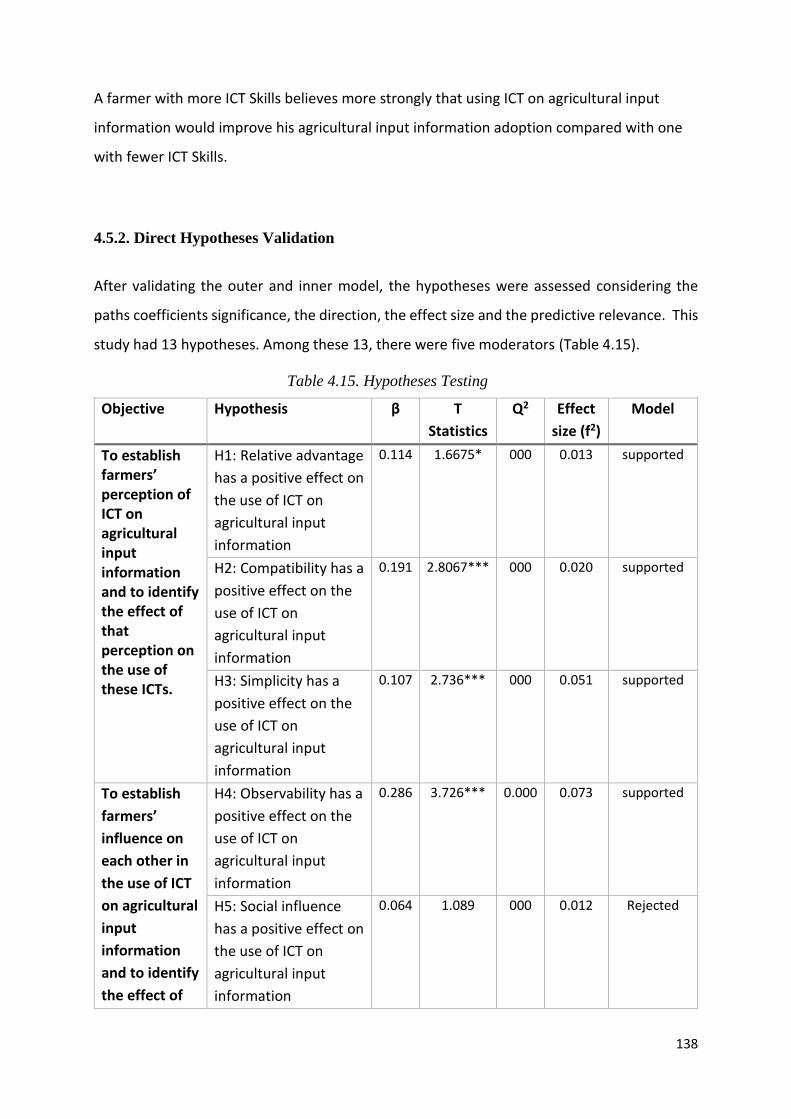
138
A farmer with more ICT Skills believes more strongly that using ICT on agricultural input
information would improve his agricultural input information adoption compared with one
with fewer ICT Skills.
4.5.2. Direct Hypotheses Validation
After validating the outer and inner model, the hypotheses were assessed considering the
paths coefficients significance, the direction, the effect size and the predictive relevance. This
study had 13 hypotheses. Among these 13, there were five moderators (Table 4.15).
Table 4.15. Hypotheses Testing 30
Objective Hypothesis β T
Statistics
Q2 Effect
size (f2)
Model
To establish farmers’ perception of ICT on agricultural input information and to identify the effect of that perception on the use of these ICTs.
H1: Relative advantage
has a positive effect on
the use of ICT on
agricultural input
information
0.114 1.6675* 000 0.013 supported
H2: Compatibility has a
positive effect on the
use of ICT on
agricultural input
information
0.191 2.8067*** 000 0.020 supported
H3: Simplicity has a
positive effect on the
use of ICT on
agricultural input
information
0.107 2.736*** 000 0.051 supported
To establish
farmers’
influence on
each other in
the use of ICT
on agricultural
input
information
and to identify
the effect of
H4: Observability has a
positive effect on the
use of ICT on
agricultural input
information
0.286 3.726*** 0.000 0.073 supported
H5: Social influence
has a positive effect on
the use of ICT on
agricultural input
information
0.064 1.089 000 0.012 Rejected

139
that influence
on the use of
these ICTs
To establish
the challenges
faced by
farmers in the
use of ICT on
agricultural
input
information
and to identify
the effects of
these
challenges in
the use of ICT
on agricultural
input
information
H6: Cost has a positive
effect on the use of ICT
on agricultural input
information.
0.132 2.299** 000 0.058 supported
H7: Information
Quality has a positive
effect on the use of ICT
on agricultural input
information
0.190 3.068*** 000 0.036 supported
To propose an ICT model for increased adoption of agricultural input information in developing countries using the case of Sikasso in Mali.
H8: Use of ICT on
agricultural input
information has a
positive effect on an
Increased Adoption of
agricultural input
information.
0.827 33.590*** 0.504 2.322 supported
Note: The Critical T-values are 1.65 for a significance level of 10% (*); 1.96 for a significance level of 5% (**); and 2.58 for a significance level of 1% (***) in a two-tailed test.

140
4.5.2.1. Discussion on the Specific Objective 1
To establish farmers’ perception of ICT on agricultural input information and to identify the
effect of that perception on the use of these ICTs.
Relative Advantage
The point that H1 (RA has a positive effect on Use of ICT on agricultural input information) was
supported was consistent with the literature review. The Diffusion of Innovation Theory
(DOI/IDT) confirmed that there was a relationship between Relative advantage and Use of
innovation (ICT) (Rogers, 1995).
RA was found to be a driver in the use of eHealth innovation (Atkinson, 2007) and many other
domains such as agriculture, education and e-government (Carter and Belanger, 2004) in
developing countries. Moreover, Kapoor et al. (2013) argue that studies on mobile internet
and mobile banking services have reported a positive effect of relative advantage on
behavioural intention. The relative advantage is associated with or labelled as Performance
Expectancy in UTAUT (Ventkatesh et al., 2003) and Perceived Usefulness in TAM and varieties
(Surendran, 2012) and was found to have a positive effect on Behavioural Intention (BI) to use.
The Diffusion of Innovation Theory labels BI as Use.
The relationship is significant in the agricultural input information domain. The construct is a
driver in the use of ICT on agricultural input information. Most of the respondents of this study
expected an increase of their knowledge on access to information on inputs and the use of
that information. That key was one that helped them to start using ICT on agricultural input
information.
Compatibility
H2 (CA has a positive effect on Use of ICT on agricultural input information) was supported.
There is considerable empirical evidence to support this finding. The construct was studied
and confirmed as Facilitating conditions by Ventkatesh et al. (2003) and by Rogers (1995) for
affecting use or adoption.
141
Kapoor et al. (2013) argue that studies on a mobile network (Hsu et al., 2007), mobile internet
(Shin, 2010) and mobile ticketing services (Mallat et al., 2008) have shown that compatibility
has a strong positive influence on consumer’s use intentions. Furthermore, their study
confirmed that positive effect of Compatibility on Intention to Use the mobile phone in India,
a developing country like Mali.
The construct is a driver in the use of ICT on agricultural input information. Some beliefs played
an important role in their choice to use ICT:
These ICT services fit how they like to obtain information on agricultural inputs,
ICT services made what they were doing to appear more relevant
In addition, these ICT services help them to adopt (access and use) agricultural
input information.
Simplicity
H3 stated that SIMP has a positive effect on Use of ICT on agricultural input information. This
hypothesis was supported. There is substantial empirical evidence to support this finding. The
construct was studied and confirmed as Effort Expectancy by Ventkatesh et al. (2003);
Perceived Ease of Use by Davis (1989); and as Simplicity for affecting use or adoption by Rogers
(1995). Moreover, Kapoor et al. (2013) quoting Lu et al. (2008) studied determinants of mobile
data services in China, find that the reduced complexity associated with the use of these
services positively influenced use intentions. Reduced complexity is labelled in this study as
simplicity.
The construct is a driver in the agricultural input information domain. Some perceived beliefs
were playing an important role in the choice of the respondents to use ICT on agricultural
input information:
Easy to access and find the information that they were seeking;
Easy to understand that information;
Implementing that information was easier.

142
4.5.2.2. Discussions on the Specific Objective 2
To establish farmers’ influence on each other in the use of ICT on agricultural input
information and to identify the effect of that influence on the use of these ICTs.
Observability
H4 stated that Observability has a positive effect on Use of ICT on agricultural input
information. This hypothesis was also supported. There is substantial empirical evidence to
support the finding of this study. The construct was examined and confirmed by Rogers (1995)
as Observability for affecting use or adoption.
Vishwanath and Goldhaber (2003) in their study on technology products found that this
attribute had a significant effect on adoption intention. Arts et al. (2011) also confirmed a
similar behaviour for this attribute. Moreover, Kapoor et al. (2013) argue that Observability is
posited to influence the behavioural intentions of potential users significantly.
The construct is a driver in the agricultural input information domain. This construct has the
strongest effect on use of ICT by the respondents. The fact that the visible results achieved by
a fellow farmer using the ICT, drove them in the utilisation of this ICT. In addition, this confirms
that the interaction between the early adopters and other has the strongest effect on farmers’
use of ICT on agricultural input information. Moreover, this result confirms the finding of
Msoffe & Ngulube (2016) which concluded that most of the poultry farmers preferred
interpersonal and informal sources of information. They further argued that family, friends,
neighbours represents 67.7% of the most preferred source of information for farmers. This
finding was confirmed by Zewge and Dittrich (2017), who report that peer influence is more
significant than any other influence among farmers in developing countries.
Social Influence
H5 stated that SI has a positive effect on Use of ICT on agricultural input information. This
hypothesis was not supported. The path coefficient (0.064) was not greater than the
recommended one 0.1. In addition, the path coefficient significance failed to reach the

143
recommended value of 1.65. Therefore, this construct was removed from the model. There is
substantial empirical evidence to support this finding.
Doing a literature review on technology acceptance models entitled A critical examination of
technology acceptance literature, Li (2010) reports that only 25% of the reviewed studies
found that Social Influence predicts the Use of ICT on agricultural input information
(adoption). In the agricultural input information field, we did not encounter any study
supporting this hypothesis. There was an effect of the construct (Social Influence) on use of
ICT on agricultural input information, but the effect was not statistically significant.
4.5.2.3. Discussions on the Specific Objective 3
To establish the challenges faced by farmers in the use of ICT on agricultural input information
and to identify the effects of these challenges in the use of ICT on agricultural input
information
Cost
H6 stated that Lower Cost has a positive effect on the Use of ICT on agricultural input
information. This hypothesis was supported. There is substantial empirical evidence to
support this finding.
Lower costs are often viewed as having a positive association with the adoption of an
Innovation (Tornatzky and Klein, 1982). Thus, lower costs linked with using technology will
favour easy use (adoption). A study by Shin (2010) on a mobile virtual network found the cost
to be negatively influencing consumers’ use behaviour. In contrast, Lower Cost would be
positively affecting CTs’ use. Furthermore, Kapoor et al. (2013) argue that Reduced costs are
posited to influence behavioural intentions of potential users.
In the field of ICT tools on agricultural input information used by farmers, high cost was found
to be a barrier to the use of these ICTs. For instance, in Tanzania, a case study on agricultural
information dissemination in rural areas of developing countries found that only 9.1% of the
respondents used the mobile phone as an agricultural information source, whereas 95.5%

144
used Posters. The affordability of the source was the cause of that use for 68.2% of the
respondents and (in addition) Skill using the source (Msoffe and Ngulube, 2016). This point
implies that lower or reduced cost (affordability) would have been a driver in the use of such
ICTs.
Information Quality
H7 reported that IQ has a positive effect on Use of ICT on agricultural input information. This
hypothesis was supported. There is substantial empirical evidence to support this finding. IQ
was found to be a driver in the use of ICT by a study reviewing the factors affecting the use of
ICT on agricultural input information by farmers in developing countries (Kante, Oboko and
Chepken, 2016).
Information Quality (IQ) was found to be a major factor in the use of ICTs services (Briceño-
Garmendia and Estache, 2004) in developing countries. In addition, studying Information
system success in Malaysia, Hussein et al. (2007) argued that the Information Quality is one of
the IS dimensions of success. Moreover, using the DOI to establish the factors affecting the
adoption and usage of online services, Al-Ghaith et al. (2010) labelled Information Quality e-
service quality and found a positive effect of it on use of the service use. Therefore, the
construct plays a determinant role in the use of ICT on agricultural input information by cereal
farmers.
4.5.2.3. Discussions on the Specific Objective 4
To propose an ICT model for increased adoption of agricultural input information in
developing countries using the case of Sikasso in Mali.
Use of ICT on agricultural input information
H8 reported that Use of ICT on agricultural input information has a positive effect on increased
adoption of agricultural inputs information. There is evidence in the literature to support that.
The construct Power was extracted from the Theory of Knowledge and labelled as Increased
adoption in the context of this study. The most recent and outstanding paper that this

145
researcher can link to an Increased Adoption is hope from Heeks & Krishna (2016). They
argued that Hope might be an outcome of human behaviour. Applied to the case of this study,
increased adoption is the result of Use of ICT on agricultural input information. That point was
stated by Williams (2013), who argued that more use of ICT enhance the delivery of the
content (information) to farmers. This study confirmed that argument. The cereal farmers said
that use of ICT on agricultural input information has enhanced their adoption of Agricultural
input information.
4.5.3. Conclusion on the Hypotheses
The study’s results showed that 24.72% of the respondents (ICT services’ users) were early
adopters. These early adopters expected and experienced an increase of their knowledge
(information) on agricultural inputs and therefore an increased adoption of agricultural input
information. These ICT services met their expectations (Relative Advantage). This adopter
category is posited with the greatest degree of opinion leadership in most social systems
(Rogers, 1983). The categorisation of technology (ICT) adopters was unique to the Diffusion of
Innovation Theory. This study has tested and proved this category of the theory is valid for the
adoption of innovations.
The early adopters (users) of ICT on agricultural input information were the community elders
(chief of the villages and their committee). Other farmers (potential adopters) look to them
(early adopters) for advice and information about the ICT services. The early adopter is
considered by many as "the individual to check with" before using a new idea (Rogers, 1983).
The interaction of these early adopters and other farmers was the most significant factor
driving the other farmers in the use of ICT on agricultural input information. The results
achieved by the early ICT services on agricultural input information users and the fact that
these were visible to other farmers through an interaction was significant for non-ICT services’
users to start using it. That was the Observability as measured in this study. As members of
the community interact, they build relationships that enable them to learn from each other
(Benard, 2013). This finding and explanation were confirmed by the development of Myagro
(Ngasene) in Sikasso. Before launching its services and recruiting clients in any village, Myagro
146
deploys its agricultural technicians to explain the village cultural committee - gathered around
the village chief - and the farmers’ representative about its service packages and the
advantages of working with Myagro. Once the head of the village and its committee approve
the Myagro concepts, any person from that village may become a Myagro client (de la Rive
Box et al., 2015). ICT skilled farmers had more Observability than the unskilled one. The early
adopter is respected by his or her peers and is the embodiment of the successful use of new
ideas (Rogers, 1983). Observability was the strongest driver in the use of ICT on agricultural
input information.
Another factor driving farmers in the use of ICT on agricultural input information was the way
they perceived the quality of the information delivery. Most of them argued that ICT on
agricultural input information were conform to their social context (culture, beliefs). This
factor (Compatibility) was the second most significant driver in the model. The third most
effective driver of ICT services’ use by small-scale cereal farmers is the Information Quality.
Since farmers use information that has immediate benefits on their knowledge of agricultural
inputs, the consequence of information utilisation results in further seeking and usage
because of the realised profits. That is ‘keep using ICT on agricultural input information or start
using them’ as employed in the research instrument for this study.
In addition, farmers found it easier to access the information that they were seeking. They
even argued that they understood and implement that information easily. That point means
the ICT was easier to use for them (Simplicity). This was mostly the case with literate users
than with illiterate users.
The Cost of using ICT on agricultural input was found to have reduced. This applied to the
majority of the farmers. Nevertheless, this researcher encounter some farmers who were not
using ICT on agricultural input information because of the cost that they could not afford. The
positive relationship between the Cost of ICT services and use of ICT on agricultural input
information was found to be stronger among farmers who are ICT Skilled, as they would spend
less time searching for information than those who are ICT unskilled.

147
CHAPTER FIVE
ACHIEVEMENTS, CONCLUSION AND RECOMMENDATIONS
5.1. INTRODUCTION
This chapter concludes the study. The first section (5.2) presents a summary of the research
with a focus on the findings and linking the objectives with these findings. The chapter
continuous by introducing the contribution and implications (section 5.3) of these findings,
limitations (section 5.4) of the results of the study, conclusion (section 5.5) and
recommendations (section 5.6) of this research.
5.2. ACHIEVEMENTS
This study had identified four objectives. The broad objective was to propose an ICT for
increased adoption of agricultural input information. It was divided into four specific
objectives, and these were broken down into eight direct hypotheses and five moderating
variables. The achievements on each one of these objectives are presented below.
Objective one. To establish the farmers’ perception of ICT on agricultural input information
and to identify the effects of this perception on the use of these ICTs.
The constructs Compatibility, Relative Advantage and Simplicity were established as the
perceived factors of farmers on ICT on agricultural input information. Their construct validity
was established validating, therefore, this study’s claims (Table 4.6, 4.7 and 4.9). On their
effects, H1 (Relative Advantage has a positive effect on Use of ICT on agricultural input
information), H2 (Compatibility has a positive effect on Use of ICT on agricultural input
information) and H3 (Simplicity has a positive effect on Use of ICT on agricultural input
information) were supported (Table 4.15).
Objective two. To establish farmers’ influence on each other in the use of ICT on agricultural
input information and to identify the effects of this influence on the use of these ICTs.

148
The constructs Observability and Social influence were established as the factors that
constitute the farmers influence on each other (peer influence) in the use of ICT on agricultural
input information. Their validity was also established (Table 4.6, 4.7 and 4.9). In identifying
their effects on the use of ICT on agricultural input information, H4 (Observability has a
positive effect on Use of ICT on agricultural input information) was supported, and H5 (Social
Influence has a positive effect on Use of ICT on agricultural input information) was rejected
(Table 4.15).
Objective three. To establish the challenges faced by farmers in the use of ICT on agricultural
inputs information and to identify the effects of these challenges in the use of these ICTs. The
constructs Information Quality and Cost were established as other factors challenging the use
of ICT on agricultural input information (Table 4.6, 4.7 and 4.9). In addition, the Literacy and
the ICT Skills were found to be also challenging as moderators. In identifying their effects, H3b,
H6 (Cost has a positive effect on Use of ICT on agricultural input information) and H7
(Information Quality has a positive effect on Use of ICT on agricultural input information) were
supported (Table 4.15). However, H3a (ICT Skills moderates the positive effect of Observability
on Use of ICT on agricultural input information), H4a (Literacy moderates the positive effect
of Observability on Use of ICT on agricultural input information), H7b (Literacy moderates the
positive effect of Information Quality on Use of ICT on agricultural input information) and H7a
(ICT Skills moderates the positive effect of Observability on Use of ICT on agricultural input
information) were rejected as moderators. The data of this study revealed unexpected
hypotheses in this objective. They were discussed in section 4.5.1. of moderating variables
validation. These new hypotheses were:
H1a. ICT Skills moderates the positive effect of Relative Advantage on Use of ICT on agricultural
input information.
H4a. ICT Skills moderates the positive effect of Observability on Use of ICT on agricultural input
information.
H6a. ICT Skills moderates the positive effect of Cost on Use of ICT on agricultural input
information.
H6b. Literacy moderates the positive effect of Cost on Use of ICT on agricultural input
information.

149
Objective four. To propose an ICT model for increased adoption of agricultural input
information in developing countries using the case of Sikasso in Mali. The development of the
study’s model was achieved through the establishment of the measurement model. We
established that Relative Advantage, Compatibility, Simplicity, Observability, Information
Quality and Cost explained 80.7% of the variance in Use of ICT on agricultural input
information. In addition, the latent variable Use of ICT on agricultural input information
explained 68.4% the variance of Increased Adoption of information on agricultural input
information.
Regarding prediction, the latent variables were predictive of the first endogenous variable Use
of ICT on agricultural input information 55.5%, and the Use of ICT on agricultural input
information was predictive of the Increased Adoption 50.4%.
5.3. CONTRIBUTION AND IMPLICATIONS
This research made it clear that use of ICT on agricultural input information by small-scale
cereal farmers in Mali and developing countries are subject to a particular model that was not
provided by the technology acceptance models. The study has made Theoretical,
Methodological and Practical and Managerial Contribution.
5.3.1. Theoretical Contribution
The technology acceptance models provided a basis for understanding relationships between
constructs and use of technology. The UTAUT, TAM and DOI that are the three most used and
applied technology acceptance models provided some constructs to understand the use of
technology by the farmers in the agricultural context. These models have been implemented
in a different context but barely in the agricultural input information context. In addition, they
have rarely been applied to small-scale cereal producers that dominate the agricultural
activities in developing countries. It identified in the literature review eight theory application
void gaps. This undertaken study has addressed these deficiencies in the cereal production
context. For instance, Adegbidi et al. (2012) did not present their study’s result according to

150
their framework (Diffusion of Innovation Theory). This researcher has been successful in
addressing the gap in the context of use of ICT on agricultural input information by presenting
the results of this undertaken study according to the Diffusion of Innovation Theory.
Moreover, it has met all the requirements of the diffusion of innovation theory and went
beyond by linking technology’ use and increased adoption. Another theoretical gap that was
successfully addressed in the current context is the knowledge void research gap. An example
of that gap is that from the paper of Amin and Li (2014), where the desired research hypothesis
(Relative advantage has a positive effect on intention to use ICT) was not supported by the
study’s results in Bangladesh. In the case of this research, the Relative advantage has a positive
effect on the use of ICT. A contradictory evidence (Müller-Bloch and Kranz, 2015) research gap
emerged from the study of Rezaei-Moghaddam and Salehi (2010) in Iran. They found a
relationship between Observability and Ease of Use, Observability and Perceived Usefulness.
Up to date, no other study has confirmed these findings to the knowledge of this researcher.
This undertaken study did not find any evidence supporting these findings in Iran. Thus, this
study was successful in addressing that gap in the context of use of ICT on agricultural input
information.
A literature conducted over the last fifteen years showed that the DOI was the most
technology acceptance models that could be applied in the agricultural input information
context. However, the DOI had to be contextualised and extended to some construct that was
lacking. To the knowledge of this researcher, it is the first time that the DOI is applied in the
agricultural input information sector and extended. Hence, the results and conclusions from
this study should succeed in providing the researchers with the first insights into the behaviour
of Rogers’ innovation attributes, cost and information quality on the use of ICT on agricultural
input information. This study was successful in addressing the theory application void gap in
the context of use of ICT on agricultural input information.
The final revised model indicates that the technology acceptance models, which are
developed and tested in developed countries, cannot be applied in developing countries
without contextualisation. Though all the constructs of the original DOI were included in the
final revised model except trialability, it was apparent that the strength of contribution of
these factors was contrary to what was found in the original DOI when the model was tested

151
in different contexts. Particularly, the most predictive factor for use of ICT on agricultural input
information was found to be the Observability. This was another theoretical contribution of
this study.
The relationship between use of ICT and contribution of ICT through an increased adoption of
the content (agricultural input information) was not stated in the DOI. This study went beyond
the traditional technology acceptance models to extract the construct Increased Adoption
from the theory of Knowledge from Foucault ( 1977). A Conceptual framework was proposed
and validated. To the researcher’s knowledge, this is the first time that a relationship has been
established between use of ICT (Behavioral Intention) and an increased adoption of the
content (information) in the ICT4D field. Moreover, it is the first time in the agricultural input
information context. Little research has been done on this relationship, and this study has
successfully addressed that gap in the context of use of ICT on agricultural input information.
Another contribution is the proposed constructs Cost and information Quality as influencing
the use of ICT on agricultural input information. The Cost has been suggested in the revised
UTAUT 2 as affecting behavioural intention. To the researcher knowledge again, this the first
time that Cost has been established as positively affecting the use of ICT in developing
countries in the cereal production context. That was supported the literature as we did not
encounter any model in this context that has studied the Cost. This was the filling of the
research gaps knowledge void and evaluation void. The cost was not studied very well in the
context of cereal farmers’ adoption of technology. Rather, it was examined in the context of
‘impact’ of technology. In this aim, it has emerged as an outcome of technology and not as an
input for technology acceptance. This study was successful in addressing that knowledge void
gap in the context of use ICT on agricultural input information. The evaluation void gap was
highlighted in almost all the reviewed studies in the research gap section (section 2.6.1). This
researcher confirms the results of these studies and goes beyond by presenting the
significance of cost (lower cost) on use of ICT. In addition, the moderators Literacy and ICT
Skills are other contribution made by this study. They were found to be moderating the
positive effect of Lower Cost on Use of ICT on agricultural input information.

152
The study offers suggestive evidence that Social Influence is not a construct affecting the use
of ICT on agricultural input information by small-scale farmers in developing. This confirmed
the results of a study by Adegbidi et al. (2012) in Benin in the same context on rice producer
in 2012. The final revised model is illustrated below in Figure 5.1
In addition, another contribution was the development or adaptation of new indicators to
measure the construct used in this study. The development of these news items was based on
the literature review on the subject, and they passed the reliability and validity test. Therefore,
they can be applied in similar context.
Figure 5.1 Final Revised Model for use of ICT on agricultural input information 17

153
The translation of the items from English to French and Nko (Bambara) constitutes another
contribution. The data collection instrument (questionnaire) of these models are in English.
For other speaking languages especially French and Bambara7, these instruments need to be
translated. The increasing need for non-English language data collection tools and other
survey materials is evident given recent figures (Pan and de la Puente, 2005). The researcher
developed a method for translating an English survey instrument on ICT on agricultural input
information into French and Bambara (NKO). We believe that the developed methods for
translating an English survey instrument on ICT on agricultural input information into French
and Bambara formed an effective translation. This method was different to the method of
another research (Forsyth et al., 2006b). We have improved the guidelines of the Census
Bureau Guidelines (Pan and de la Puente, 2005) by integrating into it the method ASQ (Ask the
Same Question (Harkness, 2000) and the TRAPD (Translation, Review, Adjudication, Pre-
testing and Documentation) method (Harkness, 2000). This translated instrument in NKO
(Bambara) is one of the rarely translated survey instrument on ICT on agricultural input
information. These translated items also passed the reliability and validity test and hence can
be applied in similar context. That translation successfully addressed in the context of ICT on
agricultural input information a methodological conflict gap from the literature.
5.3.2. Methodological Contribution
The methodology used in this study gives guidelines for researchers interested in the same
area or connected.
The method that was used to translate the research instrument from English into French and
Bambara was a contribution. This researcher assessed the translation methods that were
available and come up with a method for translating. That is the first time to this researcher’s
knowledge that a translation method has been proposed in the context of technology
adoption in developing countries. Moreover, the writing system of Bambara (NKo) is different
to the Latin alphabet writing system. We have brought new knowledge (terms) to the language
7 Bambara is a language spoken in Mali.

154
(Bambara), which is also to the awareness of this researcher, the first time. Thus, the study
has successfully filled a methodological conflict gap in the context of ICT on agricultural input
information.
The literature review done using the grounded theory gives a view of how it should be
conducted in the context of ICT4D. Using the analysis of the qualitative data of the literature
to find out the gap according to the Grounded Theory, assures solid legitimised, in-depth
analyses of the empirical facts and related insights. This includes the emergence of new
themes (factors or constructs), issues (barriers) and opportunities (drivers); interrelationships
and dependencies in or beyond a particular area (area of ICT on agricultural input
information); as well as inconsistencies.
The identification of research gaps of this study is another contribution. Finding a consistent
gap is always an issue. After systematically identifying the factors affecting use ICT on
agricultural input information, there was a need to look for research gaps in this literature. A
research gap arises when there is a gap in sets of information that is derived from a literature
synthesis and requires further research to be resolved (Müller-Bloch and Kranz, 2015). This
study analyses the literature according to that framework and comes up with 54 research
gaps. The main contribution of this study is that it goes beyond the framework of Müller-Bloch
and Kranz (2015). Their framework guides research gaps, while this study’s framework guides
systematic literature review and research gaps. Hence, we have addressed a methodological
conflict gap in this case in the context of use of ICT on agricultural input information.
The validation through a pretest and pilot study of this study is another method that can be
used in such context. The pre-test validated the research instrument completeness (content
validity). The pilot-study validated the model and the survey instrument for the next phase of
the study (main study).
The analysis of the data using PLS-SEM offers a guide that can be implemented. Most of the
studies in IS applied the guidelines of another field such as Marketing or Management. In
addition, the literature did not state clearly how PLS-SEM should be used in the case of
exploratory or explanatory study. This researcher provides a guide for an exploratory study in
155
the field of Information System such as ICT4D, taking into accounts the interpretability of PLS-
SEM (explanatory). This guideline shows that PLS is in the ground middle of exploratory
(predictive) and explanatory (confirmatory). Hence, PLS aims to maintain interpretability while
engaging in predictive modelling. To the researcher knowledge, this is the first time that such
contribution has been made.
In addition, the way this study established the constructs’ validity is a contribution. Most of
the research in the developing countries context using PLS-SEM establishes their discriminant
validity through the Fornell-Larcker criterion and/or cross-loadings criterion. There is empirical
evidence that while the use of these criteria is acceptable but they are not without biases.
Many researchers recommend the use of the Heterotrait-Monotrait Ratio (HTMT) criterion.
This study offers guidelines on how to use it in information systems research. Moreover, it
provides the results of these criteria that could be utilised as a guideline too. The use of the
Multigroup Analysis to assess the moderating effect is another contribution. This technique is
consistently taking over in the assessment of the moderating effect. Moreover, in the current
case, it revealed new findings that would not be possible without its use.
This research addressed some of the critics of PLS utilisation in an exploratory (predictive)
study. It provides an updated guideline for the use of PLS in IS research for the exploratory
study. This guidance document, to this researcher’s knowledge, is the first combining model
validity and model fitness. In doing so, the study has successfully filled a methodological
conflict gap in this case in the context of use of ICT on agricultural input information.
5.3.3. Practical and Managerial Contribution
This study was exploratory (predictive). A predictive model may be easier to accept by decision
makers and other stakeholders when it can be plausibly interpreted. Further, it may be simpler
to determine the prediction boundaries, i.e. determine under what situations the model will
hold and under what situations the model will break when a plausible substantive
interpretation is available. Users of predictive models have more trust in its results, especially
for unexpected or counterintuitive predictions, when there is a plausible interpretation
possible.

156
Beyond researchers, the findings of this study have major practical significance. It proved that
the deployment of an ICT service towards farmers because of the demand is not an acceptable
standard. The drivers of the use of the technology should be understood before. The model
provided helps to inform on which factors affect the use of technology. Moreover, the model
gives the relative significance of each construct.
It is important for the managers to consider the constructs and moderators established in this
study for deployment of their ICT services towards farmers.
5.4. STUDY LIMITATIONS
It should be borne in mind that this study has some limitations namely:
There was no similar survey instrument translated in Bambara, which was the language of
the most of the respondent in this study’s area. This study uses a method to translate the
instrument. However, it does suggest a direction for further investigation of this
instrument.
Some of the respondents could not fill the form, and they were helped to do so. That could
be a question mark on the quality of the data. However, Bowling (2005) concluded that
the legitimacy of a study is difficult to establish with some methods than others. In
addition, three research assistants were formed on how to choose verbal descriptors as
label according to Villar (2009). Moreover, the supervisor visited the field and could see
how the farmers who could not fill were helped to do so.
Broad application of the results
This study was conducted in the district of Bougouni in the region of Sikasso in Mali in a
specific domain of ICT on agricultural input information. The users of Bougouni, Sikasso
may have different characteristics from other regions or countries. Therefore, it is not
certain that the findings of this study could be applied broadly.
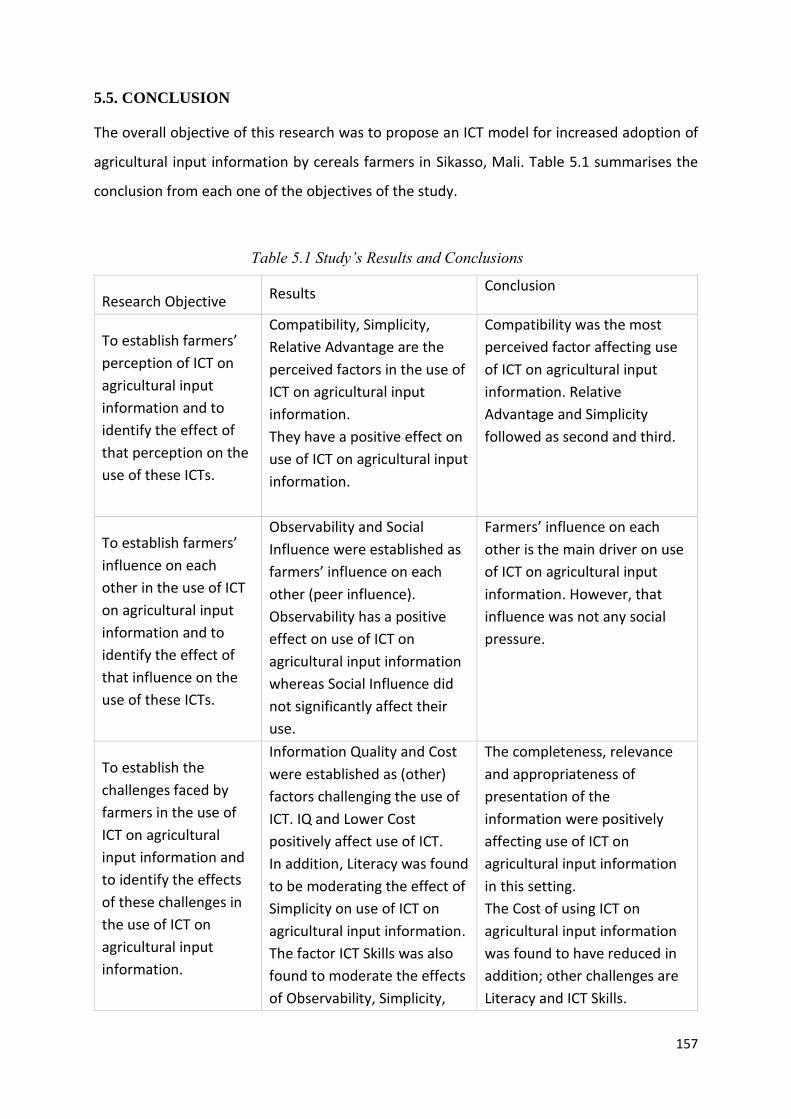
157
5.5. CONCLUSION
The overall objective of this research was to propose an ICT model for increased adoption of
agricultural input information by cereals farmers in Sikasso, Mali. Table 5.1 summarises the
conclusion from each one of the objectives of the study.
Table 5.1 Study’s Results and Conclusions 31
Research Objective Results Conclusion
To establish farmers’
perception of ICT on
agricultural input
information and to
identify the effect of
that perception on the
use of these ICTs.
Compatibility, Simplicity,
Relative Advantage are the
perceived factors in the use of
ICT on agricultural input
information.
They have a positive effect on
use of ICT on agricultural input
information.
Compatibility was the most
perceived factor affecting use
of ICT on agricultural input
information. Relative
Advantage and Simplicity
followed as second and third.
To establish farmers’
influence on each
other in the use of ICT
on agricultural input
information and to
identify the effect of
that influence on the
use of these ICTs.
Observability and Social
Influence were established as
farmers’ influence on each
other (peer influence).
Observability has a positive
effect on use of ICT on
agricultural input information
whereas Social Influence did
not significantly affect their
use.
Farmers’ influence on each
other is the main driver on use
of ICT on agricultural input
information. However, that
influence was not any social
pressure.
To establish the
challenges faced by
farmers in the use of
ICT on agricultural
input information and
to identify the effects
of these challenges in
the use of ICT on
agricultural input
information.
Information Quality and Cost
were established as (other)
factors challenging the use of
ICT. IQ and Lower Cost
positively affect use of ICT.
In addition, Literacy was found
to be moderating the effect of
Simplicity on use of ICT on
agricultural input information.
The factor ICT Skills was also
found to moderate the effects
of Observability, Simplicity,
The completeness, relevance
and appropriateness of
presentation of the
information were positively
affecting use of ICT on
agricultural input information
in this setting.
The Cost of using ICT on
agricultural input information
was found to have reduced in
addition; other challenges are
Literacy and ICT Skills.

158
Relative advantage and Cost
on use of ICT in this context.
Literacy moderated the
positive effect of Simplicity on
Use of ICT on agricultural input
information.
An ICT skilled farmer was able
to access/use the information
he/she was seeking better than
was an unskilled farmer, thus,
making ICT skills a moderator
on the effect of cost on use of
ICT on agricultural input
information.
ICT Skills also moderated the
effects of Simplicity,
Observability, and Relative
advantage on Use of ICT on
agricultural input information.
To propose an ICT
model for increased
adoption of
agricultural input
information in
developing countries
using a case in Sikasso,
Mali.
A model of 8 latent variables
and 5 moderating effects was
proposed for small-scale
cereal farmers.
A model for cereal farmers in a
developing country was
proposed for the first time to
the knowledge of this
researcher.
The two aspects (prediction
and interpretability) of PLS
were reported and achieved.
The latent variables predict the
use of ICT by 55.5%. Use
predicts the increased
adoption by 50.4%.
The model explains Use of ICT
80.7% and Increased adoption
68.4%.
In the model, the farmers’
influence on each other has the
strongest effect on use of ICT
on agricultural input
information, followed by their
perceived compatibility and
Information Quality.

159
5.6. RECOMMENDATIONS
This research has proposed an ICT model for increased adoption of agricultural input
information in developing countries using the case of Sikasso in Mali by small-scale cereal
farmers, although some orientations need further investigation. The study has proposed
theoretical, methodological, practical and managerial and policy recommendation.
5.6.1. Theoretical Recommendations
This proposed model can be applied in another developing country for other crops. However,
it might be advantageous for another study to test it. In such way, other factors could be
found. This study used cereals like millet, sorghum, rice and fonio. Other cereals crops could
be tested using the model.
The second aspect that might be further investigated is the social influence. The culture of
developing countries may differ from each other. Other items could also be integrated into
the measure of the construct, which was not applied in this study. That is an evaluation void
and a knowledge void research gaps that need to be filled by future research.
Finally, an orientation that might be taken by further research is to apply another time horizon
such as the longitudinal. This study used the cross-sectional as time horizon to explain how
factors are related. The main strength of longitudinal research is the capacity that it has to
study change and development. Adams and Schvaneveldt (1991) point out that in observing
people or events over time, the researcher can exercise a measure of control over variables
being studied, provided that they are not affected by the research process itself (Saunders,
Lewis and Thornhill, 2009).

160
5.6.2. Methodological Recommendations
This study has provided a method for translating into French and Bambara (Nko). The method
can be used for other languages. However, it might interest to take into account some cultural
viewpoints of other local languages mainly African. Therefore, this researcher recommends
future researchers to fill that evaluation void research gap.
Another recommendation is to test the updated guidelines of the use of PLS-SEM in an
exploratory setting in Information System research. The use of PLS-SEM is increasing among
IS researchers. However, the literature reports that how to use PLS-SEM and how to report
the results is problematic. This research has brought a new guideline by extracting some
criteria from explanatory studies. Nevertheless, it will be useful to assess this guideline and
come up with other criteria or confirm the usefulness of this guideline. That another
evaluation void research gap that needs to be filled by future inquiries.
5.6.3. Practical and Managerial Recommendation
The study has provided a model that needs to be taken into account by ICT services’ designers.
It recommends the integration of more social interaction with the farmers in the context of
cereal production. The factor Observability that came up as the strongest in the model as
affecting use of ICT on agricultural input information points to that direction.
5.6.4. Policy Recommendation
The proposed model can be used by government policymakers on ICT on agricultural services
in developing countries to implement policies that speed up the use of ICT on agricultural input
information. For instance, the Lower Cost has a significant effect on the use of ICT on
agricultural input information and put into place an environment that will allow the ICT
services designers to offer their services cheaper that will result in more use of these ICTs.
That, in turn, will result in an increased adoption of agricultural input information and
therefore more use of farm inputs. That is the one the basis for more agricultural productivity
for better food security level.
161
REFERENCES Adegbidi, A. et al. (2012) ‘Determinants of ICT use by rice farmers in Benin : from the
perception of ICT characteristics to the adoption of the technology’, Journal of Research in International Business and Management, 2(11), pp. 273–284.
Advameg (2016) Culture of Mali - history, people, traditions, women, beliefs, food, customs,
family, social, everyculture.com. Available at: http://www.everyculture.com/Ja-Ma/Mali.html (Accessed: 6 April 2016).
AGRA (2014) Improving fertilizer supplies for African farmers. Nairobi. Available at:
http://iirr.org/wp-content/uploads/2015/09/Fertilizer-supply_print-1.pdf. Aguirre-urreta, M. I. and Marakas, G. M. (2012) ‘REVISITING BIAS DUE TO CONSTRUCT
MISSPECIFICATION: DIFFERENT RESULTS FROM CONSIDERING COEFFICIENTS IN STANDARDIZED FORM’, MIS Quarterly, 36(1), pp. 123–138.
Aker, J. C. (2008) ‘Does Digital Divide or Provide? The Impact of Cell Phones on Grain Markets
in Niger’, Center for Global Development Working Paper, (February), p. 61. doi: 10.2139/ssrn.1093374.
Aker, J. C. (2011) ‘Dial “ A ” for Agriculture : Using Information and Communication
Technologies for Agricultural Extension in Developing Countries’, Agricultural Economics, 42(6), pp. 631–647. doi: 10.1111/j.1574-0862.2011.00545.x.
Aker, J. C., Ghosh, I. and Burrell, J. (2016) ‘The promise (and pitfalls) of ICT for agriculture
initiatives’, Agricultural Economics (United Kingdom), 47, pp. 35–48. doi: 10.1111/agec.12301.
Al-Ghaith, W., Sanzogni, L. and Sandhu, K. (2010) ‘Factors Influencing the Adoption and
Usage of Online Services in Saudi Arabia’, Electronic Journal of Information Systems in Developing Countries, 40(1), pp. 1–32.
Aleke, B., Egwu, P. and N, E. P. (2015) ‘Strategic Women Empowerment through ICT
Innovation Adoption : Case of Smallholder Rice Farmers in Nigeria Strategic Women Empowerment through ICT Innovation Adoption : Case of Smallholder Rice Farmers in Nigeria’, in Systems, U. A. for I. (ed.) UK Academy for Information Systems Conference Proceedings. Oxford: AIS Electronic Library (AISeL). Available at: http://aisel.aisnet.org/ukais2015/29.
Amin, M. K. and Li, J. (2014) ‘Applying Farmer Technology Acceptance Model to Understand
Farmer’s Behavior Intention to use ICT based Microfinance Platform: A Comparative Analysis between Bangladesh and China’, in WHICEB2013 (ed.) Fact Reports. wuhan: AIS Electronic Library (AISeL), pp. 0–8. doi: 10.13140/RG.2.1.3832.9363.
Angelucci, F. et al. (2013) Monitoring and analysing food and agricultural policies in Africa
MAFAP Synthesis Report Series. Aparisi, A. M. (FAO) and Balie, J. (FAO) (2013) Review of Food and Agricultural Policies Mali

162
2005-2011. Rome. Asyraf Afthanorhan, Nazim, A. and Ahmad, S. (2014) ‘A Parametric Approach To Partial Least
Square Structural Equation Modeling of Multigroup Analysis (PLS-MGA)’, International Journal of Economics, Commerce and Management United Kingdom, II(10), pp. 1–15. doi: 10.9734/BJAST/2015/14380.
Atajeromavwo, E. J. et al. (2010) ‘An Evaluation of the Relevance of Information and
Communication Technologies (ICT) to Agricultural and Rural Development in Niger Delta of Nigeria’, African Research Review, 4(1), pp. 401–414.
Atkinson, N. L. (2007) ‘Developing a questionnaire to measure perceived attributes of
eHealth innovations’, American Journal of Health Behavior, 31, pp. 612–621. doi: 10.5993/AJHB.31.6.6.
Bagozzi, R. P. (2007) ‘The Legacy of the Technology Acceptance Model and a Proposal for a
Paradigm Shift .’, Journal of the Association for Information Systems, 8(4), pp. 244–254. Bakkabulindi, F. E. K. (2012) ‘Does Use of ICT Relate with the way it is Perceived ? Evidence
from Makere University’, International Journal of Computing and ICT Research, 6(2), pp. 75–94.
Barakabitze, A. A. et al. (2015) ‘NEW TECHNOLOGIES FOR DISSEMINATING AND
COMMUNICATING AGRICULTURE KNOWLEDGE AND INFORMATION: CHALLENGES FOR AGRICULTURAL RESEARCH INSTITUTES IN TANZANIA’, The Electronic Journal of Information Systems in Developing Countries, 70, pp. 1–22.
Barakabitze, A. A., Fue, K. G. and Sanga, C. A. (2017) ‘The Use of Participatory Approaches in
Developing ICT-based Systems for Disseminating Agricultural Knowledge and Information for Farmers in Developing Countries: The Case of Tanzania’, The Electronic Journal of Information Systems in Developing Countries, 78(8), pp. 1–23.
Baron, R. M. and Kenny, D. a. (1986) ‘The Moderator-Mediator Variable Distinction in Social
The Moderator-Mediator Variable Distinction in Social Psychological Research: Conceptual, Strategic, and Statistical Considerations’, Journal of Personality and Social Psychology, 51(6), pp. 1173–1182. doi: 10.1037/0022-3514.51.6.1173.
Bartelt, V. L. and Dennis, A. R. (2014) ‘NATURE AND NURTURE: THE IMPACT OF
AUTOMATICITY AND THE STRUCTURATION OF COMMUNICATION ON VIRTUAL TEAM BEHAVIOR AND PERFORMANCE’, MIS Quarterly, 38(2), pp. 521–538.
Batchelor, S. et al. (2014) ‘Is there a role for mobiles to support sustainable agriculture in
Africa?’, 2nd International Conference on ICT for Sustainability, (Ict4s), pp. 272–280. doi: 10.2991/ict4s-14.2014.33.
Beardon, H. et al. (2005) ICT for development : empowerment or exploitation? Learning from
the Reflect ICTs project, Human Development. London. Available at: reflect-action.org.

163
Benard, R. (2013) ‘Knowledge management & e-Learning understanding the knowledge sharing process among rural communities in Tanzania : areview of selected’, Knowledge Management & E-Learning, 5(2), pp. 205–217.
Bosch, M. et al. (2012) ‘Agriculture and ICT’, eLac, 18, pp. 1–12. Bovaird, J. a et al. (2007) ‘Missing data and standard errors with partial least squares’, 115th
Annual Meeting of the American Psychological Association, p. 1. Bowling, A. (2005) ‘Mode of questionnaire administration can have serious effects on data
quality’, Journal of public health, 27(3), pp. 281–291. doi: 10.1093/pubmed/fdi031. Briceño-Garmendia, C. and Estache, A. (2004) Infrastructure Services in Developing Countries:
Access, Quality, Costs, and Policy Reform. World Bank Publications. Available at: https://books.google.com/books?hl=en&lr=&id=TULcB1co4-cC&pgis=1 (Accessed: 4 December 2015).
Bui, Q. (2015) ‘A Review of Innovation Diffusion Theories and Mechanisms’, in Technology,
D. I. G. I. I. (ed.) DIGIT 2015 Proceedings. Paper 11. AISel, pp. 1–11. Available at: http://aisel.aisnet.org/digit2015 Recommended.
Bwalya, K. J. (2009) ‘FACTORS AFFECTING ADOPTION OF E-GOVERNMENT IN ZAMBIA’,
Electronic Journal of Information Systems in Developing Countries, 38(4), pp. 1–13. Bwalya, S., Asenso-Okyere, K. and Tefera, W. (2012) ‘Promoting ICT based agricultural
knowledge management’, in Increasing agricultural productivity and enhancing food security in Africa : New Challenges and Opportunities. Addis Ababa: UNDP, p. 39.
Carrasco, L. (2003) The American Community Survey ( ACS ) en Español : Using Cognitive
Interviews to Test the Functional Equivalency of Questionnaire Translations Lorena Carrasco ( Currently in the Decennial Management Division )* Statistical Research Division U . S . Bureau, Methodology. Washington D.C.
Carter, L. and Belanger, F. (2004) ‘Citizen adoption of electronic government initiatives’, 37th
Annual Hawaii International Conference on System Sciences, 2004. Proceedings of the, 0(C), p. 10 pp. doi: 10.1109/HICSS.2004.1265306.
Carter, R. L. (2006) ‘Solutions for Missing Data in Structural Equation Modeling’, Research
and Practice Assessment, 1(1), pp. 1–6. Chilimo, W. L. and Sanga, C. (2006) ‘TOWARDS EFFECTIVE KNOWLEDGE MANAGEMENT
PRACTICES FOR AGRICULTURAL INFORMATION SPECIALISTS IN TANZANIA’, in EASTERN, X. S. C. O., & C. & S. A. L., and ASSOCIATIONS, I. (eds) Librarianship as a Bridge to an Information and Knowledge Society in Eastern, Central and Southern Africa. Dar es Salam, pp. 124–140.
Chin, T. Y. (2006) ‘Mediator and Moderator Variables in Social Science Research’. Nebraska,
USA, pp. 1–29. Available at:

164
http://www.cyfs.unl.edu/docs/CenterScope/ResearchMethodologySeries/Chin.pdf. Chung, Y. S. (2015) Case study : Tigo Kilimo, Tanzania, GSMA. Edited by PUBmed. London.
doi: 10.1016/S1360-8592(98)80013-2. Churi, A. J. et al. (2012) ‘Understanding Farmers Information Communication Strategies for
Managing Climate Risks in Rural Semi-Arid Areas , Tanzania Description of the Study Area’, International journal of information and commication technology research, 2(11), pp. 838–845.
CICC (2003) ‘Success and Future Prospects of “Initiative for Multimedia Information
Technology Toward 21’, in, pp. 1–6. Cox, A. J. and Sseguya, H. (2016) ‘ICT supported extension services in conservation
agriculture information access for small holder farmers in Laikipia County, Kenya’, in International Symposium on Technology and Society,. doi: 10.1109/ISTAS.2015.7439408.
Csa (2007) ‘Commissariat à la Sécurité Un Peuple – Un But – Une Foi REGION DE SIKASSO
Synthèse régionale I . Introduction’. Bamako: Commissariat a la Securite Alimentaire, p. 19.
Dandedjrohoun, L., Diagne, a and Biaou, G. (2012) ‘Determinants of diffusion and adoption
of improved technology for rice parboiling in Benin’, Review of Agricultural and Environmental Studies, 93(2), pp. 171–191. Available at: http://www.raestud.eu/pdf/171-191-ncho.pdf.
Dangi, N. and Singh, H. (2010) ‘e-Choupal : Hope or Hype ? Neeraj Dangi and Harjit Singh
Department of Management , Institute of Management Education , Sahibabad ( Ghaziabad ), India’, American Journal of Economics and Business Administration, 2(2), pp. 179–184.
Davydov, A. (2005) On Souleymane Kanté ’ s ‘ Nko Grammar ’. Saint Petersbourg. Available
at: http://mandelang.kunstkamera.ru/files/mandelang/davydov.pdf. Dey, B. L., Prendergast, R. and Newman, D. (2008) ‘How can ICTs be used and appropriated
to address agricultural information needs of Bangladeshi farmers?’, in GlobDev (ed.) Proceedings Annual Workshop of the AIS Special Interest Group for ICT in Global Development. Paris: AIS Electronic Library (AISeL). Available at: http://aisel.aisnet.org/globdev2008%5Cnhttp://aisel.aisnet.org/globdev2008/21.
Diallo, M. (2013) ‘Deficit des politiques d’Interconnexion, cas du Mali’, in Forum Africain sur
les Points d’echange internet 2-5 septembre 2013. Casanblanca. Dissanayeke, U. (2014) ‘Mobile Based Information Communication Interactions Among
Major agriculture Stakeholders : Sri lankan Experience’, Electronic Journal of Information Systems in Developing Countries, 60(1), pp. 1–12.

165
Doss, D. C. (2006) ‘Analysing technology adoption: Challenges and limitations of micro-studies.’, Agricultural Economics, 34, pp. 207–219.
DRPSIAP (2011) RAPPORT DE L ’ ENQUETE SUR LA RECONNAISSANCE RAPIDE DES AXES ET
CIRCUITS DE COMMERCIALISATION DES CEREALES DANS LA REGION DE SIKASSO. Sikasso. Available at: fsg.afre.msu.edu/promisam_2/reconnaissance_bassin_Sikasso.pdf.
Evermann, J. and Tate, M. (2010) ‘Testing Models or Fitting Models? Identifying Model Misspecification in PLS’, in 2010, I. (ed.) Thirty First International Conference on Information Systems (Icis). St. Louis: AIS, p. Paper 21.
Evermann, J. and Tate, M. (2012) ‘COMPARING THE PREDICTIVE ABILITY OF PLS AND
COVARIANCE MODELS’, in Proceedings of the 33rd International Conference on Information Systems (ICIS). Orlando, pp. 546–550.
Evermann, J. and Tate, M. (2014) ‘Comparing the Predictive Ability of Pls and Covariance
Models’, in 2016, I. (ed.) Thirty Fifth International Conference on Information Systems (Icis). Auckland: AISel, pp. 1–18.
Fang, Y. et al. (2014) ‘TRUST, SATISFACTION, AND ONLINE REPURCHASE INTENTION: THE
MODERATING ROLE OF PERCEIVED EFFECTIVENESS OF E-COMMERCE INSTITUTIONAL MECHANISMS’, MIS Quarterly, 38(2), pp. 407–427.
Forsyth, B. H. et al. (2006a) ‘Methods for Translating Survey Questionnaires’, in JSM
Proceedings (Survey Research Methods Section), pp. 4114–4119. Forsyth, B. H. et al. (2006b) ‘Methods for Translating Survey Questionnaires’, in JSM
Proceedings (Survey Research Methods Section), pp. 4114–4119. Foucault, M. (1977) Power/Knowledge, Power/Knowledge: Selected Interviews and Other
Writings 1972-1977. Edited by C. GORDON. New York: Pantheon Books. Fung, H. P. (2015) Is there any different between ‘control variable’ and ’moderating variable?
Available at: www.researchgate.net/post/Is_there_any_different_between_control_variable_and_moderating_variable2 (Accessed: 25 July 2017).
Garcia-Murillo, M. (2003) ‘Patchwork Adoption of ICTs in Latin America Martha’, Electronic
Journal of Information Systems in Developing Countries, 15(1), pp. 1–9. Garson, G. D. (2016) Partial Least Squares: Regression & Structural Equation Models. 2016
Editi. Asheboro: Statistical Associates Publishing. Gefen, D., Straub, D. W. and Boudreau, M.-C. (2000) ‘Structural Equation Modeling and
Regression : Guidelines for Research Practice’, Communications of the Association for Information Systems, 4(October), p. 7. doi: 10.1.1.25.781.
Glendenning, C. J. and Ficarelli, P. P. (2012) The Relevance of Content in ICT Initiatives in

166
Indian Agriculture, International Food Policy Research Institute. Grant, R. (CMR) (1991) ‘Ressource based theory of competitive advantage: Implications for
strategy formulation’, pp. 1–3. doi: 10.1017/CBO9781107415324.004. Groeneveld, R. A. and Meeden, G. (1984) ‘Measuring Skewness and Kurtosis’, Journal of the
Royal Statistical Society, 33(4), pp. 391–399. GSMA (2012) Annual Report 2012 The GSMA Mobile Money for the Unbanked Team. London.
Available at: https://www.gsma.com/mobilefordevelopment/wp-content/uploads/2012/10/2012_MMU_Annual-Report.pdf.
GSMA (2015) Case study: Orange Senekela, Mali. doi: 10.1016/S1360-8592(98)80013-2. Gupta, S. (2014) ‘SEM for Experimental Designs : An Information Systems Example’,
Electronic Journal of Business Research Methods, 12(1), pp. 27–40. Hair, J. F. et al. (2014) ‘Partial least squares structural equation modeling (PLS-SEM)’, in Sage
Publisher. Emerald Group Publishing Limited, pp. 1–329. doi: 10.1108/EBR-10-2013-0128.
Hair, J. F., Ringle, C. M. and Sarstedt, M. (2011) ‘PLS-SEM: Indeed a Silver Bullet’, The Journal
of Marketing Theory and Practice, 19(2), pp. 139–152. doi: 10.2753/MTP1069-6679190202.
Han, W. et al. (2015a) ‘CAMPUS EMERGENCY NOTIFICATION SYSTEMS: AN EXAMINATION OF
FACTORS AFFECTING COMPLIANCE WITH ALERTS’, MIS Quarterly, 39(4), pp. 909–929. Han, W. et al. (2015b) ‘CAMPUS EMERGENCY NOTIFICATION SYSTEMS: AN EXAMINATION OF
FACTORS AFFECTING COMPLIANCE WITH ALERTS’, MIS Quarterly, 39(4), pp. 909–929. Harindranath, G. and Berna, G. (2009) Challenges of ICT Adoption by South African SMEs : A
study of Manufacturing and Logistics Firms, Royal University of London. Harkness, J. a. (2000) Round 4 ESS translation strategies and procedures, Retrieved April. Harrod, J. and Jamsen, P. (2010) ‘Farmer Organizations Work Better with ICT’, in ICT in
Agriculture: Connecting Smallholders to Knowledge, Networks, and Institutions, pp. 173–202.
Hatakka, M. and De, R. (2011) ‘Development, capabilities and technology: an evaluative
framework’, … Developing Countries: Partners for Development …, (May 2011). Available at: http://www.diva-portal.org/smash/record.jsf?pid=diva2:486303.
Haug, R. and Tumbo, S. (2016) ‘Mobile learning bridging the gap in agricultural extension
service delivery: Experiences from Sokoine University of Agriculture, Tanzania Camilius Sanga and Malongo Mlozi Sokoine University of Agriculture, Tanzania’, International Journal of Education and Development using Information and Communication

167
Technology, 12(3), pp. 108–127. Heeks, R., Gao, P. and Ospina, A. (2010) ‘Delivering Coherent ICT Policies in Developing
Countries’, eDevelopment Briefing No 14, (14), pp. 1–4. Heeks, R. and Krishna, S. (2016) ‘ICTS AND HOPE FOR DEVELOPMENT: A THEORETICAL
FRAMEWORK’, Electronic Journal of Information Systems in Developing Countries, 77(4), pp. 1–19.
Heeks, R. and Molla, A. (2009) Development Informatics Compendium of Approaches,
Assessment. Manchester. Available at: http://www.sed.manchester.ac.uk/idpm/research/publications/wp/di/index.htm.
Heeks, R. and Molla, A. (2009) Impact Assessment of ICT-for-Development Projects: A
Compendium of Approaches, Development Informatics Working Paper No 36. Available at: http://www.sed.manchester.ac.uk/idpm/research/publications/wp/di/index.htm.
Henseler, J. (2010) ‘On the convergence of the partial least squares path modeling
algorithm’, Computational Statistics, 25(1), pp. 107–120. doi: 10.1007/s00180-009-0164-x.
Henseler, J. et al. (2014) ‘Common Beliefs and Reality About PLS: Comments on Ronkko and
Evermann (2013)’, Organizational Research Methods, 17(2), pp. 182–209. doi: 10.1177/1094428114526928.
Henseler, J., Hubona, G. and Ash, P. (2016) ‘Using PLS path modeling in new technology
research : updated guidelines’, Industrial Management & Data Systems, 116(1), pp. 2–20. doi: 10.1108/IMDS-09-2015-0382.
Henseler, J., Ringle, C. M. and Sarstedt, M. (2014) ‘A new criterion for assessing discriminant
validity in variance-based structural equation modeling’, Journal of the Academy of Marketing Science, 43(1), pp. 115–135. doi: 10.1007/s11747-014-0403-8.
Hodge, V. J. and Austin, J. (2004) ‘A Survey of Outlier Detection Methodoligies’, Artificial
Intelligence Review, 22(1969), pp. 85–126. doi: 10.1007/s10462-004-4304-y. Hoffmeyer-Zlotnik, J. H. P. and Harkness, J. A. (2006) Methodological Aspects in Cross-
National Research. Edited by J. H. P. Hoffmeyer-Zlotnik and J. A. Harkness. Mannheim: Druck & Kopie Hanel. doi: 16,19.
Hreats, A. V. V. A. T., Becker, J. and Ringle, C. M. (2013) ‘DISCOVERING UNOBSERVED
HETEROGENEITY IN STRUCTURAL EQUATION MODELS TO AVERT VALIDITY THREATS’, MIS Quarterly, 37(3), pp. 665–694.
Hsieh, J. J. P. and Petter, S. (2012) ‘IMPACT OF USER SATISFACTION WITH MANDATED CRM
USE ON EMPLOYEE SERVICE QUALITY’, MIS Quarterly, 36(4), pp. 1065–1080. Hussein, R. et al. (2007) ‘The influence of Organizational Factors on Information Systems

168
Success in E-Government Agencies in Malaysia’, The Electronic Journal on Information Systems in Developing Countries, 29(1), pp. 1–17.
IFDC (2004) Le marche des Intrants au Mali, Burkina Faso et Ghana. Bamako. Available at:
http://fsg.afre.msu.edu/promisam_2/references/IFDC_2004_Marche_Intrants_Mali_Burkina_Ghana.pdf.
Ifinedo, P. (2015) ‘The Moderating Effects of Age and Computer Knowledge on Nurses ’
Acceptance of Information Systems : A Canadian Study’, in. International Conference on Information Resources Management (CONF-IRM). Available at: http://aisel.aisnet.org/confirm2015/29%0AThis.
INSTAT (2014) ENQUETE NATIONALE AUPRES DES MENAGES ( EMOP ) RAPPORT D ’ ANALYSE
PREMIER PASSAGE 2014 POPULATION. Bamako. Available at: http://www.instat-mali.org/contenu/eq/rana14pas1_eq.pdf.
INSTAT (2015) INSTITUT NATIONAL AUPRES DES MENAGES ( EMOP ) RAPPORT D ’ ANALYSE
PREMIER PASSAGE 2015. Bamako. Available at: http://www.instat-mali.org/contenu/eq/rana15pas1_eq.pdf.
Issa FOFANA (2010) Memoire Online - L’utilisation de téléphone mobile et dynamiques des
acteurs dans l’espace urbain de Bamako - Issa FOFANA. Gaston Berger. Available at: http://www.memoireonline.com/10/12/6176/Lutilisation-de-telephone-mobile-et-dynamiques-des-acteurs-dans-lespace-urbain-de-Bamako.html.
Ituma-aleke, B. and Egwu, P. (2014) ‘Social Network Adaptation , a Panacea to Information
and Communication Technologies ( ICTs), Innovation Diffusion : the Case of Small Scale Agribusinesses in Less Developed Countries’, in UK Academy for Information Systems Conference Proceedings. AIS Electronic Library. Available at: http://aisel.aisnet.org/ukais2014/55.
Jacobs, R. L. (2011) Developing a Research Problem and Purpose Statement. FIRST EDIT.
Edited by T. S. Rocco and T. Hatcher. San Francisco: Jossey-Bass. Jarvis, C. B., Mackenzie, S. B. and Podsakoff, P. M. (2012) ‘THE NEGATIVE CONSEQUENCES OF
MEASUREMENT MODEL MISSPECIFICATION: A RESPONSE TO AGUIRRE-URRETA AND MARAKAS’, MIS Quarterly, 36(1), pp. 139–146.
Joanes, D. N. and Gill, C. A. (1998) ‘Comparing measures of sample skewness and kurtosis’,
Journal of the Royal Statistical Society: Series D (The Statistician). Blackwell Publishers Ltd, 47(1), pp. 183–189. doi: 10.1111/1467-9884.00122.
Johnston, A. C., Warkentin, M. and Siponen, M. (2015) ‘AN ENHANCED FEAR APPEAL
RHETORICAL FRAMEWORK: LEVERAGING THREATS TO THE HUMAN ASSET THROUGH SANCTIONING RHETORIC’, MIS Quarterly, 39(1), pp. 113–134.
Jorge, C. M. H. et al. (2003) ‘Use of the ICTs and the perception of e-learning among
University Students : a Differential Perspective according to Gender and Degree Year

169
Group .’, Interactive Educational Multimedia, 7(7), pp. 13–28. Kaba, B., Diallo, A. and Plaisent, M. (2006) ‘Explaining the factors influencing cellular phones
use in Guinea’, The Electronic Journal of Information Systems in Developing Countries, 28(3), pp. 1–7. Available at: http://www.ejisdc.org/ojs2../index.php/ejisdc/article/view/341.
Kaddu, S. B. (2011) INFORMATION AND COMMUNICATION TECHNOLOGIES’ (ICTs)
CONTRIBUTION TO THE ACCESS AND UTILISATION OF AGRICULTURAL INFORMATION BY THE RURAL WOMEN IN UGANDA. Makerere University.
Kameswari, V. L. V., Kishore, D. and Gupta, V. (2011) ‘ICTs for agricultural extension: a study
in the Indian Himalayan region’, Electronic Journal of Information Systems in Developing Countries, 48(3), pp. 1–12.
Kankanhalli, A., Ye, H. (Jonathan) and Teo, H. H. (2015) ‘COMPARING POTENTIAL AND
ACTUAL INNOVATORS: AN EMPIRICAL STUDY OF MOBILE DATA SERVICES INNOVATION’, MIS Quarterly, 39(3), pp. 667–682.
Kante, M., Chepken, C. and Oboko, R. (2017) ‘Methods for translating ICTs ’ survey
questionnaire into French and Bambara’, in Knowledge and Innovation for Social and Economic Development. Njoro: Egerton University.
KANTE, M. and Myagro (2016) ‘Synthese sur Maigro’. Bamako. Kante, M., Oboko, R. and Chepken, C. (2016) ‘Factors affecting the use of ICTs on agricultural
input information by farmers in developing countries’, AIMS Agriculture and Food, 1(3), pp. 315–329. doi: 10.3934/agrfood.2016.3.315.
Kante, M., Oboko, R. and Chepken, C. (2017) ‘INFLUENCE OF PERCEPTION AND QUALITY OF
ICT-BASED AGRICULTURAL INPUT INFORMATION ON USE OF ICTS BY FARMERS IN DEVELOPING COUNTRIES: CASE OF SIKASSO IN MALI’, Electronic Journal of Information Systems in Developing Countries, 83(9), pp. 1–21. Available at: ejisdc.org.
Kapoor, K., Dwivedi, Y. K. and Williams, M. D. (2013) ‘Role of Innovation Attributes in
Explaining the Adoption Intention for the Interbank Mobile Payment Service in an Indian Context’, in Brooks, L., Wainwright, D., and Wastell, D. (eds) SOCIAL INFORMATION SYSTEMS. Oxford: UK Academy for Information Systems Proceedings 2013, pp. 203–220. doi: 10.1007/978-3-642-38862-0.
Kilima, F. T. M., Sife, A. S. and Sang, C. (2016) ‘Factors Underlying the Choice of Information
and Communication Technologies among Small holder Farmers in Tanzania International Journal ICT Research’, International Journal of Computing and ICT Research, 10(2), pp. 41–60.
Kinyangi, A. A. (2014) Factors influencing the adoption of agricultural technology among
smallholder farmers in kakamega north sub-county , kenya. University of Nairobi. Kiwanuka, A. (2015) ‘Acceptance Process : The Missing Link between UTAUT and Diffusion of

170
Innovation Theory’, American Journal of Information Systems, 3(2), pp. 40–44. doi: 10.12691/ajis-3-2-3.
Kline, R. B. (2013) Principales and practice of Strutural equation modeling. third, Guilford Publications. third. London: THE GUILFORD PRESS. doi: 10.1017/CBO9781107415324.004.
Kondo, F. N., Ishida, H. and Ghyas, Q. M. (2013) ‘A DIFFERENCE BETWEEN JAPAN AND THE US
IN THE CUSTOMER SATISFACTION MODEL FOR MOBILE UTILITARIAN INFORMATION SERVICES’, in ICMB (ed.) International Conference on Mobile Business International. AISel, pp. 181–192.
KTM (2013) Kenya Markets Trust - Agricultural Inputs. Available at:
http://www.kenyamarkets.org/what-we-do/the-market-assistance-programme/agricultural-inputs (Accessed: 18 January 2016).
de la Rive Box, J. et al. (2015) Finance for Smallholders Colophon. Available at:
http://www.inclusivefinanceplatform.nl/documents/finance for smallholders- case studies report_1.pdf.
Li, L. (2010) ‘A critical review of technology acceptance literature’, Southwest Decisino
Sciences Institute, p. 22. Available at: http://www.swdsi.org/swdsi2010/SW2010_Preceedings/papers/PA104.pdf.
Lim, S. et al. (2009) ‘Theories Used in Information Systems Research : Identifying Theory
Networks in Leading IS Journals’, in ICIS (ed.) International Conference on Information Systems. AISel, p. 10. Available at: http://aisel.aisnet.org/icis2009.
Lio, M. and Liu, M. C. (2006) ‘ICT and agricultural productivity: Evidence from cross-country
data’, Agricultural Economics, 34(3), pp. 221–228. doi: 10.1111/j.1574-0864.2006.00120.x.
Lwoga, E. T. (2010) ‘BRIDGING THE AGRICULTURAL KNOWLEDGE AND INFORMATION DIVIDE:
THE CASE OF SELECTED TELECENTERS AND RURAL RADIO IN TANZANIA’, Electronic Journal of Information Systems in Developing Countries, 43(6), pp. 1–14.
Lwoga, E. T., Stilwell, C. and Ngulube, P. (2011) ‘Access and use of agricultural information
and knowledge in Tanzania’, Library Review, 60(5), pp. 383–395. doi: 10.1108/00242531111135263.
MacVaugh, J. and Schiavone, F. (2010) ‘Limits to the diffusion of innovation: A literature
review and integrative model’, European Journal of Innovation Management, 13(2), pp. 197–221. doi: 10.1108/14601061011040258.
MAIGA, A. (2009) Community Telecentres in Mali, Telecentre.org. Bamako. Available at:
afriklinks.org. Majchrzak, A., Wagner, C. and Yates, D. (2013) ‘THE IMPACT OF SHAPING ON KNOWLEDGE
REUSE FOR ORGANIZATIONAL IMPROVEMENT WITH WIKIS’, MIS Quarterly, 37(2), pp.

171
455–469. March, S. T. and Smith, G. F. (1995) ‘Design and Natural Science Research on Information
Technology.’, Decision Support Systems, 15, pp. 251–266. Available at: http://search.ebscohost.com/login.aspx?direct=true&db=epref&AN=DSS.AE.BEA.MARCH.DNSRIT&site=ehost-live.
Marett, K., Otondo, R. F. and Taylor, G. S. (2013) ‘ASSESSING THE EFFECTS OF BENEFITS AND
INSTITUTIONAL INFLUENCES ON THE CONTINUED USE OF ENVIRONMENTALLY MUNIFICENT BYPASS SYSTEMS IN LONG-HAUL TRUCKING’, MIS Quarterly, 37(4), pp. 1301–1312.
Marsh, H. W. et al. (2014) ‘Exploratory structural equation modeling: an integration of the
best features of exploratory and confirmatory factor analysis.’, Annual review of clinical psychology, 10(Mimic), pp. 85–110. doi: 10.1146/annurev-clinpsy-032813-153700.
Maumbe, B. M. and Okello, J. (2010) ‘Uses of Information and Communication Technology
(ICT) in Agriculture and Rural Development in Sub-Saharan Africa: Experiences from South Africa and Kenya’, International Journal of ICT Research and Development in Africa, 1(1), pp. 1–22. doi: 10.4018/jictrd.2010010101.
Meera, S. N., Jhamtani, A. and Rao, D. U. M. (2004) ‘INFORMATION AND COMMUNICATION
TECHNOLOGY IN AGRICULTURAL DEVELOPMENT : A COMPARATIVE ANALYSIS OF THREE PROJECTS FROM INDIA Shaik . N . Meera , Anita Jhamtani , and D . U . M . Rao’, Agricultural Research & Extension Network, (135), pp. 2–15.
Michael D Myers and David Avison (1997) ‘Qualitative Research in Information Systems’, MIS
Quarterly, 22(2), pp. 241–242. Available at: www.qual.auckland.ac.nz. Mittal, S. and Mehar, M. (2012) ‘How Mobile Phones Contribute to Growth of Small
Farmers ? Evidence from India’, Quarterly Journal of International Agriculture, 51(3), pp. 227–244.
Msoffe, G. E. P. and Ngulube, P. (2016) ‘Agricultural Information Dissemination in Rural Areas
of Developing Countries : A Proposed Model for Tanzania’, Electronic Journal of Information Systems in Developing Countries, 26(2), pp. 169–187.
Mueller, B. and Urbach, N. (2013) ‘THE WHY, WHAT, AND HOW OF THEORIES IN IS
RESEARCH’, in ICIS (ed.) Thirty Fourth International Conference on Information Systems. Milan: AISel, pp. 181–192.
Müller-Bloch, C. and Kranz, J. (2015) ‘A Framework for Rigorously Identifying Research Gaps
in Qualitative Literature Reviews’, in Thirty Sixth International Conference on Information Systems. ICIS, pp. 1–19.
Murage, A. et al. (2013) ‘Potential uptake determinants of climate-smart push-pull
technology in drier agro-ecological zones of eastern Africa’, in the 4th International Conference of the African Association of Agricultural Economists, p. 24. Available at: http://ageconsearch.umn.edu/bitstream/161511/2/Murage A.W., Midega C.A.O,

172
Pittchar J.O., Khan Z.R.pdf. Mwombe, S. O. L. et al. (2014) ‘Evaluation of Information and Communication Technology
Utilization by Small Holder Banana Farmers in Gatanga District, Kenya’, Journal of Agricultural Education and Extension, 20(2), pp. 247–261. doi: 10.1080/1389224X.2013.788454.
Myagro (2016) Myagro, myagro.org. Available at: http://www.myagro.org/meet-our-
farmers/ (Accessed: 2 December 2015). Nakasone, E., Torero, M. and Minten, B. (2014) ‘The Power of Information: The ICT
Revolution in Agricultural Development’, Annual Review of Resource Economics, 6(1), pp. 533–550. doi: 10.1146/annurev-resource-100913-012714.
Ndiege, J. R. A., Wayi, N. and Herselman, M. E. (2012) ‘QUALITY ASSESSMENT OF
INFORMATION SYSTEMS IN SMES: A STUDY OF ELDORET, KENYA’, Electronic Journal of Information Systems in Developing Countries, 51(2), pp. 1–23.
Njelekela, C. and Sanga, C. (2015) ‘Contribution of Information and Communication
Technology in Improving Access to Market Information among Smallholder Farmers: The case study of Kilosa District’, International Journal of Management Science and Information Technology, (17), pp. 56–71.
Odhiambo, F. (2014) ‘Unlocking the market’, in CTA (ed.) Revolutionising finance for agri-
value chains. Nairobi: ICT4AG. Available at: http://ictupdate.cta.int/Feature-Articles/Unlocking-the-market.
Oodhue, G. et al. (2012) ‘WHEN IMPRECISE STATISTICAL STATEMENTS BECOME
PROBLEMATIC: A RESPONSE TO GOODHUE, LEWIS, AND THOMPSON’, MIS Quarterly, 36(3), pp. 717–728.
Orange (2014) services for agriculture in Africa. Available at:
www.orange.com/.../Catalogue_Orange_mAgri_JAN14_external. Ouedrago, J. E. (2008) evaluation des besoins en informations agricoles dans les etats du
groupe afrique-caraibes-pacifique (acp), Centre Technique de cooperation Agricole et rurale (CTA). doi: 10.1017/CBO9781107415324.004.
Palmer, N. (2011) Utiliser les TIC pour permettre aux petits exploitants d’accéder aux
systèmes d’innovation agricole. Palmer, T. (2014) mAgri Rapport initial sur Orange. Available at:
http://www.gsma.com/mobilefordevelopment/programme/magri/early-results-from-orange-senekela-data-and-insights-from-the-baseline-version-francaise-disponible.
Palmer, T. (2015) Orange Sènèkèla Midline. Available at:
http://www.gsma.com/mobilefordevelopment/wp-content/uploads/2015/09/GSMA_Senekela_Midline.pdf.

173
Pan, Y. and de la Puente, M. (2005) Census Bureau guideline for the translation of data
collection instruments and supporting materials: Documentation on how the guideline was developed, Survey Methodology. Washington D.C.
Park, I., Sharman, R. and Rao, H. R. (2015) ‘DISASTER EXPERIENCE AND HOSPITAL
INFORMATION SYSTEMS: AN EXAMINATION OF PERCEIVED INFORMATION ASSURANCE, RISK, RESILIENCE, AND HIS USEFULNESS’, MIS Quarterly, 39(2), pp. 317–344.
Pick, J. B. and Gollakota, K. (2010) ‘Technology for rural telecenters In India: A model and
exploratory study of diffusion of information for telecenter use and sustainability’, in Amcis (ed.) 16th Americas Conference on Information Systems. Lima: AISeL, pp. 3935–3946. Available at: http://www.scopus.com/inward/record.url?eid=2-s2.0-84870314918&partnerID=tZOtx3y1.
Presser, S. et al. (2004) Methods for testing and evaluating survey questions, Public Opinion
Quarterly. doi: 10.1093/poq/nfh008. Products, F. (2014) ‘Mali Cereals Production’, (August), p. 2014. Promisam (2007) Synthese des plans communaux de securite alimentaire du cercle de
Bougouni 2007-2011. Bamako. Available at: http://fsg.afre.msu.edu/mali_fd_strtgy/plans/sikasso/bougouni/psa_cercle_bougouni.pdf.
PROMISAM (2012) ‘Plan de securite alimentaire commune rurale de Zantiebougou 2008- 2012’, pp. 1–17.
Pshenichnaya, N. and Clause, V. (2013) mAgri Case Study: Nokia Life Agriculture Service.
Available at: http://www.gsma.com/mobilefordevelopment/wp-content/uploads/2013/03/GSMAmAgri_Nokia_Case_Study.pdf.
van Raaij, E. M. and Schepers, J. J. L. (2008) ‘The acceptance and use of a virtual learning
environment in China’, Computers & Education, 50(3), pp. 838–852. doi: 10.1016/j.compedu.2006.09.001.
Rezaei-Moghaddam, K. and Salehi, S. (2010) ‘Agricultural specialists’ intention toward
precision agriculture technologies: Integrating innovation characteristics to technology acceptance model’, African Journal of Agricultural Research, 5(March), pp. 1191–1199. doi: 10.5897/AJAR09.506.
RGPH (2013) 4 ème Récensement General de la Population et de l’Habitat du Mali (RGPH).
Résultats définitifs. Tome 0: Répertoire des villages. Bamako. Richardson, D. (2005) ‘How Can Agricultural Extension Best Harness ICTs to Improve Rural
Livelihoods in Developing Countries?’, In ICT in Agriculture: Perspectives of Technological Innovation, p. 14.
Ringle, C. M., Wende, S., and Becker, J.-M. (2015) ‘SmartPLS 3’. Boenningstedt: SmartPLS GmbH. Available at: http://www.smartpls.com.
174
Ringle, C. M., Sarstedt, M. and Straub, D. W. (2012) ‘EDITOR’S COMMENTS’, MIS Quarterly,
36(1). Rogers, E. M. (1983) DIFFUSION OF Third Edition. Third Edit. New York: Macmillan Publishing.
doi: 82-70998. Rogers, E. M. (1995) Diffusion of innovations, Macmillian Publishing Co. doi: citeulike-article-
id:126680. Rogers, E. M. (2014) Diffusion of Innovations Theory. doi: 10.1111/j.1467-
9523.1970.tb00071.x. Rönkkö, M., Parkkila, K. and Ylitalo, J. (2012) ‘Use of Partial Least Squares as a Theory Testing
Tool - An Analysis fo Information Systems Papers’, in ECIS (ed.) European Conference on Information Systems (Ecis). AISeL, p. Paper 145.
Rouse, A. C. and Corbitt, B. (2008) ‘There ’ s SEM and “ SEM ”: A Critique of the Use of PLS
Regression in Information Systems Research’, in the 19th Australasian Conference on Information Systems (ACIS). Christchurch: ACIS, pp. 845–855. doi: 10.1177/1094428106296642.
Sanga, C. ., Kalungwizi, V. J. ; and Msuya, C. P. (2013) ‘Building an agricultural extension
services system supported by ICTs in Tanzania : Progress made , Challenges remain’, International Journal of Education and Development using Information and Communication Technology, 9(1), pp. 80–99.
Sathye, M. et al. (2015) ‘Determinants of intention to use mobile value added services: The
case of women-owned micro enterprises in Fiji’, in Kankanhalli, A., Jones, A. B., and Teo, T. (eds) IT and Open Innovation. Singapore: PACIS 2015 Proceedings. Available at: https://www.scopus.com/inward/record.uri?eid=2-s2.0-85011024220&partnerID=40&md5=fd60f3843dc1c59bd6a297f45a0612d9.
Saunders, M., Lewis, P. and Thornhill, A. (2009) Research methods for business students fifth
edition. fifth. Pearson. Available at: https://is.vsfs.cz/el/6410/leto2014/BA_BSeBM/um/Research_Methods_for_Business_Students__5th_Edition.pdf.
Schmitz, K. W., Teng, J. T. C. and Webb, K. J. (2016) ‘CAPTURING THE COMPLEXITY OF
MALLEABLE IT USE: ADAPTIVE STRUCTURATION THEORY FOR INDIVIDUALS’, MIS Quarterly, 40(3), pp. 663–686.
Sen, S. and Choudhary, V. (2011) ‘ICT Applications for Agricultural Risk Management’, ICT in
Agriculture Sourcebook, pp. 259–284. Available at: http://scholar.google.com/scholar?hl=en&btnG=Search&q=intitle:ICT+APPLICATIONS+FOR+AGRICULTURAL+RISK+MANAGEMENT#0.
Setia, P., Ventkatesh, V. and Joglekar, S. (2013) ‘LEVERAGING DIGITAL TECHNOLOGIES: HOW

175
INFORMATION QUALITY LEADS TO LOCALIZED CAPABILITIES AND CUSTOMER SERVICE PERFORMANCE’, MIS Quarterly, 37(2), pp. 565–590.
Silva, H. De (2008) Using ICT to reduce transaction costs in agriculture through better
communication: A case study from Sri Lanka, LIRNEasia, Colombo, Sri Lanka,. Available at: http://unpan1.un.org/intradoc/groups/public/documents/UNPAN/UNPAN037348.pdf%5CnSilva_2008_Using ICT to reduce transaction costs in agriculture through better communication A case study from Sri Lanka (2).pdf.
Simin, M. and Janković, D. (2014) ‘Applicability of Diffusion of Innovation Theory in Organic
Agriculture’, Economics of Agriculture, 2014(61), pp. 517–531. doi: 10.5937/ekoPolj1402517T.
Singh, M. et al. (2016) ‘Mobile Phone Technology-An Eminent ICT Tool for Better Family
Farming Mobile Phone Technology- An Eminent ICT Tool for Better Family Farming’, in Family Farming and Rural development, pp. 287–291.
Siraj, M. (2010) A model for ICT based services for agriculture extension in Pakistan. Available
at: http://r4d.dfid.gov.uk/PDF/Outputs/Misc_Infocomm/60818-extensionmodel-Pakistan.pdforg.
Siyao, P. O. (2012) ‘Barriers in accessing Agricultural Information in Tanzania With a Gender
Perspective : the Case study of small-scale sugar Cane growers in Kilombero District’, Electronic Journal of Information Systems in Developing Countries, pp. 1–19.
Sousa, F., Nicolay, G. and Home, R. (2016) ‘Information technologies as a tool for agricultural
extension and farmer- to-farmer exchange: Mobile-phone video use in Mali and Burkina Faso’, International Journal of Education and Development using Information and Communication Technology, 12(3), pp. 19–36.
Souter, D. (2010) ‘ICTs and Development in Zambia : Challenges and Opportunities’, Thetha
Regional ICT Discussion Forum Project. Staatz, J. and Temé, B. (2015) WHAT WOULD IT TAKE TO INCREASE THE PRODUCTIVITY OF
THOSE ENGAGED IN THE PRIMARY SECTOR IN MALI ? In answering the question , we need to consider : Michigan State University. Available at: http://fsg.afre.msu.edu/srai2/What_would_it_take_to_increase_the_productivity_5.pdf.
Sukhpal, S. (Indian I. of (2004) ‘Leveraging ICT for Agricultural Development: A case study of
e-Choupals of ITC’, Journal of IMT, VIII(1), pp. 1–6. Surendran, P. (2012) ‘Technology Acceptance Model : A Survey of Literature’, International
Journal of Business and Social Research, 2(4), pp. 175–178. Sylvester, G. (2013) Information and communication technologies for sustainable agriculture
Indicators from Asia and the Pacific. Bangkok. Available at: www.fao.org/publications.

176
Traoré, A. et al. (2011) ‘Quelles évolutions des systèmes de production céréaliers au Mali ?’, pp. 54–56.
Traore, S. M. et al. (2012) 4 ème RECENSEMENT GENERAL DE LA POPULATION ET DE L ’
HABITAT DU MALI ( RGPH-2009 ) : Etat et structure de la population, Institut national de la statistique. Bamako. Available at: http://www.unfpa-mali.org/sites/default/files/Rapport_Etat_Structure_Version 22 Dec 2011.pdf.
Ueno, T. and Yoshida, K. (2012) Nikkei BP Consulting, Inc. | Newsrelease. Available at:
http://consult.nikkeibp.co.jp/english/news/120420/ (Accessed: 1 February 2016). United Nations Population Division (2015) World population prospects: The 2015 revision.
The 2015 R. Edited by D. Edition. Available at: http://esa.un.org/unpd/wpp/DVD/. Urbach, N. and Ahlemann, F. (2010) ‘Structural equation modeling in information systems
research using partial least squares’, Journal of Information Technology Theory and Application, 11(2), pp. 5–40. doi: 10.1037/0021-9010.90.4.710.
Urquhart, C. and Fernández, W. (2013) ‘Using grounded theory method in information
systems: the researcher as blank slate and other myths’, Journal of Information Technology, 28(3), pp. 224–236. doi: 10.1057/jit.2012.34.
Vaughan, R. (2008) ‘Conceptual Framework’. Available at: bournemouth.ac.uk. Venkatesh, V., Thong, J. Y. L. and Xu, X. (2012) ‘CONSUMER ACCEPTANCE AND USE OF
INFORMATION TECHNOLOGY: EXTENDING THE UNIFIED THEORY OF ACCEPTANCE AND USE OF TECHNOLOGY’, MIS Quarterly, 36(1), pp. 157–178.
Ventkatesh, V. et al. (2003) ‘USER A CCEPTANCE OF I NFORMATION T ECHNOLOGY :
TOWARD A UNIFIED VIEW’, MIS Quarterly, 27(3), pp. 425–478. Villar, A. (2009) Agreement answer scale design for multilingual surveys: Effects of
translation-related changes in verbal labels on response styles and response distributions, Survey Research and Methodology program (SRAM)-Dissertations & Theses. University of Nebraska. Available at: http://digitalcommons.unl.edu/cgi/viewcontent.cgi?article=1002&context=sramdiss.
Wainwright, D. W. and Waring, T. S. (2007) ‘The application and adaptation of a diffusion of
innovation framework for information systems research in NHS general medical practice’, Journal of Information Technology. Palgrave Macmillan UK, 22(1), pp. 44–58. doi: 10.1057/palgrave.jit.2000093.
Wang, E. T. G., Tai, J. C. F. and Grover, V. (2013) ‘EXAMINING THE RELATIONAL BENEFITS OF
IMPROVED INTERFIRM INFORMATION PROCESSING CAPABILITY IN BUYER–SUPPLIER DYADS’, MIS Quarterly, 37(1), pp. 149–173.
Wang, W. . and Peng, G. . (2008) ‘The service models and technical models of agricultural
informationization in China’, in Pacific Asia Conference on Information Systems (ed.)

177
Leveraging ICT for Resilient Organizations and Sustainable Growth in the Asia Pacific Region. suzhou: AIS Electronic Library (AISeL). Available at: http://www.scopus.com/inward/record.url?eid=2-s2.0-84862915402&partnerID=40&md5=521e6c1af582f3a5176d4e82a98dbf8a.
Webster, J. and Watson, R. T. (2002) ‘Analyzing the Past to Prepare for the Future: Writing a
Literature Review.’, MIS Quarterly, 26(2), pp. xiii–xxiii. doi: 10.1.1.104.6570. Weigel, F. K. et al. (2014) ‘Diffusion of innovations and the theory of planned behavior in
information systems research: A metaanalysis’, Communications of the Association for Information Systems, 34(1), pp. 619–636. Available at: http://aisel.aisnet.org/cais/vol34/iss1/31/%5Cnpapers3://publication/uuid/75BAEF77-7E49-467E-B445-8A2FE649FBA8.
Williams, B. B. M. (2013) ‘An Evaluation of the Farmer-Training Programme in Jamaica:
Opportunities for use of ICTs in training delivery and in farming activities’, in Systems, P. of the N. A. C. on I. (ed.) AMCIS 2013 Proceedings. Chicago: AISeL, pp. 1–11. Available at: http://aisel.aisnet.org/amcis2013/ICTCaribbean/RoundTablePresentations/3.
Wolfswinkel, J. F., Furtmueller, E. and Wilderom, C. P. M. (2011) ‘Using grounded theory as a
method for rigorously reviewing literature’, European Journal of Information Systems. Nature Publishing Group, 22(1), pp. 45–55. doi: 10.1057/ejis.2011.51.
Wollni, M. and Qaim, M. (2014) Traditional Food Crop Production and Marketing in Sub-
Saharan Africa : The Case of Finger Millet in Western Kenya. Gottingen. Available at: https://ediss.uni-goettingen.de/bitstream/handle/11858/00-1735-0000-0022-5E54-4/Traditional Food Crop Production and Marketing in Sub-Saharan Africa - The Case of Finger Millet in Western Kenya.pdf?sequence=1.
Wong, K. K.-K. (2014) Partial Least Squares Structural Equation Modeling ( Pls-Sem ). Wood, T. G. and Cowie, R. H. (2001) ‘Assessment of On-Farm Losses in Cereals in Africa Due
to Soil Insects’, International Journal of Tropical Insect Science. Cambridge, UK: Cambridge University Press, 9(6), pp. 709–716. doi: 10.1017/S1742758400005580.
Woosley, J. M. and Ashia, K. (2011) ‘Comparison of Contemporary Technology Acceptance
Models and Evaluation of the Best Fit for Health Industry Organizations .’, International Journal of Computer Science Engineering and Technology, 1(11), pp. 709–717.
World Bank (2011) ‘ICT in agriculture: connecting amallholders to knowledge, networks, and
institutions’, World, (64605), p. 424. doi: 64605. Wu, S. P., Straub, D. W. and Liang, T.-P. (2015) ‘HOW INFORMATION TECHNOLOGY
GOVERNANCE MECHANISMS AND STRATEGIC ALIGNMENT INFLUENCE ORGANIZATIONAL PERFORMANCE: INSIGHTS FROM A MATCHED SURVEY OF BUSINESS AND IT MANAGERS’, MIS Quarterly, 39(2), pp. 497–518.
Wulystan, P. M. and Andrew, C. M. (2013) ‘Using Information and Communication

178
Technologies for Enhancing the Accessibility of Agricultural Information for Improved Agricultural Production in Tanzania’, Electronic Journal of Information Systems in Developing Countries, 56(1), pp. 1–14.
Wyk, B. van (2012) ‘Research design and methods: Part 1’. Cape town, p. 16. Xu, J. D., Benbasat, I. and Cenfetelli, R. T. (2014) ‘THE NATURE AND CONSEQUENCES OF
TRADE-OFF TRANSPARENCY IN THE CONTEXT OF RECOMMENDATION AGENTS’, MIS Quarterly, 38(2), pp. 379–406.
Zavala-Rojas, D. (2014) A procedure to prevent differences in translated survey items using
SQP. 38. Available at: http://www.upf.edu/survey/_pdf/RECSM_wp038.pdf. Zewge, A. and Dittrich, Y. (2017) ‘SYSTEMATIC MAPPING STUDY OF INFORMATION
TECHNOLOGY FOR DEVELOPMENT IN AGRICULTURE (THE CASE OF DEVELOPING COUNTRIES)’, Electronic Journal of Information Systems in Developing Countries, 82(2), pp. 1–25.

179
APPENDICES
APPENDIX 1. QUESTIONNAIRE Questionnaire Number………………. Section A: Introduction My name is:………………………………………………………………………………. Thank you for accepting to complete this questionnaire. This study aims to propose an ICT model for increased adoption of agricultural input information for cereals’ producer in Sikasso region. Participation in this study is voluntary, and the information will be used to advise the government, policy-making bodies and other stakeholders on how efficiently provide farm inputs information to cereal farmers in developing countries and more so in Sikasso. This information will not be used in any other way other than this. Merci d’accepter de remplir ce questionnaire. La présente étude vise à proposer un modèle Tics pour une plus grande adoption des informations sur les intrants agricoles des producteurs de céréales de la région de Sikasso. La participation à l’étude est volontaire et l’information qui en résultera servira à conseiller le gouvernement, les organes/institution décisionnels et autres acteurs sur la manière
d’offrir avec efficience les informations sur les intrants agricoles aux producteurs de céréales des pays en voie de développement et en particulier ceux de Sikasso. L’information issue de cette étude ne sera utilisée qu’à cette fin.
Section B: Demographic information (Information démographique)
1. District (Cercle): Bougouni
2. Commune: Zantiebougou
3. Village: Sirakoro Zantiebougou Monzondougou koloni Oure
Section C: Identification (Identification)
1. Name (nom): Surname (Prénom):……………….. Age (Age):…………………
Gender (Genre): M F
2. Are you the head of this family (Êtes-vous le chef de cette famille ?): Yes (oui) No
(Non)
Date (dd/mm/yyyy): …………../………../2016

180
3. If no who are you (Sinon, qui êtes vous?): ……………………………………..
4. Size of household (Taille de la famille): ……………………
5. Which cereals do you produce (Quelles céréales produisez-vous : Millet(Mil)
Maize(Mais) Sorghum (Sorgho) Rice (Riz) Fonio (Fonio)
6. Do you use ICTs to get information on agricultural inputs (Utilisez-vous les TICs pour obtenir
de l’information sur les intrants agricoles)? ……………………………
7. For how long have been using ICTs (Depuis quand ou combien de temps utilisez-vous les
TIC)? Less than a year (moins d’une année) One year (une année) more than
a year (Plus d’une année)
8. Which ICTs do you use (Quelles TICs utilisez-vous)?
Mobile phone (Telephone portable) Telecentre (Telecentre)
Section D: Moderators
1=strongly agree, 2=agree, 3= neutral, 4=disagree, and 5=strongly disagree.
LITERACY (NIVEAU D’ALPHABÉTISATION)
Please tick one (Veuillez
Cocher une case)
Yes
Oui
No
Non
1. I can read and understand alphabets letters
Je peux lire et comprendre les lettres de l’alphabet
2. I can read to learn and apply my understanding
Je peux lire pour apprendre et appliquer cette
compréhension

181
3. I can write the alphabet letters and numbers
Je peux écrire les lettres de l’alphabet et les chiffres
4. I can write a personal letter, a brief description of
an event or image
Je peux écrire une lettre personnelle, une brève description
d’un évènement ou d’une image
5. I can fill out a simple form
Je peux remplir un formulaire simple
ICT Skills (for all the respondents) / Compétences
d’utilisation des TIC (pour tous les répondants)
Yes
(Oui)
No
(Non)
6. I can turn on a computer
Je peux allumer un ordinateur
7. I can name parts of a computer and connect
devices to a computer
je peux citer les noms des parties de l’ordinateur et y
brancher des appareils

182
8. I can create, modify and delete a folder on a
computer
Je peux créer, modifier et effacer un dossier sur un
ordinateur
9. I can use Word processing
Je peux utiliser le traitement de textes
10. I have an email address, I can read and
write an email
Je possède une adresse email, je peux écrire et lire un
11. I can use a browser and find online the
information I am looking for
Je peux utiliser un navigateur et trouver l’information dont
j’ai besoin
12. I can write an SMS on a mobile phone
Je peux écrire un message SMS sur un téléphone portable
13. I can a follow up procedure given by a
customer care on a mobile phone
Je peux suivre une procédure donnée par un agent d’un
centre d’appel sur mon téléphone

183
14. I can take pictures with my mobile phone
or download a video on my phone
Je peux prendre des photos ou télécharger une vidéo avec
mon mobile.
Section E: Determinants (for those who have used ICTs to adopt agricultural input
information) / Déterminants (pour ceux qui ont utilisé les TICs pour obtenir et utiliser des
informations sur les intrants agricoles)
Cost (Coût) /
Please tick one
Veuillez choisir
1 2 3 4 5
1. The transaction cost such as airtime, bundles for
N’gasene/Senekela is not expensive
Les coûts de transaction tels que les cartes de recharge
téléphonique (crédit), forfaits N’gasene/Senekela n’est pas cher
2. I use N’gasene/Senekela because it is cheaper
J’utilise N’gasene/Senekela parcequ’ils sont moin chers

184
3. Getting agricultural input information through other
means such as radio, TV, community meetings, newspaper is
expensive than using N’gasene/Senekela
Il est plus cher d’obtenir des informations sur les intrants
agricoles à travers les media tels que la radio, la TV, les réunions
communautaires, les journaux que par N’gasene/seenekela.
Relative advantage / Avantage relative/
1 2 3 4 5
4. N’gasene/Senekela is better than using books or
newspaper to get AIIagricultural input information
Les N’gasene/Senekela est mieux que les livres ou les journaux
pour obtenir les informations sur intrants agricoles.
5. N’gasene/Senekela is more interesting than other
source of information that I have used to get agricultural input
information
N’gasene/Senekela est plus intéressant que d’autres sources
d’information que j’ai utilisée pour obtenir des informations sur les
intrants agricoles

185
6. Using N’gasene/Senekela made contribution to the
access and use of agricultural input information than it would
be possible without the it for me
L’utilisation N’gasene/Senekela a apporté une contribution à
l’accès et l’utilisation de ces informations qui ne serait pas
possible sans lui pour moi.
Compatibility/ Compatibilité/
1 2 3 4 5
7. N’gasene/Senekela is suitable to the way I like to get
information to the access and use of agricultural input
information
Les N’gasene/Senekela est conforme à la manière dont j’aimerais
obtenir l’information sur les intrants agricoles
8. I think other farmers should use N’gasene/Senekela to
access/use agricultural input information
Je pense que les autres agriculteurs (paysans) doivent utiliser
N’gasene/Senekela
9. Using N’gasene/Senekela made what I was doing about
agricultural input information seem more relevant
L’utilisation N’gasene/Senekela a rendu ce que je faisais
concernant les informations sur les intrants plus pertinent.

186
Simplicity/ Simplicité/
10. When using N’gasene/Senekela, I had no
difficulty finding the information that I wanted
En utilisant N’gasene/Senekela, je n’ai eu aucune difficulté à
obtenir l’information que je voulais.
11. I had no difficulty understanding how to get around in
N’gasene/Senekela Je n’ai aucune difficulté à me servir de
N’gasene/Senekela.
12. When using N’gasene/Senekela to access agricultural input
information, I had no difficulty implementing the information
that I got
En utilisant les N’gasene/Senekela pour accéder à l’information
sur les intrants agricoles, je n’ai aucune difficulté à mettre en œuvre
l’information que j’ai obtenue à travers l’utilisation de
N’gasene/Senekela.

187
Observability (Observabilité) 1 2 3 4 5
13. Other farmers seemed interested in
N’gasene/Senekela when they saw me using it
Certains agriculteurs/paysans en me voyant utiliser les
N’gasene/Senekela semblaient intéresser.
14. People can tell that I know more about access
and use of agricultural input information since I have used
N’gasene/Senekela
Des gens peuvent témoigner que je connais mieux l’accès et
l’utilisation des informations sur les intrants agricoles parce que j’ai
utilisé N’gasene/Senekela.
15. Other farmers using N’gasene/Senekela liked
using it, i.e. they found from satisfactory
D’autres agriculteurs/paysans utilisant N’gasene/Senekela, les
apprécient (Ils sont satisfait)
Social influence (for all the respondents) / Influence sociale (pour
tous les répondants)
1 2 3 4 5
16. My neighbours (village mates, friends) think I
should start using/keep using N’gasene/Senekela

188
Mes voisins (compagnon de village, les amis) pensent que je dois
commencer/continuer à utiliser N’gasene/Senekela.
17. My friends and parents use N’gasene/Senekela
Mes amis et parents utilisent N’gasene/Senekela
18. Using N’gasene/Senekela makes me feel higher
reputation than those who do not
Je sens que l’utilisation N’gasene/Senekela me confère un statut
particulier que les personnes qui ne les utilisent pas.
Information Quality / Qualité de l’information/
19. The information I got from N’gasene/Senekela
was complete, i.e. all the data necessary to meet the current
need for farm input information is provided by the ICTs and
correct for my need for information on agricultural input.
L’information que j’ai obtenue grâce a N’gasene/Senekela était
complète et exacte c’est-à-dire que toutes les données nécessaires pour
répondre aux besoins actuels d’information sur les intrants agricoles
sont fournies par N’gasene/Senekela et conforme à mes besoins
d’informations sur les intrants agricoles.

189
20. The information I got from N’gasene/Senekela
was relevant, i.e. the information is suitable for the current
need, and I got it when needed it.
L’information que j’ai obtenue grâce a N’gasene/Senekela
relative aux informations sur les intrants agricoles était pertinente
c’est-à-dire qu’elle était adaptée à mes besoins actuels je l’ai reçue au
moment opportun.
21. The information I got from N’gasene/Senekela
was appropriate i.e. in the suitable format (local language) and
quantity
L’information que j’ai obtenue grâce N’gasene/Senekela était
appropriée, c’est-à-dire qu’elle était présentée dans un format
convenable et en quantité satisfaisante
Section F: Endogenous variables (for those who have used ICTs to access and use
agricultural input information) / Variables endogènes

190
Use of N’gasene/Senekela (All the respondents) / Utilisation de
N’gasene/Senekela (Tous les répondants)./
1 2 3 4 5
22. I use/plan to use N’gasene/Senekela regularly
when preparing to plant my crops
J’utilise/j’envisage d’utiliser régulièrement N’gasene/Senekela
lorsque je me prépare à planter mes cultures.
23. I intend to use/continue to use N’gasene/Senekela
J’entends continuer à utiliser les N’gasene/Senekela
24. I recommend farmers to use N’gasene/Senekela
Je recommande aux agriculteurs/paysans d’utiliser
N’gasene/Senekela.
Increased adoption ofagricultural input information (For those
using ICT) / Adoption accrue des informations sur les intrants agricoles
(pour ceux qui ont utilisé les TIC pour accéder à l’information sur les
intrants agricoles et l’utiliser)/
1 2 3 4 5
25. Before I started using N’gasene/Senekela, I found
it difficult to access agricultural input information

191
Avant que je ne commence à utiliser N’gasene/Senekela, j’avais des
difficultés à accéder à l’information sur les intrants agricoles
26. Before I started using N’gasene/Senekela, I found
it difficult to use agricultural input information
Avant que je ne commence à utiliser les N’gasene/Senekela, j’avais
des difficultés à utiliser les informations sur les intrants agricoles
27. After I started using N’gasene/Senekela, I found it
easier to access agricultural input information and I have more
access to agricultural input information
Après que j’ai commencé à utiliser N’gasene/Senekela, il est devenu
plus facile pour moi d’accéder à l’information sur les intrants agricoles
et j’ai plus accès a ces dites informations.
28. After I started using N’gasene/Senekela, I found it
easier to use agricultural input information and I have improved
the use of agricultural input information
Après que j’ai commencé à utiliser les N’gasene/Senekela, il est
devenu plus facile pour moi d’utiliser les informations sur les intrants
agricoles et j’ai amélioré l’utilisation de ces dites informations.

192

193
APPENDIX 2. INSTRUMENT TRANSLATION AND PRE-TEST
REPORT
1. Introduction
Information and Communication Technology (ICT)8 has seen an exponential development in
the dissemination of information, especially in agriculture. Researchers have used many
instruments to gather data on the subject. These tools are based on some theories. The most
technology acceptance models are Technology Acceptance Model (TAM), Diffusion of
Innovation Theory (DOI) and the Unified Theory of Acceptance and Use of Technology (UTAUT)
(Woosley and Ashia, 2011). The data collection instrument (questionnaire) of these models
are in English. For other speaking languages especially French and Bambara9, these tools need
to be translated. There is an increasing demand for these tools to be brought from English to
other languages (Pan and de la Puente, 2005). Information on ICTs’ survey translation
methods or procedures is limited to the translation process from English to French and
Bambara. For instance, developing a guideline for translation from English to Spanish, a study
arguing that there is limited information on the translation procedure (Pan & de la Puente,
2005). Therefore, there is need to provide a method to translate ICTs’ survey instrument into
French and Bambara.
Factors affecting ICTs’ use in accessing and using agricultural input information in developing
countries was provided by researchers (Kante, Oboko and Chepken, 2016). The Diffusion of
Innovation Theory was the basis of our proposed model. We need to collect data in Sikasso,
Mali using the data collection instrument adapted from researchers (Ventkatesh et al., 2003;
Atkinson, 2007). Nevertheless, there two remaining questions: a) Can we propose a method
for translating this questionnaire into French and Bambara? b) What lessons have we learned?
The literature describes two approaches, which is adoption and adaptation to translate a
survey questionnaire. The adoption method is where the instrument to collect data is directly
translated from the source language to the targeted one regardless to the linguistic of cultural
nuances, which can impact the intended meaning of the question (Carrasco, 2003).
Adaptation, on the other hand, allows the contextualization of the instrument taking into
account the cultural deficiencies (Hoffmeyer-Zlotnik and Harkness, 2006). Adaptation admits
and answers for any differences that exist crosswise languages.
2. Materials and Method
We used the adaptation method following the guideline of the Census Bureau guidelines (Pan
and de la Puente, 2005). Using the adaptation, we modified or altered the components of the
survey question for contextualization of the instrument for fielding in French and Bambara.
The guidelines propose five steps in translating a questionnaire which is: Prepare, Translate,
Pre-test, Revise and Document (Pan and de la Puente, 2005). However, we modified the
8 By ICT, we mean Mobile phone and telecentres 9 Bambara is a language spoken in Mali.

194
guidelines to integrate some translating rules from TRAPD (Translation, Review, Adjudication,
Pre-testing and Documentation) (Harkness, 2000) and the model ASQ (Ask the Same Question
(Harkness, 2000; Presser et al., 2004).
2.1. Prepare
The translation process started by establishing the statement of work, documentation and
subject matter contact.
2.1.1 Statement of work
The purpose of this translation is to transfer the meaning of a questionnaire of fifty-one items
in English into French and Bambara. The translation has to preserve the meaning, style and
effect of the source text and at the same time respecting the sentence structure, vocabulary
and meaning values of French and Bambara languages.
2.1.2 Documentation:
We defined our keys terms to the translators:
ICT: This questionnaire refers to ICT as Information Communication Technology such as Mobile phone and telecentres.
Household head: A head of the household is an individual in one family setting who supplies actual support and maintenance to one or more people who are connected to him/her (Advameg, 2016). Domestic units are barely limited to the nuclear family in ‘collectivist societies’ that characterise most societies of developing countries. The household head will be someone who is leading the agricultural activities of the family and therefore using ICTs in this questionnaire. In other words, it is an informant.
Relative advantage: Relative advantage (or superiority) is the degree to which an innovation is perceived as being better than the idea it supersedes (Rogers, 1983), and is often expressed in this questionnaire regarding convenience and/ or satisfaction (Adegbidi et al., 2012).
Compatibility: It is the degree to which an innovation is perceived as consistent with the existing values, past experiences, and needs of potential adopters (Rogers, 1983).
Complexity/Simplicity: complexity is the degree to which an innovation is perceived as relatively easy to understand and use (Rogers, 1983).
Observability: Observability, also known as communicability, demonstrability or describability, is the degree to which results of an innovation are visible to others (Adegbidi et al., 2012).
Social Influence: It is defined as the degree to which an individual perceives that important others believe he or she should use the new system (Ventkatesh et al., 2003).
2.1.3: Subject-matter contact: Translators had access to one of the authors for further
explanation.
2.2. Translate

195
The committee or team approach has gained exposure in the literature for survey translation
(Harkness, 2000; Presser et al., 2004; Pan and de la Puente, 2005). We formed our translation
team constituted of two translators for each language. The two translators of each language
worked independently to produce the target language translation. The subject-matter contact
was the translation coordinator for each one of the languages. The translators documented
their work so that we could see their specific challenges and their decisions to deal with these
difficulties. The two translators and the coordinator reviewed the translation together. Where
the translator identified a problem, the coordinator suggested a solution and the three could
agree on it or reject it. A first document was then accepted for each language.
2.3 Pre-test:
The widely pretesting technique cognitive interview applies for the pre-test of translated
language data collection instrument (Pan and de la Puente, 2005). Cognitive interviews are
structured, open-ended interviews, designed to gather detailed information about the
cognitive thought processes respondents use to understand and answer survey questionnaire
(Presser et al., 2004). We produced an English language cognitive interview. One respondent,
skilled in the field of ICT4D (ICT for Development) studies were selected for each language.
He/she was asked to describe the way he/she comprehended particular question and answer
to see if he had difficulty in recalling.
2.4 Revise
With the cognitive interview pre-test, we revised the first document to get a new one. That
was the second paper for each targeted language.
2.5 Document
We described all of these steps in the document. A document was produced by each one of
the translators, the team coordinator. The minutes of the meetings were also documented.
3. Results
This process led us to produce a questionnaire that could be filled by an English speaker, a
French or a Bambara speaker. Our translation process provided some lessons (Table 1).
Table I: Lessons from the translation process
Language Translation errors Cultural issues General problems
French We had to decide between two or three French words for one English word. The choice was based on the results of our cognitive interview. For instance, the English word ‘can’ could be translated into French as “can” or “know”. We chose can as “can” in some items and “know” in some others based on
Issues related to differences in cultural viewpoint were infrequent. Only one item made an exception. The item was “Using ICT on agricultural
The biggest problem came out with choice of “article” such as “the”, “a”; “determiner/pronoun” such as “this”, “those”. We used the grammar and vocabulary as well as the cognitive interview

196
the results of the cognitive interview.
The sentence structure was also an issue during the process. The sentence was constructed in such a way that it was free of spelling and grammatical errors. Doing so, ten items structure was changed but with the same meaning.
input information makes me feel higher in reputation than those who do not use it”. That was not appropriate for the Malian culture. So, we changed it “I feel that using ICT on agricultural input information gives me a particular status than those who do not use it”.
to decide which word to use.
Bambara (NKO)
The main issue was that the English or even French “word(s)” does not have their equivalent in Bambara. For instance, the abbreviation “ICT” is very hard to translate in Bambara; we, therefore, decided to use the name of the ICT services in the area as ICT. Thereby, “Senekela” or “Ngasene” meant ICT on agricultural input information as these are the only ICTs operating in the area.
As the writing system strongly differs from English or French, the sentence construction also was different. That made all the items sentence structure to change but giving out the meaning intended by the sentence.
The cultural viewpoints were frequent in Bambara. While the future tense appeared in an item, we had to add “By God/Allah willing. For instance, the item 46 in English was “I intend to use/continue to use ICT on agricultural input information”, and in Bambara, we added, “By Allah’s willing, I intend to use/continue to use ICT on
The general issue once again was how to translate the “articles” or “determinant”. There is no “article” in NKO used to write the Bambara language in this instrument. The “noun” is divided into two parts, and one of it is the “article” (Davydov, 2005).
The main issue coming out from the translators was related to the tense. We adopted wherever needed, the advice from the coordinator.

197
agricultural input information”.
4. Discussion and Conclusion
We believe that our methods for translating English survey instrument on ICTs into French and
Bambara formed an effective translation. It proposed five steps that are Prepare, Translate,
Pre-test, Revise and Document. The method was different to that of another research (Forsyth
et al., 2006b). Although, the cognitive interview and reviews were similar to that research. We
have improved the guidelines of the Census Bureau Guidelines (Pan and de la Puente, 2005)
by integrating into it the method ASQ (Ask the Same Question (Harkness, 2000) and the TRAPD
(Translation, Review, Adjudication, Pre-testing and Documentation) method (Harkness, 2000).
Our translated instrument in Bambara is one of the rare translated survey instrument on ICTs.
We learned that ICTs’ survey instruments translation should be done regarding the culture of
the target population language. Also, due to the absence of some terms in local languages, the
term ICT can be replaced by the name of an ICT’s service in the area. We are currently
conducting research in Mali with this instrument. A further line of inquiry could be to test the
method or to modify it taking into account some cultural viewpoints of others local languages.
Acknowledgement
We would like to thank the translation teams and respondents of the cognitive interviews. We
also thank Adama Coulibaly for his assessment of the translation.

198
APPENDIX 3. PILOT STUDY REPORT
1. Introduction
Agriculture constitutes the backbone of the economy of developing countries. For instance, it
was argued that agriculture is the mainstay of the economy of Ethiopia (Bwalya, Asenso-
Okyere and Tefera, 2012), Mali (Angelucci et al., 2013) and Tanzania (Siyao, 2012).
Small-scale farmers dominate the agricultural activities in developing countries. Small-scale
farmers dominate for instance the Tanzanian agriculture (Siyao, 2012). In addition, in Mali, the
agriculture sector is dominated by small family farms (68%) (Angelucci et al., 2013). Moreover,
in Ethiopia, in the year 2010/11, over 96 percent of cereals were produced by smallholder
farmers (Bwalya, Asenso-Okyere and Tefera, 2012).
Cereals constitute the main food item in these countries. For instance, in Mali, cereals
constitute the main part of the agricultural production (millet 41%, maize and rice 15%,
sorghum 26%, fonio 3%) which occupy 72% of the total agricultural area (Aparisi and Balie,
2013). It is a defining economic activity for the majority living in the countryside, with small-
scale farming dominating production (Aparisi and Balie, 2013). Cereal crops are essential for
food security in Africa (developing countries (Murage et al., 2013).
Nevertheless, these agricultural activities are marked by low productivity ((IFDC, 2004)-
(Products, 2014)-(AGRA, 2014)). Agricultural inputs such as seeds, fertiliser and advice are
essential to increase yields and hence production.
Durable agricultural intensification cannot be achieved without a greater adoption of
appropriate (agricultural) inputs, which permit the growth of the yield (IFDC, 2004). That was
also confirmed by another researcher (Kinyangi, 2014) who argued that the use of agricultural
technologies (farm inputs) affect the rate of increase in agricultural output. In general, farmers
could realise higher yields if they access and use agricultural inputs.
Agricultural inputs access and use depend largely on the availability of information. For
instance, in Tanzania, farmers’ decision to adopt input is greatly influenced by the amount of
information that is available (Msoffe and Ngulube, 2016). Moreover, the experience of some
of the rapidly growing economies such as China has shown that improvement in information
services was one of the strategies used to achieve agricultural transformation (Siyao, 2012).
Therefore, ICTs have a determinant role in the dissemination of agricultural input information.
Moreover, well-informed farmers make wise decisions, which in turn are responsible for
improving agricultural productivity.
1.1. Background Information
ICT on Agricultural Input Information (AII) is any ICT resource that allows farmers to access,
send and utilise information on agricultural inputs. Agricultural input information is on crop
planning (identify the best time to plant, higher yield crops information), buying seeds (seed
diverseness, the source of inputs), planting (use better fertiliser, apply better techniques)
(Aker, 2011).

199
The most dominantly used ICT channel to get access to agricultural information in Mali and
elsewhere is the mobile phone. The mobile phone was introduced in Mali in the 1990s with
only one telecom operator. The use of mobile telephone has grown since then regarding a
number of network providers, coverage, subscriptions and services offered. For instance, in
1999, there were 6,375 mobile phone subscribers, 4.5 million subscribers in 2009 and 10.3
million in 2014 (Issa FOFANA, 2010; GSMA, 2015).
ICT services on a mobile phone for farmers started in 2013. Orange Mali (telecom operator)
launched the ICT Value Added Service (VAS) Senekela in 2014 in the region of Sikasso. Myagro
(N’gasene), another ICT service for farmers started to disseminate information on agricultural
input for farmers in 2011. The service is concentrated in the region of Sikasso. These are the
two ICT services disseminating agricultural input information in Mali towards cereal
producers.
Senekela relies on a call-centre with agronomists who advise the farmers – in French and
Bambara (A local language) – on all their daily questions in the agricultural domain including
planting methods, the seeds to use, sowing time and application of fertilisers. The service had
180,000 customers in 2014 (GSMA, 2015).
Myagro enables farmers to purchase high-quality agricultural inputs (certified seeds
and fertiliser) on layaway (agreement in which the seller reserves an item for a consumer until
the consumer completes all the payments necessary to pay for that item) through an SMS-
based platform and a network of local vendors. It helps farmers to get information that would
increase their crop yields by using modern planting techniques and providing access to simple
agricultural machines that can make their work more efficient and effective and eventually
enhance their profitability. The service started with approximately 3,500 customers. It has
reached over 18,000 customers by the year 2016.
1.2. Study Objectives
The main aim of this study was to propose an ICTs model for cereal farmers in accessing and
using agricultural input information in developing countries.
The specifics objectives are:
a. To validate the survey instrument;
b. To establish the model predictability.
1.3. Literature review
ICTs have been set up in developing countries such as India, Indonesia, Pakistan, China,
Tanzania, Uganda, Zambia, Uganda, Benin, Nigeria, Burkina Faso and Mali (Kante, Oboko and
Chepken, 2016) to disseminate agricultural input information. Therefore, farmers have been
exposed to ICT on agricultural input information.
In spite the availability of diverse communication channels, access and use of agricultural input
information services. For instance, the main challenge faced by many (cereal) farmers in Mali
is access to selected seeds and fertilisers (de la Rive Box et al., 2015). In addition, KTM (2013)
concluded that in Kenya, still, an improvement is necessary since a large number of

200
smallholder farmers (3.5 million) work without basic farm inputs. Moreover, in Tanzania, ICTs
have not benefited the agricultural sector (Wulystan and Andrew, 2013).
Previous studies ((AGRA, 2014)-(Aker, 2011)-(Msoffe and Ngulube, 2016)-(Rezaei-
Moghaddam and Salehi, 2010)-(Sanga, Kalungwizi and Msuya, 2013)) concur that ICTs
contribution to access and use of agricultural (input) information would be applicable to
farmers in developing countries only if certain conditions were met. Without addressing these
conditions (factors) and finding the way to overcome them, there will be less use of ICTs to
access and use information on agricultural inputs. Therefore, farmers will not adopt
agricultural inputs resulting in a low productivity.
In conclusion, though efforts have been made to apply ICTs in the farm input information
sector, the contribution of ICTs to the access and use of agricultural input information is far
from expectation. It was emphasised that ICTs have not yet been able to create an impact as
expected (Mittal and Mehar, 2012). An investigation needs to be conducted into these factors
affecting farmers’ access and use of agricultural inputs and their relationships (hence a model)
to inform the design and delivery of this information service to small-scale cereal growers.
Studies picked out that the perception of ICTs by farmers influence their use of ICTs. For
instance, in Kenya, it was emphasised that farmers found the access to production information
via mobile phone complicated (Odhiambo, 2014). In Tanzania, a study noticed that the use of
agricultural value added service (VAS) known as Tigo Kilimo10 was difficult for farmers (Chung,
2015). The same observation was made in Mali (Palmer, 2014). Finally, in Benin, researchers
conclude that the use of ICT needs positive attitude from the actors (Adegbidi et al., 2012).
Therefore, farmers’ perception of ICTs is a factor in the use of ICT on agricultural input
information and this study will identify its effects on the use of ICT on agricultural input
information.
Farmers are known to share information among themselves. Previous studies have highlighted
that fact. For instance, it was argued that the primary sources of information for farmers were
predominantly local (neighbours, friends and family) (Lwoga, 2010). Therefore, the interaction
among farmers affects ICTs’ use.
The content delivered to farmers is important to them. For instance, it was reported that
farmers voiced the need to improve the quality, reliability and timeliness of the information
delivered to them (Mittal and Mehar, 2012). Information is seen as a valuable and useful tool
to people in their attempts to cope with life, but the value of information depends on many
conditions including accessibility, relevance, accuracy and currency ((Chilimo and Sanga,
2006)-(Heeks and Alemayehu Molla, 2009)). Therefore, it is important for information
providers to ensure that they disseminate information that satisfies farmers’ need and is
appropriate to their farming practices (Msoffe and Ngulube, 2016). A farmer who is satisfied
with information will keep using ICTs to get information on agricultural inputs, thus leading to
an adoption or use of agricultural inputs.
1.3.1. Farmers’ Perception
10 Tigo Kilimo is an ICTs’ service in Tanzania that disseminates agricultural (input) information

201
ICTs’ use depends on the perceptions of the user. It was highlighted by many studies on ICTs
adoption/use in different fields such as education (Jorge et al., 2003), health (Atkinson, 2007),
agriculture (Kameswari, Kishore and Gupta, 2011), e-government (Carter and Belanger, 2004)
and others.
The perceived attitudes (relative advantage, simplicity, observability, compatibility and
trialability) are critical in the adoption and use of ICTs/Innovation(Rogers, 1983). However, it
was emphasised that compatibility, relative advantage and complexity are the most perceived
construct in the use of ICTs (Carter and Belanger, 2004). Moreover, conducting a literature
review on ICT on Agricultural Input Information (AII) in developing countries over the last 15
years, researchers found empirical evidence of these factors as affecting the use of ICTs on AII
(Kante, Oboko and Chepken, 2016). We hypothesise that:
H1. Relative advantage has a positive effect on the use of ICTs on AII.
H2. Compatibility has a positive effect on the use of ICTs on AII
H3. Simplicity has a positive effect on the use of ICTs AII.
1.3.2. Farmers’ Influence on Each Other
Any community is composed of people who interact on a regular basis around a common set
of issues, interests or needs (Benard, 2013). That was also emphasised by other researchers
whose findings conclude that 67% of farmers found families, friends and neighbours’
information very effective (Lwoga, Stilwell and Ngulube, 2011). Therefore, sharing of
information accessed through ICTs is a major key to the success of that source (ICT) of
information.
A study on ICTs service (Senekela) in Mali observed that almost all users interviewed in the
field said that other farmers come to them every month for farming advice (Palmer, 2015).
This finding means that the information seekers were satisfied with the information given to
them by their fellow Senekela’ users. Satisfaction of farmers has an impact on information
usage, for the reason that farmers who are satisfied with the information are likely to use it
(Msoffe and Ngulube, 2016) or keep using it. The non-ICT users would try to get the
information directly from the source, which is ICTs. Therefore, farmers influence each other in
the use of ICT on agricultural input information.
This influence is among the community. Repeat users are influential in their communities,
providing advice to other farmers (Palmer, 2015). That can be interpreted as the way the
influential ICT users can describe (Observability) their results achieved to other farmers.
Thereby, the non-users get knowledge on this ICT and its visible results (Observability). It can
also be interpreted as the community pressure (Social Influence) on non-users to use ICT. We
conclude that there is a relation between the observability, social influence and the use of ICT
on agricultural input information. Thus, this study postulates that:
H4. Observability has a positive effect on the use of ICTs on AII
H5. Social influence has a positive effect on the use of ICTs on AII.
1.3.3. Cost

202
The high cost of ICTs’ services constitutes a barrier to its use on agricultural input information.
For instance in Tanzania, the cost of mobile phone services is a barrier for many farmers in
using these services (Chung, 2015). In Mali, 95% of Senekela users find that the cost is
prohibitive (Palmer, 2014). Moreover, in Tanzania, the cost was a barrier to the uptake of ICTs
on agricultural input by farmers (Barakabitze et al., 2015). We, therefore, conclude that the
high cost is a barrier to the use of ICTs in agricultural input information context.
On the other hand, other studies argued the cost or transaction cost is positively related to
the use of ICT. That was observed in Niger (Aker, 2008), Sri Lanka (Dissanayeke, 2014).
However, it is necessary that a working definition of transaction cost is specified (Silva, 2008).
In our context, we referred to the cost of the search, access and use of information on
agricultural inputs. In addition, we argued that:
H6. Cost has a negative effect on the use of ICTs on AII
1.3.4. Information Quality
There are some characteristics related to the agricultural input information quality affecting
its use. For instance, in Uganda, it was argued that the value of information depend on many
characteristics including accessibility, relevance, accuracy and currency (Kaddu, 2011). In
addition, in a study on ICT for development in developing countries, it was argued that the
participants say that for information to be useful or valuable, it needs to be timely,
understandable, directed, from a trusted source, inclusive and non-subversive (Beardon et al.,
2005). Moreover, in Mali, it was reported that participants in the case study on Senekela
revealed that the agronomy and market price advisory provided by Sènèkèla might not meet
all of their information needs (GSMA, 2015). Therefore, some characteristics are affecting the
use of information accessed through ICTs. They need to be established and to identify their
effect on ICTs’ use. This study argues that:
H7. Information quality has a positive effect on the use of ICTs on AII
1.3.5. Literacy and ICT Skills
The adoption of Innovations in agriculture is linked to an appropriate level of education (Simin
and Janković, 2014). In addition, it was argued that educational deficiencies negatively affect
a broader adoption of IT (Garcia-Murillo, 2003). Moreover, the adopter of new technology has
an appropriate level of education (Al-Ghaith, Sanzogni and Sandhu, 2010).
A moderating variable is an anteceding common direct or indirect cause of two variables
further down in the causal model (Saunders, Lewis and Thornhill, 2009). We summarise the
expecting contributions of the moderating effects Literacy (education) and ICT Skills.
H3a: ICT Skills moderates the positive effect of simplicity on use of ICTs AII.
H3b: Literacy moderates the positive effect of simplicity on use of ICTs on AII
H4a: Literacy moderates the positive effect of observability on use of ICTs on AII
H7a: ICT Skills moderates the positive effect of information quality on use of ICTs on AII
H7b: Literacy moderates the positive effect of information quality on use of ICTs on AII

203
1.4 Research Conceptual Model
Using the factors that affect AII, this study aimed to propose a model for ICTs’ contribution to
the access and use of agricultural input information. Technology Acceptance Model (TAM),
Diffusion of Innovation Theory (DOI) and the Unified Theory of Acceptance and Use of
Technology (UTAUT) are the three most popular contemporary technology acceptance models
(Woosley and Ashia, 2011). TAM needs to be expanded to include social and human factors
(Li, 2010). UTAUT is a well-meaning and thoughtful presentation, but that it presents a model
with 41 independent variables for predicting intentions and at least eight independent
variables for predicting behaviour, and that it contributed to the study of technology adoption
“reaching a stage of chaos” (Bagozzi, 2007).
Due to these drawbacks of TAM and UTAUT, we chose to rely on the Diffusion of Innovation
Theory (DOI). It attempts to predict the behaviour of individuals and social groups in the
process of adoption (use) of innovation, considering their characteristics, social relations, time
factor and the features of the innovation (Simin and Janković, 2014). It has been applied in
different field such as agriculture, health and education in developing countries. The DOI has
five characteristics which determine the rate of adoption: relative advantage, compatibility,
complexity, trialability and observability (Rogers, 1983). However, the Relative Advantage,
Compatibility, and Complexity are the most relevant constructs to adoption research (Carter
and Belanger, 2004). The observability was found to be an important factor in this context.
Thus we included it.
The DOI does not have the constructs Information Quality, Cost or Social Influence that were
supported empirically. We relied on the DIKDAR model (Heeks and Alemayehu Molla, 2009)
to extract the constructs Information Quality and Cost; on the UTAUT (Ventkatesh et al., 2003)
to remove the construct Social Influence; on the Theory of Knowledge (Foucault, 1977) to
remove the construct power. The Theory of Knowledge argues that whoever has the
information will have the power. In our case, we assume that well-informed farmers will use
agricultural inputs, which will result in better productivity. Therefore, we used Power as
Contribution in the access and use of AII.

204
Fig. 1. Research Conceptual Framework
2. Materials and Methods
This section describes the study’s methodology. The research was conducted through quantitative
methods. Information Systems (IS) research is classified as positivism if there was evidence of formal
propositions, quantifiable measures of variables, hypothesis testing, and the drawing of inferences
about a phenomenon from the sample to a stated population (Michael D Myers and David Avison,
1997). Thus, we adopted a positivist paradigm.
The study was exploratory with a cross-sectional survey strategy.
2.1. Model Construction and Instrument Development
A model is a set of propositions or statements expressing relationships among constructs (March and
Smith, 1995). It has two inter-models: The measurement model that answers the question how to
measure a construct and the structural model that deals with the relationship between these
constructs.
We conducted and published a literature review (Kante, Oboko and Chepken, 2016).
The model construction and instrument development require the development of the structural
model, the measurement model, survey instrument and a pre-tests/pilot-study (Urbach and
Ahlemann, 2010). After establishing empirical evidence of our constructs, we established their
theoretical evidence (see conceptual framework).
An initial survey instrument was adapted from researchers ((Atkinson, 2007)-(Ventkatesh et al.,
2003)) to refer to ICT on agricultural input information. More than three items for each construct
were proposed on a 5-point Likert scale arranging from strongly agree to disagree strongly.
In addition, we conducted a pre-test of our instrument to get empirical feedback with five researchers
grounded in the field of ICT4D. It consisted of cognitive interview. Each one of the respondents was
asked to describe how he/she understood particular question and response to see if he/she had
difficulty in recalling. The Pre-test allows the researcher to receive empirical feedback from a

205
controlled sample (Urbach and Ahlemann, 2010). An instrument of thirty-six items was validated
during this phase.
2.2. Data Source
We purposively selected the village of Lobougoula in the district of Sikasso, Mali from the five villages
in which we were supposed to conduct the next phase of the study. It was argued that a sample size
larger than 30 was enough for testing a model using PLS-SEM (Hair, Ringle and Sarstedt, 2011). A
stratified systematic sampling, which is a combination of stratified sampling and systematic sampling,
was used to select 40 respondents (cereal farmers), which was above the minimum sample size.
Stratified random sampling is a modification of random sampling in which you divide the population
into two or more relevant and significant strata based on one or some attributes (Saunders, Lewis
and Thornhill, 2009). It is suitable for all sizes and accurate.
Systematic sampling is a probability sampling procedure in which the initial sampling point is selected
at random, and then the cases are chosen at regular intervals (Saunders, Lewis and Thornhill, 2009).
This sampling was applied to the cereal farmers’ respondent to get the sampling fraction. We divided
the sample size by the total of households (999) (RGPH, 2013) in the village. Our sampling fraction
(guide) is approximately 1/25. The respondent was the head of the household (someone who is aware
of the agricultural activities and use of the ICTs). We replaced the phrase ‘ICTs on AII’ by
‘Ngasene/Senekela’ as Ngasene/Senekela are the ICTs services in Sikasso on AII.
2.3. Data Analysis
The data entered into SPSS V20 for descriptive analysis and data management. The data was then
taken from SPSS to SMARTPLS 3.2.4 for the model assessment.
2.3.1. Partial Least Square Structural Equation Modelling (PLS-SEM)
Structural Equation Modelling (SEM) techniques are second generation data analysis methods highly
recommended and used IS research (Gefen, Straub and Boudreau, 2000). Contrary to the first
generation statistical tools such as regression, SEM enables researchers to answer a set of the
interrelated research question in a: a) single, b) systematic, and comprehensive analysis by modelling
the relationship between multiple independent and dependent constructs simultaneously. This
capability for simultaneous analysis differs greatly from most first generation regression models such
as linear regression, LOGIT, ANOVA, and MANOVA, which can analyse only one layer of linkages
between independent and dependent variables at a time (Gefen, Straub and Boudreau, 2000).
There are two major techniques in SEM. The Partial Least Squares (PLS) and linear structural relations
(LISREL) known as covariance based (CB). CB-SEM requires a sound theory base and confirmatory
research while PLS does not need a sound theory base and support a confirmatory or exploratory
research. Information System research is the main user of the PLS technique for estimating structural
equation models (Evermann and Tate, 2014).
We selected PLS-SEM as the art for analysing our data. It was argued that PLS had been accepted as
an important statistical method in the MIS (Management Information System field (Evermann and
Tate, 2014). PLS should be favoured for small-sample research (Evermann and Tate, 2010) in
Information system research.

206
It is important first to understand the vocabulary in PLS-SEM. The structural model of PLS-SEM has
two types of latent variables (Wong, 2014). There are two models in PLS-SEM. The measurement
model of the outer model and the inner model or structural model. The outer model gives an
overview of how the constructs are measured. The inner model deals with the relationship between
the constructs.
The inner model also has two types of variables: Exogenous and Endogenous. An exogenous latent
variable is an LV that is not the effect of any other latent variable in the model (there are no incoming
arrows from other latent variables). An endogenous latent variable it is an LV that is an effect of at
least one other latent variable (Garson, 2016). In our case, we have only two endogenous latent
variables (Use of ICTs on agricultural inputs information and Contribution to the access and use of
agricultural inputs information). As no other variables predict the other latent variables, they are
exogenous latent variables. PLS-SEM has six steps (Urbach and Ahlemann, 2010) like SEM (Kline,
2013). These steps are slightly different. We adopted the steps of PLS-SEM by a study (Urbach and
Ahlemann, 2010): a) problem definition and research design; b) theoretical foundation; c) model
construction and instrument development; d) data collection; e) model validation and f)
interpretation.
2.3.2. Survey Instrument Validation
The instrument is validated when the measurement model is established. PLS-SEM algorithm was
run, and the results such as convergent validity and discriminant validity were reported.
The type of reliability coefficient reported most often in the literature is coefficient alpha also
called Cronbach’s alpha (Kline, 2013). This statistic measures internal consistency reliability, the
degree to which responses are consistent across the items within a measure. It varies between 0.4 to
0.7 for exploratory study (Urbach and Ahlemann, 2010). We also measured the extent to which a
given construct is different from other constructs also known as discriminant validity in PLS-SEM. Each
construct AVE (Average Variance construct) should be larger than its correlation with other
constructs, and each item should load more highly on its assigned construct than on the other
constructs (Gefen, Straub and Boudreau, 2000).
The discriminant validity measures the extent to which constructs differ from each other. Many
methods have been used to assess the discriminant validity. In PLS-SEM, methods such AVE of Fornell-
Larcker, Cross-loading, Heterotrait-Monotrait Ratio (HTMT) are used to evaluate the discriminant
validity (Garson, 2016). Although testing of cross-loadings and use of the Fornell-Larcker criterion are
accepted methods for evaluating the discriminant validity of a PLS model, they have deficiencies
(Garson, 2016). Simulation studies demonstrated that the heterotrait-monotrait (HTMT) detect
better the lack of discriminant validity than that criterion (Henseler, Ringle and Sarstedt, 2014).
Moreover, in Information System research, it was argued that Discriminant validity should be
assessed by the Heterotrait-Monotrait Ratio (HTMT) (Henseler, Hubona and Ash, 2016).
The recommended threshold for a well-fitted model is an HTMT ratio below 1.0 (Garson, 2016),
0.90 or 0.80 (Henseler, Ringle and Sarstedt, 2014).
2.2.3. Structural Model
The model’s quality evaluation is based on its capability to anticipate the endogenous constructs.
Some criteria can be used in the assessment: Coefficient of determination (R2) (Urbach and

207
Ahlemann, 2010), predictive relevance (Q2) (Evermann and Tate, 2014), and path coefficients
(Garson, 2016).
As stated, this is an exploratory study. PLS path modelling can be used both for explanatory and
predictive research. Depending on the analyst’s aim – either explanation or prediction – the model
assessment will be different. If the analyst seeks to predict, the assessment should focus on
blindfolding and the model’s performance on holdout samples (Evermann and Tate, 2014).
It was argued that while in traditional regression models the R2 proportion of explained variance is
an indicator of the predictive strength of the model, researchers have recently advocated the use of
blindfolding for assessing the predictive strength of structural equation models (Evermann and Tate,
2014).
In IS research, it is recommended to use redundancy-based blindfolding to evaluate the predictive
relevance of one's “theoretical/structural model” (p. 680) and suggests that a value of Q2 > 0.5 is
indicative of a predictive model (Evermann and Tate, 2012). Hence, this pilot study assessed the
structural model validity by the predictive relevance.
3. Results and Discussion
This section describes and discusses the results.
3.1. Descriptive Statistics
The data were entered into MS Excel. It was compared to completed data files for entry errors. We
exported a copy of the entered data to SPSS V20 for manipulation and descriptive analyses. Data
screening showed that there were no incorrect data but missing values. There were 25 missing data
distributed throughout the nine variables. We replaced those missing data by the method of mean
replacement whereby missing score are replaced with the overall sample mean. This method is the
most basic when dealing with missing data in Structural Equation Modelling (Kline, 2013).
Table 1. ICTs’ use distribution ICTs’ use Total
Yes No
Gender Male
20 10 30
Female 0 0 0
Age < 18 1 0 1
18-40 6 5 11
> 40 13 5 18
Table 1 summarises the ICTs’ use distribution. All of the respondents were men. That should not mean
that women do not use ICT in the village. It is explained by the fact that we were targeting household
head and men were mainly the head of the household. This is highlighted by another study, which
argues that 86.9% of the household head in a rural area in Mali are men (Traore et al., 2012). We also
noticed that the respondents above 40 years old were the majority in the use of ICT. The explanation
is that most of the household head were above that age. The skills distribution is showed in Table 2.
Table 2. Skills’ distribution
Skills Respondents
Frequency Percentage
Literacy Able to read and write alphabet letters and
numbers
26 86.67%

208
Able to write a personal letter or a brief
description of an event
10 33.33%
Fill out a form 6 20%
Mobile phone’s skills
Write an SMS 10 33.33%
Call and follow up instruction given by a customer care centre
23 76.67%
Take a picture or download a video
20 66.67%
Table 3. Descriptive statistics of the variables
Items (indicators) Mean Std.
deviation Skewness
Std. Error
.524
Kurtosis
Std.
Error 1.014
C1. The transaction cost such as airtime, bundles for Ngasene/Senekela services are not
expensive 2,33 1,807 -,086 -1,312
44. C2. I use Ngasene/Senekela because the service is cheaper 2,13 1,525 -,552 -1,416
45. C3. Getting AII through other means is expensive than using Ngasene/Senekela 2,10 1,470 -,602 -1,305
2. RA1. Ngasene/Senekela are better than using books or newspaper to get AII 1,33 1,061 ,192 -,343
2. RA2. Ngasene/Senekela are more interesting than another source of information that I
have used to get AII
1,40 1,037 -,310 -1,276
3. RA3. Using Ngasene/Senekela contributed to the access and use of AII than it would be
possible without the ICTs for me
1,30 1,088 ,210 -1,231
2. RA4. I had more access and use of AII because of using Ngasene/Senekela 1,40 1,070 -,174 -1,312
2. RA5. Ngasene/Senekela made it easier to get AII 1,43 1,194 -,026 -1,556
2. CA1. Ngasene/Senekela is suitable to the way I like to get information to the access and
use of AII
1,43 1,278 ,690 ,336
2. CA2. I think other farmers should use ICTs to access/use AII 1,33 1,093 ,289 -,461
2. CA3. Using Ngasene/Senekela made what I was doing about AII seem more relevant 1,37 1,066 ,099 -,413
2. CA4. Ngasene/Senekela helped me to have more access and use of AII 1,53 1,167 -,086 -,907
2. SIMP1. When using Ngasene/Senekela, I had no difficulty finding the information that I
wanted
2,30 1,841 -,191 -1,601

209
2. SIMP2. I had no difficulty understanding how to get around in Ngasene/Senekela 2,13 1,737 -,092 -1,427
2. SIMP3. I had no difficulty understanding how Ngasene/Senekela technically worked 2,60 2,111 -,208 -1,729
2. SIMP4. When using ICTs to access AII, I had no difficulty implementing the information that
I got
1,63 1,377 ,042 -1,419
2. Ob1. Other farmers seemed interested in Ngasene/Senekela when they saw me using it 1,30 1,119 ,146 -1,374
2. Ob2. People can tell that I know more about access and use of AII since I have used
Ngasene/Senekela
1,23 1,006 -,070 -1,388
2. Ob3. Other farmers using Ngasene/Senekela liked using them i.e. they found from
satisfactory
1,17 ,986 ,107 -1,249
2. Ob4. I would have no difficulty in telling friends what Ngasene/Senekela are to make them
understand the ICTs
1,13 ,973 ,198 -1,142
2. Ob5. I would have no difficulty in telling others the way using Ngasene/Senekela improved
my access and use of AII
1,13 1,008 ,366 -,977
2. Ob6. After telling my friend about Ngasene/Senekela, he/she seemed to like using
Ngasene/Senekela
1,60 1,329 -,136 -1,810
2. SI1. My neighbours (village mates. friends) think I should start using/keep using
Ngasene/Senekela
1,46 ,669 1,253 ,504
2. SI2. My friends and parents use Ngasene/Senekela 2,21 ,760 ,617 ,672
2. SI3. Using Ngasene/Senekela makes me/will make me feel higher reputation than those
who do not
3,66 1,267 -,811 -,131
3. IQ1. The information I got from ICTs AII was complete 1,43 1,194 ,234 -,989
4. IQ2. The information I got from Ngasene/Senekela was accurate 1,10 1,029 ,602 -,686
IQ3. The information I got from Ngasene/Senekela was relevant 1,40 1,221 ,249 -1,078
5. IQ4. The information I got from Ngasene/Senekela was timeliness 1,43 1,357 ,728 ,077
6. IQ5. The information I got from Ngasene/Senekela was appropriate 1,43 1,357 ,550 -,865
2. Use1. I use Ngasene/Senekela regularly when preparing to plant my crops 1,31 1,105 ,008 -1,434
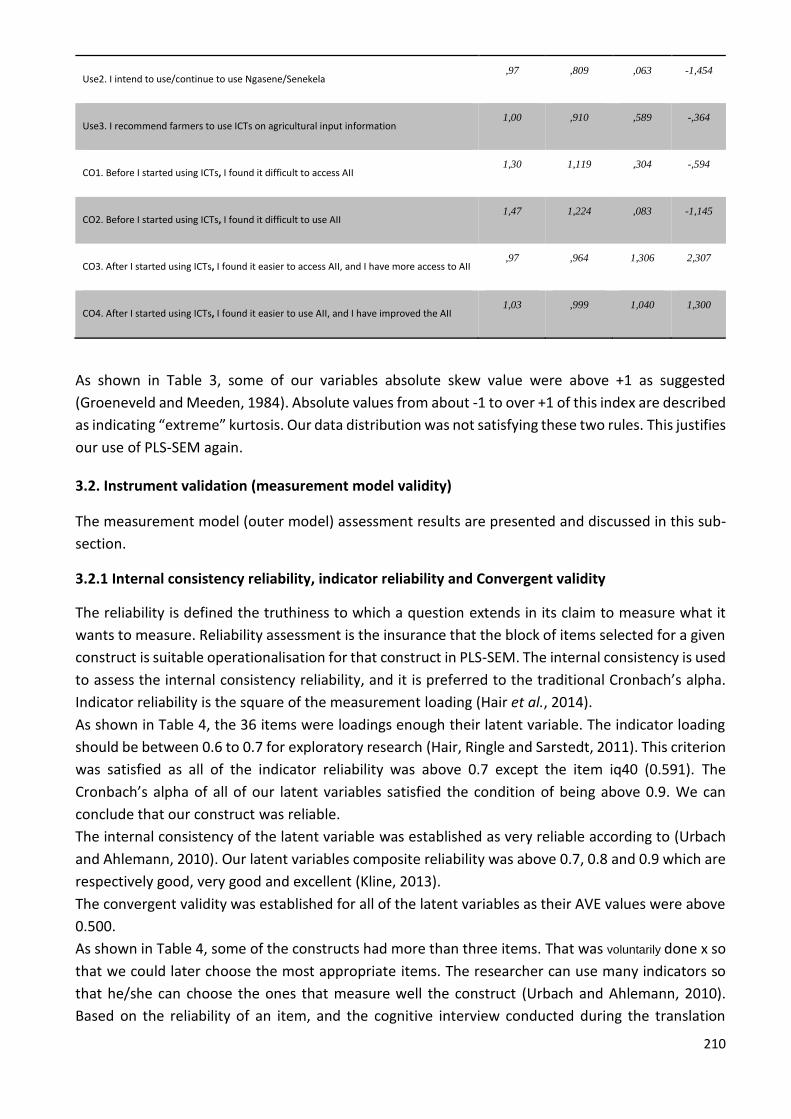
210
Use2. I intend to use/continue to use Ngasene/Senekela ,97 ,809 ,063 -1,454
2. Use3. I recommend farmers to use ICTs on agricultural input information 1,00 ,910 ,589 -,364
2. CO1. Before I started using ICTs, I found it difficult to access AII 1,30 1,119 ,304 -,594
2. CO2. Before I started using ICTs, I found it difficult to use AII 1,47 1,224 ,083 -1,145
2. CO3. After I started using ICTs, I found it easier to access AII, and I have more access to AII ,97 ,964 1,306 2,307
CO4. After I started using ICTs, I found it easier to use AII, and I have improved the AII 1,03 ,999 1,040 1,300
As shown in Table 3, some of our variables absolute skew value were above +1 as suggested
(Groeneveld and Meeden, 1984). Absolute values from about -1 to over +1 of this index are described
as indicating “extreme” kurtosis. Our data distribution was not satisfying these two rules. This justifies
our use of PLS-SEM again.
3.2. Instrument validation (measurement model validity)
The measurement model (outer model) assessment results are presented and discussed in this sub-
section.
3.2.1 Internal consistency reliability, indicator reliability and Convergent validity
The reliability is defined the truthiness to which a question extends in its claim to measure what it
wants to measure. Reliability assessment is the insurance that the block of items selected for a given
construct is suitable operationalisation for that construct in PLS-SEM. The internal consistency is used
to assess the internal consistency reliability, and it is preferred to the traditional Cronbach’s alpha.
Indicator reliability is the square of the measurement loading (Hair et al., 2014).
As shown in Table 4, the 36 items were loadings enough their latent variable. The indicator loading
should be between 0.6 to 0.7 for exploratory research (Hair, Ringle and Sarstedt, 2011). This criterion
was satisfied as all of the indicator reliability was above 0.7 except the item iq40 (0.591). The
Cronbach’s alpha of all of our latent variables satisfied the condition of being above 0.9. We can
conclude that our construct was reliable.
The internal consistency of the latent variable was established as very reliable according to (Urbach
and Ahlemann, 2010). Our latent variables composite reliability was above 0.7, 0.8 and 0.9 which are
respectively good, very good and excellent (Kline, 2013).
The convergent validity was established for all of the latent variables as their AVE values were above
0.500.
As shown in Table 4, some of the constructs had more than three items. That was voluntarily done x so
that we could later choose the most appropriate items. The researcher can use many indicators so
that he/she can choose the ones that measure well the construct (Urbach and Ahlemann, 2010).
Based on the reliability of an item, and the cognitive interview conducted during the translation

211
process of the instrument, we drop the items compatibility26; iq40; iq42; ob33; ob34; ob35; simp29;
ra21; ra22. These droppings were also based on the predictability of these elements done through
the Q2 of the indicator cross-validated communality. In addition, it was argued that in Information
System Research context, a median of 3.5 indicators were reported in the literature for each reflective
construct (Evermann and Tate, 2014).
Table 4. Model’s reliability and validity
Construct Items Loadings Indicator Reliability (Loadings2)
Cronbach’s Alpha Composite reliability AVE
Compatibility compatibility_23 0.918 0.843 0.953 0.877 0.877
compatibility_24 0.924 0.854 compatibility_25 0.963 0.927
compatibility_26 0.942 0.887
Contribution contribution_48 0.946 0.895 0.953 0.966 0.878 contribution_49 0.918 0.843
contribution_50 0.944 0.891
contribution_51 0.939 0.882 Cost cost_15 0.947 0.897 0.955 0.971 0.918
cost_16 0.975 0.951
cost_17 0.951 0.904
Information
Quality
iq_40 0.769 0.591 0.928 0.946 0.778
iq_41 0.915 0.837
iq_42 0.876 0.767 iq_43 0.908 0.824
iq_44 0.933 0.870
Observability observability_31 0.920 0.846 0.956 0.965 0.821 observability_32 0.934 0.872
observability_33 0.963 0.927
observability_34 0.904 0.817 observability_35 0.883 0.780
observability_36 0.932 0.869
Relative advantage
ra_18 0.954 0.910 0.957 0.967 0.854 ra_19 0.942 0.887
ra_20 0.891 0.794
ra_21 0.941 0.885 ra_22 0.890 0.792
Social Influence si_37 0.891 0.794 0.922 0.949 0.861
si_38 0.945 0.893 si_39 0.945 0.893
Simplicity simplicity_27 0.967 0.935 0.970 0.978 0.918
simplicity_28 0.981 0.962 simplicity_29 0.958 0.918
simplicity_30 0.925 0.856
Use u_i_o_aif_45 0.902 0.814 0.906 0.941 0.842 u_i_o_aif_46 0.938 0.880
u_i_o_aif_47 0.912 0.832
3.2.2 Discriminant validity
As shown in figure 2, our latent variables discriminant validity were established except for the Use of
AII on Information Quality according to (Garson, 2016).
However, the HTMT value below 0.9 could not be achieved by some latent variables. This could be
due to the sample size.
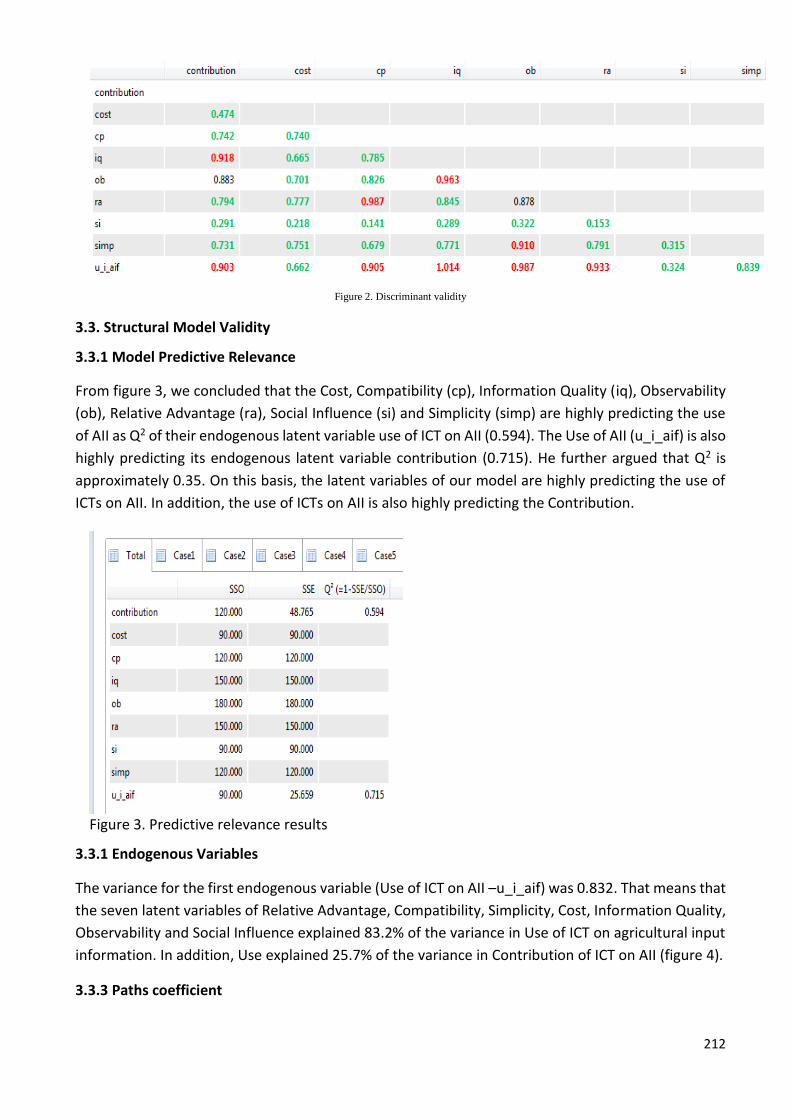
212
Figure 2. Discriminant validity
3.3. Structural Model Validity
3.3.1 Model Predictive Relevance
From figure 3, we concluded that the Cost, Compatibility (cp), Information Quality (iq), Observability
(ob), Relative Advantage (ra), Social Influence (si) and Simplicity (simp) are highly predicting the use
of AII as Q2 of their endogenous latent variable use of ICT on AII (0.594). The Use of AII (u_i_aif) is also
highly predicting its endogenous latent variable contribution (0.715). He further argued that Q2 is
approximately 0.35. On this basis, the latent variables of our model are highly predicting the use of
ICTs on AII. In addition, the use of ICTs on AII is also highly predicting the Contribution.
Figure 3. Predictive relevance results
3.3.1 Endogenous Variables
The variance for the first endogenous variable (Use of ICT on AII –u_i_aif) was 0.832. That means that
the seven latent variables of Relative Advantage, Compatibility, Simplicity, Cost, Information Quality,
Observability and Social Influence explained 83.2% of the variance in Use of ICT on agricultural input
information. In addition, Use explained 25.7% of the variance in Contribution of ICT on AII (figure 4).
3.3.3 Paths coefficient

213
We found that Information Quality has the strongest effect on Use of ICT on agricultural input
information (0.576), followed by the Compatibility (0.401). The Social Influence comes as the third
latent variable having the strongest effect on Use of ICT on AII (0.159). The Use of ICT on AII has a
strong effect on Contribution of ICT in the AII sector (0.842) (figure 4).
Surprisingly, the cost has a negative effect on the Use of ICT on AII (-0.034). We argued that the high
cost has a negative effect on the use of ICT on AII, but the findings showed that farmers found the
cost cheaper. Moreover, this cheaper cost is negatively affecting the use of ICTs. This is explained by
the fact that the farmers in this study from Lobougoula are more using radio/television as ICTs instead
of mobile phone or telecentres as we expected.
Another unexpected result is the adverse effect of Relative Advantage on Use of ICTs. This can be
explained by the fact that we were looking at ICT such as Mobile phone and Telecentres, but in the
commune of Lobougoula, farmers use Radio and Television mainly to get information on AII. All of
our other latent variables were supported as expected.
Figure 4. PLS-SEM results
4. Conclusion

215
This study aimed to propose a model for cereal farmers in the context of access and use of
agricultural input information. This paper discussed the results of the pilot-study to validate
the survey instrument and the model predictability. They were instrumental in confirming the
predictability of our proposed model (Kante, Oboko and Chepken, 2016).
Moreover, the instrument was validated. The use of PLS-SEM through SMARTPLS software
ensured the validity and reliability of our measurement and structural model. Although, we
dropped some items to enhance the reliability and validity of the model. Due to our interest
in ICTs such as Mobile phones and Telecentres, the study area should be changed to cover
these ICTs. In addition, the high cost should be modified into the lower cost as it affects ICTs'
use positively.
The results showed that the constructs Relative Advantage, Compatibility, Observability,
Simplicity, Cost, Information Quality were highly predicting the endogenous latent variable
Use of ICT on AII (0.715). The Use was highly predicting the Contribution of ICTs to the access
and use of AII (0.594) in the measurement and structural model through the Q2.
In addition, the assessment of R2 suggested the same highly prediction of these two
endogenous latent variables 95.8% and 70.9%. However, the tiny sample of this pilot-study
phase could be biased. Nonetheless, it helped us to refine our research instrument for the
next step of this research that is to gather data from 300 cereal farmers in the Sikasso region,
Mali. This sample will enable us to test the moderating effects such as Literacy and ICT Skills
and the path coefficient significances.
Acknowledgement
We would like to thank the participants of this pilot study and the ICTs services Myagro and
Senekela teams in Mali. We also thank the Borlaug Higher Education for Agricultural Research
and Development (BHEARD) and the United States Agency for International Development
(USAID) who are funding this research. Finally, we would like to thank Dr Ibrahim Otieno for
his valuable comments on this paper.

216
APPENDIX 4: PARTIAL LEAST SQUARE STRUCTURAL EQUATION
MODELLING’ USE IN INFORMATION SYSTEMS: AN UPDATED
GUIDELINE IN EXPLORATORY SETTINGS.
1. Introduction
The purpose of many studies in the field of Information Systems (IS) research is to analyse
causal relationship between variables. Structural Equation Modelling (SEM) is a statistical
technique for testing and estimating that causal connection based on statistical data and
qualitative causal assumption. Partial Least Square Structural Equation Modelling (PLS-SEM)
is the technique that is mostly used in IS research. It has been subject to many reviews either
in confirmatory or exploratory settings. However, it has recently emerged that PLS occupies
the middle ground of exploratory and confirmatory settings. Thus, this paper intends to
propose an updated guideline for the use of PLS-SEM in Information Systems Research in
exploratory settings maintaining interpretability. A systematic literature review of 40
empirical and methodological studies published between 2012 and 2016 in the leading
journal of the field guides future empirical work.
The purpose of many studies in the field of Information Systems (IS) research is to analyse
causal relationship between variables. Several techniques allow researchers to evaluate their
models such as regression, structural equation modelling (SEM). SEM is a statistical technique
for testing and estimating those causal relationship based on statistical data and qualitative
causal assumption (Urbach and Ahlemann, 2010). Contrary to the first generation statistical
tools such as regression, SEM enables researchers to answer a set of an interrelated research
question in an a) single, b) systematic, and comprehensive analysis by modelling the
relationship between multiple independent and dependent constructs simultaneously. This
capability for simultaneous analysis differs greatly from most first generation regression
models such as linear regression, LOGIT, ANOVA, and MANOVA, which can analyse only one
layer of linkages between independent and dependent variables at a time (Gefen, Straub and
Boudreau, 2000).
SEM is highly recommended and used in the field of IS research. Quantitative research in
Information System (IS) frequently uses structural equation modelling, allowing researchers
to represent latent constructs, observations and their relationship in a single statistical model
(Evermann and Tate, 2014). SEM has two major techniques: The Partial Least Squares (PLS)
and the Covariance Based (CB). CB-SEM requires a sound theory base and confirmatory
research while PLS does not need a sound theory base and support a confirmatory or
exploratory research (Hair, Ringle and Sarstedt, 2011).
Partial Least Square Structural Equation Modelling (PLS-SEM) is the most SEM technique used
in IS research. PLS is regarded as the most fully developed and general system (Henseler,
Hubona and Ash, 2016). IS was identified as the primary user of PLS (Evermann and Tate,
2014).

217
Rönkkö et al. (2012) argue that the use of partial least squares path modelling as a tool for
theory testing has been increasing in the late 90’s and PLS is one of the most common
quantitative data analyses methods in the top IS journals. However, they emphasise that
reliance on PLS method has possibly resulted in producing and publishing a large number of
studies, whose results are invalid. These critics have been addressed by the literature
(Henseler et al., 2014).
The technique has been subject to many reviews (Rouse and Corbitt, 2008; Urbach and
Ahlemann, 2010; Evermann and Tate, 2012; Henseler, Hubona and Ash, 2016). That has
resulted in the production of guidelines for the use of PLS-SEM in IS research. Most of these
guidelines focus on either explanatory (confirmatory) or exploratory research. Henseler et al.
(2016) propose an updated guideline for the use of PLS in IS research in confirmatory settings.
On the other hand, Urbach & Ahlemann (2010) come up with a guideline for the use of the
technique in exploratory contexts.
The literature provides three purposes of any research: exploratory, descriptive or
explanatory (confirmatory). An exploratory study is a valuable means of finding out what is
happening; to seek new insights; to ask questions and to assess phenomena in a new light
(Saunders, Lewis and Thornhill, 2009). Exploratory research goes with a predictive model
(Evermann and Tate, 2014).The object of descriptive research is to portray an accurate profile
of persons, events or situations (Saunders, Lewis and Thornhill, 2009). Studies that establish
causal relationships between variables may be termed explanatory research (Saunders, Lewis
and Thornhill, 2009). Explanatory research goes with the causal model (confirmatory) model.
Nevertheless, Evermann & Tate (2014) argue that the causal and predictive modelling does
not form a dichotomy but that there is a middle-ground between the two extreme positions.
A predictive model may be easier to accept by decision makers and other stakeholders when
it can be plausibly interpreted. Further, they state that it may be simpler to determine the
prediction boundaries, i.e. determine what situations the model will hold and under what
situations the model will break, when a plausible substantive interpretation is available. Users
of predictive models have more trust in its results, especially for unexpected or
counterintuitive predictions, when there is a plausible interpretation possible (ibid.). In
contrast to explanatory modelling, the plausible interpretations in this context do not entail
a rigorous formal statistical testing of all posited relationships and model constraints as in
causal- explanatory modelling (Evermann and Tate, 2014).
PLS path modelling was developed to occupy this middle ground and to straddle the
traditional divide between causal-explanatory and predictive modelling at the extremes. It
aims to maintain interpretability while engaging in predictive modelling (Evermann and Tate,
2014). Therefore, there is a need to review the guidelines of exploratory research by taking
into account the middle ground. That justifies the purpose of this paper.

218
The objective of this article was to propose an updated guideline for the use of PLS-SEM in
Information Systems Research in exploratory settings maintaining interpretability. It updated
the paper of Urbach & Ahlemann (2010) that is mainly for exploratory settings.
2. Material and Methods
This section describes the methods that were used to conduct the study.
To efficiently perform the systematic literature, search criterion for inclusion in the dataset
was defined. Table 1 provides the criterion.
Table 1: Criterion for inclusion/exclusion in the dataset
We had papers from proceedings and journals. Management Information Systems Quarterly
(MISQ), Information Systems Research (ISR), Journal of Management Information Systems
(JMIS) and Journal of the Association for Information Systems (JAIS) were identified as the
four leading journals in the field of IS (Evermann and Tate, 2010). This paper is restrained to
MISQ as it is recognised as the leading journal. We had for 26 research papers from MISQ:
Eight papers in 2012: two empirical studies and six methodological papers
Five papers in 2013: four empirical papers and one methodological study.
Three papers in 2014: all of them were empirical studies.
Six studies in 2015: one methodological paper and five empirical studies.
One empirical study in 2016.
On the proceeding papers, we selected four papers from the conferences that were hosted
or organised by the Association for Information Systems and its affiliated organisations. In
conclusion, the data set was a sample size of 40 studies. From the data set, it was extracted:
1) reason for choosing PLS-SEM, 2) research epistemology, 3) research approach, 4) research
strategy, 5) Model characteristics and 6) Model evaluation.
Inclusion Criteria
Time of
publication
Published between 2012 and 2016
Appropriate
source
Researchgate.com, aisnet.org, webofscience.com, google scholar
Search terms Information Systems, Information System, Information System research,
Use of Structural Equation Modelling, Use of Partial Least Square Equation
Modelling, Use of PLS-SEM, Guidelines for the use of PLS-SEM, PLS-SEM use
in IS, Research methods using PLS-SEM

219
3. Results and Discussion
This section presents the in-depth analyses of the papers.
3.1 The reasons for choosing PLS
Urbach & Ahlemann (2010) argue that overall, PLS can be an adequate alternative to CBSEM
if the problem has the following characteristics:
The phenomenon to be investigated is relatively new, and measurement models need
to be newly developed.
The structural equation model is complex with a large number of LVs and indicator
variables.
Relationships between the indicators and LVs have to be modelled in different modes
(i.e., formative and reflective measurement models).
The conditions relating to sample size, independence, or normal distribution are not
met, and/or. CB requires a large sample size while PLS does not require large sample
size. If the sample size is small, PLS is recommended in Information System research
(Evermann and Tate, 2014), in Marketing research (Hair, Ringle and Sarstedt, 2011).
Table 2 gives an overview of the reason that underlines studies from our dataset to choose
PLS.
Table 2. Reason for choosing PLS-SEM
Reason Authors Years
Small sample sizes (Wang, Tai and Grover, 2013; Bartelt and Dennis,
2014; Ifinedo, 2015)
2013;
2014;
2015
Non normality (Wang, Tai and Grover, 2013; Xu, Benbasat and
Cenfetelli, 2014; Ifinedo, 2015; Park, Sharman
and Rao, 2015)
2013;
2014;
2015
Exploratory research objective/
predictive purposes
(Fang et al., 2014; Johnston, Warkentin and
Siponen, 2015; Park, Sharman and Rao, 2015)
2014;
2015
Analyse formative and
reflective constructs
(Majchrzak, Wagner and Yates, 2013; Han et al.,
2015a)
2013;
2015
Analyse formative constructs (Kankanhalli, Ye and Teo, 2015) 2015
Number of interaction terms (Venkatesh, Thong and Xu, 2012) 2012
Mediated Models (Bartelt and Dennis, 2014) 2014

220
None of the studies used the small sample sizes criterion to justify the use of PLS-SEM.
Instead, each one had another argument to justify their use of the technique. The use of small
sample size for PLS-SEM is not recommended. For instance, Oodhue, Ewis, Hompson,
Marcoulides, & Chin (2012) argue that when determining the minimum sample size to obtain
adequate power, use Cohen’s approach (regardless of the technique to be used). Do not rely
on the rule of 10 (or the rule of 5) for PLS (ibid.). In addition, Kline (2013) argues that a
“typical” sample size in studies where SEM was used is about 200 cases. Moreover, Garson
(2016) quoting (Chin & Newsted, 1999) agrees with the same sample size. Therefore, we
conclude that a sample size of 200 or above is the good sample size in using PLS-SEM.
3.2 Research epistemology
Many philosophical positions characterise information System research. Saunders et al.
(2009) draw a comparison of the four research philosophies, which can be applied in
information management research (Positivism, realism, interpretivism and pragmatism).
In Information System research, Urbach & Ahlemann (2010) argue that SEM researchers
commonly adopt a positivist epistemological belief. Furthermore, they report that the
positivist researcher plays a passive, neutral role and does not intervene in the phenomenon
of interest. Epistemologically, the positivist perspective is concerned with the empirical
testability of theories. In other words, these theories are either confirmed or rejected. None
of the paper that we reviewed had addressed the philosophical point of view. Therefore, we
are consistent with Urbach & Ahlemann (2010) who argue that research that applies SEM
(including PLS) follows a positivist epistemological belief.
3.3 Research approach
The extent to which the researcher is evident about the theory at the beginning of his/her
research raises an important question concerning the design of the research project
(Saunders, Lewis and Thornhill, 2009). That is whether the research should use the deductive
approach, in which the researcher develops a theory and hypothesis (or hypotheses) and
design a research strategy to test the hypothesis, or the inductive approach, in which you
would collect data and develop a theory as a result of your data analysis (ibid.). None of the
paper that we reviewed had reported their research approach. Nevertheless, the purpose of
the empirical studies we reviewed was to gather data and test their hypotheses. This is a
deductive approach, and thus, we conclude that studies using PLS-SEM apply a deductive
approach.
3.4 Research strategy
Saunders et al. (2009) argued that survey is a popular and shared strategy in business and
management research and is most frequently used to answer who, what, where, how much
and how many questions. It, therefore, tends to be used for exploratory and descriptive

221
research. Our dataset reveals that PLS-SEM studies applied survey as a strategy. This was also
consistent as these studies were mainly done in exploratory settings.
3.5 Model characteristics
A Structural equation model consists of two models. The structural model (or inner model)
comprises the relationship between the latent variables, which has to be derived from
theoretical considerations. The second model is called the measurement model (or outer).
This model deal with “how do you measure your latent variables?”
Figure 1. Inner vs Outer Model in a SEM Diagram
Source: Wong (2014)
3.5.1. Outer Model
Measurement model specification requires the consideration of the nature of the relationship
between constructs and measures. Latent variable measurement concerns the process of
ensuring that local independence is satisfied for a selected set of observed variables or
indicators and this can be done via the use of a model such as a common factor model
(Oodhue et al., 2012). There are two types of measurement models: reflective and formative
(Figure 2) (Hreats, Becker and Ringle, 2013). Formative and reflective are thus the two
currently accepted ways of specifying the relationship between latent constructs and
observed variables that are causally related to them (Aguirre-urreta and Marakas, 2012).

222
Figure 2. Overview of reflective/formative models
Source: adapted from Urbach & Ahlemann (2010)
In reflective measures, changes in the construct are reflected in variations in all of its
indicators, and the direction of causality is from the construct to the indicators (Garson, 2016).
Reflective indicators are assessed regarding their loadings, which entails the simple
correlation between the indicator and the construct (Hreats, Becker and Ringle, 2013). The
reflective model were reported by some reviewed empirical studies (Bartelt & Dennis, 2014;
Fang et al., 2014; Han, Ada, Sharman, & Rao, 2015; Johnston et al., 2015; Kankanhalli et al.,
2015; Marsh, Morin, Parker, & Kaur, 2014; Setia, Ventkatesh, & Joglekar, 2013; Xu et al.,
2014).
In formative measures, the indicators do not reflect the underlying construct but are
combined to form it without any assumptions about the intercorrelation patterns among
them (Garson, 2016). The direction of causality is from the indicators to the construct, and
the weights of formative indicators represent the importance of each indicator in explaining
the variance of the construct (Hreats, Becker and Ringle, 2013). Reviewed empirical studies
reported the use of formative model (Han et al., 2015; Jarvis, Mackenzie, & Podsakoff, 2012;
Kankanhalli et al., 2015; Majchrzak et al., 2013; Marett, Otondo, & Taylor, 2013; Schmitz,

223
Teng, & Webb, 2016; Setia et al., 2013; Venkatesh et al., 2012; Wang et al., 2013; Wu, Straub,
& Liang, 2015).
Figure 3. Model distribution per year
3.5.2 Inner model or structural model
The inner model (structural model) has also two types of variables: Exogenous and
Endogenous (see figure 1). An exogenous latent variable is an LV that has no income arrow
from any other LV in the model (Garson, 2016). An endogenous latent variable is an LV that
has at least one income arrow from another LV in the model (Garson, 2016).
The inner model can also have other variables such as moderating variable, mediating variable
and controlling variable. A moderator is a qualitative (e.g., sex, race, class) or quantitative (e.g.,
level of reward) variable that affects the direction and strength of the relation between an
independent or predictor variable and a dependent or criterion variable (Baron and Kenny,
1986). They further argue that the relationship between two variables changes as a function of
the moderator variable. In other words, moderator effect = interaction effect.
Figure 4. Conceptual diagram for moderating variable
0 0
5
4
0
9
1
4
0 0
1
6
0
1
0
2
0
3
0
1
2
3
4
5
6
7
8
9
10
2012 2013 2014 2015 2016 total
Reflective and Formative model distribution per year
Reflective formative both

224
Source: adapted from Chin (2006)
A mediator (or mediating variable) accounts for the relationship between the predictor and
the criterion (Baron and Kenny, 1986). It is an intervening variable (Garson, 2016).
An intervening variable (mediator) transmits the effect of an independent variable to a
dependent variable (Chin, 2006).
Figure 5. Conceptual diagram for mediating variable
Source: adapted from Chin (2006)
Control variable (controlling) is a variable that is not the focus or planned as part of a research
study. However, its existence has a positive impact over Dependent Variable (DV) that cannot
be ignored in which it is included in the research model testing together with other
Independent Variables (IVs) (Fung, 2015). Hence it is called control variable, i.e. it is kept
under "controlled", "monitored" or "constant" to observe whether it has minimal impact on
the relationships between the independent variable and dependent variable (Fung,
2015). Usually, the control variable is not included as part of a hypothesis statement.
3.6 Model evaluation
The model evaluation requires the assessment of the two inter-related models: measurement
model (outer model) and structural model (inner model).
3.6.1 Outer model fit evaluation
a. Reflective outer model fit evaluation
The measurement model should be tested for least internal consistency reliability, indicator
reliability, convergent validity, and discriminant validity by applying standard decision rules
from the IS research literature.
Urbach & Ahlemann (2010) argued that the traditional criterion for assessing internal
consistency reliability is Cronbach’s alpha (CA), whereas a high alpha value assumes that the
scores of all items with one construct have the same range and meaning (Cronbach 1951).
However, Garson (2016) argued that Composite reliability is preferred to Cronbach's alpha in

225
testing the convergent validity of a reflective model. Regardless of which coefficient is used
for assessing internal consistency, values above .700 are desirable for exploratory research
(Urbach and Ahlemann, 2010).
Convergent validity entails the degree to which individual items reflecting a construct
converge in comparison to items measuring different constructs. Urbach & Ahlemann (2010)
argued that a commonly applied criterion of convergent validity is the average variance
extracted (AVE) proposed by Fornell and Larcker (1981). It measures the percent of variance
captured by a construct by showing the ratio of the sum of the variance captured by the
construct and measurement variance (Gefen, Straub and Boudreau, 2000). Its value should
be above .5 (Urbach and Ahlemann, 2010; Garson, 2016).
Finally, discriminant validity involves the degree to which the measures of different constructs
differ from one another. Whereas convergent validity tests whether a particular item
measures the construct it is supposed to measure, discriminant validity tests whether the
items do not unintentionally measure something else (Urbach and Ahlemann, 2010). In SEM
using PLS, two measures of discriminant validity are commonly used: Cross loading criterion
and Fornell–Larcker (Urbach and Ahlemann, 2010). However, simulation studies
demonstrated that the heterotrait-monotrait (HTMT) detects better the lack of discriminant
validity (Henseler, Ringle and Sarstedt, 2014). Moreover, in Information System research, it
was argued that Discriminant validity should be assessed by the Heterotrait-Monotrait Ratio
(HTMT) (Henseler, Hubona and Ash, 2016). Table 3 summarises the measurement model
assessment.
Table 3. Reflective measurement model assessment
Validity type Criterion Description Literature
Indicator
reliability
Indicator loading >
.600
Loadings represent the
absolute contribution of the
indicator to the definition of
its latent variable.
(Urbach and
Ahlemann, 2010;
Setia, Ventkatesh
and Joglekar, 2013;
Wang, Tai and
Grover, 2013; Fang
et al., 2014; Han et
al., 2015b)
Internal
consistency
reliability
Cronbach’s α > 0.6 Measures the degree to
which the MVs load
simultaneously
when the LV increases.
(Urbach and
Ahlemann, 2010;
Wang, Tai and
Grover, 2013; Fang
et al., 2014; Han et

226
al., 2015b; Garson,
2016)
Internal
consistency
reliability
Composite
reliability > 0.6
Attempts to measure the sum
of an LV’s factor loadings
relative to the sum of the
factor loadings plus error
variance. Leads to
values between 0 (completely
unreliable) and 1 (perfectly
reliable).
(Urbach and
Ahlemann, 2010;
Wang, Tai and
Grover, 2013; Fang
et al., 2014; Han et
al., 2015b; Garson,
2016)
Convergent
validity
Average Variance
Extracted (AVE) >
0.5
It involves the degree to which
individual items reflecting a
construct converge in
comparison to items
measuring different
constructs.
(Urbach and
Ahlemann, 2010;
Venkatesh, Thong
and Xu, 2012; Wang,
Tai and Grover,
2013; Majchrzak,
Wagner and Yates,
2013; Setia,
Ventkatesh and
Joglekar, 2013;
Bartelt and Dennis,
2014; Han et al.,
2015a, 2015b;
Kankanhalli, Ye and
Teo, 2015; Garson,
2016; Henseler,
Hubona and Ash,
2016)
Discriminant
validity
Cross-loadings requires that the loadings of
each indicator on its construct
are higher than the cross-
loadings on other constructs
(Gefen, Straub and
Boudreau, 2000;
Urbach and
Ahlemann, 2010;
Wang, Tai and
Grover, 2013)
Discriminant
validity
Fornell-Larcker Requires an LV to share more
variance with its assigned
indicators than with any other
LV. Accordingly, the AVE of
each LV should be greater
(Urbach and
Ahlemann, 2010;
Venkatesh, Thong
and Xu, 2012; Bartelt
and Dennis, 2014;
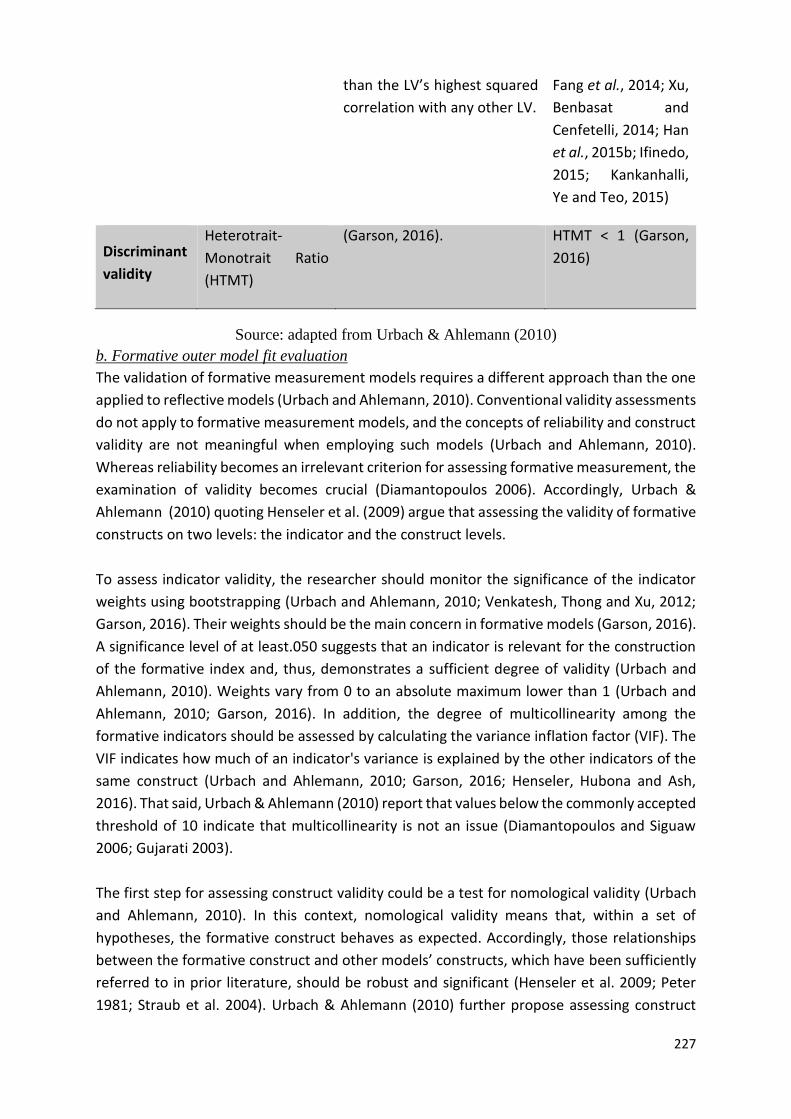
227
than the LV’s highest squared
correlation with any other LV.
Fang et al., 2014; Xu,
Benbasat and
Cenfetelli, 2014; Han
et al., 2015b; Ifinedo,
2015; Kankanhalli,
Ye and Teo, 2015)
Discriminant
validity
Heterotrait-
Monotrait Ratio
(HTMT)
(Garson, 2016).
HTMT < 1 (Garson,
2016)
Source: adapted from Urbach & Ahlemann (2010)
b. Formative outer model fit evaluation
The validation of formative measurement models requires a different approach than the one
applied to reflective models (Urbach and Ahlemann, 2010). Conventional validity assessments
do not apply to formative measurement models, and the concepts of reliability and construct
validity are not meaningful when employing such models (Urbach and Ahlemann, 2010).
Whereas reliability becomes an irrelevant criterion for assessing formative measurement, the
examination of validity becomes crucial (Diamantopoulos 2006). Accordingly, Urbach &
Ahlemann (2010) quoting Henseler et al. (2009) argue that assessing the validity of formative
constructs on two levels: the indicator and the construct levels.
To assess indicator validity, the researcher should monitor the significance of the indicator
weights using bootstrapping (Urbach and Ahlemann, 2010; Venkatesh, Thong and Xu, 2012;
Garson, 2016). Their weights should be the main concern in formative models (Garson, 2016).
A significance level of at least.050 suggests that an indicator is relevant for the construction
of the formative index and, thus, demonstrates a sufficient degree of validity (Urbach and
Ahlemann, 2010). Weights vary from 0 to an absolute maximum lower than 1 (Urbach and
Ahlemann, 2010; Garson, 2016). In addition, the degree of multicollinearity among the
formative indicators should be assessed by calculating the variance inflation factor (VIF). The
VIF indicates how much of an indicator's variance is explained by the other indicators of the
same construct (Urbach and Ahlemann, 2010; Garson, 2016; Henseler, Hubona and Ash,
2016). That said, Urbach & Ahlemann (2010) report that values below the commonly accepted
threshold of 10 indicate that multicollinearity is not an issue (Diamantopoulos and Siguaw
2006; Gujarati 2003).
The first step for assessing construct validity could be a test for nomological validity (Urbach
and Ahlemann, 2010). In this context, nomological validity means that, within a set of
hypotheses, the formative construct behaves as expected. Accordingly, those relationships
between the formative construct and other models’ constructs, which have been sufficiently
referred to in prior literature, should be robust and significant (Henseler et al. 2009; Peter
1981; Straub et al. 2004). Urbach & Ahlemann (2010) further propose assessing construct

228
validity by checking discriminant validity. Correlations between formative and all other
constructs of less than .700 indicate sufficient discriminant validity (Urbach and Ahlemann,
2010).
Table 4. Formative measurement model assessment
Validity type Criterion Description Literature
Indicator validity Indicator weights Significance at the .050
level suggests that an
indicator is relevant for the
construction of the
formative index and, thus,
demonstrates a sufficient
degree of validity. Some
authors also recommend
path coefficients greater
than .100 or .200.
(Urbach and
Ahlemann, 2010;
Venkatesh, Thong
and Xu, 2012;
Marett, Otondo and
Taylor, 2013; Han
et al., 2015b; Wu,
Straub and Liang,
2015)
Indicator validity Variance inflation
factor (VIF)
Indicates how much of an
indicator's variance is
explained by the other
constructs’ indicators and,
thus, indicates how
redundant the indicator’s
information is. Acceptable
values are below 10.
(Urbach and
Ahlemann, 2010;
Venkatesh, Thong
and Xu, 2012; Han
et al., 2015b;
Kankanhalli, Ye
and Teo, 2015;
Garson, 2016;
Schmitz, Teng and
Webb, 2016)
Construct validity Nomological
validity
Means that, within a set of
hypotheses, the formative
construct behaves as
expected. Relationships
between the formative
construct and other
models’ constructs, which
have been sufficiently
referred to in prior
literature
(Urbach and
Ahlemann, 2010;
Wu, Straub and
Liang, 2015)
Construct validity Inter-construct
correlations
If the correlations between
the formative and all the
other constructs are less
than .700, the constructs
differ sufficiently from one
another.
(Urbach and
Ahlemann, 2010)

229
Source: adapted from Urbach & Ahlemann (2010)
3.6.2 Inner model fit evaluation
Once the reliability and validity of the outer models established, several steps need to be
taken to evaluate the hypothesised relationships within the inner model. The assessment of
the model’s quality is based on its ability to predict the endogenous constructs. The following
criteria facilitate this evaluation: Coefficient of determination (R2) (Urbach and Ahlemann,
2010), predictive relevance (Q2) (Evermann and Tate, 2014), and path coefficients (Garson,
2016).
Evermann & Tate (2012) argue that while in traditional regression models the R2 proportion
of explained variance is an indicator of the predictive strength of the model, researchers have
recently advocated the use of blindfolding for assessing the predictive strength of structural
equation models (Chin, 2010; Ringle et al., 2012). The purpose is to calculate cross-validated
measures of model predictive accuracy (reliability), of which there are four: Construct cross-
validated redundancy, Construct cross-validated communality, Indicator cross-validated
redundancy and Indicator cross-validated communality (Garson, 2016).
However, in IS research, Evermann & Tate (2012) quoting Chin (2010) recommend to use
redundancy-based blindfolding to assess the predictive relevance of one's
“theoretical/structural model” and suggests that a value of Q2 > 0.5 is indicative of a predictive
model.
R2 is the measure of the proportion of the variance of the dependent variable about its mean
that is explained by the independent variable(s) (Gefen, Straub and Boudreau, 2000). Urbach
& Ahlemann (2010) quoting Chin (1998b) considers values of approximately .670 substantial,
values around .333 average, and values of .190 and lower weak. Nevertheless, the “significant
value” of R2 depends on fielding (Garson, 2016). The path coefficients should also be assessed.
Urbach & Ahlemann (2010) reports that some authors argue that path coefficients should
exceed .100 to account for a certain impact within the model (e.g., Huber et al. 2007). The
paths coefficient significance test and p-value should be done using the bootstrapping
technique.
Finally, the model fitness should be assessed. Henseler et al. (2016) argued that currently, the
only approximate model fit criterion implemented for PLS path modelling is the standardised
root mean square residual (SRMR). They further claimed that as can be derived from its name,
the SRMR is the square root of the sum of the squared differences between the model-implied
and the empirical correlation matrix, i.e. the Euclidean distance between the two matrices.
By convention, a model has a good fit when SRMR is less than .08 (Hu & Bentler, 1998). Some
use the more lenient cut-off of less than .10 (Garson, 2016). Table 5 gives an overview of the
assessment of formative models. Four papers report the use of indicator weights to assess
indicator validity while five reports the VIF for the same purpose. Only one paper reports the
formative construct validity assessment.

230
Table 5. Structural model assessment
Validity type Criterion Description Literature
Model
Predictability
Predictive relevance
Q2 > 0.05
By systematically
assuming that a certain
number of cases are
missing from the sample,
the model parameters are
estimated and used to
predict the omitted
values. Q2 measures the
extent to which this
prediction is successful.
(Urbach and Ahlemann,
2010; Garson, 2016;
Henseler, Hubona and Ash,
2016)
Model
validity
Effect size ( f2) Measures if an
independent LV has a
substantial impact on a
dependent LV. Values of
.020, .150, .350 indicate
the predictor variable’s
low, medium, or large
effect in the structural
model.
(Urbach and Ahlemann,
2010; Venkatesh, Thong and
Xu, 2012; Fang et al., 2014;
Xu, Benbasat and Cenfetelli,
2014; Johnston, Warkentin
and Siponen, 2015; Garson,
2016; Schmitz, Teng and
Webb, 2016)
Model
validity
Model fit
SRMR < 0.08
SRMR is a measure of
close fit of the
researcher’s model.
(Garson, 2016; Henseler,
Hubona and Ash, 2016)
Model
validity
R2 > 0.100 Coefficient of
determination
(Urbach and Ahlemann,
2010; Hsieh and Petter, 2012;
Setia, Ventkatesh and
Joglekar, 2013; Wang, Tai
and Grover, 2013; Majchrzak,
Wagner and Yates, 2013;
Marett, Otondo and Taylor,
2013; Bartelt and Dennis,
2014; Fang et al., 2014; Xu,
Benbasat and Cenfetelli,
2014; Ifinedo, 2015;
Kankanhalli, Ye and Teo,
2015; Park, Sharman and
Rao, 2015; Garson, 2016;

231
Schmitz, Teng and Webb,
2016)
Model
validity
Path coefficients
Critical t-values for a
two-tailed test are
1.65 (significance
level = 10 percent),
1.96 (significance
level = 5 percent),
and 2.58
(significance level =
1 percent).
Structural path
coefficients are the path
weights connecting the
factors to each other.
(Urbach and Ahlemann,
2010; Hsieh and Petter, 2012;
Setia, Ventkatesh and
Joglekar, 2013; Wang, Tai
and Grover, 2013; Majchrzak,
Wagner and Yates, 2013;
Marett, Otondo and Taylor,
2013; Bartelt and Dennis,
2014; Fang et al., 2014; Xu,
Benbasat and Cenfetelli,
2014; Ifinedo, 2015;
Kankanhalli, Ye and Teo,
2015; Park, Sharman and
Rao, 2015; Garson, 2016;
Schmitz, Teng and Webb,
2016)
Source: adapted from Urbach & Ahlemann (2010)
4. Conclusion
Partial Least Square Structural Equation Modelling has been applied in the field of Information
Systems and is characterised as the primary user of that technical statistic. Nevertheless, its
use is subject to critics. This review has updated the guidelines for the use of PLS-SEM in IS
settings by integrating new criterion for assessing the measurement and the structural model.
Nevertheless, this update is a non-technical point of view. The further inquiry could be taken
to show how to reports the results of these provided criterions.

232
APPENDIX 5. CORRELATIONS BETWEEN THE VARIABLES

233
cost_15
cost_16
cost_17
ra_18
ra_19
ra_20
cp_21
cp_22
cp_23
sp_24
sp_25
sp_26
ob_27
ob_28
ob_29
si_30
si_31
si_32
iq_33
iq_34
iq_35
u_i_o_aif_3
6
u_i_o_aif_37
u_i_o_aif_38
ctr_39
ctr_40
ctr_41
ctr_42
cost_15
1
cost_16
,756**
1
cost_17
,794**
,759**
1
ra_18
,589**
,587**
,611**
1
ra_19
,630**
,665**
,667**
,777**
1
ra_20
,522**
,609**
,557**
,749**
,763**
1
cp_21
,595**
,643**
,605**
,731**
,795**
,747**
1
cp_22
,597**
,632**
,625**
,650**
,710**
,711**
,700**
1
cp_23
,572**
,645**
,571**
,641**
,674**
,657**
,659**
,689**
1
sp_24
,413**
,405**
,367**
,377**
,455**
,376**
,397**
,347**
,378**
1
sp_25
,359**
,356**
,353**
,382**
,450**
,346**
,387**
,332**
,306**
,807**
1

234
sp_26
,426**
,409**
,349**
,379**
,417**
,379**
,395**
,345**
,306**
,797**
,781**
1
ob_27
,590**
,665**
,642**
,673**
,746**
,706**
,700**
,680**
,652**
,343**
,409**
,382**
1
ob_28
,599**
,635**
,588**
,703**
,762**
,743**
,751**
,734**
,686**
,359**
,323**
,348**
,742**
1
ob_29
,572**
,593**
,587**
,685**
,729**
,718**
,748**
,692**
,657**
,295**
,325**
,298**
,752**
,796**
1
si_30
,115
,052
,028
,080
,064
,056
,113
-,00
6
,089
-,14
3*
-,08
3
-,10
7
,115
,081
,118 1
si_31
,088
,015
,050
-,03
9
,007
-,05
9
,028
-,06
0
-,00
7
-,15
0*
-,07
9
-,11
3
,077
-,01
7
,073 ,802**
1
si_32
,078
,018
,026
-,04
4
,035
-,04
6
,058
,011
,028
-,09
7
-,08
9
-,12
8
,068
,065
,143* ,718**
,759**
1
iq_33
,516**
,565**
,544**
,657**
,721**
,670**
,662**
,626**
,538**
,280**
,291**
,274**
,653**
,726**
,632** ,075
,018
,042
1
iq_34
,531**
,578**
,539**
,643**
,679**
,643**
,667**
,595**
,570**
,334**
,302**
,364**
,671**
,662**
,585** ,083
,035
,046
,656**
1
iq_35
,562**
,653**
,591**
,703**
,723**
,718**
,769**
,668**
,656**
,355**
,338**
,383**
,673**
,694**
,711** ,007
-,03
6
-,02
8
,658**
,705**
1
u_i_o_aif_36
,550**
,563**
,543**
,604**
,638**
,602**
,642**
,623**
,639**
,441**
,446**
,467**
,612**
,620**
,583** ,049
-,00
3
,023
,582**
,571**
,659**
1
u_i_o_aif_37
,508**
,562**
,538**
,550**
,662**
,576**
,606**
,564**
,567**
,338**
,380**
,336**
,616**
,659**
,613** ,044
-,07
0
-,02
0
,591**
,601**
,625**
,525**
1
u_i_o_aif_38
,534**
,641**
,594**
,705**
,731**
,674**
,714**
,699**
,677**
,381**
,404**
,372**
,723**
,704**
,707** -,00
8
-,07
6
-,04
5
,626**
,605**
,681**
,630**
,659**
1

235
ctr_39
,543**
,599**
,551**
,619**
,653**
,610**
,661**
,578**
,572**
,290**
,348**
,312**
,639**
,677**
,625** ,096
-,01
3
-,03
8
,564**
,554**
,670**
,615**
,610**
,623**
1
ctr_40
,530**
,588**
,581**
,654**
,724**
,666**
,727**
,630**
,605**
,337**
,384**
,353**
,659**
,690**
,630** ,012
-,06
4
-,04
5
,635**
,628**
,684**
,622**
,602**
,671**
,750**
1
ctr_41
,497**
,629**
,597**
,625**
,687**
,692**
,645**
,634**
,627**
,357**
,305**
,305**
,609**
,689**
,658** ,042
-,02
9
,009
,587**
,573**
,710**
,581**
,627**
,686**
,663**
,643**
1
ctr_42
,554**
,632**
,599**
,583**
,686**
,666**
,660**
,618**
,615**
,435**
,369**
,367**
,585**
,666**
,629** ,044
-,02
1
-,00
6
,560**
,594**
,683**
,577**
,614**
,669**
,687**
,629**
,865**
1

236
APPENDIX 6. RESEARCH APPROVAL LETTER

237

238
APPENDIX 7. MODE OF DATA COLLECTION EFFECT ON DATA
Source: (Bowling, 2005)