an independent review of the common funding...
TRANSCRIPT
An Independent Review of the
Common Funding SchemeAn Independent Review of the
Common Funding SchemeAn Independent Review of the
Common Funding Scheme
PHOTO REDACTED DUE TO THIRD PARTY RIGHTS OR OTHER LEGAL ISSUES

An Independent Review of the Common Funding Scheme An Independent Review of the Common Funding Scheme c
Chair’s Message
On 12 June 2012, the Education Minister appointed me to chair an Independent Review of the Common Funding
Scheme, an appointment which I was delighted to accept. The review’s terms of reference tasked the panel, with delivering a complete review of the existing scheme and preparing detailed proposals for a new scheme within a six month timeframe. This has been a challenging undertaking, but I now have the pleasure of presenting this ‘Independent Review of the Common Funding Scheme’.
Throughout, I have been particularly conscious of the context for this review: the education system is at the beginning
of a period of fundamental change heralded by the area planning process and the imminent establishment of the Education and Skills Authority. Equally, education will face unprecedented financial challenges over the next number of years. Our focus as a panel, however, has been clear: to ensure that the finite resources available for schools are allocated and used, as effectively as possible.
Our recommendations span three broad areas: firstly recommendations relating to the framework of financial management; secondly recommendations relating to funding outside the formula, including funding for initiatives, central services and allocated to schools by funding authorities; and finally detailed proposals for a revised funding formula.
As you will be aware, the funding of schools is often contentious. A common worldwide complaint is that school funding systems can be unfair, creating large variations in how much money similar schools receive. In this regard, the Common Funding Scheme in Northern Ireland is no exception. It is clear, therefore, that a key driver for this review was to ensure that any new system should result in a fairer, more transparent and more logical outcome for all schools.
The review process attracted a great deal of interest. Four hundred written submissions were received to our call for evidence and the panel has met with representatives of over one hundred and thirty stakeholder groups from the education community and beyond. We have managed to meet many school representatives and educational stakeholders along with representatives
An Independent Review of the Common Funding Schemed
of community groups and review the information submitted in the call for evidence. We have also visited a number of schools and educational institutions, including Alternative Education Providers and Further Education Colleges, to garner as many views and gain an understanding of as many educational settings as possible.
I would like to take this opportunity to thank everyone who contributed to the review both through the call for evidence and the stakeholder meetings: their positive and pro-active participation has shaped this review. I would also like to thank my fellow panel members, Evan Bates and Dr Eemer Eivers, for their immense contribution to the review.
____________________________________________
Sir Robert Salisbury Chair, Independent Review of Common Funding Scheme
January 2013
An Independent Review of the Common Funding Scheme An Independent Review of the Common Funding Scheme e
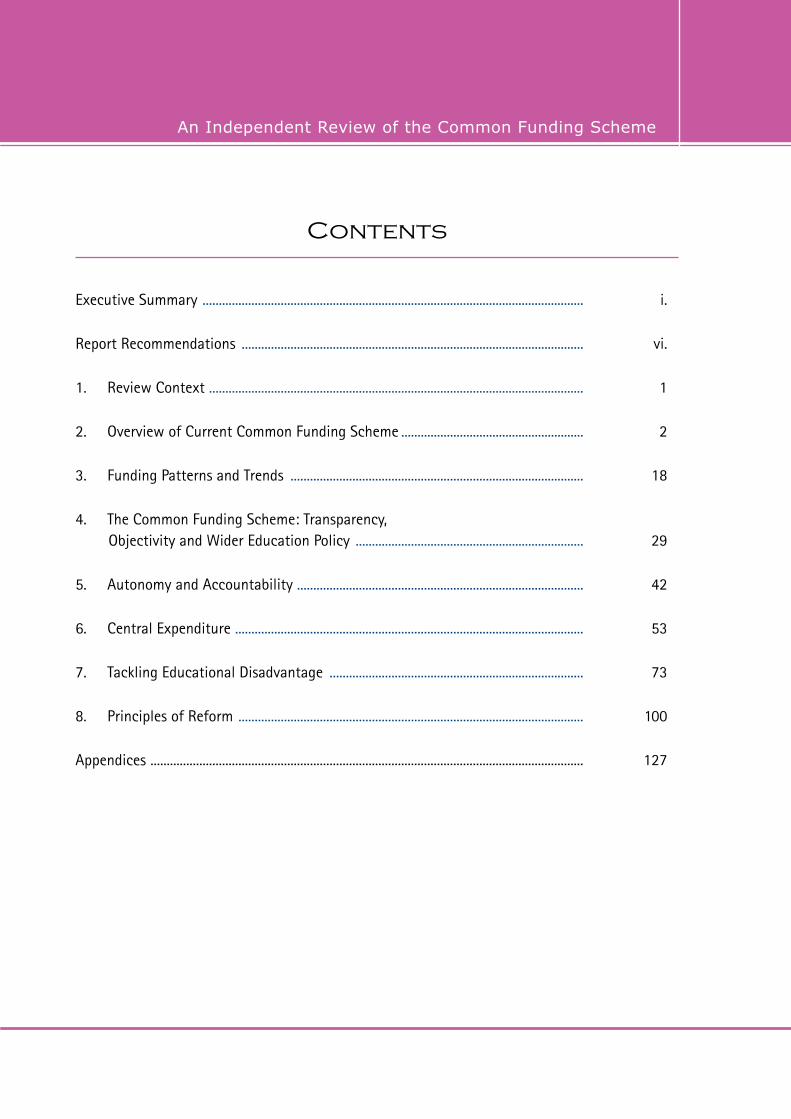
Contents
Executive Summary ..................................................................................................................... i.
Report Recommendations ......................................................................................................... vi.
1. Review Context ................................................................................................................... 1
2. Overview of Current Common Funding Scheme ........................................................ 2
3. Funding Patterns and Trends .......................................................................................... 18
4. The Common Funding Scheme: Transparency, Objectivity and Wider Education Policy ...................................................................... 29
5. Autonomy and Accountability ........................................................................................ 42
6. Central Expenditure ........................................................................................................... 53
7. Tackling Educational Disadvantage .............................................................................. 73
8. Principles of Reform .......................................................................................................... 100
Appendices ..................................................................................................................................... 127

An Independent Review of the Common Funding Schemef
An Independent Review of the Common Funding Scheme An Independent Review of the Common Funding Scheme i
EXECUTIVE SUMMARY
Introduction
1. Between June and December 2012, the independent panel has explored how to create a funding system that is fair, clear, and distributes funding proportional to pupil need. Our work has included an extensive review of relevant research evidence; an analysis of the relevant data on the education system; a comprehensive programme of stakeholder engagement and a formal call for evidence.
2. We have concluded that the current model of funding schools does not maximise opportunity for all pupils, nor does it sufficiently target educational under-achievement, or children with additional educational needs.
3. Funding is allocated via a large number of factors, many not clearly related to current school or pupil needs. The origins of many weights and cash values are often obscure, based on historical practice. An unanticipated by-product of the complexity of the current formula has been that funding is not always channelled according to need. Further, why a school receives the funding it does is often difficult to understand. This lack of transparency facilitates perceptions of bias.
4. Two key areas of the current formula run counter to wider Department of Education objectives. These are 1) the significant additional support for all small schools, irrespective of circumstance, which can be contrasted with 2) the low level of additional funding for pupils from socially disadvantaged backgrounds or with additional educational needs.
5. More broadly, it is apparent that the current funding formula is designed to support the needs of educational institutions. The panel instead propose a model of funding that places individual pupils and their varying levels of educational and pastoral need at the heart of funding allocations.
An Independent Review of the Common Funding Schemeii
Autonomy and Accountability
6. Currently, two broad types of delegation operate in Northern Ireland’s schools. Voluntary grammar and grant-maintained integrated schools are funded through grants from the Department of Education. Other schools’ budgets and accounts are delegated, buty are largely maintained by Education and Library Boards.
7. There are serious shortcomings in the practical operation of the current model of financial administration for controlled and maintained schools. There is a clear need for more disciplined budgeting and fiscal management by schools and funding authorities. While the Education and Library Boards have provided schools with both challenge and support on financial management, no real intervention has occurred where schools have failed to remain within budget.
8. The processes for monitoring, providing challenge, support and intervening in schools on financial management issues should be closely aligned to the processes in place in relation to school improvement. A financial classification of schools, together with comprehensive intervention procedures for schools that have excessive deficits and surpluses are urgently required.
9. We believe that any delegation must be accompanied by accountability - encompassing not only spending within limits, but spending wisely. Schools should be made fully aware of their responsibilities to plan and use public funding effectively, with close monitoring and intervention when outcomes are not satisfactory.
10. The top down imposition of a particular model of financial management, dependent not on the wishes, or capabilities of schools, but varying according to eccentricities of school management type, appears, therefore, anomalous. The panel, therefore, recommends that the Department of Education explores the practical implications and legislative, or procedural changes required to allow any school to adopt the systems of financial management operated for voluntary grammar and grant maintained integrated schools.
11. That aside, the panel notes that education funding spent employing financial advisors necessarily reduces the funds available for pedagogical purposes. We also caution that schools be aware of the increased time and expenditure on administration that would accompany the adoption of this model.

An Independent Review of the Common Funding Scheme An Independent Review of the Common Funding Scheme iii
Consistent financial management information
12. Financial information for all schools and Board areas should be standardised. It is only with improved consistency, particularly in the classification and recording of funding for schools outside the formula that accurate benchmarking of funding levels between schools throughout Northern Ireland can take place.
13. Consistent financial management information should also be recorded for all special schools and in a format that will facilitate benchmarking between schools and with special schools elsewhere. Only then do we believe that a specific review of special school funding would be appropriate. These proposals are set out in Chapter 6.
Fewer Initiatives
14. The Panel believe the number of funded initiatives for schools should be curtailed. This will minimise administrative costs and effort both at centre and within schools. It will also facilitate greater focus, coherence of approach, and long-term planning at school level.
15. The Department of Education should review all current ring-fenced initiative funding. For each initiative it should establish if earmarking is a more effective approach than directly delegating to schools via the funding formula. These proposals are also set out in Chapter 6.
Additional funding for pupils from socially deprived backgrounds
16. A key element in the terms of reference for our review was to ensure that the scheme sufficiently targets social need. Our review indicates that, counter to Department of Education policy and indeed to the Northern Ireland Executive’s Programme for Government 2011-15, it does not.
17. We, therefore, propose significantly increased levels of funding to address the additional needs of children at risk of educational under-achievement. We propose a pupil premium for all children entitled to Free School Meals and an additional social deprivation premium for Traveller, Roma and looked-after pupils.

An Independent Review of the Common Funding Schemeiv
18. In recognition of school context effects, we also propose that social deprivation funding is tiered, so that schools with a higher proportion of pupils experiencing social deprivation receive higher per-pupil funding. Again, we caution that additional funding delegated to schools must be accompanied by a clear responsibility for outcomes. These proposals are set out in detail in Chapters 7 and 8.
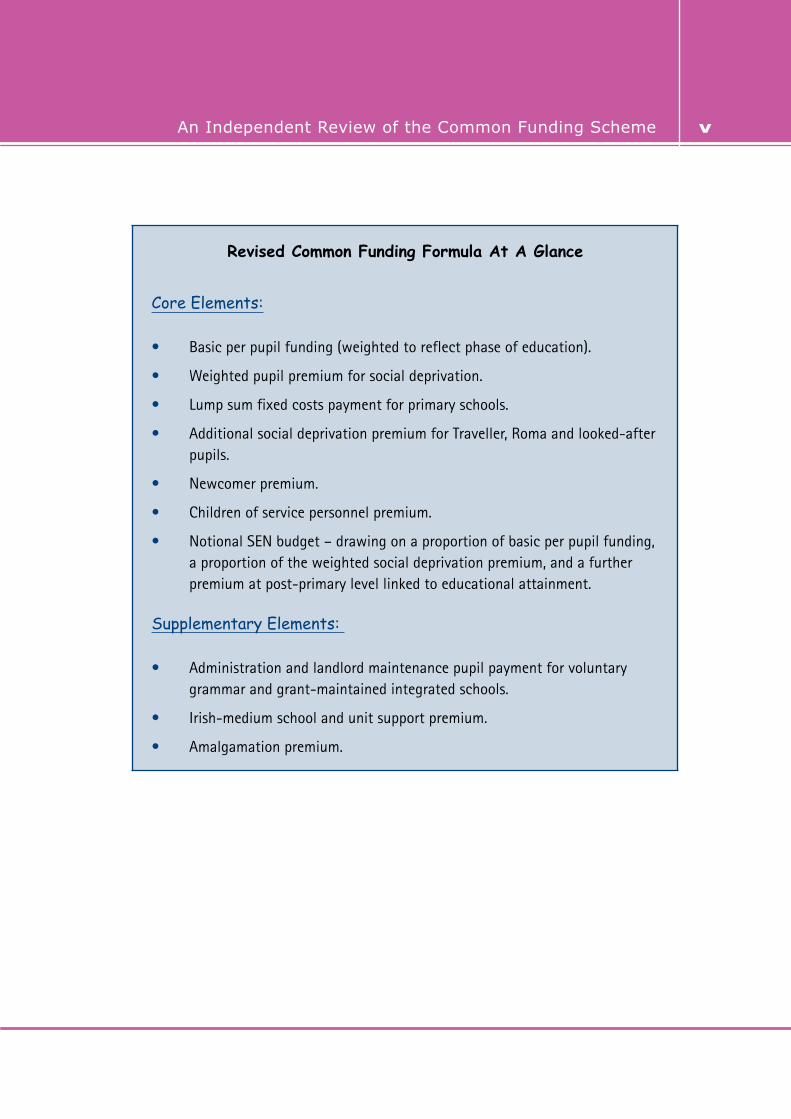
A fairer, simpler and more transparent funding formula
19. Although the panel proposes a formula with ten funding elements (summarised below), only a few will be relevant to most schools. In addition to significantly increasing the amount of funding dedicated to tackling educational disadvantage, the formula is considerably simplified, having only the minimum number of factors required to facilitate the distribution of funding in an equitable manner. Consequently, school funding will be more transparent. Most importantly, the proposed formula distributes as much funding as possible according to pupil rather than institutional needs.
These proposals are set out in Chapter 8 of the report.
Conclusion
20. The components of the proposed funding formula are the foundations for change that will benefit all pupils. However, the manner of implementation and transition are equally important.
21. The proposed funding model substantially reduces the considerable additional financial support for small schools provided in the current model, removing it completely at the post-primary level. The panel strongly recommends that a designation of ‘small school status’ for strategically necessary small schools is assigned as a matter of urgency, and that such schools are funded in part, or entirely from outside the Common Funding Formula.
22. The Department of Education must determine the timeframe and nature of the transition to the new formula and the other changes proposed. Additional short-term financial resources may be required to facilitate such significant system-level change.
An Independent Review of the Common Funding Scheme An Independent Review of the Common Funding Scheme v
Revised Common Funding Formula At A Glance
Core Elements:
• Basic per pupil funding (weighted to reflect phase of education).
• Weighted pupil premium for social deprivation.
• Lump sum fixed costs payment for primary schools.
• Additional social deprivation premium for Traveller, Roma and looked-after pupils.
• Newcomer premium.
• Children of service personnel premium.
• Notional SEN budget – drawing on a proportion of basic per pupil funding, a proportion of the weighted social deprivation premium, and a further premium at post-primary level linked to educational attainment.
Supplementary Elements:
• Administration and landlord maintenance pupil payment for voluntary grammar and grant-maintained integrated schools.
• Irish-medium school and unit support premium.
• Amalgamation premium.
An Independent Review of the Common Funding Schemevi
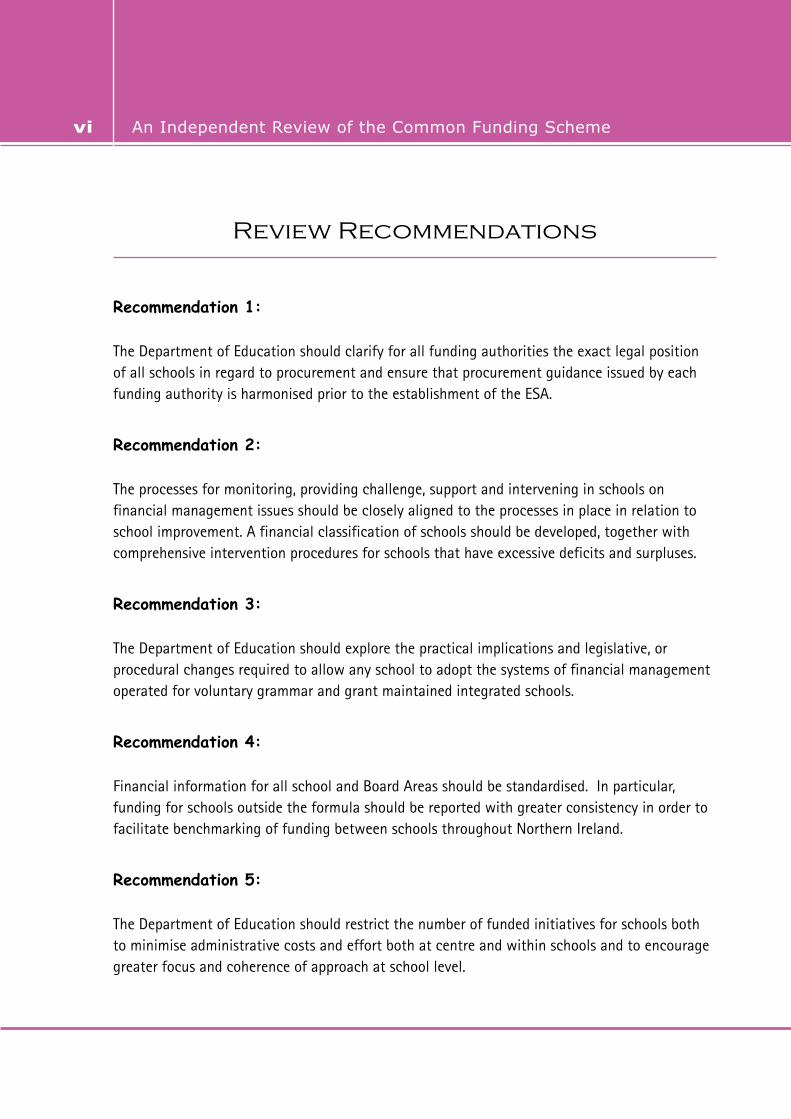
Review Recommendations
Recommendation 1:
The Department of Education should clarify for all funding authorities the exact legal position of all schools in regard to procurement and ensure that procurement guidance issued by each funding authority is harmonised prior to the establishment of the ESA.
Recommendation 2:
The processes for monitoring, providing challenge, support and intervening in schools on financial management issues should be closely aligned to the processes in place in relation to school improvement. A financial classification of schools should be developed, together with comprehensive intervention procedures for schools that have excessive deficits and surpluses.
Recommendation 3:
The Department of Education should explore the practical implications and legislative, or procedural changes required to allow any school to adopt the systems of financial management operated for voluntary grammar and grant maintained integrated schools.
Recommendation 4:
Financial information for all school and Board Areas should be standardised. In particular, funding for schools outside the formula should be reported with greater consistency in order to facilitate benchmarking of funding between schools throughout Northern Ireland.
Recommendation 5:
The Department of Education should restrict the number of funded initiatives for schools both to minimise administrative costs and effort both at centre and within schools and to encourage greater focus and coherence of approach at school level.
An Independent Review of the Common Funding Scheme An Independent Review of the Common Funding Scheme vii
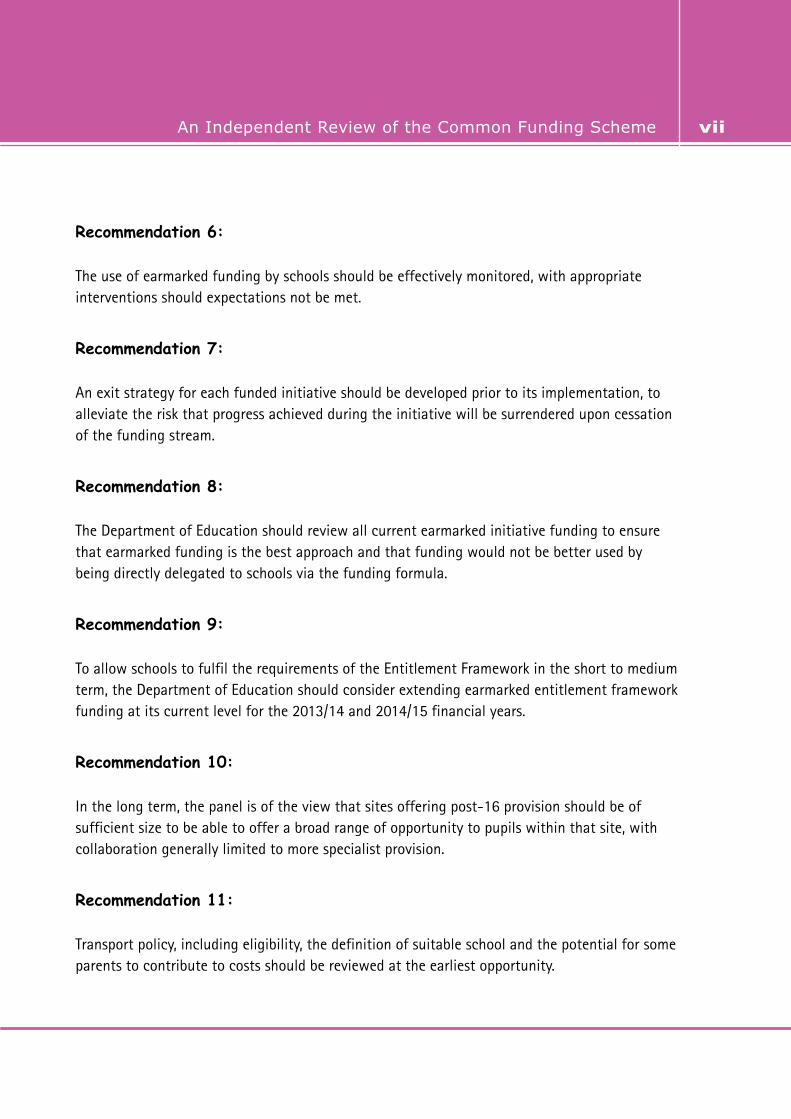
Recommendation 6:
The use of earmarked funding by schools should be effectively monitored, with appropriate interventions should expectations not be met.
Recommendation 7:
An exit strategy for each funded initiative should be developed prior to its implementation, to alleviate the risk that progress achieved during the initiative will be surrendered upon cessation of the funding stream.
Recommendation 8:
The Department of Education should review all current earmarked initiative funding to ensure that earmarked funding is the best approach and that funding would not be better used by being directly delegated to schools via the funding formula.
Recommendation 9:
To allow schools to fulfil the requirements of the Entitlement Framework in the short to medium term, the Department of Education should consider extending earmarked entitlement framework funding at its current level for the 2013/14 and 2014/15 financial years.
Recommendation 10:
In the long term, the panel is of the view that sites offering post-16 provision should be of sufficient size to be able to offer a broad range of opportunity to pupils within that site, with collaboration generally limited to more specialist provision.
Recommendation 11:
Transport policy, including eligibility, the definition of suitable school and the potential for some parents to contribute to costs should be reviewed at the earliest opportunity.

An Independent Review of the Common Funding Schemeviii
Recommendation 12:
The proposed regional school development service should assign a central role to supporting ongoing peer support at area and school level, providing greater opportunities for teachers to work together in sharing good practice, while also able to draw on external expert advice, where needed.
Recommendation 13:
Until the impact of the recent Special Education Needs review can begin to be assessed, and until there is greater consistency and precision is available financial information linked to pupil needs, it is best to continue to rely on current funding arrangements, and the use of funding outside the Aggregated Schools Budget.
The Department of Education should consider targeting funding and resources at the collective needs of statemented pupils within a school, rather than allocating physical resources or services to individual children, irrespective of circumstance.
Recommendation 14:
Consistent financial management information should be recorded for all special schools, in a format which will facilitate benchmarking with special schools elsewhere. There should be a specific review of special school funding at that stage.
Recommendation 15:
The funding arrangements for Alternative Education Providers should be reviewed. Arrangements to remove funding from mainstream schools following transfer should be assiduously followed (involving not only AWPU funding, but also Special Educational Needs and social deprivation funding), with transfer of this funding to EOTAS budgets.
An Independent Review of the Common Funding Scheme An Independent Review of the Common Funding Scheme ix
Recommendation 17:
More funding should be directly targeted at pupils from socially-disadvantaged backgrounds. This should be part of core school funding rather than short-term initiatives. A revised funding formula should increase the level of funding spent for social deprivation.
Recommendation 18:
Increased funding for socio-economic deprivation should be weighted towards schools with significant concentrations of disadvantage to reflect the negative effects of such concentrations.
Recommendation 19:
A notional Special Educational Needs budget should be identified for each school in Northern Ireland.
Recommendation 20:
The Department of Education should closely monitor and evaluate the use of additional resources and performance of schools and intervene rapidly when performance expectations are not met.
Recommendation 21:
Social deprivation funding should continue to be allocated using either adjusted Free School Meal eligibility criteria (to increase eligibility at post-primary), or “Ever Free School Meals” criteria.
Recommendation 22:
Ongoing investigation into an alternative, or adjunct measures to Free School Meals, as a measure of deprivation, should continue.

An Independent Review of the Common Funding Schemex
Recommendation 23:
Data should be gathered on maternal education for inclusion in pupil databases, and its efficacy modelled as a measure of additional educational need.
Recommendation 24:
In the future, the following principles should underpin the Common Funding Scheme:
• Sustainable schools should be funded according to the relative need of their pupils, and in a way that enables the effects of social disadvantage to be substantially reduced.
• Sustainable schools should be funded on a consistent and fair basis, taking full account of the needs of pupils.
• The formula should support schools in delivering the curriculum;
• The formula should underpin and reinforce wider education policy and objectives;
• The formula should be as transparent and comprehensible as possible and predictable in its outcome.
Recommendation 25:
Small school support factors should be removed from the Common Funding Formula. However, this must be combined with a Small Schools Policy and funding for strategically important small schools outside the formula.
The Department of Education should, as a matter of urgency, develop a Small Schools Policy, which defines clearly the circumstances in which a small school will be required and allows for schools to become designated small schools for funding purposes.

An Independent Review of the Common Funding Scheme An Independent Review of the Common Funding Scheme xi
Recommendation 26:
The Department of Education should aim to ensure that a future funding formula distributes as much funding as possible according to pupil rather than institutional needs and has the minimum number of factors required to facilitate the distribution of funding in an equitable manner thereby making it as clear as possible why a school receives the funding it does.
Recommendation 27
The Department of Education should consider the implementation of a new funding formula made up of following elements
• Basic Per Pupil funding (weighted to reflect phase of education).
• Weighted Pupil Premium for social deprivation.
• Lump sum fixed costs payment for primary schools.
• Additional Social Deprivation Premium for Traveller, Roma and looked-after pupils.
• Newcomer Premium
• Children of Service personnel premium.
• Notional SEN budget – drawing on a proportion of basic per pupil funding, a proportion of the weighted social deprivation premium, and a further premium at post-primary level linked to prior attainment (KS2, KS3 or GCSE , as appropriate).
• Administration and landlord maintenance pupil payment for Voluntary Grammar and Grant-maintained integrated schools
• Irish-medium school and unit support premium.
• Amalgamation Premium.

An Independent Review of the Common Funding Schemexii
Recommendation 28:
Voluntary grammar and grant-maintained integrated schools should be able to reclaim actual VAT costs from the funding authority. DE should investigate the potential for these schools to reclaim their VAT from HMRC.
Recommendation 29:
The balance of funding between primary and post-primary should be kept under review.
Recommendation 30:
In the medium to long-term, DE should consider moving towards a model whereby it commissions sixth form places on an area basis thereby maximising economies of scale and ensuring a broad, balanced curricular offer for all pupils; ensures open access to area based sixth forms; and considers with the Department of Employment and Learning the potential for joint funding arrangements for all 16-19 provision.
An Independent Review of the Common Funding Scheme An Independent Review of the Common Funding Scheme 1
Chapter 1
The Review Context
Scope of the Review
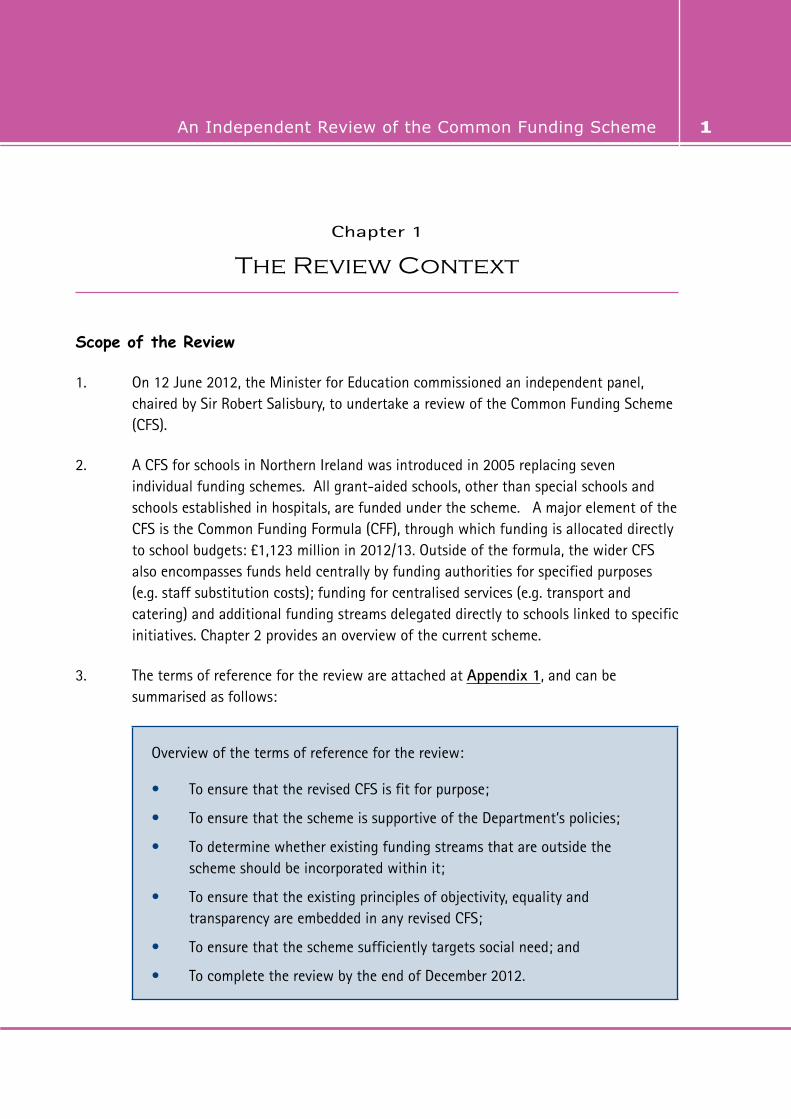
1. On 12 June 2012, the Minister for Education commissioned an independent panel, chaired by Sir Robert Salisbury, to undertake a review of the Common Funding Scheme (CFS).
2. A CFS for schools in Northern Ireland was introduced in 2005 replacing seven individual funding schemes. All grant-aided schools, other than special schools and schools established in hospitals, are funded under the scheme. A major element of the CFS is the Common Funding Formula (CFF), through which funding is allocated directly to school budgets: £1,123 million in 2012/13. Outside of the formula, the wider CFS also encompasses funds held centrally by funding authorities for specified purposes (e.g. staff substitution costs); funding for centralised services (e.g. transport and catering) and additional funding streams delegated directly to schools linked to specific initiatives. Chapter 2 provides an overview of the current scheme.
3. The terms of reference for the review are attached at Appendix 1, and can be summarised as follows:
Overview of the terms of reference for the review:
• To ensure that the revised CFS is fit for purpose;
• To ensure that the scheme is supportive of the Department’s policies;
• To determine whether existing funding streams that are outside the scheme should be incorporated within it;
• To ensure that the existing principles of objectivity, equality and transparency are embedded in any revised CFS;
• To ensure that the scheme sufficiently targets social need; and
• To complete the review by the end of December 2012.

An Independent Review of the Common Funding Scheme2
The Process
4. The review took an open and collaborative approach to gathering information for this report. This included an extensive review of relevant high quality research evidence; an analysis and critical appraisal of the relevant data on the education system; a comprehensive programme of stakeholder engagement and a formal call for evidence.
Stakeholder Meetings
5. In order to get a detailed understanding of the impact of the current funding arrangements on the wide range of school sectors, stakeholder engagement was identified as the defining characteristic of the review.
6. Between June and November 2012, the panel met with representatives from over 130 stakeholder groups. While mainly composed of education professionals from nursery, primary and post-primary schools, special schools and alternative education providers, the panel also met with a broader range of stakeholders. These included representatives from the Further Education and Higher Education sectors, with governor representatives, children and young people, area learning community representatives, sectoral support bodies, trade unions, support groups for children with additional educational needs, and a wide range of rural and community interest groups.
7. In addition, the panel consulted with relevant staff within the Department of Education (DE) and the Education and Library Boards (ELBs). At each meeting stakeholders were given the opportunity to provide evidence to the review. Meetings were informal and stakeholders were encouraged to provide frank opinions on the efficacy of the current CFS and to provide suggestions for change.
8. A broad summary of the major themes that emerged from the stakeholder meetings can be accessed at http://www.deni.gov.uk/index/schools-and-infrastructure-2/schools-finance/common-funding-section/independent-review-of-the-common-funding-scheme.htm.

An Independent Review of the Common Funding Scheme An Independent Review of the Common Funding Scheme 3
Call for Evidence
9. A significant amount of information was gathered through a call for evidence. This exercise enabled anyone with an interest to submit their views and any evidence that they may have related to the CFS.
10. The call for evidence was launched on 25 August 2012 and closed on 12 October 2012, although considerable leeway was afforded to organisations and individuals who could not meet the deadline. During this time, almost 400 written responses were received from a wide range of stakeholders. The outcomes of the call for evidence can be accessed at http://www.deni.gov.uk/index/schools-and-infrastructure-2/schools-finance/common-funding-section/independent-review-of-the-common-funding-scheme.htm.
11. The information gathered through stakeholder meetings, the call for evidence, and the panel’s own research, all form the basis for the remainder of this report.
Overview: The Northern Ireland Education System
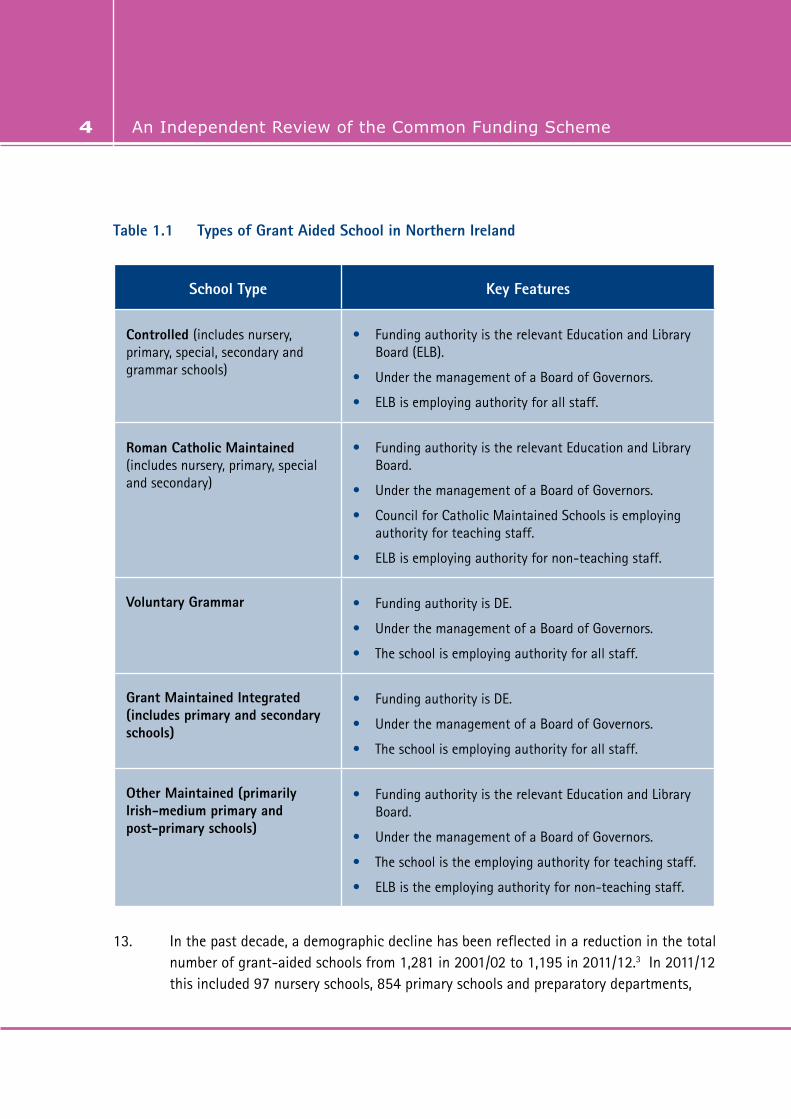
12. Northern Ireland has a diverse schools system, with controlled and maintained, voluntary grammar, grant maintained integrated and Irish-medium schools.1 The following table describes the large variety of grant-aided schools. 2
______________________________________________________________________
1 Throughout the report, controlled and maintained secondary schools and grant-maintained integrated post-primary schools have been collectively referred to as non-selective post-primary schools. The panel is aware that a number of grant-maintained integrated post-primary schools have a bi-lateral Year 8 intake and equally a number of voluntary grammar schools do not use academic selection. The term is, however, relatively accurate and useful for referring to schools with different management types collectively.
2 There are also 15 independent schools, which receive no state funding.
An Independent Review of the Common Funding Scheme4
Table 1.1 Types of Grant Aided School in Northern Ireland
School Type Key Features
Controlled (includes nursery, primary, special, secondary and grammar schools)
• Funding authority is the relevant Education and Library Board (ELB).
• Under the management of a Board of Governors.
• ELB is employing authority for all staff.
Roman Catholic Maintained (includes nursery, primary, special and secondary)
• Funding authority is the relevant Education and Library Board.
• Under the management of a Board of Governors.
• Council for Catholic Maintained Schools is employing authority for teaching staff.
• ELB is employing authority for non-teaching staff.
Voluntary Grammar • Funding authority is DE.
• Under the management of a Board of Governors.
• The school is employing authority for all staff.
Grant Maintained Integrated (includes primary and secondary schools)
• Funding authority is DE.
• Under the management of a Board of Governors.
• The school is employing authority for all staff.
Other Maintained (primarily Irish-medium primary and post-primary schools)
• Funding authority is the relevant Education and Library Board.
• Under the management of a Board of Governors.
• The school is the employing authority for teaching staff.
• ELB is the employing authority for non-teaching staff.
13. In the past decade, a demographic decline has been reflected in a reduction in the total number of grant-aided schools from 1,281 in 2001/02 to 1,195 in 2011/12.3 In 2011/12 this included 97 nursery schools, 854 primary schools and preparatory departments,

An Independent Review of the Common Funding Scheme An Independent Review of the Common Funding Scheme 5
216 post-primary schools, 41 special schools, 15 independent schools and two hospital schools.4
14. Despite this reduction, the percentage of primary schools here with fewer than 100 pupils continues to be significantly higher than in England and slightly higher than the percentages for Scotland and Wales. Equally, in the post-primary sector, we have a significantly greater percentage of schools with fewer than 300 pupils than England, Scotland and Wales.5
Table 1.26 Primary School Sizes7 – Years 1-7 - 2011/12
Number of pupils Number of schools
1-49 94
50- 99 203
100 – 199 281
200 – 299 119
300 – 399 83
400 – 499 37
500 + 37
Total 854
______________________________________________________________________
3 Source: http://www.deni.gov.uk/index/facts-and-figures-new/education-statistics/32_statistics_and_research-numbersofschoolsandpupils_pg/32_statistics_and_research-northernirelandsummarydata_pg.htm. Northern Ireland Summary data: Spreadsheet: Schools and Pupils in Northern Ireland 1991/92 to 2011/12. This total includes all nursery, primary, post-primary schools, as well as special schools and hospital schools. It excludes voluntary and private pre-school education providers and independent schools.
4 Source: http://www.deni.gov.uk/index/facts-and-figures-new/education-statistics/32_statistics_and_research-numbersofschoolsandpupils_pg/32_statistics_and_research-northernirelandsummarydata_pg.htm. Northern Ireland Summary data: Spreadsheet: Schools and Pupils in Northern Ireland 1991/92 to 2011/12.
5 Department of Education, Sustainable Schools Policy, (January, 2009).
6 Figures in Tables 1.2 and 1.3 provided by NISRA. Source: Northern Ireland Schools Census.
7 Includes preparatory departments in grammar schools
An Independent Review of the Common Funding Scheme6
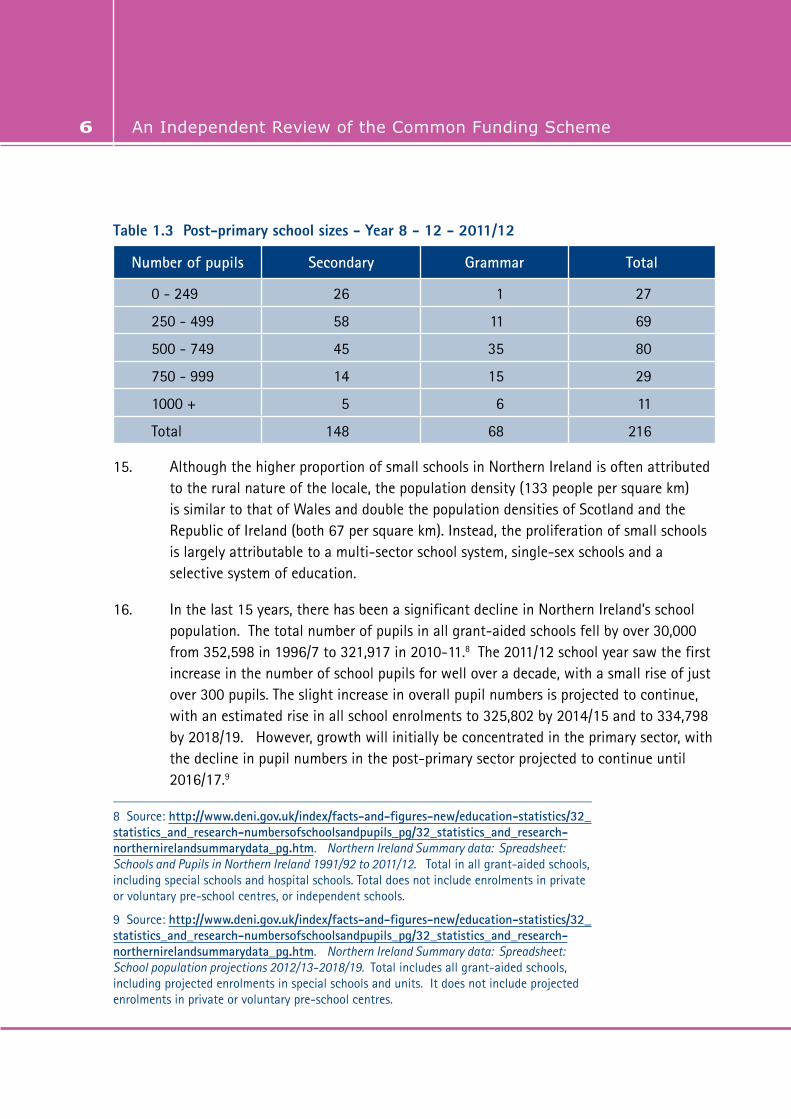
Table 1.3 Post-primary school sizes - Year 8 - 12 - 2011/12
Number of pupils Secondary Grammar Total
0 - 249 26 1 27
250 - 499 58 11 69
500 - 749 45 35 80
750 - 999 14 15 29
1000 + 5 6 11
Total 148 68 216
15. Although the higher proportion of small schools in Northern Ireland is often attributed to the rural nature of the locale, the population density (133 people per square km) is similar to that of Wales and double the population densities of Scotland and the Republic of Ireland (both 67 per square km). Instead, the proliferation of small schools is largely attributable to a multi-sector school system, single-sex schools and a selective system of education.
16. In the last 15 years, there has been a significant decline in Northern Ireland’s school population. The total number of pupils in all grant-aided schools fell by over 30,000 from 352,598 in 1996/7 to 321,917 in 2010-11.8 The 2011/12 school year saw the first increase in the number of school pupils for well over a decade, with a small rise of just over 300 pupils. The slight increase in overall pupil numbers is projected to continue, with an estimated rise in all school enrolments to 325,802 by 2014/15 and to 334,798 by 2018/19. However, growth will initially be concentrated in the primary sector, with the decline in pupil numbers in the post-primary sector projected to continue until 2016/17.9
________________________________________________________________________
8 Source: http://www.deni.gov.uk/index/facts-and-figures-new/education-statistics/32_statistics_and_research-numbersofschoolsandpupils_pg/32_statistics_and_research-northernirelandsummarydata_pg.htm. Northern Ireland Summary data: Spreadsheet: Schools and Pupils in Northern Ireland 1991/92 to 2011/12. Total in all grant-aided schools, including special schools and hospital schools. Total does not include enrolments in private or voluntary pre-school centres, or independent schools.
9 Source: http://www.deni.gov.uk/index/facts-and-figures-new/education-statistics/32_statistics_and_research-numbersofschoolsandpupils_pg/32_statistics_and_research-northernirelandsummarydata_pg.htm. Northern Ireland Summary data: Spreadsheet: School population projections 2012/13-2018/19. Total includes all grant-aided schools, including projected enrolments in special schools and units. It does not include projected enrolments in private or voluntary pre-school centres.
An Independent Review of the Common Funding Scheme An Independent Review of the Common Funding Scheme 7
17. The combined effect of a diverse school system and a 15 year period of declining enrolments is a school provision which has many small schools and a surplus of approximately 85,000 places.10 This in turn raises concerns about the quality of some pupils’ experience of school life and about the extent to which the broader aims of equity and efficiency are being met.
Policy context
18. The educational landscape has also changed considerably since the introduction of the CFS in 2005. Since that time, DE has put in place a coherent suite of policies, outlined below, designed to improve educational outcomes for young people. A key deliverable of the review is therefore to ensure that the CFS is supportive of DE’s key policies.
Key Education Policies and Priorities:
19. Every School a Good School – A Policy for School Improvement focuses on how schools can effectively meet the needs of all of their pupils by promoting the core characteristics that evidence shows make for a good school: child-centred provision; high quality teaching and learning; effective leadership; and connection to local community. The policy seeks to improve the life chances of all young people by raising attainment levels; it also sets out a formal intervention process for schools found by the Education and Training Inspectorate to offer less than satisfactory provision.
20. Count, read: succeed – a Strategy to Improve Outcomes in Literacy and Numeracy – is set within the context of the Every School a Good School policy and aligns key work strands with a particular focus on improving literacy and numeracy outcomes.
21. The Revised Curriculum promotes a greater focus on skills for life and work, and on connecting learning across the curriculum. Developing literacy and numeracy is a central element of a school’s delivery of the revised curriculum.
________________________________________________________________________
10 Estimates compiled by DE. Figures provided are derived from the approved enrolment number of each school for the 2010/11 school year against the actual enrolment at the 2010/11 school census date (8 October 2010). Figures exclude the following as they are admitted over and above a school’s approved enrolment number: pupils in receipt of a statement of special educational needs; pupils admitted to pre-school on appeal; pupils admitted to Year 1 (primary) on appeal; pupils admitted to Year 8 (post-primary) on appeal; and pupils in their first year at a post-primary school following their admission by the direction of the Exceptional Circumstances Body.
An Independent Review of the Common Funding Scheme8
22. The Entitlement Framework is designed to ensure that pupils have access to a broad and balanced range of learning opportunities suited to their needs, aptitudes and interests. It guarantees all pupils access to a minimum number of courses at Key Stage 4 and post-16, of which at least one-third must be general and one-third applied.
23. Area-based planning is a strategic approach to planning education on an area basis. It recognises that the raising standards agenda can only be delivered effectively and efficiently through a network of strong, sustainable schools. The Sustainable Schools Policy is a key driver for the area planning process offering a robust framework for considering the educational viability of schools. Its focus is on high quality education, maximising the benefits for children and young people through the efficient and effective use of available resources.
24. Transfer 2010 Guidance provided a menu of recommended non-academic admissions criteria for use by post-primary schools. This guidance was subsequently updated and published as a statement of policy covering Transfer 2011 and beyond.
25. The Review of Special Educational Needs (SEN) and Inclusion aims to build on the existing SEN policy framework to develop the capacity of mainstream schools to meet the needs of children with SEN, within the wider network of special schools, units and learning support centres.
26. Learning to Learn: A Framework for Early Years Education and Learning provides both the defining principles and key actions for the future development of all early years education and learning services. The aim of the framework is to ensure all children should have opportunities to achieve their potential through high quality early learning and education experiences
Summary - The Context of the Review
27. The wider framework for this review is, therefore, how to provide a fit-for-purpose funding scheme for a diverse schools system, emerging from a period of sustained demographic decline, during a period of considerable planned change to its structures and institutions. In addition, the current financial environment, characterised by falling real-terms budgets, will compound the challenges of implementing reform.

An Independent Review of the Common Funding Scheme An Independent Review of the Common Funding Scheme 9
28. This report sets out the conclusions reached by the panel on the basis of the evidence provided during the review. The panel is satisfied that this report provides a fair and comprehensive review of the CFS as it is. We are also satisfied that it proposes a revised scheme that will support DE policy in a manner that is equitable and transparent. The report also highlights areas that require more in-depth analysis and which whilst outside the remit of this review do have a direct impact on its outcomes.

An Independent Review of the Common Funding Scheme10
Chapter 2
Overview of the Common Funding Scheme
The Common Funding Scheme
1. Since 2005/6, the Common Funding Scheme (CFS), drawn up by the Department of Education (DE), has been the framework for the distribution of the General Schools Budget, which provides both revenue funding to schools and funds a number of central education services.1
2. The CFS was developed to be objective, fair, and transparent; it was to help mitigate the effects of social disadvantage, and underpin wider education policy.
3. Funding from budget allocations to DE is distributed each year to ‘funding authorities’. Currently these are the five Education and Library Boards (ELBs), which fund controlled and maintained schools in their areas and DE, which is the funding authority for voluntary grammar and grant-maintained integrated schools.
4. Most of the funding delegated to schools by the funding authorities is allocated from the Aggregated Schools Budget (ASB) using the Common Funding Formula (CFF). The ASB is the largest component of the General Schools Budget.
5. Smaller additional amounts may be delegated to certain schools by funding authorities – often linked to a specific initiative (such as the Extended Schools Programme) funded either by DE, or by an individual ELB.
6. In addition, the funding authorities support schools by providing central funding to cover many costs, for example, school salary costs linked to long-term sickness, the costs of additional support for pupils with statemented special educational needs, and school transport costs. Some of this may be linked to individual schools as ‘non-delegated’ expenditure.
________________________________________________________________________
1 It should be noted that special schools are not funded via the CFS rather their funding is determined separately by the relevant ELB.
An Independent Review of the Common Funding Scheme An Independent Review of the Common Funding Scheme 11
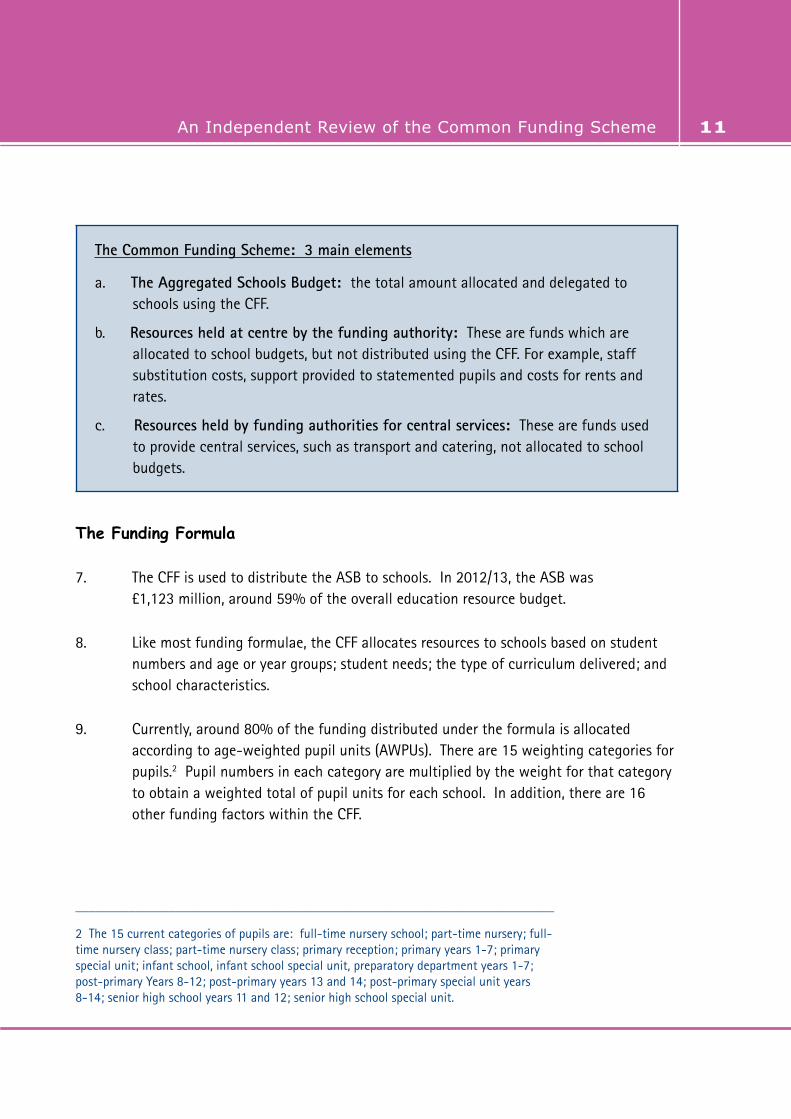
The Common Funding Scheme: 3 main elements
a. The Aggregated Schools Budget: the total amount allocated and delegated to schools using the CFF.
b. Resources held at centre by the funding authority: These are funds which are allocated to school budgets, but not distributed using the CFF. For example, staff substitution costs, support provided to statemented pupils and costs for rents and rates.
c. Resources held by funding authorities for central services: These are funds used to provide central services, such as transport and catering, not allocated to school budgets.
The Funding Formula
7. The CFF is used to distribute the ASB to schools. In 2012/13, the ASB was £1,123 million, around 59% of the overall education resource budget.
8. Like most funding formulae, the CFF allocates resources to schools based on student numbers and age or year groups; student needs; the type of curriculum delivered; and school characteristics.
9. Currently, around 80% of the funding distributed under the formula is allocated according to age-weighted pupil units (AWPUs). There are 15 weighting categories for pupils.2 Pupil numbers in each category are multiplied by the weight for that category to obtain a weighted total of pupil units for each school. In addition, there are 16 other funding factors within the CFF.
________________________________________________________________________
2 The 15 current categories of pupils are: full-time nursery school; part-time nursery; full-time nursery class; part-time nursery class; primary reception; primary years 1-7; primary special unit; infant school, infant school special unit, preparatory department years 1-7; post-primary Years 8-12; post-primary years 13 and 14; post-primary special unit years 8-14; senior high school years 11 and 12; senior high school special unit.
An Independent Review of the Common Funding Scheme12
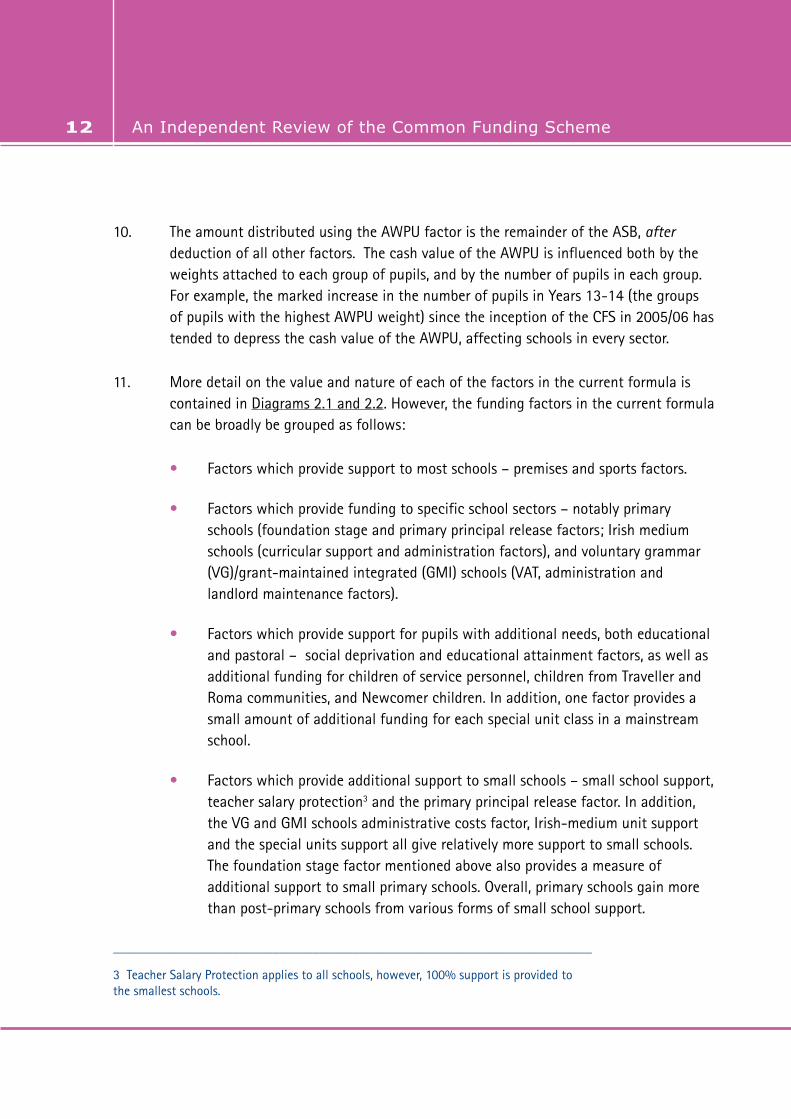
10. The amount distributed using the AWPU factor is the remainder of the ASB, after deduction of all other factors. The cash value of the AWPU is influenced both by the weights attached to each group of pupils, and by the number of pupils in each group. For example, the marked increase in the number of pupils in Years 13-14 (the groups of pupils with the highest AWPU weight) since the inception of the CFS in 2005/06 has tended to depress the cash value of the AWPU, affecting schools in every sector.
11. More detail on the value and nature of each of the factors in the current formula is contained in Diagrams 2.1 and 2.2. However, the funding factors in the current formula can be broadly be grouped as follows:
• Factors which provide support to most schools – premises and sports factors.
• Factors which provide funding to specific school sectors – notably primary schools (foundation stage and primary principal release factors; Irish medium schools (curricular support and administration factors), and voluntary grammar (VG)/grant-maintained integrated (GMI) schools (VAT, administration and landlord maintenance factors).
• Factors which provide support for pupils with additional needs, both educational and pastoral – social deprivation and educational attainment factors, as well as additional funding for children of service personnel, children from Traveller and Roma communities, and Newcomer children. In addition, one factor provides a small amount of additional funding for each special unit class in a mainstream school.
• Factors which provide additional support to small schools – small school support, teacher salary protection3 and the primary principal release factor. In addition, the VG and GMI schools administrative costs factor, Irish-medium unit support and the special units support all give relatively more support to small schools. The foundation stage factor mentioned above also provides a measure of additional support to small primary schools. Overall, primary schools gain more than post-primary schools from various forms of small school support.
________________________________________________________________________
3 Teacher Salary Protection applies to all schools, however, 100% support is provided to the smallest schools.

An Independent Review of the Common Funding Scheme An Independent Review of the Common Funding Scheme 13
12. It should be noted nursery schools are eligible for funding from only some of these factors – premises, social deprivation, teacher salary protection, Traveller/Roma, and Newcomer factors.
Diagram 2.1 Aggregated Schools Budget Distribution: Breakdown of Funding Factors in 2012/134
________________________________________________________________________
4 Source: Local management of schools, Common Funding Scheme 2012-13, p.107. This can be accessed at. http://www.deni.gov.uk/index/schools-and-infrastructure-2/schools-finance/common-funding-section/common-funding-scheme-2012-13.htm

An Independent Review of the Common Funding Scheme14
Funding FactorFunding £000’s
% ASB
Pupil AWPU 895,438 79.71%
Premises 66,312 5.90%
TSN 56,860 5.06%
Small schools support 28,891 2.57%
Foundation stage 23,166 2.06%
Landlord maintenance 9,334 0.83%
Primary principals’ release time 8,845 0.79%
Newcomer 8,420 0.75%
Administration costs 7,481 0.66%
Teachers salary protection 6,024 0.54%
Sports 5,588 0.50%
VAT costs 4,235 0.38%
Children of the Traveller community
962 0.09%
Irish-medium pupils and units funding
878 0.08%
Special units 591 0.05%
Children of service personnel 308 0.03%
TOTAL FUNDING 1,123,333

An Independent Review of the Common Funding Scheme An Independent Review of the Common Funding Scheme 15
Diagram 2.2 Common Funding Formula Factors
The Age Weighted Pupil Unit
Per pupil funding: pupil numbers in each category are multiplied by the weight for that category to obtain a weighted total for each school.
Premises
40% of premises funding is allocated on the basis of the school’s approved premises area in square metres, with the remaining 60% of funding distributed on the basis of the number of pupils enrolled.
Small School Support
Tapered lump sum for primary schools with less than 300 pupils and post-primary schools with less than 550 pupils.
Primary Principal Release Time
Lump sum payment for primary schools with enrolments below 100 pupils (£16,420 in 2012/13), with an adjustment in funding of -£80-£82.10 per pupil above 100 pupils up to 300 pupils.
Foundation Stage
Additional per pupil funding for Years 1 and 2 pupils (£350.45 in 2012/13). Minimum lump sum of £12k for all schools (including Irish-medium units) with an additional allocation of £350.45 for each pupil above 10 in the combined Year 1 and Year 2 cohort.
Teacher Salary Protection
Schools with up to four teachers receive 100% of their above average teacher salary costs, tapering to zero for schools of 30 teachers.
An Independent Review of the Common Funding Scheme16
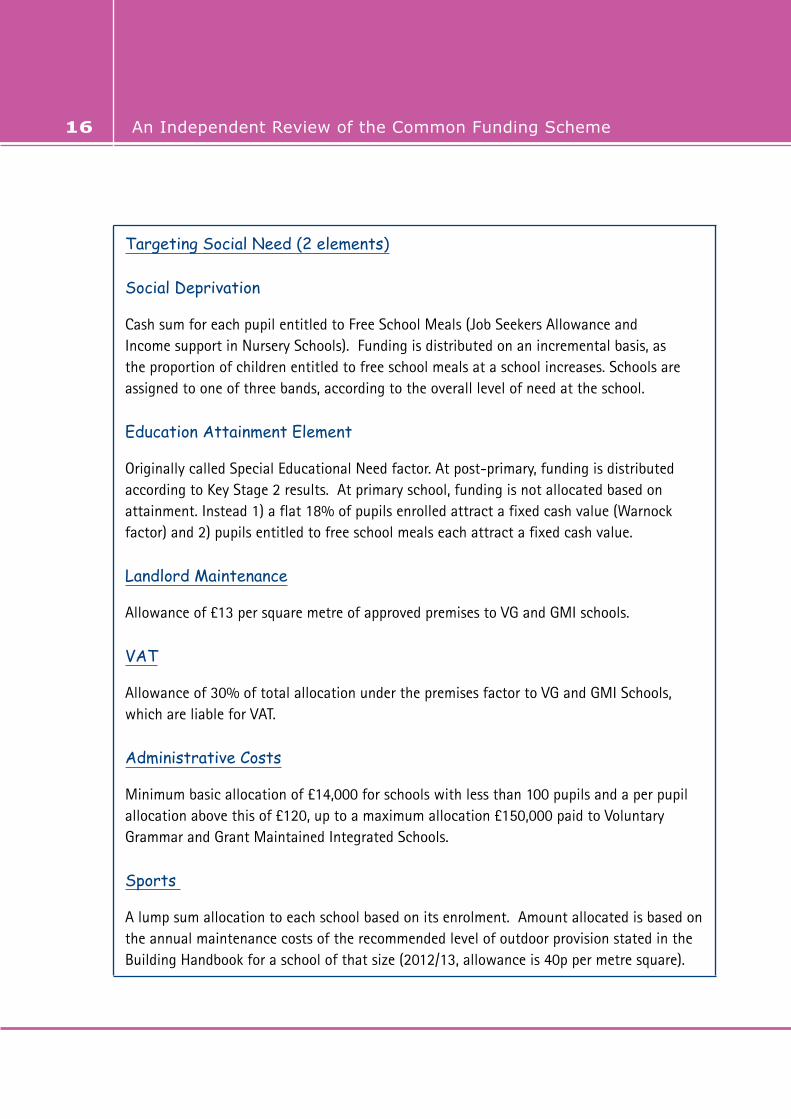
Targeting Social Need (2 elements)
Social Deprivation
Cash sum for each pupil entitled to Free School Meals (Job Seekers Allowance and Income support in Nursery Schools). Funding is distributed on an incremental basis, as the proportion of children entitled to free school meals at a school increases. Schools are assigned to one of three bands, according to the overall level of need at the school.
Education Attainment Element
Originally called Special Educational Need factor. At post-primary, funding is distributed according to Key Stage 2 results. At primary school, funding is not allocated based on attainment. Instead 1) a flat 18% of pupils enrolled attract a fixed cash value (Warnock factor) and 2) pupils entitled to free school meals each attract a fixed cash value.
Landlord Maintenance
Allowance of £13 per square metre of approved premises to VG and GMI schools.
VAT
Allowance of 30% of total allocation under the premises factor to VG and GMI Schools, which are liable for VAT.
Administrative Costs
Minimum basic allocation of £14,000 for schools with less than 100 pupils and a per pupil allocation above this of £120, up to a maximum allocation £150,000 paid to Voluntary Grammar and Grant Maintained Integrated Schools.
Sports
A lump sum allocation to each school based on its enrolment. Amount allocated is based on the annual maintenance costs of the recommended level of outdoor provision stated in the Building Handbook for a school of that size (2012/13, allowance is 40p per metre square).
An Independent Review of the Common Funding Scheme An Independent Review of the Common Funding Scheme 17
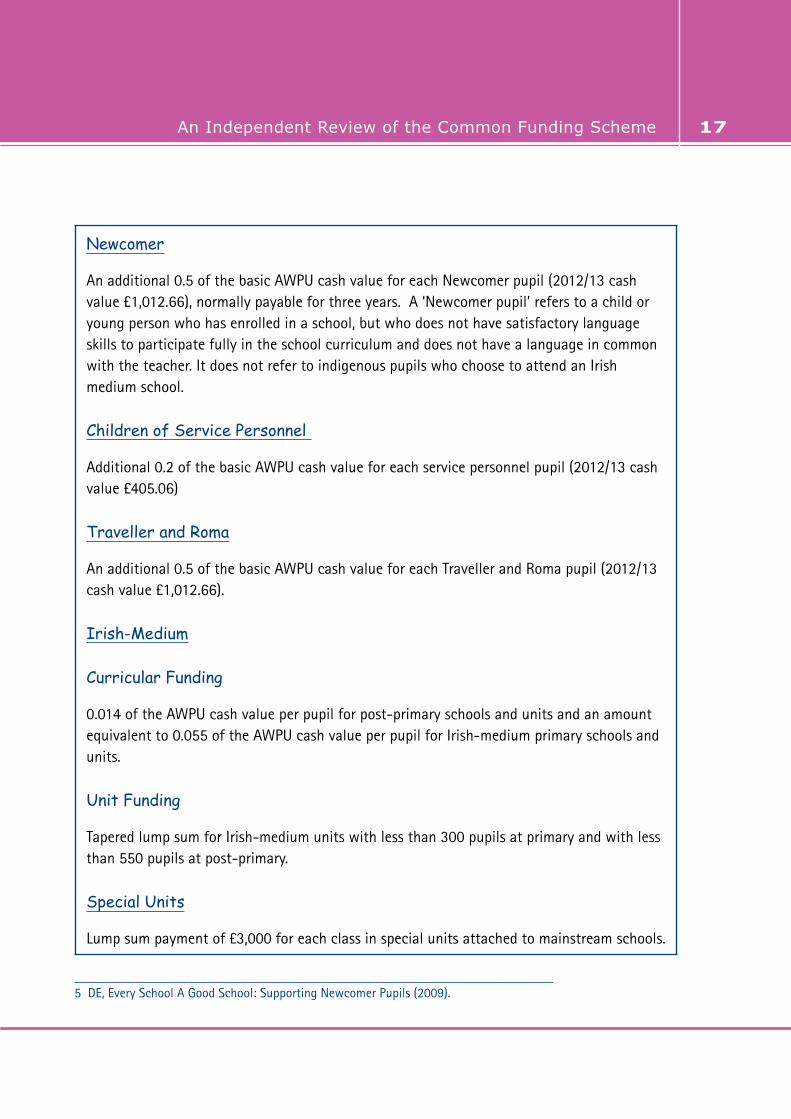
Newcomer
An additional 0.5 of the basic AWPU cash value for each Newcomer pupil (2012/13 cash value £1,012.66), normally payable for three years. A ‘Newcomer pupil’ refers to a child or young person who has enrolled in a school, but who does not have satisfactory language skills to participate fully in the school curriculum and does not have a language in common with the teacher. It does not refer to indigenous pupils who choose to attend an Irish medium school.
Children of Service Personnel
Additional 0.2 of the basic AWPU cash value for each service personnel pupil (2012/13 cash value £405.06)
Traveller and Roma
An additional 0.5 of the basic AWPU cash value for each Traveller and Roma pupil (2012/13 cash value £1,012.66).
Irish-Medium
Curricular Funding
0.014 of the AWPU cash value per pupil for post-primary schools and units and an amount equivalent to 0.055 of the AWPU cash value per pupil for Irish-medium primary schools and units.
Unit Funding
Tapered lump sum for Irish-medium units with less than 300 pupils at primary and with less than 550 pupils at post-primary.
Special Units
Lump sum payment of £3,000 for each class in special units attached to mainstream schools.
________________________________________________________________________ 5 DE, Every School A Good School: Supporting Newcomer Pupils (2009).

An Independent Review of the Common Funding Scheme18
Chapter 3
Funding Patterns and Trends
Introduction
1. Chapters 3 and 4 assess the current funding arrangements for schools from two broad perspectives:
• the financial implications of the Common Funding Scheme (CFS) for schools since its introduction; and
• how far the scheme achieves both its underlying principles and is in line with current Department of Education (DE) policy.
2. This chapter examines funding patterns and trends since the introduction of the scheme in 2005/6. Inevitably, the financial implications of the CFS on schools and each school phase has been heavily influenced by the wider trends in funding levels and pupil numbers since 2005/6.
3. The scheme, combined with changes in funding and enrolment levels, has resulted in some schools, even within the same phase of education, receiving significantly more funding per pupil than others. Schools of different types have also experienced notably different rates of growth in funding since 2005/6.
Demographic Trends: 2005/06 to 2014/15
4. Table 3.1 provides an overview of trends in pupil numbers from 2005/06 to date, and projects likely pupil numbers in 2014/15 – the earliest date by which a revised scheme might be applied. As can be seen, the past few years have shown a drop in overall pupil numbers, with fewer pupils in Northern Ireland’s schools than in 2005/06. The demographic decline has mainly affected numbers at primary and years 8-12 at post-primary. Nursery school enrolments have remained fairly stable, whilst post 16 enrolments have expanded considerably.

An Independent Review of the Common Funding Scheme An Independent Review of the Common Funding Scheme 19
Table 3.11: Total Enrolments/Pupil Numbers 2005/06, 2011/12 and Projected Enrolments for 2014/15
Total Enrolments/Pupil Numbers Change in Pupil numbers
% Change in Pupil Numbers
2005/6 2011/12 2014/15 (Projected)
11/12 vs
05/06
14/15 vs
11/12
11/12 vs
05/06
14/15 vs
11/12
Nursery Schools 6,175 5,911 5,911 -264 0 -4.3% 0.0%
Nursery unit 8,049 8,669 8,721 620 52 7.7% 0.6%
Reception 754 449 333 -305 -116 -40.5% -25.8%
Primary Schools, included preparatory departments (years 1-7 only) – mainstream classes
160,084 154,751 164,920 -5,333 10,169 -3.3% 6.6%
Post-Primary Years 8-12 – mainstream classes
124,528 116,354 109,926 -8,174 -6,428 -6.6% -5.5%
Post-Primary Years 13-14 – mainstream classes
26,433 29,631 29,651 3,198 20 12.1% 0.1%
Special Schools 4,599 4,549 4,606 -50 57 -1.1% 1.3%
Primary Special Units
1,059 943 1,005 -116 62 -11.0% 6.6%
Post-Primary Special Units
879 762 729 -117 -33 -13.3% -4.3%
Total 322,560 322,019 325,802 -541 3,783 -0.2% 1.2%
_________________________________________________________________
1 Figures provided by NISRA.
An Independent Review of the Common Funding Scheme20
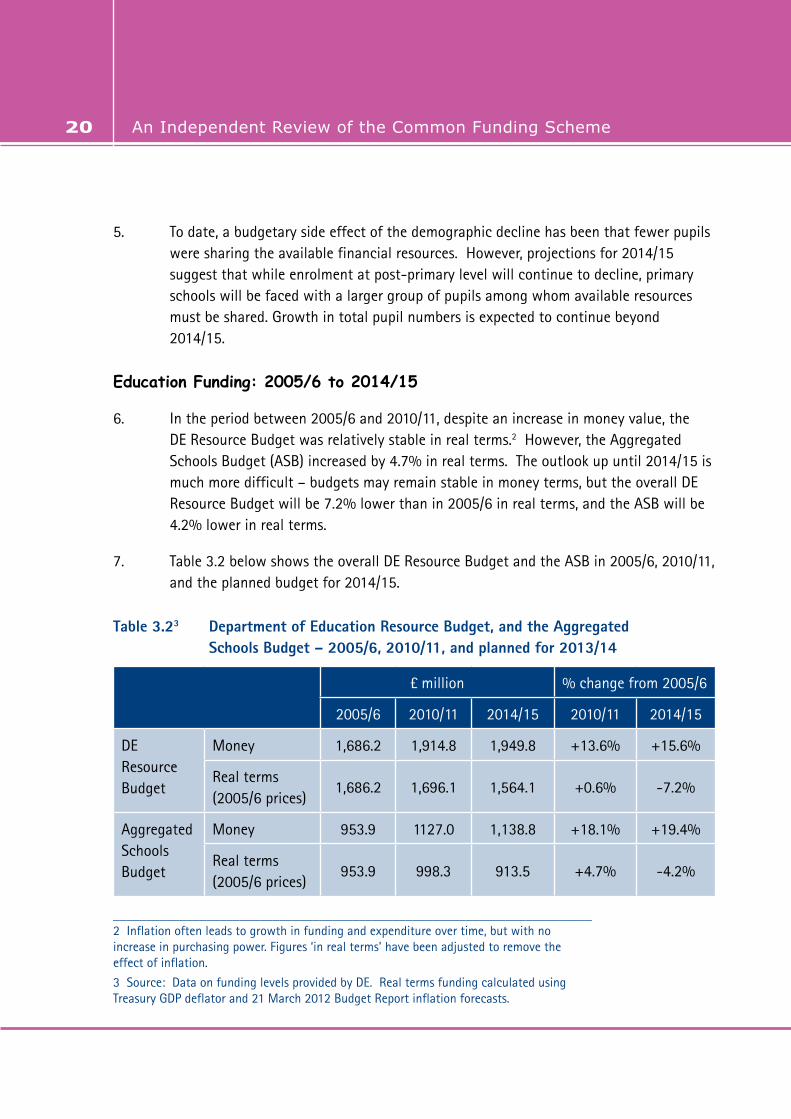
5. To date, a budgetary side effect of the demographic decline has been that fewer pupils were sharing the available financial resources. However, projections for 2014/15 suggest that while enrolment at post-primary level will continue to decline, primary schools will be faced with a larger group of pupils among whom available resources must be shared. Growth in total pupil numbers is expected to continue beyond 2014/15.
Education Funding: 2005/6 to 2014/15
6. In the period between 2005/6 and 2010/11, despite an increase in money value, the DE Resource Budget was relatively stable in real terms.2 However, the Aggregated Schools Budget (ASB) increased by 4.7% in real terms. The outlook up until 2014/15 is much more difficult – budgets may remain stable in money terms, but the overall DE Resource Budget will be 7.2% lower than in 2005/6 in real terms, and the ASB will be 4.2% lower in real terms.
7. Table 3.2 below shows the overall DE Resource Budget and the ASB in 2005/6, 2010/11, and the planned budget for 2014/15.
Table 3.23 Department of Education Resource Budget, and the Aggregated Schools Budget – 2005/6, 2010/11, and planned for 2013/14
£ million % change from 2005/6
2005/6 2010/11 2014/15 2010/11 2014/15
DE Resource Budget
Money 1,686.2 1,914.8 1,949.8 +13.6% +15.6%
Real terms (2005/6 prices)
1,686.2 1,696.1 1,564.1 +0.6% -7.2%
Aggregated Schools Budget
Money 953.9 1127.0 1,138.8 +18.1% +19.4%
Real terms (2005/6 prices)
953.9 998.3 913.5 +4.7% -4.2%
________________________________________________________________________ 2 Inflation often leads to growth in funding and expenditure over time, but with no increase in purchasing power. Figures ‘in real terms’ have been adjusted to remove the effect of inflation.
3 Source: Data on funding levels provided by DE. Real terms funding calculated using Treasury GDP deflator and 21 March 2012 Budget Report inflation forecasts.

An Independent Review of the Common Funding Scheme An Independent Review of the Common Funding Scheme 21
Nursery, Primary and Post-Primary Funding: 2005/6-2010/11
8. When examining resource patterns and trends in school funding, this Chapter takes account of both the ASB and additional funding streams provided to schools. The selected additional funding streams outside the ASB that have been included for analysis are detailed in Appendix 2 of the report. This is essential because some of the additional funding streams are substantial and often provide additional support to selected schools, perhaps concentrated within a particular school phase. 4
9. The result of the current funding arrangements, combined with changes in budget levels and enrolment numbers, has been that some school phases as a whole and some types of school in particular receive more funding per pupil than others and have experienced different rates of growth in funding since the introduction of the scheme. Appendices 3, 4, 5 and 6 present in detail the changes in funding levels for school phases and sectors between 2005/6 and 2010/11. 5
Nursery Schools
10. Since 2005/6, the number of Full Time Equivalent pupils has remained fairly stable in nursery schools, with schools generally filling to capacity throughout the period. However, there has been a slight decline in actual pupil numbers (4.3% between 2005/6 and 2011/12), as more schools now offer full-time provision. Between 2005/6 and 2010/11, funding per full-time equivalent pupil increased by 21.3%. In 2010/11, funding per full-time equivalent pupil amounted to £3797, 2% below the average for pupils across all phases, but notably 19% higher than the primary phase.
_______________________________________________________________________
4 It should also be noted that between 2005/6 and 2010/11, there have also been funding transfers from these additional funding streams into the ASB. For example, funding to cover teacher salary costs associated with Upper Spine Points was subsumed into the ASB; and the cessation of funding for Early Years initiatives such as Making a Good Start was linked to the expansion of the ASB to include funding for a Foundation Stage factor.
5 These tables and the attached explanations provide the basis for all per pupil funding figures and changes in funding levels quoted through this chapter. 2010/11 is the last financial year for which reliable financial data was available to the panel for a number of additional funding streams provided to schools. It should be particularly noted that the pupil numbers used to drive the Common Funding Formula are those from the preceding census i.e. 2009/10 and it is these pupil numbers that have been used to inform funding per pupil calculations. When pupil numbers are quoted without reference to funding changes, the most update to date NISRA figures available have been used, namely 2011/12 enrolments.
An Independent Review of the Common Funding Scheme22
11. Nursery schools are usually small, often with two classrooms, and most frequently with between 52 and 78 full-time equivalent pupils. Given the truncated size range, there are not large differences in per-pupil funding by size of school. The level of social deprivation in a school is a key element in determining differences in per capita funding.
Primary Schools
12. Funding in primary schools increased between 2005/6 and 2010/11, both in total and per pupil. Per pupil, it increased by 27%. As pupil numbers declined during the same period: fewer pupils were sharing increasing financial resources.
13. Funding in primary schools has grown faster than in the other phases since 2005/6. This has been partly due to the introduction of a foundation stage factor within the Common Funding Formula (CFF) and a marginal increase in the formula’s age-weighted pupil unit weight for pupils in Year 1-7 amongst other changes during this time. Nonetheless, despite this growth, funding per pupil amounted to £3,182 in 2010/11, which is 18% below the average for pupils across all phases.
14. Within primary schools, there is very significant variation in the amount of funding per pupil allocated through the funding formula ranging at the very extreme from £2,442 per pupil to £14,632 (roughly six times the lowest per pupil funding). More usually funding varies from approximately £2,500 per pupil to approximately £6000 per pupil. This variation is largely attributable to the range of small schools protection provided to small primary schools under current funding arrangements. As highlighted in Chapter 1, there is considerable variation in primary school size in Northern Ireland, and an unusually large proportion of very small schools. Diagram 3.1 illustrates that under the current formula, funding per pupil at primary school level decreases, as school size increases and funding per pupil in schools with fewer than about 100 pupils is significantly higher than in larger schools.
15. Whilst there is not a perfect correlation between individual school size and funding per capita, it is notable that 299 of the 300 primary schools which receive the highest per capita funding have less than 100 pupils.

An Independent Review of the Common Funding Scheme An Independent Review of the Common Funding Scheme 23
Diagram 3.16 Aggregated School Budget funding per pupil Primary schools, 2012/13, by school size band
Post-Primary Schools
16. Pupil numbers in post-primary schools as a whole fell by 3.4% between 2005/6 and 2011/12, but this masks considerable variation between types of school. Pupil numbers in grant-maintained integrated schools rose by 11.3%, but these schools account for only about 6.4% of the overall post-primary enrolment. Enrolment numbers in other non-selective schools fell by 7.6%, or almost 6,200 pupils. At the same time, non-selective schools expanded their sixth form enrolments by over 2,500 pupils during this period, so the contraction in years 8-12 was actually around 7,800 pupils. Voluntary grammar school enrolment numbers remained comparatively stable.
________________________________________________________________________
6 Figures in Diagram 3.1 exclude infant schools and preparatory departments. Figures also exclude AWPU funding for nursery unit and special unit pupils and the lump sum payment for special units. Other funding for nursery and special units cannot be disaggregated from total funding for the host primary school.

An Independent Review of the Common Funding Scheme24
17. Overall funding in post-primary schools grew more slowly than in the other phases during the period 2005/6 to 2010/11; per pupil it increased by 21%. Funding per pupil in grammar schools grew by 18%. Growth in funding per pupil was faster in non-selective schools, rising by 23%, due to a combination of factors.
• the reducing enrolments in year 8-12 increased the significance of small school support provided through the CFF;
• the growth in sixth form enrolment numbers brought additional funding due to the high age-weighted pupil unit weight for sixth form pupils;
• whilst outside the CFF, funding for Entitlement Framework was of particular assistance within this group of schools.
18. It should be noted, however, that funding per pupil in the post-primary phase amounted to £4,617 in 2010/11 – almost 20% above the average for pupils across all phases.
19. As with primary schools, post-primary schools vary in size. As demonstrated in Diagram 3.2, under the current formula, funding per pupil in schools with fewer than 500 pupils rises significantly, particularly among schools where the enrolment number is declining. The range of funding per pupil through the CFS is narrower than in primary schools, ranging in 2010/11 from £3,815 to £6,204 per pupil.

An Independent Review of the Common Funding Scheme An Independent Review of the Common Funding Scheme 25
Diagram 3.27 Aggregated School Budget funding per pupil post-primary schools, 2012/13, by school size band
Future Funding Patterns and Trends
20. At the earliest, policy changes based on recommendations from this Review could be introduced from 2014/15. The funding patterns and trends which were evident between 2005/6 and 2010/11 will have changed in several important ways by then:
• As already highlighted, the wider financial outlook up until 2014/15 is much more difficult. The Departmental budget and ASB may remain stable in money terms, but the overall DE Resource budget will be 7.8% lower than in 2010/11, in real terms, and the ASB will be 8.5% lower in real terms.
________________________________________________________________________
7 Figures in Diagram 3.1 exclude senior high schools and preparatory departments. Figures also exclude AWPU funding for special unit pupils and the lump sum payment for special units. Other funding for special units cannot be disaggregated from total funding for the host school.

An Independent Review of the Common Funding Scheme26
• As noted in Chapter 1, after a period of sustained decline, the number of primary school pupils has begun to rise. By 2014/15, DE is forecasting that there will 10,231 more pupils than in 2011/12, a 6.6% increase. In the post-primary phase, pupil numbers are forecast to remain stable in grammar schools. Excluding grammar schools, the number of sixth form pupils is forecast to remain at 2010/11 levels, but by 2014/15 the number of pupils in years 8-12 in these schools will be 6,212 lower than in 2011/12, a substantial 8.7% decrease. Overall, there will be a very slight (1.1%) increase of 3,783 pupils in the total number of school aged pupils.
21. Information on the distribution of the ASB was available to the panel up to and including 2012/13. Table 3.6 shows the percentage change in funding per full-time equivalent pupil by school phase between 2005/6 and 2012/13, in real terms.
Table 3.68 Aggregated Schools Budget - percentage change in funding per full-time equivalent pupil between 2005/6 and 2012/13, by school phase, in real terms without the effect of inflation
School Phase Percentage change, 2005/6 – 2012/13
Nursery school +0.9%
Primary school +11.8%
Post-Primary school -1.5%
22. In real terms, the growth in funding per pupil that was evident in primary schools between 2005/6 and 2010/11 has largely been protected. The growth in the nursery school phase, however, will be largely eroded; and by 2012/13 funding per pupil in post-primary schools will be 1.5% lower in real terms than in 2005/6, even after accounting for the effects of sixth form expansion. Post-primary schools without sixth forms or with small sixth forms will have experienced a greater reduction in funding.
________________________________________________________________________
8 Source: Data on funding levels provided by DE. Real terms funding calculated using Treasury GDP deflator and 21 March 2012 Budget Report inflation forecasts.

An Independent Review of the Common Funding Scheme An Independent Review of the Common Funding Scheme 27
Surpluses and Deficits
23. Financial management guidance issued by DE, and adopted by other funding authorities, states that no school can plan for a budget deficit without the consent of the funding authority. The following table shows the number of schools, by school type, which had a deficit at March 2005, March 2011, or March 2012 (excluding voluntary grammar and grant-maintained integrated schools).
Table 3.79 Number of schools with deficits (as at March 2005, March 2011, and March 2012) – number of schools, and their average deficit, by school type
School type
At March 2005 At March 2011 At March 2012
Number of
schools
Average deficit (£’000)
Number of
schools
Average deficit (£’000)
Number of
schools
Average deficit (£’000)
Nursery school 17 9.1 19 7.4 9 14.0
Primary school 386 28.1 147 36.0 163 36.6
Non-selective post-primary school
52 106.3 44 121.9 51 139.4
Controlled grammar school
6 59.2 5 101.7 5 145.0
24. Though 386 primary schools had a deficit at March 2005, the number fell to 147 at March 2011 – this is consistent with the real growth in funding per primary pupil during this period. Significantly, small primary schools were less likely to be in deficit than larger primary schools. At March 2012, 16.5% of primary schools with fewer than 105 pupils were in deficit, compared to 22.1% of larger primary schools.
________________________________________________________________________
9 Source Table and following section: DE Paper, Surplus and deficit positions at March 2005 and March 2011. Additional supplementary information also provided by DE.

An Independent Review of the Common Funding Scheme28
25. More schools of all types experienced deficits in 2011/12. The problem appears more acute among post-primary schools, with average deficits growing significantly – almost 40% of all non-selective post-primary schools were in deficit at March 2012. Though financial controls appear to have been tightening, this pattern of large and persistent deficits, and further recent deterioration, raises serious issues about the financial management of funding delegated through the CFS.
26. Excluding voluntary grammar and grant-maintained integrated schools, in March 2005 schools had total surpluses, net of deficits, amounting to £17.7 million. By March 2011, this figure had risen to £42.0 million (including over £30 million in primary schools); but by March 2012 total surpluses, net of deficits, had declined to £38.3 million. With a difficult economic outlook ahead, the panel anticipates that surpluses will continue to fall over the next few years.
Summary
27. The period between 2005/6 and 2010/11 saw growth in the actual and real levels of overall funding allocated to schools. In addition, increases in the overall levels of funding coincided with demographic decline to produce significant increases in the actual and real amount of funding per pupil at each phase of education.
28. One significant impact of the CFS was that growth in overall and per pupil funding levels between 2005/6 and 2010/11 varied between each phase of education. Growth in funding per pupil was significantly higher in the primary phase. However, this occurred against a backdrop of a large imbalance in funding that significantly favoured post-primary schools in general, and post-16 provision in particular. The CFS established the significant variation in funding between the primary and post-primary phases that existed when the scheme was initiated. Consequently in 2010/11, funding per pupil at post-primary level remained 20% above the average for pupils across all phases, despite recent gains at primary.
29. Within both the primary and post-primary phases, throughout the period, schools received different funding per pupil, according to different school characteristics, most notably school size, which is the largest determinant of funding per pupil in both the primary and post-primary phases.
An Independent Review of the Common Funding Scheme An Independent Review of the Common Funding Scheme 29
Chapter 4
The Common Funding Scheme: Transparency, Objectivity and Wider
Education Policy
Introduction
1. The Common Funding Scheme (CFS) was developed to be objective, fair, and transparent; it was to help mitigate the effects of social disadvantage, and underpin wider educational policy. In reaching conclusions on how well the CFS met these aims, the panel has given careful consideration to both oral and written evidence submitted to the panel.
2. This chapter sets out the conclusions of the panel in relation to the effectiveness of the CFS particularly in relation to the extent it supports the Department of Education’s (DE) key goals and policies. The focus tends to be on the Common Funding Formula (CFF), which allocates the majority of funding distributed under the scheme.
3. There are now obvious shortcomings, but the panel want to acknowledge and applaud the key achievement of the CFS which was undoubtedly the merging of separate funding schemes operated by separate funding authorities into a single CFS in 2005/6, without disruption to pupil education. This was an essential and difficult step, creating a foundation for the current review.
Transparency, Efficiency and Ease of Comprehension
4. The Education and Library Boards (ELBs) have published outturn statements for every individual controlled and maintained school each year; the statements provide summary details of funding provided through the CFF, additional delegated funding, and non-delegated funding attributed to the school; opening and closing surpluses (and deficits) are also shown. DE publishes outturn statements for voluntary grammar and grant-maintained integrated schools. There are some inconsistencies in accounting methodology between funding authorities, but this represents a commendable level of transparency.

An Independent Review of the Common Funding Scheme30
5. With 16 separate funding factors, and 15 age-weighted pupil unit weights, the CFF is undoubtedly complicated.
6. A highly complex formula of this nature, with many factors, has a number of disadvantages: funding is not necessary targeted where it is needed most, as the interaction of the many factors within the formula can produce unanticipated results. It is also very difficult to see why a school receives the funding it does. It is notable in England, for example, that the Department of Education intends to limit local authority formulae to a maximum of 10 factors.
7. The complexity of the formula also means there is a tendency for stakeholders to focus on an individual component of the formula, such as the value of age-weighted pupil units, without taking due account of the other factors within the formula, or of additional funding streams provided to schools through the scheme.
Objectivity
8. The CFF is based on a complex set of weights and cash values. The most significant are the age-weighted pupil unit weights, as they determine the distribution of 80% of the Aggregated School Budget (ASB). Though there has been some small adjustment, the current weights are derived largely from averages of the weights used by funding authorities in their earlier funding formulae. The origins of these funding authority weights are obscure, but they are thought to reflect earlier patterns of financial expenditure.
9. Some of the cash values associated with individual factors within the CFF are opaque in origin, often being averages of values in the individual ELB formulae.1 The following examples indicate the type and range of these shortcomings – they are simply examples, several other factors have similar shortcomings:
________________________________________________________________________
1 Coopers & Lybrand, Review of Formulae Funding, (May, 1997) and DE’s CFS Consultation documents of April 2001 and Autumn 2004 set out the background and rationale for current factors and many of the calculations used to obtain their cash values. The consultation documents can be accessed on the DE website: http://www.deni.gov.uk/index/schools-and-infrastructure-2/schools-finance/common-funding-section/common-funding-scheme-consultations.htm
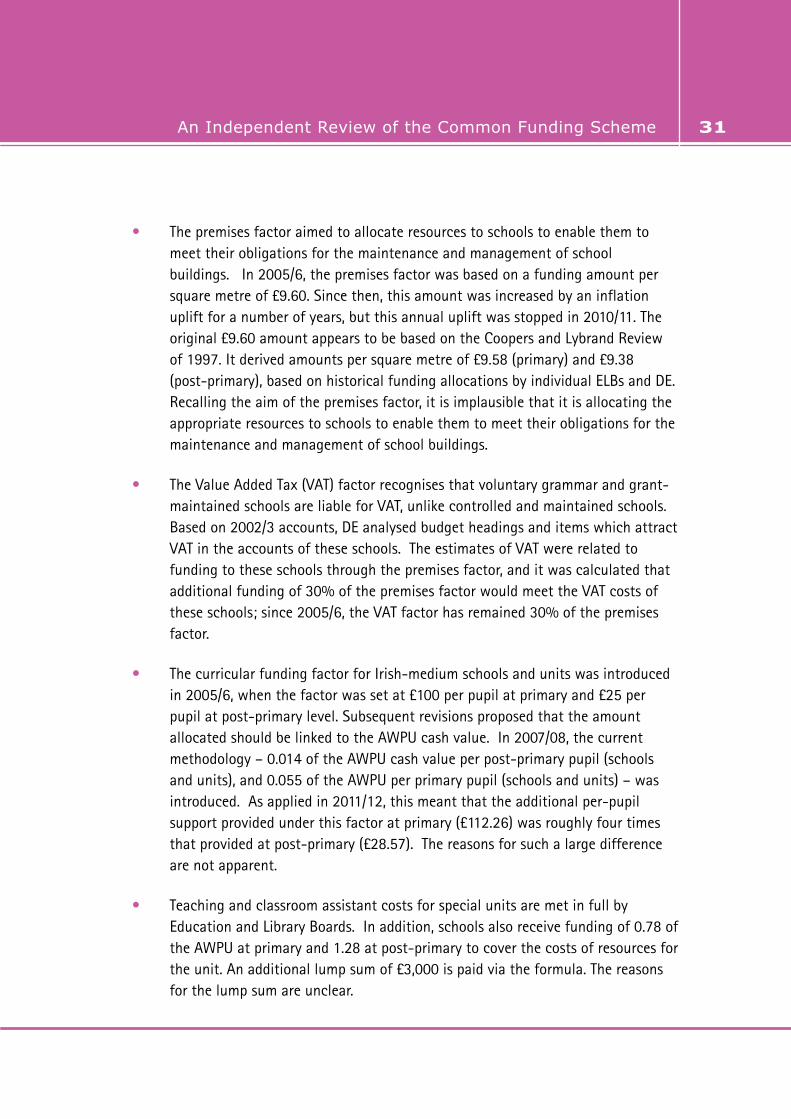
An Independent Review of the Common Funding Scheme An Independent Review of the Common Funding Scheme 31
• The premises factor aimed to allocate resources to schools to enable them to meet their obligations for the maintenance and management of school buildings. In 2005/6, the premises factor was based on a funding amount per square metre of £9.60. Since then, this amount was increased by an inflation uplift for a number of years, but this annual uplift was stopped in 2010/11. The original £9.60 amount appears to be based on the Coopers and Lybrand Review of 1997. It derived amounts per square metre of £9.58 (primary) and £9.38 (post-primary), based on historical funding allocations by individual ELBs and DE. Recalling the aim of the premises factor, it is implausible that it is allocating the appropriate resources to schools to enable them to meet their obligations for the maintenance and management of school buildings.
• The Value Added Tax (VAT) factor recognises that voluntary grammar and grant-maintained schools are liable for VAT, unlike controlled and maintained schools. Based on 2002/3 accounts, DE analysed budget headings and items which attract VAT in the accounts of these schools. The estimates of VAT were related to funding to these schools through the premises factor, and it was calculated that additional funding of 30% of the premises factor would meet the VAT costs of these schools; since 2005/6, the VAT factor has remained 30% of the premises factor.
• The curricular funding factor for Irish-medium schools and units was introduced in 2005/6, when the factor was set at £100 per pupil at primary and £25 per pupil at post-primary level. Subsequent revisions proposed that the amount allocated should be linked to the AWPU cash value. In 2007/08, the current methodology – 0.014 of the AWPU cash value per post-primary pupil (schools and units), and 0.055 of the AWPU per primary pupil (schools and units) – was introduced. As applied in 2011/12, this meant that the additional per-pupil support provided under this factor at primary (£112.26) was roughly four times that provided at post-primary (£28.57). The reasons for such a large difference are not apparent.
• Teaching and classroom assistant costs for special units are met in full by Education and Library Boards. In addition, schools also receive funding of 0.78 of the AWPU at primary and 1.28 at post-primary to cover the costs of resources for the unit. An additional lump sum of £3,000 is paid via the formula. The reasons for the lump sum are unclear.
An Independent Review of the Common Funding Scheme32
10. Equally, there are also inconsistencies in the application or nature of a number of the funding factors in the formula, as highlighted in the responses to the call for evidence. For example,
• Funding for principal release time is available to primary, but not nursery schools, even when they are of comparable size.
• The premises factor takes no account of the condition, or suitability of school buildings, which are key elements in determining maintenance expenditure.
• The so-called ‘education attainment factor’ is applied to primary schools, but not nursery schools. Yet no actual measure of attainment is applied to primary schools and no evidence exists that nursery schools are any less likely to need support for pupils with low attainment levels. On a related point, pupils attending voluntary, community and private nurseries do not receive any additional funding for social deprivation or low education attainment, whereas pupils in nursery schools and classes receive an additional £672-£1,345 per pupil for pupils whose parents claim Job Seekers’ Allowance (JSA)/ Income Support (IS) or Free School Meals (FSM).
11. Ideally, a funding scheme would be able to take full account of the objective needs of each pupil, and provide the appropriate resources to each school based on the needs of the children currently enrolled. However, many key components of the formula seem (at best) to be based on historical funding patterns to schools and not on any up-to-date assessment of the objective needs of pupils.
Supporting Early Intervention - Funding by Phase of Education
12. In the panel’s consultations, the difference in AWPU by phase of education was regularly mentioned. The AWPUs were originally based on an estimate of funding levels needed to maintain the status quo when LMS was introduced in the 1990s. The introduction of a common formula led to an averaging of the slightly different weights by Board area, but not to a re-evaluation of the relative weights. It is clear, though, that simple comparison of AWPU weights presents a slightly distorted view of relative allocation by phase of education, in view of the different impact of other CFF factors and other funding streams.

An Independent Review of the Common Funding Scheme An Independent Review of the Common Funding Scheme 33
13. As a panel, we have had difficulty in establishing a reliable metric for how much it should cost to educate a child at a particular point in their education in Northern Ireland. Although data are subject to some variation, we have broadly established what funding is provided per pupil per phase and, therefore, the current differential weights by phase of education. Including both delegated and non-delegated recurrent expenditure, the average funding per pupil at post-primary is just over 1.4 times the funding for a primary pupil. Despite a narrowing of the funding gap over the last few years, primary continues to receive considerably less per pupil funding than post-primary. Yet, the appropriateness of this difference is not established.
14. The Office of National Statistics regularly publishes information on staffing and pupil numbers by school sector for England, Scotland, Wales, and Northern Ireland.2 In addition, HM Treasury publish Public Expenditure Statistical Analyses, identifying expenditure by school phase for each country in the UK.3 At an international level, the Organisation for Economic Co-operation and Development (OECD) publish comparative school expenditure information4; and through the Programme for International Student Assessment (PISA).5
15. The panel has given careful consideration to the possibility of making staffing and funding comparisons to other countries using these data sources – various other analyses and reports have attempted and used such comparisons. In relation to the countries within the UK, there are various factors which affect resource allocations and comparisons, including:
• Demographic and social variations – age and gender patterns, ethnicity, socio-economic circumstances, and rurality all affect each country differently, and the need for resources.
________________________________________________________________________
2 ‘DfE: Education and Training Statistics for the United Kingdom 2012’ at http://www.education.gov.uk/rsgateway/DB/VOL/v001096/index.shtml
3 See http://www.hm-treasury.gov.uk/pespub_pesa11_natstats.htm
4 ‘Education at a Glance 2012: OECD Indicators’ at http://www.oecd.org/edu/eag2012.htm
5 ‘PISA 2009 Results: What Makes a School Successful? – Resources, Policies and Practices (Volume IV)’ at http://dx.doi.org/10.1787/9789264091559-en
An Independent Review of the Common Funding Scheme34
• School organisation varies. Northern Ireland mainstream schools include nursery classes and special units, raising costs. It is unclear how this affects the validity of cost comparisons.
• Reliance on public funding varies. In Northern Ireland, some voluntary grammar schools benefit from ‘voluntary contributions’ collected from parents; and some schools receive additional funding from charitable or other sources. In England, there is a large private school sector, with a particularly large sixth form enrolment; this in turn reduces the proportion of sixth form pupils in other secondary schools, leading to lower average costs than would otherwise have been the case.
• There are cost variations, as the following three examples show. First, in Northern Ireland, costs are increased as voluntary grammar and grant-maintained integrated schools are liable for VAT; in contrast, academies in England are able to reclaim VAT from HM Revenue and Customs. Second, payments related to Public-Private Partnerships and Public Finance Initiative schemes are large and growing rapidly (approximately one billion pounds per year) – but the differential effect on costs in each school sector are unknown.
• There are potential inconsistencies in relation to inclusion and apportionment of costs. Some resources that are managed centrally in Northern Ireland are devolved to schools in England. In Northern Ireland, the panel is aware of some differences in financial management information available from each funding authority, which can affect the consistency of expenditure comparisons at school level. In England, Scotland and Wales, local education authorities and councils have each developed their own funding model, with considerable variability. In addition, in England publically-funded education for students aged 16-19 was provided via the Learning and Skills Council.
• There are also inconsistencies in drawing comparisons on class sizes and pupil-teacher ratios. For Northern Ireland, the published statistics exclude teachers who are on temporary contracts. English data excludes sixth form colleges, which account for a substantial proportion of sixth form pupils.
16. With reluctance, the panel has concluded that comparisons of specific costs relative to England, Scotland and Wales using these aggregated information sources may be misinterpreted and occasionally misleading.
An Independent Review of the Common Funding Scheme An Independent Review of the Common Funding Scheme 35
17. Turning to the OECD resource allocation information, it is understood that resource data for the UK is submitted to OECD by HM Treasury. It is unclear how the data as submitted for the UK have addressed the difficulties summarised above. Indeed, the OECD point out many aspects where caution is needed in interpreting the information. Those caveats aside, some doubts about the precision with which specific cost comparisons can be made does not preclude the possibility of broad comparisons of education spending across countries.
18. The 2012 edition of Education at a Glance provides data on annual expenditure per student, by phase of education, for all OECD countries.6 The focus on Education at a Glance is on contrasting spend per phase, across countries. Thus, for example, Luxembourg spends approximately four times as much as the Czech Republic per primary pupil. All but five of the 31 countries for whom reliable data were available allocated more money per head for post-primary than for primary pupils, but usually only slightly more. Averaging across OECD countries, the primary versus post-primary ratio was 1.21, and 1.23 for 21 EU countries. This is considerably smaller than the Northern Ireland difference of 1.4. The UK as a whole tended to be reasonably balanced in the division of funds across phases: secondary education as a whole received 1.10 times the per pupil amount received for primary.
19. Whilst again recognising the limitations on the data sources, most may conclude that the CFS directs proportionally less funding to primary level than the average for OECD and EU countries. This is inconsistent with the Departmental policy emphasis on early intervention and investment. The panel believes that there are justifiable grounds to seek additional funding within the primary phase.
Area Planning and Sustainable Schools
20. Within the CFS, there are a number of factors and funding rules that provide additional support to all small schools. As illustrated in Chapter 3, this has resulted in large variances in per capita funding between schools. Tables 4.1 and 4.2 illustrate the very strong relationship between school size and funding per capita in the current formula.
________________________________________________________________________
6 The data are obtained by converting expenditure in national currency into equivalent USD by dividing the national currency figure by the purchasing power parity index (PPP). The use of a common metric facilitates cross-country comparison, but means that the cash values shown in tables may be different to the nationally reported costs in a country. See the OECD’s Education at a Glance for more information on PPP.

An Independent Review of the Common Funding Scheme36
The relationship is most pronounced at primary level, where small schools support is particularly focused. The relationship is also apparent at post-primary level but is somewhat moderated by the fact that large post-primary schools are likely to have large sixth forms, which attract a significantly higher level of funding than Years 8-12.
Table 4.17 Average funding per capita in primary schools according to size via the CFF in 2012-13
School Enrolments Average Funding per capita via the CFF
1-49 £4,164
100 – 199 £3,181
200 – 299 £2,971
300 – 399 £2,816
400 – 499 £2,758
500 + £2,730
Table 4.28 Average funding per capita in post-primary schools according to size via the CFF in 2012-13
School Enrolments Average Funding per capita via the CFF
1-299 £4,960
300-499 £4,259
500-699 £4,163
700-1000 £4,191
1000 + £4,053
________________________________________________________________________
7 In Table 4.1, average per capita funding at primary schools includes all CFF funding factors, including funding for nursery and special units In contrast, in diagram 3.1 in Chapter 3 nursery and special unit AWPU and special unit lump sum funding are excluded. Primary schools include a considerable number of part-time nursery class pupils, which lowers the overall per capita average funding per pupil.
8 In Table 4.2, average per capita funding at post-primary schools includes all CFF funding factors, including funding for special units In contrast, in diagrams 3.2 in Chapter 3 special unit AWPU and special unit lump sum funding are excluded.

An Independent Review of the Common Funding Scheme An Independent Review of the Common Funding Scheme 37
21. The 2009 Sustainable Schools Policy acknowledged this additional support, and the higher costs associated with smaller schools. The panel endorses the conclusion in the Sustainable Schools Policy that additional support for smaller schools inevitably means that there are fewer resources to distribute elsewhere. Some small schools are clearly essential, serving pupils in isolated areas or communities, and these small schools require additional resources to cover costs linked to their small size. However, the additional support provided by a formula for all small schools, regardless of their circumstances, is not consistent with the Sustainable Schools Policy.
22. In addition, the panel notes that an unintended consequence of the high AWPU weighting for post-16 pupils may have been an additional financial incentive for schools to establish, or continue to run sixth form provision that is not sustainable, or in accordance with the Entitlement Framework.
Raising Standards for All - Closing the Performance Gap
23. The CFF has a number of factors that provide resources linked to pupils with additional needs, both educational and pastoral. Some additional resources are also provided outside the formula, linked to social deprivation, to specific groups of pupils such as Travellers, or pupils with special educational needs. It is a glaring anomaly that one very disadvantaged group, looked-after children are not directly supported within the current funding formula.
24. One obvious reason for the emphasis on addressing social disadvantage is that it is clearly connected to educational underachievement. In 2011, only 32% of school leavers with FSM entitlement achieved at least 5 GCSEs at A*-C standard (including English and mathematics), compared to 65% of those without FSM entitlement. While there has been some overall improvement in achievement at this level in recent years, the gap between the most and least deprived pupils remains (and will be discussed in more detail in Chapter 7).
25. International evidence (e.g. from the OECD’s PISA studies) shows that at a national level higher expenditure on education does not guarantee better student performance. Once a threshold level of spending is exceeded, it is not the amount of expenditure that matters, but how effectively the money is spent. As expenditure in Northern Ireland exceeds that minimum threshold, it is necessary to look at effective strategies. Internationally, high-performing systems ensure each student receives the instruction
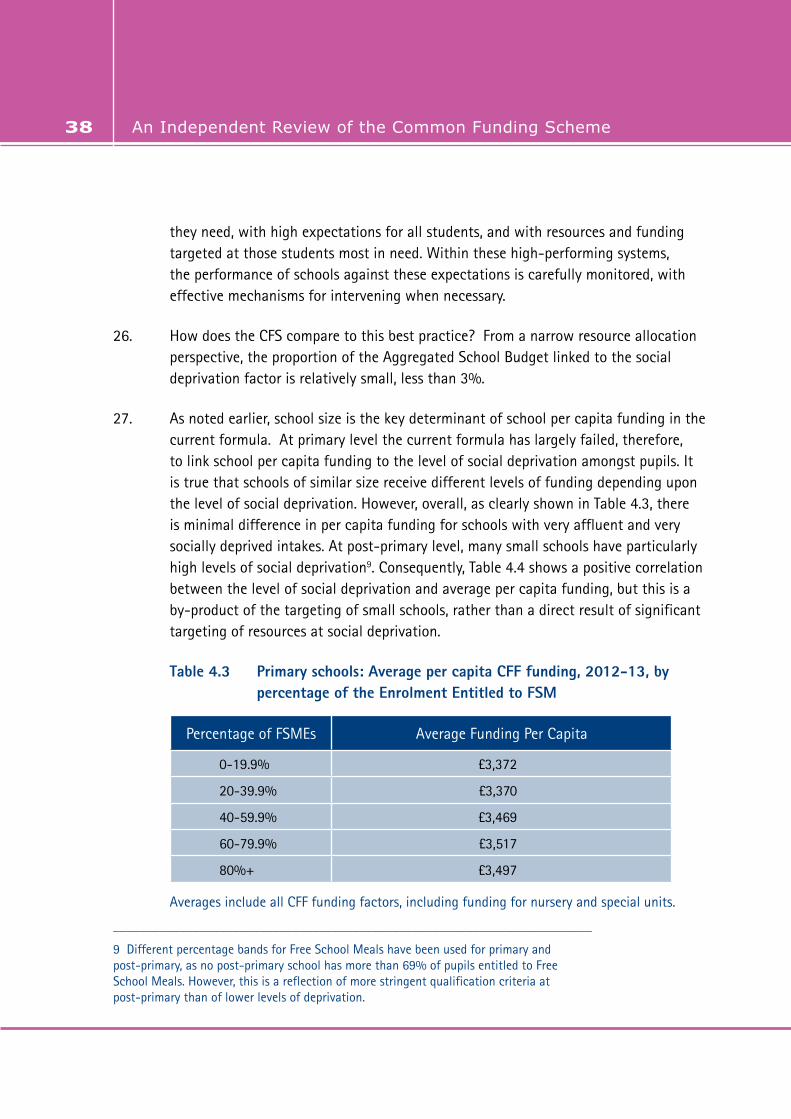
An Independent Review of the Common Funding Scheme38
they need, with high expectations for all students, and with resources and funding targeted at those students most in need. Within these high-performing systems, the performance of schools against these expectations is carefully monitored, with effective mechanisms for intervening when necessary.
26. How does the CFS compare to this best practice? From a narrow resource allocation perspective, the proportion of the Aggregated School Budget linked to the social deprivation factor is relatively small, less than 3%.
27. As noted earlier, school size is the key determinant of school per capita funding in the current formula. At primary level the current formula has largely failed, therefore, to link school per capita funding to the level of social deprivation amongst pupils. It is true that schools of similar size receive different levels of funding depending upon the level of social deprivation. However, overall, as clearly shown in Table 4.3, there is minimal difference in per capita funding for schools with very affluent and very socially deprived intakes. At post-primary level, many small schools have particularly high levels of social deprivation9. Consequently, Table 4.4 shows a positive correlation between the level of social deprivation and average per capita funding, but this is a by-product of the targeting of small schools, rather than a direct result of significant targeting of resources at social deprivation.
Table 4.3 Primary schools: Average per capita CFF funding, 2012-13, by percentage of the Enrolment Entitled to FSM
Percentage of FSMEs Average Funding Per Capita
0-19.9% £3,372
20-39.9% £3,370
40-59.9% £3,469
60-79.9% £3,517
80%+ £3,497
Averages include all CFF funding factors, including funding for nursery and special units.
________________________________________________________________________
9 Different percentage bands for Free School Meals have been used for primary and post-primary, as no post-primary school has more than 69% of pupils entitled to Free School Meals. However, this is a reflection of more stringent qualification criteria at post-primary than of lower levels of deprivation.

An Independent Review of the Common Funding Scheme An Independent Review of the Common Funding Scheme 39
Table 4.4 Post-primary schools: Average per capita CFF funding, 2012-13, by percentage of the Enrolment Entitled to FSM
Percentage of FSMEs Average Funding Per Capita
0-9.9% £4,153
10-19.9% £4,128
20-29.9% £4,248
30-39.9% £4,438
40-49.9% £4,549
50%+ £4,922
Averages include all CFF funding factors, including funding for special units.
28. The CFS factor entitled Targeting Social Need (TSN) is divided into two elements – social deprivation and ‘educational attainment’. It is particularly notable that since 2005/6, there has been little growth in TSN funding in post-primary schools relative to primary schools. There are two reasons for this – changes in eligibility for FSMs and improved Key Stage 2 results. Firstly, parents in receipt of Working Tax Credit can now register their children for FSMs in nursery and primary, but not post-primary, schools. Secondly, the gradual improvement in Key Stage 2 results over the last few years has resulted in a drop in the number of post-primary pupils eligible for additional educational attainment funding.
29. In contrast, funding linked to TSN within primary schools benefited from the expanding number of pupils entitled to and registering for FSMs; and a uniform allocation based on the total number of primary school pupils, the so-called ‘Warnock factor’.
30. This shift in the balance of TSN funding from post-primary to primary has been driven by unanticipated consequences of the design of the funding allocation mechanism rather than by changes in the needs of the respective pupils.
31. The current scheme has also failed to meet the challenge of linking spending on deprivation with learning outcomes. There is a lack of rigorous monitoring and evaluation of how resources are used to improve outcomes. More importantly, there

An Independent Review of the Common Funding Scheme40
has been no intervention when performance targets are not met. The autonomy that comes with distributed funding has not been accompanied by accountability.
32. In sum, the panel believes that TSN allocates relatively few resources, and that this is compounded by how schools spend these resources. A necessary corollary of school choice in how to use TSN funds is a duty to spend wisely. The NFER’s recent report for the Sutton Trust on the use of Pupil Premium funds notes that ‘while a large proportion of teachers believed that decisions in their school are based on research evidence, it is unclear what evidence they are using’. The panel believes that the adoption of any intervention that draws on a school’s budget and staffing resources should be based on sound evidence.
Common Funding Formula – Going forward
33. Going forward it is plausible to assume:
• Small annual reductions in the Aggregated Schools Budget, in real terms.
• Moderate growth in the number of primary pupils, a small contraction in the number of post-primary pupils in Years 8-12 and stable number of sixth form pupils.
• An increase in the number of pupils living in social deprivation.
34. The expected increase in the number of pupils living in social deprivation and the fact that some CFF factors are adjusted for inflation will increase the proportion of the CFF allocated though these factors. This will in turn depress the “AWPU cash value”. The AWPU cash value will be depressed further by the net expansion in total pupil numbers.
35. Projected changes suggest that, without adjustments to the CFF, small schools will face less financial pressure than larger schools, and non-selective post-primary schools will face most financial pressure (due to the depressed AWPU cash value and the decline in Year 8-12 enrolment). With many non-selective schools already facing severe financial difficulties, this is likely to cause difficulty throughout the non-selective sector, regardless of the sustainability and size of the school.
An Independent Review of the Common Funding Scheme An Independent Review of the Common Funding Scheme 41
36. The panel has concluded that this is an unacceptable scenario. The CFF as currently constructed will not be suited to sharing a reduced education budget under these changed circumstances.
Conclusion
37. The funding allocated to schools under the current CFS, and the funding formula in particular is allocated via a large number of factors. These factors are based on a myriad of historic compromise cash values rather than on any analysis of current school or indeed pupil needs. It is clear that without significant reform, funding is likely to become somewhat disconnected from pupil educational needs.
38. In regard to supporting DE’s wider policy objectives, the panel is acutely aware that funding can only provide a support mechanism for effective teaching and learning. Nonetheless, there are two significant areas in which the current funding formula appears to run counter to wider DE objectives:
• significant additional support for all small schools, irrespective of circumstance; and
• relatively low levels of additional funding for pupils from socially disadvantaged backgrounds, many of whom are highly likely to require additional support.
39. Further, current factors for deprivation funding are geared more towards nursery and primary schools than post-primary schools. While the panel endorses an emphasis on early intervention, it is likely that the relative lack of TSN at post-primary is more by accident of qualification criteria than by design.
40. The panel believes that funding reform is urgently required to meet the changing needs of the school-going population. Any reform will undoubtedly create a perception of winners and losers; that unfortunately is unavoidable. However, doing nothing is no longer an acceptable option, as too many children will not receive the educational opportunities they deserve.

An Independent Review of the Common Funding Scheme42
Chapter 5
Autonomy and Financial Management
Introduction
1. Chapters 5 and 6 of the report focus on the issues of financial management, autonomy and funding that is currently either distributed to schools outside of the Common Funding Formula (CFF), or used to provide central services.
2. This chapter focuses on the concept of financial autonomy. During the panel’s discussions with school stakeholders, many expressed the wish for more direct control of their delegated finances, particularly in the area of procurement.
3. Beginning with the international context, the chapter outlines recent worldwide reforms to increase school autonomy in a range of areas, highlighting the ambiguous relationship between financial autonomy and student performance. The chapter then demonstrates how the Northern Ireland school system has in turn been deeply influenced by the concept of increasing school autonomy. It then focuses more particularly on how much financial autonomy schools of different types have, both in theory and in practice, and evaluates the current arrangements for school financial administration, making a number of recommendations for change.
The International Context
4. In recent decades many countries have begun to focus on reforming the institutional structures of their school systems, with the focus of recent school reforms in many countries being efficiency, accountability, autonomy, and choice. In particular, academic commentators have identified a worldwide movement towards greater school autonomy.
5. Autonomy for schools spans a range of areas. For example, over the past two decades, a diversity of reforms has been implemented throughout Europe under the umbrella
An Independent Review of the Common Funding Scheme An Independent Review of the Common Funding Scheme 43
of increasing school autonomy.1 The nature of these autonomy reforms has been dependent on the time period, the country and even geographical area in which they were introduced.
6. Broadly, however, reforms to increase autonomy may be assigned to one of three categories:
• education content, including the curriculum, teaching methods, and pupil evaluation;
• the use of public funds; and
• the management of human resources, including the selection and employment of staff.
7. Reforms introducing greater school autonomy were initially linked with the political cause of democratic participation and emphasized the need for schools to be more open to their local communities. By the 1990s, many governments had linked the drive for school autonomy to the efficient management of public funds under the premise that decisions taken at the level closest to operations should guarantee the best use of public resources.
8. Now, in most countries, school autonomy in its various forms is widely promoted by government policy makers, as an instrument to achieve primarily educational goals: giving more freedom to schools and teachers in order to improve the quality of education.
9. Indeed, the last decade has triggered a new wave of school autonomy reforms. An increasing number of developing countries have begun to introduce these types of reforms and countries which had already embarked on a policy of school autonomy have also started to reinforce the powers already granted to schools.
10. Most notably in England, a fundamental reform of the operational structure of its school system is ongoing. The growth in academies has been large and rapid, with
________________________________________________________________________
1 Eurydice European Unit, School autonomy in Europe: Policies and Measures (December, 2007).

An Independent Review of the Common Funding Scheme44
almost 2,500 schools now having academy status. Academies enjoy significantly extended autonomy compared to schools maintained by the Local Education Authority, including direct funding from central government, the ability to set their own pay and conditions for staff, freedoms around the delivery of the curriculum and the ability to change the lengths of terms and school days.
11. By contrast to policy makers, academic commentators were somewhat more circumspect in their evaluation of the potential and impact of increased autonomy on student performance. Many initially cautioned that an international programme of systematic research was needed to test the claims that devolution of responsibility to more self-managing schools would lead to better management, better teaching, and improvements in the quality and equity of student outcomes.
12. Some consensus has now emerged at post-primary level. Programme for International Student Assessment (PISA) results suggest that, when autonomy and accountability are intelligently combined, they tend to be associated with better student performance.2 In countries where schools have greater autonomy over what is taught and how students are assessed, students tend to perform better. At the country level, the greater the number of schools that have the responsibility to define and elaborate their curricula and assessments, the better the performance of the entire school system, even after accounting for national income.
13. The relationship between autonomy in resource allocation and student performance is more complex. PISA highlights that there is no clear relationship between autonomy in resource allocation and performance at the country level.3 In countries where schools account for their results by posting achievement data publicly, schools that enjoy
________________________________________________________________________
2 PISA in Focus 9, School autonomy and accountability; Are they related to student performance (October, 2011); Wößmann, Ludger, Elke Lüdemann, Gabriela Schütz, Martin R. West (2007). School Accountability, Autonomy, Choice and the Level of Student Achievement: International Evidence from PISA 2003. OECD Education Working Paper No. 13, EDU/WKP(2007)
3 PISA in Focus 9, School autonomy and accountability; Are they related to student performance (October, 2011). PISA considered the followings areas of resource allocation– selecting teachers, dismissing teachers, establishing teacher starting salaries, determining salary increases, formulating the school budget, and deciding budget allocations within the school.

An Independent Review of the Common Funding Scheme An Independent Review of the Common Funding Scheme 45
greater autonomy in resource allocation tend to show better student performance than those with less autonomy. In countries where there are no such accountability arrangements, schools with greater autonomy in resource allocation tend to perform worse. This suggests that it is a combination of several autonomy and accountability policies, not just a single, isolated policy that is related to better student outcomes.
14. Related reforms over the past number of years have allowed parents more autonomy over school choice. A recent Organisation for Economic Co-operation and Development (OECD) report on successful schools notes that over half of OCED countries have reduced restrictions on school choice, while 10 have instituted new funding mechanisms to promote school choice.4 Schools competing for students and also for funding is now a more common feature of education systems. An argument underpinning the parental choice model is that schools become more responsive to student needs. However, the data indicates mixed effects for competitive school systems. Some schools will perform exceptionally well in a competitive system, usually because of the high socio economic status of their intakes, but for education systems as a whole the results are ambiguous.
The Principle of Autonomy in Northern Ireland
15. The Northern Ireland education system has been strongly influenced by the concept of increased autonomy for schools in each of the three broad areas noted earlier.
16. One of central tenets of the recently introduced Revised Curriculum is to reduce the prescription that had applied since 1989 and give teachers much more flexibility to exercise their professional judgement. Within the general framework of a duty to secure a broad and balanced curriculum, as set out in Article 4 of the Education (NI) Order 2006, schools have responsibility for securing the provision of the curriculum.
17. Equally, the Department of Education’s (DE) School Improvement policy clearly articulates the belief that schools, themselves, through honest self evaluation informed by data, are best placed to identify and address areas for improvement that can bring about better outcomes for pupils.
________________________________________________________________________
4 OECD. (2010). PISA 2009 results: Resources, policies and practices (Volume IV).

An Independent Review of the Common Funding Scheme46
18. In the area of human resources, the aim of the Education Bill, which will establish the Education and Skills Authority (ESA), is to establish a model of delegated autonomy. ESA is to be the employing authority for all teaching and non-teaching staff, but employment functions are delegated to schools. Schools, not ESA, decide on the level of delegation, to be set out in their schemes of employment, along with the detailed arrangements for carrying out employment functions. Boards of Governors will, if they wish, have the option of full autonomy on all day to day employment issues
19. With regard to funding, all grant-aided schools (other than special schools or schools established in hospitals), receive fully delegated budgets from the Aggregated Schools Budget (ASB) using the CFF. The Common Funding Scheme (CFS) asserts that:
“the delegation of financial and managerial responsibilities to Boards of Governors, are key elements in DE’s overall policy to improve the quality of teaching and learning in schools”. 5
20. However, the overriding concept of delegation and a common formula to determine allocations conceals significant differences in the systems of financial management and administration to which schools are subject and on which this chapter will now focus.
Financial Administration – Current Arrangements in N.I. Schools – Theory and Practice
21. Two broad types of financial administration operate. Voluntary grammar (VG) and grant-maintained integrated schools (GMI) are funded in the form of grants from the Department of Education (DE). In contrast, other schools’ budgets and accounts are delegated, however, they are largely maintained by Education and Library Boards (ELBs).
22. As VG and GMI schools have direct control of their cash budgets. They are directly responsible for purchasing and invoicing of school supplies and services and for paying salaries to all non-teaching staff. VG schools are also responsible paying all teaching staff, whilst DE runs the teaching payroll for GMI schools.
________________________________________________________________________
5 Local management of schools, Common Funding Scheme 2012-13, p.2.

An Independent Review of the Common Funding Scheme An Independent Review of the Common Funding Scheme 47
23. Given the extent of this autonomy, both VG and GMI schools must provide DE with necessary assurances that financial and management controls are in place, which are appropriate and sufficient to safeguard public funds and to protect assets from loss, waste, fraud or impropriety. Both VG and GMI schools are also subject to annual internal and external financial audit.
24. As at March 2011, no VG or GMI school had a deficit of public funds. If any of these schools had exceeded the budget allocated to them by DE then the school has to cover this additional cost from its own funds, or external borrowing. No additional budget cover is provided by DE.
25. In other schools, ELBs are responsible for handling the cash flow of delegated funds and for ensuring the maintenance of appropriate records for accounting and audit purposes. The Chief Executive of ELB has the legal responsibility to ensure that adequate systems and procedures exist to account for all income due and expenditure incurred on behalf of the Board, including those in respect of schools funded by the Board and that controls are in operation to protect assets from loss, waste, fraud or impropriety.
26. The role of ELBs is to monitor the operation of finances in schools, provide management information to schools; make available to individual schools statements showing financial allocations and actual school expenditure; operate a system of audit to provide the necessary level of assurance that proper controls are in place to safeguard public funds; and apply sanctions, where appropriate, including suspension of delegation.
27. It is a system of delegation, whereby schools have allocated budgets and responsibility for key decisions impacting on financial spend, particularly the school’s staffing profile, but do not have direct control of making payments, or financial accounting.
28. Critically in practice budget delegation has been combined, with very limited accountability for schools. Delegation has never been removed from any school, even where a large and increasing deficit has been incurred.
29. Limited accountability has manifested itself most clearly in a pattern of school deficits. Some schools are significantly overspending their budgets. In March 2011, following
An Independent Review of the Common Funding Scheme48
a sustained period of funding growth, 147 primary and 49 post-primary schools had deficits. The forthcoming real terms reduction in school funding means the issue is fast becoming critical. In 2014/15, the overall DE Resource budget will be 7.2% lower in real terms than in 2005/6, in real terms, and the ASB will be 4.2% lower in real terms.6
30. Whilst the panel is aware that the pattern of large and persistent deficits amongst schools in part reflects the urgent need for structural changes, particularly in the post-primary sector, it also raises serious issues about the effectiveness of the current systems for the financial administration of funds delegated to schools through the CFS.
31. The panel is also aware that the ELBs have sustained a commendable level of engagement with schools, providing challenge and support on financial management. Nonetheless, intervention procedures when schools have failed to remain in budget have been inadequate.
32. Consequently, the panel believes that as well as external monitoring, support and challenge, there is a need for more active interventions to ensure that poor quality financial management is not allowed to continue. This is similar to the approach DE has adopted in regard to school improvement.
33. Equally, there must be recognition from schools that, while DE and its support bodies are accountable for the overall use of funding, it is the school and its Board of Governors that is accountable for the school’s budget.
34. The panel does note, however, that some schools have operated within budget for a sustained period, yet have large historic deficits. Funding authorities should review the position of such schools.
Demand for Reform
35. When asked in the call for evidence, whether all schools should run their delegated finances directly and assume the accompanying management responsibilities, a large majority of respondents (272, or 71%) were unsure, with 73 respondents (19%) believing they should and 23 (6%) answering no.
________________________________________________________________________
6 Source: Data on funding levels provided by DE. Real terms funding calculated using Treasury GDP deflator and 21 March 2012 Budget Report inflation forecasts.

An Independent Review of the Common Funding Scheme An Independent Review of the Common Funding Scheme 49
36. There was a notable difference, however, between the responses from primary and post-primary schools to this question. Most (83%) respondents from primary schools were unsure, while only 9% (24) were in favour. By contrast, 30 respondents (75%) from post-primary schools answered yes. It is notable that seven out of eight (88%) controlled grammars answered yes, as did five out of six (83%) of controlled secondary schools, and 15 out of 16 VG schools (94%).
37. In stakeholder meetings, a significant number of post-primary schools, in particular controlled grammar schools, voiced strongly their desire for direct control over their school budgets and the model of financial administration currently applied to VG and GMI schools. Specifically, the most frequent comment was that they wished to employ a bursar to manage their school’s finances, as they felt this would be more effective than their current model. Equally, VG and GMI schools believed their current model of financial autonomy worked well.
38. In contrast, some ELB staff familiar with the CFS felt that many schools did not yet fully appreciate the practical implications of further resource delegation, and the need for collective responsibility, for example, in relation to shared central support services. Most trade unions favoured a model of centralised staff budgets (similar to the arrangement in the Republic of Ireland). Some suggested that this could be more efficient, and facilitate workforce planning and the redeployment of staff.
39. It is clear from the call for evidence and stakeholder engagement that not all schools would wish to exercise the function of direct control of their financial resources, however, it is equally clear some schools would wish to exercise this opportunity. Broadly speaking, smaller schools and primary schools were least likely to want greater delegation.
Procurement: A Key Concern in Focus
40. One area where school stakeholders almost universally voiced their desire for more freedom was procurement. Most frequently, principals felt that ELB contracts did not represent value for money and that they would like more flexibility, particularly for small purchases.
An Independent Review of the Common Funding Scheme50
41. Currently, it is the responsibility of each funding authority to issue guidance to schools regarding procurement. The panel notes there has been a variety of practice between funding authorities regarding the application to schools of NI Public Procurement Policy (NIPPP), UK procurement regulations and the requirement to subject procurement spend to Centre of Procurement Expertise (CoPE) influence, as stipulated under NIPPP.
42. A number of ELBs have advised schools that they should not operate outside Board contracts for all supplies and services purchasing. DE’s Financial Memorandum with VG and GMI schools outlines procedures for the purchase of equipment and these schools have also been issued with the updated Procurement Control Limits, but the procedures have not been updated for some time.
43. The panel notes that the legal position of all schools, as grant-funded bodies, is the same. All procurement must comply with EU Treaty based principles of non-discrimination, equal treatment, transparency, mutual recognition and proportionality and some degree of advertising, appropriate to the scale of the contract, is likely to be necessary to demonstrate transparency. Procurement over EU Thresholds must comply with EU Directives and UK Procurement Regulations.
44. Schools are not listed as subject to NI Public Procurement Policy and, therefore, not required to undertake procurements via a Service Level Agreement with a CoPE.
45. The panel is acutely aware of the potential financial benefits of maximising the collaborative purchasing power of the education sector via central contracts. Equally, however, the panel feels it is both sensible and in line with procurement guidance recently issued by the Central Procurement Directorate to allow real choice in low cost, or urgent operational purchases that are frequently needed by schools and where there is little risk of legal challenge
46. The panel, therefore, recommends that DE clarify for all funding authorities the exact legal position of all schools in regard to procurement and ensure that procurement guidance issued by each funding authority is harmonised prior to the establishment of the ESA.

An Independent Review of the Common Funding Scheme An Independent Review of the Common Funding Scheme 51
Conclusions
47. Delegation must be accompanied by accountability. There are clearly serious shortcomings identified in the practical operation of the current model of financial administration for controlled and maintained schools. There is a clear need for more disciplined budgeting and fiscal management.
48. The panel recommends that the processes for monitoring, providing challenge, support and intervening in schools on financial management issues should be closely aligned to the processes in place in relation to school improvement. A financial classification of schools: light touch, schools of concern, should be developed, together with comprehensive intervention procedures for schools that have excessive deficits and surpluses.
49. More generally, effective financial management must in future be viewed as a critical element in any evaluation of school leadership. Leadership in a school should be found inadequate when the school is continuing to operate significantly outside budget requirements.
50. Whilst highlighting serious issues about the effectiveness of the current systems for the financial administration of funds delegated to controlled and maintained schools through the CFS, the panel is not of the view that the model operated by VG and GMI schools necessarily represents a panacea for the ills described.
51. In areas particularly such as payroll administration, the cost effectiveness of a centralised service is clear. Furthermore, for many small and medium sized schools, the additional burden would be too great. This is particularly the case, as many governors continue to defer their management responsibility, as laid down in legislation, to the principal. A number of schools, currently living within budget, also acknowledged to the panel that they rely heavily on the ELBs to manage their budgets effectively. Nor is it desirable for significantly increased portions of education funding to be spent on employing financial specialists in each school, as this inevitably occurs at the expense of other educational services within the school.
52. That being said however, the Northern Ireland school system has embraced the concept of increased school autonomy across a range of areas. The top down imposition of a

An Independent Review of the Common Funding Scheme52
particular model of financial management, dependent not on the wishes, or capabilities of schools, but varying according to eccentricities of school management type, appears, therefore, anomalous.
53. The panel, therefore, recommends that DE explores the practical implications and legislative, or procedural changes required to allow any school to adopt the systems of financial management operated for VG and GMI schools.
54. The panel would, however, caution that schools will need to be aware of the increased time and expenditure on administration that would accompany the choice of assuming this model. Equally, schools which choose such an option will need to have demonstrated satisfactory financial management. Nonetheless, schools should have the choice.
Key Recommendations – Chapter 5
Recommendation 1:
The Department of Education should clarify for all funding authorities the exact legal position of all schools in regard to procurement and ensure that procurement guidance issued by each funding authority is harmonised prior to the establishment of the ESA.
Recommendation 2:
The processes for monitoring, providing challenge, support and intervening in schools on financial management issues should be closely aligned to the processes in place in relation to school improvement. A financial classification of schools should be developed, together with comprehensive intervention procedures for schools that have excessive deficits and surpluses.
Recommendation 3:
The Department of Education should explore the practical implications and legislative, or procedural changes required to allow any school to adopt the systems of financial management operated for voluntary grammar and grant maintained integrated schools.

An Independent Review of the Common Funding Scheme An Independent Review of the Common Funding Scheme 53
Chapter 6
Central Expenditure
Introduction
1. This chapter focuses on the elements of the General Schools Budget1 that are outside the Aggregated Schools Budget (ASB) and the funding formula. It also examines funding for Special Educational Needs (SEN) in some detail.
2. The panel’s remit did not extend to examining every element of educational funding in detail, or providing an evaluation of the effectiveness of all education services. The focus of this chapter is an overview of the need for, and general effectiveness of funding outside the ASB. However, in a number of key areas of high spend, or where stakeholders voiced considerable concerns, a more detailed evaluation is offered.
3. Respondents to the call for evidence had mixed views on whether there were centrally-held elements of the General Schools Budget that should be delegated to schools. Almost half (48%) felt that some funding held centrally should be delegated to schools; 32% were unsure and 14% did not believe that further funding should be delegated to schools.
4. A significantly higher percentage (68%) of post-primary respondents felt there were elements of the General Schools Budget that should be delegated to schools. Controlled and voluntary grammar (VG) schools in particular expressed a desire for the maximum delegation of funds to schools and were particularly concerned that a considerable proportion of the General Schools Budget was not delegated to schools.
5. Of those stakeholders who felt further central funding should be directly delegated to schools through the formula, many believed that the Curriculum Advisory and Support Service (CASS) should be decentralised. The three other funding streams stakeholders
________________________________________________________________________
1 The General Schools Budget is defined as the total sum expended by funding Authorities under the terms of the Common Funding Scheme.

An Independent Review of the Common Funding Scheme54
most commonly felt should be delegated were funding for the extended schools programme2, for SEN and landlord maintenance. Each of these areas will be considered later in this chapter.
Funding Held Centrally: Overview
6. The ASB allocated by the Common Funding Formula (CFF) currently accounts for 59% of the Department of Education’s (DE) Resource Budget. During the panel’s consultations, this percentage was often contrasted unfavourably with the percentage of funding allocated directly to schools in England.
7. However, sizeable percentages of non ASB funds are spent on schools and pupils. This includes funding for special schools, the majority of other expenditure on special educational needs, teacher substitution costs and centre support for VG and grant-maintained integrated (GMI) schools. Earmarked funding such as extended schools and Entitlement Framework (EF) is directly allocated to schools. In addition, for some other categories – school transport being a prime example – it seems self-evident that delegation would increase costs and lower efficiency. Administration costs, including DE and all Non-Departmental Public Bodies (NDPBs) account for around 4.5% of the total resource budget. Appendix 7 provides a detailed breakdown of how the remaining 41% of the budget was split in 2012/13.
8. The remainder of this chapter examines the three broad types of funding that sit outside the ASB:
• earmarked or initiative funding;
• funding for central services; and
• funding allocated to schools other than through the formula.
________________________________________________________________________
2 Extended schools programme aims to improve levels of educational achievement and the longer term life chances of disadvantaged children and young people by providing the necessary additional support which can enable those children to reach their full potential. Through this programme, schools serving areas of the highest social deprivation can provide for a wide range of services or activities outside of the normal school day to help meet the needs of pupils, their families and local communities.

An Independent Review of the Common Funding Scheme An Independent Review of the Common Funding Scheme 55
Earmarked or Initiative Funding
9. Outside the ASB, earmarked funding, provided to schools for DE initiatives, such as the extended schools programme and full service schools3, is directly linked with wider educational policy. Funding targeted through such initiatives can certainly promote policy implementation.
10. However, in consultation many school stakeholders voiced their concerns that when funding ceased it was difficult to continue with initiatives, or that temporary initiative funding was not a good way to make lasting long-term changes. Twenty respondents to the call for evidence drew attention to extended schools funding and felt it should be incorporated within delegated funding.
11. The panel has, therefore, formed the view that:
• The number of funded initiatives should be restricted, both to minimise administrative costs and effort both at centre and within schools and to encourage greater focus and coherence of approach at school level.
• The use of earmarked funding must be monitored, with appropriate actions where it is found not to be effective.
• An exit strategy for each initiative is required, to alleviate the risk that progress achieved during the initiative will be surrendered upon cessation of the funding stream.
12. The panel recommends that DE reviews all earmarked initiative funding. For each initiative, DE should establish if earmarking is a more effective approach than directly delegating to schools via the funding formula.
________________________________________________________________________
3 Linked closely with the Extended Schools Programme, the Full Service approach goes beyond standard extended school provision by delivering substantial additional programmes and activities aimed at tackling barriers to learning and raising levels of educational attainment for those pupils in the greatest need.
An Independent Review of the Common Funding Scheme56
Entitlement Framework funding
13. Throughout stakeholder discussions, the phasing out of earmarked funding for delivery of the EF was a key area of concern for a large number of post-primary schools. The panel also met with Further Education (FE) College principals, who were extremely concerned that the ending of EF funding would damage the working relationships that have been developing between the schools and the Colleges.
14. The EF will have statutory force from September 2013, however, the full subject requirements of 24 subjects at Key Stage 4 and 27 subjects at post-16 will not be in force until September 2015.
15. Earmarked EF funding has supported schools as they increased the breadth of their curricular offer, providing a contribution towards courses delivered collaboratively between schools, and with Further Education Colleges and training organisations. The earmarked budget will be halved in the 2013/14 financial year, and phased out by the 2014/15 financial year.
16. Collaboration has merits in meeting young people’s needs, helping to provide a broad curricular experience and avoiding duplication of resources. Nonetheless, in the long term, the panel is of the view that sites offering post-16 provision should be of sufficient size to be able to offer a broad range of opportunity to pupils within that site, with collaboration generally limited to more specialist provision. Clearly, in a number of specialist areas, the FE sector has state-of-the-art facilities that would not be cost effective for schools to try to replicate. Collaboration makes sense in such cases, but collaboration between multiple small schools, each incapable of breadth of curriculum coverage, does not. The panel believes that a model of curricular provision that requires large amounts of travelling between a variety of institutions represents poor value-for-money, poor use of time, and is not in pupils’ best interests.
17. In the medium term, the panel is of the view that area planning must ensure post-primary schools are of sufficient size to deliver a broad curriculum in a cost-effective manner. The panel also believes that in order to best use limited resources post-primary schools will need to be significantly larger than the minimum threshold of 500 pupils outlined in the Sustainable Schools Policy. Nonetheless, changes to the schools’ estate take time. Currently, some schools will clearly not be able to deliver the EF without considerable short-term collaboration between schools. This collaboration

An Independent Review of the Common Funding Scheme An Independent Review of the Common Funding Scheme 57
represents additional expense for schools, particularly in regard to transport costs and class scheduling.
18. The panel does not think that a stream of funding for delivery of the EF with the formula allocation represents a solution to this issue. A funding stream for EF without additional post-primary funding will, if allocated to all schools, represent a reduction in the basic per pupil allocation that post-primary schools receive.
19. To allow schools to fulfil the requirements of the EF in the short to medium term, the panel recommends that DE considers extending earmarked EF funding at its current level for the 2013/14 and 2014/15 financial years. However, the panel does not believe funding for collaboration should be targeted only at schools needing additional finance to offset the costs of significant collaboration, as this might be perceived as financially incentivising a poor curricular offer.
20. In the medium term, and with the benefit of more data on area planning, the need for earmarked funding should be re-evaluated. Longer term, the panel considers that there would be merit in moving to a common funding formula for distribution of funding to schools, Further Education Colleges4, and other education providers for all students aged 16-19.
Central Services
21. There are a range of central services provided by ELBs, such as school tansport, school meals, inclusion and diversity, curriculum support, professional development, pupil support, music and library services.
22. It is important to distinguish between the general theory of centralised delivery and the effectiveness of services, as currently delivered. The panel frequently heard concerns from stakeholders about the effectiveness of current services, given the staffing pressures facing the Education and Library Boards (ELB) prior to the establishment of the Education and Skills Authority (ESA). However, in most cases there was no corresponding desire for such services to be decentralised.
________________________________________________________________________
4 Currently funded by the Department for Employment and Learning.

An Independent Review of the Common Funding Scheme58
23. The panel examined in more detail the areas of transport, which accounts for a significant portion of spend on central services, and curriculum support, as many stakeholders felt this service should decentralised and funding delegated to schools.
Transport and Catering
24. Significant funding is held by funding authorities to provide services for schools in its area. The two major areas of spend are school transport (c.£74 million in 2012/13) and the school meals service (c.£38 million in 2012/13), which jointly account for a considerable proportion of all supplies and services procurement spend in the education sector. The majority of contracts are tendered and administered on a collaborative joint Board basis.
25. There are well established benefits resulting from economies of scale and collaboration in procurement. These include efficiency gains through increased purchasing power, standardised conditions of contract, common documentation, gaining access to others’ expertise, sharing best practice and avoiding ‘reinventing the wheel’. Consequently, the panel sees no rationale for services such as school meals and transport to be decentralised, nor was any such demand articulated in the call for evidence. The panel also notes that the establishment of ESA, as a single contracting authority will help ensure economies of scale within the education sector are maximised.
26. However, the panel notes the extent to which there is effective and efficient use of resources outside the ASB clearly influences the extent of resources available within the ASB. With this in mind, the high and escalating expenditure on home to school transport services is a particular cause for concern.
27. Article 52 of The Education and Libraries (NI) Order 1986 (as substituted by Article 23 of The Education (NI) Order 1997) empowers Boards to make arrangements for the provision of transport and otherwise for certain (eligible) pupils. Transport provided under these arrangements must be provided for free.
28. Eligibility for transport assistance is determined by two criteria: ‘distance’ and ‘suitable school’. The distance is two miles at primary and three miles at post-primary school. A ‘suitable’ primary school is one in the categories of controlled, integrated, Irish-medium, and maintained. At post-primary, denominational, or non-denominational

An Independent Review of the Common Funding Scheme An Independent Review of the Common Funding Scheme 59
grammar schools are also recognised as separate categories. When a parent selects a school for their child, schools in other categories are then ignored for assessment of transport eligibility.
29. The Minister for Education has announced that the home to school transport policy will be reviewed, but not until the outcome of other developments, such as area planning are known.
30. The panel believes that the delay should be minimised. DE already has a coherent suite of policies in place and whilst area planning is an ongoing process, the principles which underpin its development have been established. There will continue to be a wide variety of school types in Northern Ireland and the panel is not suggesting that respect for parental preference should be removed. That aside, transport policy, including eligibility, the definition of suitable school, and the potential for some parents to contribute to costs, should be reviewed at the earliest opportunity.
Curriculum Support and Professional Development Funding
31. Some Irish-medium schools and bodies favoured a strengthened CASS service. However, a majority of primary school respondents to the call for evidence and a significant number of post-primary respondents felt that funding for Continuing Professional Development (CPD) should be delegated directly to schools. As well as the more ad hoc funding, this included CASS, which supports schools in the process of school improvement and raising standards, and the Regional Training Unit, which supports the professional development of leaders and senior managers in schools.
32. A partial explanation for this view is that many stakeholders felt CASS no longer provided the services to their school that had been provided in the past by school improvement professionals. The role of CASS was now perceived to relate almost exclusively to inadequate schools within the Formal Intervention Process rather than providing support and challenge to all schools.
33. The panel believes that the current risk-based model of support, whereby the service is delivered by a permanent central team in each Board area focused on those schools in formal intervention is, on its own, inadequate. It is recognised, however, that some form of centrally co-ordinated service continues to be needed. Professional

An Independent Review of the Common Funding Scheme60
development is often falsely dichotomised between a one-size-fits-all centralised model (a paradigm which implies CPD is something that is done to teachers) and more recent approaches such as professional learning communities (based on the theory that teachers are empowered through collaboration, they develop cultures that value shared responsibilities and values, and practice becomes student-centred). Neither view is entirely accurate.
34. The professional learning community (PLC) has much to commend it as a model, and the literature provides some evidence that student learning increases when teachers participate in such communities.5 However, PLCs are less likely to be effective in schools where school leadership and co-operation among staff is poor – in other words, schools that would benefit most from additional support will gain least. Thus, the panel believes there remains a role for a central professional development agency, which combines high-level expert knowledge with responsiveness to local need.
35. In terms of achievement outcomes on reading, mathematics and science, the results from international comparative studies such as the Programme for International Student Assessment (PISA), PIRLS (Progress in International Reading Literacy Study) and TIMSS (Trends in Mathematics and Science Study) suggest that Singapore is one of the most successful education systems in the world. Given this, the panel has examined elements of the Singaporean model of teacher education and CPD.
36. In Singapore, teachers work on school-based curricular innovations, using action research techniques, all under the guidance of curricular experts. As well as an entitlement to 100 hours annually of CPD, an element of school-based funding is ring-fenced for CPD. Newly-qualified teachers receive considerable structured mentoring within their school and outstanding teachers can receive grants for further study and/or travel. Schools are clustered (in groups of 11-14) under the leadership of an experienced and outstanding principal, thereby facilitating the sharing of innovation and good practice.
________________________________________________________________________
5 Bolam, R. et al., (2005). Creating and sustaining effective professional learning communities. Research Report 637. London: DfES and University of Bristol; Supovitz, J.A., (2002). Developing communities of instructional practice, Teachers College Record, 104, 2, 127-146;

An Independent Review of the Common Funding Scheme An Independent Review of the Common Funding Scheme 61
37. The panel endorses the strong Singaporean emphasis on CPD, the catering to local needs, and the sharing of teacher experience and practice. While not proposing that a specific percentage of each school’s budget should be ring-fenced for CPD, the panel is concerned that in times of shrinking financial resources, CPD may be seen as a “soft target”. It cautions against such an approach, and believes that retaining some funds centrally will ensure all schools continue to engage in regular CPD. The current central budget for professional development would have limited impact when divided between all schools, but has the potential to have significant wider impact through a fit-for-purpose central service.
38. It is planned to establish a regional school development service in 2013 in Northern Ireland. The panel is of the view that the service should assign a central role to supporting ongoing peer support at area and school level, providing greater opportunities for teachers to work together in sharing good practice, while also drawing on external expert advice, where needed. While recognising that PLCs and self-directed learning can be relatively inexpensive and effective methods of CPD, it is important they should not be the sole form, and that schools should have ready access to external expert advice.
School funding outside the Formula
39. In addition to the earmarked, or initiative funding discussed earlier, funding is available to schools from a range of funding streams outside the CFF. The majority of this funding may be categorised, as follows.
a) Teacher Costs, including funding for long-term sickness absence; maternity/adoption absences; in-service training costs (INSET); representative costs (trade unions, CCMS) youth tutors, and suspension of staff.
b) Special Education in Mainstream, including teachers in special units, teacher substitutes, classroom assistants, general assistants and nursery assistants.
c) Landlord maintenance.6
___________________________________________________________________
6 Controlled and maintained schools only.

An Independent Review of the Common Funding Scheme62
d) Rates.
e) Non-Teaching Staff Costs, including compensation for long-term sickness; other non teaching staff costs; premature retirement pension costs; and redundancy costs.
There are also a number of other funding streams which are delegated directly to schools: contingency funding for schools, curriculum reserve support, funding for class sizes, split school sites and reorganisation allowances.
40. In a number of these areas, it is clear there would either be no meaningful value, or indeed potentially adverse consequences from transferring funding to the ASB and allocating to schools via the CFF. An example of the former would be the payment of rates. Equally, centrally held funds for teaching and non-teaching staff substitution costs, such as compensation for long-term sickness, maternity absences, redundancy costs etc appear to the panel sensible. Otherwise, unavoidable and unpredictable situations could lead to significant financial hardship for individual schools and pupils.
41. Generally, however, the panel is concerned that there is a lack of transparency and consistency across the various funding authorities in regard to financial data for school funding outside the ASB. For example, in some ELBs notional costs are apportioned to schools. As noted in Chapter 3, it is necessary to take account of both formula and non-formula funding to get a clear picture of school funding levels. However, this is not always easy and may lead to inaccurate comparisons of funding levels. Appendix 2 provides more details of the funding streams analysed in Chapter 3. In areas such as SEN expenditure, and landlord maintenance expenditure, there were difficulties in obtaining comparable and consistent information from all funding authorities. It is essential to standardise financial information across all schools in all sectors and facilitate benchmarking between schools throughout Northern Ireland.
Funding for SEN Provision
42. In 2009, DE published a consultation paper setting out policy proposals to help pupils facing greater difficulties in learning than their peers.7 The proposals placed emphasis on getting pupils the help they needed as quickly as possible. In 2012, the Minister set
________________________________________________________________________
7 ‘Every school a good school – The way forward for special educational needs and inclusion’, DENI, 2009.

An Independent Review of the Common Funding Scheme An Independent Review of the Common Funding Scheme 63
out the next steps, taking account of the original proposals and further developments, along with the response to the initial consultation.8
43. In this context, in addition to examining the distribution of funding already within the ASB, the panel has been asked to consider:
• Should some of the expenditure for SEN currently managed by funding authorities be delegated to schools, through an expansion of the ASB?
• Should special schools be funded on the same basis as other grant-aided schools, using a funding formula, with comparable budget management and control at school level?
44. The panel has found it particularly difficult to analyse these issues. There is a considerable level of uncertainty in trying to identify the needs of pupils in a manner which would allow comparison of aggregated needs at school level. There is also some uncertainty about the extent to which those needs are met through existing funding arrangements, particularly in mainstream schools and some ambiguities about how resources are distributed between schools.
Pupil Profile
45. The percentage of pupils on SEN registers has shown a marked increase in recent years, from 14.5% of all pupils (50,266) in 2001 to 20.4% (67,344 pupils) of all pupils as at October 2011. Of those on the register in 2011, 14,090 of these pupils had SEN statements; 9,822 of these pupils with statements were attending mainstream schools and units, and 4268 were attending special schools.
46. In 2011/12, 37.6% of all pupils on SEN registers in mainstream primary and post-primary schools were registered for Free School Meals (FSM). Typically, the proportion of pupils at SEN Stages 1-4 is higher in schools with higher proportions of pupils
________________________________________________________________________
8 See ‘Minister’s presentation to the Committee for Education, 16 May 2012’. http://www.deni.gov.uk/index/support-and-development-2/special_educational_needs_pg/review_of_special_educational_needs_and_inclusion.htm
An Independent Review of the Common Funding Scheme64
facing social deprivation. However, in the primary phase it is notable that nonetheless the majority of pupils on the register at Stages 1-4 attend schools where less than 30% are registered for FSM. There are also concentrations in particular schools, notably grant-maintained integrated schools.
Pupils in Mainstream
47. Schools receive resources linked to the specific requirements set out in statements for pupils at SEN Framework Stage 5. They may also receive additional resources (either funding, or assistance from peripatetic staff) to meet the needs of pupils at Stage 3. Notably, the panel was unable to distinguish additional resources distributed to schools for pupils at Stage 3 from the additional resources distributed for pupils at Stage 5.
48. Stakeholders frequently mentioned to the panel the need for greater flexibility in providing appropriate support for children with statemented SEN in mainstream schools, in contrast to the almost default deployment of classroom assistant support. Some stakeholders also felt that delegated resources for statemented children directly to schools would result in more flexible and effective support being provided.
49. Ideally, those providing additional support should help the student become an independent learner.9 However, current funding often attaches one individual to one child, thereby encouraging the so-called helicopter or velcro models of support, that many stakeholders criticised. Moreover, the panel has heard anecdotal evidence of assistants taking on a more active teaching role. It would be unfortunate if children with the most complex educational needs were receiving educational instruction from staff without the requisite pedagogical qualifications.
50. Currently, there is no appropriate robust methodology to identify the needs of SEN pupils in a manner that would allow comparison of aggregated needs at school level and, thereby, allow for greater system wide delegation of centrally held SEN funds to schools.
______________________________________________________________________
9 Skar, L. and Tamm, M. (2001) My Assistant and I: Disabled Children’s and Adolescents’ Roles and Relationships to Their Assistants, Disability and Society, Vol. 16 (7), pp. 919-931
An Independent Review of the Common Funding Scheme An Independent Review of the Common Funding Scheme 65
51. The panel has concerns about the consistency of SEN register information. A recent OFSTED report has highlighted inconsistencies in the use of SEN registers in England.10
OFSTED commented that:
• There was variation in assessment and use of SEN statements for pupils with similar needs.
• Inspectors met pupils on SEN registers who were provided with significant additional support; but whose needs could and should have been met by appropriately differentiated teaching, good learning and pastoral support earlier on.
• There was some evidence that SEN or disability were being used as a reason for lower expectations and an excuse for poor outcomes.
52. There is also a concern that a pupil who is making slower progress than normal may be more quickly identified in a class of high-achieving pupils, than if in a class of low-to-moderate achieving pupils - perhaps in a school where many children were experiencing social deprivation.
53. Nor can levels of social deprivation be used, as a proxy for all SEN. Many types of high-incidence SEN, such as moderate and severe learning difficulties, and behavioural, emotional and social difficulties, have been found elsewhere to have a significant correlation with social deprivation. However, other types of difficulty, such as autism and sensory disabilities, are not correlated with social deprivation.
54. Generally, the panel also recognises the significant advantages that centralised expertise can bring when dealing with atypical educational issues, particularly low frequency, high cost SEN. It is efficient to have a pool of specialist support or guidance which can be made available to pupils. It is not reasonable to expect a school or cluster of schools to build up expertise in an area that is outside of their normal experiences. Small schools in particular benefit from central expertise and services.
________________________________________________________________________
10 ‘The special educational needs and disability review’, OFSTED, 2010.

An Independent Review of the Common Funding Scheme66
55. The current framework is administratively bureaucratic for schools. Equally, there has been a tendency for limited emphasis on the impact and effectiveness of centrally resourced interventions for SEN, though there is some evidence this is beginning to change. However, these are weakness in the current systems and an argument for administrative reform: shorter, less bureaucratic, more responsive processes, rather than decentralisation of funding and services per se. The need for administrative reform has been recognised by DE in its recent policy proposals.
56. The panel concluded that until the impact of the recent SEN review can begin to be assessed, and until there is greater consistency and precision is available financial information linked to pupil needs, it is best to continue to rely on current funding arrangements, and the use of funding outside the ASB for Stage 3 and 4 and statemented pupils That being said however, a more flexible system in the future might consider at times delegating funding to individual schools to meet the collective needs of pupils with a statement, or funding co-ordinated support plans, rather than allocating physical resources, or services to individual children.
57. Other aspects of SEN funding related to the ASB are addressed in Chapter 8.
Special units
58. Resources for teaching and other support staff within special units in mainstream schools are provided by the relevant ELB. In addition, there is some funding support from the ASB. Each year, the mainstream school receives a small lump sum (£3000) for each special unit class, and baseline funding per pupil amounting to approximately 75% of the funding for a mainstream pupil in that phase of education.
59. The staffing needs of special units are similar to those of special schools in that they are dictated not solely by the number and age of pupils, but also by the need to take account of the nature of the unit and the needs of the pupils enrolled. It may also be necessary to run a unit with less than maximum enrolments. It, therefore, appears appropriate that staffing costs are met centrally.
An Independent Review of the Common Funding Scheme An Independent Review of the Common Funding Scheme 67
60. The Education and Training Inspectorate (ETI) recently evaluated the quality of services in these special units.11 ETI reported that the profile of pupils in these units is changing, characterised by more diverse and complex educational, social, and emotional needs. ETI drew attention to the need for stronger links between special schools and units, and the continued need for small class sizes. Some pupils can benefit from inclusive learning opportunities alongside other pupils in the mainstream school. While reporting that most special units provide good quality education, ETI concluded that there was scope to improve strategic planning and staff development, both within schools and across ELBs. Though concluding that funding levels for pupils in special were adequate, ETI commented that:
This funding is not ‘ring-fenced’. As a result, schools may allocate the funding to other priorities in the school. There is a need for common procedures and protocols across the Education and Library Boards regarding how the allocated funding for unit provision should be used and for schools to be better able to track the use of the allocated funding.
61. The panel endorses this approach. In relation to special units, the panel particularly recommends that information should facilitate monitoring of pupil needs, standards and resources, to ensure consistency and allow careful benchmarking. Where possible, data standards should be consistently applied across all special schools, units and mainstream schools.
Special Schools
62. Special schools are not funded from the ASB. Funding for each school is determined individually by the relevant Education and Library Board (ELB). Funding in individual schools is influenced by historical funding patterns, adjusted in light of changing pupil numbers. In addition, pupils may have specific and sometimes substantial resource needs identified in SEN statements. Whilst some areas of expenditure in relation to goods and services are delegated to the school, staffing decisions are often subject to discussion and agreement with the relevant ELB. Some special schools have staff whose primary role is to provide outreach support to pupils and staff in mainstream schools.
________________________________________________________________________
11 Education and Training Inspectorate, An evaluation of the quality of Special Educational Needs provision in special units attached to mainstream schools’, (2010).
An Independent Review of the Common Funding Scheme68
63. The panel does not have sufficient information to comment on whether there is consistency in funding levels among special schools in each ELB area, and recognises the potential difficulties in drawing valid comparisons; nor can the panel comment on whether funding levels at any individual special school are appropriate.
64. The panel recommends as a first step that consistent financial management information should be recorded for all special schools, in a format which will facilitate benchmarking with special schools elsewhere. Particular care will be needed to apportion the costs of peripatetic staff. This financial information, combined with consistent and comparable information about the pattern and extent of needs of individual pupils at each school, will be essential in ensuring appropriate and consistent funding for each special school. It may be possible at that stage to identify a practical ‘funding formula’ which would allow greater budget delegation to special schools and there should be a specific review of special school funding at that stage.
Education Other Than at School (EOTAS)
65. There are several forms of education that take place outside of the formal school environment:
• home or hospital tuition for pupils unable to attend school through illness or disability.
• provision for school-age mothers.
• provision for young people of compulsory school age who cannot adjust to or cope with mainstream schooling - services are provided by Pupil Referral and Intensive Support Units, through an Educational Resource Centre, and through community-based provision. This is frequently referred to as Alternative Education Provision (AEP), though this is not a legal definition.
66. AEP is funded by ELBs outside the ASB. However, the CFS makes provision for the transfer of the associated AWPU funding from a mainstream school following expulsion, or transfer of a pupil into EOTAS provision . There is no provision for the
An Independent Review of the Common Funding Scheme An Independent Review of the Common Funding Scheme 69
withdrawal and transfer of other CFF funding associated with the transferred pupil, such as funding linked to social deprivation and educational attainment.
67. The panel is aware of some of the difficulties and challenges faced by alternative education providers.12 Inspection reports by the ETI have highlighted satisfactory and good quality standards, but also on occasion inadequate standards, partially linked to resource problems.
68. Though the panel has concluded that the funding arrangements for AEP should be reviewed, this would largely proceed outside the scope of the CFS. The panel recommends, however, that arrangements to remove funding from mainstream schools following transfer should be assiduously followed (involving not only AWPU funding, but also SEN and social deprivation funding), with transfer of this funding to EOTAS budgets.
Conclusion
69. In conclusion, it is clear there is need for better and more consistent financial information in regard to non-delegated funding for schools. It is only through clearer information that the true level of support for all grant-aided schools can be clearly measured and benchmarked.
70. There would also be merit in seeking to improve benchmarking with schools in some other countries. One approach to ensure comparability may be to identify selected schools and explore costs and performance in those schools.
71. In particular, in relation to SEN, the panel reiterates the importance of better and more consistent information, to facilitate monitoring of pupil needs, standards and resources, to ensure consistency and allow careful benchmarking. Where possible, data standards should be consistently applied across all special schools, units and
________________________________________________________________________
12 See “Achieving successful outcomes through Alternative Education Provision: an international literature review”, CfBT Education Trust, 2011. Also, “The Taylor review of alternative provision: Improving alternative provision”, http://www.education.gov.uk/schools/pupilsupport/behaviour/a00204776/taylor-review-of-alternative-provision

An Independent Review of the Common Funding Scheme70
mainstream schools. In relation to mainstream schools, it will be particularly helpful to distinguish resources allocated specifically for pupils with SEN statements from other central support resources. Until the impact of the recent SEN review can begin to be assessed, and until there is greater consistency and precision is available financial information linked to pupil needs, it is best to continue to rely on current funding arrangements, and the use of funding outside the ASB.
72. Overall, whilst the panel has heard concerns about a number of central services, the panel believes this reflects the current efficiency, or model of delivery rather than a need for decentralisation. The panel is in agreement that the number of funded initiatives should be restricted and as much funding, as possible delegated directly to schools through the ASB.
Key Recommendations - Chapter 6
Recommendation 4
Financial information for all school and Board Areas should be standardised. In particular, funding for schools outside the formula should be reported with greater consistency in order to facilitate benchmarking of funding between schools throughout Northern Ireland.
Recommendation 5
The Department of Education should restrict the number of funded initiatives for schools both to minimise administrative costs and effort both at centre and within schools and to encourage greater focus and coherence of approach at school level.
Recommendation 6
The use of earmarked funding by schools should be effectively monitored, with appropriate interventions should expectations not be met.

An Independent Review of the Common Funding Scheme An Independent Review of the Common Funding Scheme 71
Recommendation 7
An exit strategy for each funded initiative should be developed prior to its implementation, to alleviate the risk that progress achieved during the initiative will be surrendered upon cessation of the funding stream.
Recommendation 8
The Department of Education should review all current earmarked initiative funding to ensure that earmarked funding is the best approach and that funding would not be better used by being directly delegated to schools via the funding formula.
Recommendation 9
To allow schools to fulfil the requirements of the Entitlement Framework in the short to medium term, the Department of Education should consider extending earmarked Entitlement Framework funding at its current level for the 2013/14 and 2014/15 financial years.
Recommendation 10
In the long term, the panel is of the view that sites offering post-16 provision should be of sufficient size to be able to offer a broad range of opportunity to pupils within that site, with collaboration generally limited to more specialist provision.
Recommendation 11
Transport policy, including eligibility, the definition of suitable school and the potential for some parents to contribute to costs should be reviewed at the earliest opportunity.
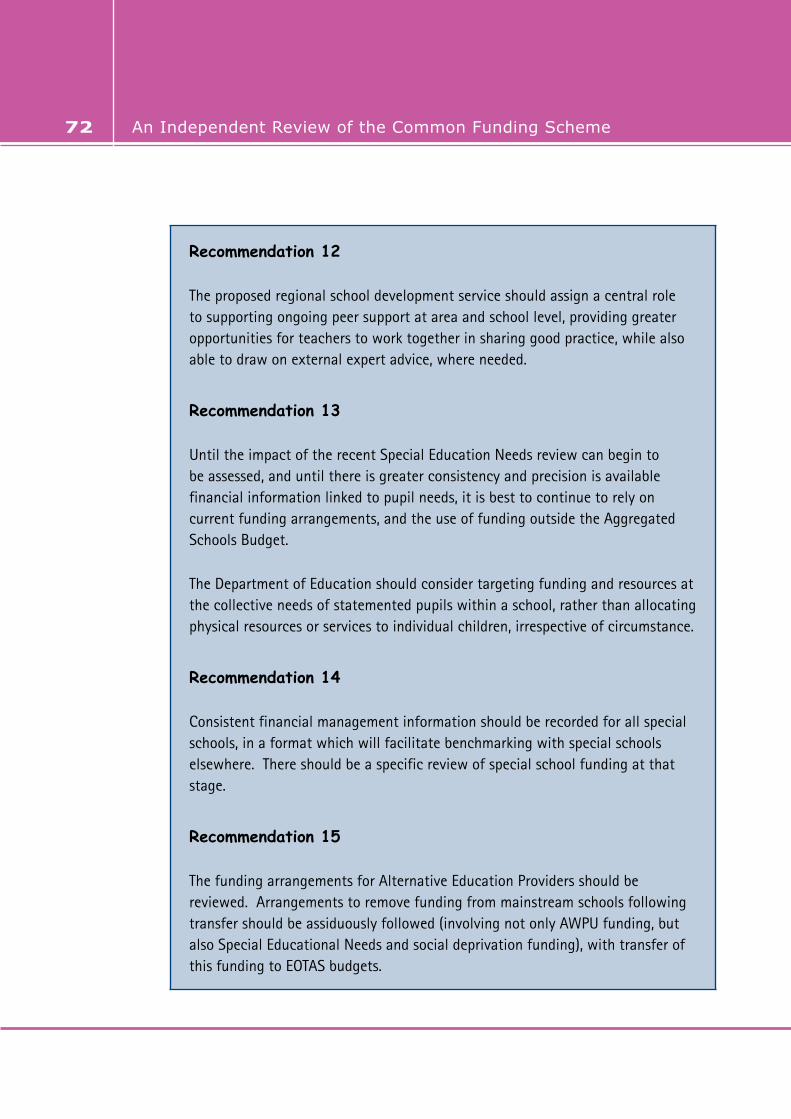
An Independent Review of the Common Funding Scheme72
Recommendation 12
The proposed regional school development service should assign a central role to supporting ongoing peer support at area and school level, providing greater opportunities for teachers to work together in sharing good practice, while also able to draw on external expert advice, where needed.
Recommendation 13
Until the impact of the recent Special Education Needs review can begin to be assessed, and until there is greater consistency and precision is available financial information linked to pupil needs, it is best to continue to rely on current funding arrangements, and the use of funding outside the Aggregated Schools Budget.
The Department of Education should consider targeting funding and resources at the collective needs of statemented pupils within a school, rather than allocating physical resources or services to individual children, irrespective of circumstance.
Recommendation 14
Consistent financial management information should be recorded for all special schools, in a format which will facilitate benchmarking with special schools elsewhere. There should be a specific review of special school funding at that stage.
Recommendation 15
The funding arrangements for Alternative Education Providers should be reviewed. Arrangements to remove funding from mainstream schools following transfer should be assiduously followed (involving not only AWPU funding, but also Special Educational Needs and social deprivation funding), with transfer of this funding to EOTAS budgets.

An Independent Review of the Common Funding Scheme An Independent Review of the Common Funding Scheme 73
Chapter 7
Tackling Educational Disadvantage
Introduction
1. The Northern Ireland Executive’s Programme for Government 2011-15 highlights both its vision and the key challenges for Northern Ireland in the 21st century.
The most immediate challenges lie in supporting economic recovery and tackling disadvantage. In particular, we need to rebuild the Northern Ireland labour market following the impact of the global economic downturn, while also continuing to rebalance the economy to increase living standards......Equality of opportunity and sustainability are our underpinning principles.... We recognise that we cannot simply grow the economy at the expense of disregarding our endeavours to transform society and enhance our environment. A strong modern economy is built upon a healthy, well-educated population backed by high quality public services and a commitment to use prosperity as a means of tackling disadvantage.
2. In order to meet these challenges, the Executive has developed five key strategic priorities, which will underpin all government activity. Priority 2 is Creating Opportunities, Tackling Disadvantage and Improving Health and Wellbeing. This priority seeks to address the challenges of disadvantage and inequality that afflict society.
3. The Executive’s aim is to stimulate interventions that break the cycle of deprivation and educational under-achievement, and to address health inequalities and poor health and wellbeing, as well as economic disengagement. The Programme for Government clearly recognises that to achieve this there is a need to close the gap in educational underachievement between those who are least and most disadvantaged and improve the participation of young people in education, employment and training.
4. Finding ways of breaking the cycle of disadvantage, educational failure and restricted life chances is a fundamental challenge, with no quick fix solutions. However, it has been recognised by the Northern Ireland Executive both as a key priority and as essential to the growth of a strong, modern economy and society.

An Independent Review of the Common Funding Scheme74
5. This chapter demonstrates the extent of the relationship between social disadvantage and educational achievement in Northern Ireland and describes the current policy interventions targeting social disadvantage. It then discusses, in the context of international best practice, the arguments for higher levels of funding for social disadvantage within the Aggregated Schools Budget (ASB). Finally, the chapter examines the most appropriate measure for social disadvantage, focusing on the need for a measure that is not only fair, but also transparent, stable and reliable.
Disadvantage and Education Achievement - Current Performance
Domestic Outcomes
6. Tables 7.1 and 7.2 demonstrate, for the years 2005/6 and 2010/11, educational outcomes for school leavers, overall and by entitlement to Free School Meals (FSM). The percentages within each group attaining the two main “benchmark” indicators of achievement – a) at least five GCSEs at grades A*-C or equivalent, and b) five GCSEs at grades A*-C or equivalent, including GCSEs in English and Maths – are shown.
Table 7.11 Pupils achieving 5+ GCSEs A*-C, or equivalent and 5+ GCSEs or equivalent, including GCSEs in English and Maths in 2005-6
Performance of school leavers 2005/06
All Pupils Not entitled to FSM Entitled to FSM
Number % Number % Number %
At least 5 GCSEs A*-C inc. equivalents
16394 64.2 14622 70.2 1772 37.6
At least 5 GCSEs A*-C (inc. equivalents) including GCSE English and maths
13416 52.6 12173 58.5 1243 26.4
Total Leavers 25528 20816 4712
Source: School Leavers Survey
________________________________________________________________________
1 Source: Figures provided by NISRA

An Independent Review of the Common Funding Scheme An Independent Review of the Common Funding Scheme 75
Table 7.22 Pupils achieving 5+ GCSEs A*-C, or equivalent and 5+ GCSEs or equivalent, including GCSEs in English and Maths in 2010/11
Performance of school leavers 2010/11
All Pupils Not entitled to FSM Entitled to FSM
Number % Number % Number %
At least 5 GCSEs A*-C inc. equivalents
16949 73.2 15071 78.0 1878 48.8
At least 5 GCSEs A*-C (inc. equivalents) including GCSE English and maths
13791 59.5 12572 65.1 1219 31.7
Total Leavers 23160 19313 3847
Source: School Leavers Survey
7. Over the past five years there has been an overall improvement in the attainment levels of schools leavers in Northern Ireland, including pupils entitled to FSM which is the indicator of social deprivation most commonly used by the Department of Education (DE).
8. There have been overall increases in the percentages obtaining at least five GCSEs grades A*-C, or equivalent (9%) and at least five GCSEs at grades A*-C, or equivalent, including GCSEs in English and Maths (7%). Similarly, increased percentages of FSM pupils have reached each attainment benchmark. However, while percentages have risen, the gap has not closed. In 2005/6 and again in 2010/11, pupils not entitled to FSM were twice as likely as FSM pupils to obtain at least five GCSEs at grades A*-C, or equivalent, including English and Maths.
9. Although not shown in Tables in 7.1 and 7.2, only 35.3% of those who had attended non-selective post-primary schools achieved at least five GCSEs at grades A*-C, including English and Maths. Thus, many young people continue to underachieve and large performance gaps by school type and by FSM entitlement remain.
________________________________________________________________________
2 Source: Figures provided by NISRA
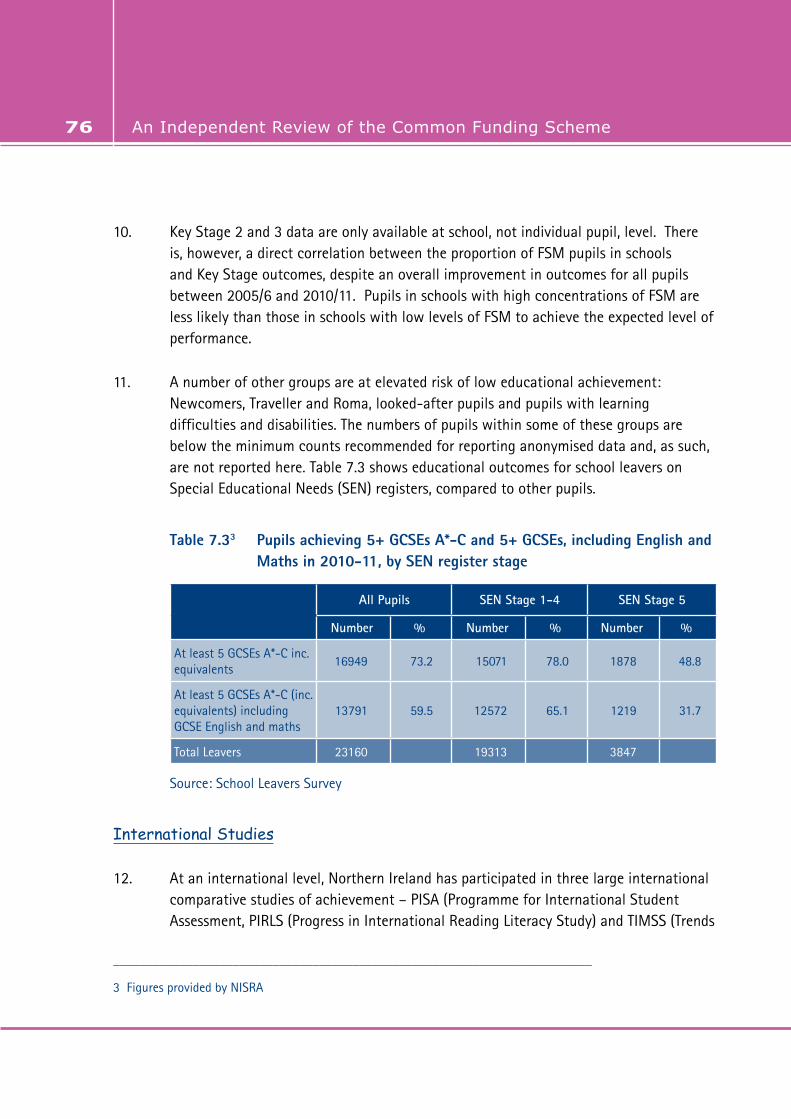
An Independent Review of the Common Funding Scheme76
10. Key Stage 2 and 3 data are only available at school, not individual pupil, level. There is, however, a direct correlation between the proportion of FSM pupils in schools and Key Stage outcomes, despite an overall improvement in outcomes for all pupils between 2005/6 and 2010/11. Pupils in schools with high concentrations of FSM are less likely than those in schools with low levels of FSM to achieve the expected level of performance.
11. A number of other groups are at elevated risk of low educational achievement: Newcomers, Traveller and Roma, looked-after pupils and pupils with learning difficulties and disabilities. The numbers of pupils within some of these groups are below the minimum counts recommended for reporting anonymised data and, as such, are not reported here. Table 7.3 shows educational outcomes for school leavers on Special Educational Needs (SEN) registers, compared to other pupils.
Table 7.33 Pupils achieving 5+ GCSEs A*-C and 5+ GCSEs, including English and Maths in 2010-11, by SEN register stage
All Pupils SEN Stage 1-4 SEN Stage 5
Number % Number % Number %
At least 5 GCSEs A*-C inc. equivalents
16949 73.2 15071 78.0 1878 48.8
At least 5 GCSEs A*-C (inc. equivalents) including GCSE English and maths
13791 59.5 12572 65.1 1219 31.7
Total Leavers 23160 19313 3847
Source: School Leavers Survey
International Studies
12. At an international level, Northern Ireland has participated in three large international comparative studies of achievement – PISA (Programme for International Student Assessment, PIRLS (Progress in International Reading Literacy Study) and TIMSS (Trends
________________________________________________________________________
3 Figures provided by NISRA

An Independent Review of the Common Funding Scheme An Independent Review of the Common Funding Scheme 77
in Mathematics and Science Study). These studies allow us to benchmark not only average student achievement in Northern Ireland on each of reading, mathematics and science, but also to look at the range of achievement and the effects of social class on educational outcomes.
13. In 2011, Northern Ireland was a first time participant in PIRLS and TIMSS. Both are grade-based assessments, targeting a sample of pupils in Year 6 (or its international equivalent), and operate under the aegis of IEA (International Association for the Evaluation of Educational Achievement). In contrast, the Organisation for Economic Co-operation and Development’s (OECD) PISA is an age-based study, targeting a sample of 15 year olds. Northern Ireland has participated in five cycles of PISA (2000, 2003, 2006, 2009 and 2012).
14. The just-published results of PIRLS and TIMSS 2011 indicate that, at primary level, Northern Ireland is among the highest performing countries on reading and mathematics, and slightly above the study average for science. As well as average levels of performance (country-mean score) we can look at the range of achievement. A common way to do so is to examine the score of pupils at the 5th and 95th percentiles and use to the gap between the scores as the measure of range of achievement. Comparing with England, Northern Ireland had a shorter tail of underachievement for each of reading, mathematics and science, and proportionally more children reaching at least minimum competency level (the Low International Benchmark) on each domain.
15. The PIRLS assessment also collected measures related to SES (parental employment and education) from pupils’ parents. In Northern Ireland, the relationship between SES and achievement on the PIRLS reading test is weaker than in most participating countries. For example, the gap between children from professional and labouring families is 54 points (study average: 64 points), and the gap between children from university educated families and those from homes where parents had no educational qualifications is 77 points (study average: 90).
16. In short, at primary level international results are very encouraging, not only in relation to overall achievement, but also in regard to breaking the cycle of educational underachievement.

An Independent Review of the Common Funding Scheme78
17. However, the results at 15 years old reveal a quite different picture. Overall, the reading and maths performance of 15 year olds in Northern Ireland is not significantly different from the OECD average in the two most recent cycles of PISA (2006 and 2009) and represent a significant decline in performance on earlier cycles.
18. Notably, the distribution of scores between students at the 5th and 95th percentiles tends to be wider in Northern Ireland than in most OECD countries. Indeed, in PISA 2006, Northern Ireland’s spread of achievement for science was the largest of any participating country. Only for mathematics is the spread of achievement similar to or smaller than (depending on cycle) the OECD average. Unfortunately, this is not because a long tail of underachievement has been addressed, but because of relatively poor performance by higher achieving students in Northern Ireland on mathematics.
19. Further, the relationship between social class and test performance tends to be stronger in Northern Ireland than the OECD average in PISA. Socio-economic background in PISA is reported as the Economic, Social and Cultural Status (ESCS) index. In PISA 2009, a one-unit increase on the ESCS index was associated with an increase of 48 points on the reading test, compared to an OECD average of 38. This indicates that the relationship between SES and achievement in Northern Ireland is stronger than is the average in OECD countries. To gain a true picture of interactions between reading score and ESCS, it is also necessary to look at the amount of variance in scores that can be explained by socio-economic background. This indicates the extent to which pupils in each country are able to overcome the predicted effects of socio-economic disadvantage. Pupils in Northern Ireland are able to overcome the disadvantages of their background better than in some other countries, but the effects of socio-economic background are nevertheless large.
20. In sum, Northern Ireland’s primary pupils performed extremely well in an international comparative study of reading and mathematics achievement, performed well on science, and had proportionally fewer very weak students than England. Further, the relationship between SES and test performance was weaker in Northern Ireland than the average across PIRLS countries. In contrast, Northern Ireland’s post-primary students are average performers on reading and maths assessments, and just above average on science. The relationship between achievement and SES is stronger than in most OECD countries and the tail of underachievement tends to be longer than the average.
An Independent Review of the Common Funding Scheme An Independent Review of the Common Funding Scheme 79
21. In light of the preceding, the following OECD4 quote is of interest:
“… school systems that assume that students have different destinations with different expectations and differentiation in terms of how they are placed in schools, classes and grades often show less equitable outcomes without an overall performance advantage. ….In countries where 15-year-olds are divided into more tracks based on their abilities, overall performance is not enhanced, and the younger the age at which selection for such tracks first occurs, the greater the differences in student performance, by socio-economic background, by age 15, without improved overall performance.”
Current Policy Interventions in Northern Ireland
22. Research has identified a number of broad categories of interventions used by policy makers to reduce the impact of social disadvantage on educational attainment. Each of these is currently being applied to a greater or lesser extent in Northern Ireland.
(a) General Intervention to improve the quality of teaching and leadership in all schools.
Evidence for the effectiveness of centrally-determined prescriptive strategies for “high quality” teaching and learning is inconclusive, though the importance of quality continuous professional development guided by an overarching policy framework is clear. Increasingly the evidence is also showing that schools themselves, through a system of rigorous self-evaluation, are best placed to identify areas of improvement and implement changes on a whole-school basis.
There is now a coherent set of policies based on best practice designed to improve the quality of teaching and learning in all schools in Northern Ireland. The Revised Curriculum has provided schools with additional flexibility to make decisions about how best to interpret and combine minimum requirements so as to provide a broad and balanced curriculum. The introduction of the Revised Curriculum and Entitlement Framework has been supported by a School Improvement policy, which focuses on
________________________________________________________________________
4 OECD (2010). PISA 2009 results: What makes a school successful?

An Independent Review of the Common Funding Scheme80
promoting the core characteristics that evidence shows make for a good school. This policy also includes a formal intervention process providing robust intervention when a school is found by the Inspectorate to offer less than satisfactory provision.
(b) Structural Interventions
This intervention involves re-structuring schools and re-organising schools systems to help tackle inequality. In Northern Ireland, FSM children tend to be clustered together in certain schools, particularly at post-primary level. Within and between schools, there is a large degree of segregation by social class. Aside from general disquiet about a socially segregated society, there is a large body of educational research that shows such segregation merely exacerbates class difference without improving the system-level performance.
To date, the ending of academic selection has been the key structural intervention in Northern Ireland. This was intended to increase social mixing in schools and in turn bring about equal educational provision and opportunity for all children. However, the continued use of unregulated tests by grammar schools has resulted in minimal impact to date.
(c) ‘BeyondSchool’Interventions
Some researchers argue that initiatives that focus only on within school factors are unlikely to make a significant difference to disadvantaged children: children’s academic performance cannot be divorced from other aspects of their development and what happens to them in their families and communities.
Consequently, many countries have developed a range of interventions to integrate different services, align them with the work of schools, and to help schools reach into their communities.
In Northern Ireland, the Extended Schools Programme serves areas of greatest social disadvantage; Full Service programmes are piloted through BELB in North Belfast at the Belfast Boys’ and Girls’ Model Schools and CCMS in West Belfast with the Full Service Community Network, which centres on the local communities of the Greater Falls and

An Independent Review of the Common Funding Scheme An Independent Review of the Common Funding Scheme 81
Upper Springfield; and Sure Start Services are provided to some children in the top 20% most disadvantaged wards and Super Output Areas.
There have been evaluations of many “beyond school” interventions. A general finding is that they can create the conditions to make better outcomes possible, but will not deliver them on their own. Rather they need to be a component of a wider approach to whole school improvement.
(d) Targeting Schools in Disadvantaged Areas
This type of intervention involves identifying areas or schools that face challenging circumstances and then targeting additional programmes and resources on schools in these areas. Overall, the evidence on the impact of interventions which have targeted schools in disadvantaged areas is quite mixed.
The British Educational Research Association (BERA)5 has observed that schools can make a difference, and even small differences can be life-changing for pupils from socially disadvantaged backgrounds. However, in many cases the potential of schools to make that difference has not been fully realised. BERA’s review suggests that school driven interventions need to be supported by parallel developments within the disadvantaged communities themselves as schools cannot ‘close the gap’ on their own.
BERA also emphasised that interventions which aim to address complex issues of inequality have to be given time to make an impact. In addition, too many new initiatives can be destabilising and hinder the development of consistent procedures for meeting the needs of disadvantaged children and their families.
The key interventions of this nature in Northern Ireland have been the Achieving Belfast and Achieving Derry – Bright Futures Programmes. Both programmes are intended to be long-term, sustained interventions. The Education and Training Inspectorate evaluated the programmes in May 2010 noting strengths in both programmes, as well as areas for improvement.
________________________________________________________________________
5 BERA (2010) Social Inequality – Can Schools Narrow the Gap?
An Independent Review of the Common Funding Scheme82
Many schools are familiar with the DEIS scheme in the Republic of Ireland which targets extensive resources at schools in disadvantaged areas. Addressing some of the common problems with such schemes identified above, it replaced or combined a number of shorter-term initiatives. It has been comprehensively evaluated, and the initial evaluation of the primary element of the scheme reported significant achievement gains over the first three years of the scheme.6 It is, however, a very high cost initiative.
(e) Interventions which target underachieving groups
Evidence regarding the impacts of targeted programmes, which aim to develop basic skills is reasonably strong, and especially so in primary schools.
Currently, the Common Funding Formula (CFF) has a number of needs-based variables reflecting the additional resource needs of teaching pupils with educational needs including Newcomer pupils; children from the Traveller Community and the Roma community, children with additional educational needs, and those children who come from disadvantaged socio economic backgrounds. In addition, substantial funding is provided to support some of these pupils from outside the ASB.
Social Deprivation
The formula currently uses a banded methodology for social deprivation funding to provide additional funding for pupils from disadvantaged backgrounds. Around 2.8% of the Aggregated Schools Budget is distributed in this manner.
Pupils with Additional Educational Needs
The CFF currently provides additional resources to help primary and post-primary schools in meeting the needs of those pupils who are performing below the expected level for their age and who require additional support. Current arrangements differ between phases of education:
______________________________________________________________________
6 Weir, S. (2011). A report on the first phase of the evaluation of DEIS, Summary report. Dublin: Educational Research Centre.

An Independent Review of the Common Funding Scheme An Independent Review of the Common Funding Scheme 83
• Nurseryschoolsandclasses
Though nursery schools and classes are required to give due regard to the SEN Code of Practice, and broadly follow the same procedures as other schools, there is no separately identifiable funding factor linked to SEN.
• Primaryschools
SEN funding (more recently termed ‘educational attainment’ although not linked to actual pupil attainment) is split in a variable proportion between two components. In 2012/13, each school was allocated a flat rate of £45.39 per pupil (excluding nursery classes and special units), irrespective of pupil characteristics, and £209.60 per pupil registered for FSM. The economic recession coupled with a change in eligibility criteria for FSM led to a 30% growth in this latter type of funding for primary schools between 2005/6 and 2012/13.
• Post-Primaryschools
SEN/educational attainment funding is linked to Key Stage 2 results for intake Year 8 pupils (KS3, intakes for Year 11, is used for Senior High Schools). Results are weighted, and then linked to the total number of pupils in the school and averaged over the last three years of available data. Gradual improvement in KS2 results since 2005/6 combined with a reduction in post-primary numbers has led to a 17% contraction in this type of funding allocated to post-primary schools by 2012/13.
The CFS currently states that this element of the formula is intended to provide additional resources to help schools in meeting the needs of those pupils who are performing below the expected level for their age, and who require additional support.
The SEN Code of Practice and its supplement offer some guidance on use of additional resources for underachieving groups, but the guidance can be perceived as still ambiguous.7 For example, all schools must designate a teacher to act as
________________________________________________________________________
7 The SEN Code of Practice, and the Supplement to the Code, offer the following guidance: “It should be noted that the duty of reasonable adjustments on schools does not require the provision of auxiliary aids and services or the removal or alteration of physical features. Decisions about the provision of educational aids and services for children with SEN will continue to be taken within the SEN framework.” “It will often be reasonable to spend some money. However, it will not always be reasonable to spend large amounts of money.” Though the Supplement went on to set out some useful examples of reasonable adjustments, the guidance on resource expenditure is ambiguous.

An Independent Review of the Common Funding Scheme84
SEN Coordinator (SENCO), with responsibility for day to day operations of the school’s SEN policy, dealing with giving advice to teachers, liaising with parents, and co-ordinating SEN provision; and in all but the smallest schools this will involve extra expenditure. In some schools, the SENCO may also provide some direct teaching support for underachieving pupils or groups of pupils. In England, it is clear that SENCO costs should be met from each school’s base budget. This is not currently explicit in Northern Ireland. Schools may consider it reasonable, and in accordance with guidance, not to draw on base budget funding to meet SENCO costs, but instead to use the CFF SEN/educational attainment funding for this purpose – perhaps leaving little funding to support individual pupils.
Current funding arrangements in England provide for the establishment of ‘notional SEN budgets’, with schools expected to provide additional funding support of up to £6,000 per pupil to meet their SEN. The figure of £6,000 is not directly comparable to Northern Ireland, as there are various differences in funding allocation patterns, but the panel can see merit in providing added clarity about each school’s responsibility to provide additional support up to a specified cost ceiling for individual pupils. The panel, therefore, recommends that a ‘notional SEN budget’ be identified for each school in Northern Ireland.
Newcomer pupils
Newcomer pupils need to be helped to acquire both conversational and academic proficiency in the language of instruction, enabling them to access the curriculum and take a full part in every aspect of school life. Consequently the formula has provided additional funding of approximately £1,000 per year for the first three years of the pupil’s school life to facilitate this.
Children from the Traveller Community
The Traveller community has historically suffered high levels of disadvantage and this has extended into the education system. The Taskforce on Traveller Education reported that “it is clear that on a range of indicators – including attendance, achievement and the very high proportion of Traveller children identified as having ‘special needs’ – that Traveller children are profoundly disadvantaged in their experience of statutory
An Independent Review of the Common Funding Scheme An Independent Review of the Common Funding Scheme 85
education”. 8 Research in England estimates that Traveller children are roughly 2.7 times as likely as a “White British” pupil to have identified SEN.9 The CFF has, therefore, included additional support for Traveller children – approximately £1000 per pupil per year.
Roma Pupils
As the number of Roma pupils in schools in Northern Ireland is small, the panel was unable to obtain reliable educational performance data. There is substantial international evidence, however, that Roma pupils face many of the challenges experienced by Traveller pupils, severely affecting their educational attainment10. In Northern Ireland, there are additional language and poverty barriers affecting both the children and their parents. Since 2009/10 the CFF has included additional support for Roma Children – approximately £1000 per pupil per year.
Improving Arrangements for Funding for Disadvantaged Pupils
23. Despite the current investment and the strategies outlined above, the strong link between underachievement and social disadvantage continues to pervade the education system here.
24. Additional funding, well spent, can make a real difference to vulnerable and disadvantaged pupils. But it must be well spent. Just as greater national wealth, or higher expenditure on education does not guarantee better student performance, additional funding for supporting children from less affluent backgrounds does not always improve outcomes.
________________________________________________________________________
8 Report of the Taskforce on Traveller Education, 2011.
9 Lindsay, G., Pather, S., & Strand, S. (2006). Special educational needs and ethnicity: Issues of over- and under-representation. DfES Research Report 757. Nottingham: Department for Education and Skills.
10 NFER (2009), ‘Improving the Outcomes for Gipsy, Roma and Traveller pupils – Literature Review’, Anne Wilkin, Chris Derrington and Brian Foster
An Independent Review of the Common Funding Scheme86
25. Whilst still in its early days of implementation, the recent OFSTED evaluation into the use of the Pupil Premium in England provides a relevant cautionary note on the limited impact of additional funding alone. Only one in 10 school leaders said that the Pupil Premium had significantly changed the way that they supported pupils from disadvantaged backgrounds. Rather, they commonly said that they were using the funding to maintain or enhance existing provision. Schools did not routinely disaggregate the Pupil Premium funding from their main budget, especially when receiving smaller amounts. Inspectors saw little evidence of a strong focus on the Pupil Premium by governors or managing committees.11
26. The relationship between spending and outcomes for children from socially-disadvantaged circumstances is complex: the way money is spent is crucial12. Internationally, high-performing systems are better at ensuring each student receives the instruction they need. They ensure resources and funding are targeted at those students who need them most. Schools are then closely monitored against a set of criteria to ensure the resources are being effectively utilised and mechanisms are developed for intervening when these criteria are not met. The very best systems also locate the processes for intervention in the schools themselves.13
27. Equally, international evidence is also clear about what does not work to improve outcomes for children from disadvantaged backgrounds: overloading schools with multiple short-term interventions is simply not effective.
28. The OECD, for example, recommends ten steps which would reduce school failure and drop out at the system level, three of which are crucial in regard to resource allocation:
• Provide strong education for all, giving priority to early childhood provision and basic schooling;
• Direct resources to the students with greatest needs;
________________________________________________________________________
11 OFSTED, The Pupil Premium, How schools are using the pupil premium to raise achievement for disadvantaged pupils (September, 2012). 12 Sutton Trust (2011), Toolkit of Strategies to Improve Learning 13 McKinsey and Company, How the world’s best performing school systems come out on top, (September, 2007).

An Independent Review of the Common Funding Scheme An Independent Review of the Common Funding Scheme 87
• Set concrete targets for more equity, particularly related to low school attainment and dropouts.14
29. In short, in order to overcome the significant barriers to educational achievement for those from socially disadvantaged backgrounds, significant resources should be targeted at those who need it most. The second key challenge is linking this spending with learning outcomes.
Funding Levels
30. In Northern Ireland, the social deprivation factor within the CFF amounted to 2.8% of the ASB in 2012/13 – equivalent to £108 per primary pupil, and £82 per post-primary pupil.15 In a primary school with a high concentration of pupils living in social deprivation, the amount rises to over £400 per pupil.
31. It is difficult to draw direct comparisons with spend other countries, as social deprivation patterns differ both in scale and intensity and as noted above funding may be allocated through associated education initiatives, alongside social deprivation funding factors. Bearing in mind the difficulties in drawing valid comparisons, it is interesting to note the approach in some other countries.
• England. A Pupil Premium of £623 is provided for every pupil who is registered for FSM, or was registered at any stage during the pupil’s previous six years at school. The Premium is expected to increase to £900 in 2013/14. In addition, Local Education Authority school funding formulae already provide funding to schools linked to measures of social deprivation; informal estimates suggested that this may amount to £1.5 billion per year – equivalent to an average of an additional £200 per pupil.
________________________________________________________________________
14 OECD Policy Brief, 10 Steps to Equity in Education (January 2008). The remaining steps are: ‘Limit early tracking and streaming and postpone academic selection; Manage school choice so as to contain the risks to equity; In upper secondary education, provide attractive alternatives, remove dead ends and prevent dropout; Offer second chances to gain from education; Identify and provide systematic help to those who fall behind at school and reduce high rates of school-year repetition; Strengthen the links between school and home to help disadvantaged parents help their children to learn; Respond to diversity and provide for the successful inclusion of migrants and minorities within mainstream education.’
15 This is all pupils not the amount per pupil entitled to FSM.

An Independent Review of the Common Funding Scheme88
• Australia. The 2011 Review of Funding for Schooling recommended an additional ‘loading factor’ for students based on socio-economic status, with some broad and tentative estimates. The loading would be very small in schools with few pupils facing social deprivation but it would rise to approximately £2000 per pupil in primary schools with a high concentration of pupils experiencing social deprivation: in post-primary schools, the amount would be higher, perhaps £2500 per pupil.
• New Zealand. The Ministry of Education’s Operational Funding Rates include ‘Targeted funding for educational achievement’ linked to socio-economic school deciles. In 2012, a school in the decile with the fewest pupils from a socially deprived background would receive no additional funding through this factor; but a school in the decile with the most pupils who experience social deprivation would receive an additional £400 per pupil. In addition, the New Zealand government has a number of initiatives directed specifically at raising standards among children from Maori and Pasifika backgrounds, which are only partially reflected in the funding above.
• Republic of Ireland. Direct comparisons with the Republic of Ireland are quite difficult, as a far smaller proportion of funds is directly delegated to schools. For example, the DEIS scheme to address educational disadvantage targets considerable additional resources at schools with socially deprived enrolments, and funding increases as the extent of social disadvantage increases. However, much funding is directed at employing additional support teachers and reducing pupil-teacher ratios, all of which is managed centrally. Schools do receive additional funding, but it represents a very small element of the scheme’s overall cost. As such, school-level funding comparisons with the Republic are somewhat misleading. At system-level, approximately €1.2bn was spent in 2011/12 on the general area of “social inclusion”, of which the majority came from the Department of Education and Skill’s budget.
32. The continuing tail of educational under-achievement, as illustrated in both domestic examination outcomes and international studies, is evidence that more funding must be directly targeted at pupils from socially-disadvantaged backgrounds. International evidence indicates the most effective way to direct this money is via direct funding rather than short-term initiatives. Countries such as England, the Republic of Ireland

An Independent Review of the Common Funding Scheme An Independent Review of the Common Funding Scheme 89
and Australia have provided, or recommended significant additional direct funding for pupils from socially deprived backgrounds, with funding proportional to the extent of social deprivation. The panel, therefore, recommends that a revised funding formula must increase the level of funding spent for social deprivation.
Concentrations of Disadvantage
33. From the groundbreaking Coleman report in 196616 to more recent OECD analyses of multiple cycles of PISA17, it is clear that a school context effect exists. Schools that are very socially segregated are likely to magnify pre-existing differences between their intake.
34. In particular, low SES students attending a school that is also largely composed of low SES students typically have poorer outcomes than they would were they enrolled in a more mixed school. Research in the Republic has found that while a high concentration of “disadvantage” in a school is associated with poorer achievement outcomes for all pupils – irrespective of their own SES – the effects are most pronounced for boys from low SES families.18 Given recent reviews such as that by the Working Group on Educational Disadvantage and the Protestant Working Class19, led by Dawn Purvis, this would seem an important point to note.
35. The panel, therefore, recommends that increased funding for socio-economic deprivation would be weighted towards schools with significant concentrations of disadvantage to reflect the additional negative effects outlined above. However, the panel also wishes to promote socially balance intakes and therefore, even at the lowest rate, a significant premium should be allocated for pupils from socially disadvantaged circumstances.
________________________________________________________________________
16 J. Coleman et al (1966) Equality of Educational Opportunity.(Washington, US Department of Health, Education and Welfare).
17 OECD (2012) ‘Equity and Quality in Education: Supporting Disadvantaged Students and Schools’
18 Eivers, E., Shiel, G., & Shortt, S. (2004). Reading literacy in disadvantaged primary schools, Dublin: Educational Research Centre.
19 Working Group on Educational Disadvantage & the Protestant Working Class (2011) Educational Disadvantage and the Protestant Working Class: A Call to Action
An Independent Review of the Common Funding Scheme90
Linking Spending with Outcomes
36. The second key challenge is linking this spending with learning outcomes. Evidence indicates that giving schools the autonomy to lead on appropriate interventions and provide tailored local solutions to individual problems is the most effective way improving teaching and learning for children from disadvantaged backgrounds. However, schools must also be supported to make informed choices. The Sutton Trust’s toolkit20 summarises the research on improving attainment for those from socially disadvantaged groups. It is an example of a resource on which schools can draw when selecting effective interventions for supporting pupils who are eligible for the additional funding.
37. Currently, many schools do not draw on best research evidence when choosing interventions. For example, OFSTED recommends that school leaders, including governing bodies, should ensure that Pupil Premium funding is carefully targeted at the designated children and spent in ways known to be most effective. However, despite this advice, a recent NFER report, found that Pupil Premium funds were often being spent without reference to available research on which interventions are most effective.21 It pithily noted that “while a large proportion of teachers believed that decisions in their school are based on research evidence, it is unclear what evidence they are using”. They found teachers often favoured high cost, low/no impact methods (but with face-value popularity) over more effective, but less popularly appealing methods.
38. With additional delegated funding must come the responsibility of ensuring that the funds are spent appropriately and effectively. Schools must be able to justify their choice of interventions, using evidence-based research; they must set out relevant plans and targets to lift the performance of low attaining pupils within School Development Plans, and Boards of Governors should oversee performance.
39. The panel recommends that as the final strand in adopting international best practice, ESA and DE must also closely monitor and evaluate the use of additional
________________________________________________________________________
20 Sutton Trust (2011), Toolkit of Strategies to Improve Learning
21 Cunningham, R. and Lewis, K. (2012). NFER Teacher Voice Omnibus 2012 Survey: The use of the Pupil Premium. Slough: NFER.

An Independent Review of the Common Funding Scheme An Independent Review of the Common Funding Scheme 91
resources and performance of schools and intervene rapidly when performance expectations are not met.
40. In conclusion, it is only by providing significant funding, by linking this funding with learning outcomes, by measuring and monitoring performance and by intervening rapidly when outcomes are not satisfactory, that best practice in improving outcomes for children from socially disadvantaged backgrounds will be achieved.
Social Deprivation: Getting the Measure Right
41. A recent report to the Assembly in relation to the Child Poverty Strategy estimated that almost 75,000 children were living here in poverty in 2008/9; the number had been increasing each year since 2006/722. It is likely that the number of children living in poverty has risen even higher during the current economic recession.
42. For school funding purposes within the UK, registration for FSM has been commonly used as a measure of social deprivation. Other measures of social deprivation used for school funding purposes in the UK have included:
• A parent claiming income-related Jobseekers Allowance, or Income support (this measure is also used in NI within for nursery schools).
• Area-based measures, such as the official “Income Deprivation Affecting Children Index” (IDACI), and Indices of Multiple Deprivation. There are also area-based measures available from commercial sources, such as ACORN and Mosaic.
43. Though the dominant measure, the use of registration for FSM as a proxy for social deprivation has been subject to criticism:
• Perception of under-claiming – for example, by families which do not claim benefits to which they are entitled and families who do not claim their
________________________________________________________________________
22 IMPROVING CHILDREN’S LIFE CHANCES – THE FIRST YEAR. A REPORT TO THE ASSEMBLY AS REQUIRED BY ARTICLE 12(7) OF THE CHILD POVERTY ACT 2010. “Absolute income poverty means living in an income poor household. The target is that less than 5% of children should live in households that have a household income of less than 60% of the UK median household income for the financial year 2010-11 adjusted annually to take account of inflation.”

An Independent Review of the Common Funding Scheme92
entitlement to FSM. In England, the panel is aware of anecdotal evidence that registration rates may be lower in some marginalised groups, including some black and minority ethnic communities (particularly where parents have difficulty using English). Also, there are some suggestions of lower registration rates in rural areas, and in post-primary schools. In Northern Ireland, there have again been suggestions that registration rates may be lower in post-primary schools and also in certain sections of the community, specifically amongst Protestant families.23
• Changing eligibility depending on phase of education – no account is taken of the educational disadvantage of those children who cease to be eligible, particularly as a result of the differing criteria between primary and post-primary in Northern Ireland.
44. In the call for evidence 75% of respondents felt that entitlement to FSM was the most appropriate indicator to allocate funding associated with social deprivation. However, whilst 83% of respondents from primary schools felt FSM entitlement was most appropriate, only 30% respondents from post-primary agreed with this. It was also particularly notable that only 21% of grammar school respondents felt FSM entitlement was most appropriate, compared to 44% of secondary schools.
45. A common theme from respondents who confirmed that they agreed FSM entitlement was most appropriate was the caveat that it was a crude indicator, but in the absence of anything else it was most appropriate, as the data for FSM entitlement is readily available and is updated annually unlike other measures. In addition, it was seen as an externally validated measure that was not “manipulable” and was easily understood.
46. Alternatives to FSM entitlement include area-based measures such as the Northern Ireland Multiple-Deprivation Measure (NIMDM); the Income Deprivation Affecting Children Index (IDACI) and Acorn/MOSAIC.
• NIMDM is a measure of multiple deprivation which is based on distinct domains of deprivation including income; employment; health & disability; education &
________________________________________________________________________
23 ‘A Call to Action: Educational Disadvantage and the Protestant Working Class’ Dawn Purvis and the Working Group on Educational Disadvantage and the Protestant Working Class; March 2011

An Independent Review of the Common Funding Scheme An Independent Review of the Common Funding Scheme 93
training; proximity to services; living environment and crime & social disorder. This is a wide spectrum of deprivation issues, while FSM is sensitive only to income issues. In addition, the measure avoids the simple eligible/ineligible dichotomy associated with FSM. On the other hand, it relies on more out-of-date information; and it classifies all people living in an area in the same way, although their circumstances may in practice vary considerably. The following chart shows the relationship between the percentage of pupils registered for FSMs, and the area where each pupil lives, grouped into socioeconomic deciles based on the NIMDM. It is clear that the FSM registration indicator is particularly effective in identifying pupils in the most socioeconomically deprived areas.
Diagram 7.1 The % of pupils registered for FSM by NIMDM decile based on area of residence, primary and Year 8-12 post-primary pupils, 2011/1224
Note: Decile 1 represents the most deprived areas, Decile 10 the least deprived areas.
• IDACI is an index of deprivation which measures the proportion of children under the age of 16 that live in low income households. Unlike FSM, the IDACI score for each pupil does not relate directly to their individual family circumstances, but is a proxy measure based on their local area. The following charts show
________________________________________________________________________
24 Source: NISRA. Diagram compiled by panel.
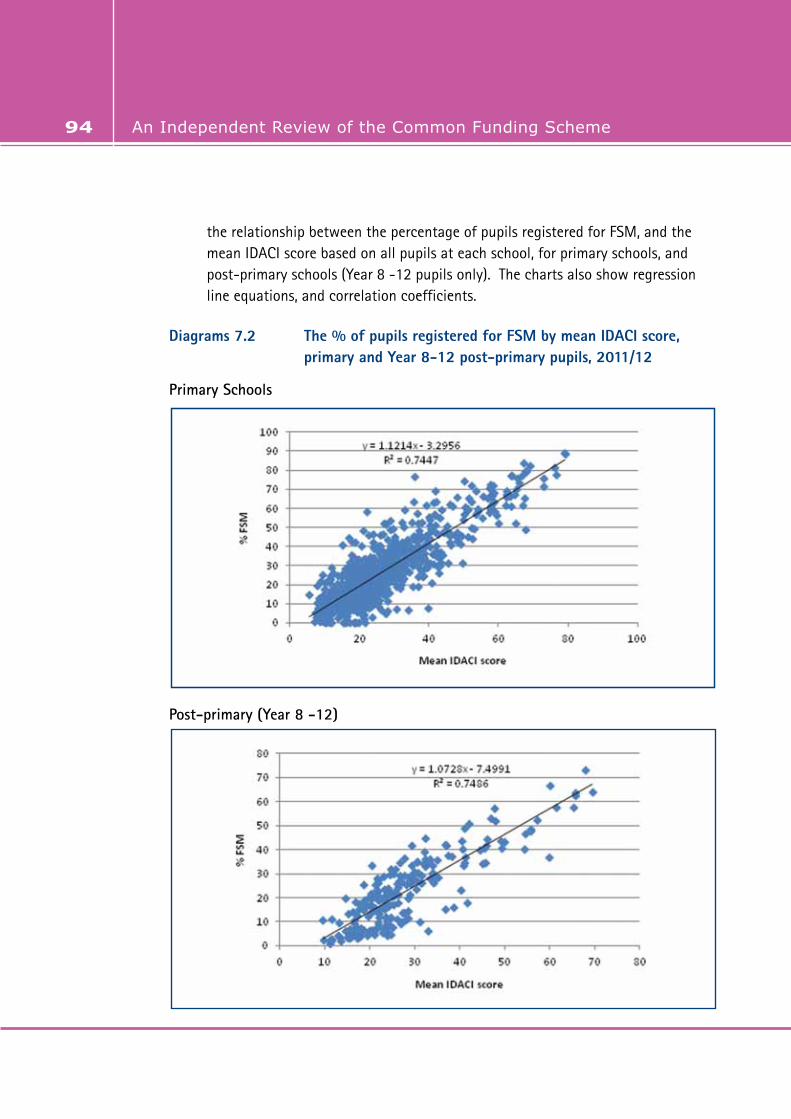
An Independent Review of the Common Funding Scheme94
the relationship between the percentage of pupils registered for FSM, and the mean IDACI score based on all pupils at each school, for primary schools, and post-primary schools (Year 8 -12 pupils only). The charts also show regression line equations, and correlation coefficients.
Diagrams 7.2 The % of pupils registered for FSM by mean IDACI score, primary and Year 8-12 post-primary pupils, 2011/12
Primary Schools
Post-primary (Year 8 -12)
An Independent Review of the Common Funding Scheme An Independent Review of the Common Funding Scheme 95
There is a strong correlation at school level between mean IDACI scores and the percentage of pupils registered for FSM, both at primary and post-primary (Year 8-12) phase. There is no evidence that IDACI would be more effective than FSM % in identifying severe social deprivation.
• ACORN and MOSAIC are commercial geodemographic classifications at postcode and household level. The measures draw on census data and other information. The Department of Education in London have commented that the measures provide better discrimination for less severely deprived groups. On the other hand, DE also noted that most input data was for areas larger than postcode areas, with precise data inputs and statistical methods being protected by commercial confidentiality. 25
47. A comparison of FSM registration rates to available information on absolute poverty rates indicated no differential registration rates by religious background.
48. Over recent years, however, the numbers registered for FSM have increased more rapidly in primary schools than in post-primary schools. This is in part due to the extended eligibility criteria at primary level. However, there remains some concern that registration rates may be lower within post-primary schools, due to a perceived stigma among parents, and (anecdotally) due to the greater ability of primary schools to encourage parents to register.
49. When considering the appropriateness of FSM entitlement, it is also important to note that the data is collected and updated on an annual basis and is available at pupil level. In the panel’s opinion, FSM entitlement provides an indication of the relative concentration of potentially ‘disadvantaged’ pupils in a given school in a way that no other indicator currently seems to do.
Future Eligibility for Free School Meals
50. The introduction of the Universal Credit will have an impact on the eligibility criteria for FSM entitlement as key benefits which determine whether a family is entitled
________________________________________________________________________
25 “Consultation on school funding, 2011-12: introducing the Pupil Premium”, DE London, 2010.
An Independent Review of the Common Funding Scheme96
to FSM (including Income Support, Job Seekers’ Allowance and Child Tax Credit and Working Tax Credit) will all cease to exist for new claimants, and be replaced by the Universal Credit.
51. Under the current system in Northern Ireland there are different criteria determining entitlement to FSM for nursery, primary and post-primary pupils as a result of changes implemented by the Department in 2010. At nursery and primary level the criteria now include families in receipt of Working Tax Credit and an annual taxable income not exceeding an amount determined by the DE26. Post-primary pupils in the same position are not eligible for FSM.
52. Currently there is a drop off in the numbers claiming their entitlement to FSM at post-primary level and this combined with the different eligibility criteria for post-primary pupils could result in the under-identification of educational disadvantage needs of these children at post-primary level. Educational needs are not dependent on the changing eligibility criteria for FSM or whether the entitlement is claimed. Those needs remain.
53. In addressing this disparity, the panel has considered two options, while aware that the introduction of Universal Credit will in any event require alteration to current eligibility criteria for FSM:
i) Extend the criteria for FSM registration at primary level to the post-primary level. This would increase the number of eligible pupils at post-primary, but at additional cost to DE, through provision of additional FSM (though this extension could just be restricted to CFS related purposes only).
ii) Determine that a child who becomes eligible for FSM at any time shall continue to be classified as “Ever FSM” for CFS purposes only for the remainder of their school education. Note that a pupil’s entitlement to a FSM is not affected by this option, it simply affects CFS allocations to schools. England is beginning to implement this option, based on eligibility for FSM in the previous 6 years. Clearly the number of pupils classified as “Ever FSM” would be higher than the
____________________________________________________________________
26 The amount of taxable income is currently £16,190

An Independent Review of the Common Funding Scheme An Independent Review of the Common Funding Scheme 97
number of pupils registered for FSM in any specific year, and Ever FSM would spread social deprivation funding more thinly across a wider group of schools. However, annual funding to individual schools would be more stable, allowing better planning and use of funding – “boom and bust” cycles in the wider economy cause the actual number of pupils eligible for free school meals to move in a cyclical manner over a series of years.
55. Both these options would improve the current allocation pattern of social deprivation funding. There is more uncertainty about the full effects of the “Ever FSM”, and there may be merit in taking a staged approach – Option 1 does not preclude the subsequent implementation of Option 2. With either option, the panel recommends regular monitoring of the impact, including any differential impact on sections of the community.
Conclusion
56. The priority of closing the gap in educational underachievement between those who are least and most disadvantaged is clearly recognised in Northern Ireland. The panel is encouraged to note the relatively strong performance of primary pupils in PIRLS and TIMSS and the continued improvement in the attainment levels of school leavers. Despite this however there remains a long tail of underachievement and the continued strong link between underachievement and social disadvantage is evident.
57. Finding the most appropriate ways to tackle this issue, however, remains the key challenge. The panel acknowledges the interventions implemented by DE to target underachieving groups, including the funding streams within the CFF. However, the panel is of the view that more needs to be done in a targeted and co-ordinated manner to ensure that the resources are used in an appropriate way to tackle this problem. Alongside dedicated resources to tackle the underachievement of disadvantaged pupils, schools should be made fully aware of their responsibilities to plan and use the funding effectively, with close monitoring and intervention when outcomes are not satisfactory.
58. Furthermore, the panel also believes that the total budget dedicated to tackling educational disadvantaged should be significantly increased. It is acknowledged that funding alone will not reduce the achievement gap between those who are least and most disadvantaged. Nonetheless, the panel is of the view that by targeting

An Independent Review of the Common Funding Scheme98
resources at those pupils who need them most, combined with an effective support and monitoring system will assist those pupils in overcoming the significant barriers they face.
59. Whilst there has been much debate about the most appropriate measure of educational disadvantage, the panel considers that FSM entitlement currently provides a reliable indication of the relative concentration of children at risk of poor education outcomes due to social deprivation. It is recommended that social deprivation funding continue to be allocated using either adjusted FSM eligibility criteria (to increase eligibility in the post-primary phase), or “Ever FSM” criteria.
60. DE should however, also consider the collection of other pupil-level variables that might add to the information provided by FSM entitlement. In particular, data on maternal education would be of interest as maternal education is a recognised strong predictor of children’s educational outcomes.27 The panel recommends that the DE gathers data on maternal education for inclusion in pupil databases, and models its efficacy as a measure of additional educational need.
Key Recommendations - Chapter 7
Recommendation 17
More funding should be directly targeted at pupils from socially disadvantaged backgrounds. This should be part of core school funding rather than short-term initiatives. A revised funding formula should increase the level of funding spent for social deprivation.
________________________________________________________________________
27 See for example: Carneir , P et al, (September 2007), Maternal Education, Home Environments and the Development of Children and Adolescents, in IZA Discussion Paper Series; Isaacs, J and Magnuson, K, (December 2011), Income and Education as Predictors of Children’s School Readiness, Brookings; and Dearden, L, (June 2011), Measuring school value added with administrative data: the problem of missing variables, in Department of Quantitative Social Science (Institute of education, University of London), Working Paper No. 11-05).
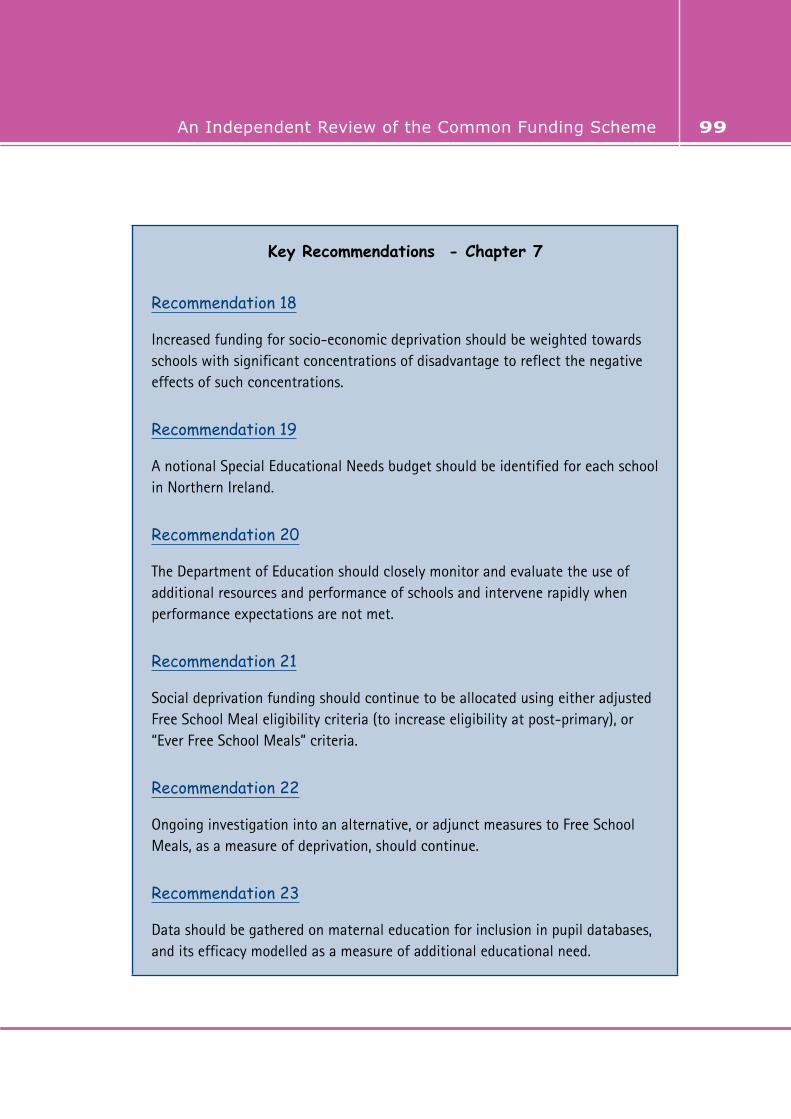
An Independent Review of the Common Funding Scheme An Independent Review of the Common Funding Scheme 99
Key Recommendations - Chapter 7
Recommendation 18
Increased funding for socio-economic deprivation should be weighted towards schools with significant concentrations of disadvantage to reflect the negative effects of such concentrations.
Recommendation 19
A notional Special Educational Needs budget should be identified for each school in Northern Ireland.
Recommendation 20
The Department of Education should closely monitor and evaluate the use of additional resources and performance of schools and intervene rapidly when performance expectations are not met.
Recommendation 21
Social deprivation funding should continue to be allocated using either adjusted Free School Meal eligibility criteria (to increase eligibility at post-primary), or “Ever Free School Meals” criteria.
Recommendation 22
Ongoing investigation into an alternative, or adjunct measures to Free School Meals, as a measure of deprivation, should continue.
Recommendation 23
Data should be gathered on maternal education for inclusion in pupil databases, and its efficacy modelled as a measure of additional educational need.
An Independent Review of the Common Funding Scheme100
Chapter 8
Principles of Reform
Introduction
1. The preceding chapters highlighted a number of issues with the Common Funding Scheme (CFS), as currently instituted. In particular, the panel found shortcomings in transparency, fairness, and in the extent to which the scheme supported Departmental policy in areas such as the Sustainable Schools Policy and addressing social deprivation and educational under-attainment.
2. This chapter proposes a new model for school funding that will address these deficiencies. The panel is very conscious that a funding formula is simply that: a means of allocating funding to schools. It can ensure that funding is distributed in a transparent and equitable manner and that additional funding is targeted at those pupils most in need. It is, however, ultimately only a support mechanism. Improved outcomes will only come with high quality teaching and learning, outstanding leadership and high-quality interventions for socially disadvantaged children.
3. This chapter begins by proposing some modifications to the key principles for the CFS and then outlines proposals for a new funding formula that is fairer, simpler, more consistent and transparent.
4. The panel wants education funding to reach the pupils who need it most. Consequently, the guiding principles underpinning the proposed reforms are to simplify the funding formula and then to distribute as much funding as possible according to pupil rather than institutional needs. A significant reduction in the number of funding factors makes it as clear as possible why a school receives the funding it does, whilst funding factors based on pupil characteristics rather than school organisation or premises characteristics ensure pupil needs are the core determinant of funding allocations.

An Independent Review of the Common Funding Scheme An Independent Review of the Common Funding Scheme 101
Key Principles of the Common Funding Scheme
5. The aims of this review are to ensure that the revised CFS is fit for purpose, sufficiently targets social needs and is consistent with, and supports, Departmental policy objectives. The panel was also asked to ensure that the existing principles of objectivity, equality and transparency are embedded in any revised CFS.
6. The panel feels that the principles that underpin the CFS should be refocused from institutions to the pupils they serve. The following revised funding principles are, therefore, recommended.
• Sustainable schools should be funded according to the relative need of their pupils, and in a way that enables the effects of social disadvantage to be substantially reduced.
The original principle stated that ‘schools should be funded according to their relative need, and in a way that helps mitigate the effects of social disadvantage’. In view of the considerable additional financial support provided to large numbers of small schools, the panel considers that this principle placed excessive emphasis on the financial survival of schools, as institutions. This has resulted in a considerably weaker emphasis on the needs of pupils, especially socially disadvantaged pupils.
• Sustainable schools should be funded on a consistent and fair basis, taking full account of the needs of pupils.
The original set of principles stated that ‘schools should be funded on an objective and fair basis determined as far as possible by objective measures of the various factors which give rise to unavoidable and significant additional expenditure’. Again, the panel considers that this principle placed too much emphasis on the costs of schools as institutions, rather than on the needs of pupils.
• The formula should support schools in delivering the curriculum;
• The formula should underpin and reinforce wider education policy and objectives;
An Independent Review of the Common Funding Scheme102
• The formula should be as transparent and comprehensible as possible and predictable in its outcome.
Area Planning: A Key Concern
7. A key difficulty for the panel in developing a new funding formula has been that the implementation of the Sustainable Schools Policy and the Area Planning Process are at an early stage of development. The pace and nature of change is difficult to gauge.
8. As described in Chapter 4, the current funding formula provides a range of small schools support funding, which reflects the significant number of small schools in the estate, as currently configured. Equally, a new formula that removes small schools support removes it for all such schools, even those which must continue and need to be well supported. A funding formula cannot delineate between varieties of small schools.
9. The panel is aware that some small schools, particularly at primary level, will continue to be needed. Consequently, the panel recommends that the Department of Education (DE) should, as a matter of urgency, develop a Small Schools Policy, which defines clearly the circumstances in which a small school will be required. This would include unrealistic travelling times to other schools for pupils, or particular community need.
10. A Small Schools Policy will in turn allow some schools to become recognised, or strategically designated small schools. These schools will require additional funding outside the formula, or indeed may be wholly funded outside the formula. It may be necessary to reduce the ASB in order to create a funding reserve for these strategically designated small schools.
11. Given the very early process of change, the panel cannot, and would not try to estimate the numbers of small schools likely to be needed in the medium to long-term, and consequently the amount of funding that will ultimately be required. This will be a matter for DE and the planning authorities.
12. In support of the Sustainable Schools Policy, the panel recommends the removal of small school support factors from the Common Funding Formula (CFF). However,
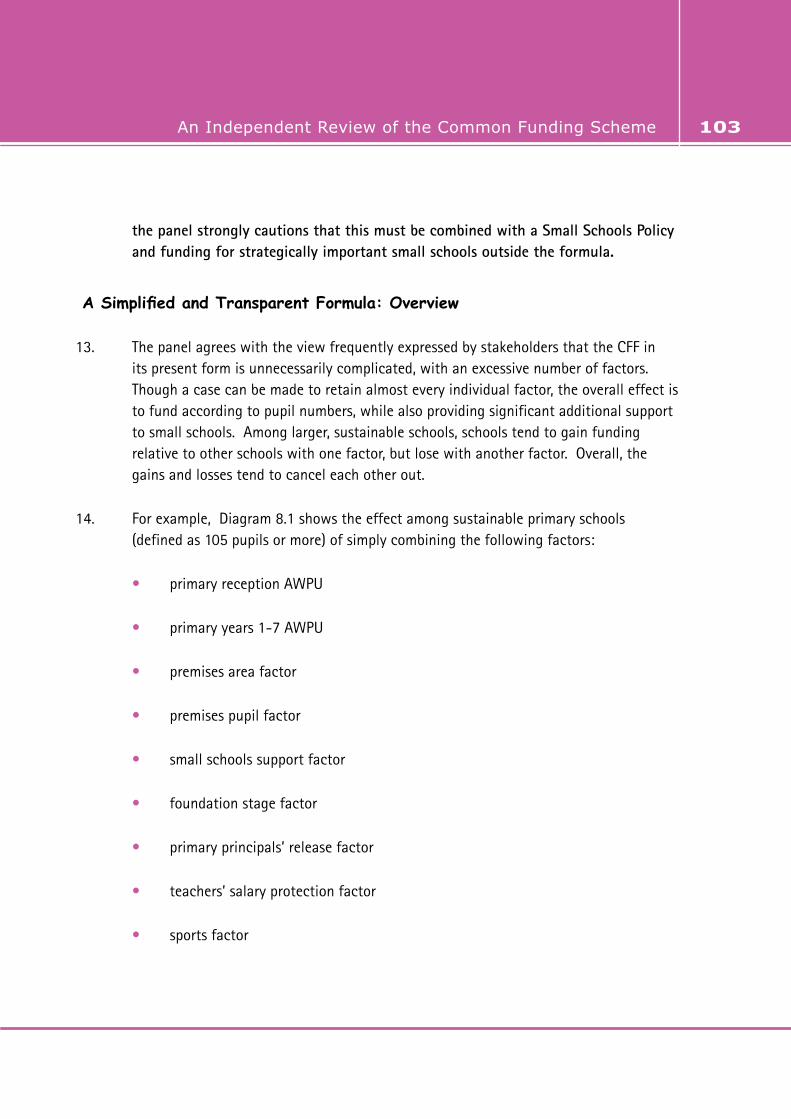
An Independent Review of the Common Funding Scheme An Independent Review of the Common Funding Scheme 103
the panel strongly cautions that this must be combined with a Small Schools Policy and funding for strategically important small schools outside the formula.
A Simplified and Transparent Formula: Overview
13. The panel agrees with the view frequently expressed by stakeholders that the CFF in its present form is unnecessarily complicated, with an excessive number of factors. Though a case can be made to retain almost every individual factor, the overall effect is to fund according to pupil numbers, while also providing significant additional support to small schools. Among larger, sustainable schools, schools tend to gain funding relative to other schools with one factor, but lose with another factor. Overall, the gains and losses tend to cancel each other out.
14. For example, Diagram 8.1 shows the effect among sustainable primary schools (defined as 105 pupils or more) of simply combining the following factors:
• primary reception AWPU
• primary years 1-7 AWPU
• premises area factor
• premises pupil factor
• small schools support factor
• foundation stage factor
• primary principals’ release factor
• teachers’ salary protection factor
• sports factor

An Independent Review of the Common Funding Scheme104
Diagram 8.1: Funding from nine selected CFF factors for individual primary schools, related to pupil enrolment, 2012/13
Notes:1. Regression equation is y = 2.3167x + 80.2922. Excludes nursery class and special unit AWPU funding3. Excludes schools with enrolments less than 105 pupils4. Excludes infant schools, and preparatory departments.
15. As can be seen the nine factors combine to show an almost perfect correlation (0.99) between amount of funding allocated per school and numbers of pupils per school. Similar relationships are apparent for Year 8-12 and Year 13-15 funding. Given this, it is difficult to justify the use of nine factors, where one (pupil numbers) provides essentially the same outcome.
16. The panel is also aware of a further practical concern – a large number of funding factors produces a complex and opaque formula and makes it very difficult to see why a school receives the funding it does. This contributes to misinformed comparisons about the levels of funding received by different schools or school phases and to unfounded perceptions of bias.
17. In addition to significantly increasing the amount of funding dedicated to tackling educational disadvantage, the two key goals of the panel have, therefore, been
An Independent Review of the Common Funding Scheme An Independent Review of the Common Funding Scheme 105
• to simplify the funding formula, having the minimum number of factors required to facilitate the distribution of funding in an equitable manner, and, therefore, to make it as clear as possible why a school receives the funding it does.
• to distribute as much funding as possible according to pupil rather than institutional needs.
18. It should be acknowledged that an entirely objective funding formula is not possible. It would require knowledge about what it should cost to support individual pupils from very different backgrounds to achieve their potential, and this knowledge would then need to be linked to the costs of running the school which each pupil was attending, be it nursery, primary or post-primary, be it small, medium or large. Even then funding allocations would be subject to variations in the overall funding available.
19. The panel therefore proposes a formula, with ten potential funding elements, but for most schools only a few will be relevant. Most schools will receive their formula funding allocations on the basis of a basic per-pupil allocation, additional per-pupil allocations for children from disadvantaged backgrounds; and at primary school, a £50,000 lump sum.
20. Each grant-aided school will receive a basic per-pupil allocation for all pupils, varying according to phase of education. The amount of the budget allocated via the basic per pupil allocation will be considerably higher than under the current funding formula.
21. The key dimensions of disadvantage that are having a significant impact on pupils educational performance in Northern Ireland are:
• social deprivation
• special educational needs
• looked-after children
• Traveller and Roma background; and

An Independent Review of the Common Funding Scheme106
• limited English language proficiency
The revised formula, therefore, provides significant additional funding for each pupil experiencing social deprivation, for pupils from Traveller and Roma communities, for looked–after children, and Newcomer pupils. It also establishes ‘notional SEN budgets’ for each school.
22. Northern Ireland’s schooling system is characterised by strong concentrations of disadvantaged students in certain schools, particularly at post-primary level. As illustrated in Chapter 7, research demonstrates that concentrations of disadvantage have negative educational impacts. In order to counter this, the level of support provided for pupils experiencing social deprivation will be higher at schools that have high concentrations of disadvantage.
23. The panel wants the vast majority of funding to be distributed on the basis of pupil numbers, or through pupil needs factors. However, the large variability in primary school size means that per pupil allocations alone provide insufficient funds for many sustainable schools with smaller enrolments. Consequently, all primary schools will receive a fixed lump sum payment of £50,000 per annum. As will be discussed later in the chapter, the analyses undertaken by the panel showed that lump sums were unnecessary in nursery school and post-primary school phases, but were needed to establish a balanced funding structure at primary level.
24. Whilst an aim has been to have as few institution targeted funding factors, as possible, a number of supplementary factors for some schools types are essential given the nature of the Northern Ireland school system. Voluntary grammar and grant maintained integrated schools have additional legal responsibilities for the provision of landlord maintenance. They have also additional administrative requirements associated with the model of grant funding described in Chapter 5. These include the need to employ legal and audit services. In recognition of these additional responsibilities, the panel has recommended an additional maintenance and administration per pupil allocation. This allocation will reflect the overall level of funding allocated in the current formula via the landlord maintenance and administration factors. Equally, Irish-medium schools face additional costs linked to the provision of resources and curricular development in Irish, which must be reflected in funding allocations. These
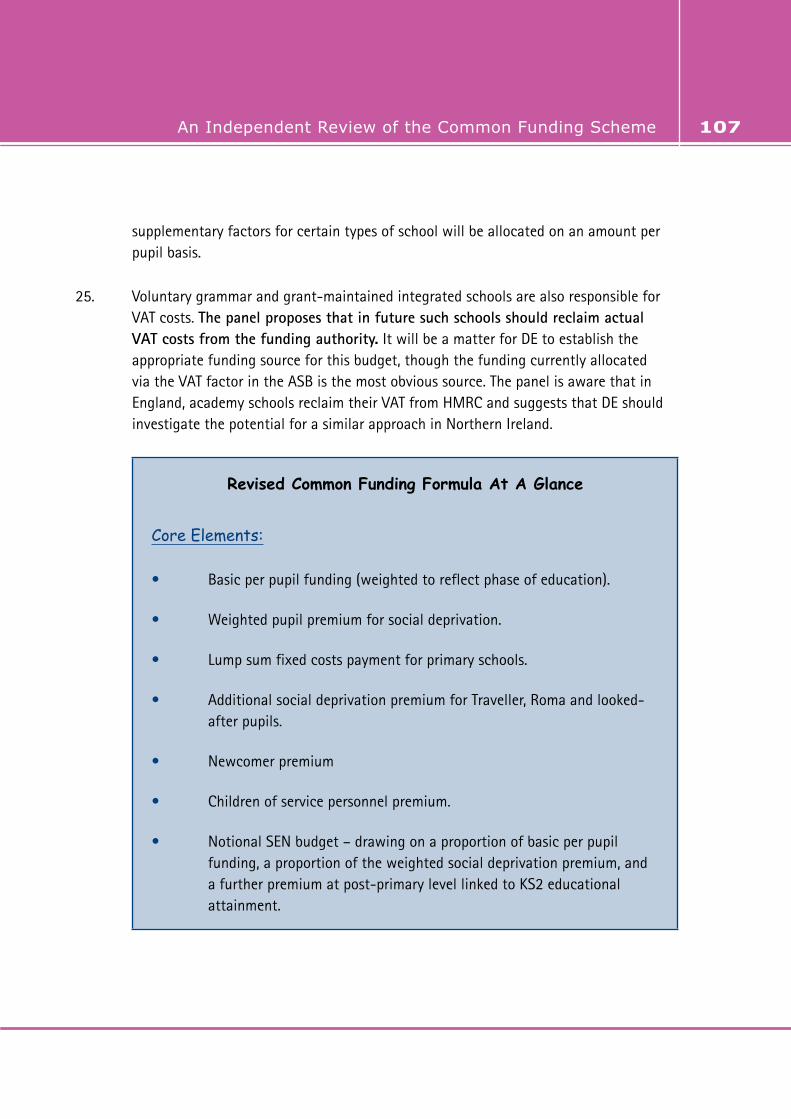
An Independent Review of the Common Funding Scheme An Independent Review of the Common Funding Scheme 107
supplementary factors for certain types of school will be allocated on an amount per pupil basis.
25. Voluntary grammar and grant-maintained integrated schools are also responsible for VAT costs. The panel proposes that in future such schools should reclaim actual VAT costs from the funding authority. It will be a matter for DE to establish the appropriate funding source for this budget, though the funding currently allocated via the VAT factor in the ASB is the most obvious source. The panel is aware that in England, academy schools reclaim their VAT from HMRC and suggests that DE should investigate the potential for a similar approach in Northern Ireland.
Revised Common Funding Formula At A Glance
Core Elements:
• Basic per pupil funding (weighted to reflect phase of education).
• Weighted pupil premium for social deprivation.
• Lump sum fixed costs payment for primary schools.
• Additional social deprivation premium for Traveller, Roma and looked-after pupils.
• Newcomer premium
• Children of service personnel premium.
• Notional SEN budget – drawing on a proportion of basic per pupil funding, a proportion of the weighted social deprivation premium, and a further premium at post-primary level linked to KS2 educational attainment.

An Independent Review of the Common Funding Scheme108
Revised Common Funding Formula At A Glance
Supplementary Elements:
• Administration and landlord maintenance pupil payment for voluntary grammar and grant-maintained integrated schools
• Irish-medium school and unit support premium.
• Amalgamation premium.
The Elements in Detail
I. Basic per Pupil Funding
There will be a basic per pupil element of funding, weighted according to phase of education. This will include part-time and full-time weightings for nursery classes and schools and two weightings at post-primary level – one for Years 8-12 and a second for Years 13-15.
Without changing overall funding in the nursery school and class phase, the formula slightly increases the current funding difference between full- and part-time pupils.
For post-primary schools, the proposed formula will narrow the funding difference between the basic per pupil allocations for Years 8-12 and Years 13-15. This will ensure that 11-16 schools are not disadvantaged. The costs of providing a large, sustainable sixth form, with appropriately sized classes should not be significantly greater than Key Stage 4 provision. As highlighted in Chapter 4, an unintended consequence of the high AWPU weighting for post-16 pupils may have been an additional financial incentive for schools to establish, or continue to run sixth form provision that is not sustainable, or able to deliver the range of courses required under the Entitlement Framework. The closer weighting will remove some of the financial incentive for schools to run small, inefficient sixth forms.

An Independent Review of the Common Funding Scheme An Independent Review of the Common Funding Scheme 109
As currently configured, the Northern Ireland post-primary phase is very inefficient. The panel is keen to continue the trend in recent years and transfer additional resources into the primary school phase. In particular, as the importance of targeting resources at early years is generally recognised. However, the panel does not feel that it can immediately transfer significant amounts of post-primary funding to primary schools, without adversely impacting the education of current post-primary pupils. In the medium to longer-term, the panel strongly recommends that proportionally more funding be directed at the primary phase of education. In anticipation of this, the post-primary phase as a whole must be restructured, and made more efficient as funding will not support current provision.
Some may argue that the very good performance of primary pupils on PIRLS and TIMSS, contrasted with the mediocre performance of post-primary pupils on PISA, means more funding needs to be directed at post-primary. The panel holds the reverse view. Channelling proportionally more funds to post-primary level for these reasons would be a perverse incentive for inefficiency, fragmentation, and social segregation.
II. Lump Sum for Primary Schools
All primary schools will receive a fixed lump sum payment of £50,000 per annum.
As noted, the panel wants the vast majority of funding to be distributed on the basis of per pupil funding, or through pupil needs factors. However, there is enormous variation in primary school size (ranging from seven to almost 900 pupils). Two-thirds (68%) of primary schools have less than 200 pupils, including 281 schools with between 100 and 200 pupils.
The wide range in size means that per pupil allocations alone would not cover costs at small- to medium-sized, but sustainable primary schools. A flat rate increase of the per pupil value is not a solution, as this only slightly improves the funding allocation to smaller schools, while significantly increasing the allocation to larger schools.
Consequently, all primary schools will receive a fixed lump sum payment to reflect a number of fixed costs that do not increase incrementally in line with changes in pupil numbers.
An Independent Review of the Common Funding Scheme110
Whilst the lump sum will benefit small- to medium-sized primary schools most, funding per pupil for small schools is nonetheless significantly reduced in the revised funding model. Schools with enrolments below 105 will require additional funding outside the formula to remain viable, subject to assignment of designated small school status.
The long-term need for the primary school lump sum will be dependent on the nature and pace of the changes implemented via area planning, in particular the number of schools with enrolments between 100 and 200.
By contrast, all sustainable post-primary schools should receive sufficient funding via per pupil allocations to negate the need for a lump sum payment. Nursery schools do not have the wide size range demonstrated in the primary phase and, consequently, a higher basic per pupil allocation benefits all nursery schools relatively equally.
III. Weighted Pupil Premium for Social Deprivation
Previously, £31.7 million was allocated to alleviate social deprivation through the scheme. In the new formula (based on 2012/13 funding levels) this would rise to approximately £47.8 million.
Within the nursery school and class phase, social deprivation funding is already high relative to other phases, and the formula will continue to distribute a similar level of funding, with eligibility based on the same criteria as at present (Job Seekers Allowance (JSA)/Income Support (IS) or Free School Meals (FSM). Pupils will attract higher funding rates in schools with a higher proportion of pupils experiencing social deprivation.
Within the primary and post-primary school phases, the formula will increase the proportion of funding linked to social deprivation. Eligibility will be either based on registration for FSM (assuming widened eligibility criteria at post-primary level), or on ‘Ever FSM’ criteria. As at nursery, pupils will attract higher funding rates in schools with a higher proportion of pupils experiencing social deprivation.

An Independent Review of the Common Funding Scheme An Independent Review of the Common Funding Scheme 111
Based on pupil numbers, schools (nursery, primary and post-primary separately) will be ranked into 5 quintiles, and the schools in each quintile will receive funding set out in Table 8.1.
Using 2012/13 funding levels, at the lowest level the premium would be £511 per pupil at primary, £531 per pupil at post-primary and £1,174 per pupil at nursery rising to £766 per pupil at primary, £797 per pupil at post-primary and £1,762 at nursery at the highest level.
Table 8.1 Social Deprivation Premium Values
Very high social deprivation Quintile 5 1.2 weighting
High social deprivation Quintile 4 1.1 weighting
Average social deprivation Quintile 3 1.0 weighting
Low social deprivation Quintile 2 0.9 weighting
Very low social deprivation Quintile 1 0.8 weighting
IV. Additional Social Deprivation Premium
An additional social deprivation premium will provide funding to support the additional educational needs of three groups of children:
• children of Traveller community:
• Roma children; and
• looked-after children
The additional social deprivation premium for these pupils will be provided at approximately the current level of the Traveller/Roma CFF factor. The panel has also included looked-after children within this element as many (though not all) pupils within this group also need additional support which is not provided through the current CFS. Given the nature of their care arrangements these children may not be eligible for FSM and therefore receive support under the additional social deprivation
An Independent Review of the Common Funding Scheme112
element. At the value of the 2012/13 ASB funding would be equivalent to £1012.66 per pupil.
V. Newcomer Premium
A Newcomer premium will provide additional funding to support the educational needs of Newcomer children. Funding will be at the same level as in the existing funding formula. At the value of the 2012/13 ASB funding would be equivalent to £1012.66 per pupil.
VI. Notional Special Educational Needs Budget and Premium
The panel endorses the concept of a notional SEN budget, such as that currently applied in England. Schools have a responsibility to use part of their normal budget to support individual pupils with additional learning needs, and to coordinate SEN-related issues. Further, as there is some correlation between the prevalence of many types of additional learning needs, and social deprivation, it is reasonable that some additional funding for social deprivation should be used to meet these additional needs. Finally, it is legitimate to allocate additional resources to address poor attainment, once care is taken to deal with any perverse performance incentives. In Northern Ireland, attainment-related funding relates to post-primary level, where Key Stage 2 and 3 results have already been used for distribution of SEN/educational attainment funding within the existing CFF.
Taking account of expenditure patterns in England, and proceeding with a degree of caution, the panel proposes that notional SEN budgets be calculated as follows:
• nursery schools and classes: £60 per FTE pupil from base AWPU funding, plus 10% of the school’s social deprivation funding.
• primary schools: £60 per pupil from base AWPU funding, plus 30% of the school’s social deprivation funding.

An Independent Review of the Common Funding Scheme An Independent Review of the Common Funding Scheme 113
• post-primary: £20 per pupil from base AWPU funding, plus 10% of the school’s social deprivation funding, plus a prior attainment premium linked to prior attainment levels (Key Stage 2, Key Stage 3 or GCSE results as appropriate).1
Drawing on this notional budget, a school will be expected to co-ordinate SEN related administrative workload, and to meet the needs of most pupils, either through one-to-one or small group support, or through provision of additional equipment and aids. This makes explicit that basic support for pupils with SEN is one of the core functions of a school and provides schools with an indicator of SEN budget.
In England, schools are expected to spend up to £6,000 per annum, where necessary, to meet the additional needs of an individual pupil. Proceeding more cautiously, the panel expects that schools in Northern Ireland should be prepared to spend up to £2,000 per year on a pupil at SEN Stages 1-3. Of course, the majority of pupils with identified additional needs will not require this level of expenditure. Their needs can often be met by the class teacher alone, or supplemented with low cost in-school strategies.
Children of Service Personnel Premium
A service personnel premium will provide additional funding to support the educational needs of children of service personnel. Funding will be at the same level as the existing scheme.
______________________________________________________________________
1 DE does not currently collect information on the GCSE results of Year 13 pupils at school, or pupil level. This information would be valuable in monitoring school performance at post-16 level, as well as supporting the implementation of this element of the new funding formula. The panel recommends that DE begins to collect this information (preferably at pupil level) as soon as possible, and that it then be used to implement this element of the new funding formula. In the meantime, it will be necessary to continue to rely on KS2 or KS3 results to determine prior attainment funding for post-primary schools.

An Independent Review of the Common Funding Scheme114
VII. Voluntary Grammar/Grant Maintained Integrated Administration and Landlord Maintenance Payment
An additional per pupil payment will reflect the additional administrative and landlord maintenance responsibilities in these schools. The amount of funding distributed will be approximately equivalent to the combined funding levels provided in the existing formula via the landlord maintenance and administrative support factors.
VIII. Irish-medium school and unit curricular and administrative premium
An Irish-medium curriculum and administrative support premium will provide additional funding for all pupils attending Irish-medium schools. The premium will combine the total levels of funding available in the current formula for curricular support and in the Irish-medium unit support factor. It will be equivalent to approximately £299 per pupil at 2012/13 funding levels and will be particularly valuable to sustainable Irish-medium schools.
IX. Amalgamation Premium
An amalgamation premium will be payable to all schools for a period of five years following amalgamation. The premium will be equivalent to approximately £100 per pupil in Year 1 following amalgamation, with a 20% reduction in each of the next 5 years.
This premium should address some of the concerns raised by stakeholders that schools may encounter some financial difficulties when amalgamating. It will also act as an incentive to facilitate amalgamation and provide the new schools with the opportunity to establish themselves,
DE may also determine that the premium will be payable in some other circumstances - for example in the event that a controlled and maintained school close and a new school is established, or in the case of federations between schools.
An Independent Review of the Common Funding Scheme An Independent Review of the Common Funding Scheme 115
Weights Per Pupil
26. Based on a model using 2012/13 data, the basic per pupil amount for a primary school pupil has been calculated as £2,498. The panel proposes that funding for each primary school child will be the basic Weight Per Pupil (WPP), with a weighting of 1.000. The panel recommends that each funding element described above (with the exception of the primary school lump sum) should be calculated, as a proportion of this basic weight per pupil. The proportions which will be in line with the cash values indicated above are detailed in Table 8.2.
27. Each year, the overall pupil population and the total ASB will change. A WPP cash value will be calculated by totalling all Weights Per Pupil and dividing into the ASB. The funding per school follows by totalling the WPP weights for that school.
28. The panel feels that having premiums per pupil for each funding element is superior to the mixture of calculations used for factors in the current formula, which as described in Chapters 3 and 4 means that the proportion of funding allocated via some factors may increase year on year, while others may decrease – not for policy reasons, but simply due to the varying factor methodology.
29. In turn, the proposed weighting approach is preferable to having cash values for each funding element, which remain fixed, or rise with inflation. Going forward, the forecast small reductions in the ASB, net expansion in total pupil numbers and assumed increase in the number of pupils living in social deprivation will tend to depress the basic per pupil cash value. As all factors are expressed as proportions of this basic per pupil cash value, the impact will be balanced across funding factors and school phases. Other funding elements will not rise at the expense of the basic per pupil allocations, as is the case in the current formula.
30. In the medium to longer- term however, the panel recommends that the weights be kept under review, and adjusted at the commencement of each Comprehensive Spending Review cycle. There may be policy reasons which might justify a measure of financial protection to pupils in a specific school phase (such as Early Years), or to a specific group of disadvantaged pupils. The initial fixing of weights may assist short term financial planning at school level, but in the medium term adjustment may be deemed more effective.
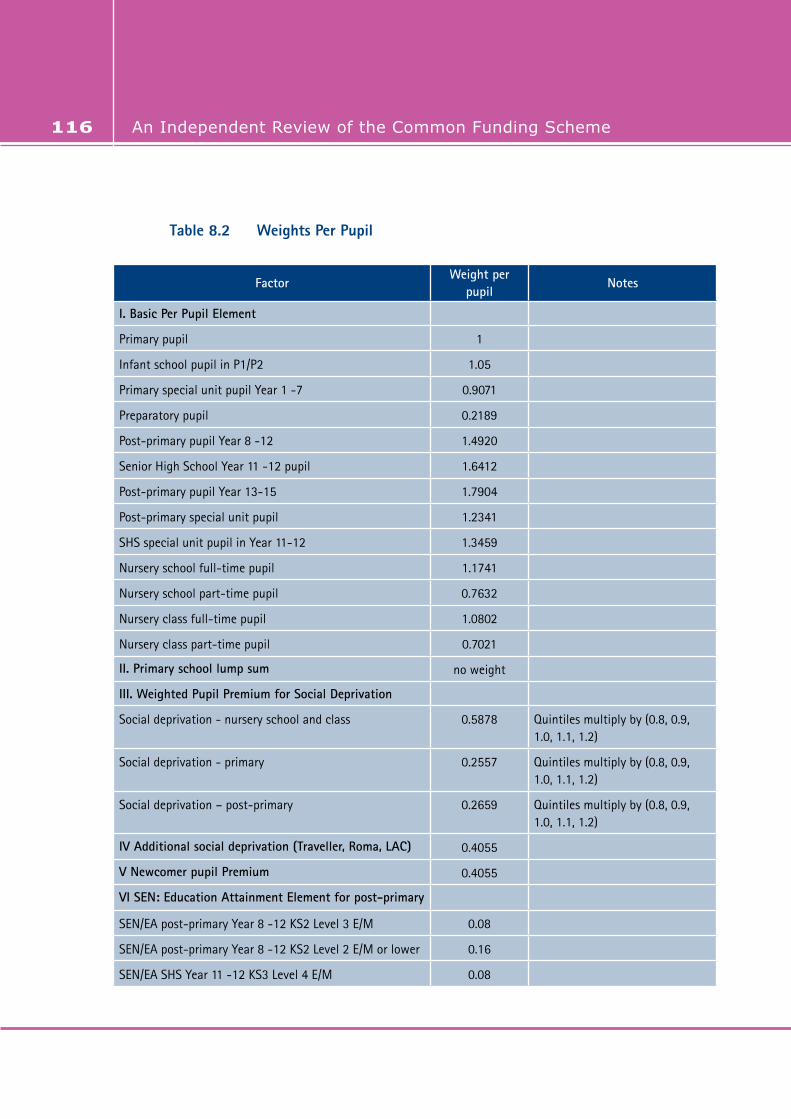
An Independent Review of the Common Funding Scheme116
Table 8.2 Weights Per Pupil
FactorWeight per
pupilNotes
I. Basic Per Pupil Element
Primary pupil 1
Infant school pupil in P1/P2 1.05
Primary special unit pupil Year 1 -7 0.9071
Preparatory pupil 0.2189
Post-primary pupil Year 8 -12 1.4920
Senior High School Year 11 -12 pupil 1.6412
Post-primary pupil Year 13-15 1.7904
Post-primary special unit pupil 1.2341
SHS special unit pupil in Year 11-12 1.3459
Nursery school full-time pupil 1.1741
Nursery school part-time pupil 0.7632
Nursery class full-time pupil 1.0802
Nursery class part-time pupil 0.7021
II. Primary school lump sum no weight
III. Weighted Pupil Premium for Social Deprivation
Social deprivation - nursery school and class 0.5878 Quintiles multiply by (0.8, 0.9, 1.0, 1.1, 1.2)
Social deprivation - primary 0.2557 Quintiles multiply by (0.8, 0.9, 1.0, 1.1, 1.2)
Social deprivation – post-primary 0.2659 Quintiles multiply by (0.8, 0.9, 1.0, 1.1, 1.2)
IV Additional social deprivation (Traveller, Roma, LAC) 0.4055
V Newcomer pupil Premium 0.4055
VI SEN: Education Attainment Element for post-primary
SEN/EA post-primary Year 8 -12 KS2 Level 3 E/M 0.08
SEN/EA post-primary Year 8 -12 KS2 Level 2 E/M or lower 0.16
SEN/EA SHS Year 11 -12 KS3 Level 4 E/M 0.08

An Independent Review of the Common Funding Scheme An Independent Review of the Common Funding Scheme 117
SEN/EA SHS Year 11 -12 KS3 Level 3 E/M or lower 0.16
SEN/EA post-primary Year 13 -15 < 5 GCSE A*-C inc E/M 0.08
VII Children of Service Personnel Premium 0.1622
VII Voluntary Grammar/Grant Maintained Integrated Administration and Landlord Maintenance Payment
0.1086
IX Irish-medium school and unit curricular and administrative premium
0.1198
X Amalgamation 0.0400
The Impact on Schools
31. Table 8.3 demonstrates how 2012/13 funding would be distributed under the proposed funding formula.
32. As recommended, the panel proposes voluntary grammar and grant–maintained integrated schools should be able to reclaim actual VAT costs from the funding authority. The total amount of funding in the ASB has, therefore, been reduced by the current VAT factor amount paid to voluntary grammar and grant–maintained integrated schools.2
______________________________________________________________________
2 It should be also noted that in modelling the impact of the proposed formula, the panel has estimated the number of post primary FSM pupils on the basis of extended eligibility equivalent to that at primary school. Due to time constraints, the educational attainment allocation at post-primary has been calculated using the methodology in the current formula.

An Independent Review of the Common Funding Scheme118
Table 8.3 Distribution of 2012/13 Aggregated Schools Budget via proposed funding formula
School type Size band Modelled CFFMean
change per school
Number gaining >
£5k
Number losing >
£5k
Modelled CFFper FTE
pupil
Mean change per FTE pupil
Nursery £18,266,656 £0 30 37 £3,611 £0
Infant £2,401,700 £11,502 1 0 £2,961 £41
Primary < 105 £64,124,724 -£24,554 2 286 £3,452 -£387
105 - 199 £111,821,625 -£8,685 33 146 £3,088 -£58
200 - 299 £88,578,019 £11,970 81 18 £3,005 £51
300 - 499 £146,685,755 £41,668 129 4 £2,890 £111
> 499 £71,314,413 £55,034 41 0 £2,811 £89
Secondary and grant-maintained integrated
< 400 £51,192,445 -£107,927 0 47 £4,158 -£412
400 - 599 £87,102,659 £14,925 25 14 £4,203 £30
600 - 799 £74,631,508 £65,711 26 4 £4,190 £96
800 - 999 £70,530,497 £86,264 19 0 £4,240 £99
> 999 £66,943,700 £106,104 13 0 £4,169 £86
Senior High £8,006,798 -£14,025 1 2 £4,312 -£23
Voluntary and controlled grammar
< 400 0 0 0 0 0 0
400 - 599 £13,684,971 -£47,575 0 4 £4,253 -£89
600 - 799 £48,611,054 -£31,530 1 12 £4,172 -£43
800 - 999 £85,362,968 -£3,550 8 10 £4,126 -£4
> 999 £108,872,112 £19,907 17 5 £3,990 £16
Total £1,118,131,604
Note: Excludes preparatory department pupils in grammar schools, and associated funding

An Independent Review of the Common Funding Scheme An Independent Review of the Common Funding Scheme 119
Table 8.4 Average Funding per capita in Primary and Post-Primary Schools According To Percentage of the Enrolment Entitled to FSM via proposed formula
School phase FSM % bandNumber of
schoolsNumber of
pupilsNumber of FSM pupils
Funding per pupil
Primary 0-9.9 119 22756 1577 £2,913
10-19.9 231 42102 6387 £2,973
20-29.9 210 35677 8924 £3,096
30-39.9 121 23966 8250 £3,269
40-49.9 64 11104 4926 £3,421
50-59.9 32 6152 3406 £3,530
60 or more 62 12413 8611 £3,624
Post-primary 0-9.9 58 50717 2611 £4,157
10-19.9 55 38517 5809 £4,135
20-29.9 51 29224 7376 £4,165
30-39.9 29 16805 5947 £4,314
40-49.9 13 7803 3396 £4,405
50-59.9 6 2120 1162 £4,492
60-69.9 4 1452 922 £4,556
Note: Excludes preparatory department pupils in grammar schools, and associated funding
33. The above tables demonstrate the major impact of new formula:
• The nursery school phase is not affected in overall terms. Individual nursery schools may experience a modest change in funding – typically nursery schools with a higher proportion of pupils experiencing social deprivation.
• The removal of small school funding support will clearly reduce funding levels in small primary schools, and increase funding in larger schools. Strategically necessary small schools must, however, receive additional support from funding

An Independent Review of the Common Funding Scheme120
outside the Aggregated Schools Budget (at a level deemed appropriate in each case).
• At post-primary level, there is need for substantial structural change. The new formula will substantially reduce funding for small non-selective post-primary schools. Grammar schools of medium and small size will lose some funding, due not only to the removal of small school support, but also due to the narrower funding gap between Year 8-12 pupils, and the increased funding linked to social deprivation. Larger post-primary schools of all types will gain additional funding, which should assist in fully implementing the Entitlement Framework.
• At both primary and post-primary level schools will receive large premiums for children from socially-disadvantaged backgrounds. Schools with significant concentrations of social deprivation will receive considerably higher average funding per pupil than other schools to help them meet the needs of these pupils.
34. The proposed new formula would allocate funding in a significantly altered manner from the current formula and the impact on many individual primary and post-primary budgets would be considerable.
35. DE must determine the timeframe and nature of the transition to the new formula. The formula supports sustainable schools and at post-primary level, large schools in particular.
36. The Department may wish to implement the formula, as a support mechanism for the current Area Planning Process, or work towards a longer more graduated transition. The implementation of the formula would render small, non-sustainable schools financially unviable. The panel also recognises, therefore, that implementation of the formula will also partly be determined by practical implementation issues – the time needed to identify strategically necessary small schools and the volume and speed at which school closures and amalgamations can be managed.
37. The panel believes there is a very strong case for the Executive to provide additional resources to the education sector during this period of rapid structural change, which is likely to temporarily increase overhead costs across the sector.

An Independent Review of the Common Funding Scheme An Independent Review of the Common Funding Scheme 121
Conclusion
38. In conclusion, the panel believes the proposed funding model is fairer, simpler, and more transparent. It is composed of seven core elements: a basic per pupil entitlement, with additional premiums reflecting pupil needs.
39. The panel is aware that smaller schools receive less funding under the proposed new model, but is also acutely aware that some small schools are necessary. Such schools need, as a matter of urgency, to be assigned a designated small school status that entitles them to funding outside of the formula.
40. The panel also believes that the proposed model shifts the focus from preserving institutions to addressing pupil educational need.
Future Funding Reforms
A Better Balance Across Each Phase of Education
41. Current post-primary provision is unsustainable, inefficient, and fragmented. The panel would like to increase the proportion of funding allocated to primary schools, but believes some re-structuring at post-primary schools must first take place. The panel recommends that the balance of funding between primary and post-primary should be kept under review.
16-19 Funding
42. Historically, post-16 provision, mainly A-Levels, was offered in grammar schools and some non-selective schools. In the last decade, there has been a significant increase in the number of pupils studying post-16 courses in schools and in the range of courses followed. Whilst the increase in pupil numbers is clearly desirable, the panel is concerned that the current model of post-16 provision is not fit for purpose.
43. Small sixth forms, with poor curricular offers, often offering provision that is available elsewhere, are a particular concern. The panel feels sixth forms must be of a sufficient scale to deliver a broad and balanced curriculum at reasonable cost. In addition, the

An Independent Review of the Common Funding Scheme122
panel notes that retaining a pupil in school may help maintain core sixth form numbers in a school, but may not always be in the best interests of the pupil.
44. In addition, DE funds post-16 provision in schools, whilst the Department for Employment and Learning funds pupils aged 16-19 in Further Education Colleges. This has meant that the funding arrangements developed for collaboration between schools and Colleges have not been entirely satisfactory. In discussions, schools felt the hourly charges made by Colleges were high, whilst Colleges felt they were very good value for money and significantly less than charged to commercial clients.
45. In summary, whilst in recent years, there has been some excellent collaboration within Area Learning Communities, there has been limited co-ordination on an area basis of the total post-16 provision offered.
46. The panel recommends that DE should consider moving towards a model whereby it:
• commissions sixth form places on an area basis thereby maximising economies of scale and ensuring a broad, balanced curricular offer for all pupils;
• ensures open access to area based sixth forms; and
• considers with the Department of Employment and Learning the potential for joint funding arrangements for all 16-19 provision.
47. The panel has chosen not to allocate additional funding for the provision of applied, or vocational courses. The panel feels that in the current fragmented system this may encourage further duplication of provision and in particular schools to replicate specialist provision in Further Education Colleges. In the longer-term a single 16-19 funding scheme would undoubtedly recognise the additional costs associated with applied courses.

An Independent Review of the Common Funding Scheme An Independent Review of the Common Funding Scheme 123
Key Recommendations – Chapter 8
Recommendation 24:
In the future, the following principles should underpin the Common Funding Scheme:
• Sustainable schools should be funded according to the relative need of their pupils, and in a way that enables the effects of social disadvantage to be substantially reduced.
• Sustainable schools should be funded on a consistent and fair basis, taking full account of the needs of pupils.
• The formula should support schools in delivering the curriculum;
• The formula should underpin and reinforce wider education policy and objectives;
• The formula should be as transparent and comprehensible as possible and predictable in its outcome.
Recommendation 25
Small school support factors should be removed from the Common Funding Formula. However, this must be combined with a Small Schools Policy and funding for strategically important small schools outside the formula.
The Department of Education should, as a matter of urgency, develop a Small Schools Policy, which defines clearly the circumstances in which a small school will be required and allows for schools to become designated small schools for funding purposes.
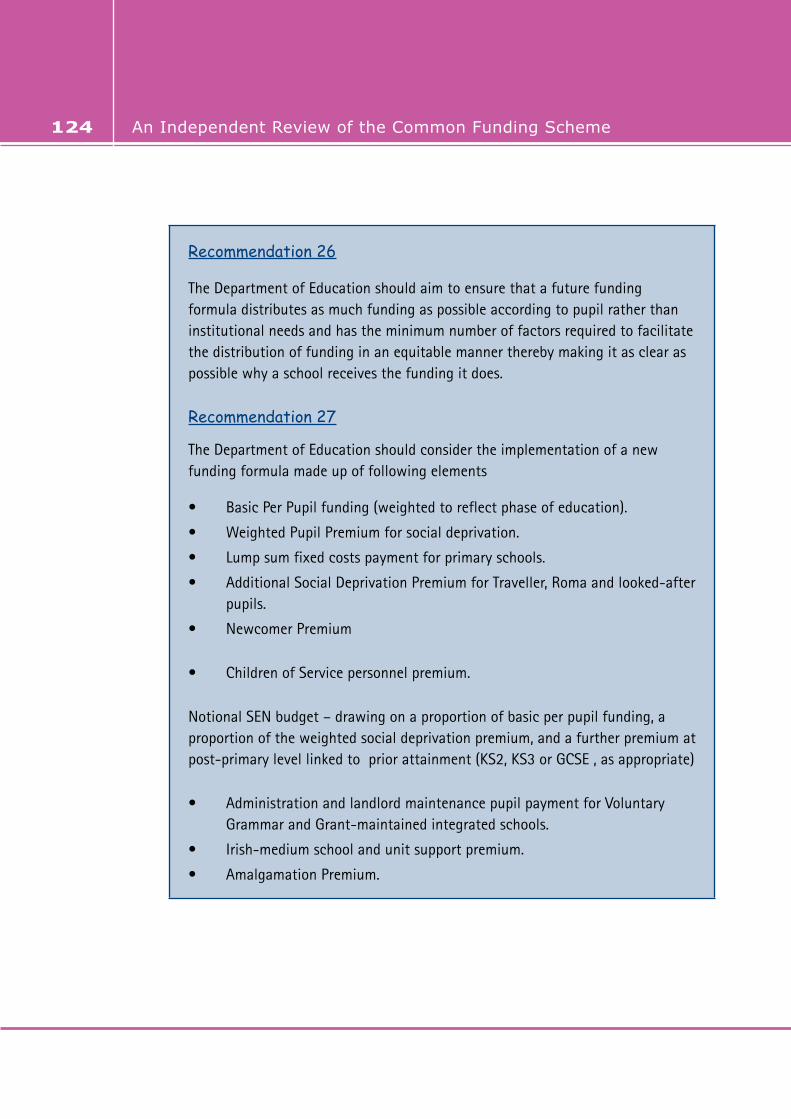
An Independent Review of the Common Funding Scheme124
Recommendation 26
The Department of Education should aim to ensure that a future funding formula distributes as much funding as possible according to pupil rather than institutional needs and has the minimum number of factors required to facilitate the distribution of funding in an equitable manner thereby making it as clear as possible why a school receives the funding it does.
Recommendation 27
The Department of Education should consider the implementation of a new funding formula made up of following elements
• Basic Per Pupil funding (weighted to reflect phase of education).
• Weighted Pupil Premium for social deprivation.
• Lump sum fixed costs payment for primary schools.
• Additional Social Deprivation Premium for Traveller, Roma and looked-after pupils.
• Newcomer Premium
• Children of Service personnel premium.
Notional SEN budget – drawing on a proportion of basic per pupil funding, a proportion of the weighted social deprivation premium, and a further premium at post-primary level linked to prior attainment (KS2, KS3 or GCSE , as appropriate)
• Administration and landlord maintenance pupil payment for Voluntary Grammar and Grant-maintained integrated schools.
• Irish-medium school and unit support premium.
• Amalgamation Premium.
An Independent Review of the Common Funding Scheme An Independent Review of the Common Funding Scheme 125
Recommendation 28:
Voluntary grammar and grant-maintained integrated schools should be able to reclaim actual VAT costs from the funding authority. DE should investigate the potential for these schools to reclaim their VAT from HMRC.
Recommendation 29:
The balance of funding between primary and post-primary should be kept under review.
Recommendation 30:
In the medium to long-term, the Department of Education should consider moving towards a model whereby it commissions sixth form places on an area basis thereby maximising economies of scale and ensuring a broad, balanced curricular offer for all pupils; ensures open access to area based sixth forms; and considers with the Department of Employment and Learning the potential for joint funding arrangements for all 16-19 provision.
An Independent Review of the Common Funding Scheme126

An Independent Review of the Common Funding Scheme An Independent Review of the Common Funding Scheme 127
Appendix 1
Review of Common Funding Scheme (CFS): Final Terms of Reference
Purpose
1. The purpose of this paper is to provide a Terms of Reference for the Review of the Common Funding Scheme (CFS) announced by the Minister for Education on 26 September 2011. The paper defines the strategic context, aim and objectives of the Review and the structure and timeframe required.
Background
2. The Education and Libraries (NI) Order 2003 requires the Department to draw up a Common Funding Scheme (CFS) to apply to all relevant schools funded under the Local Management of Schools (LMS) arrangements. The Education Reform (NI) Order 1989 provided the original legislative basis for the delegation of responsibility under Local Management of Schools. The subsequent introduction of a Common Funding Scheme did not change the fundamental principles of LMS.
3. Article 3(9) of the 2003 Order provides for the Scheme to be varied or replaced by a subsequent scheme. The Department will consult with the LMS Steering Group on the format and content of the subsequent Scheme prior to formal consultation. The LMS Steering Group is made up of representatives of the Department of Education, Education and Library Boards, the Council for Catholic Maintained Schools (CCMS), the Governing Bodies Association (GBA), the NI Council for Integrated Education (NICIE) and Comhairle na Gaelscolaíochta (CnaG). The Education Committee of the Assembly may also contribute proposals for change.
4. The CFS is the methodology used to distribute delegated budgets, and provide a framework for consistent centre funding and support arrangements, to all grant-aided schools, except special schools or schools established in hospitals. The application of formula funding and the delegation of financial and managerial responsibilities to

An Independent Review of the Common Funding Scheme128
Boards of Governors are key elements in the Department’s overall policy to improve the quality of teaching and learning in schools.
5. The key aim of the CFS and its formula methodology is to underpin and reinforce wider education policy and objectives, and act to support schools in delivering the curriculum. The Common Funding Formula is a mechanism to distribute funding in a consistent and equitable way to schools using common measures of identified needs.
Strategic Context
6. In his statement on the 26 September 2011 the Minister said:
“The Common Funding Scheme dictates how funds are allocated to schools. I am not satisfied that the scheme adequately supports and is consistent with our policy objectives. That relates to primary and post-primary funding.
I do not believe that the current system sufficiently takes account of TSN in our drive for sustainable schools.
I am therefore commissioning a major review of the Scheme, with a brief to ensure that it is fit for purpose in our drive for a sustainable estate. …….In taking it forward, I am making it clear that I want schools to continue to be able to decide how best to use the funding they receive, but I also want schools to be more accountable for the outcomes that their pupils achieve.”
Aim of the Review
7. The aim of the Review is to ensure that the revised CFS is fit for purpose, sufficiently targets social needs and is consistent with, and supports, Departmental policy objectives. The outcome of the Review and subsequent Ministerial decisions will be taken forward by the Department and the Education and Skills Authority which will be the Funding Authority for all schools.

An Independent Review of the Common Funding Scheme An Independent Review of the Common Funding Scheme 129
Structure of the Review
8. The Review will be conducted by an independent expert panel, chaired by Sir Robert Salisbury. The Department will provide secretarial support to the panel.
Objectives of the Review
9. The objectives of the Review are to:
• Ensure that the Common Funding Scheme is supportive of the Department’s policies and in particular –
• Sustainable Schools
• The Revised Curriculum: (including Foundation Stage and the Entitlement Framework);
• Every School a Good School
• Count, Read – Succeed
• Targeting Social Need
• Promoting Equality
• Determine whether existing funding streams that are outside the Scheme should be incorporated within it, whether by delegated funding to schools using the CFF, or by centre funding support;
• Consider whether the existing CFF mechanism adequately reflects these policies;
• Ensure that ongoing reviews such as SEN & Inclusion, Early Years, Sustainable Schools and Area Based Planning are all reflected in any revised CFS;

An Independent Review of the Common Funding Scheme130
• Propose amendments to the existing CFF mechanism to ensure it is consistent with, and fully supports these policies;
• Ensure that the existing principles of objectivity, equality and transparency are embedded in any revised CFS;
• Undertake appropriate engagement with key stakeholders;
• Produce coherent proposals and recommendations to the Minister on a revised CFS, in the form of a Report incorporating its analysis, findings and recommendations.
Wider considerations
10. Other, wider issues to be considered within the Review include:
• Analysis of whether those aspects of Special Educational Needs currently funded in the CFS should remain as is, or be augmented;
• Potential inclusion of Special Schools in the CFS;
• Dividing the existing single CFF into three separate formulae for each school phase: Nursery, Primary & Post Primary; and
• How schools will be more accountable for the outcomes that their pupils achieve.
Timing of the Review
11. The independent panel should complete its Report by the end of December 2012, at the latest.

An Independent Review of the Common Funding Scheme An Independent Review of the Common Funding Scheme 131
Appendix 2
The current Common Funding Scheme – selected additional funding streams outside the
Aggregated Schools Budget
During the course of the Review, Funding Authorities provided data to the panel in relation to funding streams outside the Aggregated Schools Budget.
The selected funding streams outside the Aggregated Schools Budget included for analysis of overall school funding levels in Chapter 3 were:
• Funding for contingency, class sizes, split school sites, reorganisation, curriculum reserve support, and administration of educational maintenance allowances.
• In relation to school staffing, the selected funding streams included staff severance, early retirement, long term sickness, maternity pay, substitution, and Upper Pay Spine costs.
• Funding streams for various DE initiatives are also included, such as Revised Curriculum, literacy and numeracy, Entitlement Framework, specialist schools, extended schools, Enriched Curriculum, and Making a Good Start.
A number of other funding streams have been omitted, partly due to concerns with the consistency of financial data obtained from various Funding Authority sources; these omitted streams include some Education and Library Board initiatives, landlord maintenance costs, and the revenue costs associated with Public-Private partnership/Public Finance Initiative projects.
The funding stream associated with staff in mainstream school special units, along with central support for pupils in mainstream classes with special educational needs (Stage 5, and some earlier support) has been omitted (along with school rates) for the purposes of analysis.
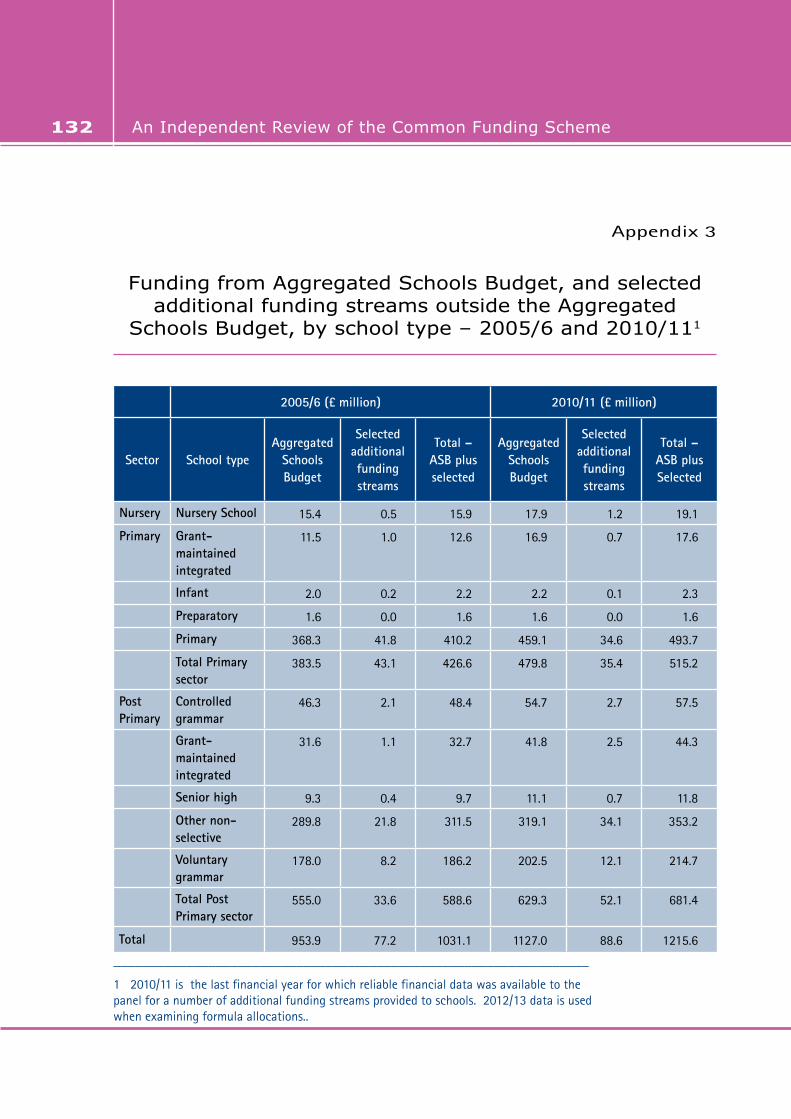
An Independent Review of the Common Funding Scheme132
Appendix 3
Funding from Aggregated Schools Budget, and selected additional funding streams outside the Aggregated
Schools Budget, by school type – 2005/6 and 2010/111
2005/6 (£ million) 2010/11 (£ million)
Sector School typeAggregated
Schools Budget
Selected additional funding streams
Total – ASB plus selected
Aggregated Schools Budget
Selected additional funding streams
Total –ASB plus Selected
Nursery Nursery School 15.4 0.5 15.9 17.9 1.2 19.1
Primary Grant-maintained integrated
11.5 1.0 12.6 16.9 0.7 17.6
Infant 2.0 0.2 2.2 2.2 0.1 2.3
Preparatory 1.6 0.0 1.6 1.6 0.0 1.6
Primary 368.3 41.8 410.2 459.1 34.6 493.7
Total Primary sector
383.5 43.1 426.6 479.8 35.4 515.2
Post Primary
Controlled grammar
46.3 2.1 48.4 54.7 2.7 57.5
Grant-maintained integrated
31.6 1.1 32.7 41.8 2.5 44.3
Senior high 9.3 0.4 9.7 11.1 0.7 11.8
Other non-selective
289.8 21.8 311.5 319.1 34.1 353.2
Voluntary grammar
178.0 8.2 186.2 202.5 12.1 214.7
Total Post Primary sector
555.0 33.6 588.6 629.3 52.1 681.4
Total 953.9 77.2 1031.1 1127.0 88.6 1215.6
_________________________________________________________________
1 2010/11 is the last financial year for which reliable financial data was available to the panel for a number of additional funding streams provided to schools. 2012/13 data is used when examining formula allocations..

An Independent Review of the Common Funding Scheme An Independent Review of the Common Funding Scheme 133
Appendix 4
Number of full-time equivalent pupils ; and funding per pupil, based on Aggregated School Budget
and selected additional funding streams; by school type, for 2005/6 and 2010/11
Number of full-time equivalent pupils
Total ASB plus selected additional funding streams: £ per FTE pupil
Sector School type 2005/6 2010/11 2005/6 2010/11
Nursery Nursery School 5089 5028 3130 3797
Primary Grant-maintained integrated
4641 5431 2707 3246
Infant 913 772 2438 3040
Preparatory 2511 2329 650 667
Primary 162215 153375 2528 3219
Total Primary sector 170280 161907 2505 3182
Post Primary
Controlled grammar 13659 13664 3543 4205
Grant-maintained integrated
8254 9319 3964 4749
Senior high 2421 2464 4025 4778
Other non-selective 81590 75850 3818 4657
Voluntary grammar 47455 46274 3924 4640
Total Post Primary sector 153379 147571 3838 4617
Total 328748 314506 3136 3865

An Independent Review of the Common Funding Scheme134
Appendix 5
Percentage changes between 2005/6 and 2010/11, by school type – changes in full-time equivalent
pupil numbers, changes in total funding (Aggregated Schools Budget plus selected funding
streams), and changes in funding per pupil
% change, 2005/6 – 2010/11
Level Sector FTE pupil numbersTotal ASB plus
selected funding streams
Funding per FTE pupil
Nursery Nursery School -1.2 19.8 21.3
Primary GMI 17.0 40.3 19.9
Infant -15.4 5.4 24.7
Preparatory -7.2 -4.8 2.6
Primary -5.4 20.4 27.3
Total -4.9 20.8 27.0
Post Primary Controlled grammar 0.0 18.7 18.7
GMI 12.9 35.2 19.8
Senior high 1.8 20.8 18.7
Other non-selective -7.0 13.4 22.0
Voluntary grammar -2.5 15.3 18.2
Total -3.8 15.8 20.3
Total -4.3 17.9 23.2
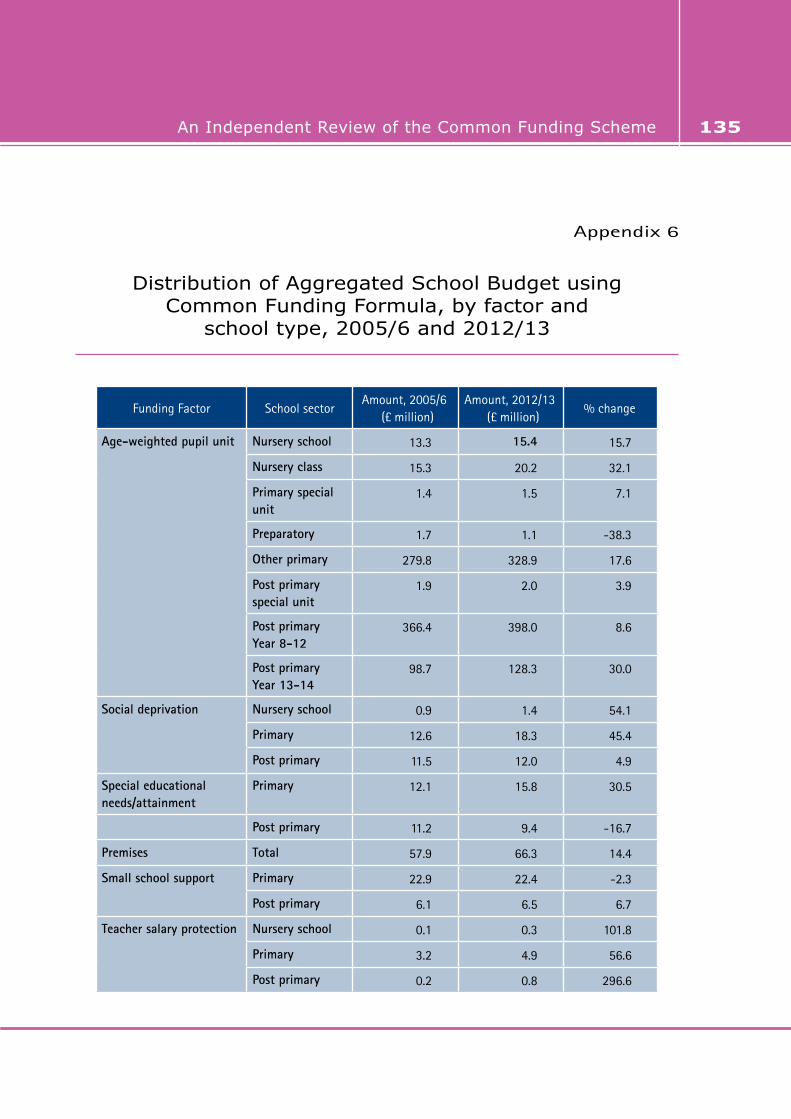
An Independent Review of the Common Funding Scheme An Independent Review of the Common Funding Scheme 135
Appendix 6
Distribution of Aggregated School Budget using Common Funding Formula, by factor and
school type, 2005/6 and 2012/13
Funding Factor School sectorAmount, 2005/6
(£ million)Amount, 2012/13
(£ million)% change
Age-weighted pupil unit Nursery school 13.3 15.4 15.7
Nursery class 15.3 20.2 32.1
Primary special unit
1.4 1.5 7.1
Preparatory 1.7 1.1 -38.3
Other primary 279.8 328.9 17.6
Post primary special unit
1.9 2.0 3.9
Post primary Year 8-12
366.4 398.0 8.6
Post primary Year 13-14
98.7 128.3 30.0
Social deprivation Nursery school 0.9 1.4 54.1
Primary 12.6 18.3 45.4
Post primary 11.5 12.0 4.9
Special educational needs/attainment
Primary 12.1 15.8 30.5
Post primary 11.2 9.4 -16.7
Premises Total 57.9 66.3 14.4
Small school support Primary 22.9 22.4 -2.3
Post primary 6.1 6.5 6.7
Teacher salary protection Nursery school 0.1 0.3 101.8
Primary 3.2 4.9 56.6
Post primary 0.2 0.8 296.6

An Independent Review of the Common Funding Scheme136
Funding Factor School sectorAmount, 2005/6
(£ million)Amount, 2012/13
(£ million)% change
Sports Total 4.4 5.6 27.2
Service personnel Total 0.5 0.3 -41.9
Traveller/Roma Total 0.6 1.0 58.0
English as Additional Language/Newcomer
Nursery school 0.1 0.2 384.9
Primary 1.1 5.7 415.2
Post primary 0.5 2.5 367.2
Irish curricular support Total 0.2 0.3 42.9
Irish unit administration Total 0.3 0.5 76.2
Special unit Total 0.5 0.6 13.2
VGS/GMI VAT Total 3.5 4.2 20.0
VGS/GMI administration Total 7.5 7.5 0.3
VGS/GMIS landlord maintenance
Total 9.6 9.3 -2.8
Transition Total 7.7 0.0 -100.0
Principal release Primary 0.0 8.8 -
Foundation stage Primary 0.0 23.2 -
Total 953.9 1123.3 17.8

An Independent Review of the Common Funding Scheme An Independent Review of the Common Funding Scheme 137
Appendix 7
Education Budget Distribution Table
(a) Figures below represent the 2011-12 & 2012-13 Opening Budgets and Plans for 2013-14 to 2014-15
(b) Position includes additional funding of £120m for the ASB as announced by the Education Minister on 12 January 2012
(c) Position reflects outcome of the Education Minister’s announcement on 15 May 2012 following a review of budgets
(d) Due to roundings some figures may not sum to totals
£m
FUNCTIONOPENING BUDGET 2011-12
OPENING BUDGET 2012-13
2013-14 PLAN
2014-15 PLAN
1. RESOURCE DEL (Departmental Expenditure Limit)
Schools Delegated Budgets, which comprise:Year on Year Change% of overall resource budget
ELB funded Schools (controlled and maintained)Voluntary Grammar SchoolsGrant Maintained Integrated Schools
1,125.7
860.2206.559.0
1,123.3-0.2%58.9%
858.4205.859.1
1,113.0-0.9%58.5%
Budget not yet
allocated
1,138.82.3%
58.4%
Budget not yet
allocated
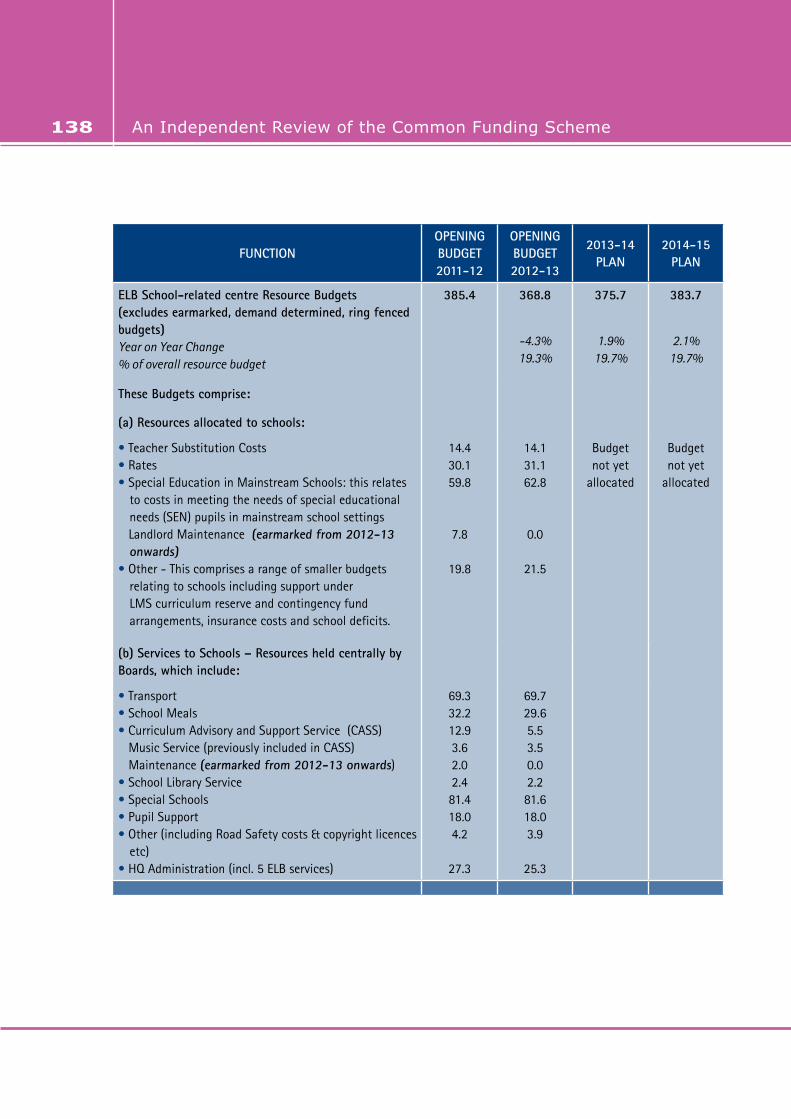
An Independent Review of the Common Funding Scheme138
FUNCTIONOPENING BUDGET 2011-12
OPENING BUDGET 2012-13
2013-14 PLAN
2014-15 PLAN
ELB School-related centre Resource Budgets(excludes earmarked, demand determined, ring fenced budgets)Year on Year Change% of overall resource budget
385.4 368.8
-4.3%19.3%
375.7
1.9%19.7%
383.7
2.1%19.7%
These Budgets comprise:
(a) Resources allocated to schools:
• Teacher Substitution Costs• Rates• Special Education in Mainstream Schools: this relates
to costs in meeting the needs of special educational needs (SEN) pupils in mainstream school settings
Landlord Maintenance (earmarked from 2012-13 onwards)
• Other - This comprises a range of smaller budgets relating to schools including support under LMS curriculum reserve and contingency fund arrangements, insurance costs and school deficits.
14.430.159.8
7.8
19.8
14.131.162.8
0.0
21.5
Budgetnot yet
allocated
Budgetnot yet
allocated
(b) Services to Schools – Resources held centrally by Boards, which include:
• Transport• School Meals• Curriculum Advisory and Support Service (CASS) Music Service (previously included in CASS) Maintenance (earmarked from 2012-13 onwards)• School Library Service• Special Schools• Pupil Support• Other (including Road Safety costs & copyright licences
etc)• HQ Administration (incl. 5 ELB services)
69.332.212.93.62.02.481.418.04.2
27.3
69.729.65.53.50.02.281.618.03.9
25.3
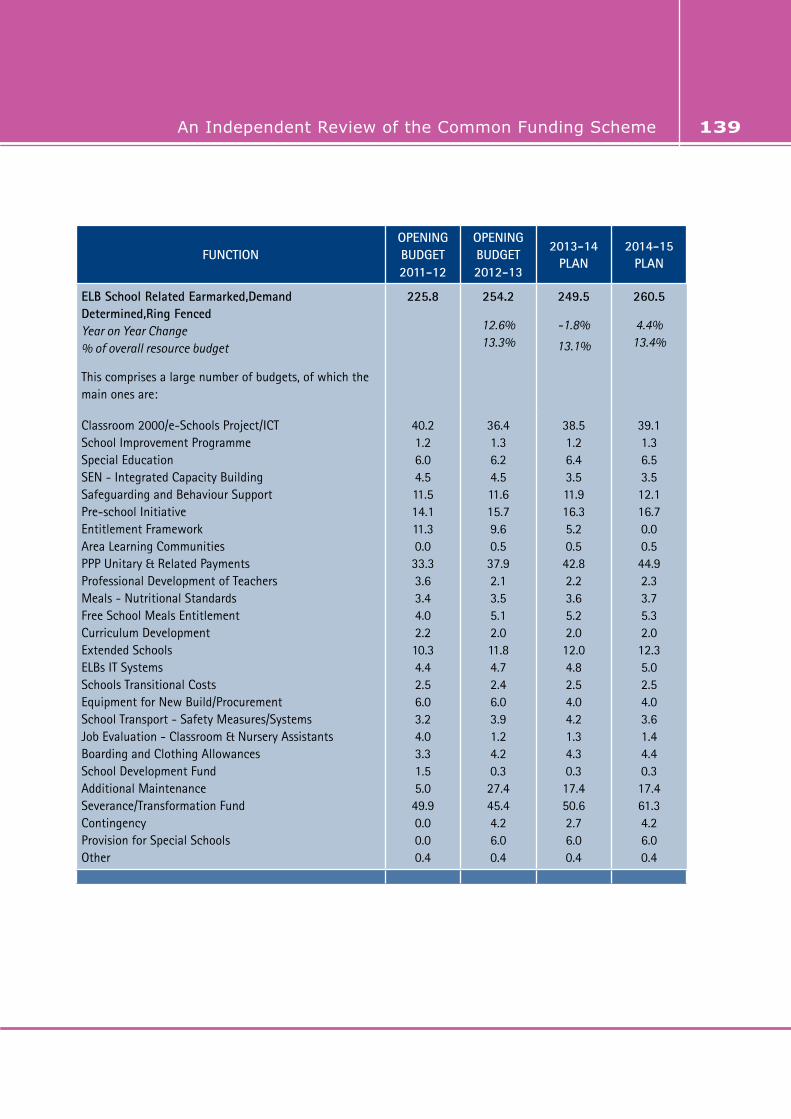
An Independent Review of the Common Funding Scheme An Independent Review of the Common Funding Scheme 139
FUNCTIONOPENING BUDGET 2011-12
OPENING BUDGET 2012-13
2013-14 PLAN
2014-15 PLAN
ELB School Related Earmarked,Demand Determined,Ring FencedYear on Year Change% of overall resource budget
This comprises a large number of budgets, of which the main ones are:
225.8 254.2
12.6%13.3%
249.5
-1.8%
13.1%
260.5
4.4%13.4%
Classroom 2000/e-Schools Project/ICT School Improvement ProgrammeSpecial EducationSEN - Integrated Capacity BuildingSafeguarding and Behaviour SupportPre-school InitiativeEntitlement FrameworkArea Learning CommunitiesPPP Unitary & Related PaymentsProfessional Development of Teachers Meals - Nutritional StandardsFree School Meals EntitlementCurriculum Development Extended SchoolsELBs IT Systems Schools Transitional Costs Equipment for New Build/ProcurementSchool Transport - Safety Measures/Systems Job Evaluation - Classroom & Nursery AssistantsBoarding and Clothing AllowancesSchool Development FundAdditional Maintenance Severance/Transformation FundContingencyProvision for Special SchoolsOther
40.21.26.04.511.514.111.30.033.33.63.44.02.210.34.42.56.03.24.03.31.55.049.90.00.00.4
36.41.36.24.511.615.79.60.537.92.13.55.12.011.84.72.46.03.91.24.20.327.445.44.26.00.4
38.51.26.43.511.916.35.20.542.82.23.65.22.012.04.82.54.04.21.34.30.317.450.62.76.00.4
39.11.36.53.512.116.70.00.544.92.33.75.32.012.35.02.54.03.61.44.40.317.461.34.26.00.4
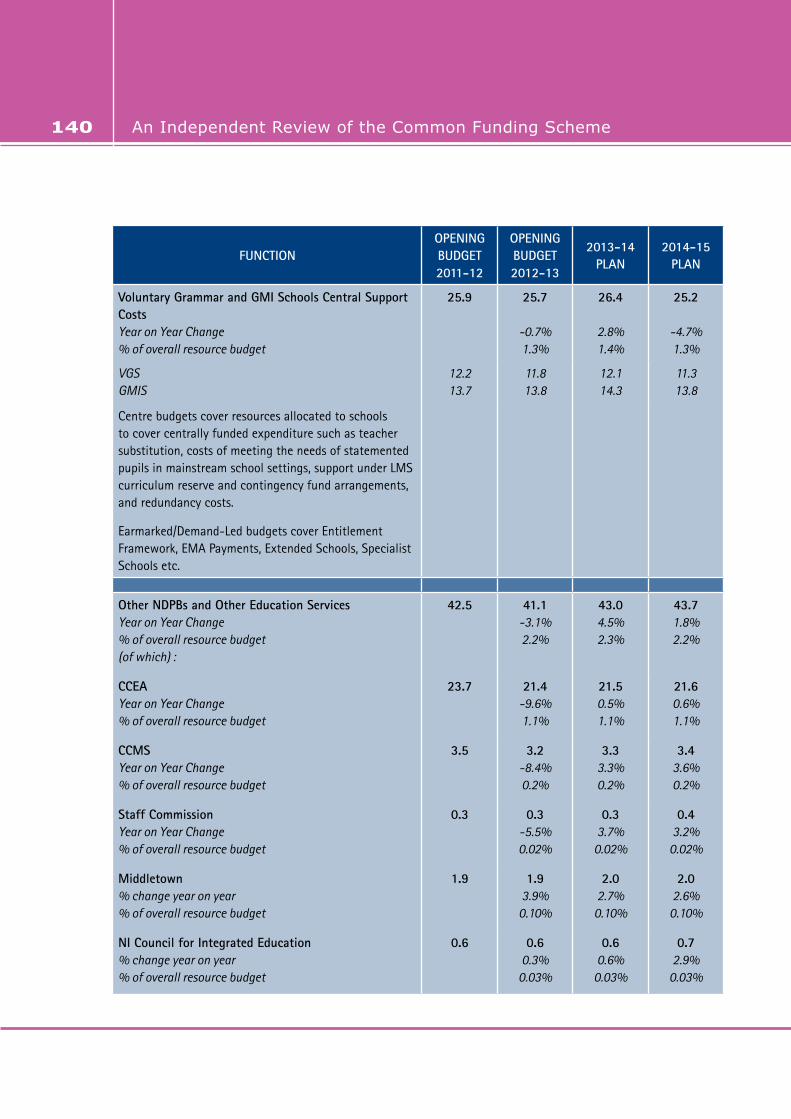
An Independent Review of the Common Funding Scheme140
FUNCTIONOPENING BUDGET 2011-12
OPENING BUDGET 2012-13
2013-14 PLAN
2014-15 PLAN
Voluntary Grammar and GMI Schools Central Support CostsYear on Year Change% of overall resource budget
25.9 25.7
-0.7%1.3%
26.4
2.8%1.4%
25.2
-4.7%1.3%
VGSGMIS
12.213.7
11.813.8
12.114.3
11.313.8
Centre budgets cover resources allocated to schools to cover centrally funded expenditure such as teacher substitution, costs of meeting the needs of statemented pupils in mainstream school settings, support under LMS curriculum reserve and contingency fund arrangements, and redundancy costs.
Earmarked/Demand-Led budgets cover Entitlement Framework, EMA Payments, Extended Schools, Specialist Schools etc.
Other NDPBs and Other Education Services Year on Year Change% of overall resource budget(of which) :
42.5 41.1-3.1%2.2%
43.04.5%2.3%
43.71.8%2.2%
CCEAYear on Year Change% of overall resource budget
23.7 21.4-9.6%1.1%
21.50.5%1.1%
21.60.6%1.1%
CCMSYear on Year Change% of overall resource budget
3.5 3.2-8.4%0.2%
3.33.3%0.2%
3.43.6%0.2%
Staff CommissionYear on Year Change% of overall resource budget
0.3 0.3-5.5%0.02%
0.33.7%
0.02%
0.43.2%
0.02%
Middletown% change year on year% of overall resource budget
1.9 1.93.9%
0.10%
2.02.7%
0.10%
2.02.6%
0.10%
NI Council for Integrated Education% change year on year% of overall resource budget
0.6 0.60.3%
0.03%
0.60.6%
0.03%
0.72.9%
0.03%

An Independent Review of the Common Funding Scheme An Independent Review of the Common Funding Scheme 141
FUNCTIONOPENING BUDGET 2011-12
OPENING BUDGET 2012-13
2013-14 PLAN
2014-15 PLAN
CnaG% change year on year% of overall resource budget
0.6 0.60.5%
0.03%
0.72.8%
0.04%
0.72.7%
0.04%
GTCNI% change year on year% of overall resource budget
0.1 0.128.0%0.01%
0.13.1%
0.01%
0.12.0%
0.01%
Other Education Budgets% change year on year% of overall resource budget(of which):-Special EducationTeacher-related ActivitiesYoung Enterprise NI & Business/Education LinksPupil Support & CounsellingEducational Research and PublicityAccess NIOtherSports InitiativeRPA Institutions
11.7
0.40.31.63.80.50.23.41.50.0
12.910.0%0.7%
0.90.31.63.90.50.23.21.50.7
14.412.0%0.8%
0.40.31.64.00.50.22.91.52.9
14.82.8%0.8%
0.40.31.64.10.50.33.11.52.9
Early Years Provision Year on Year Change% of overall resource budgetThis covers the costs of budgets transferred to DE from DHSSPS in recent years
28.9 28.9-0.2%1.5%
30.35.0%1.6%
31.43.5%1.6%
Funding through the Health Boards (incl Sure Start)Funding through Voluntary Bodies
25.23.7
25.13.8
26.43.9
27.44.0

An Independent Review of the Common Funding Scheme142
FUNCTIONOPENING BUDGET 2011-12
OPENING BUDGET 2012-13
2013-14 PLAN
2014-15 PLAN
Youth and Community Relations Year on Year Change% of overall resource budget
28.6 30.87.4%1.6%
32.66.0%1.7%
33.52.6%1.7%
Youth ELBs Youth Youth Council
22.94.8
24.64.6
26.34.8
27.04.9
Community RelationsELBs Community Relations, Equality & Diversity 1.0 1.5 1.6 1.6
Department of Education Year on Year Change% of overall resource budget
This covers the running costs of the department and the biggest single factor is salary costs. The budget also covers general administrative expenditure such as postage, staff travel, stationery etc.
32.1 33.64.5%1.8%
32.4-3.4%1.7%
33.12.0%1.7%
TOTAL RESOURCEYear on Year Change
1,894.90.6%
1,906.4-0.2%
1,903.02.5%
1,949.8
TOTAL CAPITALYear on Year Change
114.7 101.9-11.1%
106.04.0%
182.271.9%

An Independent Review of the Common Funding Scheme