an indoor environmental quality assessment: the study of
TRANSCRIPT
Portland State University Portland State University
PDXScholar PDXScholar
University Honors Theses University Honors College
5-25-2018
An Indoor Environmental Quality Assessment: the An Indoor Environmental Quality Assessment: the
Study of Naturally Ventilated University Classrooms Study of Naturally Ventilated University Classrooms
within a Mixed-Mode Ventilated Building within a Mixed-Mode Ventilated Building
Kyhetica M. Lattin Portland State University
Follow this and additional works at: https://pdxscholar.library.pdx.edu/honorstheses
Let us know how access to this document benefits you.
Recommended Citation Recommended Citation Lattin, Kyhetica M., "An Indoor Environmental Quality Assessment: the Study of Naturally Ventilated University Classrooms within a Mixed-Mode Ventilated Building" (2018). University Honors Theses. Paper 583. https://doi.org/10.15760/honors.592
This Thesis is brought to you for free and open access. It has been accepted for inclusion in University Honors Theses by an authorized administrator of PDXScholar. Please contact us if we can make this document more accessible: [email protected].

AN INDOOR ENVIRONMENTAL QUALITY ASSESMENT:
The Study of Naturally Ventilated University Classrooms Within a
Mixed-Mode Ventilated Building
by
Kyhetica Lattin
An undergraduate honors thesis submitted in partial fulfillment of the requirements for the
degree of
Bachelor of Science
in
University Honors
and
Architecture
Thesis Advisor
Corey Griffin
Portland State University
2018

AN INDOOR ENVIRONMENTAL QUALITY ASSESMENT LATTIN | 1
TABLE OF CONTENTS
Table of Contents …………………………………………………………………….………….. 1
Abstract ……………………………………………………………………………….…………. 2
Defining Key Terms …………………………………………………………………………..… 3
1.0 INTRODUCTION …………………….…...………………...……….…………….…....… 5
1.1 Literature Review …………………...………………………………....……...…….. 7
1.2. The KMC Building Design and Systems……………………....………………....... 11
1.3 Purpose of Study …....………….………………….……………………………….. 12
2.0 RESEARCH DESIGN AND METHODS ……….………...…………...………………... 14
2.1 Participants ……………...…………………………………………..……………… 14
2.2 Materials …….…………...………………………………………………………… 14
2.3 Design ……………………………………………………………………………… 15
2.4 Procedures ……………...……....……...…………………………………………… 16
2.5 Limitations ………………...…………………………………………………..…… 18
3.0 DATA RESULTS AND ANALYSIS …………………………………….………….…… 19
3.1 Perception Data Analysis ………...………...…....………………….……………… 20
3.2 Answering Research Question 1 …………...…....………………….……………… 27
3.3 Answering Research Question 2 ………....………………...……….……………… 30
3.4 Answering the Hypothesis ………..………………………………...……………… 31
4.0 CONCLUSIONS ………………………………………….…...……..…………………… 33
SOURCE LIST ……………….……………………………….…...……..…………………… 35
APPENDIX A-C …………….…………….………………….…....……..…………………… 36

AN INDOOR ENVIRONMENTAL QUALITY ASSESMENT LATTIN | 2
AN INDOOR ENVIRONMENTAL QUALITY ASSESMENT:
The Study of Naturally Ventilated University Classrooms Within a
Mixed-Mode Ventilated Building
Abstract: Housing classrooms and office space for a school of business, the recently renovated
and expanded the Karl Miller Center at Portland State University utilizes mixed-mode
ventilation, a combination of natural and mechanical ventilation. The mixed-mode ventilation
system present within the Karl Miller center is classified as a zoned system, where mechanical
and natural ventilation are working in some parts of the building individually and in combination
in other parts. In the newly constructed north wing, an HVAC system has been omitted and
natural ventilation system employed through the use of: operable windows, ceiling fans, interior
below-sill heaters, and exhaust vents. The purpose of this study is to examine and evaluate the
ability of the classrooms within this zone to provide thermal comfort. Data for this indoor
environmental quality (IEQ) study includes post occupancy surveys and interior air temperature,
humidity, and CO₂ data collected between October and December of 2017.
Keywords: Indoor environmental quality, Comfort, Passive design, Mixed-mode ventilation,
Natural nentilation, Passive cooling, Post-occupancy survey, Higher education, Portland State
University, Karl Miller Center
AN INDOOR ENVIRONMENTAL QUALITY ASSESMENT LATTIN | 3
DEFINING KEY TERMS
Climate Data: hourly, site-specific values of representative meteorological data, such as
temperature, wind speed, solar rotation, and relative humidity. 1
Clo: a unit used to express the thermal insulation provided by garments and clothing ensembles,
where 1 clo = 0.155 m² ∙ ℃/W (0.88ft² ∙ h ∙ ℉/Btu). ¹
Descriptions for associated clo levels used in perception surveys were created using the Center
for the Built Environment's Thermal Comfort Tool: shorts and short sleeves shirt (0.36 clo),
pants/long skirt and short sleeve shirt (0.57 clo), pants/long skirt and long sleeve shirt (0.61 clo),
pants and long-sleeve sweatshirt (0.74 clo), pants and long sleeve shirt and jacket (0.96 clo),
typical indoor winter clothing (1.0 clo). 2
Comfort Condition: environmental condition in a space such that the majority of the occupants
should, on a statistical basis, be comfortable. 3
Comfort Zone: those combinations of air temperature, mean radiant temperature, and humidity
that are predicted to be an acceptable thermal environment at particular values of air speed,
metabolic rate, and clothing insulation. ¹
Cross Ventilation: (1) natural ventilation in which the airflow mainly results from wind pressure
effects on the building facades and where stack effects in the building are of less importance. (2)
type of ventilating with air supply and exhaust points at opposite sides of ventilated space. ²
Environment, acceptable thermal: a thermal environment that a substantial majority (more than
80%) of the occupants find thermally acceptable. ¹
HVAC (Heating, Ventilation, and Air Conditioning) System: the equipment, distribution
systems, and terminals that provide, either collectively or individually, the processes of heating,
ventilating, or air conditioning to a building or portion of a building. ²
Metabolic Rate (met): the rate of transformation of chemical energy into heat and mechanical
work by metabolic activities of an individual, per unit of skin surface area (expressed in units of
met) equal to 58.2 W/m² (18.4 Btu/h ∙ ft²), which is the energy produced per unit skin surface
area of an average person seated at rest. ¹
Mechanical Ventilation: (1) the active process of supplying or removing air to or from an indoor
space by powered equipment such as motor-driven fans and blowers but not by devices such as
wind-driven turbine ventilators and mechanically operated windows. (2) ventilation provided by
mechanically powered equipment, such as motor-driven fans and blowers, but not by devices
such as wind-driven turbine ventilators and mechanically operated windows. ²
1 See ASHRAE, Thermal Environmental Conditions for Human Occupancy (2013) pg. 3-4. 2 See drop down menu titled, Clothing Level (clo), in Hoyt, Tyler et al.’s, CBE’s Thermal Comfort Tool, (2017). 3 See ASHRAE, TERMINOLOGY.

AN INDOOR ENVIRONMENTAL QUALITY ASSESMENT LATTIN | 4
Mixed-Mode Ventilation: a combination of natural ventilation from operable windows (either
manually or automatically controlled), and mechanical systems that include air distribution
equipment and refrigeration equipment for cooling. 1
Natural Ventilation: movement of air into and out of a space primarily through intentionally
provided openings (such as windows and doors), through non-powered ventilators, or by
infiltration.2
Perception Based Comfort Data: the attitudes, understanding, and feelings of an occupant
associated with the five senses, used to expressed one’s level of comfort.
Performance Based Comfort Data: collecting, analyzing, and reviewing data through the use of
technology, to identify gaps in how a system, building, or technology works to establish areas of
improvement
Stack Effect: (1) movement of air into and out of buildings, chimneys, flue gas stacks, or other
containers and is driven by buoyancy. Buoyancy occurs due to a difference in indoor to outdoor
air density resulting from temperature and moisture differences. The result is either a positive or
negative buoyancy force. The greater the thermal difference and the height of the structure, the
greater the buoyancy force, and thus the stack effect. The stack effect is also referred to as the
chimney effect, and it helps drive natural ventilation and infiltration. (2) movement of air or other
gas in a vertical enclosure (e.g., duct, chimney, building), induced by the density difference
between the air or other gas in the enclosure and the ambient atmosphere. Note: stack effect is a
significant concern in heating-system design for tall buildings in cold climates. Sometimes
referred to as chimney effect. (3) pressure difference caused by the difference in density between
indoor and outdoor air due to an indoor/outdoor temperature difference. (4) the vertical airflow
within buildings caused by temperature differences between the building's interior and exterior. ⁴
Thermal Comfort: that condition of mind which expresses satisfaction with the thermal
environment and is assessed by subjective evaluation. 3
Thermal Sensation: a conscious subjective expression of an occupant’s thermal perception of
the environment, commonly expressed using the categories “cold”, “cool”, “slightly cool”,
“neutral”, “slightly warm”, “warm”, and “hot”. ⁵
Ventilation: (1) the process of supplying air to or removing air from a space for the purpose of
controlling air contaminant levels, humidity, or temperature within the space. (2) the process of
supplying or removing air by natural or mechanical means to or from any space. Such air is not
required to have been conditioned. ⁴
1See the section titled, Introduction, in Brager, Gail and Baker, Lindsay’s, “Occupant satisfaction in mixed-mode
buildings,” (2008). 2 See ASHRAE, TERMINOLOGY. 3 See ASHRAE, Thermal Environmental Conditions for Human Occupancy (2013) pg. 3-4
AN INDOOR ENVIRONMENTAL QUALITY ASSESMENT LATTIN | 5
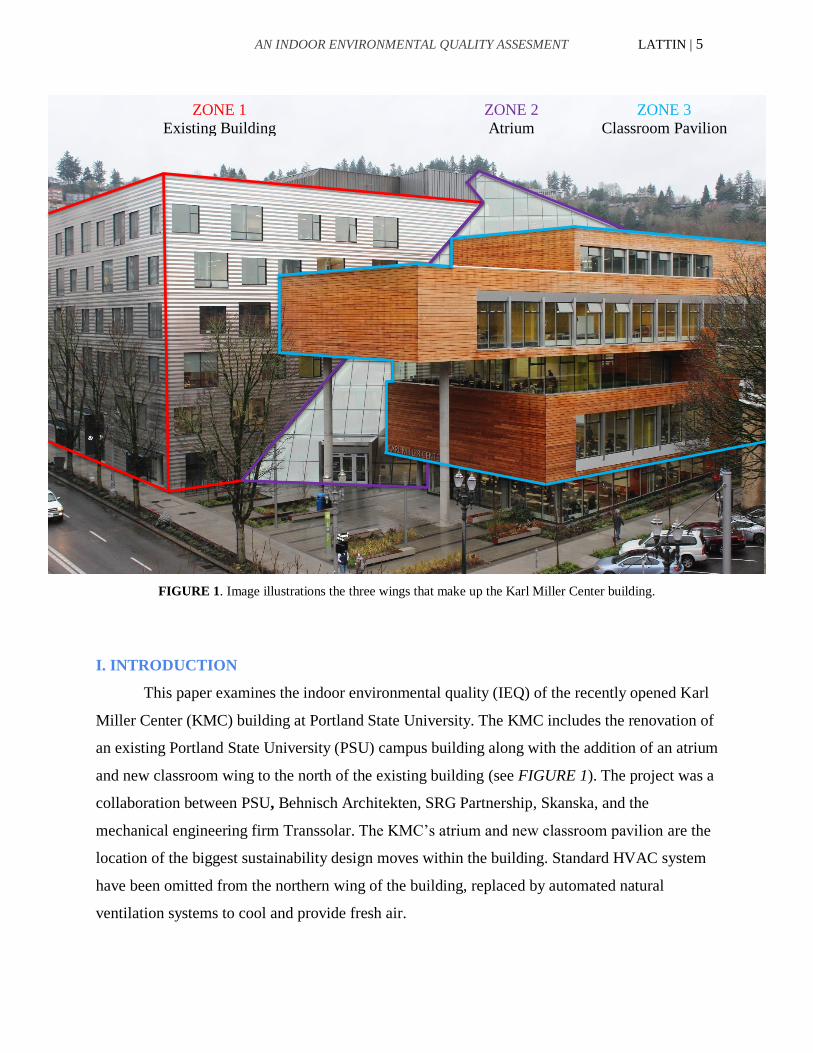
FIGURE 1. Image illustrations the three wings that make up the Karl Miller Center building.
I. INTRODUCTION
This paper examines the indoor environmental quality (IEQ) of the recently opened Karl
Miller Center (KMC) building at Portland State University. The KMC includes the renovation of
an existing Portland State University (PSU) campus building along with the addition of an atrium
and new classroom wing to the north of the existing building (see FIGURE 1). The project was a
collaboration between PSU, Behnisch Architekten, SRG Partnership, Skanska, and the
mechanical engineering firm Transsolar. The KMC’s atrium and new classroom pavilion are the
location of the biggest sustainability design moves within the building. Standard HVAC system
have been omitted from the northern wing of the building, replaced by automated natural
ventilation systems to cool and provide fresh air.
ZONE 1
Existing Building
ZONE 2
Atrium
ZONE 3
Classroom Pavilion

AN INDOOR ENVIRONMENTAL QUALITY ASSESMENT LATTIN | 6
Mixed-mode ventilation (MMV) utilizes the climate, orientation, and location of a
building to optimize the use of heat naturally given off by the sun, decrease necessary cooling
loads, and harnesses natural air movement through a space. This reduces the need for and energy
consumption of conventional HVAC systems. MMV is, “a combination of natural ventilation
(NV) from operable windows (either manually or automatically controlled), and mechanical
systems that provide air distribution and some form of cooling.” 1 The whole of the Karl Miller
Center acts as a zoned mixed-mode building because the southern renovated half, utilizes the
existing HVAC system whereas the newly constructed north wing utilizes operable windows and
vents, ceiling fans, perimeter heaters, and the stack effect to ventilate and cool spaces.
As buildings account for more than 40% of all energy consumed within the U.S.2, it's
crucial that all building typologies make strides towards lowering energy demand. Although,
HVAC systems are the standard method used to cool, heat, and pull clean fresh air into buildings
in the U.S., other systems that have the ability of being more efficient in areas of energy usage,
thermal comfort for occupants, and indoor environmental quality. Methods of improving the
efficiency of one of the least efficient systems of the buildings, “cooling and mechanical
ventilation account for over 30% of total energy use, approximately 20% of electricity use, and
approximately 40% of peak demand,” 3 can be seen through the, “simulations using EnergyPlus
[which] demonstrated that energy savings associated with various forms of mixed-mode
operation ranged from 13% (medium-sized office building with a VAV 4 system in Miami) to
29% (small office building with a CAV 5 system in Atlanta) to 79% (similar building in Los
Angeles).” 6 As these statistics have been derived from simulations, they lack the perceptions of
occupant comfort. Thus, a combination of perception (qualitative) and performance-based
(quantitative) comfort data found in this paper aims to explore the advantages and disadvantages
of the natural ventilation zone with a mixed-mode system provides.
1 See the section titled, Introduction, in Brager, Gail and Baker, Lindsay’s, “Occupant satisfaction in mixed-mode
buildings,” (2008). 2 See U.S. Energy Information Administration (2017) 3 See the section titled “1.2 Justification” in Brager, Gail et al. “Summary Report: Control Strategies for Mixed-
Mode Buildings” (2007). 4 The EPA defines VAV (Variable Air Volume) System by, “variation in the thermal requirements of a space are
satisfied by varying the volume of air that is delivered to the space at a constant temperature.” (2017). 5 The EPA defines CAV (Constant Air Volume) Systems by, “variations in the thermal requirements of a space are
satisfied by varying the temperature of a constant volume of air delivered to the space.” (2017). 6 See the section titled,1.4 Benefits of Mixed-Mode, in Brager Gail et al, “Summary Report: Control Strategies for
Mixed-Mode Buildings,” (2007).

AN INDOOR ENVIRONMENTAL QUALITY ASSESMENT LATTIN | 7
1.1 LITERATURE REVIEW
Due to the complex nature of KMC, this paper reviews multiple topics with respect to
ventilation, cooling and occupant comfort, including: mixed-mode ventilation, natural
ventilation, HVAC systems, human thermal comfort, and research focused on combining
performance and perception-based data. While the KMC as a whole is an example of a zoned
MMV system, the new classroom pavilion (north wing), the focus of the research documented in
this paper, is solely a naturally ventilated system equipped with operable windows and fans. The
body of literature on these topics is extensive in: definitions, detailed methods of design, and
only recently consists of research on the performance of combined natural and mechanical
ventilation..
The reason the literature is relatively new, and this type of ventilation technique is not
more widespread in the U.S., is likely due to several factors. First, because of the standard and
integrated practice of HVAC systems especially of the scale of buildings currently being built in
our larger cities. There are not enough examples of MMV buildings that can meet U.S. fire
codes, therefore the incentive to employ and explore these design techniques has not caught on
whilst HVAC systems continue to be successful. Due to these fire code standards it is hard to
employ certain natural and MMV methods in the U.S., whereas in other countries such Europe,
New Zealand, and Australia they have the ability to utilize and explore mixed-mode systems on a
greater scale. Consequently, in the U.S. we see a lack of MMV dominated buildings, and instead
more HVAC dominated buildings with the ability to supplement with natural ventilation, yet not
depend on it. Another factor is due to the issue that both MMV and natural ventilation, “may not
be suitable for all situations, perhaps least so far climates with very high humidity, or sites with
excessive levels of outside noise or pollution,” 1 whereas HVAC systems are nearly universal.
Most of the existing literature on mixed-mode ventilation is directed towards the owner-
builders and those interested in finding sustainable ways to retrofit a building in certain climate
and areas free of air pollutants. An abundance of information on MMV can be found online, with
a focus on differentiating types of MMV, identifying where they work best, and providing
advantages and disadvantages. Online you can look at articles regarding MMV and natural
ventilation from sites such as Whole Building Design Guide’s “Natural Ventilation” (2016) or
Better Buildings Partnership “Natural Ventilation and Mixed Mode Systems” (2015).
1 See the section titled, What is a Mixed-Mode Building?, in Brager Gail’s, “Mixed-Mode Cooling” (2006).

AN INDOOR ENVIRONMENTAL QUALITY ASSESMENT LATTIN | 8
The literature related to mixed-mode ventilation also acts to provide standards for design
and construction of spaces that prove a certain level of indoor environmental quality (IEQ) and
occupant comfort like ANSI/ASHRAE’s Standard 55-2013 “Thermal Environmental Conditions
for Human occupancy” (2013). These standards provide definitions to important related
terminology and clearly differentiate how the parts of MMV work together in standards of
HVAC and natural ventilation design. However, this standard does not actually reference or
relate to mixed-mode ventilation but instead natural ventilation, therefore it acts as a guideline
that alongside HVAC standards, MMV can try end up somewhere in between. The literature
presents the possibility of MMV design to those looking for sustainable and efficient ways of
conditioning buildings. The academic literature is geared towards design, engineering, and
construction professionals by providing standards, definitions, and design guidelines to
demonstrate the efficiency of MMV and natural ventilation.
Strong arguments in favor of mixed-mode ventilation are found in scholarly journals over
the use of just natural ventilation or just conventional HVAC systems. One example of an online
database of MMV literature, is The University of Berkeley's “Center for the Built Environment”
(2013). This database of papers and studies, contextualizes mixed-mode ventilation alongside
related indoor environmental quality (IEQ) characteristics. The CBR also, provides sources for
more information on MMV the related topics, and provides tools for testing IEQ.
The CBE is a culmination of research done by the students and professors at the
University of California Berkeley who are interested in understanding and exploring the
possibilities of building systems. In the research published through the CBE, there is a plethora
of information related to MMV. Several articles address how the advantages outweigh the
disadvantages of MMVs. Although MMV has the potential to be less user friendly than the
conventional HVAC systems, potentially resulting in higher energy consumptions and costs,
there is a greater chance the system will achieve the following:
1. reduce energy consumption, have higher associated occupant satisfaction because
of improved thermal comfort, health and productivity; 1
2. “fewer sick building syndrome symptoms”;2 and
3. create “highly ‘tuneable’ buildings”.1
1 See the section titled, Benefits of Mixed-Mode?, in Brager, Gail et al. “Summary Report: Control Strategies for
Mixed-Mode Buildings.” (October 2007). 2 See Brager, Gail’s, “Mixed-Mode Cooling,” (2006).

AN INDOOR ENVIRONMENTAL QUALITY ASSESMENT LATTIN | 9
Although, the benefits may outweigh the disadvantages, the research presents reasons
why there are so few MMV buildings in the US including: the convenience and conventionality
of HVAC systems, the lack of knowledge and case studies regarding MMVs successes, a lack of
knowledge regarding automatic and manual controls that are necessary for MMV which in turn
affects the confidence that a building will meet energy codes, and finally fire and safety codes in
the U.S. that inhibit our exploration of this type of design. 2 Their research clearly differentiates
three typologies of MMV that can be used in a building to optimize occupant comfort based on
design factors, the KMC falling into the zoned-system, where different spaces are being
conditioned differently at the same time of day. 3
As stated above, to successfully contextualize this research not only is it necessary to
review the literature on mixed-mode ventilation but also on the elements that make up that
system, that's where a review of literature on natural ventilation becomes crucial.. One example
of case-study based research, is David Ogoli’s paper titled “Thermal Comfort in a Naturally-
Ventilated Educational Building” which provides two separate case studies in separate locations,
further identifying the advantages of natural ventilation.
Ogoli reviews the adaptive model and why operable systems are suited for the occupant’s
comfort and not the ease of the system, He states:
“The adaptive model allows people to make adjustments to their clothing, activity,
posture, eating and drinking, shifting position in a room, operating a window or shading
device, or other adaptive opportunities in order to achieve or maintain thermal comfort. It
appears that when people are allowed greater adjustment and control over their own
indoor environment, it extends the comfort zone. The adaptive model acknowledges the
occupant is not just a passive recipient of the environment but an active member.” 4
This extension of the comfort zone known as the adaptive model is further explained as,
“recent ASHRAE-sponsored research conducted by co-author Dr. Gail Brager demonstrated that
occupants of naturally ventilated buildings are comfortable over a much wider range of
temperatures compared to occupants of air-conditioned building, primary because the higher
1 See the section titled, Potential Benefits, in Brager, Gail et al. “Mixed-Mode Ventilation: HVAC meets Mother
Nature.” (2000). 2See the section titled, Barriers to the Approach, in Brager, Gail et al. “Mixed-Mode Ventilation: Hvac meets
Mother Nature.” (2000). 3 See the section titled, What is Mixed-Mode?, in Brager, Gail et al. “Summary Report: Control Strategies for
Mixed-Mode Buildings.” (2007). 4 See Ogoli, David. “Thermal Comfort in a Naturally-Ventilated Educational Building.” page 21, section 1.3.
“Adaptive ‘errors’ in thermal comfort.”

AN INDOOR ENVIRONMENTAL QUALITY ASSESMENT LATTIN | 10
degree of personal control shifts their expectations and preferences.” 1 The importance of
occupant perception of thermal and overall comfort within the buildings, provides more
justification for other avenues of cooling and ventilation buildings, and away from the heavy use
of inefficient HVAC systems employed today. This idea is further developed again by Gail
Brager, and with the help of and Lindsey Baker, as they contextualize the importance of
occupant comfort:
“Without question, it is absolutely crucial to reduce energy consumption in buildings,
and help avoid the potentially devastating impacts of climate change. But in terms of the
building owners’ pocketbook, energy costs are still relatively small compared to worker
salaries, which represent over 90% of the total operating costs of a commercial building.
In addition, the cost of worker recruitment and retention is significant. From the building
or company owner’s point of view, perhaps the most persuasive argument for sustainable
design in general --- and operable windows in particular --- is one that makes the
connection between a higher quality indoor environment, and increased comfort, health
and productivity of the workers. If we can demonstrate that occupant satisfaction is
higher in buildings with operable windows, a powerful part argument builds in support of
avoiding or minimizing the use of air-conditioning.” 2
Further exploration in the possibilities, successes, and failures of natural and mixed-mode
ventilation is in the collection of twenty-one case studies on mixed-mode buildings the
University of California, Berkeley’s Center for the Built Environment’s report titled “Summary
Report: Control Strategies for Mixed-Mode Buildings” (October 2017). This helps to compare,
and contrast issues seen across the board in mixed-mode buildings to help improve and identify
the best practices, such as a lack of knowledge regarding both the automatic and manual controls
necessary for successful MMV design. This helps create an easier avenue for future designers
and developers to employ MMV systems as is done in this report.
Another related topic within the literature, is using simulations to compare and contrast
either natural ventilation and MMV, the effects of various facade designs on thermal data, and
those manual and automatic controls discussed above, to identify the effects and relationships to
improved occupant thermal comfort. In the academic literature there are numerous examples of
reports and research using these types of simulations: Wright and Levermor’s “Natural
1 See Brager, Gail et al.’s, “Mixed-Mode Ventilation: HVAC meets mother nature,” (2000). 2 See the section titled, introduction, in Brager, Gail and Baker, Lindsay’s, “Occupant satisfaction in mixed-mode
buildings.” (2008).

AN INDOOR ENVIRONMENTAL QUALITY ASSESMENT LATTIN | 11
Ventilation or Mixed Mode? An investigation using Simulation”, Hu and Karava’s “Model
predictive control strategies for buildings with mixed-mode cooling” (2013), Spindler and
Norford’s “Naturally ventilated and mixed-mode buildings --- Part I: Thermal modeling” (2008).
Each one of these studies pushes beyond the definitions and literature reviews that other
academic literature, to provide simulated data in defense of MMVs.
1.2 THE KMC BUILDING DESIGN AND SYSTEMS
The three separate but integrated parts that make up the Karl Miller Center (KMC)
building qualify as mixed-mode ventilation design, because of the criteria discussed above. The
KMC building’s mixed-mode system can be categorized as a zoned-system. This categorization
holds through three entities that make up the whole, each differentiated in the strategy of which
they condition their spaces.1
First, the existing and renovated southern wing of the building, identifiable by its paneled
metal enclosure system, utilizes a combination of natural ventilation with the use of operable
windows, and it is equipped with an existing but updated HVAC system. The second zone within
the KMC, is the central atrium which has an array of functions: central circulation, gathering and
study space, and acts as a full building height lightwell, is the bridge between both the existing
building and the new classroom pavilion. The atrium links the north and south classroom wings
cooling and ventilation systems together at the highest point, through an exhaust vent drop down
from the ceiling. Air that is pulled through the northern classrooms vents into the atrium through
a variation of natural ventilation known as the stack effect. The third zone is the new north
classroom wing is what makes the KMC building break away from the conventional standard of
HVAC dependency in buildings, by being supplemented with a natural ventilation system.
Where other buildings on Portland State University’s campus utilize natural ventilation but
depend on HVAC systems, the KMC provides the opportunity to study at least one set of
classrooms with only natural ventilation.
The stack effect process previously mentioned, is the driving mechanism behind the
larger ventilation process occurring concurrently in the new classroom pavilion and the atrium.
For the purpose of this study a combination of definitions explain the stack effect, “stack effect
1 See the section titled, What is Mixed-Mode?, in Brager Gail’s, “Mixed-Mode Cooling,” (2006).

AN INDOOR ENVIRONMENTAL QUALITY ASSESMENT LATTIN | 12
takes place in buildings due to buoyancy of heated air moving upward” 1 and “the vertical
airflow within buildings caused by temperature differences between the building's interior and
exterior.” 2 The stack effect occurs in the KMC as fresh cool air from outside enters into the
classrooms from exterior windows, to cool occupants in the classrooms. This process is
augmented by operable ceiling fans located within each classroom. The warm, less dense, more
buoyant air is vented and recycled up and out of the exhaust vents located near the interior walls
of the classrooms into the atrium. This exhausted air moves up through the atrium to the final set
of vents. This processed air is vented out of the atrium, meets up with the air from the southern
wing of the building, and is finally vented out the building through the roof.
1.3 PURPOSE OF STUDY
To summarize, mixed-mode ventilation is used within KMC through a use of small
operable ceiling fans found within each classroom (see FIGURE 4), operable windows (see
FIGURE 2 and FIGURE 3), soffit and duct work that pulls air in from the classroom and pulls it
out into the atrium (see FIGURE 5), an open floor plan outside of the classrooms, the exposed
concrete floor works as a thermal battery, operable ground floor east facing glass walls,
dampeners and vents over east entrance, vented and radiantly heated concrete stairs on ground
floor of atrium, and finally a mechanical system in the older building is connected to the atrium
of the new addition which acts to pull air up and out of the building. The passive ventilation
system present in the new classroom wing, and the implications of low energy cooling and
ventilation design for higher education buildings is the focus of this research project. Efficient
buildings need equally efficient building systems and occupant thermal comfort, because when
one is neglected, it affects the overall energy efficiency of the building. When a building solely
focuses on occupant comfort with little regard to system efficiency and sustainability, you have a
design that contributes to excessive energy consumption. In the case of a systems focused
building with not the same thought given to occupancy comfort, it leads to occupants taking
control of their own comfort which in turn could be even less efficient than a conventional
HVAC building system.
1 See the section titled, Introduction, in Jung-yeon, Yu et al.’s, “Resolving Stack Effect Problems in a High-Rise
Office Building by Mechanical Pressurization,” (2017). 2 See ASHRAE, TERMINOLOGY.

AN INDOOR ENVIRONMENTAL QUALITY ASSESMENT LATTIN | 13
FIGURE 2. Interior view of opened operable windows FIGURE 3. Exterior view of opened operable windows
FIGURE 4. Interior view of classroom exhaust vents FIGURE 5. View from atrium of classroom exhaust
vents windows
FIGURE 6. Interior view of atrium exhaust vents FIGURE 7. Classroom occupant controls

AN INDOOR ENVIRONMENTAL QUALITY ASSESMENT LATTIN | 14
This led to a need for the two types of data collected and evaluated for this case study: the
perception of comfort by the actual occupants and the performance-based data that may explain
why these occupants are feeling a certain way. This combination of two different types of data
helps to more accurately answer whether or not a higher education building in a climate like
Portland, Oregon can successfully create a series of comfortable spaces through passive natural
ventilation that is proven not just through simulations or data but also is matched by real life
perception comfort data.
Research Question 1: How effective is the Karl Miller Center’s new classroom pavilion’s
natural ventilation dominated system in creating thermally comfortable spaces to occupy?
Research Question 2: What type of picture does a combination of perception and performance-
based comfort data portray, and is that enough to identify if the Karl Miller Center’s addition is
successful in creating comfortable spaces to occupy?
Hypothesis 1: Participant responses will generally correlate a perception of thermal comfort in
the areas above neutral (i.e. slightly warm, warm, and hot).
a) Both the performance and perception above the thermal comfort range will
increase on average in correlation with the higher floors within the building.
b) Both the performance and perception above the thermal comfort range will
increase on average in correlation with classes held in the early afternoon, when
the sun is at its highest point, and in the evenings, when the heat trapped inside
the concrete is released.
c) Both the performance and perception above the thermal comfort range will
decrease in classrooms with multiple elevations of glazing. The thinking behind
this hypothesis is due to: these classrooms having less concrete available to hold
heat, a high glass ratio correlating with increased thermal bridging for the outside
air, and because although there is more opportunity for direct sunlight and
therefore heat through radiation, the classrooms with multiple elevations of
glazing are set back allowing the floor above to act as it's sunshade.

AN INDOOR ENVIRONMENTAL QUALITY ASSESMENT LATTIN | 15
2.0 RESEARCH DESIGN AND METHODS
2.1 PARTICIPANTS
An initial participant email list was created by using the
master class list for the KMC during the Fall 2017 academic term,
and then isolating the classes that would be held in the new
classroom wing. From there, classes were sorted by time, cardinal
location, floor, and number of walls with windows to help create a
hierarchy of classroom variation in relation to participating
professor response. This helped to identifying which classrooms
added more variation to the overall data, and therefore were chosen
above another classroom in instances of willingness to
participate from multiple professors of classes held at the
same time. In total, 863 surveys across eight classrooms
were collected, although due to a building system flush the
first week of the term, only 741 responses are used for
analysis in this paper. The surveys were distributed across
four out of the five floors within the KMC new classroom
pavilion: six were held from 5:30/5:40 pm to 9:00/9:30 pm,
one was held at 10:15-11:15 am, and finally one held from
12:00 pm to 15:50 pm. In the end, the final criteria that
helped to identify the pool of participants was the willing
professors who responded to the initial recruitment email.
Distribution of surveys was completely confidential, and
data was only used when consent was given on survey.
2.2 MATERIALS
Two primary groups of materials were used in this
study: the Kestrel data loggers (see FIGURE 8) that were
located within each classroom and the comfort surveys
distributed to participants. Forty-four loggers were installed
FIGURE 8.
Kestrel Data Logger
FIGURE 9.
Kestrel Data Logger Interface

AN INDOOR ENVIRONMENTAL QUALITY ASSESMENT LATTIN | 16
in a total of eleven classrooms, across the five floors in the new classroom pavilion. Although
only eight classrooms were surveyed, Kestrel data loggers were installed inside three extra
classrooms to obtain at least two sets of performance-based data per floor. Of the four loggers
located within each classroom, two were attached to the ceiling using zip ties and carabiners, and
the remaining two were located underneath tables using tape, accompanied by a courtesy note
asking anyone who came into contact with the loggers to leave them be and explaining in the
research they were being used for. Data loggers were suspended from the ceiling, away from fire
sprinkler pipes and surfaces that could affect the temperatures logged, as well as proximity to
other factors that may have an effect on data (i.e. windows, fans, and occupant’s legs underneath
the tables). Alongside the Kestrel loggers, an iPhone was used to download the Kestrel App,
where the interface (see FIGURE 9) allowed monitoring and collection of air temperature and
relative humidity data.
The materials used to collect the perception based data included: a lab notebook used to
make notes during survey distribution in terms of window position (open or close), fan operation
(on or off), and to keep a record of Kestrel location in correlation with serial number (i.e. floor or
ceiling; north or south) to make downloading of data go more smoothly; eight different surveys
that correlate to the specific classrooms that were surveyed (see APPENDIX C for example
survey); and a master classroom survey distribution list was made for organization, to act as a
calendar and record for how many surveys were needed based on x number of students registered
for a class obtained through PSU’s registration database/
2.3 DESIGN
During this research process, the biggest influencers of the methodology were the
definition of human comfort and the factors that affect one’s perception of thermal comfort. 1 For
the purpose of this research, ASHRAE standard 55-2013’s definition of thermal comfort, “that
condition of mind which expresses satisfaction with the thermal environment and is assessed by
subjective evaluation,” was used to define human comfort. The factors that affect human comfort
are what the same standard defines as comfort zone, “those combinations of air temperature,
mean radiant temperature, and humidity that are predicted to be an acceptable thermal
environment at particular values of air speed, metabolic rate, and clothing insulation.” 2 Since
1 See ASHRAE, Thermal Environmental Conditions for Human Occupancy (2013) pg.’s 3-4; CBE comfort tool. 2 See ASHRAE, Thermal Environmental Conditions for Human Occupancy (2013).

AN INDOOR ENVIRONMENTAL QUALITY ASSESMENT LATTIN | 17
this definition of thermal comfort clearly combines quantitative and qualitative data, that changes
from person to person based on location, sensation, physiology, and state of mind, it was evident
that both performance and perception-based data needed to be collected.
Using these initial definitions, the comfort data aimed to answer thermal insulation levels
(clo) and a subjective evaluation of thermal satisfaction within the occupied classrooms, whereas
the Kestrel data loggers combined with the data provided by building management, intended to
answer the other half: air temperature, CO2 levels, and humidity. Regarding the questions of
metabolic rate and air velocity, some assumptions were made: the metabolic rate for the
participants of the surveys would be a constant variable of 1.2 met, correlating with slightly
above the 1.1 rate associated with typing.1 This assumption was partially due to a presumption
that there would be more of a desire to participation from professors and their students if the
survey was simple, clear and short. Therefore, to keep the surveys short and simple, some
questions were removed. However, the questions omitted from this research provide a gap for
future versions of research on this building to fill: gender, windows open/closed, fans on/off,
preference of new classroom pavilion versus the existing renovated building
The survey questions utilized the ASHRAE 7-point thermal sensation scale/CLO point
scale as a reference. Most of the data was taken right before class when some of the participants
have just done a bit of “exercise” (i.e. walking to class) and haven't had a chance to really
perceive their comfort in the space. This is where having a range of ways the surveys were
distributed and collected, such as with rooms 380 and 190 (surveys were distributed by
professors midway through the allotted class time), could inform the design of future studies.
2.4 PROCEDURES
The performance-based half of the data was collected in two separate ways, to check the
validity and margin of error of each. The primary data was collected by installing four Kestrel
DROP data loggers in two to three classrooms per floor within the KMC’s north classroom wing,
totaling to forty-four loggers installed in eleven classrooms. Four Kestrels were located within
each chosen classroom. Two were located underneath tables to collect data at the occupant level,
and the other two were located directly above at the ceiling height. Again, although surveys were
collected from only eight classrooms, Kestrel data loggers were installed inside three extra
1 See drop down menu titled, Metabolic Rate, in Hoyt, Tyler et al.’s, CBE’s Thermal Comfort Tool, (2017).
AN INDOOR ENVIRONMENTAL QUALITY ASSESMENT LATTIN | 18
classrooms to obtain at least two sets of performance-based data per floor. These extra Kestrels
were located on floors where: only perception-based data was being collected in one classroom,
and therefore provided secondary data on that floor; to get data on rooms with more than one
wall of glazing; or to obtain data on the fifth floor again in regard to the stack effect, although no
perception-based data would be collected in those classrooms.
Once the loggers were installed and batteries were checked, the loggers were only
periodically tested for battery life. Downloading of the data did not occur until the loggers were
removed from the building at the end of the term, which is why the detailed catalogue of logger
number and location (north or south, table or ceiling) was crucial for organization. Although
leaving the download until the end of the term presented the possibility of not obtaining data
from all the loggers, and therefore an incomplete picture, there simply was not enough time to
download the data weekly.
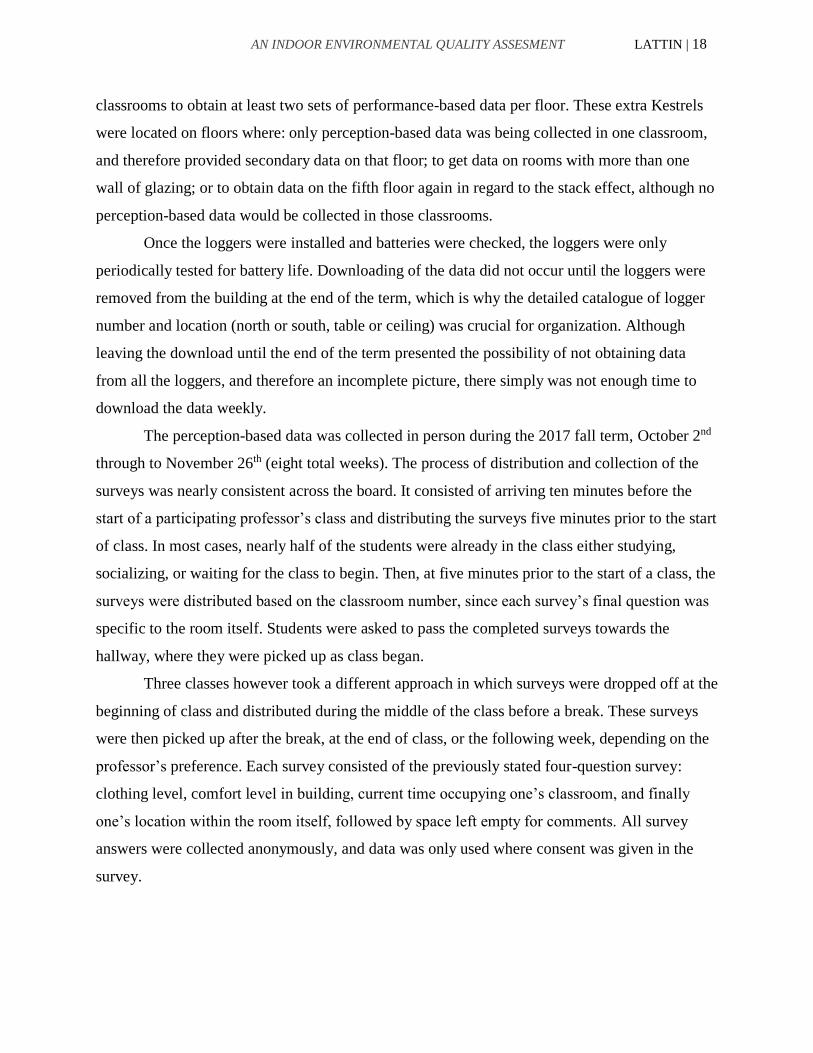
The perception-based data was collected in person during the 2017 fall term, October 2nd
through to November 26th (eight total weeks). The process of distribution and collection of the
surveys was nearly consistent across the board. It consisted of arriving ten minutes before the
start of a participating professor’s class and distributing the surveys five minutes prior to the start
of class. In most cases, nearly half of the students were already in the class either studying,
socializing, or waiting for the class to begin. Then, at five minutes prior to the start of a class, the
surveys were distributed based on the classroom number, since each survey’s final question was
specific to the room itself. Students were asked to pass the completed surveys towards the
hallway, where they were picked up as class began.
Three classes however took a different approach in which surveys were dropped off at the
beginning of class and distributed during the middle of the class before a break. These surveys
were then picked up after the break, at the end of class, or the following week, depending on the
professor’s preference. Each survey consisted of the previously stated four-question survey:
clothing level, comfort level in building, current time occupying one’s classroom, and finally
one’s location within the room itself, followed by space left empty for comments. All survey
answers were collected anonymously, and data was only used where consent was given in the
survey.

AN INDOOR ENVIRONMENTAL QUALITY ASSESMENT LATTIN | 19
2.5 LIMITATIONS
Although some of the limitations have been mentioned above, this section aims to
directly state, list and summarize the limits of this research. The goal is to identify gaps for
future research to fill both on the KMC, other natural ventilated building systems, and other
mixed-mode ventilation buildings. While methods, tools of survey distribution, and data analysis
was discussed with the research advisor, data collection and analysis occurred solely by the
author. Therefore, though observations and methods were informed by the research and
coursework in relation to the related disciplines, there is a lack of professional experience. One
of the more obvious limitations of this study, is the quality and quantity of data that was
collected due to various issues including:
1. only one survey distributor,
2. the small number of professors who responded with a willingness to participate,
3. the perception-based data collected mostly in the evening in part due to the limit
number of professor participation,
4. both types of data were only collected on the new classroom wing and therefore
no comparisons can be made to the existing HVAC system,
5. data was collected right after opening of building and the building systems were
still being flushed and tested, and
6. the presumptions made that the ease and simplicity of the survey would correlate
to more participation.
This data pool could have also benefited from more variance in the data by placing
loggers within the atrium to test air temperature and to locate personally locate carbon dioxide
sensors alongside the Kestrels, although this was provided by building management, two sets had
carbon levels could help check the validity of the data. Secondly, leaving the downloading of
data until the end of the term provided the possibility of not obtaining data from all the loggers,
and therefore an incomplete picture. With more than one survey distributor and researcher, there
is the possibility that more data could be collected and more often. Thirdly, another limitation
and therefore opportunity for a future researcher to improve their own study by developing and
being able to employ a more prescribed distribution technique with the possibility of having
posters (using spannable codes and links to a digital platform) or an electronic survey could be
done, although the electronic version might mean less data.

AN INDOOR ENVIRONMENTAL QUALITY ASSESMENT LATTIN | 20
3.0 DATA RESULTS AND ANALYSIS
Research Question 1: How effective is the Karl Miller Center’s new classroom pavilion’s
natural ventilation dominated system in creating thermally comfortable spaces to occupy?
Research Question 2: What type of picture does a combination of perception and performance-
based comfort data portray, and is that enough to identify if the Karl Miller Center’s addition is
successful in creating comfortable spaces to occupy?
Hypothesis 1: Participant responses will generally correlate a perception of thermal comfort in
the areas above neutral (i.e. slightly warm, warm, and hot).
a) Both the performance and perception above the thermal comfort range will
increase on average in correlation with the higher floors within the building.
b) Both the performance and perception above the thermal comfort range will
increase on average in correlation with classes held in the early afternoon, when
the sun is at its highest point, and in the evenings, when the heat trapped inside
the concrete is released.
c) Both the performance and perception above the thermal comfort range will
decrease in classrooms with multiple elevations of glazing. The thinking behind
this hypothesis is due to: these classrooms having less concrete available to hold
heat, a high glass ratio correlating with increased thermal bridging for the outside
air, and because although there is more opportunity for direct sunlight and
therefore heat through radiation, the classrooms with multiple elevations of
glazing are set back allowing the floor above to act as it's sunshade.
The main goal of this section of the paper is to summarize the perception-based data by
comparing data collected from classrooms 180, 290, 295, 385, and 480 to create a series of
graphs to summarize participants clothing level (clo) and their perception of thermal comfort (7-
point scale; a range from cold-hot) 1. After that initial analysis of solely perception-based data,
this section will act as a comparative analysis of perception-based data alongside performance-
1 See APPENDIX A.

AN INDOOR ENVIRONMENTAL QUALITY ASSESMENT LATTIN | 21
based. The method of assembling the performance-based data consisted of identifying days with
outdoor temperature highs or lows and logging the hourly temperature and humidity data, as well
as viewing at the indoor CO2 data alongside healthy indoor standards set by the ASHRAE
Standard 62.1-2016 (2017); charts for the temperature and CO2 data were also constructed. 1
For this section, CO2 data is looked at during the second half of the data collected
(October 30th – November 22nd). This time period is used because as days were getting colder, an
assumption was made that there would be a decrease in use of the operable windows to cool and
ventilate the spaces. Less fresh air being ventilated into the classrooms coupled with a
concentration of people, correlated to an increase in CO2 levels. Regarding healthy and
comfortable indoor CO2 levels, the ASHRAE Standard 62.1-2016 calculates that, “an activity
level at 1.2 met units (1.0 met = 18.4 Btu/h ∙ ft²), corresponding to a sedentary persons,”
therefore if the “ventilation rate is to be held to 15 cfm (7.5 L/s) per person, the resulting steady-
state CO2 concentration relative to that in the outdoor air is equal to 700 ppm.” After identifying
that outdoor CO2 levels generally range from “300 to 500 ppm,” the standard sets an indoor CO2
maximum concentration of 1000 to 1200 ppm to correlate with indoor air that is perceived as
breathable fresh air and an atmosphere disassociated with headaches or discomfort. 2
3.1 PERCEPTION DATA ANALYSIS
This section focuses exclusively on analysis of the surveys distributed in the 2017 fall
academic term within eight classrooms, across four days of the week, for eight weeks. The pool
of data for examination consists of 37 survey sets consisting of 741 total responses. An initial
isolation of the surveys is done to identify trends within the data, which the section that follow,
uses other forms of data to further explain the trends and recognize additional trends. TABLE 1
presents a summary of the diversity of the data pool in relation to the classes surveyed, in terms
of: classroom number (i.e. floor), times of the classes surveyed, number of walls of glazing, and
the overall percentage of data from each classroom out of the total of surveys collected. Using a
complete catalog of thermal responses relayed in two different formats (see FIGURE 10 and
TABLE 2), some initial conclusions and trends are identified:
1 See, Figures 1-10, in APPENDIX B. 2 See the section titled, Informative Appendix D: RATIONALE FOR MINIMUM PHYSIOLOGICAL
REQUIREMENTS FOR RESPIRATION AIR BASED ON CO2 CONCENTRATION, in the ASHRAE Standard 62.1-
2016. “Ventilation for Acceptable Indoor Air Quality.” ANSI/ASHRAE. 2016, pg. 40.

AN INDOOR ENVIRONMENTAL QUALITY ASSESMENT LATTIN | 22
FIGURE 10.
Floor Plans for the eight classrooms used within study

AN INDOOR ENVIRONMENTAL QUALITY ASSESMENT LATTIN | 23
1. A neutral perception of thermal comfort dominates the overall data. Within the
survey sets a neutral perception is either the leading response or is equal to
slightly warm or slightly cool perceptions within the data, with few exceptions. 1
2. Another overarching trend in the data that cold and hot are never leading answers,
nor is eithers percentage out of the overall data set ever more than 20%
3. For classroom 480, neutral responses are always greater than those above neutral
(i.e. slightly warm + warm + hot responses), with at least an 18% difference.
Classroom 180 has the same relationship between neutral and above natural, with
one exception of data collected on October 23rd: Classroom 285 also has a similar
relationship between those two response groups within the data, with one
exception on October 4th.
4. The trend spreading across classrooms 390, 385, 380, 295, and 290, is that these
classrooms on average were relatively warm, with (1) at least half of each
classroom’s set of data either having the responses of slightly warm, warm, and
hot combined being greater than the neutral responses, and/or (2) the gap between
these above neutral responses (i.e. slightly warm + warm + hot) and neutral, being
less than 10 percent difference. 2
5. Using two sets of classroom comparisons, 385 versus 180 and 295 versus 4803,
two different conclusions are identified within the data regarding stack effect. The
comparison between385 and 180 is in line with hypothesis 1 (a) and concerns
regarding a naturally ventilated building, where the classroom held on a higher
floor with be warmer on average. Whereas when comparing classrooms 295 and
480, although classroom 480 is on a higher floor, a contradiction of the hypothesis
is presented, since room 295 is warmer than 480, although it is located on a lower
floor.
6. The trend found within the data from classroom 285 starts after the second
survey, where the gap between above natural and neutral gets smaller and smaller,
although with the neutral response percentage always dominating.
1 See CHART 2 for exceptions: 385 - 10/2, 285- 10/4, 385 -10/16, 295 – 10/18, and 290 – 11/22. 2 See the red highlights and red superscript 1 in CHART 2. 3 See Classroom 285 for similar data as seen with classroom 480, and therefore acts to support the responses
presented by classroom 480. The reason classroom 285 is not used for primary analysis, is because classroom 285 is
an example of a professor distributed survey and therefore different methods.

AN INDOOR ENVIRONMENTAL QUALITY ASSESMENT LATTIN | 24
Analysis of the other data sets provided by the surveys, such as: clo levels, location, and
comments, provides little correlation related to thermal comfort. Graphics were created, and
initial analysis done, but as seen in APPENDIX A for example, little relationship can be
found between clo levels and thermal comfort, whereas knowledge of gender in correlation
with both perception of thermal comfort and clo level could have been more insightful. When
looking at the comments left by participants on the surveys (see TABLE 3), qualities of
classrooms are presented: warm, comfortable, and/or unformattable in regard to the quality of
the air. However, the issue with the comments is that few were given, and those that were
given seem to have been elicited mostly by discomfort, especially by the operable fans.
Finally, little relationship between location within the classroom and thermal comfort was
found, but instead more relationship between negative comments were found with the
proximity to the operable windows and fans. Therefore, the analysis that follows focuses on
the trends and insightful data found within the actual perception of thermal comfort
responses.
TABLE 1.
Break Down of Overall Classroom Data Pool
CLASSROOM #
(TIME)
NUMBER OF WALLS OF GLAZING
(ORIENTATION)
% OF PARTICIPANTS OUT OF
OVERALL SAMPLE SIZE OF 741
RESPONSES
480 (17:30-19:30) Single Wall (N) 14%
390 (17:40-21:20) Three Walls (N, S, E) 19%
385 (17:40-21:10) Single Wall (N) 9%
380 (12:00-13:50) Single Wall (N) 8%
295 (17:30-21:20) Half Wall (N) 8%
290 (17:30-21:20) Single Wall (N) 18%
285 (10:15-11:20) Single Wall (N) 8%
180 (17:40-21:10) Single Wall (N) 16%

AN INDOOR ENVIRONMENTAL QUALITY ASSESMENT LATTIN | 25
FIGURE 11.
Complete Catalog of all Thermal Comfort Responses on the 7-Point Scale.1
1 Data beak down: cold – 16, cool – 44, s. cool – 112, neutral - 332, s. warm – 205, warm – 84, and hot – 27.

AN INDOOR ENVIRONMENTAL QUALITY ASSESMENT LATTIN | 26
TABLE 2.
A Catalog of Thermal Comfort Response Pie Charts Based on Classroom Number, Including Related Notes.
480 390 385 380 295 290 285 180
10/4
F = ON
n = 21
AN = 29%
N = 48%
AVG = neutral
10/31
n = 31
AN = 42%
N = 48%
AVG = neutral
10/2
n = 24
AN = 46%
N = 29%
AVG = warm
10/61
F = ON
W = OPEN
n = 26
AN = 46%
N = 39%
AVG = neutral
10/111
F = OFF
W = OPEN
n = 17
AN = 29%
N = 29%
AVG = neutral;
s. cool
10/41
n = 36
AN = 33%
N = 36%
AVG = neutral
10/4
n = 15
AN = 67%
N = 13%
AVG = s. warm
10/2
n = 19
AN = 21%
N = 47%
AVG =
neutral
10/11
F = ON
W = CLOSE
n = 14
AN = 7%
N = 36%
AVG = neutral;
cool
10/10
n = 22
AN = 23%
N = 45%
AVG = neutral
10/16
F = ON
W = OPEN
n = 15
AN = 60%
N = 33%
AVG = s. warm
10/201
F = OFF
W = CLOSE
n = 18
AN = 33%
N = 33%
AVG = neutral
10/18
F = ON
W = OPEN
n = 15
AN = 67%
N = 27%
AVG = s. warm
11/1
F = ON
W = OPEN
n = 24
AN = 33%
N = 67%
AVG = neutral
10/11
n = 12
AN = 8%
N = 75%
AVG = neutral
10/16
n = 15
AN = 27%
N = 40%
AVG = neutral
10/18
F = ON
W = OPEN
n = 25
AN = 16%
N = 36%
AVG = neutral
10/171
F = ON
W = CLOSE
n = 21
AN = 43%
N = 38%
AVG = neutral;
s. warm
10/30
F = ON
W = OPEN
n = 12
AN = 17%
N = 42%
AVG = neutral
11/3
F = OFF
W = CLOSE
n = 16
AN = 0%
N = 44%
AVG = neutral
11/1
F = ON
W = OPEN
n = 15
AN = 53%
N = 27%
AVG = s. warm
11/151
n = 36
AN = 50%
N = 44%
AVG = neutral
10/18
F = ON
W = OPEN
n = 9
AN = 11%
N = 56%
AVG = neutral
10/23
n = 25
AN = 52%
N = 32%
AVG = neutral
Note: F – fan, W – window, n – # of participants, AN – % above neutral comfort (i.e. s. warm, warm, hot), N – % of neutral comfort,
AVG – average comfort (leading response(s)), s. warm/s. cool – slightly cool/warm, red highlight - above neutral > neutral.
1 Indicates a difference of less than 10%, between percentage of neutral and above natural thermal comfort responses.

AN INDOOR ENVIRONMENTAL QUALITY ASSESMENT LATTIN | 27
TABLE 2. CONTINUED …
A Catalog of Thermal Comfort Response Pie Charts Based on Classroom Number, Including Related Notes.
480 390 385 380 295 290 285 180
11/1
F = ON
W = OPEN
n = 25
AN = 36%
N = 56%
AVG = neutral
10/311
n =20
AN = 40%
N = 40%
AVG = neutral
11/13
F = OFF
W = CLOSED
n = 18
AN = 50%
N = 33%
AVG = neutral;
s. warm
------
11/151
F = OFF
W = OPEN
n = 14
AN = 43%
N = 50%
AVG = neutral
11/22
n = 35
AN = 66%
N = 31%
AVG = s. warm
11/1
F = ON
W = OPEN
n = 9
AN = 33%
N = 56%
AVG = neutral
10/30
n = 18
AN = 11%
N = 50%
AVG = neutral
11/15
F = ON
W = OPEN
n = 19
AN = 26%
N = 58%
AVG = neutral
11/14
n = 22
AN = 27%
N = 45%
AVG = neutral
------
------
------
------
11/15
F = OFF
W = CLOSED
n = 11
AN = 36%
N = 54%
AVG = neutral
11/13
n = 24
AN = 13%
N = 67%
AVG = neutral
------
11/21
n = 28
AN = 21%
N = 46%
AVG = neutral
------
------
------
------
------
11/20
n = 15
AN = 20%
N = 53%
AVG = neutral
Note: F – fan, W – window, n – # of participants, AN – % above neutral comfort (i.e. s. warm, warm, hot), N – % of neutral comfort,
AVG – average comfort (leading response(s)), s. warm/s. cool – slightly cool/warm, red highlight - above neutral > neutral.
1 Indicates a difference of less than 10%, between percentage of neutral and above natural thermal comfort responses.

AN INDOOR ENVIRONMENTAL QUALITY ASSESMENT LATTIN | 28
TABLE 3.
A Catalog of Relevant Comments Left on Surveys.
480 390 385 290 180
10/18
(1) “Fans
are strong
in this
section.”
clo = .67;
cool
11/1
(1)
“Hot.”
(clo =
.67; hot)
11/15
(1) “I’m
good.”
(clo =
.67;
neutral)
(1)
10/17
(1) “Room 285 is
always hot. Put a
survey there!”
(clo = .74;
neutral)
11/14
(1) “Temperature
is good and I’m
wearing a long
sleeve plus a
windbreaker.” clo
= .74; slightly
warm
10/16
(1) “Comfortable
until the fan is
turned on high
(which happens
every class).”
(clo .67; neutral)
(2) “The fans are
better today, but
on other days
they blew my
papers down and
were very
distracting.” (clo
= .67; slightly
warm)
(3) “Windows
are very noisy
and take a long
time to
open/close.” (clo
= .67; neutral)
11/13
(1) “I usually
feel colder, later
in the evening.”
(clo = .74;
slightly warm)
11/15
(1) “Too hot.”
(clo = .67;
hot)
(2) “I’m
okay.” (clo =
.96; neutral)
(3) “Cannot
breath” (clo =
.74; slightly
warm)
11/22
(1) “This
room is so
inconsistent in
temperature.
It is hard to
evaluate when
it changes
from hour to
hour.” (clo =
.57; warm)
10/23
(1) “When we open the windows.
It’s very noisy.” (clo = .74; neutral)
“Room feels a tad stuffy, sometimes.
Otherwise o.k.” (clo = .57; cool)
(2) “Windows were opened
manually by prof around 5:25 pm
due to stuffiness and temperature
level (very warm).” (clo = .57;
slightly warm)
(3) “Fans blow papers off my desk.”
(clo = .57; cool)
(4) “The fans are messing the papers
on my desk.” (clo = .67; slightly
warm)
(5) “Fans blow papers on desk.” (clo
= .67; neutral)
(6) “Too windy with fan on. Papers
blow around. Too noisy/street noise
with windows open.” (clo = .57;
warm)
11/13
(1) “We need a clock especially
during exams.” (clo = .57; slightly
cool)
(2) “Seems relatively comfortable
most of the time.” (clo = .57; cool

AN INDOOR ENVIRONMENTAL QUALITY ASSESMENT LATTIN | 29
TABLE 4.
3.2 ANSWERING RESEARCH QUESTION 1
Through analysis of the occupant thermal comfort survey data, the overall conclusion is
that on average the KMC’s new classroom pavilion’s naturally ventilated system provides
thermally comfortable spaces. Synthesis of the perception data included in Appendix A, shows
that out of the thirty-seven surveys included, a feeling of neutral comfort was perceived and
dominated the results in more than half of those surveys, twenty-seven to be exact. Although on
average the classrooms are perceived by occupants as thermally comfortable, the perception of
slightly warm and/or slightly cool are close contenders. The remaining ten surveys not
categorized by a neutral perception of comfort, can be categorized as the following: slightly-
warm dominates seven, one shows a tie between neutral and slightly warm, one with a tie
between neutral and slightly cool, and one with a tie between neutral and cool. 1 Again, although
most of the data sets are dominated by a neutral perception of thermal comfort, in half of those
cases either slightly cool and/or slightly warm was a close contender. Therefore, the perception-
based data of this study exemplifies that the KMC’s new classroom pavilion falls within the
thermal comfort range of slightly warm to slightly cool, dominated by a neutral and slightly
warm perception.
Comparing the exterior climate data, alongside the comfort survey data, identifies and
highlights patterns within the data. One pattern previously discussed, is within classrooms 480
and 295 held at the same time, the data shows a contradiction to hypothesis 1 (a), in correlation
with warm climate data. This phenomenon is visible in both the performance and perception
data, as exterior temperatures
drop (see TABLE 4) during October
11th and November 15th, there is a
closer relationship between the
perceived comfort of occupants
related to a neutral or cooler
perception compared to a warmer
perception for the dates of October
11th and November 15th (see GRAPH
1 See, Figures 1-23, in APPENDIX A. 2 Data taken from weatherunderground.com, where climate data is collected hourly; data relates to the time range
of 4:53pm to 5:53pm.
Date Outdoor Temp. at Time
of Survey Distribution2
October 11th 46.9°F - 48.9°F
October 18th 64.0°F – 63.0°F
November 1st 55.0°F – 53.1°F
November 15th 45.0°F – 43.0°F

AN INDOOR ENVIRONMENTAL QUALITY ASSESMENT LATTIN | 30
1-8). In each set of surveys,
regardless of eternal temperatures, classroom 295 feels warmer to occupants than classroom 480,
though it is on a higher floor. For the second two dates (see CHART 2), interior temperature data
supports the perception felt by the occupants and the reoccurring contradiction of hypothesis 1
(a). However, the survey data collected from classroom 290 (see APPENDIX A), falls closely in
line with the survey data collected from classroom 480. Therefore, classroom 295 classifies as a
classroom with difficulties staying within a neutral thermal comfort zone compared to other
classrooms in the KMC, such as classroom 480, which when taking other factors in to account,
does a good job on average providing a neutral thermal comfort. The factors that might explain
classroom 480’s cooler perception of thermal comfort is due to the fans being on October 11th
and 18th (see GRAPH 1 and GRAPH 5).
GRAPH 1.
Classroom 480
October 11th
fans on & windows closed
GRAPH 2.
Classroom 295
October 11th
fans off & windows open
GRAPH 3.
Classroom 480
November 15th
fans off & windows open
GRAPH 4.
Classroom 295
November 15th
fans off & windows open
GRAPH 5.
Classroom 480
October 18th
fans on & windows open
GRAPH 6.
Classroom 295
October 18th
fans on & windows open
GRAPH 7.
Classroom 480
November 1st
fans off & windows open
GRAPH 8.
Classroom 295
November 1st
fans on & windows open

AN INDOOR ENVIRONMENTAL QUALITY ASSESMENT LATTIN | 31
TABLE 5.
Interior Temperature Data Between Two Classrooms Held on Different Floors at the Same Time. 1
Room # Temperature (F°)
(11/1/2017)
Temperature (F°)
(11/15/2017)
CO₂ (PPM)
(11/1/2017)
CO₂ (PPM)
(11/15/2017)
480 71.1 70.7 512.5 449.5
295 74 72.9 622.5 796
Another moment of interest in the data relating to the first research question, is the
evidence of the stack effect trend between classrooms 385 and 180 held at the same time as well.
Although his trend mostly lends itself to the perception data for support, the interior temperature
data acts to provide secondary data backing up the occupant’s perception of comfort and
therefore the stack effect trend. Through analysis of both sets of data (see GRAPH 9-16 and
CHART 3), classroom 385 is perceived and performing on a slightly warmer thermal comfort
scale than the lower classroom 180. Therefore, although more data is necessary to completely
and confidently answer whether the stack effect is contributing to the thermal comfort of these
classrooms, this data presents strong evidence in support, where classroom 295 is an anomaly
that should be further researched to identify other factors to explain these results.
1 Shows interior classroom performance data collected 15 minutes before class as surveys were distributed up until
the start of class. Classroom 480 data averaged from 17:15 – 17:30 and classroom 295 data averaged from 17:30 –
17:45.
GRAPH 9.
Classroom 180
October 2nd
GRAPH 10.
Classroom 385
October 2nd
GRAPH 11.
Classroom 180
October 16th
GRAPH 12.
Classroom 385
October 16th

AN INDOOR ENVIRONMENTAL QUALITY ASSESMENT LATTIN | 32
TABLE 6.
Interior Temperature Data Between Two Classrooms Held on Different Floors at the Same Time. 1
Room # Temperature (F°)
(10/30/2017)
Temperature (F°)
(11/13/2017)
CO₂ (PPM)
(11/1/2017)
CO₂ (PPM)
(11/15/2017)
385 75 71.5 547 508
180 72.05 70.45 583.5 506.5
3.3 ANSWERING RESEARCH QUESTION 2
The combination of perception-based data and perception-based data collected, presents a
solid foundation to answer the simple questions related to indoor air quality and thermal comfort,
as well as being to tackle some of the more complex data. However, the addition of a full set of
relative humidity data, and indoor temperature data and more data, would be the means of fully
answering the research questions with total confidence. The data still justifies that a combination
of performance and perception-based data is enough to answer whether the Karl Miller Center’s
addition is successful in creating comfortable spaces to occupy. This combination of qualitative
and quantitative data also begins to address why this is so and what range of thermal comfort
these classrooms provide.
1 Shows interior classroom performance data collected 15 minutes before class as surveys were distributed up until
the start of class. Classroom 480 data averaged from 17:15 – 17:30 and classroom 295 data averaged from 17:30 –
17:45.
GRAPH 13.
Classroom 180
October 30th
GRAPH 14.
Classroom 385
October 30th
GRAPH 15.
Classroom 180
November 13th
GRAPH 16.
Classroom 385
November 13th
AN INDOOR ENVIRONMENTAL QUALITY ASSESMENT LATTIN | 33
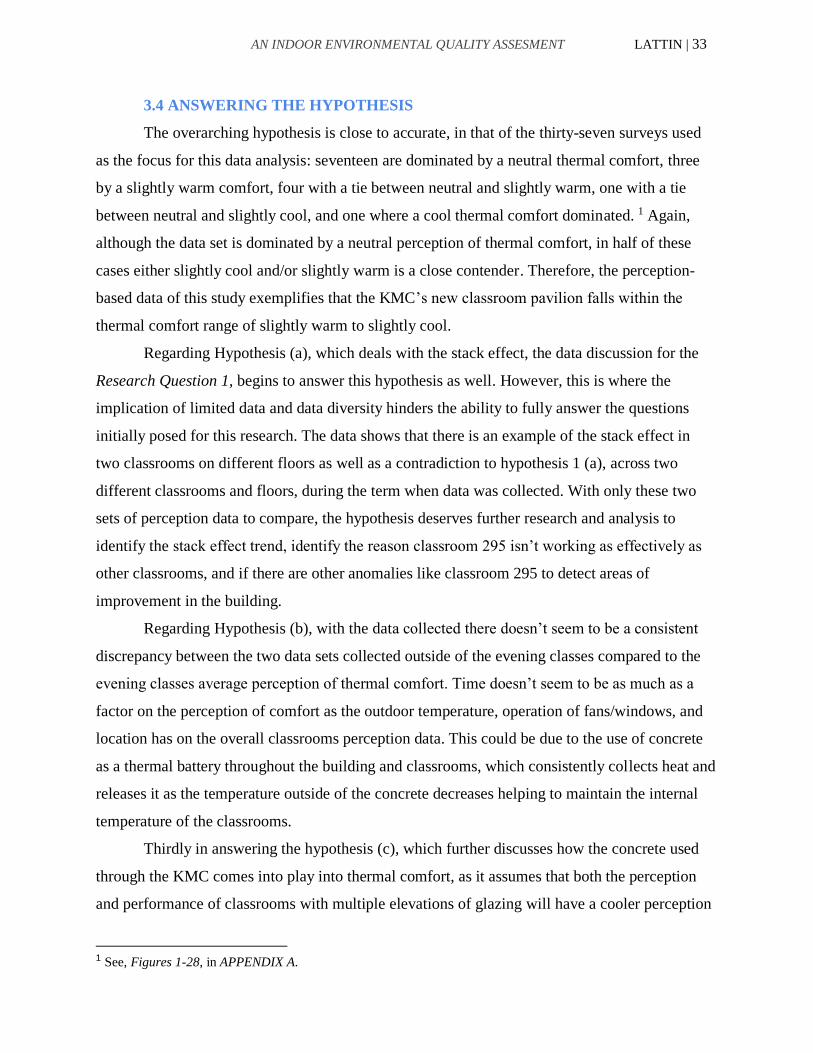
3.4 ANSWERING THE HYPOTHESIS
The overarching hypothesis is close to accurate, in that of the thirty-seven surveys used
as the focus for this data analysis: seventeen are dominated by a neutral thermal comfort, three
by a slightly warm comfort, four with a tie between neutral and slightly warm, one with a tie
between neutral and slightly cool, and one where a cool thermal comfort dominated. 1 Again,
although the data set is dominated by a neutral perception of thermal comfort, in half of these
cases either slightly cool and/or slightly warm is a close contender. Therefore, the perception-
based data of this study exemplifies that the KMC’s new classroom pavilion falls within the
thermal comfort range of slightly warm to slightly cool.
Regarding Hypothesis (a), which deals with the stack effect, the data discussion for the
Research Question 1, begins to answer this hypothesis as well. However, this is where the
implication of limited data and data diversity hinders the ability to fully answer the questions
initially posed for this research. The data shows that there is an example of the stack effect in
two classrooms on different floors as well as a contradiction to hypothesis 1 (a), across two
different classrooms and floors, during the term when data was collected. With only these two
sets of perception data to compare, the hypothesis deserves further research and analysis to
identify the stack effect trend, identify the reason classroom 295 isn’t working as effectively as
other classrooms, and if there are other anomalies like classroom 295 to detect areas of
improvement in the building.
Regarding Hypothesis (b), with the data collected there doesn’t seem to be a consistent
discrepancy between the two data sets collected outside of the evening classes compared to the
evening classes average perception of thermal comfort. Time doesn’t seem to be as much as a
factor on the perception of comfort as the outdoor temperature, operation of fans/windows, and
location has on the overall classrooms perception data. This could be due to the use of concrete
as a thermal battery throughout the building and classrooms, which consistently collects heat and
releases it as the temperature outside of the concrete decreases helping to maintain the internal
temperature of the classrooms.
Thirdly in answering the hypothesis (c), which further discusses how the concrete used
through the KMC comes into play into thermal comfort, as it assumes that both the perception
and performance of classrooms with multiple elevations of glazing will have a cooler perception
1 See, Figures 1-28, in APPENDIX A.

AN INDOOR ENVIRONMENTAL QUALITY ASSESMENT LATTIN | 34
of thermal comfort. The thinking behind this, is due to less concrete available to hold heat
coupled with the fact that glass is more of a thermal bridge for the outside air than concrete.
Although there is more opportunity for direct sunlight and therefore heat through radiation, the
classrooms with multiple elevations of glazing are set back allowing the floor above to act as it's
sunshade, and in turn present a design that will on average be colder than the other classrooms.
The only classroom with data collected that also is categorizes with multiple walls of glazing,
and therefore can be used to analysis its overall thermal comfort data, is classroom 390. Looking
at the data provided from classroom 390 (see GRAPH 17-22), this third hypothesis appears
wrong. The data provided shows that in fact the average perception of human comfort is
comfortable, and not slightly warm has hypothesized. However, the performance of this
classroom on the days with warmer temperature such as October 3rd and October 31st, appears to
lean towards providing a warmer space compared to other classrooms. It also is interesting to
point out how as the outdoor climate gets cooler (see CHART 3), so does the interior perception
of comfort, therefore not completely contradicting the hypothesis. It appears that this classroom,
because of the lack of concrete does a poor job at insulating the space, as discussed in the
hypothesis. What the hypothesis failed to address is how the lack of insulation and increased
opportunity of thermal bridging not only provides increasingly cool spaces, but also in turn
increasingly warmer spaces.
GRAPH 17.
Classroom 390
October 3rd
GRAPH 18.
Classroom 390
October 10th
GRAPH 19.
Classroom 390
October 17th
GRAPH 20.
Classroom 390
October 31st
GRAPH 21.
Classroom 390
November 14th
GRAPH 22.
Classroom 390
November 21st

AN INDOOR ENVIRONMENTAL QUALITY ASSESMENT LATTIN | 35
Table 7.
Exterior Temperature Data. 1
Date Average Outdoor Temperature at
Time of Survey Distribution
Max.
Temperature
Min.
Temperature
October
3rd
68.55°F 71°F 44°F
October
10th
53.55°F 57°F 43°F
October
17th
54.5°F 58°F 42°F
October
31st
60°F 62°F 35°F
November
14th
54.5°F 58°F 45°F
November
21st
48.9°F 51°F 45°F
4.0 CONCLUSIONS
The analysis above provides a solid foundation for the future exploration of the success
and concerns of using mixed-mode ventilation and natural ventilation systems. Limitations of
classroom diversity and participants data sets aside, this research provides some insights into
some of the problematic classrooms and therefore provides avenues for improvement of the
overall cooling and ventilation system. Some of these issues include: classroom 295’s perception
of comfort is an average warmer than comfortable even compared to classrooms above held at
the same time, when one would assume the stack affect would correlate to the opposite; although
the stack effect was not prominent in the comparison of classrooms 295 and 480, it was in
comparing the classrooms 390 and 180, therefore another set of classrooms to compare would
have better addresses the hypothesis; and with less concrete within classroom 390 there is less
insulation and therefore, the outdoor climate affect this classroom on average more than the
there’s used in this research.
1 Data taken from weatherunderground.com, where climate data is collected hourly; data relates to the time range
of 4:53pm to 5:53pm.
AN INDOOR ENVIRONMENTAL QUALITY ASSESMENT LATTIN | 36
The overall conclusion from this analysis is that the KMC’s new classroom pavilion, with
its naturally ventilation and cooling system, on average provided comfortable spaces, but nearly
equally provides spaces that are slightly outside of a neutrally perceived thermal comfort (i.e.
slightly warm or slightly cool). Although participants did relay perceptions of comfort outside of
neutral, it is important to note that some individuals prefer to occupy space that are slightly cool
or slightly warm, and therefore the data does not portray that occupants of the KMC are
necessarily uncomfortable. Therefore, future studies on this building, ill be able to have deeper
understanding of how comfortable the natural ventilation system in the KMC’s new addition
provides by including questions on surveys that ask occupants to rate their comfort as their
thermal comfort. As this was the pilot study for future studies on this building’s system, another
take away from the research is the importance of developing better ways to collect a more
diverse set of data by recruiting more professors, assembling a more diverse collection of
classrooms held at different times and on different floors, and improving the methods of
collecting both performance and perception-based data. Although each data provides thorough
insight into how a building or system works, the other half of the data illuminates upon and
questions of how and why the system is performing the way it is.

AN INDOOR ENVIRONMENTAL QUALITY ASSESMENT LATTIN | 37
SOURCE LIST
Ackerly, Katie et al. “Data Collections Methods for Assessing Adaptive Comfort in Mixed-Mode Buildings and
Personal Comfort Systems.” Indoor Environment Quality (IEQ), UC Berkeley. Center for the Built
Environment, University of California, Berkeley. Escholarship.org. OCTOBER 2012.
ASHRAE. “ASHRAE TERMINOLOGY.” 2018. Ashrae.org. https://www.ashrae.org/technical-resources/authoring-
tools/terminology
ASHRAE. “Thermal Environmental Conditions for Human Occupancy.” ANSI/ASHRAE Standard 55-2013.
www.ashrae.org.
ASHRAE. “Ventilation for Acceptable Indoor Air Quality.” ANSI/ASHRAE Standard 62.1-2016.
www.ashrae.org.
Better Buildings Partnership. “Natural Ventilation and Mixed Mode Systems.” JUNE 2015. Sydney, Australia.
www.betterbuildingspartnership.com.au/information/natural-ventilation-mixed-mode-systems/
Brager, Gail. “Mixed-Mode Cooling.” Envelope Systems, UC Berkeley. AUGUST 2006. ASHRAE Journal.
ashrae.org.
Brager, Gail and Baker, Lindsay. “Occupant satisfaction in mixed-mode buildings.” Envelope Systems, UC
Berkeley. JULY 2008. From Proceedings, Air Conditioning and the Low Carbon Cooling Challenge,
Windsor, UK.
Brager, Gail et al. “Mixed-Mode Ventilation: Hvac meets Mother Nature.” HVAC Systems, UC Berkeley. MAY
2000. ASHRAE Journal. Ashrae.org.
Brager, Gail et al. “Summary Report: Control Strategies for Mixed-Mode Buildings.” Center for the Built
environment (CBE), University of California, Berkeley. OCTOBER 2007.
Center for the Built Environment (CBE). “About Mixed-Mode.” University of California Berkeley. 2013.
https://www.cbe.berkeley.edu/mixedmode/aboutmm.html
Hoyt, Tyler et al. CBE Thermal Comfort Tool. Center for the Built Environment (CBE), University of
California Berkeley. 2017. comfort.cbe.berkeley.edu/.
EPA. “Heating, Ventilation and Air-conditioning Text Modules for the Indoor Air Quality Building Education and
Assessment Model.” United States Government. Indoor Air Quality (IAQ). JANUARY 2017.
https://www.epa.gov/indoor-air-quality-iaq/heating-ventilation-and-air-conditioning-text-modules-indoor-
air-quality.
Hu, Jianjun and Karava, Panagiota. “Model predictive control strategies for buildings with mixed-mode cooling.”
School of Civil Engineering, Purdue University. West Lafayette, IN. ELSEVIER. Building and
Environment 71 (2014) 233-244. SEPTEMBER 2013.
Jung-yeon, Yu et. al. “Resolving Stack Effect Problems in a High-Rise Office Building by Mechanical
Pressurization.” MDPI Journal. Sustainability. 2017.
N.C. Cooperation Extension.“Stack Effect - Defined.” NC State University and N.C. A&T State University.
https://energy.ces.ncsu.edu/stack-effect-defined/
Ogoli, David M. “Thermal Comfort in a Naturally-Ventilated Educational Building.” Judson College, Elgin, IL.
2007. ARCC Journal, Volume 4 Issue 2.
Spindler, Henry C. and Norford,Leslie K. “Naturally ventilated and mixed-mode buildings --- Part I: Thermal
modeling.” Massachusetts Institute of Technology. Optimal Energy Solutions LLC. Cambridge, MA and
Keene, NH. ELSEVIER. Building and Environment 44(2009) 736-749. MAY 2008.
U.S. Energy Information Administration. “How much energy is consumed in U.S. residential and commercial
buildings?.” 2017. https://www.eia.gov/tools/faqs/faq.php?id=86&t=1
Wright, Andre and Geoff Levermore, “Natural Ventilation or Mixed Mode? An investigation using Simulation.” EA
Technology Ltd, Chester CH1 6ES, UK, Virginia Cooper. UMIST, Manchester, Dept. Building
Engineering, M60 1D, U

AN INDOOR ENVIRONMENTAL QUALITY ASSESMENT LATTIN | 38
APPENDIX A.
Figure 1.
Figure 2.
Temp. at Time of
Survey Distribution1
Max. Temperature
(Entire Day)
Min. Temperature
(Entire Day)
Max. Humidity
(Entire Day)
Min. Humidity
(Entire Day)
61.6°F 65°F 49°F 93% 52%
1 Data taken from weatherunderground.com, where climate data is collected hourly; data range relates to 4:53pm to 5:53pm..
OUTDOOR CLIMATE DATA: MONDAY OCTOBER 2ND, 2017
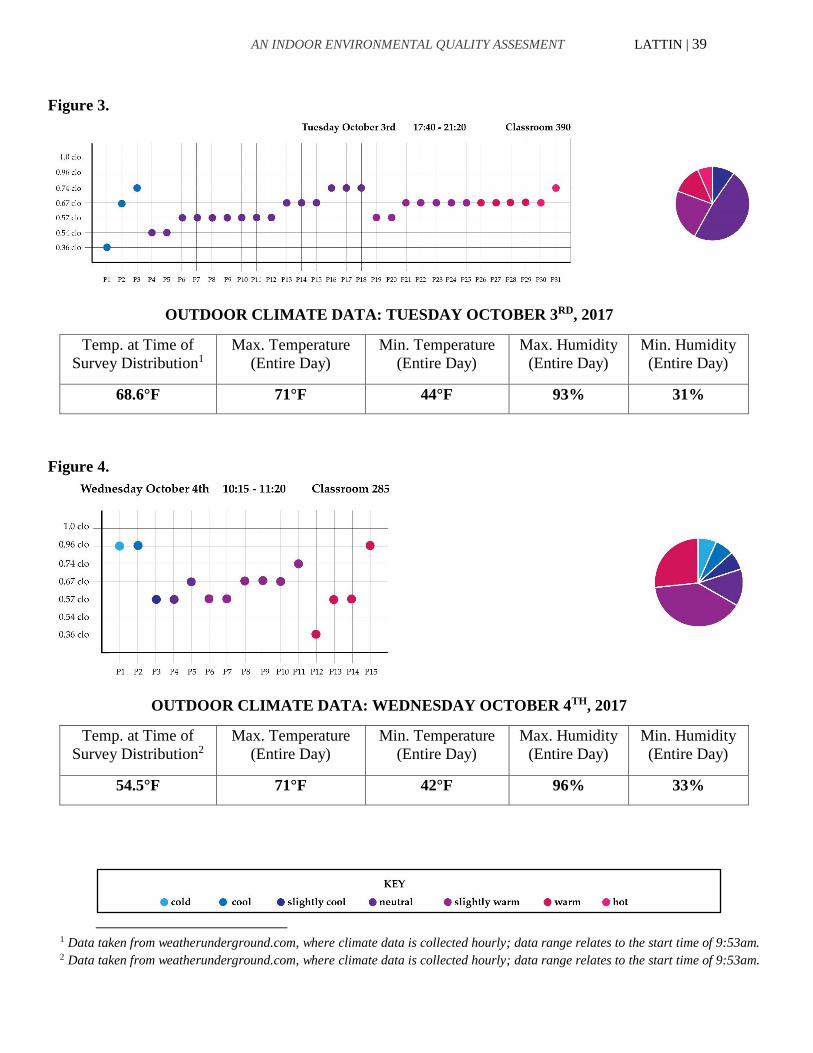
AN INDOOR ENVIRONMENTAL QUALITY ASSESMENT LATTIN | 39
Figure 3.
Temp. at Time of
Survey Distribution1
Max. Temperature
(Entire Day)
Min. Temperature
(Entire Day)
Max. Humidity
(Entire Day)
Min. Humidity
(Entire Day)
68.6°F 71°F 44°F 93% 31%
Figure 4.
Temp. at Time of
Survey Distribution2
Max. Temperature
(Entire Day)
Min. Temperature
(Entire Day)
Max. Humidity
(Entire Day)
Min. Humidity
(Entire Day)
54.5°F 71°F 42°F 96% 33%
1 Data taken from weatherunderground.com, where climate data is collected hourly; data range relates to the start time of 9:53am. 2 Data taken from weatherunderground.com, where climate data is collected hourly; data range relates to the start time of 9:53am.
OUTDOOR CLIMATE DATA: TUESDAY OCTOBER 3RD, 2017
OUTDOOR CLIMATE DATA: WEDNESDAY OCTOBER 4TH, 2017

AN INDOOR ENVIRONMENTAL QUALITY ASSESMENT LATTIN | 40
Figure 5.
Figure 6.
Temp. at Time of
Survey Distribution1
Max. Temperature
(Entire Day)
Min. Temperature
(Entire Day)
Max. Humidity
(Entire Day)
Min. Humidity
(Entire Day)
68°F 71°F 42°F 96% 33%
1 Data taken from weatherunderground.com, where climate data is collected hourly; data range relates to 4:53pm to 5:53pm.
OUTDOOR CLIMATE DATA: WEDNESDAY OCTOBER 4TH, 2017

AN INDOOR ENVIRONMENTAL QUALITY ASSESMENT LATTIN | 41
Figure 7.
Temp. at Time of
Survey Distribution1
Max. Temperature
(Entire Day)
Min. Temperature
(Entire Day)
Max. Humidity
(Entire Day)
Min. Humidity
(Entire Day)
59.0°F 73°F 43°F 93% 23%
Figure 8.
Temp. at Time of
Survey Distribution2
Max. Temperature
(Entire Day)
Min. Temperature
(Entire Day)
Max. Humidity
(Entire Day)
Min. Humidity
(Entire Day)
53.6°F 57°F 43°F 100% 66%
1 *Data taken from weatherunderground.com, where climate data is collected hourly; data relates to 11:53am. 2 Data taken from weatherunderground.com, where climate data is collected hourly; data range relates to the start time of 9:53am.
OUTDOOR CLIMATE DATA: FRIDAY OCTOBER 6TH, 2017
OUTDOOR CLIMATE DATA: TUEDAY OCTOBER 10TH, 2017
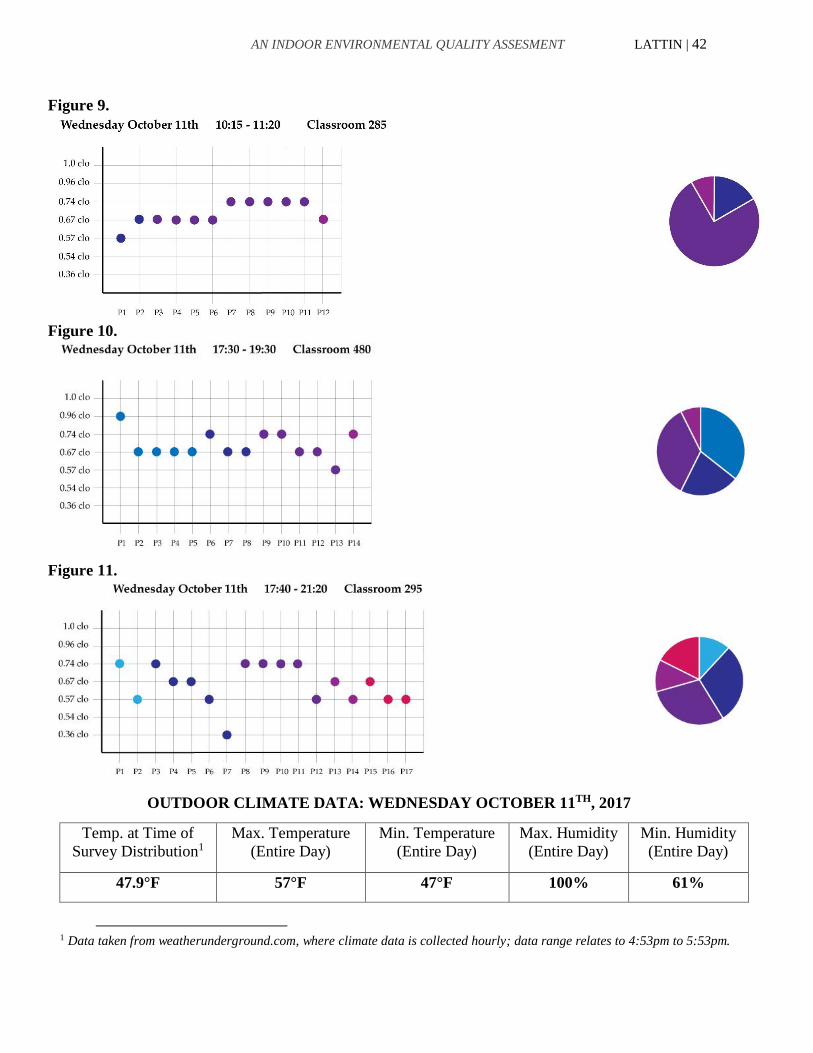
AN INDOOR ENVIRONMENTAL QUALITY ASSESMENT LATTIN | 42
Figure 9.
Figure 10.
Figure 11.
Temp. at Time of
Survey Distribution1
Max. Temperature
(Entire Day)
Min. Temperature
(Entire Day)
Max. Humidity
(Entire Day)
Min. Humidity
(Entire Day)
47.9°F 57°F 47°F 100% 61%
1 Data taken from weatherunderground.com, where climate data is collected hourly; data range relates to 4:53pm to 5:53pm.
OUTDOOR CLIMATE DATA: WEDNESDAY OCTOBER 11TH, 2017
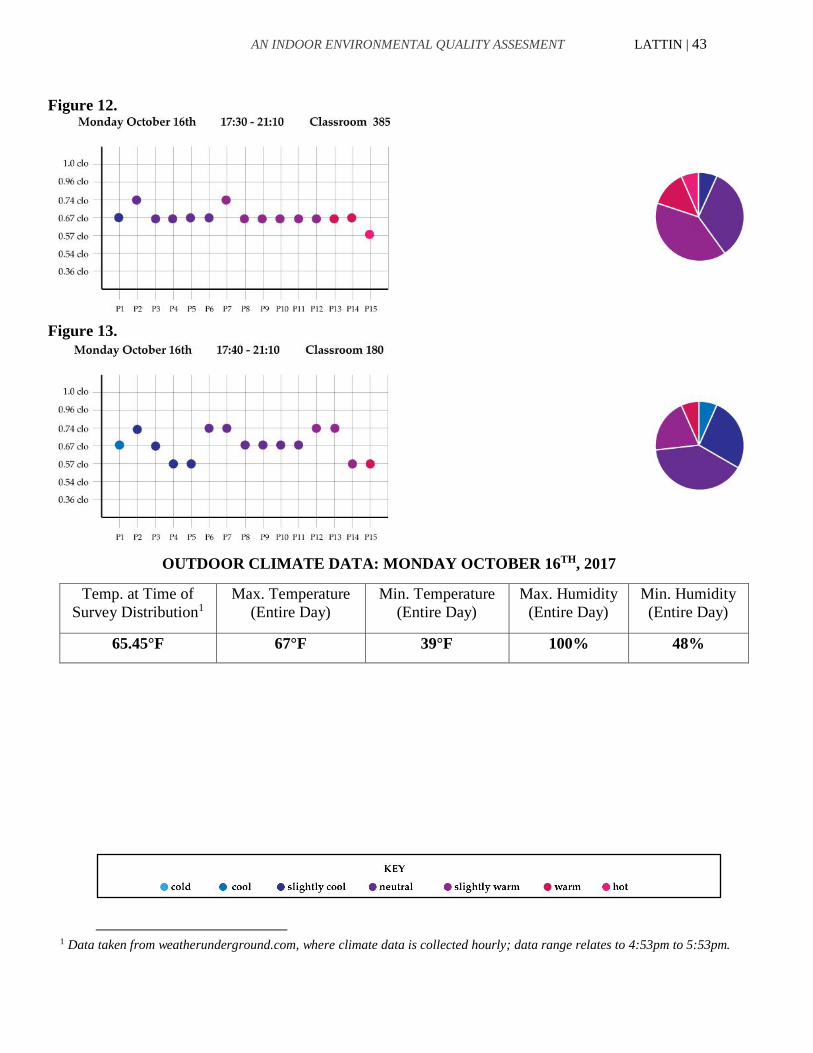
AN INDOOR ENVIRONMENTAL QUALITY ASSESMENT LATTIN | 43
Figure 12.
Figure 13.
Temp. at Time of
Survey Distribution1
Max. Temperature
(Entire Day)
Min. Temperature
(Entire Day)
Max. Humidity
(Entire Day)
Min. Humidity
(Entire Day)
65.45°F 67°F 39°F 100% 48%
1 Data taken from weatherunderground.com, where climate data is collected hourly; data range relates to 4:53pm to 5:53pm.
OUTDOOR CLIMATE DATA: MONDAY OCTOBER 16TH, 2017

AN INDOOR ENVIRONMENTAL QUALITY ASSESMENT LATTIN | 44
Figure 14.
Temp. at Time of
Survey Distribution1
Max. Temperature
(Entire Day)
Min. Temperature
(Entire Day)
Max. Humidity
(Entire Day)
Min. Humidity
(Entire Day)
54.5°F 58°F 42°F 100% 72%
Figure 15.
Temp. at Time of
Survey Distribution2
Max. Temperature
(Entire Day)
Min. Temperature
(Entire Day)
Max. Humidity
(Entire Day)
Min. Humidity
(Entire Day)
51.6°F 64°F 49°F 100% 72%
1 Data taken from weatherunderground.com, where climate data is collected hourly; data range relates to 4:53pm to 5:53pm. 2 Data taken from weatherunderground.com, where climate data is collected hourly; data relates to 9:53am to 10:53am.
OUTDOOR CLIMATE DATA: TUESDAY OCTOBER 17TH, 2017
OUTDOOR CLIMATE DATA: WEDNESDAY OCTOBER 18TH, 2017

AN INDOOR ENVIRONMENTAL QUALITY ASSESMENT LATTIN | 45
Figure 16.
Figure 17.
Temp. at Time of
Survey Distribution1
Max. Temperature
(Entire Day)
Min. Temperature
(Entire Day)
Max. Humidity
(Entire Day)
Min. Humidity
(Entire Day)
63.5°F 64°F 49°F 100% 72%
1 Data taken from weatherunderground.com, where climate data is collected hourly; data range relates to 4:53pm to 5:53pm.
OUTDOOR CLIMATE DATA: WEDNESDAY OCTOBER 18TH, 2017

AN INDOOR ENVIRONMENTAL QUALITY ASSESMENT LATTIN | 46
Figure 18.
Temp. at Time of
Survey Distribution1
Max. Temperature
(Entire Day)
Min. Temperature
(Entire Day)
Max. Humidity
(Entire Day)
Min. Humidity
(Entire Day)
51.8°F 54°F 48°F 93% 80%
Figure 19.
Temp. at Time of
Survey Distribution2
Max. Temperature
(Entire Day)
Min. Temperature
(Entire Day)
Max. Humidity
(Entire Day)
Min. Humidity
(Entire Day)
62.6°F 64°F 48°F 100% 63%
1 Data taken from weatherunderground.com, where climate data is collected hourly; data range relates to 4:53pm to 5:53pm. 2 Data taken from weatherunderground.com, where climate data is collected hourly; data range relates to 4:53pm to 5:53pm.
OUTDOOR CLIMATE DATA: FRIDAY OCTOBER 20TH, 2017
OUTDOOR CLIMATE DATA: MONDAY OCTOBER 23RD, 2017

AN INDOOR ENVIRONMENTAL QUALITY ASSESMENT LATTIN | 47
Figure 20.
Figure 21.
Temp. at Time of
Survey Distribution1
Max. Temperature
(Entire Day)
Min. Temperature
(Entire Day)
Max. Humidity
(Entire Day)
Min. Humidity
(Entire Day)
59.6°F 63°F 49°F 86% 23%
1 Data taken from weatherunderground.com, where climate data is collected hourly; data range relates to 4:53pm to 5:53pm.
OUTDOOR CLIMATE DATA: MONDAY OCTOBER 30TH, 2017

AN INDOOR ENVIRONMENTAL QUALITY ASSESMENT LATTIN | 48
Figure 22.
Temp. at Time of
Survey Distribution1
Max. Temperature
(Entire Day)
Min. Temperature
(Entire Day)
Max. Humidity
(Entire Day)
Min. Humidity
(Entire Day)
60°F 62°F 35°F 92% 33%
Figure 23.
Temp. at Time of
Survey Distribution2
Max. Temperature
(Entire Day)
Min. Temperature
(Entire Day)
Max. Humidity
(Entire Day)
Min. Humidity
(Entire Day)
53.5°F 58°F 47°F 86% 57%
1 Data taken from weatherunderground.com, where climate data is collected hourly; data range relates to 4:53pm to 5:53pm. 2 Data taken from weatherunderground.com, where climate data is collected hourly; data relates to 9:53am to 10:53am.
OUTDOOR CLIMATE DATA: TUESDAY OCTOBER 31ST, 2017
OUTDOOR CLIMATE DATA: WEDNESDAY NOVEMBER 1ST, 2017

AN INDOOR ENVIRONMENTAL QUALITY ASSESMENT LATTIN | 49
Figure 24.
Figure 25.
Figure 26.
Temp. at Time of
Survey Distribution1
Max. Temperature
(Entire Day)
Min. Temperature
(Entire Day)
Max. Humidity
(Entire Day)
Min. Humidity
(Entire Day)
54°F 58°F 47°F 86% 57%
1 Data taken from weatherunderground.com, where climate data is collected hourly; data range relates to 4:53pm to 5:53pm.
OUTDOOR CLIMATE DATA: WEDNESDAY NOVEMBER 1ST, 2017

AN INDOOR ENVIRONMENTAL QUALITY ASSESMENT LATTIN | 50
Figure 27.
Temp. at Time of
Survey Distribution1
Max. Temperature
(Entire Day)
Min. Temperature
(Entire Day)
Max. Humidity
(Entire Day)
Min. Humidity
(Entire Day)
46.5°F 50°F 43°F 89% 61%
1 Data taken from weatherunderground.com, where climate data is collected hourly; data range relates to 4:53pm to 5:53pm..
OUTDOOR CLIMATE DATA: FRIDAY NOVEMBER 3RD, 2017
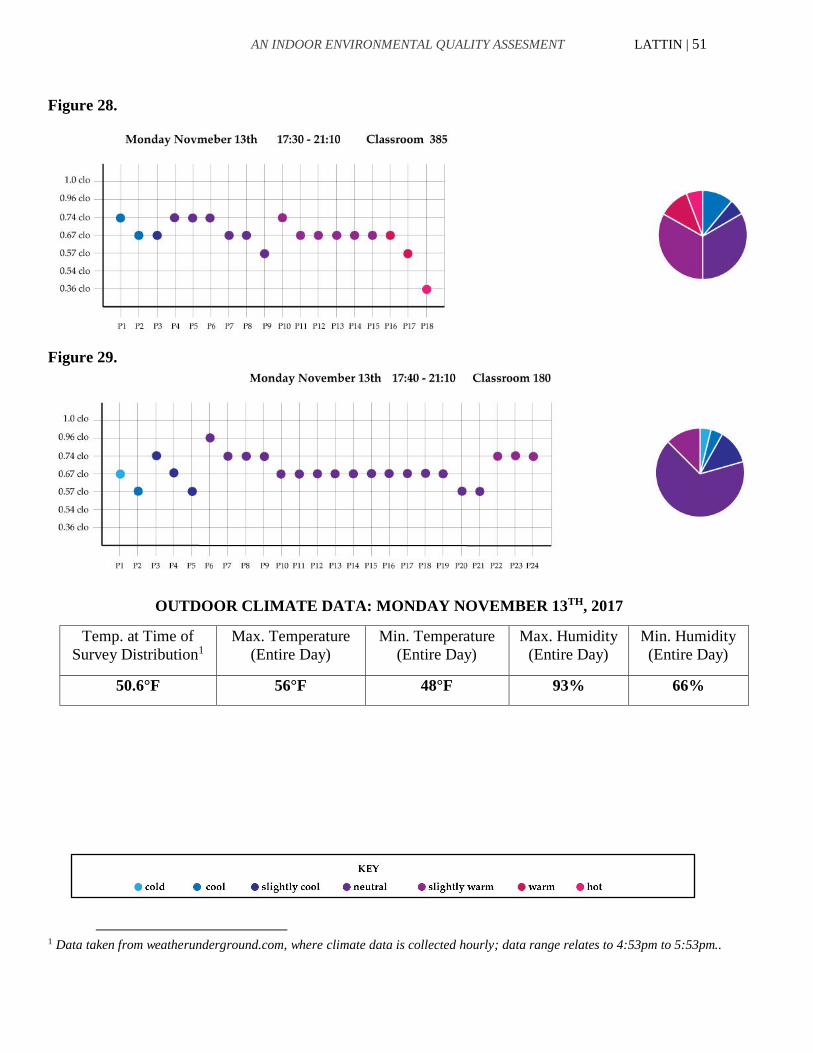
AN INDOOR ENVIRONMENTAL QUALITY ASSESMENT LATTIN | 51
Figure 28.
Figure 29.
Temp. at Time of
Survey Distribution1
Max. Temperature
(Entire Day)
Min. Temperature
(Entire Day)
Max. Humidity
(Entire Day)
Min. Humidity
(Entire Day)
50.6°F 56°F 48°F 93% 66%
1 Data taken from weatherunderground.com, where climate data is collected hourly; data range relates to 4:53pm to 5:53pm..
OUTDOOR CLIMATE DATA: MONDAY NOVEMBER 13TH, 2017
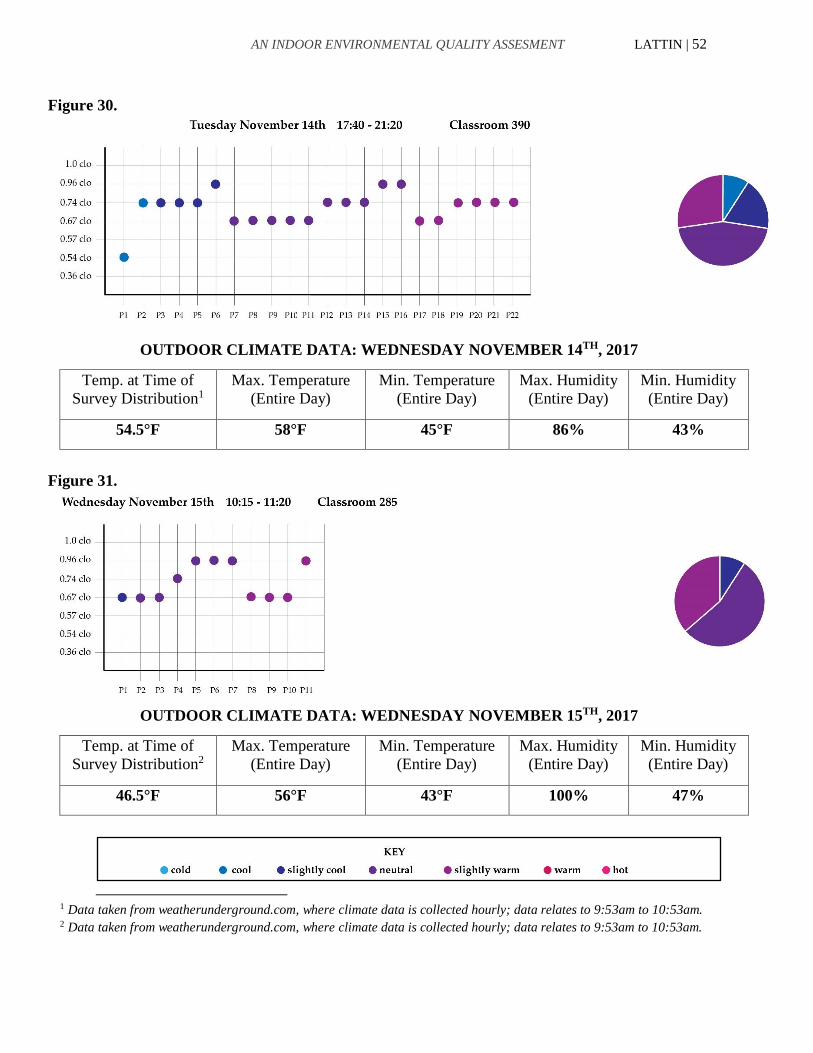
AN INDOOR ENVIRONMENTAL QUALITY ASSESMENT LATTIN | 52
Figure 30.
Temp. at Time of
Survey Distribution1
Max. Temperature
(Entire Day)
Min. Temperature
(Entire Day)
Max. Humidity
(Entire Day)
Min. Humidity
(Entire Day)
54.5°F 58°F 45°F 86% 43%
Figure 31.
Temp. at Time of
Survey Distribution2
Max. Temperature
(Entire Day)
Min. Temperature
(Entire Day)
Max. Humidity
(Entire Day)
Min. Humidity
(Entire Day)
46.5°F 56°F 43°F 100% 47%
1 Data taken from weatherunderground.com, where climate data is collected hourly; data relates to 9:53am to 10:53am. 2 Data taken from weatherunderground.com, where climate data is collected hourly; data relates to 9:53am to 10:53am.
OUTDOOR CLIMATE DATA: WEDNESDAY NOVEMBER 14TH, 2017
OUTDOOR CLIMATE DATA: WEDNESDAY NOVEMBER 15TH, 2017
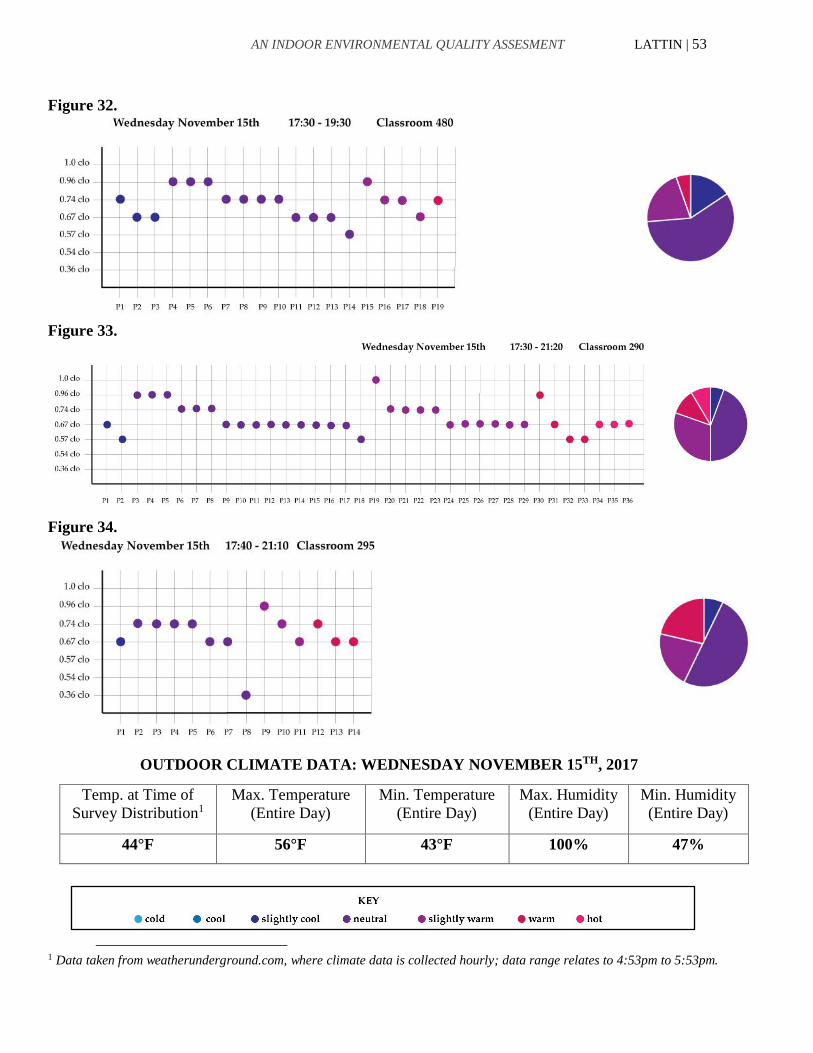
AN INDOOR ENVIRONMENTAL QUALITY ASSESMENT LATTIN | 53
Figure 32.
Figure 33.
Figure 34.
Temp. at Time of
Survey Distribution1
Max. Temperature
(Entire Day)
Min. Temperature
(Entire Day)
Max. Humidity
(Entire Day)
Min. Humidity
(Entire Day)
44°F 56°F 43°F 100% 47%
1 Data taken from weatherunderground.com, where climate data is collected hourly; data range relates to 4:53pm to 5:53pm.
OUTDOOR CLIMATE DATA: WEDNESDAY NOVEMBER 15TH, 2017

AN INDOOR ENVIRONMENTAL QUALITY ASSESMENT LATTIN | 54
Figure 35.
Temp. at Time of
Survey Distribution1
Max. Temperature
(Entire Day)
Min. Temperature
(Entire Day)
Max. Humidity
(Entire Day)
Min. Humidity
(Entire Day)
49.6°F 56°F 46°F 100% 72%
Figure 36.
Temp. at Time of
Survey Distribution2
Max. Temperature
(Entire Day)
Min. Temperature
(Entire Day)
Max. Humidity
(Entire Day)
Min. Humidity
(Entire Day)
48.9°F 51°F 45°F 100% 83%
1 Data taken from weatherunderground.com, where climate data is collected hourly; data range relates to 4:53pm to 5:53pm. 2 Data taken from weatherunderground.com, where climate data is collected hourly; data range relates to 4:53pm to 5:53pm.
OUTDOOR CLIMATE DATA: MONDAY NOVEMBER 20TH, 2017
OUTDOOR CLIMATE DATA: TUESDAY NOVEMBER 21ST, 2017

AN INDOOR ENVIRONMENTAL QUALITY ASSESMENT LATTIN | 55
Figure 37.
Temp. at Time of
Survey Distribution1
Max. Temperature
(Entire Day)
Min. Temperature
(Entire Day)
Max. Humidity
(Entire Day)
Min. Humidity
(Entire Day)
55°F 56°F 49°F 100% 86%
1 Data taken from weatherunderground.com, where climate data is collected hourly; data range relates to 4:53pm to 5:53pm.
OUTDOOR CLIMATE DATA: WEDNESDAY NOVEMBER 22ND, 2017

AN INDOOR ENVIRONMENTAL QUALITY ASSESMENT LATTIN | 56
APPENDIX B.
See below for performance data correlating to perception data sets from 10/30-11/15 (interior
temperature and CO₂ data collected from specified classrooms)
CHART 1.
ROOM # DATE TIME TEMPERATURE (F°) CO₂ (PPM)
385 10/30/2017 17:15:00 74.8 456
385 10/30/2017 17:30:00 75.2 638
385 10/30/2017 17:45:00 76.4 845
385 10/30/2017 18:00:00 76.4 945
385 10/30/2017 18:15:00 76.4 982
385 10/30/2017 18:30:00 76.8 959
385 10/30/2017 18:45:00 76.8 983
385 10/30/2017 19:00:00 76.7 883
385 10/30/2017 19:15:00 76.7 936
385 10/30/2017 19:30:00 76.7 1014
385 10/30/2017 19:45:00 76.7 896
385 10/30/2017 20:00:00 76.4 795
385 10/30/2017 20:15:00 76.6 973
385 10/30/2017 20:30:00 76.9 988
385 10/30/2017 20:45:00 76.9 1008
385 10/30/2017 21:00:00 76.9 1008
385 10/30/2017 21:15:00 76.6 903
385 10/30/2017 21:30:00 76.1 703
*Note: Comfort data correlates to first to rows of data; 15 minutes before class as surveys were
distributed up until the start of class.

AN INDOOR ENVIRONMENTAL QUALITY ASSESMENT LATTIN | 57
CHART 2.
ROOM # DATE TIME TEMPERATURE (F°) CO₂ (PPM)
180 10/30/2017 17:30:00 72.2 476
180 10/30/2017 17:45:00 71.9 691
180 10/30/2017 18:00:00 72.1 892992
180 10/30/2017 18:15:00 72.6 1019
180 10/30/2017 18:30:00 72.9 1003
180 10/30/2017 18:45:00 73.1 991
180 10/30/2017 19:00:00 73.4 875
180 10/30/2017 19:15:00 73.8 771
180 10/30/2017 19:30:00 74 671
180 10/30/2017 19:45:00 74 661
180 10/30/2017 20:00:00 73.7 661
180 10/30/2017 20:15:00 73.1 661
180 10/30/2017 20:30:00 73 661
180 10/30/2017 20:45:00 72.7 661
180 10/30/2017 21:00:00 72.5 661
180 10/30/2017 21:15:00 72.5 661
180 10/30/2017 21:30:00 72 566
*Note: Comfort data correlates to first to rows of data; 15 minutes before class as surveys were
distributed up until the start of class.

AN INDOOR ENVIRONMENTAL QUALITY ASSESMENT LATTIN | 58
CHART 3.
ROOM # DATE TIME TEMPERATURE (F°) CO₂ (PPM)
480 11/1/2017 17:15:00 70.6 486
480 11/1/2017 17:30:00 71.6 539
480 11/1/2017 17:45:00 72.5 847
480 11/1/2017 18:00:00 72.5 1049
480 11/1/2017 18:15:00 72.5 1150
480 11/1/2017 18:30:00 72.9 1204
480 11/1/2017 18:45:00 73.1 1297
480 11/1/2017 19:00:00 73.1 1329
480 11/1/2017 19:15:00 72.4 1029
480 11/1/2017 19:30:00 71.5 828
480 11/1/2017 19:45:00 71.3 628
480 11/1/2017 20:00:00 70.7 539
480 11/1/2017 20:15:00 70.1 486
480 11/1/2017 20:30:00 70.3 456
480 11/1/2017 20:45:00 71.3 771
480 11/1/2017 21:00:00 71.6 732
480 11/1/2017 21:15:00 71.9 632
480 11/1/2017 21:30:00 71.6 546
*Note: Comfort data correlates to first to rows of data; 15 minutes before class as surveys were
distributed up until the start of class.

AN INDOOR ENVIRONMENTAL QUALITY ASSESMENT LATTIN | 59
CHART 4.
ROOM # DATE TIME TEMPERATURE (F°) CO₂ (PPM)
290 11/1/2017 17:15:00 72.9 422
290 11/1/2017 17:30:00 72.9 455
290 11/1/2017 17:45:00 73.6 755
290 11/1/2017 18:00:00 73.9 832
290 11/1/2017 18:15:00 74.3 832
290 11/1/2017 18:30:00 74.3 856
290 11/1/2017 18:45:00 74.6 873
290 11/1/2017 19:00:00 74.6 873
290 11/1/2017 19:15:00 74.8 861
290 11/1/2017 19:30:00 74.8 839
290 11/1/2017 19:45:00 74.5 736
290 11/1/2017 20:00:00 74.5 665
290 11/1/2017 20:15:00 74.5 765
290 11/1/2017 20:30:00 74.5 805
290 11/1/2017 20:45:00 74.5 805
290 11/1/2017 21:00:00 74.8 844
290 11/1/2017 21:15:00 74.8 844
290 11/1/2017 21:30:00 75 780
*Note: Instance where comfort data correlates to the full class period; professor distributed
survey approx. midway through class.

AN INDOOR ENVIRONMENTAL QUALITY ASSESMENT LATTIN | 60
CHART 5.
ROOM # DATE TIME TEMPERATURE (F°) CO₂ (PPM)
295 11/1/2017 17:30:00 74.3 723
295 11/1/2017 17:45:00 73.7 522
295 11/1/2017 18:00:00 73.4 466
295 11/1/2017 18:15:00 73.2 450
295 11/1/2017 18:30:00 73.2 450
295 11/1/2017 18:45:00 73.2 450
295 11/1/2017 19:00:00 73.2 450
295 11/1/2017 19:15:00 73.2 450
295 11/1/2017 19:30:00 73.2 450
295 11/1/2017 19:45:00 73.2 450
295 11/1/2017 20:00:00 73.2 450
295 11/1/2017 20:15:00 73.2 450
295 11/1/2017 20:30:00 73.2 440
295 11/1/2017 20:45:00 73.2 440
295 11/1/2017 21:00:00 73.2 440
295 11/1/2017 21:15:00 72.9 440
295 11/1/2017 21:30:00 72.9 440
Note: Comfort data correlates to first to rows of data; 15 minutes before class as surveys were
distributed up until the start of class.
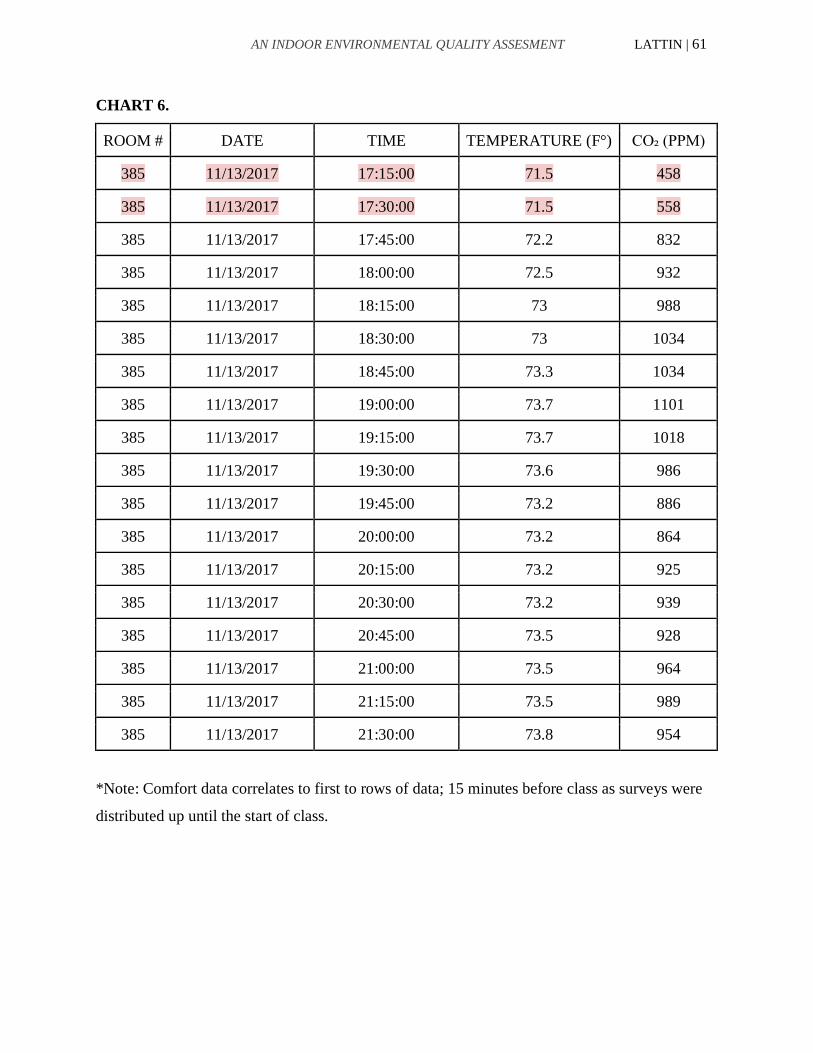
AN INDOOR ENVIRONMENTAL QUALITY ASSESMENT LATTIN | 61
CHART 6.
ROOM # DATE TIME TEMPERATURE (F°) CO₂ (PPM)
385 11/13/2017 17:15:00 71.5 458
385 11/13/2017 17:30:00 71.5 558
385 11/13/2017 17:45:00 72.2 832
385 11/13/2017 18:00:00 72.5 932
385 11/13/2017 18:15:00 73 988
385 11/13/2017 18:30:00 73 1034
385 11/13/2017 18:45:00 73.3 1034
385 11/13/2017 19:00:00 73.7 1101
385 11/13/2017 19:15:00 73.7 1018
385 11/13/2017 19:30:00 73.6 986
385 11/13/2017 19:45:00 73.2 886
385 11/13/2017 20:00:00 73.2 864
385 11/13/2017 20:15:00 73.2 925
385 11/13/2017 20:30:00 73.2 939
385 11/13/2017 20:45:00 73.5 928
385 11/13/2017 21:00:00 73.5 964
385 11/13/2017 21:15:00 73.5 989
385 11/13/2017 21:30:00 73.8 954
*Note: Comfort data correlates to first to rows of data; 15 minutes before class as surveys were
distributed up until the start of class.
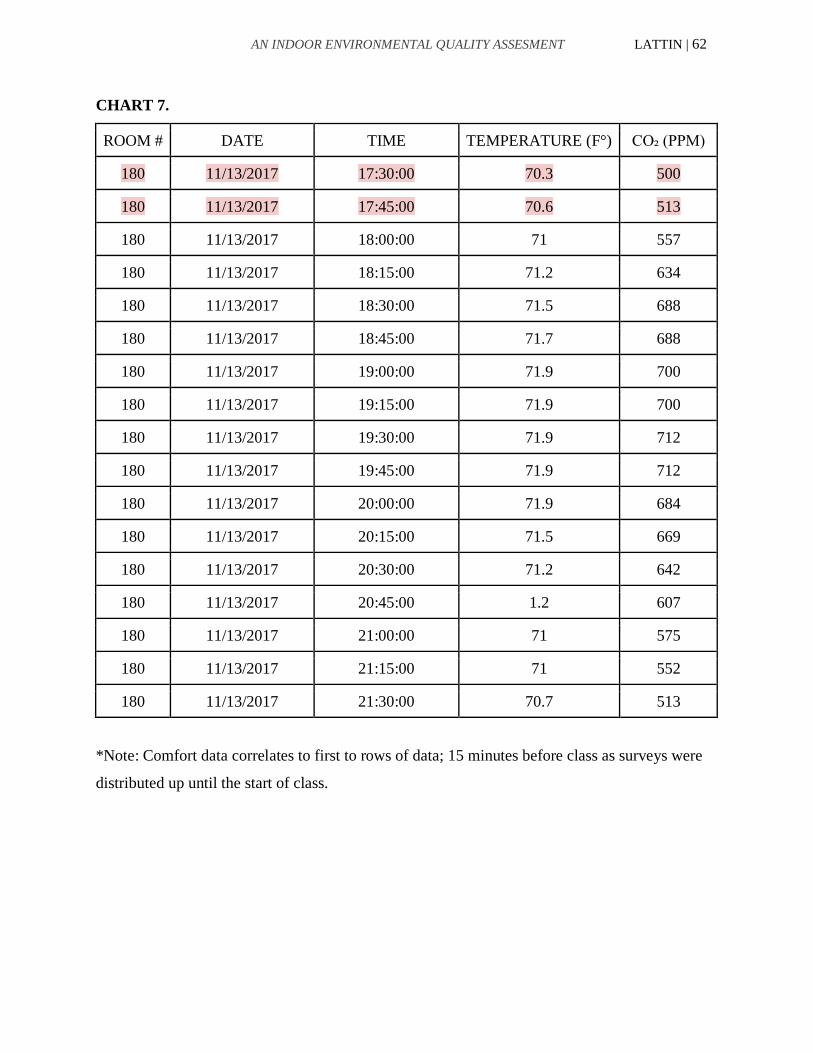
AN INDOOR ENVIRONMENTAL QUALITY ASSESMENT LATTIN | 62
CHART 7.
ROOM # DATE TIME TEMPERATURE (F°) CO₂ (PPM)
180 11/13/2017 17:30:00 70.3 500
180 11/13/2017 17:45:00 70.6 513
180 11/13/2017 18:00:00 71 557
180 11/13/2017 18:15:00 71.2 634
180 11/13/2017 18:30:00 71.5 688
180 11/13/2017 18:45:00 71.7 688
180 11/13/2017 19:00:00 71.9 700
180 11/13/2017 19:15:00 71.9 700
180 11/13/2017 19:30:00 71.9 712
180 11/13/2017 19:45:00 71.9 712
180 11/13/2017 20:00:00 71.9 684
180 11/13/2017 20:15:00 71.5 669
180 11/13/2017 20:30:00 71.2 642
180 11/13/2017 20:45:00 1.2 607
180 11/13/2017 21:00:00 71 575
180 11/13/2017 21:15:00 71 552
180 11/13/2017 21:30:00 70.7 513
*Note: Comfort data correlates to first to rows of data; 15 minutes before class as surveys were
distributed up until the start of class.

AN INDOOR ENVIRONMENTAL QUALITY ASSESMENT LATTIN | 63
CHART 8.
ROOM # DATE TIME TEMPERATURE (F°) CO₂ (PPM)
480 11/15/2017 17:15:00 70.7 439
480 11/15/2017 17:30:00 70.7 460
480 11/15/2017 17:45:00 70.7 486
480 11/15/2017 18:00:00 70.9 667
480 11/15/2017 18:15:00 71.2 767
480 11/15/2017 18:30:00 71.2 809
480 11/15/2017 18:45:00 71.2 809
480 11/15/2017 19:00:00 71.4 809
480 11/15/2017 19:15:00 71.6 809
480 11/15/2017 19:30:00 71.1 809
480 11/15/2017 19:45:00 70.9 796
480 11/15/2017 20:00:00 70.9 763
480 11/15/2017 20:15:00 70.9 763
480 11/15/2017 20:30:00 70.9 763
480 11/15/2017 20:45:00 70.9 779
480 11/15/2017 21:00:00 70.9 879
480 11/15/2017 21:15:00 70.9 939
480 11/15/2017 21:30:00 70.9 936
*Note: Comfort data correlates to first to rows of data; 15 minutes before class as surveys were
distributed up until the start of class.

AN INDOOR ENVIRONMENTAL QUALITY ASSESMENT LATTIN | 64
CHART 9.
ROOM # DATE TIME TEMPERATURE (F°) CO₂ (PPM)
290 11/15/2017 17:15:00 71.7 1247
290 11/15/2017 17:30:00 71.5 939
290 11/15/2017 17:45:00 72.1 1245
290 11/15/2017 18:00:00 72.4 1042
290 11/15/2017 18:15:00 72.8 742
290 11/15/2017 18:30:00 72.8 642
290 11/15/2017 18:45:00 73 551
290 11/15/2017 19:00:00 73 502
290 11/15/2017 19:15:00 73 477
290 11/15/2017 19:30:00 73 465
290 11/15/2017 19:45:00 73 455
290 11/15/2017 20:00:00 73 455
290 11/15/2017 20:15:00 72.5 756
290 11/15/2017 20:30:00 7.4 754
290 11/15/2017 20:45:00 72.7 748
290 11/15/2017 21:00:00 72.7 750
290 11/15/2017 21:15:00 72.3 653
290 11/15/2017 21:30:00 72 550
*Note: Instance where comfort data correlates to the full class period; professor distributed
survey approx. midway through class.

AN INDOOR ENVIRONMENTAL QUALITY ASSESMENT LATTIN | 65
CHART 10.
ROOM # DATE TIME TEMPERATURE (F°) CO₂ (PPM)
295 11/15/2017 17:30:00 72.7 847
295 11/15/2017 17:45:00 73.1 745
295 11/15/2017 18:00:00 72.3 771
295 11/15/2017 18:15:00 72.3 815
295 11/15/2017 18:30:00 72.5 815
295 11/15/2017 18:45:00 72.5 828
295 11/15/2017 19:00:00 72.5 847
295 11/15/2017 19:15:00 72.8 798
295 11/15/2017 19:30:00 72.8 831
295 11/15/2017 19:45:00 72.8 819
295 11/15/2017 20:00:00 72.6 819
295 11/15/2017 20:15:00 72.2 742
295 11/15/2017 20:30:00 72 723
295 11/15/2017 20:45:00 71.6 691
295 11/15/2017 21:00:00 72 668
295 11/15/2017 21:15:00 71.3 611
295 11/15/2017 21:30:00 71 548
Note: Comfort data correlates to first to rows of data; 15 minutes before class as surveys were
distributed up until the start of class.

AN INDOOR ENVIRONMENTAL QUALITY ASSESMENT LATTIN | 66
APPENDIX C.
See below for example survey, relating to room 180. Figure 1 shows front of survey, and figure 2
shows the back of survey where consent information is stated. Question 4 is the only difference
between surveys, where the plan shown relates to the specific classroom
Figure 1.

AN INDOOR ENVIRONMENTAL QUALITY ASSESMENT LATTIN | 67
Figure 2.