an innovative approach to improved pipeline integrity ... · pdf filekey issue #1...
TRANSCRIPT

AN INNOVATIVE APPROACH TO IMPROVED
PIPELINE INTEGRITY MANAGEMENT
PRESENTERS
2
Presenter
Michael Gloven, PE
Senior Vice President
G2 Integrated Solutions
Moderator
Christian Carlson,
Marketing Manager
G2 Integrated Solutions
ABOUT G2 INTEGRATED SOLUTIONS
G2 Integrated Solutions delivers expertise to pipeline operators, utility
companies, and other energy stakeholders in seven specialized service
disciplines:
• Asset Integrity
• Engineering
• Geospatial Systems and Services
• Regulatory Compliance
• Field Services
• Technology Services
• Strategic Consulting
G2-IS has offices located in Houston, Texas (Corporate Headquarters),
Angleton, Texas, Concord, California, and Denver, Colorado.
For more information visit www.G2-IS.com3
AN INNOVATIVE APPROACH TO IMPROVED
PIPELINE INTEGRITY MANAGEMENT
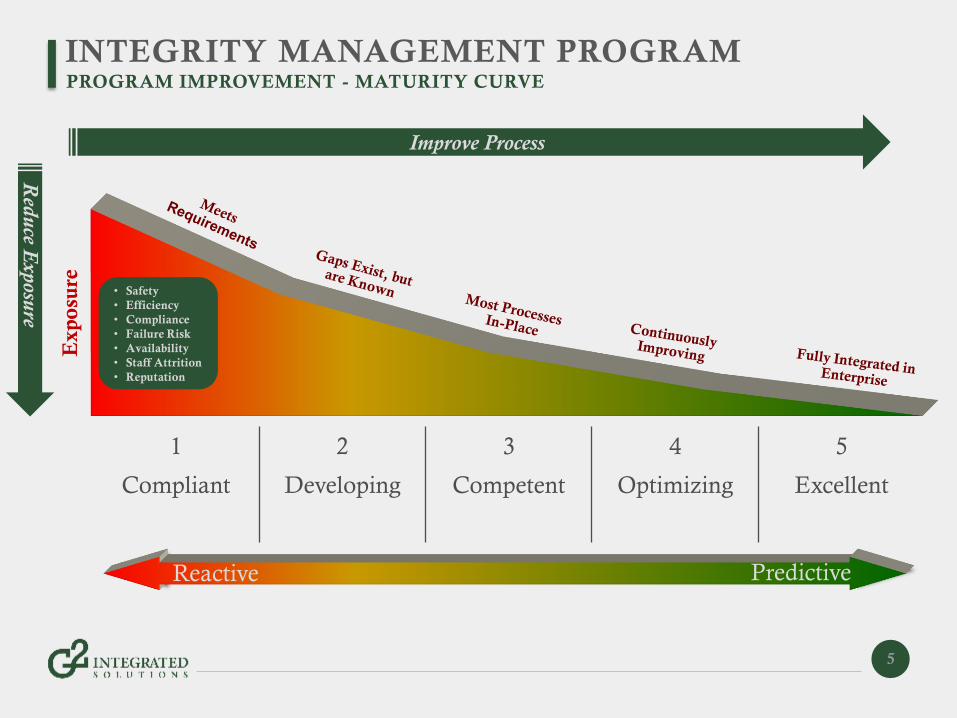
INTEGRITY MANAGEMENT PROGRAM
5
PROGRAM IMPROVEMENT - MATURITY CURVE
Improve Process
Reactive Predictive
Red
uce E
xposu
re
1 2 3 4 5
Compliant Developing Competent Optimizing Excellent
• Safety
• Efficiency
• Compliance
• Failure Risk
• Availability
• Staff Attrition
• Reputation
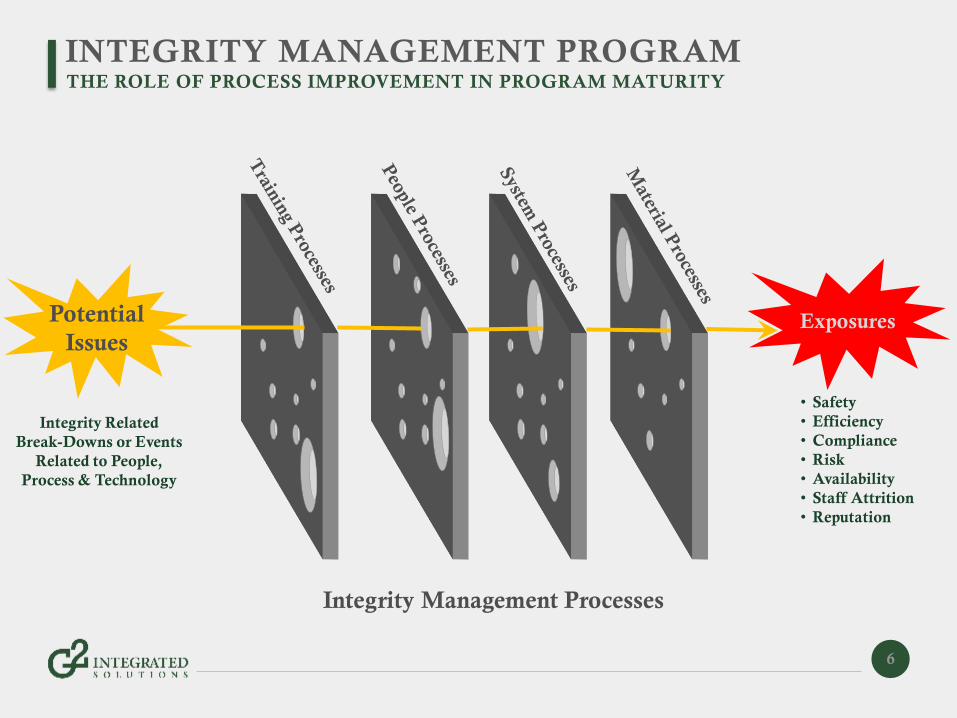
Integrity Management Processes
INTEGRITY MANAGEMENT PROGRAM
6
THE ROLE OF PROCESS IMPROVEMENT IN PROGRAM MATURITY
Exposures
• Safety
• Efficiency
• Compliance
• Risk
• Availability
• Staff Attrition
• Reputation
Potential
Issues
Integrity Related
Break-Downs or Events
Related to People,
Process & Technology
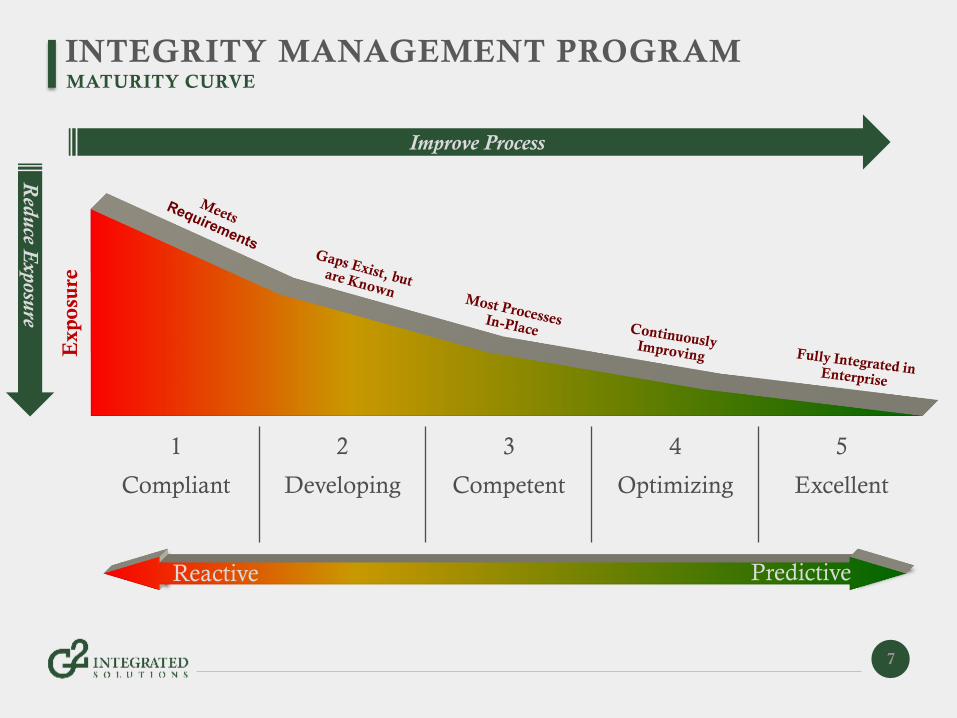
INTEGRITY MANAGEMENT PROGRAM
7
MATURITY CURVE
Improve Process
Reactive Predictive
Red
uce E
xposu
re
1 2 3 4 5
Compliant Developing Competent Optimizing Excellent
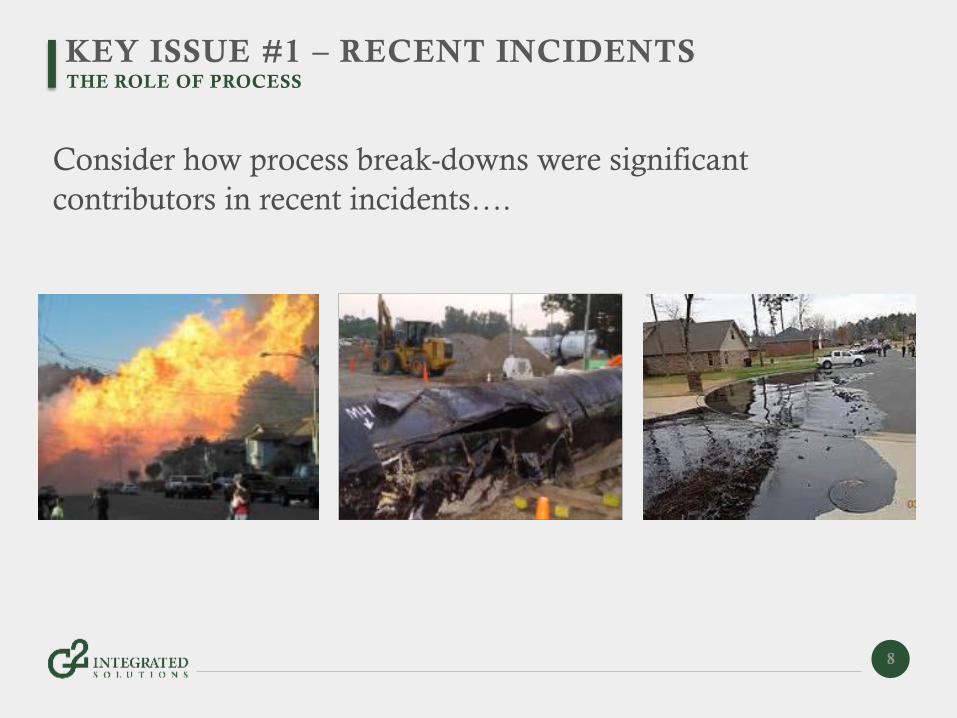
KEY ISSUE #1 – RECENT INCIDENTS
Consider how process break-downs were significant
contributors in recent incidents….
8
THE ROLE OF PROCESS
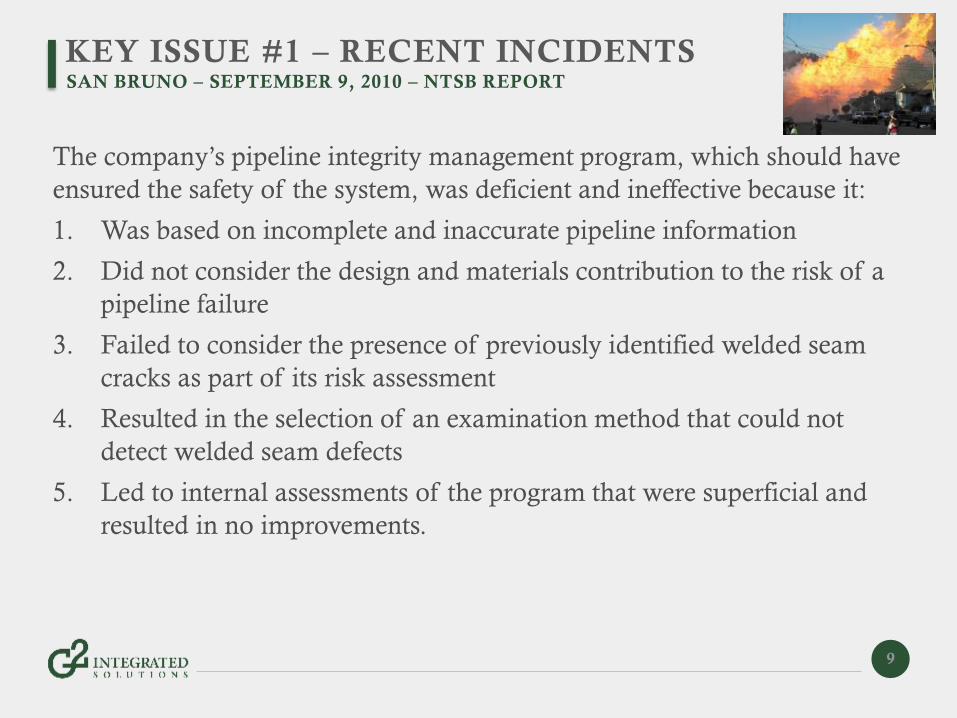
KEY ISSUE #1 – RECENT INCIDENTS
The company’s pipeline integrity management program, which should have
ensured the safety of the system, was deficient and ineffective because it:
1. Was based on incomplete and inaccurate pipeline information
2. Did not consider the design and materials contribution to the risk of a
pipeline failure
3. Failed to consider the presence of previously identified welded seam
cracks as part of its risk assessment
4. Resulted in the selection of an examination method that could not
detect welded seam defects
5. Led to internal assessments of the program that were superficial and
resulted in no improvements.
9
SAN BRUNO – SEPTEMBER 9, 2010 – NTSB REPORT
KEY ISSUE #1 – RECENT INCIDENTS
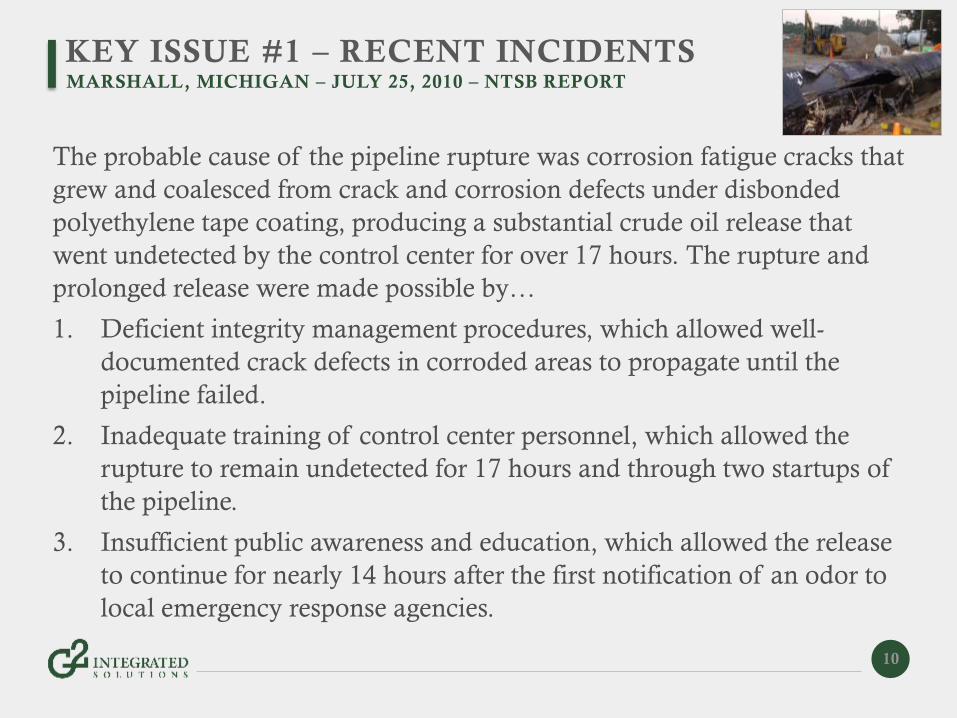
The probable cause of the pipeline rupture was corrosion fatigue cracks that
grew and coalesced from crack and corrosion defects under disbonded
polyethylene tape coating, producing a substantial crude oil release that
went undetected by the control center for over 17 hours. The rupture and
prolonged release were made possible by…
1. Deficient integrity management procedures, which allowed well-
documented crack defects in corroded areas to propagate until the
pipeline failed.
2. Inadequate training of control center personnel, which allowed the
rupture to remain undetected for 17 hours and through two startups of
the pipeline.
3. Insufficient public awareness and education, which allowed the release
to continue for nearly 14 hours after the first notification of an odor to
local emergency response agencies.
10
MARSHALL, MICHIGAN – JULY 25, 2010 – NTSB REPORT
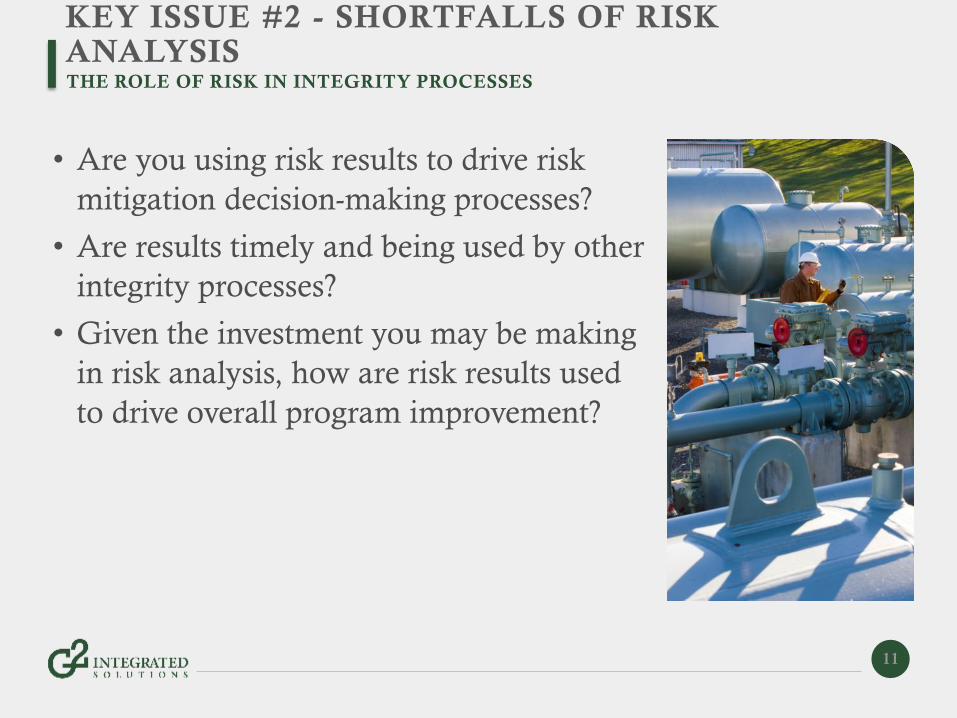
KEY ISSUE #2 - SHORTFALLS OF RISK ANALYSIS
• Are you using risk results to drive risk
mitigation decision-making processes?
• Are results timely and being used by other
integrity processes?
• Given the investment you may be making
in risk analysis, how are risk results used
to drive overall program improvement?
11
THE ROLE OF RISK IN INTEGRITY PROCESSES
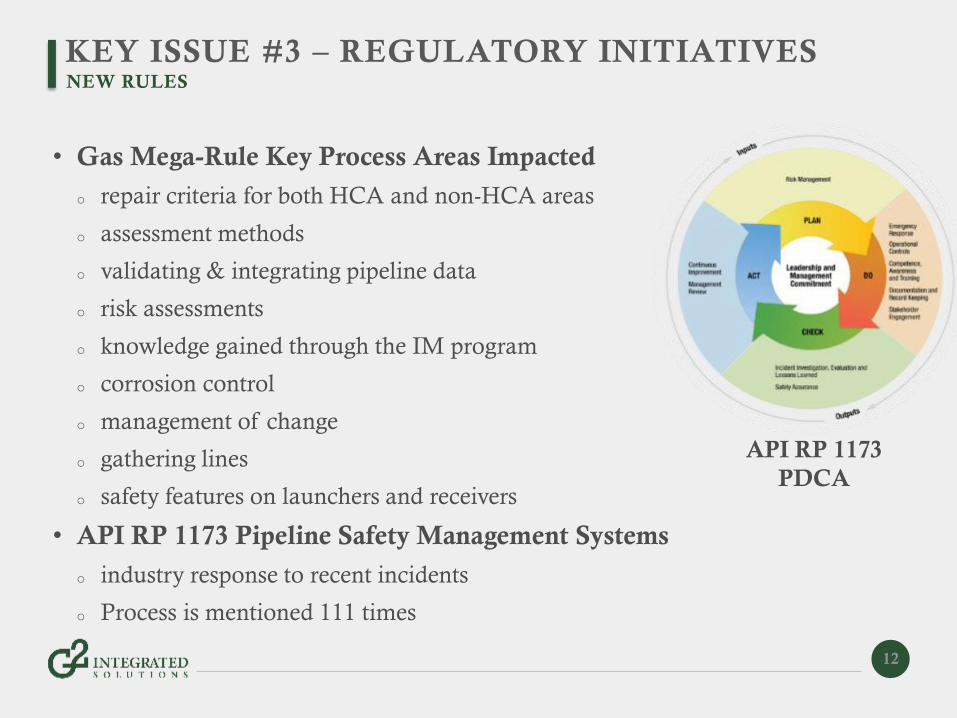
KEY ISSUE #3 – REGULATORY INITIATIVES
• Gas Mega-Rule Key Process Areas Impacted
o repair criteria for both HCA and non-HCA areas
o assessment methods
o validating & integrating pipeline data
o risk assessments
o knowledge gained through the IM program
o corrosion control
o management of change
o gathering lines
o safety features on launchers and receivers
• API RP 1173 Pipeline Safety Management Systems
o industry response to recent incidents
o Process is mentioned 111 times
12
NEW RULES
API RP 1173
PDCA

INTEGRITY MANAGEMENT PROGRAM
13
APPLYING A PROCESS BASED APPROACH
Improve Process
Reactive Predictive
Red
uce E
xposu
re
1 2 3 4 5
Compliant Developing Competent Optimizing Excellent
• Safety
• Efficiency
• Compliance
• Failure Risk
• Availability
• Staff Attrition
• Reputation

INTEGRITY MANAGEMENT PROGRAM
14
MATURITY CURVE
Improve Process
Reactive Predictive
Red
uce E
xposu
re
1 2 3 4 5
Compliant Developing Competent Optimizing Excellent
• Safety
• Efficiency
• Compliance
• Failure Risk
• Availability
• Staff Attrition
• Reputation
A PROCESS BASED APPROACH
REDUCING EXPOSURE
BY IMPROVING PROCESS
15
PROCESS BASED APPROACH
Key Take-Aways
• Explanation of Approach
• Example with Templates
• Recommended Resources
16
KEY TAKE AWAYS
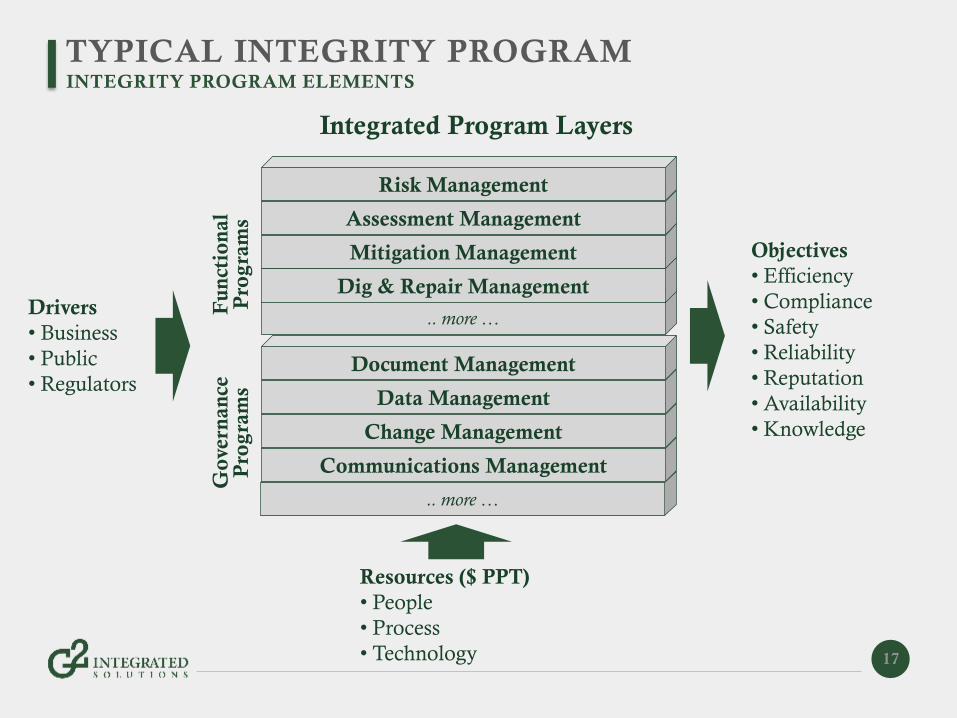
TYPICAL INTEGRITY PROGRAM
17
INTEGRITY PROGRAM ELEMENTS
Integrated Program Layers
.. more …
Communications Management
Change Management
Data Management
Document Management
Go
vern
an
ce
Pro
gra
ms
.. more …
Dig & Repair Management
Mitigation Management
Assessment Management
Risk Management
Fu
nct
ion
al
Pro
gra
ms
Drivers
• Business
• Public
• Regulators
Objectives
• Efficiency
• Compliance
• Safety
• Reliability
• Reputation
• Availability
• Knowledge
Resources ($ PPT)
• People
• Process
• Technology
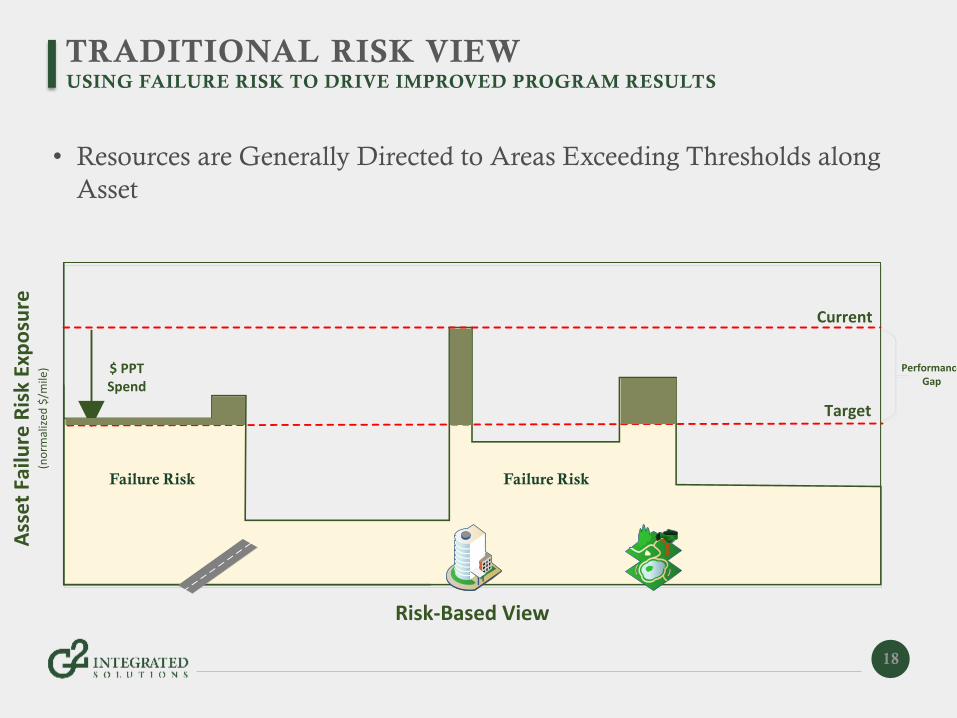
TRADITIONAL RISK VIEW
• Resources are Generally Directed to Areas Exceeding Thresholds along
Asset
18
USING FAILURE RISK TO DRIVE IMPROVED PROGRAM RESULTS
Risk-Based View
Ass
et
Failu
re R
isk
Exp
osu
re(n
orm
aliz
ed $
/mile
)
Current
Target
PerformanceGap
$ PPTSpend
Failure Risk Failure Risk
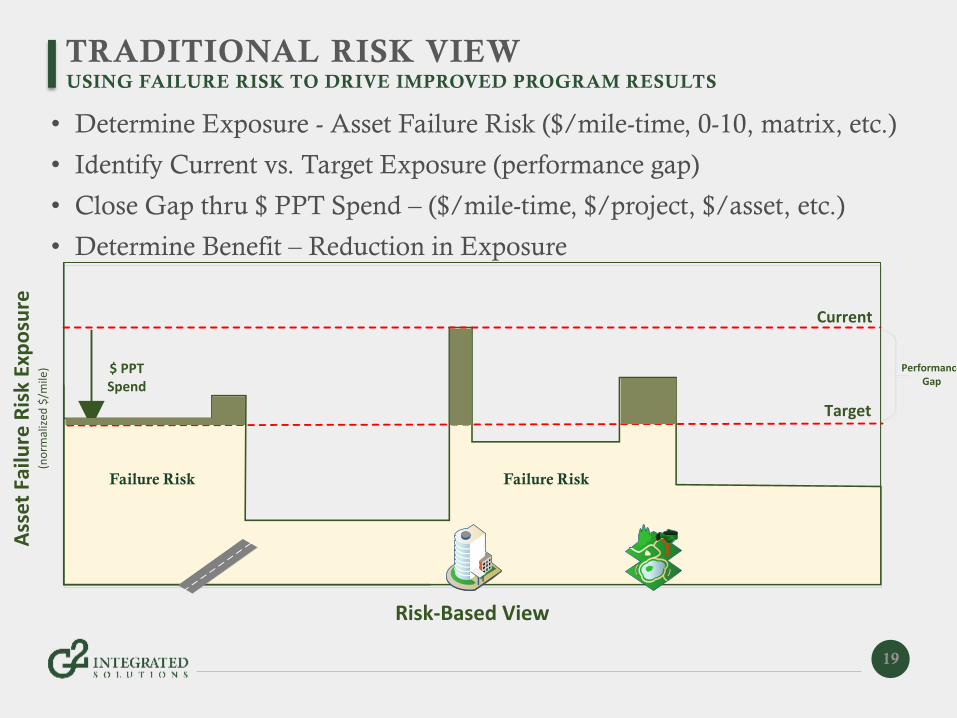
TRADITIONAL RISK VIEW
• Determine Exposure - Asset Failure Risk ($/mile-time, 0-10, matrix, etc.)
• Identify Current vs. Target Exposure (performance gap)
• Close Gap thru $ PPT Spend – ($/mile-time, $/project, $/asset, etc.)
• Determine Benefit – Reduction in Exposure
19
USING FAILURE RISK TO DRIVE IMPROVED PROGRAM RESULTS
Risk-Based View
Ass
et
Failu
re R
isk
Exp
osu
re(n
orm
aliz
ed $
/mile
)
Current
Target
PerformanceGap
$ PPTSpend
Failure Risk Failure Risk
A PROCESS BASED VIEW
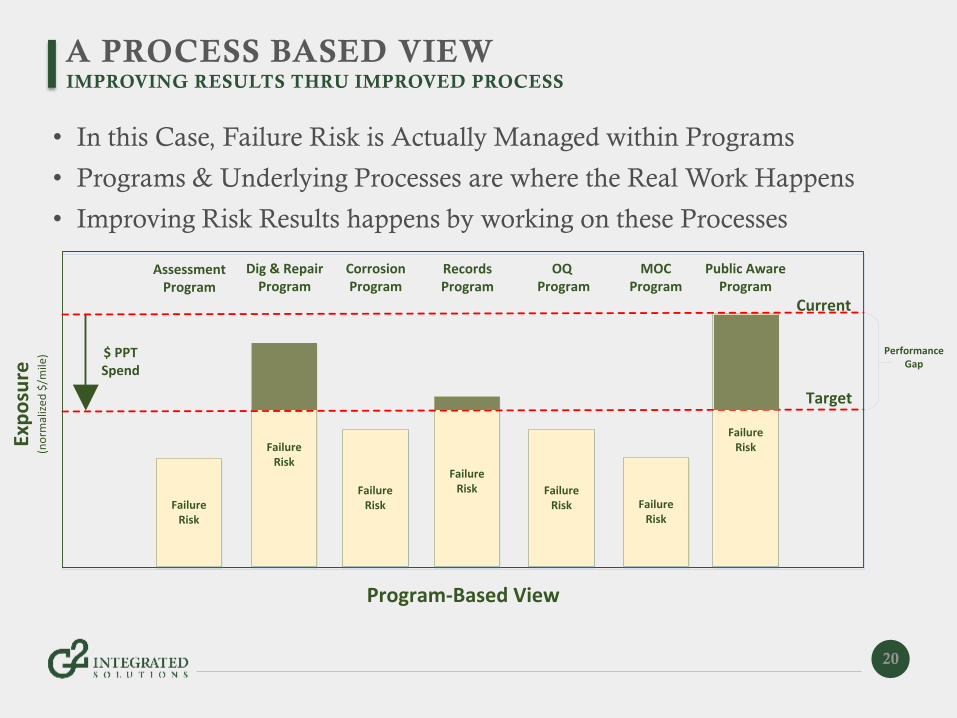
• In this Case, Failure Risk is Actually Managed within Programs
• Programs & Underlying Processes are where the Real Work Happens
• Improving Risk Results happens by working on these Processes
20
IMPROVING RESULTS THRU IMPROVED PROCESS
Program-Based View
Current
Target
Exp
osu
re(n
orm
aliz
ed $
/mile
) $ PPTSpend
Assessment Program
FailureRisk
Dig & Repair Program
FailureRisk
Corrosion Program
FailureRisk
Records Program
FailureRisk
OQ Program
FailureRisk
MOCProgram
FailureRisk
Public AwareProgram
FailureRisk
PerformanceGap
PROCESS BASED VIEW
21
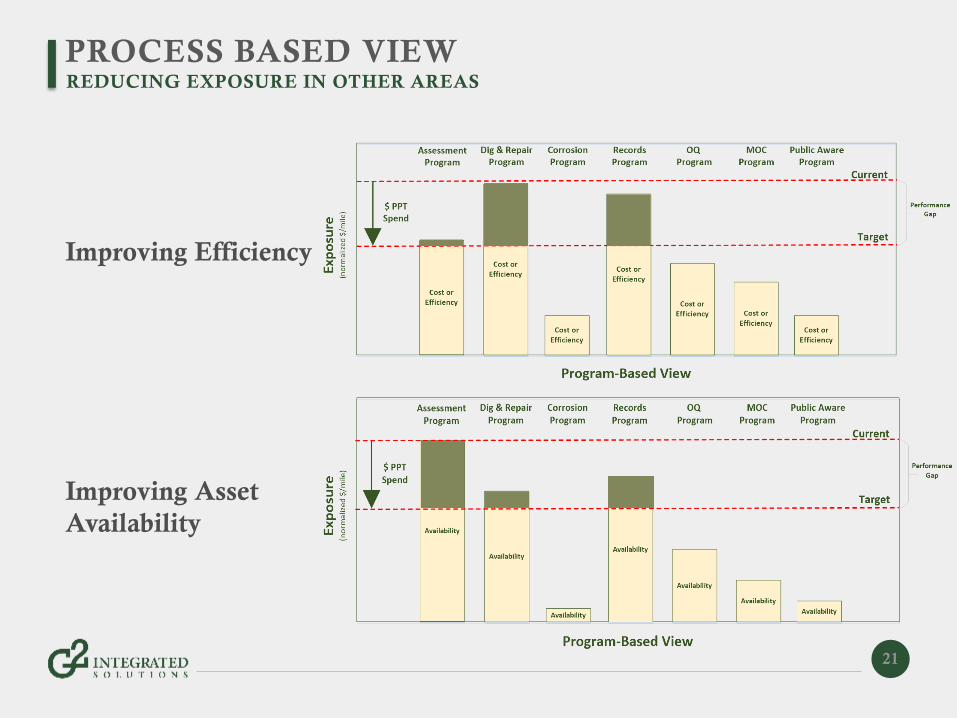
REDUCING EXPOSURE IN OTHER AREAS
Improving Efficiency
Improving Asset
Availability
A PROCESS BASED VIEW
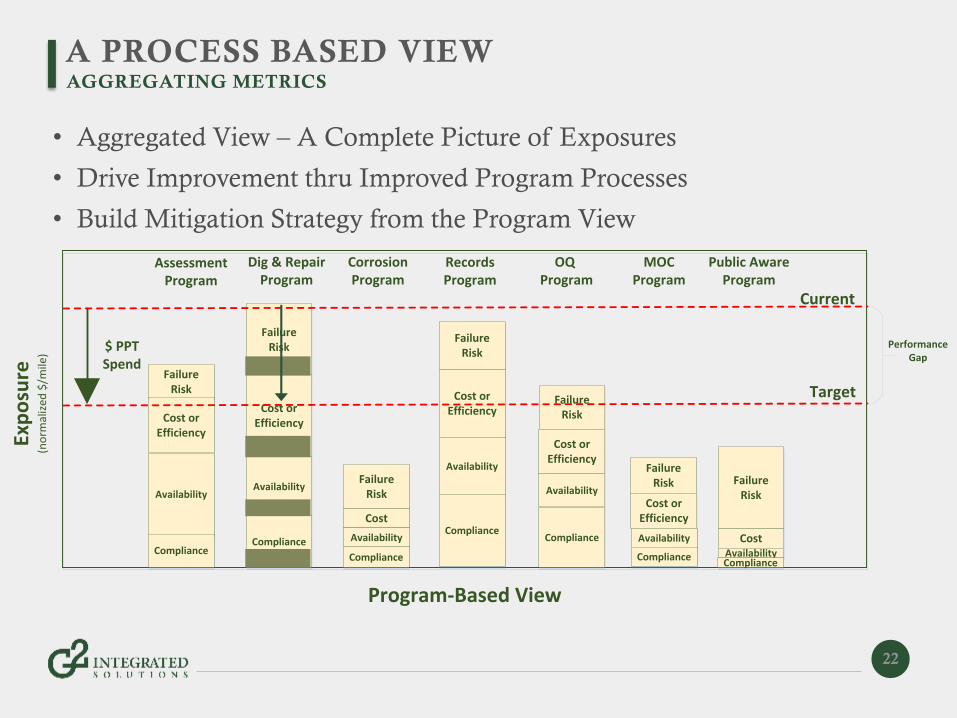
• Aggregated View – A Complete Picture of Exposures
• Drive Improvement thru Improved Program Processes
• Build Mitigation Strategy from the Program View
22
AGGREGATING METRICS
Program-Based View
Exp
osu
re(n
orm
aliz
ed $
/mile
)
FailureRisk
FailureRisk
FailureRisk
FailureRisk
FailureRisk
FailureRisk Failure
Risk
Cost or Efficiency
Cost or Efficiency
Cost
Cost or Efficiency
Cost or Efficiency
Cost or Efficiency
Cost
AvailabilityAvailability
Availability
Availability
Availability
Availability
AvailabilityComplianceCompliance
Compliance
ComplianceCompliance
ComplianceCompliance
Current
Target
$ PPTSpend
Assessment Program
Dig & Repair Program
Corrosion Program
Records Program
OQ Program
MOCProgram
Public AwareProgram
PerformanceGap
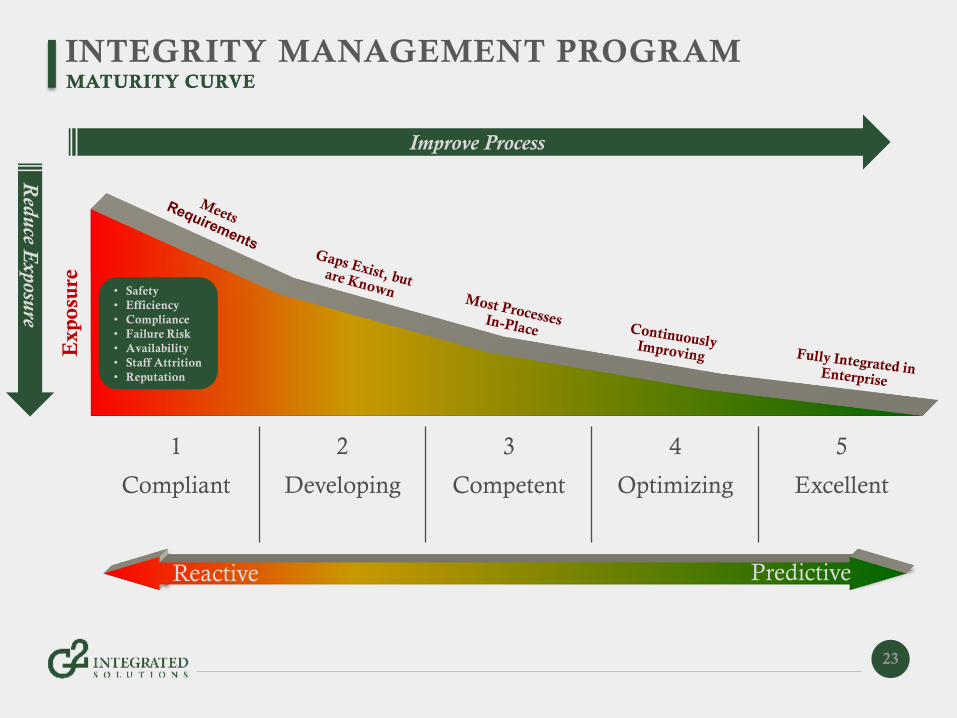
INTEGRITY MANAGEMENT PROGRAM
23
MATURITY CURVEMATURITY CURVE
Improve Process
Reactive Predictive
Red
uce E
xposu
re
1 2 3 4 5
Compliant Developing Competent Optimizing Excellent
• Safety
• Efficiency
• Compliance
• Failure Risk
• Availability
• Staff Attrition
• Reputation
THE PROCESS APPROACH
AN EXAMPLE
24
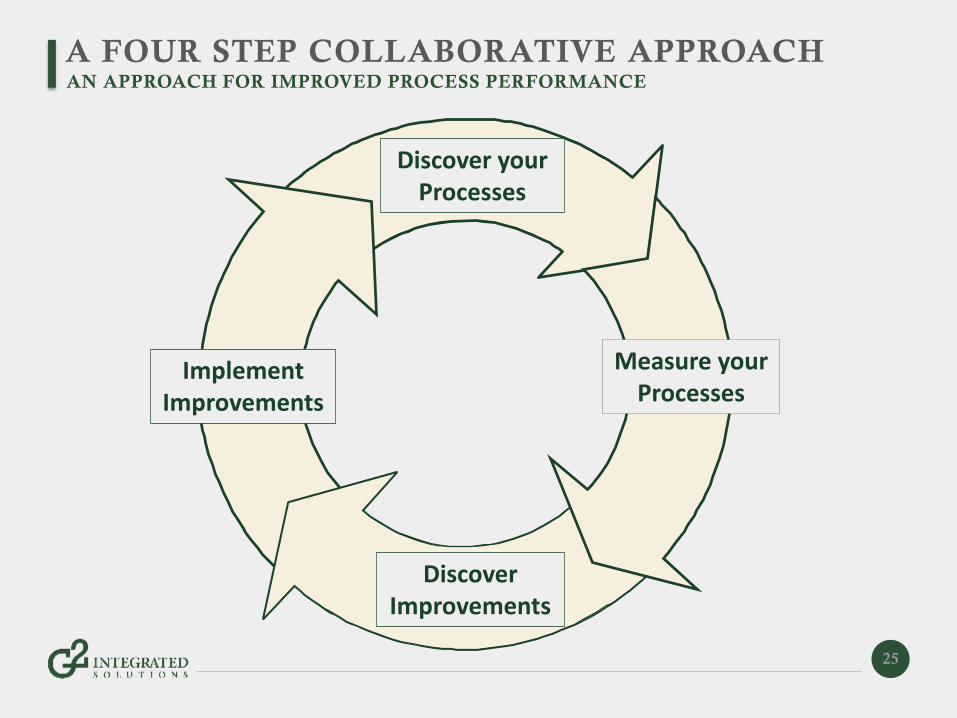
A FOUR STEP COLLABORATIVE APPROACH
25
AN APPROACH FOR IMPROVED PROCESS PERFORMANCE
Discover your Processes
Measure your Processes
Discover Improvements
Implement Improvements
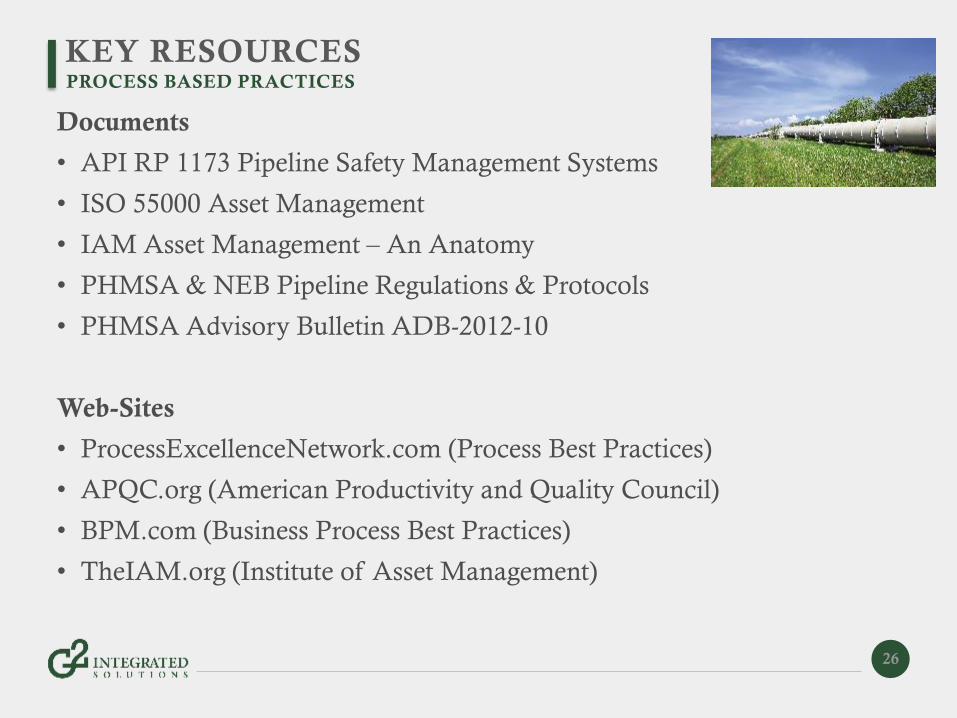
KEY RESOURCES
Documents
• API RP 1173 Pipeline Safety Management Systems
• ISO 55000 Asset Management
• IAM Asset Management – An Anatomy
• PHMSA & NEB Pipeline Regulations & Protocols
• PHMSA Advisory Bulletin ADB-2012-10
Web-Sites
• ProcessExcellenceNetwork.com (Process Best Practices)
• APQC.org (American Productivity and Quality Council)
• BPM.com (Business Process Best Practices)
• TheIAM.org (Institute of Asset Management)
26
PROCESS BASED PRACTICES
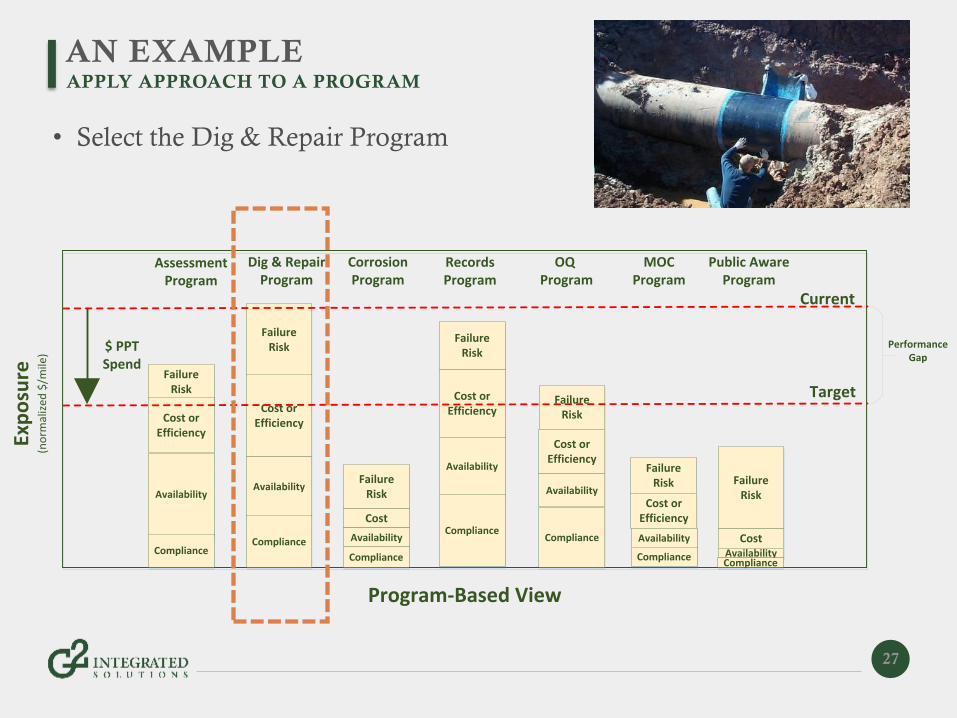
AN EXAMPLE
• Select the Dig & Repair Program
27
APPLY APPROACH TO A PROGRAM
Program-Based View
Exp
osu
re(n
orm
aliz
ed $
/mile
)
FailureRisk
FailureRisk
FailureRisk
FailureRisk
FailureRisk
FailureRisk Failure
Risk
Cost or Efficiency
Cost or Efficiency
Cost
Cost or Efficiency
Cost or Efficiency
Cost or Efficiency
Cost
AvailabilityAvailability
Availability
Availability
Availability
Availability
AvailabilityComplianceCompliance
Compliance
ComplianceCompliance
ComplianceCompliance
Current
Target
$ PPTSpend
Assessment Program
Dig & Repair Program
Corrosion Program
Records Program
OQ Program
MOCProgram
Public AwareProgram
PerformanceGap
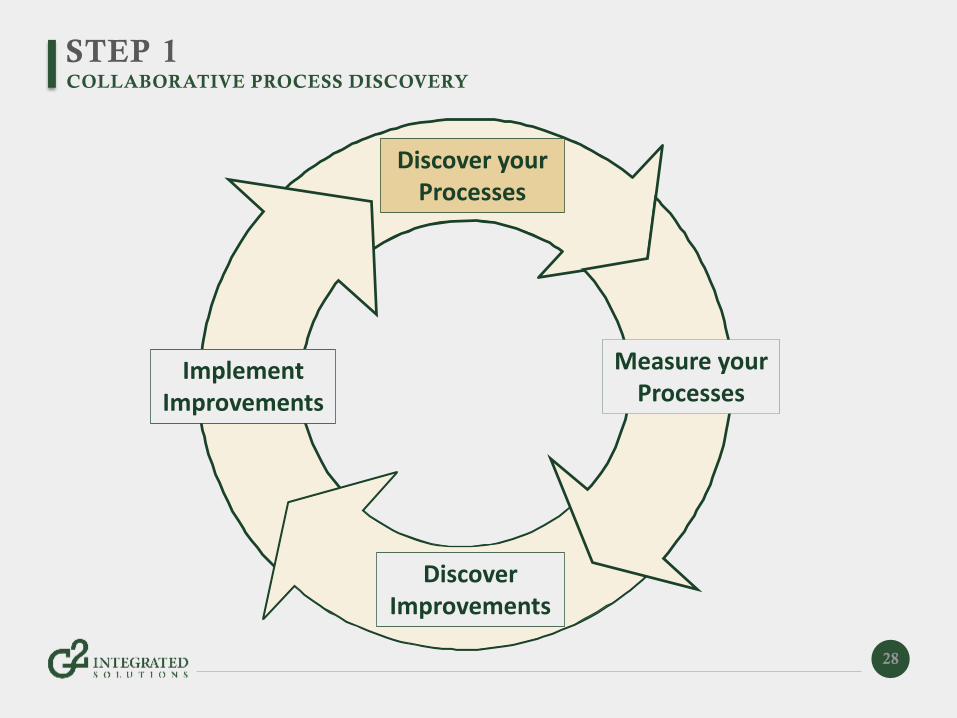
STEP 1
28
COLLABORATIVE PROCESS DISCOVERY
Discover your Processes
Measure your Processes
Discover Improvements
Implement Improvements
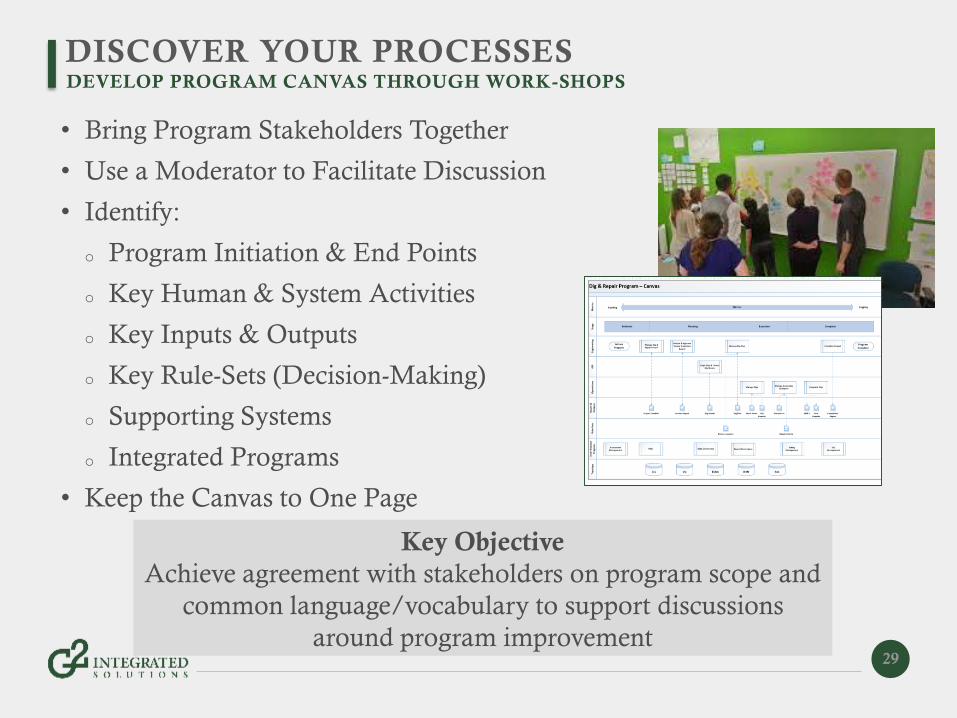
DISCOVER YOUR PROCESSES
• Bring Program Stakeholders Together
• Use a Moderator to Facilitate Discussion
• Identify:
o Program Initiation & End Points
o Key Human & System Activities
o Key Inputs & Outputs
o Key Rule-Sets (Decision-Making)
o Supporting Systems
o Integrated Programs
• Keep the Canvas to One Page
29
DEVELOP PROGRAM CANVAS THROUGH WORK-SHOPS
Key Objective
Achieve agreement with stakeholders on program scope and
common language/vocabulary to support discussions
around program improvement
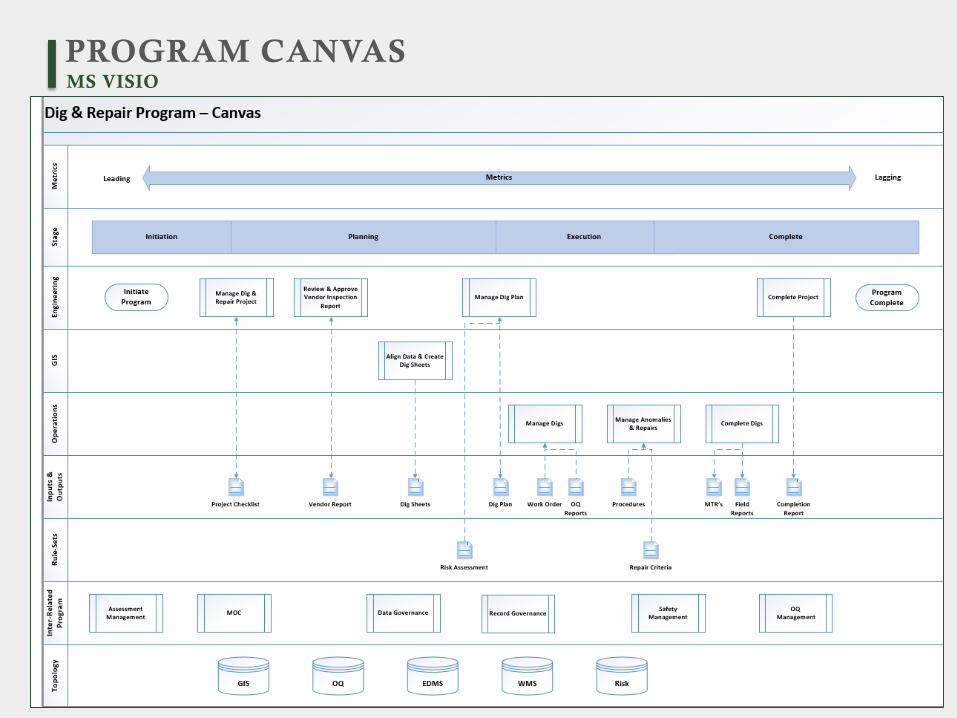
PROGRAM CANVAS
30
MS VISIO
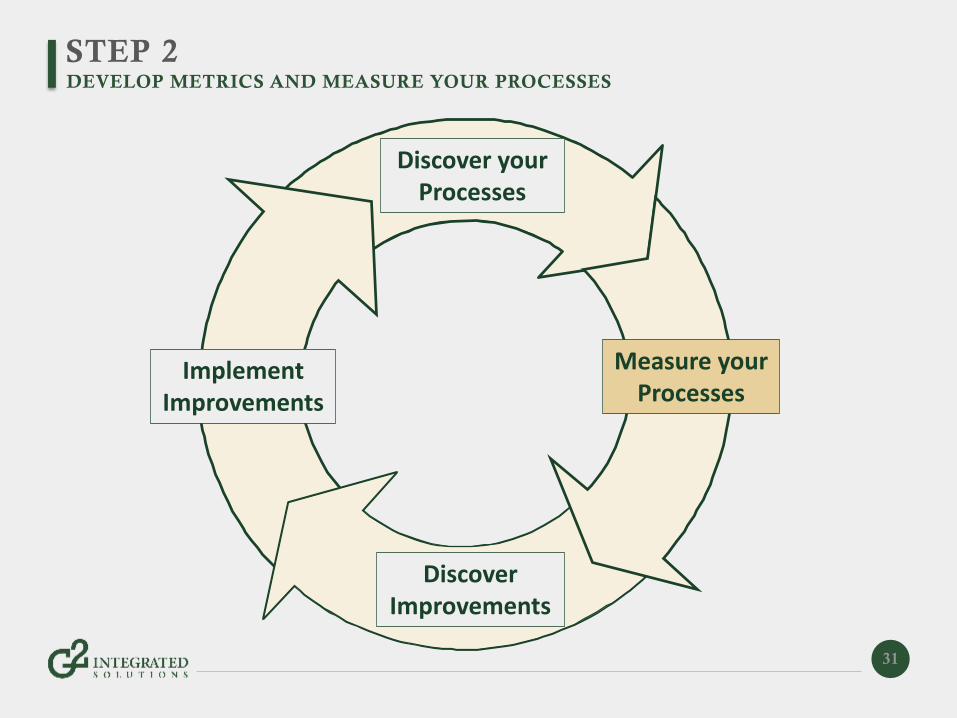
STEP 2
31
DEVELOP METRICS AND MEASURE YOUR PROCESSES
Discover your Processes
Measure your Processes
Discover Improvements
Implement Improvements
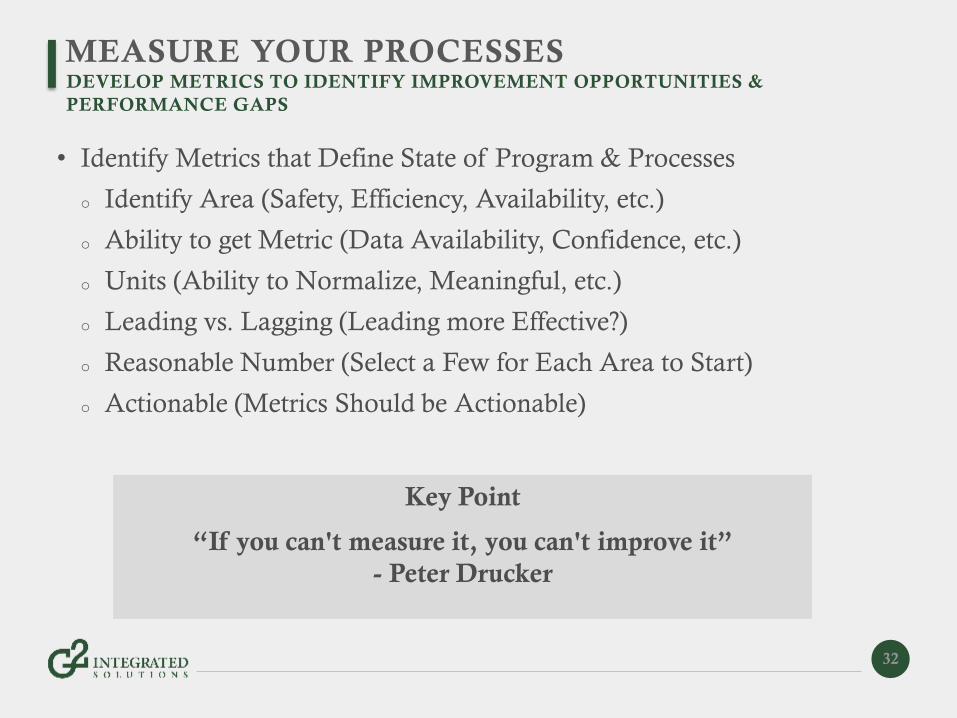
MEASURE YOUR PROCESSES
• Identify Metrics that Define State of Program & Processes
o Identify Area (Safety, Efficiency, Availability, etc.)
o Ability to get Metric (Data Availability, Confidence, etc.)
o Units (Ability to Normalize, Meaningful, etc.)
o Leading vs. Lagging (Leading more Effective?)
o Reasonable Number (Select a Few for Each Area to Start)
o Actionable (Metrics Should be Actionable)
32
DEVELOP METRICS TO IDENTIFY IMPROVEMENT OPPORTUNITIES &
PERFORMANCE GAPS
Key Point
“If you can't measure it, you can't improve it”
- Peter Drucker
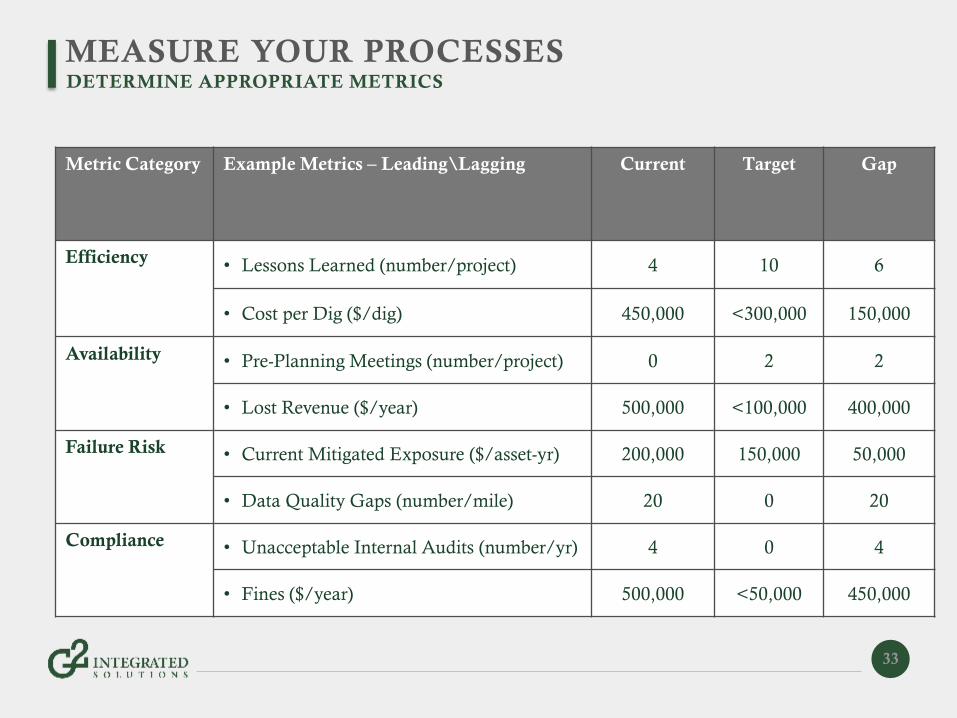
MEASURE YOUR PROCESSES
33
DETERMINE APPROPRIATE METRICS
Metric Category Example Metrics – Leading\Lagging Current Target Gap
Efficiency • Lessons Learned (number/project) 4 10 6
• Cost per Dig ($/dig) 450,000 <300,000 150,000
Availability • Pre-Planning Meetings (number/project) 0 2 2
• Lost Revenue ($/year) 500,000 <100,000 400,000
Failure Risk • Current Mitigated Exposure ($/asset-yr) 200,000 150,000 50,000
• Data Quality Gaps (number/mile) 20 0 20
Compliance • Unacceptable Internal Audits (number/yr) 4 0 4
• Fines ($/year) 500,000 <50,000 450,000
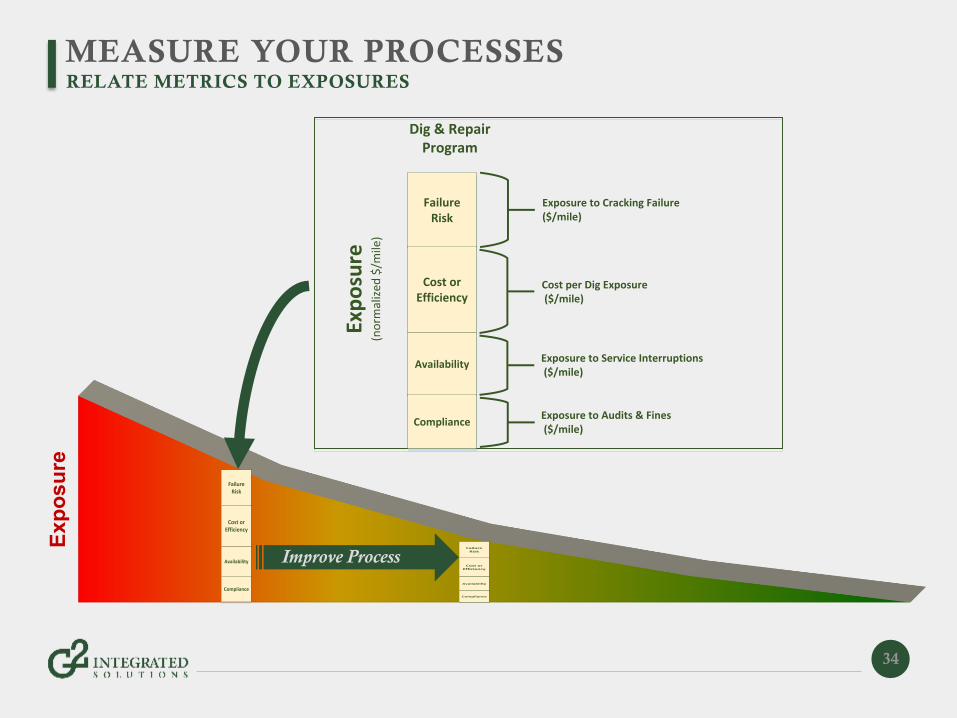
MEASURE YOUR PROCESSES
34
RELATE METRICS TO EXPOSURES
Exp
osu
re(n
orm
aliz
ed $
/mile
)
FailureRisk
Cost or Efficiency
Availability
Compliance
Dig & Repair Program
Exposure to Cracking Failure ($/mile)
Cost per Dig Exposure ($/mile)
Exposure to Service Interruptions ($/mile)
Exposure to Audits & Fines ($/mile)
Exp
osu
re(n
orm
aliz
ed
$/m
ile)
FailureRisk
Cost or Efficiency
Availability
Compliance
Dig & Repair Program
Exposure to Cracking Failure ($/mile)
Cost per Dig Exposure ($/mile)
Exposure to Service Interruptions ($/mile)
Exposure to Audits & Fines ($/mile)
Improve Process
Exposu
re(no
rmaliz
ed $/
mile)
FailureRisk
Cost or Efficiency
Availability
Compliance
Dig & Repair Program
Exposure to Cracking Failure ($/mile)
Cost per Dig Exposure ($/mile)
Exposure to Service Interruptions ($/mile)
Exposure to Audits & Fines ($/mile)
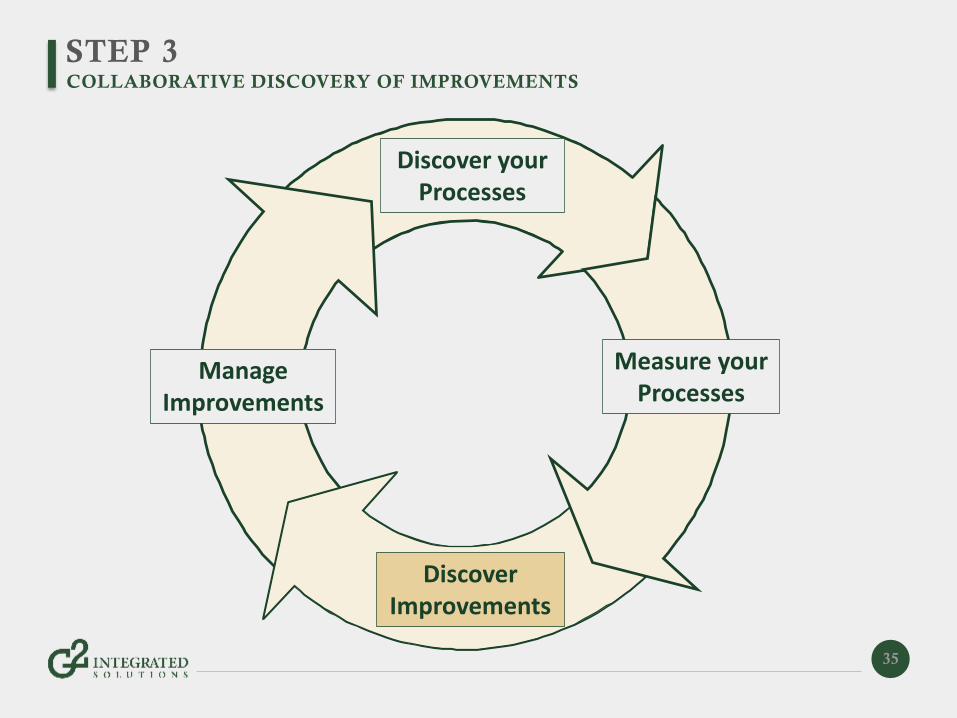
STEP 3
35
COLLABORATIVE DISCOVERY OF IMPROVEMENTS
Discover your Processes
Measure your Processes
Discover Improvements
Manage Improvements
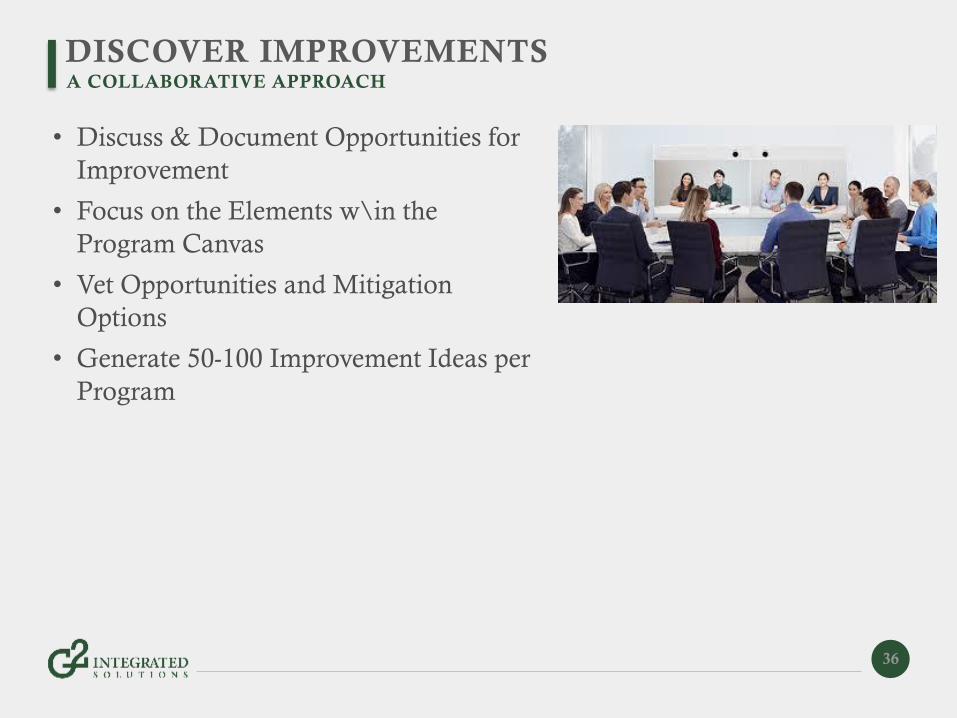
DISCOVER IMPROVEMENTS
• Discuss & Document Opportunities for
Improvement
• Focus on the Elements w\in the
Program Canvas
• Vet Opportunities and Mitigation
Options
• Generate 50-100 Improvement Ideas per
Program
36
A COLLABORATIVE APPROACH
DISCOVER IMPROVEMENTS
37
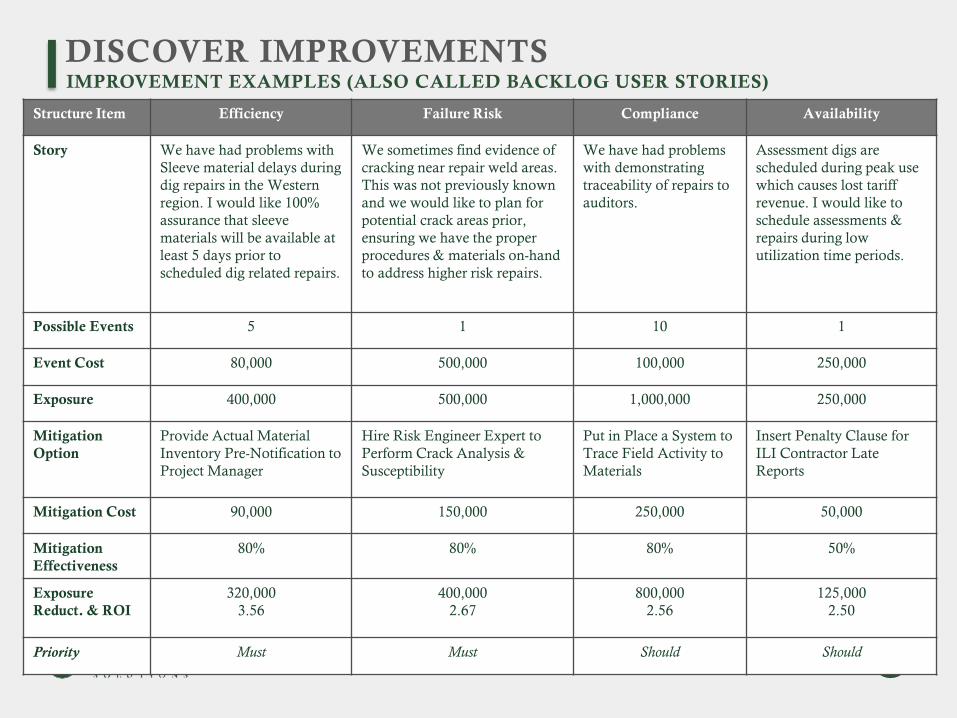
IMPROVEMENT EXAMPLES (ALSO CALLED BACKLOG USER STORIES)
Structure Item Efficiency Failure Risk Compliance Availability
Story We have had problems with
Sleeve material delays during
dig repairs in the Western
region. I would like 100%
assurance that sleeve
materials will be available at
least 5 days prior to
scheduled dig related repairs.
We sometimes find evidence of
cracking near repair weld areas.
This was not previously known
and we would like to plan for
potential crack areas prior,
ensuring we have the proper
procedures & materials on-hand
to address higher risk repairs.
We have had problems
with demonstrating
traceability of repairs to
auditors.
Assessment digs are
scheduled during peak use
which causes lost tariff
revenue. I would like to
schedule assessments &
repairs during low
utilization time periods.
Possible Events 5 1 10 1
Event Cost 80,000 500,000 100,000 250,000
Exposure 400,000 500,000 1,000,000 250,000
Mitigation
Option
Provide Actual Material
Inventory Pre-Notification to
Project Manager
Hire Risk Engineer Expert to
Perform Crack Analysis &
Susceptibility
Put in Place a System to
Trace Field Activity to
Materials
Insert Penalty Clause for
ILI Contractor Late
Reports
Mitigation Cost 90,000 150,000 250,000 50,000
Mitigation
Effectiveness
80% 80% 80% 50%
Exposure
Reduct. & ROI
320,000
3.56
400,000
2.67
800,000
2.56
125,000
2.50
Priority Must Must Should Should
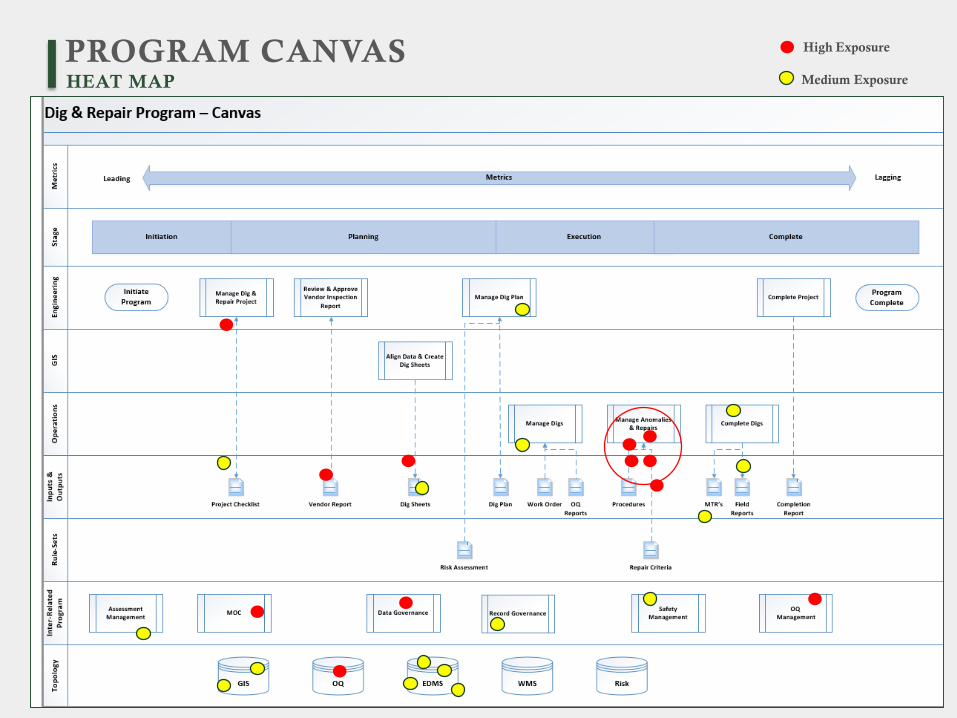
PROGRAM CANVAS
38
HEAT MAP
High Exposure
Medium Exposure
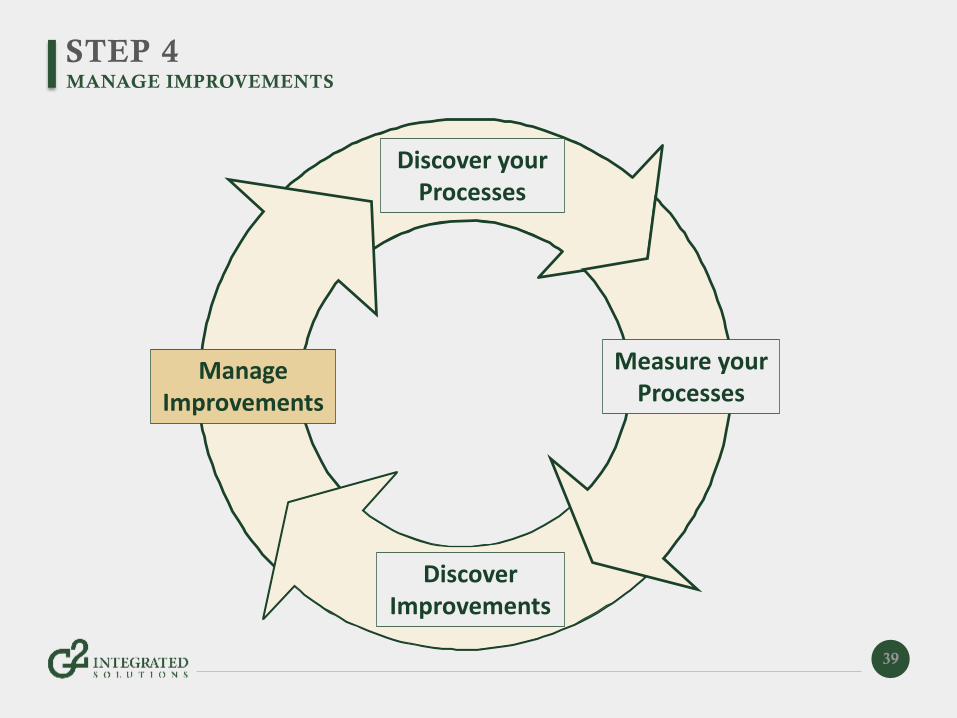
STEP 4
39
MANAGE IMPROVEMENTS
Discover your Processes
Measure your Processes
Discover Improvements
ManageImprovements
STEP 4
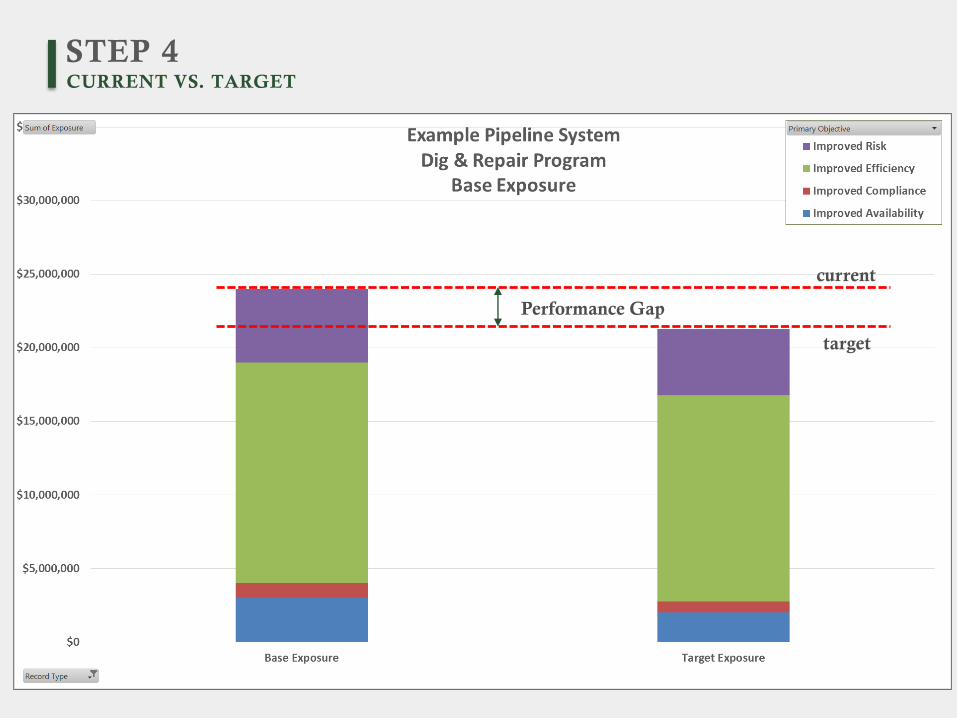
40
CURRENT VS. TARGET
current
target
Performance Gap
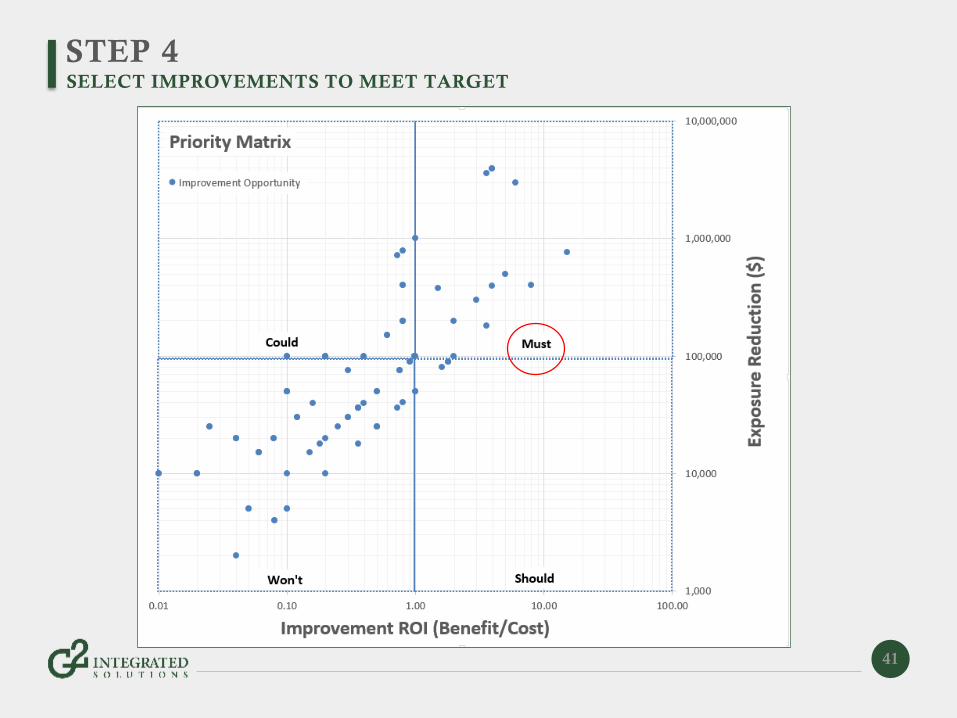
STEP 4
41
SELECT IMPROVEMENTS TO MEET TARGET
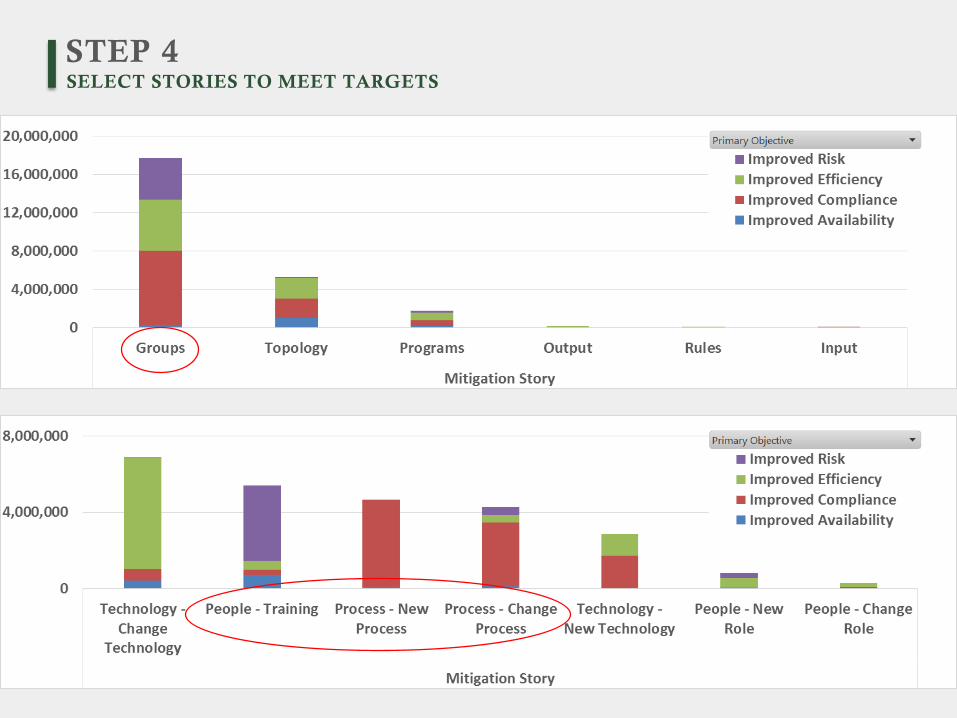
STEP 4
42
SELECT STORIES TO MEET TARGETS
STEP 4
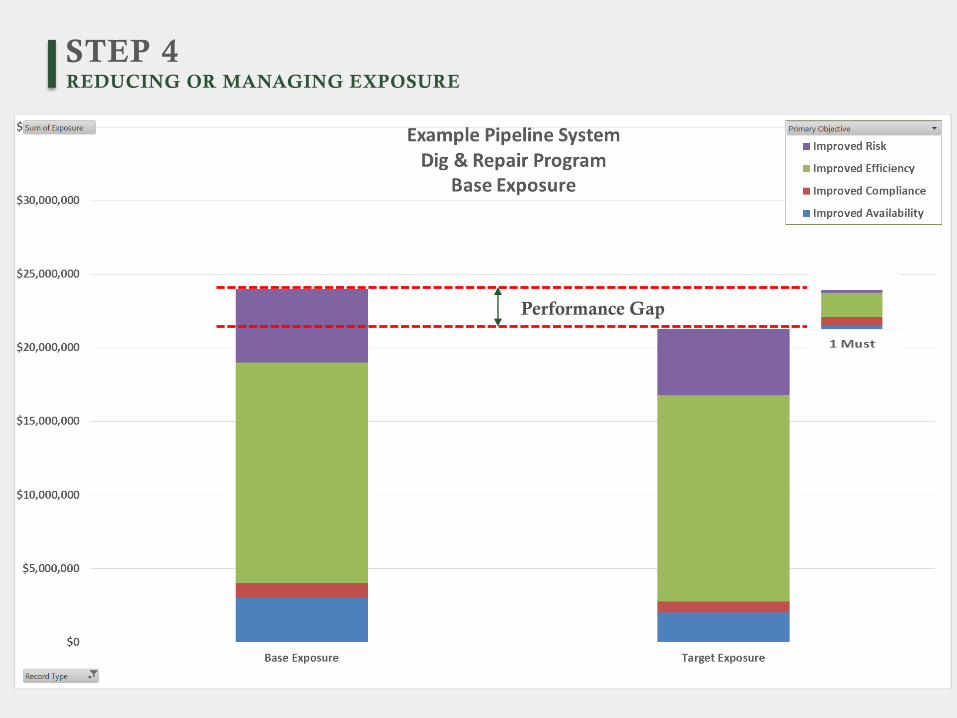
43
REDUCING OR MANAGING EXPOSURE
current
target
Performance Gap
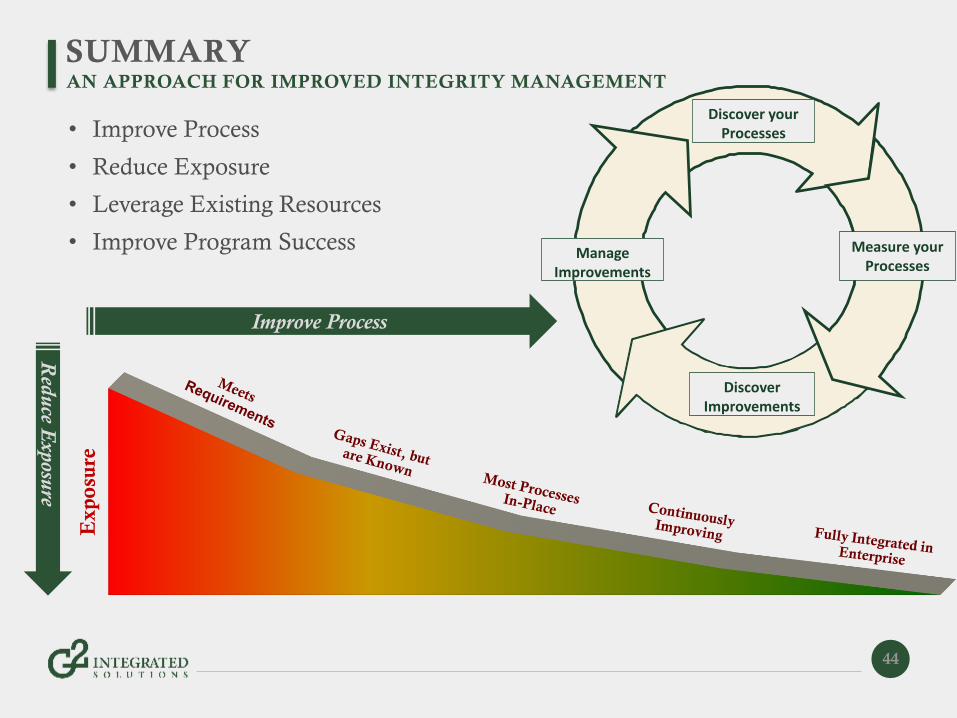
SUMMARY
44
AN APPROACH FOR IMPROVED INTEGRITY MANAGEMENT
Improve Process
Red
uce E
xposu
re
Discover your Processes
Measure your Processes
Discover Improvements
ManageImprovements
• Improve Process
• Reduce Exposure
• Leverage Existing Resources
• Improve Program Success
CONTACT INFORMATION
Presenter: Michael Gloven – [email protected]
Email: [email protected]
Phone: 713-260-4020
Website: www.g2-is.com
PARTICIPANT SURVEY & QUESTIONS