an integrated simulation of tsunami hazard and human...
TRANSCRIPT

An Integrated Simulation of Tsunami Hazard and Human Evacuationin La Punta, Peru
Paper:
An Integrated Simulation of Tsunami Hazard andHuman Evacuation in La Punta, Peru
Erick Mas, Bruno Adriano, and Shunichi KoshimuraLaboratory of Remote Sensing and Geoinformatics for Disaster Management,
International Research Institute of Disaster Science, Tohoku UniversityAoba 6-6-3, Sendai 980-8579, Japan
E-mail: [email protected][Received November 2, 2012; accepted December 27, 2012]
The 2011 Great East Japan earthquake and tsunamiwas a magnitude 9.0 Mw event that destroyed moststructural tsunami countermeasures. However, ap-proximately 90% of the estimated population at riskfrom the tsunami survived due to a rapid evacuation tohigher ground or inland. Thus, tsunami evacuation isthe most effective measure to reduce casualties. In thispaper, we applied a new developed evacuation modelintegrated with the numerical simulation of tsunamifor casualty estimation. This tool is to support deci-sions in disaster management and disaster preventioneducation. The model was developed in NetLogo,a multi-agent programming language and modelingenvironment for simulating complex phenomena. Ge-ographic Information Systems (GIS) datasets are usedas spatial input information for road and shelter lo-cations. The TUNAMI model of Tohoku University isused for the integration of tsunami numerical simula-tion results. In this paper, the study is performed in atsunami threatened urban area of Callao, Peru, calledLa Punta. Results show the various contributionsof the model to disaster management and scenarioanalysis. Among the contributions are the casualtyestimation in a tsunami risk area and the analysis ofthe spatial distribution of vertical evacuation shelters.
Keywords: tsunami simulation, evacuation simulation,tsunami hazard, human casualty
1. Introduction
It is expected that authorities in low-lying coastal areasat high risk of tsunami promote immediate evacuationafter strong ground motion or when warnings are issued.In tsunami prone areas with only a short time available forevacuation, finding safety on high ground is an importantissue and especially difficult in flat plains areas. Thedevelopment of effective warning systems and evacuationstrategies is of primary importance in mitigation mea-sures for tsunami events [1, 2]. Also, simulation plays adecisive role in the analysis of risk, helping to preventdangerous situations in huge crowds and improving theoverall evacuation performance [3] in contribution to
disaster management. It is the purpose of this research toexplore the human behavior and the evacuation simulationand the integration with the well-known technique oftsunami simulation for a comprehensive assessment oftsunami risk.
1.1. Evacuation Simulation ModelsThere is a large number of evacuation models in pre-
vious studies. Models such as those related to buildingevacuation due to fire events [4–8], evacuation fromships [9] and aircraft [10] and also models to simulate traf-fic and regional evacuation in case of hurricanes, nuclearaccidents and floods [11–13]. These and others [14, 15],were consulted to comprehend the state of the art in thefield of pedestrian dynamics and traffic simulation. As aresult, it was observed that there is increasing interest inmicroscopic and individual simulation of complex events.There is also a need for realistic and effective tools tosimulate human behavior and the several phenomena andrisks that threaten human safety.
A brief review of the most recent tsunami evacuationmodels is as follows:
• [16] The model uses multi agent systems moving ona road network map and following predefined rules.Some assumptions in this model are that (i) agentsfollow the shortest paths through a linked network.Short in terms of distance for pedestrians and timefor vehicles. (ii) fast evacuees pass slower ones whenspace is available, and (iii) vehicle speed depends onroad width. For this model, the model unit agentis the family (4 persons). Three kinds of agentsare shown, i.e., the family walking, the family in acar, and 2 members of the family on a motorcycle.Tsunami casualties are counted when inundationdepth exceeds 1.00 m at the actual location of anagent. In this case, there is a limitation on therepresentation of individual behavior and outcomefor each evacuee.
• [17] In this model, Multi-Agent Transport Simula-tion (MATSim) is used as the toolbox for the imple-mentation of large-scale agent based simulation. The
Journal of Disaster Research Vol.8 No.2, 2013 285

Mas, E., Adriano, B., and Koshimura, S.
purpose of this model is to find the best evacuationcondition that benefits all agents. The set of repeti-tions and iterative learning framework lead to Nashequilibrium as the best approximation of the desiredevacuation. Some of the findings in this study arethat (i) the shortest path solution is not suitable forevacuation planning because it does not considercongestion effects and underestimates travel times;and (ii) Nash equilibrium considers these congestioneffects but does not take into account the time-dependent aspect of the hazard.
• [18] The authors present a tsunami evacuation modelbased on a multi agent system approach. Eachevacuee is an agent with the characteristics of age,speed, fatigue level and disaster mitigation aware-ness. Interaction of these data with the environ-ment describes the evacuation behavior. The modelconsiders only agents as pedestrians and there is novehicle simulation for traffic conditions. Evacuationstart time is also strictly based on questionnaire data.Departure times are based on situational conditionsthat trigger protective action.
• [1] other tsunami related models developed a statictsunami evacuation model using GIS tools in order toinvestigate and assess risk and evacuation planningin a multilingual society. Using multi agent simula-tion, [19] aims at understanding human behavior andits interaction effects in a tsunami disaster.
Among these models, there are several differencesrelated to representation of the unit of simulation – theagent – and its characteristics such as evacuation start timedecision, route choice, mobilization means, shelter selec-tion and rules for avoiding obstacles. While some of themdo not consider the vehicle agent in simulation, under-estimating possible crowding and bottleneck conditions,others use a simplistic method of casualty estimationby stopping simulation at the estimated tsunami arrivaltime and categorizing all remaining agents as possiblecasualties. In this study, a casualty is understood as anindividual trapped in a tsunami with very little chancefor survive at the inundation depth and flow velocity.Therefore, integration of a more realistic condition ofthe probability of becoming a casualty related to tsunamicharacteristics will be applied here.
With evacuation simulation models, it is possible toanalyze alternatives for safer routes, destinations, evacueeresponse and other possible decisions for disaster mitiga-tion in an area [20, 21]. Emergency evacuation modelsmay be classified at first on: (i) large-scale scenarios,e.g. hurricanes, nuclear power plants, tsunami, etc. and(ii) small-scale evacuation of buildings or vessels due tobomb threats, fire, etc. Traditionally, large-scale scenarioswere modeled following a macroscopic approach withvehicular evacuation. In macroscopic models the flowor group of individuals on the move is the smallest unitsimulated. In recent years, researchers are focusing onthe microscopic simulation of individuals. Here, an agent
or individual is the smallest unit simulated. Although it isthe individual who is the main element during the developstage, final attention lies on the overall emergent behaviorof agents interaction. This is possible due to the fastdevelopment of computing capacity in memory processes,graphic rendering and data storage. Here, the model isdeveloped for a large-scale scenario, however consideringthe microscopic level through an agent based simulationapproach.
1.2. Agent Based ModelingModels are used to gain understanding of and insight
into aspects of the real world. In several cases, thecost of developing and experimenting with models issmall compared to the cost of experimenting in the realworld [22]. In the case of tsunami evacuation drills, forinstance, the society or community involved is requiredto stop its daily activities and move along the streets tosafe areas. Evacuation sometimes lasts for long distancesand time, creating unpleasant feelings in residents andtourists. The level of participation is rarely near 100%of the population. It is therefore, difficult to repeat theexercise very often [21]. However, local stakeholders andauthorities need to test the feasibility of their evacuationplans and the possible flaws related to it. For thatreason, modeling techniques help on the understanding ofsystems which are difficult to observe in the real world.
Agent-based modeling and simulation (ABMS) is arelatively new technique to model systems comprisedof autonomous and interacting agents [23]. Each agentindividually assesses its situation and makes decisionson the basis of a set of rules. Various behaviors canbe given to the agent for the individual decision-makingprocess or the interaction with the environment and otheragents. The main advantage of ABMS is that it capturesthe emergent phenomena from the bottom up by modelingagents interaction and behavior. Based on this, ABMSmodels are suitable for evacuation simulation that consid-ers aspects of human behavior. Although pedestrians, andin general drivers, usually try to walk or drive minimizingdetours or taking the optimal path to their targets, thereare fluctuations in human behavior. Therefore, simulationresults are to some extent uncertain. However, if thesimulated crowd is large enough and the simulation runis repeated several times (Monte Carlo simulation), thenuncertainty about individual behavior averages out at themacroscopic level of description [3].
1.3. Human Behavior in Tsunami EvacuationTsunami evacuation is a way of coping with an emer-
gency and the key to successful evacuation is being ableto move all people at risk to safer areas in the timeavailable [24, 25]. Early Warning Systems (EWS) havebeen developed to contribute promoting fast evacuationwhen a tsunami happens. Even after great improvementsin EWS tsunami technology, some people still decidenot to evacuate from an area threatened by a dangeroussituation such as a tsunami [26–30]. Therefore, it is
286 Journal of Disaster Research Vol.8 No.2, 2013

An Integrated Simulation of Tsunami Hazard and Human Evacuationin La Punta, Peru
important to look not only into available technology andways to improve it, but to look at the people involved andtheir behavior and decisions. Warning is only one elementand not necessarily the most important in evacuationbehavior [25].
When we look into the individual, we may find thathuman behavior is the most complex and difficult aspectof the evacuation process to simulate [5]. Human behav-ior includes complex problem solving [31] and individualcharacteristics with both aspects difficult to capture inmathematical equations [32]. In several attempts withmodels, human behavior in evacuation is observed and thesimplification of these individuals and their emergent be-havior has been considered to explain a part of the wholephenomenon. For example, herding effects generallyoccur if the view is limited, e.g. by smoke, darkness of thenight, etc., or if people do not have local knowledge, e.g.they do not know where emergency exits or shelters are.Under such circumstances people often rely on others,hoping that they know better [3]. Another example isthe phenomenon of lane formation that is observed whena uniform walking direction emerges instead of walkingequally distributed over sidewalks or corridors. Thisway, the number of encounters, braking and avoidancemaneuvers among opposite direction pedestrians in coun-terflows are minimized. The resulting pattern is balancedin both directions and may be considered an optimal self-organization phenomenon [3].
Human behavior in tsunami evacuations has been stud-ied through questionnaires on natural hazard risk per-ception [24, 33, 34] or post tsunami surveys addressingrespondent behavior in a tsunami event [27, 29, 30, 35].
2. Integrated Simulator
An outline of Fig. 1 shows a scheme of the model.It consists of input data provided by spatial data inGIS format, human data related to evacuee preferencesobtained from questionnaire results, the component ofhazard is provided by TUNAMI inundation model output,and a set of agent behavior rules loaded into an agent-based simulation platform. The platform chosen in thisstudy is the NetLogo modeling environment [36]. Outputsof casualty estimation, evacuation times, bottlenecks,shelter demand, etc. are obtained through report files,and snapshots or videos of the simulation process. Themodel is named TUNAMI-EVAC1 an acronym for TohokuUniversity Numerical Analysis Model for Investigationof Evacuation No.1. A screen snapshot of the modelinterface is shown in Fig. 2.
We provided agents with the minimum necessary ca-pability to process information and execute evacuationthrough simple behavior divided into layers. A briefintroduction to the agent architecture and each layer is asfollows:
• Layer 0, evacuation decision: The timing for start-ing evacuation is assigned randomly to each agent
Fig. 1. Model scheme – Inputs, libraries and hazardcharacteristics are used in the NetLogo platform to obtainthe screen and report outputs.
Fig. 2. Model interface – GUI of TUNAMI-EVAC1 withscenario variables and parameter inputs on the left, updatescreen on the center and real-time outputs on the right side.
based on tsunami departure curves that models starttime behavior through the stochastic simulation ofrandom selected time bound by two Rayleigh dis-tributions. The first curve is obtained from thedistribution of the start time of evacuation decisioncollected with a stated preference survey, and thesecond is based on Rayleigh distribution with a meanequal to the estimated tsunami arrival time obtainedfrom numerical simulation.
• Layer 1, shelter decision: There are two possibleoptions for scenario exploration: first, the nearestshelter is selected by an agent based on direct Eu-clidean distance measure and, second, any sheltercan be selected randomly. Traditionally, the nearestshelter condition has been applied. In many cases,however, preferences are not for the nearest shelter.
• Layer 2, route decision and path finding: The methodused for finding a route – not necessary the shortest– is the A* (A star) algorithm with heuristics ingrid space. This is the most popular graph searchalgorithm used in the video game industry [37].
• Layer 3, speed adjustment: Speed variation is as-sumed to be a one-tail normal distribution of evacueedensity in the agent field of view, with a maxi-mum value of 1.33 m/s for pedestrians and 30 km/h(8.33 m/s) for cars [3, 38].
Journal of Disaster Research Vol.8 No.2, 2013 287

Mas, E., Adriano, B., and Koshimura, S.
3. Tsunami Hazard and Human Evacuation atLa Punta, Peru
Finding shelter during a tsunami emergency in flatplains areas with a fast wave arrival time is a challengingtask. Vertical evacuation to high buildings rising abovethe expected inundation depth is one of the most suitablealternatives for this kind of urban district. However, ifspatial distribution combined with the available capacityof these structures are not well displayed, over-demandand under-demand conditions will be observed amongthem. In this section, we conduct the numerical simu-lation of a possible great earthquake in Peru similar tothe historical 1746 earthquake. The resulting tsunamipropagation inland is integrated with a multi agent modelof human evacuation. Using stochastic simulation ofthe initial spatial distribution of residents and evacuationbehavior start time, we evaluated the capacity-demandrelation at each official tsunami evacuation building inthe La Punta district of Callao in Peru. The capacity-demand index (CDI) is introduced as a way of mappingand identifying areas for mitigation action supporting theevacuation process of a population at risk of a tsunami.
3.1. Study Area: La Punta, Peru3.1.1. Historical Tsunami near La Punta
La Punta is part of the constitutional province of Callao,in central Peru (Fig. 3), and one of six districts in the firstnational port city of Callao. La Punta, a peninsula in thewestern part of the province, is almost entirely surroundedby the Pacific Ocean except on its northeastern side,where it is bordered by downtown Callao. It is one ofthe smallest districts in Peru, with 4,370 inhabitants [39]and a total land area of 0.75 km2. Major earthquakeand tsunami risks are present in this area, due to its lowaltitude topography, which is a maximum 3 m, and itsgeographic characteristics as a peninsula with a wide headon the sea and a narrow neck connected to the inland.Evacuation procedures and feasibility are of interest forthe safety of La Punta residents and visitors. La Punta hasbeen adversely affected by several historical earthquakesand tsunamis, such as the July 9 1586 earthquake witha magnitude of 8.6 and a local tsunami height of some5 m [40]. Another two earthquakes on October 20 and 211687, with magnitudes 8.0 and 8.4, respectively, struckthis area. The first one generated a local 5 m to 10 mtsunami. The second may have been located in southernareas [40]. One of the most memorable earthquakes in theCallao region is the great earthquake of October 28 1746,with a magnitude 8.0 to 8.6 that completely destroyedsome central Peruvian coastal cities. A tsunami 15 mto 20 m in height resulting from this earthquake arrivedhalf an hour after ground shaking and washed Callaocity away in a 24 m run-up, killing 90% of the city’spopulation [41]. Two centuries later, the Peruvian centralcoast experienced more activity on May 24 1940, witha local earthquake and tsunami of 3 m in height. AnOctober 3 1974 event in Peru’s capital Lima had a
Fig. 3. La Punta district – Location of the study area of LaPunta of the Callao province in Peru.
magnitude of 8.0 and a local tsunami height of 1.6 m [42,43]. Since then, no large seismic activity has beenreported in the Callao area. A possible seismic gap mightbe located in this area, threatening La Punta and othercoastal cities with future large earthquakes and tsunamis.
3.1.2. Tsunami Evacuation BuildingsThere are 19 official evacuation buildings in La Punta
district and a 20th building located immediately outside ofthe district in Callao province (Fig. 4).
3.1.3. PopulationThe population by age according to the 2007 cen-
sus [39] is shown in Fig. 5. We have considered 4 groupsof agent types based on the age interval. Fig. 5 showsthe limit of each age interval in a vertical line. Children– kids in the figure – are considered to be from 1 to 11years old; teenagers – teens in the figure – from 12 to17, the main group of adults – adults in the figure – from18 to 59, and the last group of pedestrians are personsover 60 years old – elders in the figure. Table 1 showsthe number of people in each group or agent type forthe three scenarios simulated – horizontal, vertical, andhorizontal and vertical. In all cases a 15% of pedestriansare considered to be handicapped, following the censusdata.
3.2. Tsunami Numerical Simulation3.2.1. Tsunami Source
Instantaneous displacement of the sea surface iden-tical to vertical sea floor displacement is assumed inthe tsunami source model. The source consist of 280
288 Journal of Disaster Research Vol.8 No.2, 2013

An Integrated Simulation of Tsunami Hazard and Human Evacuationin La Punta, Peru
Fig. 4. Tsunami Evacuation Buildings (TEBs) in La Punta,Callao, Peru – The map shows the spatial distribution ofTEBs.
Fig. 5. Population by age – Age distribution in La Puntaand four groups of agent type for simulation.
subfaults of 20× 20 km each, proposed by [44] in theoffshore zone of Lima. The tsunami simulation source isthe result of a slip deficit rate with an interseismic periodof 265 years since the 1746 historical earthquake in Peru(Fig. 6).
3.2.2. Numerical ModelingTohoku University’s Numerical Analysis Model for
Investigation of Near-field tsunamis (TUNAMI) was usedas the tsunami modeling tool [45]. A set of nonlinearshallow water equations is discretized by the staggeredleapfrog finite difference scheme. The bottom frictioncondition is in the form of Manning’s formula constantin the whole domain.
Table 1. Number of agents by type in scenarios andmaximum speed value allowed during simulation.
Type Horizontal Vertical Horizontal and Vertical Max. speed (m/s)Kids 514 514 514 1.06Teens 377 377 377 1.33Adults 1678 2428 1678 1.33Elders 901 1051 901 0.93Cars 225 - 225 8.40
(*)Units: persons
Fig. 6. Tsunami source – Slip distribution for a possibleearthquake similar to the 1746 Peru Earthquake. There are280 sub-faults of 20×20 km [44].
3.3. Evacuation SimulationWe used TUNAMI-EVAC1 [46] to observe tsunami
inundation together with resident’s evacuation behavior.The model was developed in NetLogo, a multi-agentprogramming language and modeling environment forsimulating complex phenomena [47]. As mentionedabove, the population modeled was categorized into fourgroups by age. The main difference in these groupsor agent types is the maximum possible speed duringevacuation. Table 1 shows that Teens and Adults canreach 1.33 m/s [3].
Other types are assumed to have a speed reduction of0.80 for Kids and 0.70 for Elders. Handicapped agentshave an additional 0.50 speed reduction. In the case ofcars, the maximum speed is 30 km/h (8.40 m/s) [38].Speed varies as a half-tail normal distribution of densityin the agent field of view of a 60-degree cone with a 5 mdistance for pedestrians and 10 m for cars.
3.3.1. Cases for SimulationFor better comprehension of the necessity of tsunami
evacuation buildings, we ran a case for horizontal evacu-ation alone with no use of tsunami evacuation buildings(TEBs). Next, as the main target of this section, theevaluation of the spatial distribution of TEBs is conductedfor the vertical evacuation only case and a combinedcase of horizontal evacuation and vertical evacuation,possibly the most probable scenario in a real emergency.
Journal of Disaster Research Vol.8 No.2, 2013 289

Mas, E., Adriano, B., and Koshimura, S.
Fig. 7. Location of shelter and exits – TEBs (circles) andexits (triangles).
A detailed description of assumptions and constraints foreach case is as follows:
1 Horizontal evacuation: In this case, pedestrians andcars are set to choose one of two possible exits outof the district – two streets leading northeast of thedistrict (Fig. 7 – triangles).
2 Vertical evacuation: Here, the total of 20 availableTEBs is considered for shelter (Fig. 7 – circles).Evacuees – pedestrians alone – choose the shelternearest to their location regardless of the sheltercapacity or condition. Thus, if the structure is fullof evacuees related to its real capacity, evacuees arestill allowed to enter the building. The reason for thisdecision is to observe over-demand for certain struc-tures during the time of evacuation before the arrivalof a tsunami. Further behavior can be considered infuture evaluation, i.e. changing a shelter decisiondue to overcrowding of structures or selecting ashelter based not only on distance but capacity. Suchbehavior, however, despite any underlying rational-ity may not occur in a real emergency. We, therefore,leave these other conditions for future assessmentand discussion.
3 Horizontal and vertical evacuation: The horizontaland vertical case is a combination of the two previ-ously mentioned scenarios. In this case, pedestriansand cars are both considered. Possible shelter orescape points are the union of all points previouslyshown and detailed in Fig. 7.
3.3.2. Start Time of EvacuationIn all cases, the start time condition of pedestrians
and cars follows the tsunami departure curve methodproposed in [48]. A tsunami departure curve is a set ofpossible departure behavior among residents bound bytwo distributions of behavior obtained by questionnaireand numerical tsunami simulation (Fig. 8).
Fig. 8. Tsunami Departure Curves – Behavior of starttime is obtained through the stochastic simulation of randomselected times bound by these two distributions. The dashedcurve is obtained from a pre-tsunami questionnaire surveywith residents estimation of decision time for evacuation.The second curve is the Rayleigh distribution function withmean of the distribution equal to the estimated arrival timeof tsunami obtained through numerical simulation.
In the case of La Punta, two pre tsunami or statedpreference surveys were conducted in 2010 and 2011 inwhich we asked the following question to people who willevacuate in the case of an earthquake: “In the case of anear-field tsunami, how many minutes would you take todecide and prepare yourself for evacuation? (From theend of the earthquake to the beginning of your evacuationto a safe place).” Answers were given on multiple optionsin minutes intervals. Answers fit with the Rayleighdistribution obtaining a mean of distribution of 7 min – afast evacuation compared to the expected tsunami arrivaltime of 20 min. Due to the lack of a post tsunami orrevealed preference survey, a good approximation of theslow evacuation condition is related to a Rayleigh mean ofdistribution value equal to the expected arrival time of thetsunami (20 min) [48]. Finally, distributions characterizedby a mean of 7 min and 20 min became the boundaryof stochastic simulation of several departure curves fortsunami evacuation.
3.4. Results and Discussion3.4.1. Casualty Estimation
The initial condition of residents is difficult to simulatein evacuation procedures due to the uncertainty of thetime and date of a possible real event. In a nighttimescenario, it might be reasonable to initialize in the modela resident’s location at a house; however in a daytimescenario, the dynamic status of people makes it difficultto assume an initial location for agents. We, therefore,accepted this uncertainty in the spatial initial location foragents and started the simulation at a random locationinside a house or on the street or on a beach. We, then, ran250 repetitions of scenarios with different initial locationof agents in stochastic simulation, in order to build as
290 Journal of Disaster Research Vol.8 No.2, 2013

An Integrated Simulation of Tsunami Hazard and Human Evacuationin La Punta, Peru
Table 2. Average values of casualties in three cases:a) horizontal evacuation; b) vertical evacuation and c)horizontal and vertical evacuation.
Type Horizontal Vertical Horizontal and VerticalAvrg. S.D. Max. Avrg. S.D. Max. Avrg. S.D. Max.
Kids 38 2 42 4 1 7 4 1 7Teens 29 3 34 4 1 7 4 1 8Adult 28 1 30 4 0 5 4 0 5Elder 47 1 50 4 1 6 4 1 6Cars 32 34 87 - - - 34 35 100
Total (pers.) 271 - - 16 - - 153 - -(*) Units: persons / S.D.: Standard Deviation
Fig. 9. Horizontal Evacuation scenario result – Casualtiesat traffic congestion are observed at the neck of the district.
many possible scenarios of spatial population distributionin the district. Averages of results are shown in Table 2.
The horizontal case shows the maximum average num-ber of casualties, followed by the horizontal and verticalcase, and then the vertical only case. Here, it is importantto note that in the horizontal evacuation case 5,000 peopleamong pedestrians and cars pretend to escape throughonly two narrow exits. As expected, traffic congestionis observed along exit roads and, in particular, near exitsuntil the arrival of the tsunami. Snapshots each 10 min ofsimulation are shown in Fig. 9. Final white dots are pointsof traffic and dark dots are final casualties. The necessityof tsunami evacuation buildings is observed through theresults of this case. Here, the standard deviation of carsis high compared to the pedestrian agent type, this is dueto the influence of traffic and congestion conditions forvehicles, which clearly shows high uncertainty in possibleoutcomes. More repetitions are necessary to observea better convergence of cars’ casualty estimation. Forpurposes of this paper, e.g. the evaluation of buildingdemand, if we use the vertical scenario as the reference
Fig. 10. Vertical Evacuation scenario result – Casualties aremore related to the late evacuation than the congestion orcrowding.
Fig. 11. Horizontal and Vertical Evacuation scenario result– Casualties are more related to the late evacuation than thecongestion or crowding.
scenario, then this variability can be neglected.For the vertical evacuation case, no traffic congestion
was observed due to the availability of enough space forpedestrians and the restriction on vehicles in the scenario
Journal of Disaster Research Vol.8 No.2, 2013 291

Mas, E., Adriano, B., and Koshimura, S.
Table 3. Capacity and simulation results of 20 TEBs and 2 exits in two cases (Vertical Evac. and Horizontal and Vertical Evac.).
Code Name Vertical Horizontal and Vertical CapacityAvrg. S.D. Max. Avrg. S.D. Max.S01 Escuela Naval 10 3 22 8 3 18 3000S02 Av. Bolognesi No. 11 384 19 439 306 17 354 120S03 Jr. Saenz Pena No. 275 183 13 220 145 12 182 540S04 Jr. Tarapaca No. 155 311 18 361 247 15 287 105S05 Jr. Saenz Pena cdra. 4 406 20 477 322 18 378 160S06 Av. Bolognesi cdra. 1 157 12 184 124 11 164 100S07 Jr. Larco No. 151 159 13 202 125 12 158 70S08 Jr. Tarapaca No. 288 129 11 164 102 10 137 200S09 Jr. Arrieta No. 295 258 16 304 204 14 246 200S10 Jr. Arrieta No. 320 135 12 167 106 11 141 1450S11 Jr. Arrieta No. 492 180 13 214 142 11 171 25S12 Jr. Figueredo No. 470 154 12 185 122 11 161 110S13 Jr. Figueredo No. 520 82 9 113 65 8 86 30S14 Jr. Moore No. 496 157 11 196 124 11 159 165S15 Av. Bolognesi No. 508 155 13 188 124 11 158 50S16 Jr. Moore No. 380 322 17 373 255 16 295 75S17 Jr. Tnte. Palacios No. 375 237 14 276 188 13 231 60S18 Jr. Ferre No. 460 337 16 391 268 17 327 220S19 Jr. Elias Aguirre No. 155 297 19 352 237 15 284 450S20 Edificio SUNAT/SUNAD 141 11 174 113 10 146 800E01 Exit 1 - - - 300 162 528 -E02 Exit 2 - - - 293 166 500 -
Total (pers.) 4194 - - 3922 - - 7930(*)Units: persons
(Fig. 10). The evacuation, apparently, runs smoothly witha minor number of casualties due to their late evacuation.
The third case simulated corresponds to the combi-nation of horizontal and vertical evacuation cases. Inthis case, the number of casualties is lower compared tohorizontal evacuation only due to the less use of someroads from pedestrians. It is observed that in severalrepetitions, although traffic congestion was observed atthe narrow end of the district during evacuation, nocasualties were observed at the end (Fig. 11). It isprobable that casualties will occur, however, during trafficcongestion as shown by some other repetitions that hadresults similar to the horizontal only case.
3.4.2. Shelter Demand
Table 3 shows detailed results for each tsunami evacu-ation building in regard to their capacity and the numberof evacuees in vertical and horizontal and vertical cases.Furthermore, as observed also in Fig. 12, 13 of the 20TEBs resulted with average over demand while 7 still hadspace available. In the upper inset in Fig. 12 the differencein demand is clear from the vertical case to the horizontaland vertical case. While the horizontal and vertical caseshows a lower demand of TEBs due to the possibility ofshelter outside the area, the vertical case is shown to bemore convenient to shelter more people and expect fewercasualties. It is necessary, nevertheless, to ensure thesafety of evacuees even at over demanded shelters. Asan example, building S11 with a capacity of 25 personsmay expect around 180 residents in the area looking forshelter. This is seven times its capacity, meaning that abig group of people may not be able to access the roofarea and will be compelled to remain on lower floors andthus at risk of inundation.
Fig. 12. Capacity and demand in La Punta – Out of 20TEBs, 13 might present over-demand and 7 under-demands.
New areas for vertical evacuation around the districtshould, therefore be implemented because the actual spa-tial location of TEBs compromises the safety of residents.
3.4.3. Capacity Demand MappingIn order to contribute to future mitigation plans and
new alternatives for evacuation at La Punta, the resultingcapacity-demand rate is mapped as shown in Fig. 13.
292 Journal of Disaster Research Vol.8 No.2, 2013
An Integrated Simulation of Tsunami Hazard and Human Evacuationin La Punta, Peru
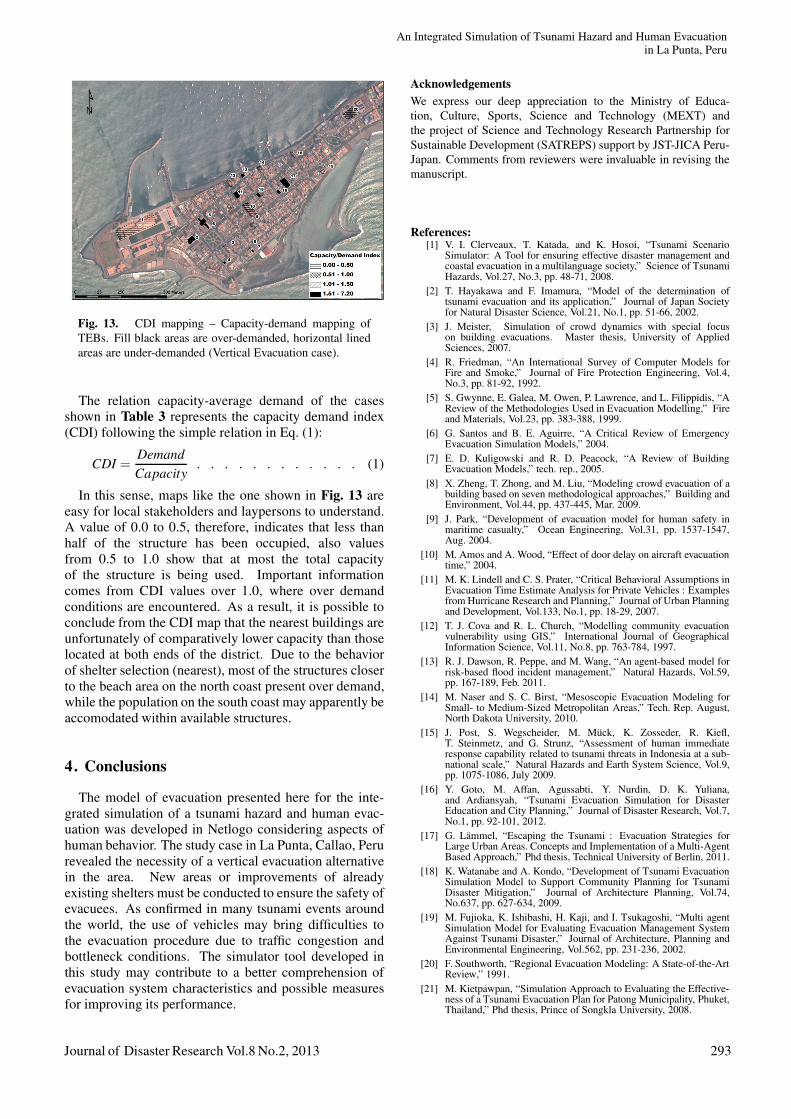
Fig. 13. CDI mapping – Capacity-demand mapping ofTEBs. Fill black areas are over-demanded, horizontal linedareas are under-demanded (Vertical Evacuation case).
The relation capacity-average demand of the casesshown in Table 3 represents the capacity demand index(CDI) following the simple relation in Eq. (1):
CDI =DemandCapacity
. . . . . . . . . . . . (1)
In this sense, maps like the one shown in Fig. 13 areeasy for local stakeholders and laypersons to understand.A value of 0.0 to 0.5, therefore, indicates that less thanhalf of the structure has been occupied, also valuesfrom 0.5 to 1.0 show that at most the total capacityof the structure is being used. Important informationcomes from CDI values over 1.0, where over demandconditions are encountered. As a result, it is possible toconclude from the CDI map that the nearest buildings areunfortunately of comparatively lower capacity than thoselocated at both ends of the district. Due to the behaviorof shelter selection (nearest), most of the structures closerto the beach area on the north coast present over demand,while the population on the south coast may apparently beaccomodated within available structures.
4. Conclusions
The model of evacuation presented here for the inte-grated simulation of a tsunami hazard and human evac-uation was developed in Netlogo considering aspects ofhuman behavior. The study case in La Punta, Callao, Perurevealed the necessity of a vertical evacuation alternativein the area. New areas or improvements of alreadyexisting shelters must be conducted to ensure the safety ofevacuees. As confirmed in many tsunami events aroundthe world, the use of vehicles may bring difficulties tothe evacuation procedure due to traffic congestion andbottleneck conditions. The simulator tool developed inthis study may contribute to a better comprehension ofevacuation system characteristics and possible measuresfor improving its performance.
AcknowledgementsWe express our deep appreciation to the Ministry of Educa-tion, Culture, Sports, Science and Technology (MEXT) andthe project of Science and Technology Research Partnership forSustainable Development (SATREPS) support by JST-JICA Peru-Japan. Comments from reviewers were invaluable in revising themanuscript.
References:[1] V. I. Clerveaux, T. Katada, and K. Hosoi, “Tsunami Scenario
Simulator: A Tool for ensuring effective disaster management andcoastal evacuation in a multilanguage society,” Science of TsunamiHazards, Vol.27, No.3, pp. 48-71, 2008.
[2] T. Hayakawa and F. Imamura, “Model of the determination oftsunami evacuation and its application,” Journal of Japan Societyfor Natural Disaster Science, Vol.21, No.1, pp. 51-66, 2002.
[3] J. Meister, Simulation of crowd dynamics with special focuson building evacuations. Master thesis, University of AppliedSciences, 2007.
[4] R. Friedman, “An International Survey of Computer Models forFire and Smoke,” Journal of Fire Protection Engineering, Vol.4,No.3, pp. 81-92, 1992.
[5] S. Gwynne, E. Galea, M. Owen, P. Lawrence, and L. Filippidis, “AReview of the Methodologies Used in Evacuation Modelling,” Fireand Materials, Vol.23, pp. 383-388, 1999.
[6] G. Santos and B. E. Aguirre, “A Critical Review of EmergencyEvacuation Simulation Models,” 2004.
[7] E. D. Kuligowski and R. D. Peacock, “A Review of BuildingEvacuation Models,” tech. rep., 2005.
[8] X. Zheng, T. Zhong, and M. Liu, “Modeling crowd evacuation of abuilding based on seven methodological approaches,” Building andEnvironment, Vol.44, pp. 437-445, Mar. 2009.
[9] J. Park, “Development of evacuation model for human safety inmaritime casualty,” Ocean Engineering, Vol.31, pp. 1537-1547,Aug. 2004.
[10] M. Amos and A. Wood, “Effect of door delay on aircraft evacuationtime,” 2004.
[11] M. K. Lindell and C. S. Prater, “Critical Behavioral Assumptions inEvacuation Time Estimate Analysis for Private Vehicles : Examplesfrom Hurricane Research and Planning,” Journal of Urban Planningand Development, Vol.133, No.1, pp. 18-29, 2007.
[12] T. J. Cova and R. L. Church, “Modelling community evacuationvulnerability using GIS,” International Journal of GeographicalInformation Science, Vol.11, No.8, pp. 763-784, 1997.
[13] R. J. Dawson, R. Peppe, and M. Wang, “An agent-based model forrisk-based flood incident management,” Natural Hazards, Vol.59,pp. 167-189, Feb. 2011.
[14] M. Naser and S. C. Birst, “Mesoscopic Evacuation Modeling forSmall- to Medium-Sized Metropolitan Areas,” Tech. Rep. August,North Dakota University, 2010.
[15] J. Post, S. Wegscheider, M. Muck, K. Zosseder, R. Kiefl,T. Steinmetz, and G. Strunz, “Assessment of human immediateresponse capability related to tsunami threats in Indonesia at a sub-national scale,” Natural Hazards and Earth System Science, Vol.9,pp. 1075-1086, July 2009.
[16] Y. Goto, M. Affan, Agussabti, Y. Nurdin, D. K. Yuliana,and Ardiansyah, “Tsunami Evacuation Simulation for DisasterEducation and City Planning,” Journal of Disaster Research, Vol.7,No.1, pp. 92-101, 2012.
[17] G. Lammel, “Escaping the Tsunami : Evacuation Strategies forLarge Urban Areas. Concepts and Implementation of a Multi-AgentBased Approach,” Phd thesis, Technical University of Berlin, 2011.
[18] K. Watanabe and A. Kondo, “Development of Tsunami EvacuationSimulation Model to Support Community Planning for TsunamiDisaster Mitigation,” Journal of Architecture Planning, Vol.74,No.637, pp. 627-634, 2009.
[19] M. Fujioka, K. Ishibashi, H. Kaji, and I. Tsukagoshi, “Multi agentSimulation Model for Evaluating Evacuation Management SystemAgainst Tsunami Disaster,” Journal of Architecture, Planning andEnvironmental Engineering, Vol.562, pp. 231-236, 2002.
[20] F. Southworth, “Regional Evacuation Modeling: A State-of-the-ArtReview,” 1991.
[21] M. Kietpawpan, “Simulation Approach to Evaluating the Effective-ness of a Tsunami Evacuation Plan for Patong Municipality, Phuket,Thailand,” Phd thesis, Prince of Songkla University, 2008.
Journal of Disaster Research Vol.8 No.2, 2013 293

Mas, E., Adriano, B., and Koshimura, S.
[22] P. J. Sanchez, “As Simple as possible, but no simpler: A gentleintroduction to simulation modeling,” in Proceedings of the 2006Winter Simulation Conference (L. F. Perrone, F. P. Wieland, J. Liu,B. G. Lawson, D. M. Nicol, and R. M. Fujimoto (Eds.)), pp. 2-10,2006.
[23] C. M. Macal and M. J. North, “Agent-Based Modeling andsimulation: Desktop ABMS,” in Proceedings of the 2007 WinterSimulation Conference, pp. 95-106, 2007.
[24] T. Charknol and Y. Tanaboriboon, “Tsunami Evacuation BehaviorAnalysis,” IATSS Research, Vol.30, No.2, pp. 83-96, 2006.
[25] E. L. Quarantelli, B. Baisden, and T. Bourdess, “EvacuationBehavior and Problems: Findings and Implications from theResearch Literature,” tech. rep., The Ohio State University, DisasterResearch Center, Ohio, USA, 1980.
[26] F. Imamura, “Dissemination of Information and EvacuationProcedures in the 2004-2007 Tsunamis, Including the 2004 IndianOcean,” Journal of Earthquake and Tsunami, Vol.3, No.2, pp. 59-65, 2009.
[27] R. Lachman, M. Tatsuoka, and W. J. Bonk, “Human behaviorduring the tsunami of May 1960.,” Science, Vol.133, pp. 1405-1409, May 1961.
[28] S. Tanaka, R. Tabuchi, R. Kimura, and G. Wu, “TsunamiEvacuation Behavior Reconsidered,” Journal of Japan Society forNatural Disaster Science, Vol.25, No.2, pp. 183-195, 2006.
[29] T. Katada, M. Kodama, N. Kuwasawa, and S. Koshimura, “Issues ofresident’s consciousness and evacuation from the tsunami – Fromquestionnaire survey in Kesennuma city, Miyagi Pref. After theEarthquake of Miyagiken-oki, 2003 –,” Proceedings of the JapanSociety of Civil Engineers, Vol.789, No.2, pp. 93-104, 2005.
[30] T. Saito, “Questionnaire Survey of Human Behaviors and Con-sciousness on the Tsunami of the 1989 Sanriku-Oki Earthquake,”Journal of Japan Society for Natural Disaster Science, Vol.9, No.2,pp. 49-63, 1990.
[31] R. M. Gagne, “Principles of Instructional Design,” Vol.44.Wadsworth Publishing Co Inc, Feb. 2005.
[32] X. Pan, C. S. Han, K. Dauber, and K. H. Law, “A multi-agent basedframework for the simulation of human and social behaviors duringemergency evacuations,” Ai & Society, Vol.22, pp. 113-132, June2007.
[33] D. K. Bird, “The use of questionnaires for acquiring information onpublic perception of natural hazards and risk mitigation a reviewof current knowledge and practice,” Natural Hazards and EarthSystem Sciences, Vol.9, pp. 1307-1325, 2009.
[34] E. Gierlach, B. E. Belsher, and L. E. Beutler, “Cross-culturaldifferences in risk perceptions of disasters.,” Risk analysis :an official publication of the Society for Risk Analysis, Vol.30,pp. 1539-1549, Oct. 2010.
[35] E. Mas, F. Imamura, and S. Koshimura, “Tsunami Risk PerceptionFramework for the Start Time Evacuation Modeling,” in XXVIUGG General Assembly International Association of Seismologyand Physics of Earths Interior, (Melbourne, Australia), 2011.
[36] U. Wilensky, “Netlogo,” 1999.[37] B. Anguelov, “Video Game Pathfinding and Improvements to
Discrete Search on Grid-based Maps,” Master thesis, University ofPretoria, 2011.
[38] T. Suzuki and F. Imamura, “Simulation model of the evacuationfrom a tsunami in consideration of the resident consciousness andbehavior,” Journal of Japan Society for Natural Disaster Science,Vol.23, No.4, pp. 521-538, 2005.
[39] Instituto Nacional de Estadistica e Informatica (INEI), “CensosNacionales 2007,” tech. rep., 2007.
[40] L. Dorbath, A. Cisternas, and C. Dorbath, “Assessment of the sizeof large and great historical earthquakes in peru,” Bulletin ofthe Seismological Society of America, Vol.80, No.3, pp. 551-576,1990.
[41] J. Kuroiwa Horiuchi, “Disaster Reduction. Living in harmony withnature,” Editorial NSG, first edited, 2004.
[42] A. F. Espinosa, R. Husid, S. T. Algermissen, and J. De Las Casas,“The Lima earthquake of October 3, 1974: intensity distribution,”Bulletin of the Seismological Society of America, Vol.67, No.5,pp. 1429-1439, 1977.
[43] C. Langer and S. William, “The 1974 Peru Earthquake Series,”Bulletin of the Seismological Society of America, Vol.85, No.3, pp.665-687, 1995.
[44] N. Pulido, Y. Yagi, H. Kumagai, and N. Nishimura, “Ruptureprocess and coseismic deformations of the 27 February 2010 Mauleearthquake, Chile,” Earth, Planets and Space, Vol.63, pp. 955-959,Dec. 2011.
[45] F. Imamura, “Review of tsunami simulation with a finite differencemethod,” in Long-Wave Runup Models, pp. 25-42, 1995.
[46] E. Mas, A. Suppasri, F. Imamura, and S. Koshimura, “Agent-basedSimulation of the 2011 Great East Japan Earthquake / TsunamiEvacuation : An Integrated Model of Tsunami Inundation andEvacuation,” Journal of Natural Disaster Science, Vol.34, No.1,pp. 41-57, 2012.
[47] U. Wilensky, “Modeling Nature’s Emergent Patterns with Multi-agent Languages,” in EuroLogo, (Linz, Austria), pp. 1-9, 2001.
[48] E. Mas, F. Imamura, and S. Koshimura, “Tsunami Departure Curvesfor Evacuation Simulation. A new approach to model the humanbehavior in tsunami evacuation.,” pp. 1-23, 2012 (under review).
Name:Erick Mas Samanez
Affiliation:Assistant Professor, Laboratory of Remote Sens-ing and Geoinformatics for Disaster Manage-ment (ReGiD), International Research Instituteof Disaster Science (IRIDeS), Tohoku University
Address:Aoba 6-6-3, Sendai 980-8579, JapanBrief Career:1999-2004 B.S. Civil Engineering, National University of Engineering,Peru2006-2009 M.Sc. Disaster Risk Management, National University ofEngineering, Peru2009-2012 PhD Civil Engineering, Tsunami Engineering, TohokuUniversity, Japan2012- Assistant Professor, ReGiD, IRIDeS, Tohoku University, JapanSelected Publications:• E. Mas, A. Suppasri, F. Imamura, and S. Koshimura, “Agent Basedsimulation of the 2011 Great East Japan Earthquake Tsunami evacuation.An integrated model of tsunami inundation and evacuation,” Journal ofNatural Disaster Science, Vol.34, Iss.1, pp. 41-57, 2012.• E. Mas, S. Koshimura, A. Suppasri, M. Matsuoka, M. Matsuyama, T.Yoshii, C. Jimenez, F. Yamazaki, and F. Imamura, “Developing Tsunamifragility curves using remote sensing and survey data of the 2010 ChileanTsunami in Dichato,” Natural Hazards and Earth System Science, Vol.12,pp. 2689-2697, 2012, doi:10.5194/nhess-12-2689-2012.Academic Societies & Scientific Organizations:• Japan Geoscience Union (JpGU)• European Geosciences Union (EGU)• American Geophysical Union (AGU)
294 Journal of Disaster Research Vol.8 No.2, 2013

An Integrated Simulation of Tsunami Hazard and Human Evacuationin La Punta, Peru
Name:Bruno Adriano Ortega
Affiliation:Research Student, Laboratory of Remote Sens-ing and Geoinformatics for Disaster Manage-ment (ReGiD), International Research Instituteof Disaster Science (IRIDeS), Tohoku University
Address:Aoba 6-6-3, Sendai 980-8579, JapanBrief Career:2009-2010 Master of Disaster Management, National Graduate Institutefor Policy Studies, Japan2010-2012 Adjunct Professor, Faculty of Civil Engineering, NationalUniversity of Engineering, Peru2012-present Research Student, ReGiD, IRIDeS, Tohoku University, JapanSelected Publications:• B. Adriano, E. Mas, S. Koshimura, and Y. Fujii, “Remote Sensing-basedAssessment of Tsunami Vulnerability in the coastal area of Lima, Peru,” inThe 10th International Workshop on Remote Sensing for DisasterManagement, Japan, 2012.• E. Mas, B. Adriano, S. Koshimura, F. Imamura, J. Kuroiwa, F.Yamazaki, C. Zavala, and M. Estrada, “Evaluation of Tsunami EvacuationBuilding Demand through the Multi-Agent System Simulation ofResidents’ Behavior,” in Proceedings of International Sessions in CoastalEngineering, JSCE, Vol.3, 2012.• B. Adriano, S. Koshimura, and Y. Fujii, “Tsunami Source and InundationModeling of the June 2001 Peru Earthquake,” in Joint ConferenceProceedings 9CUEE/4ACEE, Tokyo, pp. 2061-2065, 2012.Academic Societies & Scientific Organizations:• Peruvian Engineering College• Japan Geoscience Union (JpGU)
Name:Shunichi Koshimura
Affiliation:Professor, Laboratory of Remote Sensingand Geoinformatics for Disaster Management(ReGiD), International Research Institute ofDisaster Science (IRIDeS), Tohoku University
Address:Aoba 6-6-3, Sendai 980-8579, JapanBrief Career:2000-2002 JSPS Research Fellow, National Oceanic and AtmosphericAdministration2002-2005 Research Scientist, Disaster Reduction and Human RenovationInstitute2005-2012 Associate Professor, Tohoku University2012- Professor, ReGiD, IRIDeS, Tohoku University, JapanSelected Publications:• S. Koshimura, T. Oie, H. Yanagisawa, and F. Imamura, “Developingfragility functions for tsunami damage estimation using numerical modeland post-tsunami data from Banda Aceh, Indonesia,” Coastal EngineeringJournal, No.3, pp. 243-273, 2009.• S. Koshimura, Y. Hayashi, K. Munemoto, and F. Imamura, “Effect of theEmperor seamounts on trans-oceanic propagation of the 2006 Kuril Islandearthquake tsunami,” Geophysical Research letters, Vol.35, L02611,doi:10.1029/2007GL032129, 24, 2008.• S. Koshimura, T. Katada, H. O.Mofjeld, and Y. Kawata, “A method forestimating casualties due to the tsunami inundation flow,” Natural HazardVol.39, pp. 265-274, 2006.Academic Societies & Scientific Organizations:• Japan Society of Civil Engineers (JSCE)• Institute of Social Safety Science• Japan Association for Earthquake Engineering (JAEE)• Japan Society for Computational Engineering and Science (JSCES)• American Geophysical Union (AGU)
Journal of Disaster Research Vol.8 No.2, 2013 295