an integrated system for building enterprise taxonomies
TRANSCRIPT

An Integrated System for Building Enterprise
Taxonomies
Li Zhang1, Tao Li2, ShiXia Liu1, and Yue Pan1
1. IBM China Research Lab, {lizhang,liusx,panyue}@cn.ibm.com
2. School of Computer Science, Florida International University, [email protected]
May 24, 2007
Abstract
Although considerable research has been conducted in the field of hi-
erarchical text categorization, little has been done on automatically collect-
ing labeled corpus for building hierarchical taxonomies. In this paper, we
propose an automatic method of collecting training samples to build hierar-
chical taxonomies. In our method, the category node is initially defined by
some keywords, the web search engine is then used to construct a small set
of labeled documents, and a topic tracking algorithm with keyword-based
content normalization is applied to enlarge the training corpus on the basis
of the seed documents. We also design a method to check the consistency
of the collected corpus. The above steps produce a flat category structure
1

which contains all the categories for building the hierarchical taxonomy.
Next, linear discriminant projection approach is utilized to construct more
meaningful intermediate levels of hierarchies in the generated flat set of cat-
egories. Experimental results show that the training corpus is good enough
for statistical classification methods.
1 Introduction
In recent years, many enterprises tend to organize corporate information into tax-
onomies. At the same time, the enterprises also find it important to keep track
of marketing and competitor information from the web according to desired tax-
onomies for their business intelligence. This leads to the requirements to design
the enterprise taxonomy and label large amounts of data manually or automati-
cally.
Generally speaking, manual labeling is of high cost. It is estimated that, in
order to tag a few hundred thousand documents, the enterprise may spend more
than $1M [48]. The cost will increase dramatically when the taxonomy changes
and new facets of taxonomy are defined. Although manual labeling could achieve
high accuracy (in some circumstances), it is not a good choice for large data col-
lections.
Text categorization, as a fundamental and effective tool that can automati-
cally classify all kinds of documents into predefined categories, has been receiv-
ing much attention and numerous approaches have been developed in the liter-
2
ature [33, 10, 23, 27, 53, 42]. Experimental results show that the classification
accuracy achieved by automatic approaches is as good as human performance and
thus makes text categorization an attractive technique for information organiza-
tion [44].
However, in practice, the performance of classification methods depends on
the number of available training samples. Test with Reuters-21578 [54] shows
that the classification precision and recall are good with common categories (with
more than 300 training samples), but poor with rare categories (sometimes with
less than 10 training samples). Furthermore, the classification accuracy also de-
pends on the quality of user labeled corpus. If the corpus is poorly labeled, the
classification accuracy will decrease greatly. Thus, there exists a big gap between
the accuracy expected and the real performance in practice.
In order to achieve high accuracy, statistical machine learning methods need
a large high-quality corpus to train the classifier. As manual tagging is very ex-
pensive, it would not be expected to spend a huge amount of human efforts to do
this. So, how to prepare a training corpus with low cost is a big problem that the
enterprise must resolve.
Several attempts have been made to solve this problem. Among them, the most
commonly used method is active learning [14, 34, 45, 16]. In active learning, the
machine prompts the most informative document for the user to label. Human
operates interactively to mark the categories the documents belong to. Active
learning can reduce the number of training samples and reach a reasonable classi-
fication quality. This technique is well suited for the cases where a large unlabeled
3

corpus exists. But the enterprise information is extraordinarily complex, much of
them are even non-related to the scope of desired taxonomy. This will lead to a
lot of non-useful data to be labeled. The other type of method is to generate tax-
onomies based on the labeled data as well as unlabeled data. The methods include
learning from labeled and unlabeled examples [17, 36], or a partially supervised
classification [21, 32], or supervised clustering [2]. All of these methods require a
well-labeled pre-existing document set, but in many cases, the enterprise does not
have such a labeled document set. Different from above methods, our approach
focuses on starting with several seed documents and then enlarge the corpus from
the web or Intranet incrementally. The starting point is a set of category labels, and
the user of this system is interested in finding a hierarchical relationship between
the categories.
There are two basic components in a taxonomy: a hierarchy of categories and
a collection of documents [1]. In order to build enterprise taxonomies efficiently
and effectively, the following issues should be carefully studied:
• how to collect a large corpus from the web efficiently;
• how to evaluate the quality of the training corpus;
• how to organize the collected corpus into hierarchical structures.
In this paper, we present an integrated system to address the above-mentioned
issues. Our system can assist the enterprise to prepare large training corpus and
build hierarchical categories from the web. It takes an empty taxonomy as input
and generates as output a hierarchy of categories and a document set in which
4

Category Tree Editor
Search Engine
Document Crawler
Seed Selector
LargeCorpus Collector
Keywords & Categories
Seeds Consistency Checking
Hierarchy Generator
Taxonomy
Figure 1: System Architecture
each document is labeled with one or more categories. In particular, first, the
technicians of the enterprise can define the flat category structure freely and sub-
mit some keywords to a search engine. Our system can automatically analyze the
retrieved documents, recommend several seed documents for each category with a
refined centroid method. A keyword-based content normalization and topic track-
ing technique [13] are then used to collect large training samples from the web.
To evaluate the quality of the training corpus, a consistency checking method is
utilized to help the user check the quality of the corpus. Finally, the taxonomy hi-
erarchy is generated via linear discriminant projection. Experimental results show
that the training corpus is good enough for statistical classification methods. The
system architecture is shown in Figure 1.
The system is an interactive environment for the human to work with. We
call the person who uses the tool to build taxonomies the ”annotator”. In the
taxonomy building process, the annotator plays an important role. We mark the
modules which involve annotator’s efforts with yellow color in the system archi-
tecture. Initially the annotator will define the categories in a flat structure, that is to
give each category a meaningful name. And then the annotator needs to introduce
5

some keywords for each category and compose several queries to the search en-
gine. The annotator is responsible for justifying whether each seed document is a
good sample when the seed selector presents the seed candidates. Then when new
coming documents are classified by the system, the annotator will make judgment
on each suspected sample and label the sample correctly. Finally, in the hierarchy
generation phase, the annotator will go through the hierarchical tree structure to
guarantee the whole taxonomy is reasonable, he may edit and modify the taxon-
omy if necessary.
Since the information inside the enterprise can be organized in varied ways,
which is most unlikely based on content alone, for example, the data may have
rich metadata, or have been organized according to other hierarchies, or have a
lot of cross references internally. Our approach can leverage this information if
available. For instance, with metadata, some simple rules can be defined to map
the data to the enterprise taxonomy directly [9]. If there exist other hierarchies, the
corpus can be partially derived from the existing taxonomies by deep analysis of
the semantic meanings between the target taxonomy and the existing taxonomy [3,
57]; If documents have cross links to other documents, the referenced documents
can be dragged into the corpus to speed up corpus enlargement efficiency [4]. For
space limitation we won’t accommodate these context influences in this paper and
leave it to future work.
In summary, the contributions of our work are: i) we propose an automatic
method of collecting samples for building hierarchical taxonomies; ii) we present
a keyword-based content normalization method for improving topic tracking; iii)
6

we design a information-theoretic method for corpus consistency checking; iv) we
utilize the linear discriminant projection approach to generate meaningful hierar-
chies; and v) we develop an integrated system by leveraging the above-mentioned
techniques. The remainder of the paper is organized as follows. Section 2 de-
scribes the method to collect large corpus from the web. Section 3 introduces
the consistency checking method to evaluate the quality of the collected corpus.
Section 4 presents the linear discriminant projection approach to construct more
meaningful hierarchical category tree. Section 5 shows the experiments and re-
sults. Section 6 discusses related work. Final conclusions are given in Section 7.
2 Collecting the Large Corpus
In this section, we present in detail our methods of selecting training samples from
the web. Section 2.1 provides an overview of the selection procedure; Section 2.2
and Section 2.3 describe seed documents selection and large corpus collection
respectively.
2.1 An Overview of the Selection Procedure
Training samples are collected in two steps: seed document selection and large
corpus collection. The first step is to construct several seed documents. Keywords
are first submitted to a search engine and search results are downloaded (via a
crawler) into the local system. Next, refined centroid method is employed to auto-
matically recommend good documents as seeds from the search results. Then, the
7
annotator will make final judgment on the see documents based on the system’s
recommendation.
In the second step, the seed documents are used to discover more relevant
documents from the web. Firstly, the relevant terms are extracted from the seed
documents to enlarge the keyword set for each category. Then, the keyword set
is utilized to normalize the length of seed documents and documents being pro-
cessed. Given the web URL set the enterprise is interested in, the crawler will
crawl the web and download the documents to the local file system. Topic track-
ing algorithm with keyword-based content normalization is used to detect whether
the incoming document is related to the corresponding topic. And finally related
documents will be saved as training samples.
To guarantee the quality of the training corpus, after the large corpus is col-
lected, a consistency checking method is used to help the annotator check the
training data.
2.2 Seed Construction
For each category, some query words can be submitted to a search engine, but the
search results cannot be treated as seed documents directly, because the search
engine’s performance is a common problem, and many non-relevant documents
are often mixed with good documents. Humans can identify good documents one
by one, but it is time-consuming. In addition, in many cases, the samples selected
by a human may not be optimal. We apply relevance feedback technique into our
system and propose an automatic seed selection method.
8
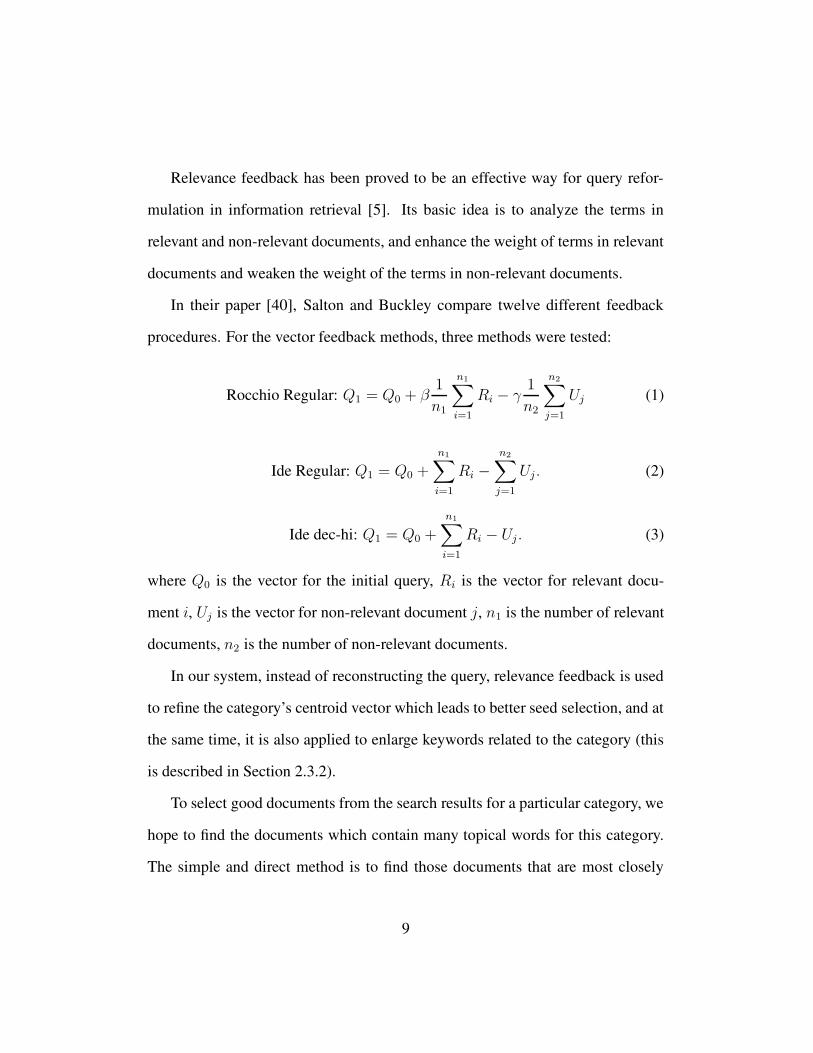
Relevance feedback has been proved to be an effective way for query refor-
mulation in information retrieval [5]. Its basic idea is to analyze the terms in
relevant and non-relevant documents, and enhance the weight of terms in relevant
documents and weaken the weight of the terms in non-relevant documents.
In their paper [40], Salton and Buckley compare twelve different feedback
procedures. For the vector feedback methods, three methods were tested:
Rocchio Regular: Q1 = Q0 + β1
n1
n1∑
i=1
Ri − γ1
n2
n2∑
j=1
Uj (1)
Ide Regular: Q1 = Q0 +
n1∑
i=1
Ri −
n2∑
j=1
Uj. (2)
Ide dec-hi: Q1 = Q0 +
n1∑
i=1
Ri − Uj. (3)
where Q0 is the vector for the initial query, Ri is the vector for relevant docu-
ment i, Uj is the vector for non-relevant document j, n1 is the number of relevant
documents, n2 is the number of non-relevant documents.
In our system, instead of reconstructing the query, relevance feedback is used
to refine the category’s centroid vector which leads to better seed selection, and at
the same time, it is also applied to enlarge keywords related to the category (this
is described in Section 2.3.2).
To select good documents from the search results for a particular category, we
hope to find the documents which contain many topical words for this category.
The simple and direct method is to find those documents that are most closely
9

related to the centroid of this category [28, 43]. With vector space model, that
means the documents containing the high frequency terms in the search results
may get higher similarity score, and so that they will be selected. But this method
doesn’t consider the documents from other categories. From the term’s aspects,
many common terms to every category may have high weights in the centroid
vector. This may lead to the selection of many general documents. Thus, a better
way to select the seed documents is to refine the documents centroid by reducing
the influence of the common terms. Here we apply Rocchio Regular method to
compute the centroid vector.
Suppose C1,C2,...,Cn are n categories, and D1,D2,...,Dn are search results for
each category. For category Ci, the seeds are selected as follows:
1. Compute the representative category vector Vi. Vi can be computed in two
ways: one is the traditional centroid method,
Traditional Centroid: Vi centroid =1
n1
n1∑
i=1
Ri (4)
the other is the refined centroid method via Rocchio Regular relevance feed-
back formula,
Refined Centroid: Vi refined =1
n1
n1∑
i=1
Ri −1
n2
n2∑
j=1
Uj (5)
where relevant document Ri is the document in the search results of the
target category Ci, and non-relevant document Uj is the document in the
10

search results of all the other categories.
2. Compute the cosine similarity of each documents di,j ∈ Di with the vector
Vi and sort the documents in descending order of the similarity values.
3. Choose top m documents as seed documents.
In this step, the annotator’s efforts are: naming the category, composing queries,
and judging the seed documents. Before starting to work, it is important to have
the annotator know the scope or the coverage of each topic, so that he can figure
out proper queries to the search engine. While the system automatically selects
seeds and presents them to the annotator, he should make relevance judgments on
the candidates, because the quality of the seeds will influence further automatic
processing. The criteria of good seeds are: the content of the document need to
be relevant to the topic as much as possible; the style of the documents comply
with the desired purpose, for example, if the taxonomy is about news report, the
review/criticism document should be excluded; the seed documents should cover
enough domain diversity for each topic, that means, if all the documents have all
similar sentences, or in the extreme case all documents are the same, it would
not lead to good discrimination; focus on the words of the document, not the dis-
play format, particularly some web pages have many embedded images containing
meaningful words, but after the html filter is applied, only plain text is left, so, the
seed documents must have meaningful words in its plain text, not in the image.
The annotator will follow these guidelines to decide the seed documents.
11

2.3 Topic Tracking with Keyword-based Content Normaliza-
tion
2.3.1 Review of Topic Tracking
Topic tracking is one of the TDT research tasks that try to discover topically re-
lated material in news streams [50]. The goal of topic tracking is to keep track of
incoming documents similar to several predefined example documents. Typically
the tracking system is given 1-4 documents, called seed documents, and asked to
monitor the news stream of future document on the same topic. In our system, by
searching the web, the user can collect several seed documents using the method
in 2.2, then topic tracking technique is applied to gather large number of relevant
documents.
Our topic tracking algorithm is based on that described in [13]. The document-
document similarity function is based on a symmetric version of the Okapi for-
mula [38]:
Ok(d1, d2; cl) =∑
w∈(d1∩d2)
t1wt2widf(w, cl). (6)
tiw is the adjusted term frequency of word w in document i,
tiw =tiw
α + tiw, where tiw =
ciw
∑
w ciw
. (7)
and idf(w, cl) is a cluster-dependent weight,
idf(w, cl) = idf0(w) + λ2nw,cl
nw + ncl
, (8)
12

where idf0(w) is the traditional inverse document frequency, nw is the number
of documents that contain word w, ncl is the number of documents in cluster cl,
nw,cl is the number of documents in the cluster which contain the word; λ is an
adjustable parameter.
The cluster is represented by the centroid of the documents it contains, then
the similarity score of a document with the cluster is given by
Sim(d, cl) = |cl|−1∑
d′∈cl
Ok(d, d′; cl). (9)
Because the content of a cluster changes over the course of time and its centroid
is updated dynamically, the scoring formula performs well in the topic tracking
task.
2.3.2 Keyword-based Content Normalization
Since the documents are from the web, their content lengths vary greatly, this
significantly influences the classification accuracy. Several methods have been
proposed to deal with such a problem. For example, Singhal et al. [47] studied
the problem of document length in information retrieval system. They paid more
attention to penalizing the term weight for a document in accordance with its
length. In this section, we propose a keyword-based content normalization method
to improve topic tracking algorithm. The main idea is to use each category’s
keyword set K = {k1, k2, ..., kp} to normalize the length of the seed document
and the document being classified. Its major objective is to remove noises from
13

the document, and thus to increase the accuracy of classification. Compared with
the method proposed by Singhal et al., our method allows the user to customize
the text categorization according to his preference. This is achieved by allowing
the user to define the keywords for the keyword-based content normalization.
The keywords are generated in three ways. Firstly, the keyword set initially
contains the category name by default. Secondly, when the user submits a query
to the search engine, the query words are automatically added into the keyword
set. Thirdly, after the seed documents are selected with the method in Section 2.2,
relevance feedback technique is again employed to analyze the documents and
enlarge the keyword set. To do this, for each category, the term weight is computed
according to one of the query refinement formulas (1),(2),(3). The category’s
seed documents are treated as relevant documents, the other categories’ seeds are
non-relevant documents. The terms are then sorted in descending order of their
weights. Top k terms in the list are added to category’s keyword set.
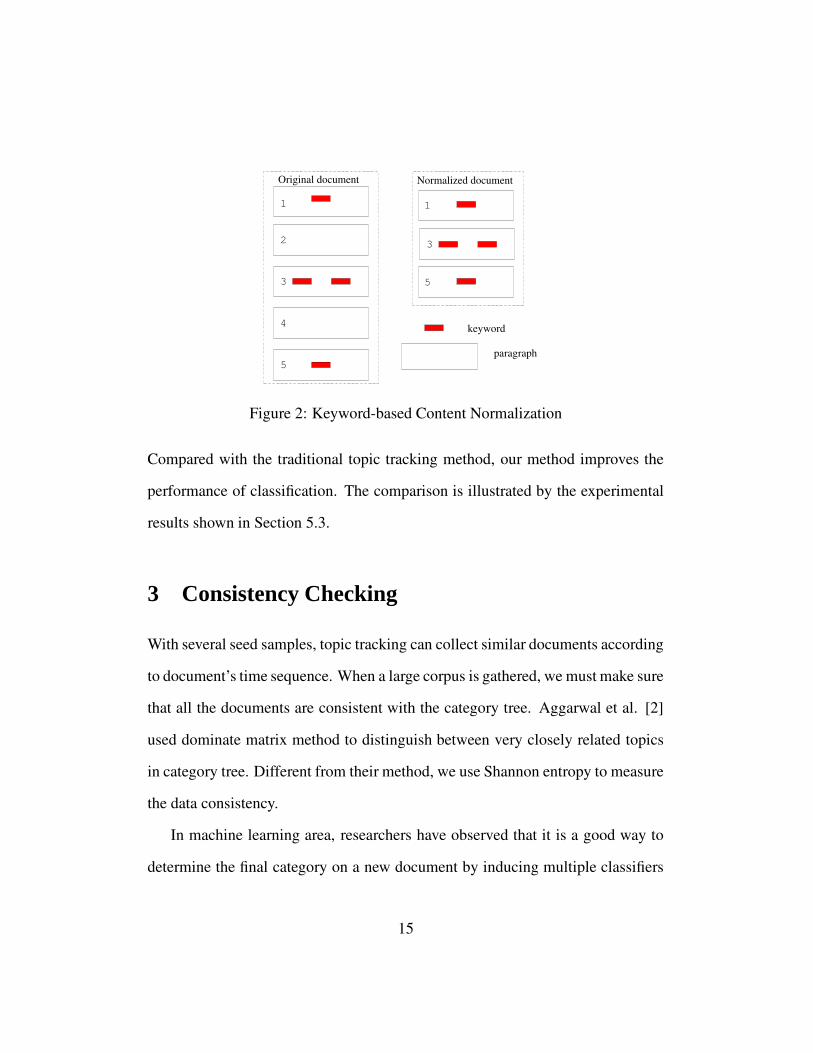
Figure 2 illustrates the keyword-based content normalization. This method
first finds the given keywords in the document. Then the paragraph which contains
the matched keyword(s) is extracted. Those extracted paragraphs are concatenated
as the normalized document of the original one. The improved topic tracking
method consists of the following steps:
1. Initialize each topic with its normalized seed documents;
2. For each incoming document, construct its normalized content and then
classify it to the most relevant category via topic tracking algorithm.
14
1
2
3
4
5
1
5
keyword
paragraph
Original document Normalized document
3
Figure 2: Keyword-based Content Normalization
Compared with the traditional topic tracking method, our method improves the
performance of classification. The comparison is illustrated by the experimental
results shown in Section 5.3.
3 Consistency Checking
With several seed samples, topic tracking can collect similar documents according
to document’s time sequence. When a large corpus is gathered, we must make sure
that all the documents are consistent with the category tree. Aggarwal et al. [2]
used dominate matrix method to distinguish between very closely related topics
in category tree. Different from their method, we use Shannon entropy to measure
the data consistency.
In machine learning area, researchers have observed that it is a good way to
determine the final category on a new document by inducing multiple classifiers
15
and picking the answer with majority votes [45, 52]. In our system, we consider
two classifiers: one is topic tracking, and the other is the traditional k-means clus-
tering method. We first run k-means clustering without time sequence, and then
compare the k-means result with the topic tracking result. There are two problems
we want to detect: the first one is whether the categories are well constructed, the
second one is whether the documents in a particular category are close to another
category.
Suppose there are n categories C1, ..., Ci, ..., Cn, and the document set is D.
K-means clustering method is used to cluster the document set D, cluster num-
ber is n. We use Shannon entropy measure to compare the result of the k-means
clustering method with that of the topic tracking method. Shannon entropy based
measure [46] is a popular method to evaluate the quality of the clustering algo-
rithms [58]. It asserts that the best entropy that can be obtained is when each
cluster contains the optimal number of members. In the ideal case, the k-means
clustering method result is the same with the topic tracking result, this means the
categories are well constructed. If these two results are not identical, then the
documents labeled differently are candidates for checking.
According to Shannon entropy theory, for cluster Sj , the category distribution
pij is the probability that a member in cluster Sj belongs to category Ci:
pij =|Ci ∩ Sj|
nj
, (10)
where nj is the document number of the cluster Sj . The entropy of every cluster
16

Sj is calculated using the standard entropy formula:
Ej = −n∑
i=1
pij log pij. (11)
The total entropy is then calculated as
E =1
n
n∑
j=1
nj ∗ Ej. (12)
The lower the entropy, the better the clustering result. When the entropy is greater
than the threshold, the specified category should be inspected. In our experiment,
we simply set the threshold to 0.5. The following steps are executed to detect
which samples are not well labeled. For each k-means cluster Sj , we find its
most matching category node Ci whose documents are collected by topic tracking
algorithm. Then in Ci, the documents which do not belong to cluster Sj are picked
out and presented to the user for checking.
4 Automatic Hierarchy Generation via Linear Dis-
criminant Projection
The first step in automatic hierarchy generation is to infer class relationships (e.g.,
measure the similarities between categories). The similarity should reflect the
intrinsic characteristics of the categories and provide dependence relationships
for efficient learning methods. Once the similarity measure has been determined,
17

a hierarchical clustering method can be used to build the hierarchy.
One simple way to infer class relationships is to compare the class repre-
sentatives. As we all know, however, the data dimension is very high in vector
space model for document analysis. It has been shown that in a high dimensional
space, the distance between every pair of points is almost the same for a wide
variety of data distributions and distance functions due to the curse of dimension-
ality [6]. In our work, we utilize linear discriminant projection for generating
more meaningful intermediate levels of hierarchies in large flat sets of categories.
Linear discriminant projection approach first transforms all the documents onto
a low-dimensional space and then clusters the categories into hierarchies accord-
ing to the distances of the centroids of each category in the transformed space.
Discriminant analysis approaches are well known to learn discriminative feature
transformations in statistical pattern recognition literature [15]. Fisher discrimi-
nant analysis [12] finds discriminative feature transform as eigenvectors of matrix
T = S−1w Sb where Sw is the intra-class covariance matrix and Sb is the inter-class
covariance matrix. Basically T captures both compactness of each class and sep-
arations between classes and hence eigenvectors corresponding to largest eigen-
values of T would constitute a discriminative feature transform. The transformed
feature space would reflect the inherent similarity structure between the classes.
4.1 Linear Discriminant Projection Approach
In this section, we briefly describe the linear discriminant projection approach for
inferring class relationships. The approach is first introduced in [30]. Its core
18

idea is to compare the class representatives in a low-dimensional space so that the
comparison is more “meaningful”. More specifically, after finding the transfor-
mation, the similarity between classes is defined to be the distance between their
centroids in the transformed spaces. The notations used later in the discussion are
listed in the Table 1.
Notations DescriptionsA document-term matrixn number of data points, i.e., documentsN number of the dimensions, i.e, termsk number of classSi covariance matrix of the i-th classSb between-class scatter matrixSw within-class scatter matrixG reduction transformationmi centroid of the i-th classm global centroid of the training set
Table 1: Notations
4.1.1 Finding the Transformation
Given a document-term matrix A = (aij) ∈�
n×N , where each row corresponds
to a document and each column corresponds to a particular term, we consider
finding a linear transformation G ∈�
N×` (` < N ) that maps each row ai (1 ≤
i ≤ n) of A in the N -dimensional space to a row yi in the `-dimensional space.
The resulting data matrix AL = AG ∈�
n×` contains ` columns, i.e. there are
` features for each document in the reduced (transformed) space. It is also clear
that the features in the reduced space are linear combinations of the features in the
19

original high dimensional space, where the coefficients of the linear combinations
depend on the transformation G. Linear discriminant projection tries to compute
the optimal transformation matrix G such that the class structure is preserved.
More details are given below.
Assume there are k classes in the data set. Suppose mi, Si, Pi are the mean
vector, covariance matrix, and a prior probability of the i-th class, respectively,
and m is the total mean. For the covariance matrix Si for the ith class, we can
decompose it as Si = XiXTi , where Xi has the same number of columns as the
number of data points in the i-th class. Define the matrices
Hb = [√
P1(m1 − m), · · · ,√
Pk(mk − m)] ∈� N×k,
Hw = [√
P1X1, · · · ,√
PkXk] ∈� N×n.
Then the between-class scatter matrix Sb, the within-class scatter matrix Sw, and
the total scatter matrix St are defined as follows [15]:
Sb =
k∑
i=1
Pi(mi − m)(mi − m)T = HbHTb ,
Sw =
k∑
i=1
PiSi = HwHTw .
In the lower-dimensional space resulting from the linear transformation G, the
20

within-cluster and between-cluster matrices become
SLw = (GT Hw)(GT Hw)T = GT SwG,
SLb = (GT Hb)(G
T Hb)T = GT SbG.
An optimal transformation G would maximize Trace(SLb ) and minimize Trace(SL
w).
A common optimization for computing optimal G is
G∗ = arg maxG
Trace((
GT SwG)−1
GT SbG)
.
The solution can be readily obtained by solving a eigenvalue decomposition prob-
lem on S−1w Sb, provided that the within-class scatter matrix Sw is nonsingular.
Since the rank of the between-class scatter matrix is bounded above by k − 1,
there are at most k − 1 discriminant vectors.
4.1.2 Extension on General Cases
In general, the within-class scatter matrix Sw may be singular especially for document-
term matrix where the dimension is very high. A common way to deal with it is
to use generalized eigenvalue decomposition [19, 29]
Let K = [Hb Hw]T , which is a k+n by N matrix. By the generalized singular
value decomposition, there exist orthogonal matrices U ∈�
k×k, V ∈�
n×n, and
21

a nonsingular matrix X ∈�
N×N , such that
UT 0
0 V T
KX =
Σ1 0
0 0
Σ2 0
0 0
, (13)
where
Σ1 = diag(
r︷ ︸︸ ︷
1, · · · , 1, α1, · · · , αs
t−r−s︷ ︸︸ ︷
0, · · · , 0),
Σ2 = diag(
r︷ ︸︸ ︷
0, · · · , 0, β1, · · · , βs,
t−r−s︷ ︸︸ ︷
1, · · · , 1),
t = rank(K), r = t − rank(HTw),
s = rank(Hb) + rank(Hw) − t,
satisfying
1 > α1 ≥, · · · ,≥ αs > 0,
0 < β1 ≤, · · · ,≤ βs < 1,
and α2i + β2
i = 1 for i = 1, · · · , s.
22

From Eq. (13), we have
(XTHb)(XTHb)
T =
ΣT1 Σ1 0
0 0
,
(XT Hw)(XT Hw)T =
ΣT2 Σ2 0
0 0
.
Hence a natural extension of the proposed linear discriminant projection in
Section 4.1.1 is to choose the first q = r + s columns of the matrix X in Eq. (13)
as the transformation matrix G∗.
4.2 Defining the Similarity and Hierarchy Generation
After finding the transformation G, we define the similarity between classes to be
the distance between their centroids in the transformed spaces. In other words,
two categories are similar if they are “close” to each other in the transformed
space. The linear discriminant projection finds the transformation that preserves
the class structure by minimizing the sum of squared within-class scatter while
maximizing the sum of squared between-class scatter and hence the distances in
the transformed space should be able to reflect the inherent structure of the dataset.
After obtaining the similarities/distances between classes, we use the Hierar-
chical Agglomerative Clustering (HAC) algorithm of [20] to generate automatic
topic hierarchies from a given set of flat classes. The result of hierarchical clus-
tering is a dendrogram where similar classes are organized into hierarchies. We
23

choose UPGMA (Unweighted Pair-Groups Method Average method), which is
known to be simple, efficient and stable [20]. In UPGMA, the average distance
between clusters is calculated from the distance between each point in a cluster
and all other points in another cluster. The two clusters with the lowest average
distance are joined together to form the new cluster.
5 Experiments
In this section, we introduce some detailed information about system implemen-
tation. Then, experimental results are reported. In the experiments, we study the
following issues: the effectiveness of automatic seed selection method, perfor-
mance evaluation for topic tracking with keyword-based content normalization,
and data quality checking. Finally a sample of hierarchical taxonomy built by our
method is presented.
5.1 System Implementation
Figure 3 illustrates the user interface of our system. In our implementation, each
individual system component is developed independently and works together in
a work flow. Because our system collects web pages from the Internet, some
particular techniques are used to deal with different kinds of web pages. The
followings are some detailed information.
1. The crawler is multi-threaded and runs in a mode that can be configured by a
configuration file. The configuration file specifies the depth of the crawling,
24

the pattern that the downloaded page’s URL must satisfy, etc. With this
crawler, the system can monitor several web sites, by using a ”start” URL
and a value for depth (in web pages).
2. The content extractor transforms various document format into plain text. It
extracts meaningful text content and removes unrelated information (such
as advertisements and menu links) from the downloaded web page. The
content extractor is based on the layout analysis of the web page and statis-
tics of the content text distribution.
3. The duplication detector maintains both a memory index and a hard disk
index for duplication computation, which makes it fast for processing large
collection of documents. We use a histogram-based measure of similarity
of word distribution in documents to determine the similarity of two docu-
ments and remove redundant information.
4. Document summarization engine extracts important sentences based on the
analysis of the document structure, such as its title, authors, sections, and
paragraphs. In the summarization result, the main document structure and
consecutive sentences are kept, which makes it more readable.
5.2 Seed Document Selection
We use the top ten categories from Reuters-21578 dataset [26] to test our auto-
matic seed selection method. The query words for each category are generated
25

Figure 3: User Interface
26

simply from the category description file in the package, which are illustrated in
Table 2. The query words are transformed into lower case without stemming.
The document’s original label in Reuters dataset is used to decide whether the
seed is correct. Suppose n documents are returned as seed candidates for cate-
gory Ci, the number of real good seeds is ng, then the precision is computed by
precision = ng/n for category Ci. The macro-average precision among all the
categories are used to evaluate the seed selection accuracy.
Table 2: Query WordsCategory Keyword(s)
earn Earnings, Forecastsacq Mergers, Acquisitions
money-fx Money,Foreign, Exchangecrude Crude, Oilgrain Graintrade Trade
interest Interest, Ratesheat Heating, Gas, Oil
wheat wheatship Shipping
We design two baselines to simulate different seed preparing environments.
The first baseline simulates a poor search environment where the search results
are not ranked by relevance score, such as file system and database. In a file
system, the annotator would use a resource manager provided by the operating
system to find seed documents, the search results can be sorted by file names,
modified date, etc, but no ranking score exists. With a database, the query results
is most likely to be listed in the order of record id. For simplicity, in the first
27

baseline experiment, we assume all of the documents containing any of the query
words are returned, the average precision for the ten categories is 0.37. If the top
5 or 10 documents are marked as seeds, the average precision is 0.42 and 0.43
respectively. This indicates that most of the search results are not suitable as seed
documents, although they contain the query words. So, in these cases, it is difficult
for the annotator to select good documents from such a long search result list.
We apply refined seed selection method (formula 5) to see if the system’s
recommendation can help the user to make a decision more easily. The traditional
centroid method (formula 4) is also employed in this experiment for comparison.
Table 3 shows the detailed experimental results.
Table 3: Seed Selection Performance Comparison with Baseline 1Category top5 top10
Baseline1 Centroid Ref. Centroid Baseline1 Centroid Ref. Centroidearn 0.80 0.60 1.00 0.60 0.80 1.00acq 0.60 0.40 0.60 0.60 0.30 0.70money-fx 0.00 0.80 1.00 0.00 0.90 1.00crude 0.40 1.00 1.00 0.50 1.00 1.00grain 1.00 1.00 1.00 0.90 1.00 1.00trade 0.20 0.60 0.80 0.20 0.70 0.90interest 0.00 0.80 0.80 0.10 0.90 0.90heat 0.00 0.00 0.00 0.00 0.00 0.00wheat 1.00 1.00 1.00 1.00 1.00 1.00ship 0.20 1.00 1.00 0.40 1.00 1.00av pr 0.42 0.72 0.82 0.43 0.76 0.85
The results in Table 3 show that both the traditional centroid method and the
refined centroid method are significantly better than the first baseline. For top 5
documents, the seed precision is improved from 0.42 to 0.72 and 0.82, and for top
28

10 documents, the average precision is enhanced from 0.43 to 0.76 and 0.85, re-
spectively. Seed selection with refined centroid method has the best performance,
it improves greatly the traditional centroid method by nearly 10 percent. The
experimental results illustrate that in a poor search environment, our seed recom-
mendation method can greatly improve the seed accuracy, saving a lot of human’s
efforts.
The second baseline ranks each candidate document according to its cosine
similarity with the query vector, just simulating the search result returned by a
search engine. In our experiments, we simply use the traditional cosine similar-
ity formula to rank the candidate documents against the query vector. With this
baseline, macro-average precision is 0.84 for top 5 results. The accuracy is much
better than the first baseline, which means that ranking is a good indicator for the
topical documents.
We apply the two seed selection methods on the search result of the second
baseline in order to investigate if there is still space to improve in this good en-
vironment. Top five documents are selected out of the ten seeds generated by the
second baseline. Table 4 shows the performance of these methods. The macro-
average precision is improved from 0.84 to 0.88 (centroid method) and 0.90 (re-
fined centroid method) respectively. This demonstrates that even with the result
list from a search engine which has ranking capability, the system’s recommenda-
tion method can also improve the accuracy of the seeds.
Based on the above experiments, we can come to the following conclusions:
our automatic seed selection method can provide high accuracy candidates to the
29
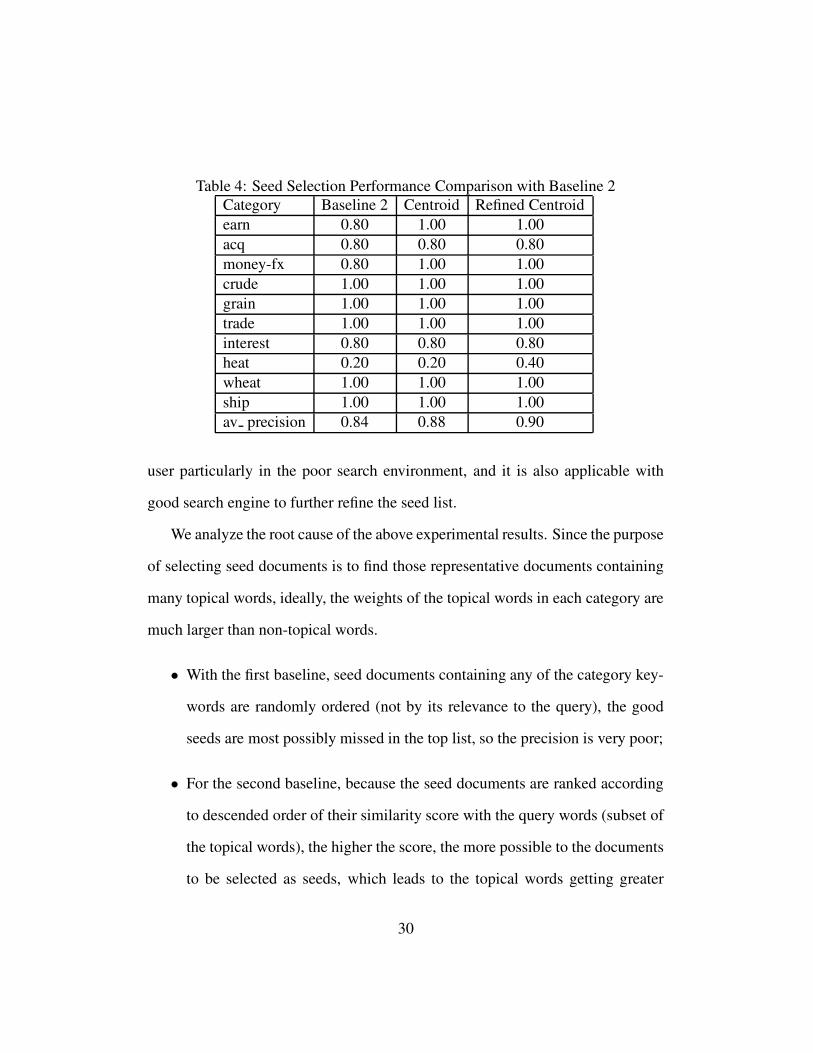
Table 4: Seed Selection Performance Comparison with Baseline 2Category Baseline 2 Centroid Refined Centroidearn 0.80 1.00 1.00acq 0.80 0.80 0.80money-fx 0.80 1.00 1.00crude 1.00 1.00 1.00grain 1.00 1.00 1.00trade 1.00 1.00 1.00interest 0.80 0.80 0.80heat 0.20 0.20 0.40wheat 1.00 1.00 1.00ship 1.00 1.00 1.00av precision 0.84 0.88 0.90
user particularly in the poor search environment, and it is also applicable with
good search engine to further refine the seed list.
We analyze the root cause of the above experimental results. Since the purpose
of selecting seed documents is to find those representative documents containing
many topical words, ideally, the weights of the topical words in each category are
much larger than non-topical words.
• With the first baseline, seed documents containing any of the category key-
words are randomly ordered (not by its relevance to the query), the good
seeds are most possibly missed in the top list, so the precision is very poor;
• For the second baseline, because the seed documents are ranked according
to descended order of their similarity score with the query words (subset of
the topical words), the higher the score, the more possible to the documents
to be selected as seeds, which leads to the topical words getting greater
30

weights than other common words, so the precision is better than the first
baseline;
• When applying relevance feedback, the seed candidates are further filtered
by computing its similarity with the centroid or refined centroid of each
category, since centroid vector better describes the category information.
The top ranked documents selected in this way are more likely to be good
seeds, this is shown in the comparison with the two baselines;
• The performance of refined centroid method is better than traditional cen-
troid method, which is mainly because the weights of common words to all
categories and non-topical words in a particular category are both decreased
by using Rocchio Regular relevance feedback, so that the refined centroid
vector better reflects the characteristics of the topic. Thus, the accuracy of
the top ranked documents are higher than traditional centroid method.
5.3 Tracking Evaluation
In order to investigate the effectiveness of our method in collecting training sam-
ples, we use ModApte split of Reuters-21578 dataset to do the performance eval-
uation. In the ModApte training set, there are totally 9,604 documents, and 7,775
documents are labeled. Among the 7,775 documents, 6,552 documents are sin-
gle labeled and this leads to 54 categories that have more than one sample in the
training set. Without loss of generality, we suppose the category tree is constructed
with these 54 nodes and the tree structure is flat.
31

In our system, we assume that the dataset doesn’t exist and the documents are
crawled from the web. In this scenario, the new document arrives one by one,
and the classification is applied on each incoming document sequentially. Our
topic tracking algorithm is actually an incremental learning process, it will update
the cluster centroid when new documents are labeled to a certain cluster. So, it
is not easy to compare our algorithm with general supervised or semi-supervised
learning algorithm. But we want to see if our incremental learning algorithm can
perform better than traditional supervised learning method, so, we select an SVM
algorithm [37] to make a comparison. We have to mention that, such a comparison
is not very fair in a strict discipline.
In the following experiments, micro-average precision, recall and F1 measure
are used to evaluate the classification performance. With Reuters data, each time
n documents are selected for each category from the 6,552 documents. These n
documents are seeds for topic tracking and training samples for SVM algorithm
as well. Because the training samples in ModApte data set are not uniformly
distributed, the total document number does not increase linearly with n.
In keyword-based content normalization, 20 keywords are selected to filter the
document content. The three formulas (1,2,3) described in Section 2.2 are used
to compute the keyword weight respectively. In the computation, Q0 is ignored;
and in formula (3), the non-relevant document is ignored in our experiments. In
topic tracking, we set α = 0.2, and λ = 15 in the experiment because these two
values showed persistent performance on several different data set in our previous
experiences.
32
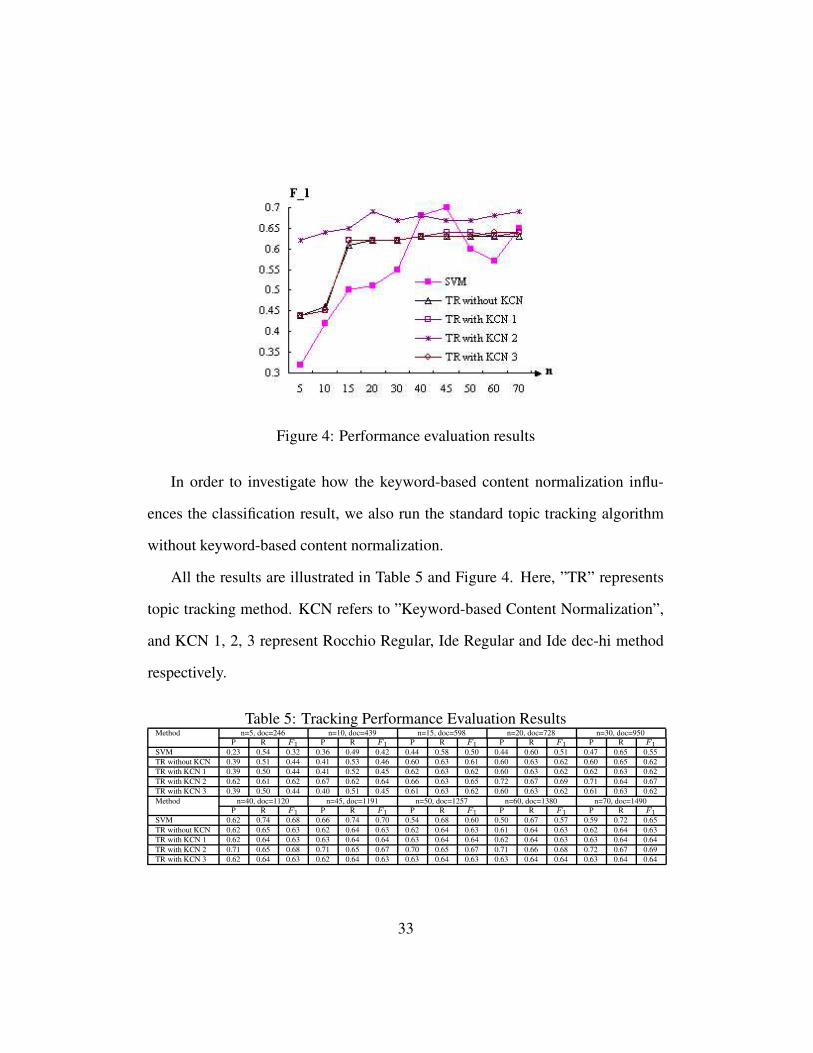
Figure 4: Performance evaluation results
In order to investigate how the keyword-based content normalization influ-
ences the classification result, we also run the standard topic tracking algorithm
without keyword-based content normalization.
All the results are illustrated in Table 5 and Figure 4. Here, ”TR” represents
topic tracking method. KCN refers to ”Keyword-based Content Normalization”,
and KCN 1, 2, 3 represent Rocchio Regular, Ide Regular and Ide dec-hi method
respectively.
Table 5: Tracking Performance Evaluation ResultsMethod n=5, doc=246 n=10, doc=439 n=15, doc=598 n=20, doc=728 n=30, doc=950
P R F1 P R F1 P R F1 P R F1 P R F1
SVM 0.23 0.54 0.32 0.36 0.49 0.42 0.44 0.58 0.50 0.44 0.60 0.51 0.47 0.65 0.55TR without KCN 0.39 0.51 0.44 0.41 0.53 0.46 0.60 0.63 0.61 0.60 0.63 0.62 0.60 0.65 0.62TR with KCN 1 0.39 0.50 0.44 0.41 0.52 0.45 0.62 0.63 0.62 0.60 0.63 0.62 0.62 0.63 0.62TR with KCN 2 0.62 0.61 0.62 0.67 0.62 0.64 0.66 0.63 0.65 0.72 0.67 0.69 0.71 0.64 0.67TR with KCN 3 0.39 0.50 0.44 0.40 0.51 0.45 0.61 0.63 0.62 0.60 0.63 0.62 0.61 0.63 0.62Method n=40, doc=1120 n=45, doc=1191 n=50, doc=1257 n=60, doc=1380 n=70, doc=1490
P R F1 P R F1 P R F1 P R F1 P R F1
SVM 0.62 0.74 0.68 0.66 0.74 0.70 0.54 0.68 0.60 0.50 0.67 0.57 0.59 0.72 0.65TR without KCN 0.62 0.65 0.63 0.62 0.64 0.63 0.62 0.64 0.63 0.61 0.64 0.63 0.62 0.64 0.63TR with KCN 1 0.62 0.64 0.63 0.63 0.64 0.64 0.63 0.64 0.64 0.62 0.64 0.63 0.63 0.64 0.64TR with KCN 2 0.71 0.65 0.68 0.71 0.65 0.67 0.70 0.65 0.67 0.71 0.66 0.68 0.72 0.67 0.69TR with KCN 3 0.62 0.64 0.63 0.62 0.64 0.63 0.63 0.64 0.63 0.63 0.64 0.64 0.63 0.64 0.64
33

Table 5 shows that with small labeled corpus, our method can achieve better
performance than SVM method. Especially, with 5 training samples for each cat-
egory and using keyword-based content normalization with Ide Regular formula,
the performance of our method is better than that of SVM algorithm with 30 train-
ing documents for each category. This is mainly due to the incremental updating
of the cluster centroid and dynamic term weighting scheme.
It follows from the comparison result in Table 5 that the topic tracking with
keyword-based content normalization improves the classification accuracy greatly.
We can further concludes from Table 5 that the method of Ide Regular method per-
forms better than the other two methods.
Besides using Reuters data to make evaluation on our classification algorithm,
we also make another online corpus collecting experiment. Assume that the task
is to gather relevant news reports about the activities of IBM’s different business
units, for example, Global Services, Software, System and Technology, and etc.
The data source is the Internet. Several large IT web sites are selected as data
source, like it.sohu.com, tech.sina.com.cn, www.ccidnet.com, www.ccw.com.cn,
www.ciweekly.com, www.nanfangdaily.com.cn, www.it168.com, and etc. These
web sites are all in Chinese. We asked one annotator to fulfill the task with our
taxonomy building tool.
Six categories are defined for the taxonomy, they are Global Services, Sales
and Distribution, Software, System and Technology, Research, Personal System.
Firstly, the annotator goes to the above news web sites and search relevant news for
each category. Table 6 lists the initial queries the annotator used, which are trans-
34

lated from Chinese. In this way, 36 documents are selected as seed documents.
Then the annotator works with the tool to interactively gather new documents
from the web site. During the process, the documents not containing ”IBM” will
be discarded by our system. Finally we got 759 documents. In the comparison ex-
periment, 100 documents are extracted as test data, and the other 659 documents
as training data for performance evaluation. Table 7 lists the evaluation result.
Table 6: User’s Query Words (Translated)Category Name Query TermsGlobal Services +IBM +”Global Services”, +IBM +solutions
Research +IBM +researchPersonal System +IBM +PC, +IBM +”personal computer”, +IBM +thinkpad, +IBM +laptop
Software +IBM +middleware, +IBM +softwareSystem and Technology +IBM +server, +IBM +systems, +IBM +hardwareSales and Distribution +IBM +sales, +IBM +market
Table 7: Tracking Performance Evaluation Result 2Method doc=36 doc=79 doc=155
P R F1 P R F1 P R F1
TR without KCN 0.38 0.10 0.16 0.63 0.68 0.65 0.57 0.65 0.61TR with KCN 1 0.44 0.15 0.23 0.59 0.69 0.64 0.55 0.65 0.60TR with KCN 2 0.35 0.12 0.17 0.64 0.73 0.68 0.60 0.72 0.65TR with KCN 3 0.43 0.12 0.18 0.65 0.69 0.67 0.57 0.69 0.62Method doc=253 doc=342 doc=434
P R F1 P R F1 P R F1
TR without KCN 0.67 0.76 0.71 0.63 0.79 0.70 0.64 0.72 0.67TR with KCN 1 0.49 0.60 0.54 0.64 0.77 0.70 0.61 0.76 0.67TR with KCN 2 0.66 0.81 0.72 0.62 0.78 0.69 0.61 0.77 0.68TR with KCN 3 0.65 0.81 0.72 0.62 0.78 0.69 0.59 0.74 0.66Method doc=523 doc=596 doc=659
P R F1 P R F1 P R F1
TR without KCN 0.57 0.72 0.63 0.58 0.73 0.64 0.64 0.72 0.67TR with KCN 1 0.59 0.73 0.65 0.56 0.71 0.63 0.58 0.73 0.65TR with KCN 2 0.58 0.73 0.65 0.60 0.76 0.67 0.63 0.79 0.70TR with KCN 3 0.56 0.71 0.62 0.58 0.73 0.64 0.60 0.76 0.67
From the testing results, it is shown that the system works generally well ex-
cept the first iteration. In the first iteration, the average F1 measure is relatively
low(around 0.20), this is mainly because the topic of each category is broad, so,
several documents per category could not cover the topical content. When more
35

documents are added to the training set, the performance is increased significantly.
Among the four methods compared, topic tracking method with Ide Regular for-
mula has better classification accuracy, it outperforms the other methods among
most of the experiments; but unfortunately, overall there is no big gain observed
over the baseline.
We further studied the reason for this experiment result. The performance in
the second experiment is due to the following two reasons: one is data source, the
other is topic coverage.
• Data source: Gathering documents from the web is a challenge to the sys-
tem. Unlike Reuters-21578 data set with clean content, the web pages are
in various style and format. Most of them are written in HTML table and
contain a lot of advertisements and menu links, this makes the content ex-
traction very difficult. Although we use automatic content extraction algo-
rithm to extract the content, and apply keyword-based normalization to filter
un-useful information during tracking, but it is unavoidable that some noise
remains.
• Topic coverage: The topics of Reuters-21578 data set are relatively narrow,
each category is a sub topic of financial and economic trade area. But the
topics in the second experiment are broader, each category may cover a
lot of sub-categories, but in our experiment, we didn’t split them further,
this leads to the less coherence in each category. Since the topic tracking
algorithm is a clustering based method, this will occasionally introduce non-
36

topical documents into the category (false positive), in the end the whole
performance is decreased. So, from this experiment, we learn that it is
better to define specific topics (narrow topics) to collect the training corpus,
so that the topic tracking algorithm can achieve better performance.
5.4 Data Quality Checking
In this experiment, we choose ten categories from the Reuters-21578 training set,
each category has 5 seeds. Test data are those single labeled to one of the ten cate-
gories in the ModApte test set, this leads to 114 documents. Firstly, topic tracking
without keyword-based content normalization is applied to classify the 114 docu-
ments. After that, k-means clustering runs on the same test dataset, cluster number
is ten. The Shannon entropy is listed in Table 8.
Table 8: Shannon Entropy Measure of K-means ClusteringCluster Num Label Entropy
0 livestock 1.04781 gold 0.50042 ipi 0.20713 sugar 0.58644 iron-steel 0.78485 natgas 0.41426 gold 0.00007 bop 0.39868 sugar 0.50049 heat 0.0000
Total Entropy 0.4180
The documents in each cluster are assumed to be labeled to the category that
37

the cluster is most closely matched. Then the cluster labeling result is compared
with that of the topic tracking algorithm, this leads to 33 documents to be checked.
Among these 33 documents, only 4 documents are correctly labeled by topic
tracking, and the other 29 documents are incorrectly labeled. Another 7 docu-
ments not flagged by the entropy method are mislabeled. In order to investigate
the effect of such misses, we extract 283 single-labeled documents belonging to
the ten categories from ModApte training set to evaluate the classification accu-
racy. The average F1 measure with the initial training seeds is 0.79; before the
33 documents are relabeled, the F1 measure is 0.82; if all the 114 documents are
correctly labeled, F1 measure can reach to 0.87; but with the mislabeled data, F1
measure is 0.86. This experiment shows that the consistency checking method
can pickup the error points from the tracking result effectively and save human’s
labeling efforts in a certain degree, but it is also inevitable to mislabel some data,
so more work is necessary to further refine the quality of the corpus.
5.5 Hierarchy generation
A sample taxonomy built by our tool is a computer market intelligence taxonomy
for a customer that provides information technology consulting service. The hi-
erarchical taxonomy contains 47 nodes. The topics include macro environment
(such as economy, politics, regulations, and technologies), information technol-
ogy products and services (such as PC, laptop, server, storage, IT service, net-
working and telecommunications, software, peripheral, and etc.), and vertical in-
dustry (such as construction, education, consumer, media, transportation, health
38

care, and etc.).
The whole working procedure is: At the beginning, the annotator spent some
time to get familiar with the corpus building tool via user manual and live demo.
Then the annotator studied each category to pick a specific topic. Since our goal
is to collect market intelligence information from different angles, the document
content needs to talk about the market analysis, activities of vendors, new tech-
nologies in each industry, and the market trends. After that, the annotator started
to build the corpus via our tool. Initially they submit several queries to web search
engines to get representative documents. Our system gave some recommendations
on the search result. The annotator selected three seed documents for each cate-
gory and packaged them to the customer for confirmation. This took two rounds
of discussion. When the initial seeds were finalized, the annotator could work
alone with the corpus building tool to enlarge the data set. All the documents
are from the web. The annotator expanded the corpus iteratively. That means,
in each iteration about two hundred of documents were crawled and then labeled
by our system automatically. Because the web contains lots of pages, a part of
the incoming documents were discarded by our system. After that, the entropy
method was used to detect suspected samples and proposed them to the annota-
tor for checking. The annotator then corrected the labels and entered to a new
iteration. At last, the annotator collected 1901 documents for this category tree.
During the corpus collecting process, the annotator judged 627 documents, and in
the whole corpus, 198 documents were mislabeled. When the flat structure were
built completely, automatic hierarchy generation method was applied to construct
39

the taxonomy. Finally, the annotator adjusted the hierarchical structure to make it
more reasonable to understand. Totally it took the annotator about three weeks to
complete the process of building such a taxonomy.
Figure 5 shows the hierarchies of the subtree of this taxonomy. The generated
hierarchy is evaluated and validated by the domain experts. In Figure 5, each block
represents the similarity between the corresponding row and column categories.
The darker the color is, the more similar the categories are. We can observe from
the dendrogram that most of the semantic similarity of categories is reasonable.
This dendrogram is also helpful for the user to refine the taxonomy manually.
Figure 5: Hierarchy Generation on the Example Dataset
40
6 Related Work
6.1 Training Set Generation
Training dataset is very important for text categorization. However, good test
collections are very rare by now. This is because constructing a new dataset for
text categorization requires huge manual effort to label the documents. Recently
several research papers have been focused on generating the labeled datasets au-
tomatically.
Adami et al. [1] propose a semi-automatic process to obtain a hierarchical
document classifier starting from an empty taxonomy. They use bootstrapping
process to make a hypothesis of categorization for a set of unlabeled documents.
Based on a revision of Self-Organizing Maps, namely TaxSOM, the proposed
method can organize the unlabeled data according to a given taxonomy, using in-
formation coming from both node labels and from their topological organization.
There are many differences between their method and ours. In our method, the
system only takes a flat empty taxonomy as input, the documents including the
seed documents and the large corpus are all collected from the web dynamically,
and the hierarchical taxonomy is generated using the discriminant projection ap-
proach based on the flat taxonomy; while [1] takes an empty taxonomy and unla-
beled documents as input to build the hierarchical taxonomy, which assume all the
candidate documents are related to at least one category of the given taxonomy.
The other difference is that, in [1] the human’s interaction is to manually check
the hypothesis formulated by the machine, that is, confirming or discarding the
41

category of a given document, [1] doesn’t provide any techniques to reduce this
effort; in our system, we use Shannon entropy to find suspected categories for user
to check, without browsing whole collection of the documents.
Godbole et al. [16] present a document annotation method through interactive
supervision of document and term labels. Actually their method is based on active
learning of SVM algorithm, which actively collects user opinion on feature rep-
resentations as well as whole-document labels to minimize the user’s annotation
efforts. The user can inspect and tune discriminating terms based on the system’s
active learning on terms, especially in the initial stages of bootstrapping a labeled
corpus. Our method has the similar starting point. While in our system, the user
can provide several topic terms to fetch good documents for each category.
Aggarwal et al. [2] propose a supervised clustering method to adjust the pre-
existing taxonomy. Their method assumes that pre-existing training samples with
the associated categories are available.
Davidov et al. [8] describe a system for automatically acquiring labeled
datasets for text categorization from the World Wide Web by capitalizing on the
existing hierarchical directory structures such as the Open Directory. They define
parameters to control the difficulty of the generated datasets for categorization.
However, their dataset generation does not consider the content of the datasets.
We compare our method with other similar taxonomy building methods in
terms of pre-existing data, taxonomy and human labor needed. Table 9 shows that
our method focuses on building taxonomies without pre-existing taxonomy and
data.
42

Table 9: Taxonomy Building Methods ComparisonMethod pre-existing data pre-existing taxonomy human labor
initial corpus quality checkingour method No No Low Low
Adami Unlabeled No Low -Godbole Unlabeled No Low LowAggarwal Labeled Yes Middle Low
Compared with the other methods, the features of our taxonomy building pro-
cess are:
• Allowing users to define the flat taxonomy at the beginning, and then con-
struct tree structure via hierarchical generation method, which gives the
users much flexibility to define the taxonomy according to human’s under-
standing.
• Starting from several seed documents and enlarging the whole training cor-
pus incrementally, which avoids the users to handle a large data set at the
very beginning;
• Giving recommendations to the annotator in the seed selection stage, which
speeds up the initial training set construction.
• Automatically filtering out a quantity of non-topical documents in each it-
eration, which helps users focus on most likely topical documents.
• Automatically detecting the wrong labeled data and alerting the users to
check and relabel them, which make users save a lot of efforts to check all
the data manually.
43

6.2 Hierarchy Generation
Our work also share some commonalities with clustering and summarizing web
search results [39, 22, 55, 56, 51, 49, 11]. Their methods try to group the search
results into clusters and provide easy access and browsing ways for user to get
information. Our method is different than them at picking good seed documents
from the search results and building hierarchical taxonomies.
The organization of a collection of documents into hierarchies derived auto-
matically from the collection itself has been studied in information retrieval [18,
41, 24, 25, 35]. These studies usually are based on selecting topic terms (salient
terms that can identify main themes in the document set) and/or frequently occur-
ring phrases. These term/phrase based hierarchy are mainly used for document
summarization and navigation rather than document classification.
6.3 Linear Discriminant Projection
Little work has been reported on using discriminant projection approach in the
document analysis domain. Chakrabarti et al. [7] propose a fast text classification
approach via multiple linear projections. It first projects training instances to low-
dimensional space and then using decision trees on the projected spaces. Li et al.
[29, 31] experimentally investigate the use of discriminant analysis for multi-class
classification problems (e.g., text categorization).
44

7 Conclusions
In this paper, we present an automatic method of collecting training samples
to build hierarchical taxonomies, which can help the enterprise prepare train-
ing samples for text categorization task. The main characteristic of this method
is that it can start with several keywords and gather high quality large hierar-
chical corpus semi-automatically. Experimental results show that our automatic
seed selection method is effective in selecting good documents. Our topic track-
ing with keyword-based content normalization method can achieve better perfor-
mance than traditional classification algorithm, especially in the case of small
training corpus. And our consistency checking method is effective to guarantee
the quality of the data. Furthermore, the generated hierarchy taxonomies improve
classification performance in most of the time.
Acknowledgments
The work of Tao Li is partially supported by NSF IIS-0546280 and NIH/NIGMS
S06 GM008205. The authors are grateful to the anonymous reviewers for their
useful comments.
References
[1] Adami, G., Avesani, P., & Sona, D. (2003). Bootstrapping for hierarchical
document classification. Proceedings of the twelfth international conference
45

on Information and knowledge management (pp. 295 – 302). New Orleans,
LA, USA, November 03 - 08, 2003.
[2] Aggarwal, C. C., Gates, S. C., & Yu, P. S. (1999). On the merits of building
categorization systems by supervised clustering. Proceedings of KDD-99, 5th
ACM International Conference on Knowledge Discovery and Data Mining (pp.
352–356). San Diego, California, USA, August 15 - 18, 1999.
[3] Agrawal, R., & Srikant, R. (2001). On integrating catalogs. WWW2001:
Proceedings of the 10th International World Wide Web Conference (pp. 603–
612). Hong Kong, China.
[4] Allan, J. (2002). Automatic hypertext link typing. Proceedings for the Hy-
pertext’96 conference (pp. 42–52). Washington, D.C., USA.
[5] Baeza-Yates, R., & Ribeiro-Neto, B. (1999). Modern information retrieval.
Addison& Wesley.
[6] Beyer, K., Goldstein, J., Ramakrishnan, R., & Shaft, U. (1999). When is
nearest neighbor meaningful? Proceeding of the 7th International Conference
on Database Theory (pp. 217–235).
[7] Chakrabarti, S., Roy, S., & Soundalgekar, M. V. (2002). Fast and accurate
text classification via multiple linear discriminant projections. Proceedings of
28th International Conference on Very Large Data Bases (pp. 658–669). Hong
Kong, China, August 20-23, 2002.
46
[8] Davidov, D., Gabrilovich, E., & Markovitch, S. (2004). Parameterized gen-
eration of labeled datasets for text categorization based on a hierarchical direc-
tory. Proceedings of The 27th Annual International ACM SIGIR Conference
(pp. 250–257). Sheffield, UK: ACM Press.
[9] Doan, A., Madhavan, J., Domingos, P., & Halevy, A. (2002). Learning to map
between ontologies on the semantic web. WWW2002: Proceedings of the 11th
International World Wide Web Conference (pp. 662–673). Hawaii, NY, USA.
[10] Dumais, S., Platt, J., Heckerman, D., & Sahami, M. (1998). Inductive learn-
ing algorithms and representations for text categorization. Proceedings of the
seventh international conference on Information and knowledge management
(pp. 148 – 155). Bethesda, Maryland, United States, November 02 - 07, 1998.
[11] Ferragina, P., & Gulli, A. (2004). The anatomy of a clustering engine for
web, books, news snippets. Proceedings of the Fourth IEEE International Con-
ference on Data Mining (ICDM’04) (pp. 395–398).
[12] Fisher, R. (1936). The use of multiple measurements in taxonomic problems.
Annals of Eugenics, 179–188.
[13] Franz, M., McCarley, J. S., Ward, T., & Zhu, W.-J. (2001). Unsupervised and
supervised clustering for topic tracking. Proceedings of the 24th annual inter-
national ACM SIGIR conference on Research and development in information
retrieval (pp. 310–317). New Orleans, Louisiana, USA, September 9-13, 2001.
47

[14] Freund, Y., Seung, H. S., Shamir, E., & Tishby, N. (1997). Selective sam-
pling using the query by committee algorithm. Machine Learning, 28, 133–
168.
[15] Fukunaga, K. (1990). Introduction to statistical pattern recognition. New
York: Academic Press. 2nd edition.
[16] Godbole, S., Harpale, A., Sarawagi, S., & Chakrabarti, S. (2004). Docu-
ment classification through interactive supervision on both document and term
labels. The 8th European Conference on Principles and Practice of Knowledge
Discovery in Databases (PKDD) (pp. 185–196).
[17] Goldman, S. A., & Zhou, Y. (2000). Enhancing supervised learning with
unlabeled data. Proceedings of the Seventeenth International Conference on
Machine Learning (ICML 2000) (pp. 327 – 334). Stanford University, Stanford,
CA, USA, June 29 - July 2, 2000.
[18] Hearst, M. A., & Pedersen, J. O. (1996). Reexamining the cluster hypothesis:
Scatter/gather on retrieval results. Proceedings of the 19th Annual ACM Inter-
national Conference on Research and Development in Information Retrieval
(SIGIR 1996) (pp. 76–84). ACM Press.
[19] Howland, P., & Park, H. (2004). Generalizing discriminant analysis using
the generalized singular value decomposition. IEEE Transactions on Pattern
Analysis and Machine Intelligence, 26, 995–1006.
48

[20] Jain, A. K., & Dubes, R. C. (1988). Algorithms for clustering data. Prentice
Hall.
[21] Jeon, B., & Landgrebe, D. (1999). Partially supervised classification us-
ing weighted unsupervised clustering. IEEE Transactions on Geoscience and
Remote Sensing, 37, 1073–1079.
[22] Jiang, Z., Joshi, A., Krishnapuram, R., & Yi, L. (2000). Retriever: Improving
Web Search Engine Results Using Clustering (Technical Report). University of
Maryland Baltimore County.
[23] Joachims, T. (1998). Text categorization with support vector machines:
learning with many relevant features. Proceedings of the 10th European Con-
ference on Machine Learning(ECML-98) (pp. 137–142). Dorint-Parkhotel,
Chemnitz, Germany, April 21 - 24, 1998.
[24] Lawrie, D., Croft, W. B., & Rosenberg, A. (2001). Finding topic words for
hierarchical summarization. Proceedings of the 24th annual international ACM
SIGIR conference on Research and development in information retrieval (SI-
GIR’01) (pp. 349–357). New Orleans, Louisiana, United States: ACM Press.
[25] Lawrie, D. J., & Croft, W. B. (2000). Discovering and comparing topic
hierarchies. Proceedings of RIAO 2000. Paris, France, April 12-14, 2000.
[26] Lewis, D. D. Reuters-21578 text categorization test collection. .
http://www.research.att.com/ lewis.
49

[27] Lewis, D. D. (1998). Naive (Bayes) at forty: The independence assump-
tion in information retrieval. Proceedings of the 10th European Conference
on Machine Learning (ECML-98) (pp. 4–15). Chemnitz, DE: Springer Verlag,
Heidelberg, DE.
[28] Lewis, D. D., Yang, Y., Rose, T. G., & Li, F. (2004). Rcv1: A new bench-
mark collection for text categorization research. Journal of Machine Learning
Research, 5, 361–397.
[29] Li, T., Zhu, S., & Ogihara, M. (2003a). Efficient multi-way text categoriza-
tion via generalized discriminant analysis. Proceedings of the Twelfth Interna-
tional Conference on Information and Knowledge Management (CIKM 2003)
(pp. 317–324). New Orleans, LA, USA, November 03 - 08, 2003.
[30] Li, T., Zhu, S., & Ogihara, M. (2003b). Topic hierarchy generation via
linear discriminant projection. Proceedings of the 26th annual international
ACM SIGIR conference on Research and development in information retrieval
(pp. 421–422). Toronto, Canada, July 28 - August 01, 2003.
[31] Li, T., Zhu, S., & Ogihara, M. (2003c). Using discriminant analysis for
multi-class classification. Proceedings of the Third IEEE International Con-
ference on Data Mining (ICDM 2003) (pp. 589–592).
[32] Liu, B., Lee, W., Yu, P., & Li, X. (2002). Partially supervised classification of
text documents. Proceedings of the 19th International Conference on Machine
Learning (pp. 387–394). Sydney, Australia, July 8-12 2002.
50

[33] McCallum, A., & Nigam, K. (1998a). A comparison of event models for
naive bayes text classification. AAAI/ICML-98 Workshop on Learning for Text
Categorization (pp. 41–48).
[34] McCallum, A. K., & Nigam, K. (1998b). Employing EM in pool-based
active learning for text classification. Proceedings of the 15th International
Conference on Machine Learning (ICML-98) (pp. 350–358). Madison, USA,
July 24-27, 1998: Morgan Kaufman Publishers, San Francisco, US.
[35] Nevill-Manning, C. G., Witten, I. H., & Paynter, G. W. (1999). Lexically-
generated subject hierarchies for browsing large collections. International
Journal on Digital Libraries, 2, 111–123.
[36] Nigam, K., McCallum, A. K., Thrun, S., & Mitchell, T. M. (1998). Learning
to classify text from labeled and unlabeled documents. Proceedings of the 15th
Conference of the American Association for Artificial Intelligence (AAAI-98)
(pp. 792–799).
[37] Pavlov, D., Mao, J., & Dom, B. (2000). Scaling-up support vector machines
using boosting algorithm. 15th International Conference on Pattern Recogni-
tion (ICPR 2000) (pp. 219–222).
[38] Robertson, S., Walker, S., Jones, S., Hancock-Beaulieu, M., & Gatford., M.
(1995). Okapi at trec-3. The 3d Text REtrieval Conference (TREC-3).
51
[39] Roussinov, D. G., & Chen, H. (2001). Information navigation on the web by
clustering and summarizing query results. Information Processing and Man-
agement, 37, 789–816.
[40] Salton, G., & Buckley, C. (1990). Improving retrieval performance by rele-
vance feedback. Journal of the American Society for Information Science, 41,
288–297.
[41] Sanderson, M., & Croft, W. B. (1999). Deriving concept hierarchies from
text. Proceedings of the 22nd Annual International ACM SIGIR Conference on
Research and Development in Information Retrieval(SIGIR’99) (pp. 206–213).
Berkeley, California, USA, August 15 - 19, 1999: ACM Press.
[42] Schapire, R. E., & Singer, Y. (2000). Boostexter: A boosting-based system
for text categorization. Machine Learning, 39, 135–168.
[43] Schutze, H., Hull, D. A., & Pedersen, J. O. (1995). A comparison of classi-
fiers and document representations for the routing problem. SIGIR ’95: Pro-
ceedings of the 18th annual international ACM SIGIR conference on Research
and development in information retrieval (pp. 229–237). New York, NY, USA:
ACM Press.
[44] Sebastiani, F. (2002). Machine learning in automated text categorization.
ACM Computing Surveys, 34, 1–47.
52

[45] Seung, H. S., Opper, M., & Sompolinsky, H. (1992). Query by committee.
Proceedings of the fifth annual workshop on Computational learning theory
(pp. 287–294).
[46] Shannon., C. E. (1948). A mathematical theory of communication. Bell
System Technical Journal, 27, 379–423, 623–656.
[47] Singhal, A., Buckley, C., & Mitra, M. (1996). Pivoted document length
normalization. SIGIR’96 (pp. 21 – 29).
[48] Stephen C. Gates, Wilfried Teiken, K.-S. F. C. (2005). Taxonomies by the
numbers: building high-performance taxonomies. Proceedings of the 14th
ACM international conference on Information and knowledge management
(pp. 568 – 577). Bremen, Germany, October 31 - November 05, 2005.
[49] Wang, Y., & Kitsuregawa, M. (2001). Link-based clustering of web search
results. Proceedings of the Second International conference on Web-Age Infor-
mation Management (WAIM’2001) (pp. 225 – 236).
[50] Wayne, C. L. (2000). Multilingual topic detection and tracking: Successful
research enabled by corpora and evaluation. Language Resources and Evalua-
tion Conference (LREC) 2000 (pp. 1487–1494).
[51] Weiss, D. (2002). Introduction to search results clustering. Proceedings of
the 6th International Conference on Soft Computing and Distributed Process-
ing (pp. 82–84). Rzeszow, Poland.
53

[52] Weiss, S. M., Apte, C., Damerau, F. J., Johnson, D. E., Oles, F. J., Goetz, T.,
& Hampp, T. (1999). Maximizing text-mining performance. IEEE Intelligent
Systems, 14, 2–8.
[53] Wiener, E. D., Pedersen, J. O., & Weigend, A. S. (1995). A neural net-
work approach to topic spotting. Proceedings of the 4th Annual Symposium on
Document Analysis and Information Retrieval (SDAIR-95) (pp. 317–332). Las
Vegas, US.
[54] Yang, Y. M., & Liu, X. (1999). A re-examination of text categorization
methods. Proceedings of the 22nd annual international ACM SIGIR conference
on Research and development in information retrieval (pp. 42–49). Berkeley,
California, USA, August 15 - 19, 1999.
[55] Zamir, O., & Etzioni, O. (1999). Grouper: a dynamic clustering interface to
web search results. Computer Networks: The International Journal of Com-
puter and Telecommunications Networking, 31, 1361 – 1374.
[56] Zhang, D., & Dong, Y. (2004). Semantic, hierarchical, online clustering
of web search results. Proceedings of the 6th Asia Pacific Web Conference
(APWEB).
[57] Zhang, D., & Lee, W. S. (2004). Taxonomy integration using support vector
machines. WWW2004: Proceedings of the 13th International World Wide Web
Conference (pp. 472–481). New York, NY, USA.
54

[58] Zhao, Y., & Karypis, G. (2001). Criterion functions for document clustering:
Experiments and analysis (Technical Report). University of Minnesota.
55