an integration of enhanced social force and crowd control
TRANSCRIPT

ORIGINAL ARTICLE
An integration of enhanced social force and crowd control modelsfor high-density crowd simulation
Hoshang Kolivand1,2 • Mohd Shafry Rahim1• Mohd Shahrizal Sunar1 • Ahmad Zakwan Azizul Fata1 •
Chris Wren2
Received: 23 October 2019 / Accepted: 24 September 2020 / Published online: 9 October 2020� The Author(s) 2020
AbstractSocial force model is one of the well-known approaches that can successfully simulate pedestrians’ movements realisti-
cally. However, it is not suitable to simulate high-density crowd movement realistically due to the model having only three
basic crowd characteristics which are goal, attraction, and repulsion. Therefore, it does not satisfy the high-density crowd
condition which is complex yet unique, due to its capacity, density, and various demographic backgrounds of the agents.
Thus, this research proposes a model that improves the social force model by introducing four new characteristics which
are gender, walking speed, intention outlook, and grouping to make simulations more realistic. Besides, the high-density
crowd introduces irregular behaviours in the crowd flow, which is stopping motion within the crowd. To handle these
scenarios, another model has been proposed that controls each agent with two different states: walking and stopping.
Furthermore, the stopping behaviour was categorized into a slow stop and sudden stop. Both of these proposed models
were integrated to form a high-density crowd simulation framework. The framework has been validated by using the
comparison method and fundamental diagram method. Based on the simulation of 45,000 agents, it shows that the
proposed framework has a more accurate average walking speed (0.36 m/s) compared to the conventional social force
model (0.61 m/s). Both of these results are compared to the real-world data which is 0.3267 m/s. The findings of this
research will contribute to the simulation activities of pedestrians in a highly dense population.
Keywords High-density crowd simulation � Crowd simulation � Crowd control models � Social force model
1 Introduction
Animating motion for high-density crowds is a hard task to
be completed. Most researchers used one of the main three
popular approaches to simulate the high-density crowds
including cellular automata model, rule-based model, and
social forces model. Many works from many researchers
have been done to improve the realism of the simulation
[43]. However, these current models are not capable of
realistic simulation of high-density crowds [2, 15]. The
fastest and the least expensive computation is the cellular
automata technique by specific strength of using a parallel
computational model which integrates macroscopic and
microscopic behaviours [42].
Yet, each agent can only move in eight directions. As a
result, the simulation will look like a checkerboard espe-
cially in high-density crowd [30, 40]. The rule-based model
is also comparatively fast showing different behaviours in
simulating high-density crowds [49]. However, this model
does not contain collision detection [1]. As a result, there
are no repulsion forces between agents, which might be
acceptable if the size of the crowd is small. However, if the
size of the crowd is huge, agents might collide with each
other and make it unrealistic [12]. For that reason, rule-
based model is not suitable to simulate high-density crowd
population. The social force model can simulate a crowd
successfully for small or medium-size groups such as metro
station [8, 24]. However, it also degrades the performance
& Hoshang Kolivand
1 MaGIC-X (Media and Games Innovation Centre of
Excellence), UTM-IRDA Digital Media Centre Universiti
Teknologi Malaysia, 81310 Skudai Johor, Malaysia
2 Department of Computer Science, Liverpool John Moores
University, L3 3AF Liverpool, UK
123
Neural Computing and Applications (2021) 33:6095–6117https://doi.org/10.1007/s00521-020-05385-6(0123456789().,-volV)(0123456789().,- volV)

when the size of the crowd increases [51]. The increase in
populations in the crowd makes the resulting simulation
unrealistic since all the agents within the crowd will be
moving at the same flow [27, 45]. These current models for
high-density crowd simulation cannot realistically handle
body-to-body contact for large crowds, and while they
achieve good results for low and medium density crowds in
normal situations (e.g. people walking in a small town or in
a park), they fail to realistically simulate high-density
situations.
High-density crowd agents come from various back-
grounds, which indirectly affect their behaviour, such as
walking speed, genders, and intention outlook. However,
these three characteristics are mostly ignored by other
researchers. Most researchers treat each agent as the same
individual, which means they will have the same walking
speed, genders, and intention outlook [17]. This will make
the crowd movement unrealistic since in a high-density
crowd agents tend to change their walking direction and
speed more often than agents in a sparse crowd [22] mainly
when using data-driven methods [46]. Thus, a proper high-
density crowd simulation needs to handle these kinds of
behaviours.
Most high-density crowd models simulate crowds as
individual agents and not as a group. The existence of
family and friendship groups within the crowd is over-
looked by many researchers [11]. Eliyan et al. [11] pre-
sented a state-based model for group behaviour by
associating some well-known activities. The grouping
behaviour may lead to a dynamic crowd flow
[20, 31, 33, 38], and it is the core issue of crowd simulation
[48]. For example, the agents in groups tend to move
together towards the same direction which causes the other
agents not in the group to make way for the agent within
the group [48]. For that reason, the techniques which
consider the agents only as individuals cannot be general-
ized for the agents that move in groups.
Although bottleneck effect and arc formation are able to
simulate the stopping motion realistically, in high-density
scenarios such as Tawaf, the lack of walls and doors sur-
rounding the crowds cause both models not suitable to be
implemented. However, stopping behaviour still occurs
within high-density crowd due to congestion, slow walking
speed, and indecisive decision of the agents [22]. Chen
et al. [8] tried to establish a bidirectional pedestrian
flow model by considering only two main factors. They are
the impacts between pedestrians and conflict frequency.
This behaviour will affect the trajectories of other agents
whether to stop, slow down, or take another path [26].
Recently, Salehi and Sung [35] presented a velocity-
based technique for simulating crowd when some of the
agents move in a specific formation. The main strength of
this work is considering group movement and collision
(which are a part of our technique) using optimal reciprocal
collision avoidance. The main issues with the presented
method can be feasibility if the obstacles are static.
Moreover, they focused on the scenarios that groups try to
maintain the group formation.
The primary goal of this research is to design a high-
density crowd simulation framework that increases the
realism of high-density crowd simulation, while people
move in groups or individuals such as Tawaf.
2 Method
The social force model is enhanced in developing crowd
simulation. The social force model has been chosen
because it is one of the most adaptable crowd simulation
models to be developed [20]. This model will be modified
and enhanced in order to derive a novel model to improve
the realism of the high-density crowd simulation.
In crowd control model, the pedestrian ‘‘stopping’’
behaviour is developed. Generally, in a large and dense
crowd situation, agents stopping, or stalling occurs com-
monly. Agents have the tendency to stop in the middle of
their path due to several factors; other agents blocking their
path, their paths collide with other people’s paths or the
area is too crowded to move. Thus, it is important that this
behaviour is included in this research.
After both crowd simulation model and crowd control
model are completed, these two models need to be inte-
grated so that it can produce a novel high-density crowd
simulation framework.
2.1 Social force model
Social force model just assumes that everyone within the
crowd has the same characteristics, which make the
pedestrians within the crowd simulation move in a uniform
pattern without any hectic behaviour of a typical crowd. To
manage this problem, we have introduced a new concept
called a Zahmah.
Pedestrians in crowd simulation are called agents. Each
agent position is defined in two dimensions: x-axis and y-
axis. As an example, for agent a, the agent’s position pa is
represented on the x-axis as xa and the position on the y-
axis as ya. Agents do not have the third dimension because
they mostly just walk on a flat surface. (A full description
of symbols is presented in ‘‘Appendix’’.)
The main force in social force model is the driving
force, f~drive. This force is described as the motivation of the
agent a to move towards the desired direction da. The agent
will move according to his or her desired walking velocity,
v~a, while vda is the deviation of v~a, where v~c is the actual
6096 Neural Computing and Applications (2021) 33:6095–6117
123

walking velocity of the agents and sa is the relaxation time
for agent a. Relaxation time is the finite amount of time
that is required for agents to react and physically change
their velocity [14, 16, 35, 50].
To get the desired direction, d~a of agent a is by calcu-
lating the distance between destination or goal position of
agent a, g~a and the current position of agent a, p~a. Goal
position is the main objective which motivates agent a to
walk, while the current position is the position of agent a at
that time. Since g~a and p~a are both vector values, the use of
double modulus is more suitable to represent the norm
value [14, 50].
The second force is the repulsion forces between agents
within the crowd. This force is important so that the agents
do not collide with each other. Each agent will have their
own, repulsion strength. The strength depends on the dis-
tance between agents with another agent in that scenario,
for example the position of agent a p~a and position of agent
b p~b. Each agent also will have their radius of interaction,
ra and rb, respectively. This determines the distance for
each interaction start. Lastly, n~ab is the normalized vector
pointing from agent a towards agent b.
In conclusion, the social force model consists of three
forces that work together to determine the next position of
the agent during that period. These forces are driving force
f~drive, repulsion force, f~repulsion, and attraction force,
f~attraction. This is a continuous process until all the agents
arrived at their goal position. This sum of all forces f~social
describes the movement and direction of the agent as
shown in Eq. 1 [14, 50]. Goal position is the main objective
which motivates agent a to walk, while the current position
is the position of agent a at that time. In order to get the
desired direction towards the goal (Fig. 1), the distance
between destination or goal position of agent a ga and the
current position of agent a pa needs to be calculated
g~a � p~a= g~a � p~aj jð Þ which | | represents the magnitude of
related vectors. Moreover, deviation of walking speed of
the agent is the factor to transmit the agent to the desired
destination. This is while the actual walking velocity has
not started from 0. Figure 1 shows this concept.
In terms of repulsion force between two objects a and b,
it is exponential with the direct proportion of the distance
between two agents and inversely proportional with the
radius of interaction for the agents. This amount must be
calculated in the direction of agent a towards agent b n~ab� �
.
The last force contributing in SFM is attraction force
which is in the same direction of repulsion force but with
the magnitude of a constant called C which is a scaling
parameter of attraction forces between agents from the
same group
f~social ¼ f~drive þXn
a¼1
f~repulsion þXn
a¼1
f~attraction
¼vda
g~a�p~ag~a�p~aj j
� �� v~c
saþXn
a¼1
expjp~a � p~bj
r
� �n~ab
þXn
a¼1
c n~ab� �
ð1Þ
As can be seen in Fig. 2 in standard SFM, agent a moves
towards his or her destination by driving force and interacts
with agent b via interaction force. This is while in the
presented model.
The second force is the repulsion forces between agents
within the crowd. This force is important so that the agents
do not collide with each other. Each agent will have their
own, repulsion strength. The strength depends on the dis-
tance between agents with another agent in that scenario,
for example the position of agent a p~a and position of agent
b p~b, which is shown in Fig. 3.
Our new presented model extends the existing social
force model by making the three main forces as the fun-
damental forces, which are the driving force, repulsion
force and attraction force (Fig. 4 (left)).
Fig. 1 Driving force for SFM Fig. 2 Basis forces of social force model
Neural Computing and Applications (2021) 33:6095–6117 6097
123

The new model is presented to improve the social force
model which is called Zahmah Social Force Model
(ZFSM) (Fig. 4(right)). The ZSFM extends the existing
social force model by making the three main forces as the
fundamental forces, which are the driving force, repulsion
force, and attraction force. The time complexity for the
standard social force model as can be seen from Eq. 1 isPn1 O 1ð Þ þ O nð Þ þ O nð Þð Þ ¼ O n2ð Þ, which later we will
see it is the same as our presented method.
One of the new forces of ZSFM is the intention outlook
force. The intention of outlook or goal is the desired
position that each agent wants to go. The goal position is
different for each agent.
In a simple crowd simulation, the goal positions are
normally linear; thus, agents will walk directly towards
their intended position. However, during Tawaf, agents
need to circle around the Kaabah, thus making it the epi-
centre of the circumambulation, t. Other than that since the
agents are moving around the Kaabah, his/her position is
the goal position of the agents. Thus, in ZSFM the goal
position, g~a will constantly move around the Kaabah to
make the agents circle around the Kaabah (Eq. 2 and
Fig. 5). Parameter d is the distance between the agent’s
goal position g~a from their current position p~a. The smaller
the distance value (d), the more accurate the rotation cal-
culation around the Kaabah will be, since the movement
will be more circular.
g~a ¼ p~a þd t~� p~a
� �� Y~
t~� p~a
� �� Y~
�� �� ð2Þ
Gender plays an important role in crowd simulation. This is
because it will influence the behaviour of the agent in terms
of the interaction with other agents especially in our case
study (Tawaf). In a basic crowd simulation, the goal
positions are normally linear, and agents will walk directly
towards their intended position. However, during Tawaf,
there are several rules that need to be followed by each
pedestrian. One of these rules is that agents with a different
gender cannot touch each other. If they touched each other,
both of them have to restart their Tawaf ritual all over
again. Thus, pedestrians will try to avoid each other if they
encounter different gender agents.
Fig. 3 Repulsion forces
between agents
Fig. 4 (left) Basic social force model forces, (right) proposed model
t
d
Movement direction
Kaabah Agent α position,
Goal position,
Fig. 5 Movement of agent’s position and goal position
6098 Neural Computing and Applications (2021) 33:6095–6117
123
None of the previous researchers is focusing on simu-
lating the different interactions between both genders. This
is because mostly in other situations there are only minor
differences between both interactions [17, 25]. However, in
Tawaf scenario, it plays a very important part to simulate
the situation precisely [36]. In order to simulate this situ-
ation, the interaction force equation has been modified to
make it more suitable to be used in ZSFM. The repulsion
force from the social force model is modified by intro-
ducing a new scalar parameter, s (Eq. 3), which controls
the strength of the repulsion forces. For example, if two
different gender agents meet, the value of the scalar
parameter s will be increased compared to where two
agents with the same gender meet.
f~gender ¼ s expjp~a � p~bj
r
n~ab
� �ð3Þ
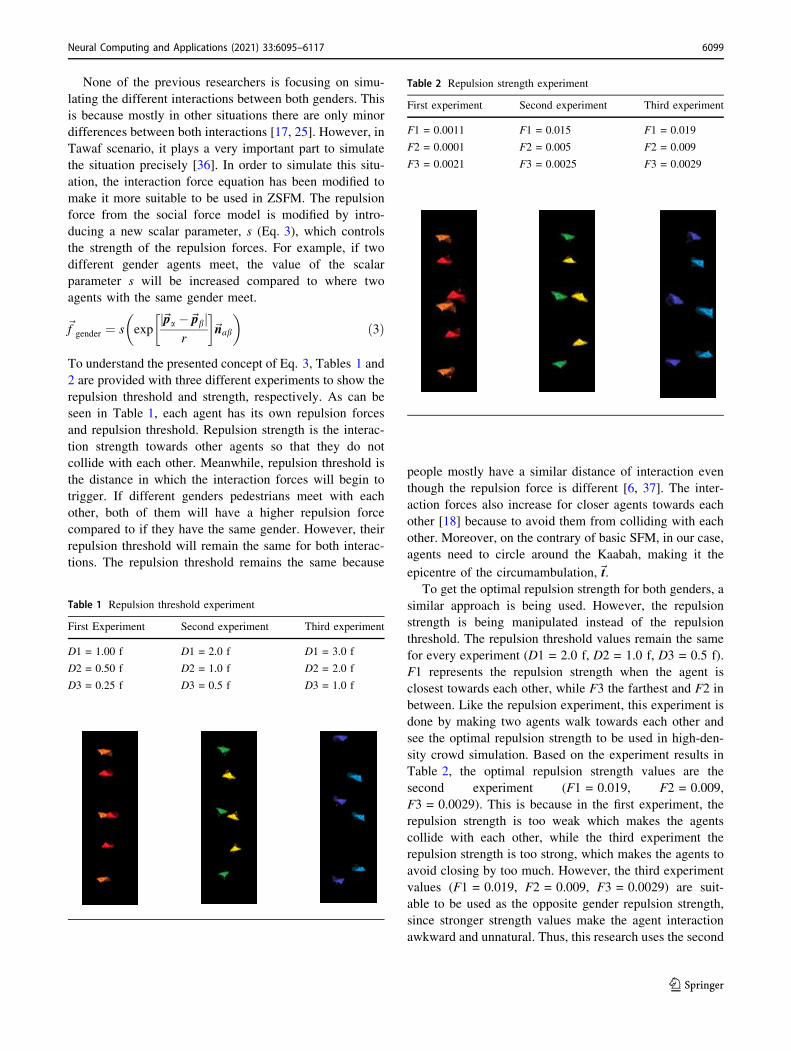
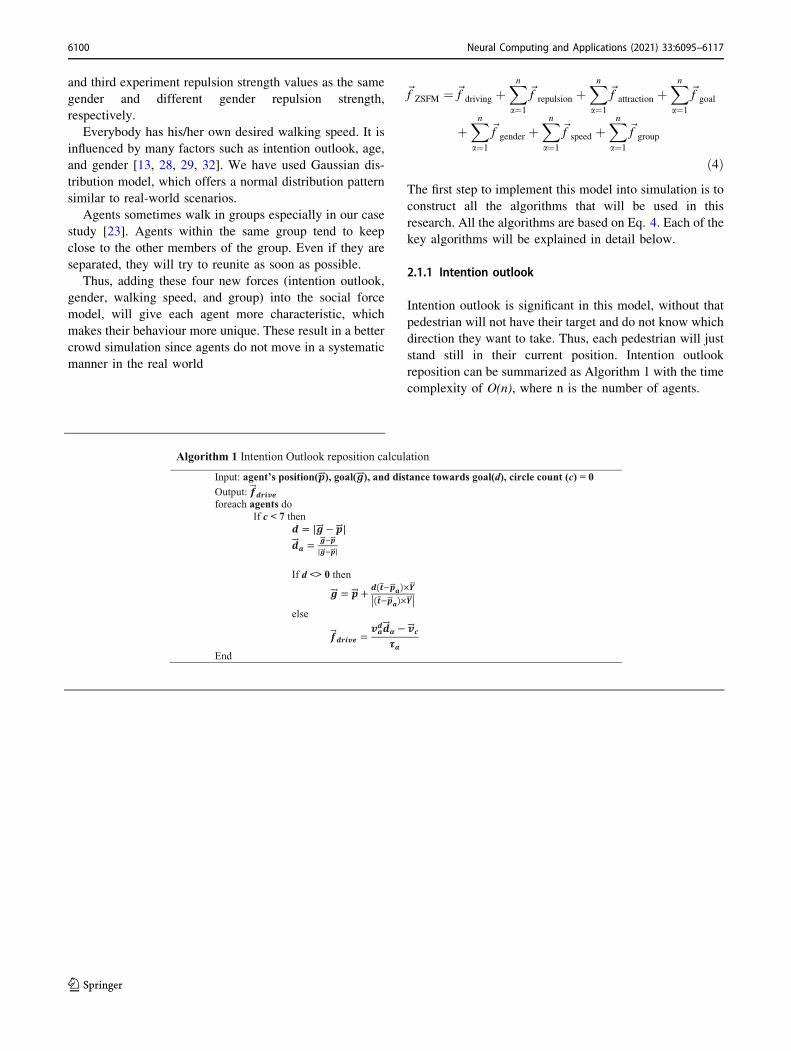
To understand the presented concept of Eq. 3, Tables 1 and
2 are provided with three different experiments to show the
repulsion threshold and strength, respectively. As can be
seen in Table 1, each agent has its own repulsion forces
and repulsion threshold. Repulsion strength is the interac-
tion strength towards other agents so that they do not
collide with each other. Meanwhile, repulsion threshold is
the distance in which the interaction forces will begin to
trigger. If different genders pedestrians meet with each
other, both of them will have a higher repulsion force
compared to if they have the same gender. However, their
repulsion threshold will remain the same for both interac-
tions. The repulsion threshold remains the same because
people mostly have a similar distance of interaction even
though the repulsion force is different [6, 37]. The inter-
action forces also increase for closer agents towards each
other [18] because to avoid them from colliding with each
other. Moreover, on the contrary of basic SFM, in our case,
agents need to circle around the Kaabah, making it the
epicentre of the circumambulation, t~.
To get the optimal repulsion strength for both genders, a
similar approach is being used. However, the repulsion
strength is being manipulated instead of the repulsion
threshold. The repulsion threshold values remain the same
for every experiment (D1 = 2.0 f, D2 = 1.0 f, D3 = 0.5 f).
F1 represents the repulsion strength when the agent is
closest towards each other, while F3 the farthest and F2 in
between. Like the repulsion experiment, this experiment is
done by making two agents walk towards each other and
see the optimal repulsion strength to be used in high-den-
sity crowd simulation. Based on the experiment results in
Table 2, the optimal repulsion strength values are the
second experiment (F1 = 0.019, F2 = 0.009,
F3 = 0.0029). This is because in the first experiment, the
repulsion strength is too weak which makes the agents
collide with each other, while the third experiment the
repulsion strength is too strong, which makes the agents to
avoid closing by too much. However, the third experiment
values (F1 = 0.019, F2 = 0.009, F3 = 0.0029) are suit-
able to be used as the opposite gender repulsion strength,
since stronger strength values make the agent interaction
awkward and unnatural. Thus, this research uses the second
Table 1 Repulsion threshold experiment
First Experiment Second experiment Third experiment
D1 = 1.00 f D1 = 2.0 f D1 = 3.0 f
D2 = 0.50 f D2 = 1.0 f D2 = 2.0 f
D3 = 0.25 f D3 = 0.5 f D3 = 1.0 f
Table 2 Repulsion strength experiment
First experiment Second experiment Third experiment
F1 = 0.0011 F1 = 0.015 F1 = 0.019
F2 = 0.0001 F2 = 0.005 F2 = 0.009
F3 = 0.0021 F3 = 0.0025 F3 = 0.0029
Neural Computing and Applications (2021) 33:6095–6117 6099
123
and third experiment repulsion strength values as the same
gender and different gender repulsion strength,
respectively.
Everybody has his/her own desired walking speed. It is
influenced by many factors such as intention outlook, age,
and gender [13, 28, 29, 32]. We have used Gaussian dis-
tribution model, which offers a normal distribution pattern
similar to real-world scenarios.
Agents sometimes walk in groups especially in our case
study [23]. Agents within the same group tend to keep
close to the other members of the group. Even if they are
separated, they will try to reunite as soon as possible.
Thus, adding these four new forces (intention outlook,
gender, walking speed, and group) into the social force
model, will give each agent more characteristic, which
makes their behaviour more unique. These result in a better
crowd simulation since agents do not move in a systematic
manner in the real world
f~ZSFM ¼ f~driving þXn
a¼1
f~repulsion þXn
a¼1
f~attraction þXn
a¼1
f~goal
þXn
a¼1
f~gender þXn
a¼1
f~speed þXn
a¼1
f~group
ð4Þ
The first step to implement this model into simulation is to
construct all the algorithms that will be used in this
research. All the algorithms are based on Eq. 4. Each of the
key algorithms will be explained in detail below.
2.1.1 Intention outlook
Intention outlook is significant in this model, without that
pedestrian will not have their target and do not know which
direction they want to take. Thus, each pedestrian will just
stand still in their current position. Intention outlook
reposition can be summarized as Algorithm 1 with the time
complexity of O(n), where n is the number of agents.
6100 Neural Computing and Applications (2021) 33:6095–6117
123

2.1.2 Gender
Pedestrians with different gender have greater interaction
forces than pedestrians with the same gender, especially for
Tawaf. To simulate this behaviour, each agent will be set
with two different sets of strength (fa, fb). fa is for same
gender interaction and fb is for opposite gender interaction.
Based on what we discussed already, the gender interaction
can be summarized as Algorithm 2 with the time com-
plexity of O(n), where n is the number of agents.
2.1.3 Walking speed
Each pedestrian has its own walking speed depending on
their gender, age and other factors which are summarized
in Algorithm 3 with the time complexity of O(n), in which
n is the number of agents.
2.1.4 Grouping
Grouping is also a common sight within high-density
crowd. This is because most agents come together with
their family and friends. The agents within the same group
tend to keep close with each other. If they get separated,
they will try to get back together as soon as possible.
Therefore, this behaviour is very important to be integrated
into the crowd simulation model.
The grouping force will follow two of Reynolds rule-
based models. The rules are cohesion and alignment.
Algorithm 4 controls this characteristic.
Cohesion, c~a, is for the formation of the group (Eq. 5).
Each agent location p~a within the same group will be
summed together and then divided by the number of the
group members, m. Hence, the groups will move together
to the same position.
c~a ¼P
p~a
mð5Þ
The next rule is alignment, m~a, which is used to make sure
that every group member moves at the same walking speed
(Eq. 6). A group cannot have a member who walks too fast
or too slow. They must have similar speeds to move
together. Hence, the average speed of the group will be
calculated. The total walking velocity of each agent, v~a,
Neural Computing and Applications (2021) 33:6095–6117 6101
123

will be divided by the total number of the group members,
m:
m~a ¼P
v~a
mð6Þ
The separation rules are eliminated because the repulsion
force of the social force model has a better solution for
collision detection compared to this rule-based model. In
addition, if the separation rule is implemented on top of the
social force model, it will cause redundant of repulsion
forces. This will make the agent move awkwardly and
unnaturally.
As a conclusion, the grouping force will consist of two
rules of Reynolds rule-based models. These rules are
cohesion and alignment. These two rules will be integrated
with the rest of the ZSFM to make a better crowd simu-
lation model (Eq. 7).
Xn
a¼1
f~repulsion ¼ c~a þm~a ð7Þ
The time complexity of Algorithm 4 by considering n
agents and an average number of m people in the groups is
O(n ? m). Due to the fact that m is quite smaller than n,
the whole time complexity is O(n).
2.2 Crowd control model
This section discusses the stopping motion of the high-
density crowd simulation. Most current existing model
only focuses on the walking motion of the crowd simula-
tion; thus, it cannot be used to handle these types of situ-
ations. This study suggested a solution by introducing two
new stopping motions into the high-density crowd simu-
lation, which are sudden stopping and slow stopping.
2.3 Motion stopper
In crowd simulation, it is not enough just to simulate the
path of each agent, and it is also important to calculate the
motion of each agent. Most researchers focus on the sim-
ulation of crowd walking motion. However, agents do not
just walk forever until they reach their destination. Some-
times they stop for some reason such as talking to other
agents or seeing something that grabs their attention
[7, 19, 34]. Stopping motion in high-density crowd simu-
lation is in need and is presented in this section using a
heuristic method for two new stopping motions. First is
sudden, which happens once an agent stops abruptly along
the way his/her path. This is because the agent suddenly
encounters huge conflicting forces. As an example, when
another agent suddenly crosses in front of the walking
agent. The second stop motion is the slow stops, which
happens if the agent slows down before completely stop
walking. This is because the agent encounters small but
continuous conflicting forces. For example, when the agent
follows groups of slow-moving agents, both scenarios will
cause pedestrians to stop if the conflict is big enough to
make the moving forces closer to zero. Agents will stop in
their position for a while before start moving again. It is
because the pedestrians will need to gain enough momen-
tum to start moving [5, 51].
2.3.1 Fundamental of motion stopper
This research has developed another novel model called
motion stopper model (MSM). MSM is a new model used
to control the stopping motion of agents. This model also
created new mathematical equations to make it suitable for
high-density crowd scenarios. This model was based on the
agents’ walking speed. MSM consisted of two main
motions: stopping and walking (Fig. 6(left)). This is
because sometimes agents are walking and sometimes the
agents are stopping. The current crowd simulation model
treats both of this behaviour mutual exclusive.
2.3.2 Motion stopper model (MSM)
Motion stopper model (MSM) is used to simulate the
stopping motion of each agent. MSM basically has two
states, which is walking state and stopping state. The
transitions between these two states are controlled by the
velocity of each agent (Fig. 6 (right)). Agents who are in
the walking state will change to stopping state if their
velocity decreases to almost zero or lower. On the other
hand, agents who are in stopping state will start walking
again if their velocity increases above zero. The increasing
and decreasing velocity is influenced by the conflicting
force towards the agents. As has been already explained, if
the agents encounter huge conflicting forces towards them,
it will force them to stop walking unexpectedly.
6102 Neural Computing and Applications (2021) 33:6095–6117
123

2.3.2.1 Stopping motion MSM controls the stopping
motion of every agent. If the velocity of the agent is almost
zero, the motion of that agent will stop too. It is to avoid
the agents walking in the same place which are unnatural.
Other than that, MSM also controls when the agent will
start walking again. A stopping agent cannot start walking
again immediately after stopping because the agent needs
to regain its momentum to start walking again [5, 51].
Thus, the agent needs to halt for a few seconds before start
walking again. This is done by manipulating the velocity of
the agent as seen in the equations above. If the agents do
not reach a certain value of velocity threshold, he or she
will remain static until the velocity value is over the
threshold.
f~stopper ¼
0 f~walk
������[ 0:01
0:001; 0:001\ f~walk
������� 0:01
f~walk; f~walk
������� 0:001
8>>><
>>>:
ð8Þ
Equation 8 explains about how the MSM will be intro-
duced into the crowd simulation. MSM will initiate a
conflicting force f~stopper towards the agent walking force
f~walk if it is less than the slow stopping threshold value
which is 0.01. This will cause the agent to have a slow
stopping motion. It is because the moving force is quite
low to walking normally. Thus, the agent walking force
will gradually decrease based on time. However, if the
walking force is below the sudden stopping threshold
(0.001), the agent will stop walking abruptly, which is the
sudden stopping motion. The walking force f~walk of the
agent is too low to walk. In the simulation, the agent would
appear like its vibrating. Thus, by introducing the stopping
motion, this vibrating agent is eliminated, which makes the
agent stop moving.
Since the algorithm (Algorithm 5) is based on the
mathematical equation above, the explanation is quite the
same. The time complexity of Algorithm 5 for each agent
is O(1), while for n number of agents is O(n). The agent
will have a slow stopping motion if the moving force is less
than 0.01 and sudden stopping motion if the moving force
is less than 0.001. The agent will start walking again if the
agent’s moving force is higher than the threshold, which is
0.01.
2.3.3 Walking motion
After stopping, the agent cannot suddenly start walking
again. The agent needs to wait for a few seconds to gain
walking force f~walk to start walking again. If the agent
starts walking again too quickly, it is not natural because a
human can start walking so fast so abruptly unless they are
in a sprinting race (Eq. 9):
f~walk ¼0 f~walk
������\0:01
0; time\2 seconds
f~walk; f~walk
������� 0:01
8>><
>>:ð9Þ
Therefore, each agent will be given a two-second buffering
time before they can start walking again. After two seconds
of time, if the agent gains enough walking force f~walk
(above the walking threshold, 0.01), the agent will be
animated. If the force f~walk is too low (below the walking
threshold, 0.01), the agent will remain in the stopping
phase until they gain enough walking force.
Fig. 6 (Left) Motion stopper model, (right) relationship between stopping and walking
Neural Computing and Applications (2021) 33:6095–6117 6103
123

The walking threshold value (0.01) was based on the
experiment which is done by making a stopping agent to
slowly gain enough walking force. The experiment is
repeated until the optimal walking threshold is found. Each
agent in the experiment is given a range of walking force
(0.1–0.0001). The optimal walking threshold is 0.01 which
shows the best walking motion compared to the other
value.
A similar experiment is conducted for the walking time
buffer period. For the starting of the experiment, each agent
is in the walking state. In the middle of their path, the agent
was given the same conflicting forces which make them
stop. After that, each agent will be given the same walking
forces to make them start walking again. The only differ-
ence is that each of them is given a different walking time
buffer, ranging from 0.5 to 5 s. Based on the experiment
results, it shows that the optimal walking time buffer is 2 s,
which shows a natural stop and walking again motion.
Since the algorithm (Algorithm 6) is based on the
mathematical equation above, the explanation is quite the
same. The time complexity of Algorithm 6 for each agent
is O(1), while for n number of agents is O(n). The agent
will start walking again if the agent passes the time buffer.
After that time buffer, if the agent’s force is high enough,
they will start moving again. If not, they will stay in the
stopping phase until they gain enough force.
3 Integration and framework
This section discusses the integration between the Zahmah
social force model (ZSFM) and the motion stopper model
(MSM). The integration will produce a novel crowd sim-
ulation framework that improves the realism of the high-
density crowd simulation.
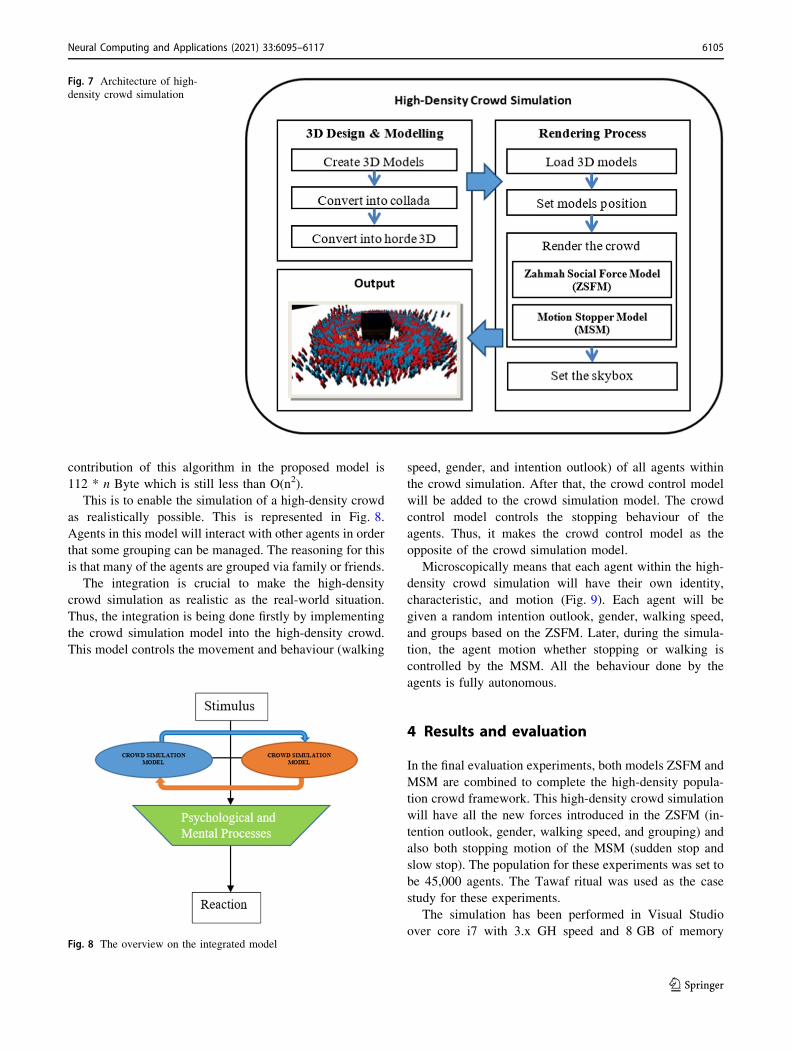
3.1 Architecture of high-density crowdsimulation
This section explains the process of designing and creating
3D models of Kaabah and pilgrims (agents) using MeshLab
tools. The models are created using 3D max and viewed by
using MeshLab tools. Later, the models are saved into the
Collada model which is supported by the horde 3D game
engine.
The high-density crowd simulation is divided into three
main elements: input, main process, and output. The input
of the simulation is the 3D models of agents and Kaabah.
The main process of the simulation is the rendering of the
crowd, which consisted of two main parts: ZSFM and
MSM. The ZSFM will control the movement of the agents,
while the MSM will control the motion of the agents. The
output of the system is the high-density crowd simulation
(Fig. 7).
The rendering process is started by interpreting the 3D
Collada model and then arranging all those models into a
proper position. The first object rendered in this application
is the human character model (agents). The reason being is
the agents have a huge number of polygons compared to
the Kaabah model. After the rendering process of the
agents, it is continued with the Kaabah rendering. The
agents are placed in a certain location around the Kaabah.
The movement and motion are control by ZSFM. The
output of the system is a mass of high-density crowd cir-
cumambulating the Kaabah as the epicentre.
3.2 High-density crowd simulation framework
In simulating the high-density crowd simulation, it is not
enough just to simulate the movement of the crowd. It is
also important to simulate the motion and animation of the
crowd, especially if the simulation is in three dimensions
(3D). The motion part plays an important role in capturing
the realism of the high-density crowd simulation. An
awkward and unnatural agent’s motion within the crowd
will make the simulation less realistic.
Thus, this research proposed two novel models: the
ZSFM and the MSM which control the crowd movement
and crowd motion, respectively. Later, these models were
integrated together into a new crowd simulation framework
to produce a more realistic high-density crowd simulation.
The integration will control every aspect of the crowd
behaviour microscopically.
The proposed framework combines the parameters
(gender, walking speed, intention outlook, and grouping) of
the crowd simulation model. The time complexity of the
proposed model for each agent is the cumulative com-
plexity of all presented algorithms with the proposed model
in Eq. 4, which remains asPn
1 6 � O nð Þð Þ ¼ O n2ð Þ.Therefore, memory consumption is not a concern in this
method. As an example, here is the memory usage of
Algorithm 1: 3 * 4 ? 3 * 4 ? 8?4 ? 3 * 4 ? 3 * 4 ?
3 * 4 ? 3 * 4 ? 8?3 * 4 ? 8=48 ? 112 Byte. Thus, the
6104 Neural Computing and Applications (2021) 33:6095–6117
123
contribution of this algorithm in the proposed model is
112 * n Byte which is still less than O(n2).
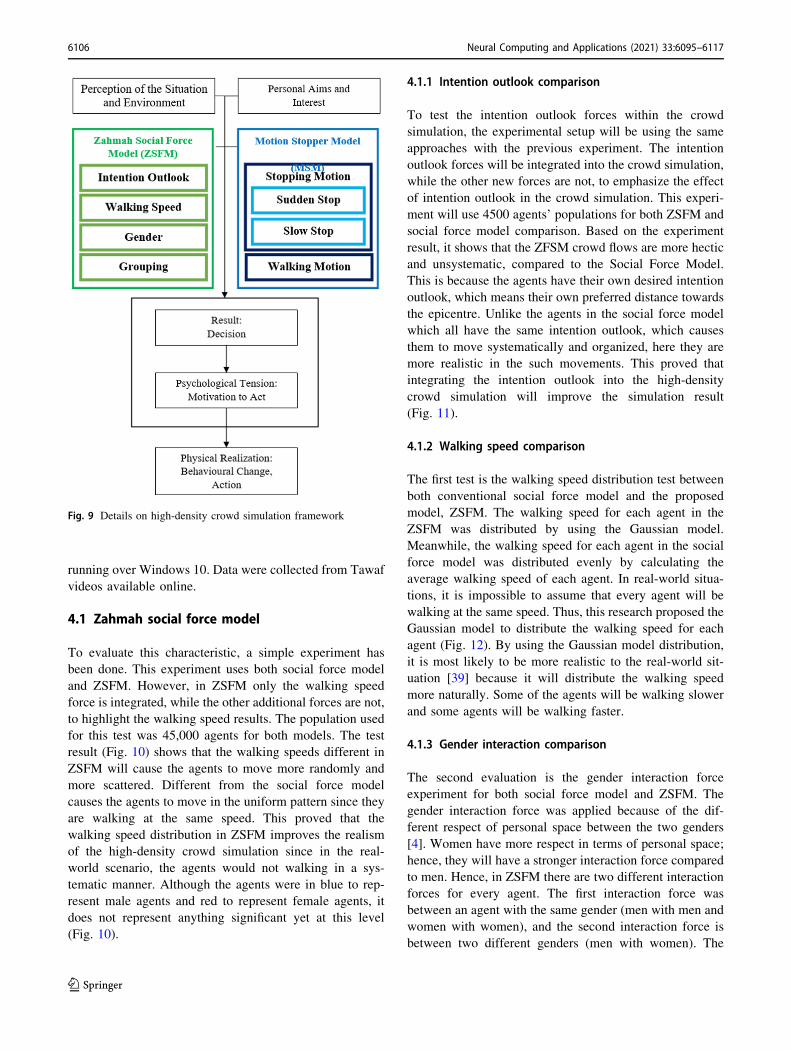
This is to enable the simulation of a high-density crowd
as realistically possible. This is represented in Fig. 8.
Agents in this model will interact with other agents in order
that some grouping can be managed. The reasoning for this
is that many of the agents are grouped via family or friends.
The integration is crucial to make the high-density
crowd simulation as realistic as the real-world situation.
Thus, the integration is being done firstly by implementing
the crowd simulation model into the high-density crowd.
This model controls the movement and behaviour (walking
speed, gender, and intention outlook) of all agents within
the crowd simulation. After that, the crowd control model
will be added to the crowd simulation model. The crowd
control model controls the stopping behaviour of the
agents. Thus, it makes the crowd control model as the
opposite of the crowd simulation model.
Microscopically means that each agent within the high-
density crowd simulation will have their own identity,
characteristic, and motion (Fig. 9). Each agent will be
given a random intention outlook, gender, walking speed,
and groups based on the ZSFM. Later, during the simula-
tion, the agent motion whether stopping or walking is
controlled by the MSM. All the behaviour done by the
agents is fully autonomous.
4 Results and evaluation
In the final evaluation experiments, both models ZSFM and
MSM are combined to complete the high-density popula-
tion crowd framework. This high-density crowd simulation
will have all the new forces introduced in the ZSFM (in-
tention outlook, gender, walking speed, and grouping) and
also both stopping motion of the MSM (sudden stop and
slow stop). The population for these experiments was set to
be 45,000 agents. The Tawaf ritual was used as the case
study for these experiments.
The simulation has been performed in Visual Studio
over core i7 with 3.x GH speed and 8 GB of memory
Fig. 7 Architecture of high-
density crowd simulation
Fig. 8 The overview on the integrated model
Neural Computing and Applications (2021) 33:6095–6117 6105
123
running over Windows 10. Data were collected from Tawaf
videos available online.
4.1 Zahmah social force model
To evaluate this characteristic, a simple experiment has
been done. This experiment uses both social force model
and ZSFM. However, in ZSFM only the walking speed
force is integrated, while the other additional forces are not,
to highlight the walking speed results. The population used
for this test was 45,000 agents for both models. The test
result (Fig. 10) shows that the walking speeds different in
ZSFM will cause the agents to move more randomly and
more scattered. Different from the social force model
causes the agents to move in the uniform pattern since they
are walking at the same speed. This proved that the
walking speed distribution in ZSFM improves the realism
of the high-density crowd simulation since in the real-
world scenario, the agents would not walking in a sys-
tematic manner. Although the agents were in blue to rep-
resent male agents and red to represent female agents, it
does not represent anything significant yet at this level
(Fig. 10).
4.1.1 Intention outlook comparison
To test the intention outlook forces within the crowd
simulation, the experimental setup will be using the same
approaches with the previous experiment. The intention
outlook forces will be integrated into the crowd simulation,
while the other new forces are not, to emphasize the effect
of intention outlook in the crowd simulation. This experi-
ment will use 4500 agents’ populations for both ZSFM and
social force model comparison. Based on the experiment
result, it shows that the ZFSM crowd flows are more hectic
and unsystematic, compared to the Social Force Model.
This is because the agents have their own desired intention
outlook, which means their own preferred distance towards
the epicentre. Unlike the agents in the social force model
which all have the same intention outlook, which causes
them to move systematically and organized, here they are
more realistic in the such movements. This proved that
integrating the intention outlook into the high-density
crowd simulation will improve the simulation result
(Fig. 11).
4.1.2 Walking speed comparison
The first test is the walking speed distribution test between
both conventional social force model and the proposed
model, ZSFM. The walking speed for each agent in the
ZSFM was distributed by using the Gaussian model.
Meanwhile, the walking speed for each agent in the social
force model was distributed evenly by calculating the
average walking speed of each agent. In real-world situa-
tions, it is impossible to assume that every agent will be
walking at the same speed. Thus, this research proposed the
Gaussian model to distribute the walking speed for each
agent (Fig. 12). By using the Gaussian model distribution,
it is most likely to be more realistic to the real-world sit-
uation [39] because it will distribute the walking speed
more naturally. Some of the agents will be walking slower
and some agents will be walking faster.
4.1.3 Gender interaction comparison
The second evaluation is the gender interaction force
experiment for both social force model and ZSFM. The
gender interaction force was applied because of the dif-
ferent respect of personal space between the two genders
[4]. Women have more respect in terms of personal space;
hence, they will have a stronger interaction force compared
to men. Hence, in ZSFM there are two different interaction
forces for every agent. The first interaction force was
between an agent with the same gender (men with men and
women with women), and the second interaction force is
between two different genders (men with women). The
Fig. 9 Details on high-density crowd simulation framework
6106 Neural Computing and Applications (2021) 33:6095–6117
123

latter interaction will have a stronger force than the former
interaction as shown in Figs. 13 and 14. Although the
interaction forces are different for both interactions, the
interaction threshold (interaction distance) stayed the same.
The reason is that the personal space of the agent is con-
sidered the same for every agent. Based on the same figure,
it shows that the social force model only has one interac-
tion force. It is because previous researches do not consider
gender differences as an important factor to be considered
in the high-density crowd simulation.
Similar to the previous experiment, this experiment also
will use the same test case scenario which is the Tawaf
ritual and also the same 4500 agents’ population. The
experiment compared the simulation results between the
social force model and the ZSFM. In this test, only the
gender interaction force will be integrated, while the other
new forces within ZSFM will not, to emphasize the result
Fig. 10 Walking speed
comparison result: (top) crowd
simulation using social force
model, (bottom) crowd
simulation using ZSFM
(blue = male agent,
red = female agent)
Fig. 11 Intention outlook force
comparison results: a crowd
simulation using social force
model; b crowd simulation
using ZSFM (blue = male
agent, red = female agent)
Neural Computing and Applications (2021) 33:6095–6117 6107
123

of gender interaction force. The experiment result (Fig. 14)
shows that the gender interaction forces in ZSFM have a
clear distinction between both genders (men in blue and
women in red). This is due to the interaction forces dif-
ferences between both genders. The agent will have a
greater repulsion force towards the opposite gender agents.
Consequently, it will make the agents with the same gender
walk closely together. Compared to the conventional Social
Force Model, all agents seem to be walking equidistance
from each other regardless of gender. Thus, it shows that
the ZSFM improved the gender interaction behaviour of
the crowd since both genders will have a different inter-
action with each other.
4.1.4 Grouping comparison
Next is the grouping force test. Some agents within a crowd
prefer to be in a group. Each group consists of two or more
agents depending on the size of the group. These groups will
walk closely together and will regroup back if they are sep-
arated whenever possible. Hence, in order to demonstrate
this situation in the simulation, several groups had been
created within this simulation. These groups were generated
manually because to have a controlled grouping environment
so that the results are comparable between crowd simulation
with grouping forces and simulation without it. The agents
within groups are in yellow coloured, while the other agents
without groups are in either red or blue depending on their
gender. There are no distinction colours of gender in groups
because there are no gender interaction forces between
agents within the same group. This is because the agents
from the same group would have the same interaction force
strength for both genders.
The experiments were run by using 4500 agents as the
total population for both social force model and ZSFM.
Similar to the previous tests in order to emphasize the
Fig. 12 Walking speed distribution of both ZS force model and social
force model
0
0.005
0.01
0.015
0.02
0.5 1 2
Forc
e St
reng
th
Interac�on Threshold
Gender Interaction Force
ZS Force Model(DifferentGender)
ZS Force Model (SameGender)
Social Force Model
Fig. 13 Gender interaction forces of both ZS force model and social
force model
Fig. 14 Gender interaction
force comparison results: (top)
crowd simulation using social
force model; (bottom) crowd
simulation using ZSFM
(blue = male agent,
red = female agent)
6108 Neural Computing and Applications (2021) 33:6095–6117
123

grouping force effect, only the grouping force was inte-
grated, while the other additional forces of ZSFM are not.
Figure 15 shows the simulation results for both social force
model and ZSFM in the Tawaf scenario. It shows that the
grouping force in ZSFM will make the agent from the same
group to stay together even though the agents were in a
congested area. Therefore, we can see clearly that those
agents were from the same group. This is different from the
agents in the social force model which do not stay together
and move individually. So, it does not show that the agent
was in the same group. With the integration of grouping
forces within the crowd simulation model, it improves the
realism of the simulation because in the real-world sce-
nario, agents within the same group will stick together.
Even though they are separated, they will try to get back
together as soon as possible, as shown in the ZSFM sim-
ulation result.
4.1.5 Comparison with conventional social force model
This experiment is to evaluate the simulation result of the
combination of all new forces within the ZSFM which is
intention outlook, walking speed, gender, and grouping.
The result of the ZSFM will be compared to the result of
the conventional Social Force Model. The testing envi-
ronment of this experiment will be the same for both
models. Blue agents will represent the male agents, red
agents will represent the female agents, and yellow agents
will represent the agents who are in groups.
The experiment results show the combination of all the
forces within ZSFM made the agents move more randomly
and more hectic, compared to the social force model
(Fig. 16). This is similar to the behaviour of the high-
density crowd in the real-world scenario. The conventional
social force model made the agents move in a uniform
pattern like companies of soldiers marching around the
Kaabah. This behaviour was unrealistic, and it does not
happen in the real-world situation. Thus, it proved that the
ZSFM is better in simulating a high-density crowd com-
pared to the Social Force Model.
4.2 Motion stopper model
4.2.1 Comparison with social force model
The experiments will be using social force model for
controlling the high-density crowd behaviour, as MSM
cannot standalone without any crowd simulation model.
Since MSM is a new model that focuses on stopping
motion in a congested area, there is no other suitable model
to be compared. Therefore, the experiment will show the
results of high-density crowd simulation by integrating
MSM against without integrating MSM. The experiments
are run using the same case study which Tawaf for con-
sistencies of the results were set.
The other stopping motion models require a door or wall
to occur, while MSM does not require any obstacle other
than the density of the crowd to occur. This thesis will
compare the social force model without integrating MSM
and with integrating MSM. This comparison is to prove
whether integrating the MSM improved the realism of the
simulation or not. Both bottlenecks effect and arc
Fig. 15 Grouping comparison
result a crowd simulation using
social force model; b crowd
simulation using ZS force
model (blue = male agent,
red = female agent,
yellow = agent in groups)
Neural Computing and Applications (2021) 33:6095–6117 6109
123

formation require a specific environment condition that
makes the stopping behaviour to happen.
Figure 17 (top) shows the bottleneck effect of stopping
behaviours. The stopping behaviour requires a narrow
pathway for it to happen. The crowd flow is also bidirec-
tional. Thus, it is totally different scenarios with this thesis
scenario which is Tawaf which does not need a wall and
the crowd flow is only in one direction to make the stop-
ping behaviour to happen.
Although the arc formation is also a one direction crowd
flow simulation, it requires a door to make the stopping
behaviour to occur (Fig. 17 (bottom)). Since the Tawaf
ritual does not have any doors for the agents to get through,
it is not suitable to be compared to the arc formation
stopping model. Other than that, mostly during the evalu-
ation of the arc formation, it requires a panic situation to
make the arc to form clearly. This research does not sim-
ulate any panic situation only in a calm and normal
situation.
As we can see in Fig. 18, it shows that by implementing
the MSM into the high-density crowd simulation, the
stopping motion was handled much better compared to the
Social Force Model. Without the MSM, the stopping will
not halt for a few seconds before continue walking again.
As a result, the agent will change from walking to stop very
abruptly. This is a contrast from with MSM, in which each
stopping agent will halt for a few seconds before start
walking again. This is a more natural behaviour because
pedestrians [41] in the real world must regain their
momentum before they walk again after stopping. Besides,
the MSM has two different stopping motions: sudden stop
and slow stop. These stopping motions were represented as
red agent for sudden stop and orange agent for slow
stopping. Both motions improved realism of the simulation
result by eliminating agent who walks in the same position,
which is not natural. Other than that, the agent also will
start walking more naturally with MSM compared without
MSM, which starts walking abruptly without halting for a
few seconds before continue walking again. In the real-
world scenarios, the agent will halt for a few seconds after
stopping to gain enough momentum before start walking
again.
Fig. 16 Social force model and
ZSFM comparison results: (top)
crowd simulation using social
force model, (bottom) crowd
simulation using ZSFM
(blue = male agents,
red = female agents,
yellow = agents in groups)
Fig. 17 (Top) Bottleneck effect, (bottom) arc formation
6110 Neural Computing and Applications (2021) 33:6095–6117
123

4.2.2 Comparison with various population
As stated before within this chapter, MSM is related clo-
sely with the number of agents within the simulation.
These experiments use a different number of agents rang-
ing from 500 agents to 4500 agents. The environment setup
for all experiments was the same except the crowd popu-
lation for consistencies of the results.
Figure 19 shows the increasing number of agents who
stop either by sudden stop (red agents) or slow stop (orange
agents) according to an increasing number of crowd pop-
ulation. Therefore, this test proves that the hypothesis was
correct. The increasing number of population in the crowd
will increase the stopping behaviour to happen more fre-
quently. This is because the increasing population will also
increase the density of the crowd, which directly will cause
the agents, have less space between them to move around.
It forced the agents to stop walking for a moment until they
have enough space around them to start walking again.
The increasing numbers of stopping agents especially
towards the centre of the circumambulation were mainly
due to the high congestion towards the epicentre. Some
stops occur at the outer ring of the circumambulation due to
the agents cannot get into the inner circle because being
blocked by the other agents. The occurrences of the slow
stop were more common compared to the sudden stop
because the agents were already walking slowly due to the
congestion. Without the integration of MSM into the high-
density crowd simulation, some of the agents will not stop
moving around and sometimes even move at the same
place due to low walking forces. By integrating MSM into
the simulation, a movement like that can be eliminated
because MSM will counter the walking forces with the
opposite forces (stopping forces), which will make the
agent stop moving before continues walking again. Thus, it
will make the high-density crowd simulation more natural.
Figure 20 shows the stopping frequencies for 60 s of
simulations based on the population from 500 agents to
4500 agents. There were no agents stops in 500 and 1000
populations because there were not enough agents to cause
congestion in the simulation. The number of agents stop-
ping increases as the population increases because the
crowd becomes more congested especially towards the
middle of the circumambulation. The increase in the con-
gestion directly will increase the difficulty for the agent to
walk, thus making the agents stop. The slow stop fre-
quencies are higher than a sudden stop at the population of
1500 agents and then become lesser with the increase in the
population. This is because the lesser number of agents
means the less congested the crowd. So, the agents have an
appropriate amount of space to slowly stop. On the other
hand, in the more congested crowd, the agents do not have
space and time to slowly stop which makes them stop
abruptly.
Fig. 18 Social force model and
MSM comparison results:
a crowd simulation using social
force model without MSM;
b crowd simulation using social
force model with MSM
(red = sudden stop,
orange = slow stop)
Neural Computing and Applications (2021) 33:6095–6117 6111
123

5 Discussion
These experimental results were compared to the real-
world videos of the Tawaf ritual. The videos used in this
test were taken from YouTube.
Figure 21 (top) shows the similarities between the
simulation result and the real-world situation. Both were
very congested especially towards the epicentre. At the
outer layer of the circle of the simulation, the agents were
walking sparsely and there was a lot of space between
them, similar to the real-world scenario. This is because the
agents in both simulation and real-world scenarios have
their own preferred walking distance. Some of them prefer
walking farther away from the epicentre for more comfort,
Fig. 19 MSM comparison
results by using different
populations ranging from 500
agents to 4500 agents
(red = sudden stop,
orange = slow stop)
Fig. 20 Stopping occurrence frequencies based on the number of
agents for 60 s of simulations
6112 Neural Computing and Applications (2021) 33:6095–6117
123

while some of them prefer walking closer to the epicentre
because they want to get close to the Kaabah.
In the second video, it shows a very clear distinction
between agents with groups and agents without groups
(Fig. 21 (bottom)). It shows that agents within the yellow
circle were from the same groups. They walk closely
together for the entire length of the video. The same
behaviour was also shown in the crowd simulation. The
agents within the white circle also walk closely together
while circling the Kaabah. This is due to the fact that some
agents perform the rituals within groups. Agents within the
same groups prefer to walk closely together to avoid get-
ting lost in the crowd. Even if they get separated, they will
try their best to get back together with their group. There is
no distinction between the interactions with the opposite
gender if the agents are from the same group because they
know each other and some of them are their spouses,
family members, or friends.
A detailed analysis of all the experimental results is
provided to prove that this novel high-density crowd sim-
ulation framework is more efficient in simulating high-
density crowd compared to the Social Force Model. Based
on all of the experimental results, the walking speed of
each agent has been calculated. This is because the average
walking speed of agents within the crowd simulation will
be compared to the actual real-world data.
Average walking speeds were collected during previous
experiments by using different populations (Table 3). The
average walking speed �v was determined by using Eq. 10.
The sum of the walking speed va of all agents within the
simulation was divided by the population of the simula-
tion,m. Based on the experiment results, it shows that the
average walking speed during the real-world Tawaf situa-
tion (0.3267 m/s) is quite near to the simulations average
walking speed of the proposed high-density crowd simu-
lation result for the population 45,000 (0.35 m/s). This
result shows that the simulation result average walking
speed was comparable to the real-world situation which
also has the population around 45,000 pilgrims [3].
�v ¼P
vam
ð10Þ
Average walking speed calculation example for the
proposed framework (population of 500 agents):
Fig. 21 Comparing crowd
simulation with real-world
scenario, video of the Tawaf
ritual [47]: (top: scenario 1)
high-density crowd simulation
compared to real-world
scenario. (Middle: scenario 2)
High-density crowd simulation–
grouping; this is highlighted by
white circles compared to real-
world scenario video of the
Tawaf ritual–grouping
highlighted by yellow circles.
(Bottom: scenario 3) High-
density crowd simulation;
orange agents demonstrate a
slow stop and red agents
demonstrate a sudden stop
Neural Computing and Applications (2021) 33:6095–6117 6113
123

total walking speed;X
va ¼ 1:6 þ 1:7 þ 1:7 þ 1:8 þ 2:2 þ 1:1 þ � � �ð ÞX
va ¼ 790
number of agents; m ¼ 500
average walking speed; �v ¼P
vam
�v ¼ 790
500
�v ¼ 1:58 m=s
Since this research is to evaluate the realism of the high-
density crowd simulation, the real walking speed data are
necessary for comparison. Thus, this research used the data
gathered by [10] which was culled from the Tawaf rituals
during Hajj season in 2009. The estimated number of pil-
grims during that time approximates 45,000 individuals
who journey from all parts of the world to attend.
Figure 22 shows a fundamental diagram, comparing the
proposed high-density crowd simulation framework walk-
ing speed and the crowd population. The fundamental
diagram is one of the methods to validate the realism of the
crowd simulation [9, 21, 44, 52]. The fundamental diagram
recognized the relationship between pedestrian density and
walking speed. The higher the density of the crowd within
an area, the slower the average walking speed of the crowd
will be. As can be seen in Fig. 22, it shows that the average
walking speed of the crowd becomes slower as the popu-
lation of the crowd become higher. The proposed frame-
work shows a much slower average walking speed because
this framework treats every agent as individuals and causes
the crowd flow to become more chaotic and disorganized.
As can be seen, the time complexity for the proposed
method is the same as the basic SFM, O(n2); then, there is
no concern by increasing the number of agents, as long as
there is space between agents to move, the speed will be
reduced slightly. In Kaabeh case of study, the limitation
depends on the capacity of Tawaf place. Compared to the
reality, 45,000 is an appropriate approximation. In general,
if there is no limitation for the place, the method behaves as
expected. However, if the place is limited, behaviour of the
method changes near to the capacity of the place. To clarify
this, we have tested the method with some other number of
agents close to the capacity of the place and shows that the
walking speed reduces to zero when the capacity exceeds.
This simulation deals with the Tawaf ritual as it is
considered the densest moving crowd by humans, so far.
As the walking speed, intention outlook, gender, and
grouping of the agents have been considered, there is no
Table 3 Average walking speed
of agents in the crowd
simulations using the social
force model and proposed
framework for different
populations
Crowd population Average walking speed
Social force model (m/s) Proposed framework (m/s)
500 2.00 1.58
1000 1.90 1.55
1500 1.83 1.24
2000 1.20 0.83
2500 1.10 0.82
3000 1.05 0.62
4000 0.99 0.58
4500 0.93 0.54
5000 0.87 0.52
10,000 0.83 0.49
15,000 0.81 0.48
20,000 0.77 0.44
25,000 0.74 0.42
30,000 0.73 0.40
35,000 0.68 0.39
40,000 0.66 0.37
45,000 0.61 0.36
00.5
11.5
22.5
Aver
age
Wal
king
Spe
ed
Crowd Popula�on
Fundamental Diagram
Social Force Model
ProposedFramework
Fig. 22 Comparison between SFM and the proposed method
6114 Neural Computing and Applications (2021) 33:6095–6117
123

difference in other situations with exception of the need for
minor adjustment for obstacles. Any changes in terms of
the path will not affect the result of the whole method
except there are special group movements such as moving
in straight lines or creating a specific shape in the group. In
these cases, those factors need to be included which cur-
rently is out of the scope of this paper.
6 Conclusion
In this research, we tried to improve the quality of pedes-
trian movement behaviour in a high-dense population
through microscopic pedestrian approach and crowd con-
trol studies. This research has come out with two new
concepts to be integrated into the crowd simulation
framework. The concept is known as the Zahmah social
force model (ZSFM) and the motion stopper model
(MSM). These concepts control the behaviour of the
pedestrian in a high-density crowd individually but also as
a whole. Naturally, these developments lead to two
important contributions to pedestrian studies in general:
rules following and stopping motion behaviour which are
handled by ZSFM and MSM, respectively. Consequently,
the combination of both models makes the crowd simula-
tion results more realistic.
ZSFM could produce efficient forces to avoid collision
between agents without separating agent whom within a
group. In addition, three more characteristics can be real-
ized successfully in this high-density crowd simulation.
Those characteristics are intention, walking speed and
gender, respectively.
In MSM, there were two types of stopping behaviour
being considered: firstly, the sudden stopping which occurs
when the pedestrians stop unexpectedly. For example,
when one agent walks in front of another agent unexpect-
edly, it causes the later to stop walking abruptly. Second is
the slow stopping behaviour, which happens when the
agents slow down before stopping. This scenario mostly
happens if an agent follows a group of slow-moving agents.
Differences in walking speed amongst the agents will be
altered and adapted to the common group’s walking speed.
The prerequisite to adjust the walking speed entails that the
faster agents to slow down and stop for a while before
readapting their walking speed.
We discussed how high-density crowd simulation
framework works. Then, the framework was evaluated
comparing to the real-world scenarios which shows how
closely the simulation results to the real-world scenarios in
terms of behaviours and walking speed are. This research
uses a fundamental diagram to evaluate the realism of the
proposed framework. Based on the experimental results, it
shows that the proposed framework can simulate the high-
density crowd simulation realistically. Hence, it can be
concluded that the proposed approach was successful in
simulating high-density crowd behaviour such as Tawaf.
Compliance with ethical standards
Conflict of interest The authors confirm that there is no conflict of
interest with this submission and this is an original work.
Open Access This article is licensed under a Creative Commons
Attribution 4.0 International License, which permits use, sharing,
adaptation, distribution and reproduction in any medium or format, as
long as you give appropriate credit to the original author(s) and the
source, provide a link to the Creative Commons licence, and indicate
if changes were made. The images or other third party material in this
article are included in the article’s Creative Commons licence, unless
indicated otherwise in a credit line to the material. If material is not
included in the article’s Creative Commons licence and your intended
use is not permitted by statutory regulation or exceeds the permitted
use, you will need to obtain permission directly from the copyright
holder. To view a copy of this licence, visit http://creativecommons.
org/licenses/by/4.0/.
Appendix
List of symbols
Parameter Description
a Agent
p~a Agent’s position
xa x-axis agent’s position
ya y-axis agent’s position
f~driveDriving force
f~repulsionRepulsion force
f~attractionAttraction force
fsocial Sum of attraction
d~a Desired direction of a agent, repulsion and driving
v~a Walking velocity for agent a
va Walking speed for agent a
vda Deviation of va
d Distance from the goal
d~a Normal distance vector from a to the goal
v~c Actual walking velocity
sa Relaxation time for agent a
g~a Goal position of agent a
ra Radius of interaction for agent a
n~ab Normalized vector pointing from agent a towards agent
b
c Scaling parameter of attraction forces between agents
from the same group
t~ Epicentre of the circumambulation
Neural Computing and Applications (2021) 33:6095–6117 6115
123

Parameter Description
s Strength of the repulsion forces
�v Average walking speed
vj j Magnitude of v
References
1. Abdelghany A, Abdelghany K, Mahmassani H (2016) A hybrid
simulation-assignment modeling framework for crowd dynamics
in large-scale pedestrian facilities. Transp Res Part A Policy
Practice 86:159–176
2. Alqurashi R, Altman T (2019) Hierarchical agent-based modeling
for improved traffic routing. Appl Sci 9(20):4376
3. Arab News (2013) Capacity of mataf to reach 105,000 in 2015.
Retrieved from Arab news website. http://www.arabnews.com/
news/456434
4. Bailenson JN, Blascovich J, Beall AC, Loomis JM (2001)
Equilibrium theory revisited: mutual gaze and personal space in
virtual environments. Presence 10(6):583–598
5. Bian C, Chen D, Wang S (2010) Velocity field based modelling
and simulation of crowd in confrontation operations. In: 16th
international conference on parallel and distributed systems,
pp 646–651
6. Biswal MK (2014) Comparison of pedestrian fundamental dia-
gram: a cultural and gender aspect, MS.c thesis, for the degree of
master of technology in transportation engineering, Department
of Civil Engineering, National Institute of Technology
7. Bostrom H, Wensby L (2012) Large-scale agent-based pedestrian
and crowd simulation in real-time
8. Chen M, Wang J, Zhi Y, Sun J (2019) Impact of intersecting
angles on evacuation efficiency of pedestrian flows in high vol-
ume: a case study in metro station. KSCE J Civil Eng
23(5):2324–2332
9. Das JB, Chattaraj U, Nayak S (2016) Studies on pedestrian
fundamental diagrams: field observations and controlled experi-
ments. Int J Res Chem Metall Civil Eng 3(1):86–89
10. Dridi MH (2015) List of parameters influencing the pedestrian
movement and pedestrian database. Int J Soc Sci Stud
3(4):94–106
11. Eliyan L, Halabi O, Saleh M (2018) Modeling family behaviour
in crowd simulation. In: 2018 international conference on com-
puter and applications (ICCA), pp 66–70. IEEE
12. Erneholm CO (2011) Simulation of the flocking behaviour of
birds with the boids algorithm. Royal Institute of Technology
13. Haughton M (2020) Narrativizing Difference in Earlier Bronze
Age Society: a comparative analysis of age and gender ideologies
in the burials of Ireland and Scotland (Doctoral dissertation,
University of Cambridge)
14. Helbing D, Molnar P (1995) Social force model for pedestrian
dynamics. Phys Rev E 51(5):5096
15. Ibe N, Masuyama G, Yamashita A, Asama H (2013) Humanlike
behaviour model with probabilistic intention. In: ACM SIG-
GRAPH, Posters, vol 7
16. Johansson A (2004) Pedestrian simulations with the social force
model, MS.c thesis. Institute for Transport and Economics,
Dresden University of Technology, Germany
17. Jiang Y, Wong SC, Zhang P, Liu R, Duan Y, Choi K (2012)
Numerical simulation of a continuum model for bi-directional
pedestrian flow. Appl Math Comput 218(10):6135–6143
18. Kang Z, Zhang L, Li K (2019) An improved social force model
for pedestrian dynamics in shipwrecks. Appl Math Comput
348:355–362
19. Kapadia M, Singh S, Reinman G, Faloutsos P (2011) A behaviour
authoring framework for multi-actor simulations. IEEE Comput
Gr Appl 31:45–55. https://doi.org/10.1109/MCG.2011.68
20. Kurdi O, Stannett M, Romano DM (2015) Modeling and simu-
lation of tawaf and sa’yee: a survey of recent work in the field. In:
29th annual European simulation and modelling conference,
pp 441–447
21. Lemercier S, Jelic A, Kulpa R, Hua J, Fehrenbach J, Degond P,
Appert-Rolland C, Donikian S, Pettre J (2012) Realistic follow-
ing behaviour s for crowd simulation. Eurographics
31(2):489–498
22. Lerner A, Chrysanthou Y, Shamir A, Cohen-Or D (2009) Data
driven evaluation of crowds. In: Egges A, Geraerts R, Overmars
M (eds) MIG, vol 5884, pp 75–83
23. Lim CK, Tan KL, Zaidan AA, Zaidan BB (2020) A proposed
methodology of bringing past life in digital cultural heritage
through crowd simulation: a case study in George Town,
Malaysia. Multimed Tools Appl 79(5):3387–3423
24. Liu J, Chen X (2019) Simulation of passenger motion in metro
stations during rush hours based on video analysis. Autom Constr
107:102938
25. Li Q, Liu Y, Kang Z, Li K, Chen L (2020) Improved social force
model considering conflict avoidance. Chaos Interdiscip J Non-
linear Sci 30(1):013129
26. Loscos C, Marchal D, Meyer A (2003) Intuitive crowd behaviour
in dense urban environments using local laws
27. Mao Y, Yang S, Li Z, Li Y (2018) Personality trait and group
emotion contagion based crowd simulation for emergency evac-
uation. Multimed Tools Appl 5:1–28
28. Moussaıd M, Nelson JD (2014) Simple heuristics and the mod-
elling of crowd behaviours. In: Pedestrian and evacuation
dynamics, pp 75–90. Springer, Cham
29. Noh B, Youm C, Lee M, Park H (2020) Age-specific differences
in gait domains and global cognitive function in older women:
gait characteristics based on gait speed modification. PeerJ
8:e8820
30. Pelechano GN (2006) Modeling realistic high density autono-
mous agent crowd movement: social forces, communication,
roles and psychological influences
31. Peng Y, Li SW, Hu ZZ (2019) A self-learning dynamic path
planning method for evacuation in large public buildings based
on neural networks. Neurocomputing 5:98
32. Pinna F, Murrau R (2018) Age factor and pedestrian speed on
sidewalks. Sustainability 10(11):4084
33. Ren Z, Charalambous P, Bruneau J, Peng Q, Pettre J (2016)
Group modeling: a unified velocity-based approach. Comput Gr
Forum 2:926
34. Rincon JA, Costa A, Villarrubia G, Julian V, Carrascosa C (2018)
Introducing dynamism in emotional agent societies. Neurocom-
puting 272:27–39
35. Salehi N, Sung M (2020) Realistic multi-agent formation using
discretionary group behaviour (DGB). Appl Sci 10(10):3518
36. Sarmady S, Haron F, Talib AZ (2011) A cellular automata model
for circular movements of pedestrians during Tawaf. SimulModel Pract Theory 19(3):969–985
37. Sticco IM, Frank GA, Dorso CO (2020) Social force model
parameter testing and optimization using a high stress real-life
situation. arXiv preprint arXiv:2007.06651
6116 Neural Computing and Applications (2021) 33:6095–6117
123

38. Strnad D, Nerat A, Kohek S (2017) Neural network models for
group behaviour prediction: a case of soccer match attendance.
Neural Comput Appl 28(2):287–300
39. Strickland BB (2001) Gale encyclopedia of psychology, 2nd edn.
Gale Group, Detroit, MI
40. Trautman P, Patel K (2020) Real time crowd navigation from first
principles of probability theory. In: Proceedings of the interna-
tional conference on automated planning and scheduling, Vol 30,
pp 459–467
41. Ullah H, Ullah M, Uzair M (2018) A hybrid social influence
model for pedestrian motion segmentation. Neural Comput Appl
96:1–17
42. Wang J, Chen M, Jin B, Li J, Wang Z (2019) Propagation
characteristics of the pedestrian shockwave in dense crowd:
experiment and simulation. Int J Disaster Risk Reduct 40:101287
43. Wang J, Jin B, Li J, Chen F, Wang Z, Sun J (2019) Method for
guiding crowd evacuation at exit: the buffer zone. Saf Sci
118:88–95
44. Wolinski D, Guy SJ, Olivier A-H, Lin M, Manocha D, Pettre J
(2014) Parameter estimation and comparative evaluation of
crowd simulations. Comput Gr Forum 33:303–312
45. Xu M, Wu Y, Lv P, Jiang H, Luo M, Ye Y (2015) miSFM: on
combination of mutual information and social force model
towards simulating crowd evacuation. Neurocomputing
168:529–537
46. Yao Z, Zhang G, Lu D, Liu H (2020) Learning crowd behaviour
from real data: a residual network method for crowd simulation.
Neurocomputing 2:1069
47. YouTube (2019) Hajj 2012 Tawaf of kaaba. Retrieved from
YouTube website. https://www.youtube.com/watch?v=
2SOWVV5Ez3k
48. Zhang J, Liu H, Li Y, Qin X, Wang S (2018) Video-driven group
behaviour simulation based on social comparison theory. Phys A
Stat Mech Appl 512:620–634
49. Zhao M, Zhong J, Cai W (2018) A role-dependent data-driven
approach for high-density crowd behaviour modeling. ACM
Trans Model Comput Simul 28(4):1–25
50. Zainuddin Z, Thinakaran K, Shuaib M (2010) Simulation of the
pedestrian flow in the Tawaf Area using the social force model.
World Acad Sci Eng Technol 1(50):910
51. Zhou S, Chen D, Cai W, Luo L, Low MYH, Tian F, Tay VS-H,
Ong DWS, Hamilton BD (2010) Crowd modeling and simulation
technologies. ACM Trans Model Comput Simul 20:4
52. Zwan M (2016) The impact of density measurement on the
fundamental diagram. MS.c thesis, Technical Artificial Intelli-
gence. University of Utrecht, the Netherlands
Publisher’s Note Springer Nature remains neutral with regard to
jurisdictional claims in published maps and institutional affiliations.
Neural Computing and Applications (2021) 33:6095–6117 6117
123