an international benchmarking analysis … hgf programme...an international benchmarking analysis of...
TRANSCRIPT

AN INTERNATIONAL BENCHMARKING ANALYSIS OF PUBLIC PROGRAMMES FOR HIGH-GROWTH FIRMS
Prepared by the OECD Local Economic and Employment Development Programme in collaboration with the Danish Business Authority
March 2013

This work is published on the responsibility of the Secretary-General of the OECD. The opinions
expressed and arguments employed herein do not necessarily reflect the official views of the Organisation or of the governments of its member countries.
This document and any map included herein are without prejudice to the status of or sovereignty over any territory, to the delimitation of international frontiers and boundaries and to the name of any
territory, city or area.
The statistical data for Israel are supplied by and under the responsibility of the relevant Israeli authorities. The use of such data by the OECD is without prejudice to the status of the Golan Heights, East Jerusalem and Israeli settlements in the West Bank under the terms of international law.
Cover prepared by François Iglesias (OECD/LEED)
© OECD 2013
You can copy, download or print OECD content for your own use, and you can include excerpts from OECD publications, databases and multimedia products in your own documents, presentations, blogs, websites and teaching materials, provided that suitable acknowledgment of the source
and copyright owner is given. All requests for public or commercial use and translation rights should be submitted to [email protected]. Requests for permission to photocopy portions of this material for public or commercial use shall be addressed directly to the Copyright Clearance Center (CCC) at
[email protected] or the Centre français d'exploitation du droit de copie (CFC) at [email protected].

AN INTERNATIONAL BENCHMARKING ANALYSIS OF PUBLIC PROGRAMMES FOR HIGH-GROWTH FIRMS
FINAL REPORT
Prepared by the OECD Local Economic and Employment Development Programme in collaboration with the Danish Business Authority
March 2013

3
TABLE OF CONTENTS
EXECUTIVE SUMMARY ............................................................................................................................ 4
INTRODUCTION .......................................................................................................................................... 7
PART I – BENCHMARKING ANALYSIS .................................................................................................. 9
CHAPTER 1. DESIGNING POLICY FOR HIGH-GROWTH SMES ....................................................... 10
CHAPTER 2. THE HIGH-GROWTH PROGRAMME ASSESSMENT FRAMEWORK ........................ 18
CHAPTER 3. THE BENCHMARKING RESULTS .................................................................................. 28
CHAPTER 4. KEY MESSAGES FOR DENMARK .................................................................................. 39
PART II – THE BENCHMARKED PROGRAMMES ................................................................................ 43
CHAPTER 5. DENMARK'S GROWTH HOUSES .................................................................................... 44
CHAPTER 6. SCOTLAND’S COMPANIES OF SCALE PROGRAMME ................................................ 64
CHAPTER 7. THE NETHERLANDS’ GROWTH ACCELERATOR ...................................................... 85
CHAPTER 8. FLANDERS’ GAZELLE JUMP ........................................................................................ 106
CHAPTER 9. GERMANY'S HIGH-TECH GRUNDERFONDS ............................................................. 131
CHAPTER 10. COMMERCIALISATION AUSTRALIA ....................................................................... 153
PART III – OTHER LEARNING MODELS ............................................................................................. 183
CHAPTER 11. ENGLAND'S GROWTH ACCELERATOR ................................................................... 184
CHAPTER 12. IRELAND'S MANAGEMENT FOR GROWTH PROGRAMME .................................. 189
CHAPTER 13. SWEDEN’S NATIONAL INCUBATOR PROGRAM ................................................... 195
CHAPTER 14. THE U.S. JOBS AND INNOVATION ACCELERATOR CHALLENGE ..................... 202
CHAPTER 15. ONTARIO'S MEDICAL AND RELATED SCIENCE DISCOVERY DISTRICT ......... 207
CHAPTER 16. CHILE'S SEED CAPITAL PROGRAMME .................................................................... 214
CHAPTER 17. BRAZIL’S INOVAR VENTURE CAPITAL PROGRAMME ....................................... 219
ANNEX A. ASSESSMENT FRAMEWORK FOR HIGH-GROWTH PROGRAMMES ....................... 222

4
EXECUTIVE SUMMARY
Applied economic research shows that net job creation comes from a small batch of successful fast-growing firms, rather than from a large majority of averagely performing SMEs. The evidence for different countries suggests that around 4-6 percent of high-growth firms produce half to three/quarters of all new jobs. Two common features to high-growth firms are that they are prevalently young and small, with age being a stronger determinant of rapid growth than size. However, they are not disproportionally present in any specific sector, including technology-based ones, and their incidence is in fact stronger in services than in manufacturing.
By definition, rapid business growth is not a steady phenomenon and high-growth firms do not remain as such for a long time. Periods of high-growth are episodic rather than persistent and multiple instances are rare. Evidence from the UK shows, for example, that firms that achieved mean sales growth of 36 percent per year over the period 1992-1996, only grew by 8 percent over the following 1996-2001 period. Repeated periods of rapid growth only affected one/third of UK high-growth firms.
The contribution to net job creation by a few rapidly growing firms provides one of the rationales for policy intervention. High-growth firms generate positive externalities (e.g. increased employment and consumer demand) that benefit the whole of the economy beyond the private returns available to the entrepreneur, which makes them worth of policy support. But there are other market failures that affect high-growth firms and that policies seek to address. Business expansion require external finance, often of equity nature, which is hardly available in the markets, especially to enterprises that are too young or too small and have not yet achieved the stage of development likely to attract Venture Capital. Business growth also calls for improved management skills. Fast business development is a disruptive process that alters the organizational dynamics and management practices of an enterprise, from production to logistics, from marketing to staff management. New leadership and management skills are often needed to cope with this process.
The programmes analysed and benchmarked in this report fall under the two categories of management skills and finance, although not always is the distinction neat. Programmes that have a focus on finance also tend to offer management support, while the opposite is generally not true for schemes with a management focus.
Programmes have been analysed through an assessment framework consisting of 35 indicators garnered by 7 categories: context of the programme (i.e. objectives, governance, and geographical scope); staff profile (i.e. academic and professional background); client firms (i.e. selection process, prevailing sectors, market orientation, and follow-up); type of business diagnosis (i.e. business concept, business organisation, customer relations, and operations); delivery arrangements (i.e. degree of externalisation of support, client firms/staff member ratio, proactiveness towards client firms, selection and evaluation of intermediary organisations); monitoring and evaluation in place (i.e. coverage, type, independence, frequency, and use); and performance of client firms (i.e. turnover, employment, export). Each indicator was linked to a set of questions, typically between one and three, which have assisted in assigning a score between 1 and 5. Each score is to portray a situation that progressively moves towards a best-practice scenario, based on past experience of the OECD LEED programme in the analysis of entrepreneurship and SME development policies.
Context: while all six benchmarked programmes have set clear qualitative objectives, this is not always the case with quantitative objectives. This is surprising but sometimes justified by the small size of the programmes or the extensive use of intermediary organisations in implementation which makes a

5
coherent set of objectives difficult to establish. Programmes have been designed in an inclusive manner, involving different government departments and the business sector. Local-level governments have, on the other hand, not always been engaged (e.g. Germany’s High-Tech Gründerfonds), which can undermine co-ordination with similar initiatives at local level and tailoring of national programmes to different local needs. Finally, while all programmes are available to firms from all regions of the country, there tends to be a concentration of client firms in the richest regions. This is perhaps not surprising but raises a flag about the possibility that high-growth policies disproportionally favour the most advanced regions, thereby enhancing regional disparities.
Staff: it is often said that the success of public programmes depend on their staff. As could be expected, an education background in management is stronger in business accelerators (e.g. Companies of Scale and the Dutch Growth Accelerator), while an education background in applied sciences is stronger in technology-based programmes (e.g. Germany’s High-Tech Gründerfonds and Commercialisation Australia). On the other hand, a strong entrepreneurial experience is often lacking in the staff of the programme, with the partial exception of the Danish Growth Houses and Commercialisation Australia. There is scope for strengthening weaker competences (e.g. entrepreneurial or technological) in public schemes through the set-up of external advisory boards.
Client firms: participant firms are selected on the basis of a combination of quantitative and qualitative criteria where the latter play a prevailing role. This makes high-growth schemes quite distinctive compared to most public programmes where quantitative selection metrics are most common. This choice reflects the fact that some key growth factors (e.g. the ambition of the entrepreneur, internal business organisation, innovativeness of the product, etc.) are not easily captured by quantitative metrics. The six benchmarked programmes do not have any specific sector focus, which reflects a good practice scenario since empirical research shows that high-growth firms are found in all sectors. On the other hand, the extent to which programmes work with international firms vary largely, from more than 80% in Scotland’s Companies of Scale to 10% in Commercialisation Australia, which points to the heterogeneous nature and goals of these programmes. Finally, follow-up with participant companies is common everywhere but, quite expectably, stronger in those programmes that work with a smaller number of entrepreneurs (e.g. Scottish and Dutch cases).
Business diagnosis: the diagnosis of the strengths and weaknesses of client firms is a feature shared by all six benchmarked programmes, although the key focus sometimes differs depending on the primary goal of the scheme. Germany’s High-Tech Gründerfonds and Commercialisation Australia do not get very much into the details of business operations, while the customer relations of the supported firms are not so closely analysed by Companies of Scale and the Dutch Growth Accelerator.
Delivery arrangements: the methods of programme implementation change remarkably across the benchmarked initiatives, and it is not uncommon for many high-growth schemes to be delivered by private intermediary organisations (e.g. consulting consortia), rather than by public sector bodies. This is due to the highly specific business and entrepreneurial skills that professionals working with high-growth firms should have and that are normally not readily available in the public sector. Companies of Scale is the programme that most internalises services offer, whereas the Growth Houses in Denmark is the one that most externalises it. In between are the other schemes, with for example the Growth Accelerator in the Netherlands that rests only on the members of the consortium running the programme. This reflects again the different scale and nature of the programmes. The Danish Growth Houses, in particular, act as a one-stop shop for businesses that intend to grow, so that the level of engagement of each manager with client firms cannot be the same as in the schemes in Scotland and the Netherlands where participation is more exclusive. Intermediaries are used everywhere, but the extent to which this happens vary. The Scottish, Dutch, and Flemish initiatives work with a restricted number of private organisations (less than 10), while the Danish and German models deal with many more. In the last two cases, the evaluation of

6
intermediaries is also erratic, and this makes it hard for programme managers to understand whether they are working in implementation with the right set of organisations
Monitoring and evaluation: evaluation approaches have been more sophisticated in the cases of the Dutch Growth Accelerator and the Danish Growth Houses, where control group evaluations have been conducted. For the other schemes, evaluation has largely been of qualitative nature. While this is sometimes justified by the small scale of the initiative (e.g. Companies of Scale), it is surprising for other larger programmes (e.g. Germany’s High-Tech Gründerfonds). The frequency of evaluation has been the highest in the Danish case, which is also the initiative where evaluation results have more clearly informed policy change. The Danish Growth Houses represent, therefore, the best practice among the benchmarked programmes with respect to evaluation practices. In the other cases, except Commercialisation Australia, evaluation has been rather ad hoc and carried out between every 3 and 6 years.
Performance of client firms: none of the programmes has been evaluated rigorously enough to attribute performance of participants to the programme intervention. Nonetheless, four of them have tried to measure their impacts on sales, exports, and employment of participant firms. Two points stand out: First, there is a tentative relationship between the ‘intensity’ of each scheme and the sales performance of client firms: the two schemes involving the most intensive interaction between programme staff and firms – the Dutch and Scottish programmes – also report the highest turnover growth rates; the scheme with the least intensive interaction – the Danish programme – reports the lowest average turnover growth rates in participant firms. Second, the evidence suggests inconsistent relationships between growth of turnover, exports and employment. In the cases of the Danish Growth Houses and German High-Tech Gründerfond, employment growth was reported stronger than sales growth, while in both the Scottish and Dutch schemes the employment gains were less significant than those for turnover.
In conclusion, while the benchmarked programmes have the common objective of supporting high-growth firms, they differ significantly in their structure, delivery arrangements, intensity and forms of support, and outcomes.

7
INTRODUCTION
High-growth firms – firms able to go through fast business expansion over a short period of time – have attracted the attention of governments due to their impact on net job creation. There is increasing evidence that most new jobs are not dispersed among a large score of small companies but are concentrated in a few successful enterprises able to grow fast and create employment. A recent survey of the research on the topic finds that job creation is concentrated in a few enterprises which tend to be younger and smaller than other firms. Age, however, is a stronger determinant of rapid growth than size, thus implying that high-growth firms are more likely to be young than small. High-growth firms are not necessarily technology-based but operate in different sectors, prevalently in services.1 An ongoing empirical analysis by the OECD Local Economic and Employment Development Programme on five OECD countries (Belgium, Denmark, Germany, Italy and United Kingdom) confirms some of these findings. Age and size are found to be important determinants of business growth, with high-growth firms again more likely to be young and small. Similarly, high-growth firms are found in all sectors and are not always overrepresented in technology-intensive industries, although the incidence of these special enterprises on the total is bigger in services than in manufacturing. 2
The importance of high-growth firms for economic growth and job creation provides the rationale for this research project, which has been carried out by the OECD LEED Programme in collaboration with the Danish Business Authority (DBA). The report examines thirteen initiatives supporting high-growth firms through either the provision of coaching/mentoring or the supply of finance. In addition to the descriptions of the programmes, six have been analysed in greater detail through the use of an OECD-designed assessment framework consisting of 35 indicators that collect comparative information on different programme features (e.g. institutional context, delivery arrangements, profile and performance of client firms, etc.). For three of these six programmes additional fact-finding missions have been undertaken (i.e. Denmark’s Growth House, Scotland’s Companies of Scale, the Netherlands’ Growth Accelerator).
The report is thus structured as follows:
Part I (Benchmark analysis) starts with a first chapter that introduces the main rationales for policies supporting SME growth and, in particular, high-growth firms. Chapter 2 then introduces the assessment framework which has been utilised to benchmark six of the programmes included in this report and presents a summary of the key results of the benchmark analysis. Chapter 3 teases out from the previous chapter key policy messages for the Danish Business Authority. This is the part of the report which has benefited the most from the assessment framework and the three fact-finding missions.
Part II (Benchmarked programmes) describes in detail the six benchmarked schemes. In each case, a local expert has drafted an analytical paper and submitted the assessment framework (and related questionnaire) to programme managers through a face-to-face interview. The six programmes are:
• Denmark’s Growth Houses
• Scotland’s Companies of Scale
1 . Henrekson M. and Johansson D. (2010), “Gazelles as Job Creators: A Survey and Interpretation of the
Evidence”, Small Business Economics, vol. 35, pp. 227-44.
2 . Hart M. and Temouri Y. (forthcoming), “High-Growth Firm Localities and Determinants: Evidence from OECD Countries”, OECD, Paris.

8
• The Netherlands’ Growth Accelerator
• Flanders’ Gazelle Jump
• Germany’s High-Tech Start-Up Fund
• Commercialisation Australia
Part III (Learning models) consists of smaller descriptive papers outlining additional examples of measures designed with the aim to back up high-growth firms. They are less analytical than the chapters in Part II, but they help the reader get a fuller picture of measures offered internationally to support fast-growing enterprises. The list of learning models included in the report is:
• England’s Growth Accelerator
• Ireland’s Management for Growth
• Sweden’s National Incubator Programme
• The US Jobs and Innovation Accelerator Challenge
• Ontario’s Medical and Related Science Discovery District
• Chile’s Seed Capital Programme
• Brazil’s Inovar Venture Capital Programme
The study was led by Marco Marchese, economist at the OECD Local Economic and Employment Development Programme (LEED), who also edited this report and designed the assessment framework (Annex I). Dr. Jonathan Potter, senior economist at OECD/LEED supervised the whole project. Dr. Anders Hoffman and Majken Caroline Jacobsen from the Danish Business Authority (DBA) have provided comments and inputs throughout the duration of the study. Michael Penfold and Marco Kamya of the CAF Latin American Development Bank have also given advices at different stages of the project.
Part I has received contributions from Prof. Steve Roper, Warwick Business School (chapters 1, 3 and 4) and Marco Marchese OECD/LEED (chapters 2 and 3). Chapters in Part II have been prepared by Vibeke Vad Baunsgaard, Franziska Günzel and Prof. Helle Neergard, Aarhus University (chapter 4); Dr. Ross Brown and Dr. Suzanne Mawson, Scottish Enterprise (chapter 5); Monique Rjinders, Technopolis-Netherlands (chapter 6); Prof. Rudy Aernoudt, University of Ghent (chapter 7); Dr. Thomas Stahlecker, Fraunhofer Institute (chapter 8); Donna Valenti and Stephan Broch, Australia’s Government Department of Innovation (chapter 9). Chapters in Part III have been drafted by: Prof. Steve Roper, Warwick Business School (chapter 10); Prof. Tom Cooney, Dublin Institute of Technology (chapter 11); Prof. Åsa Lindholm-Dahlstrand, Lund University (chapter 12); Prof. Tom Kemeny, University of North Carolina (chapter 13); Prof. Rebecca Reuber, University of Toronto and Prof. Eileen Fisher, York University (chapter 14), Gonzalo Rivas (chapter 15); Alice Pessoa de Abreu and Andre Chamun, Brazilian Agency for Innovation – FINEP (chapter 16).
Emma Mooney (OECD/LEED) has provided precious administrative support throughout the project and valuable technical assistance in the preparation of the report.

9
PART I – BENCHMARKING ANALYSIS

10
CHAPTER 1. DESIGNING POLICY FOR HIGH-GROWTH SMES
Introduction
Numerous empirical studies have demonstrated the importance of high-growth SMEs (HGSMEs) in creating new jobs and introducing and commercialising radical innovations. One recent academic review of over twenty empirical studies concluded that: ‘a few rapidly growing firms generate a disproportionately large share of all net new jobs compared to non-high-growth firms. This is a clear-cut result’3. The evidence for different countries suggests that in general terms around 4-6 per cent of high-growth firms produce around half to three-quarters of all new jobs. One other feature of HGSMEs evident from the research literature is that high growth firms occur in all sectors, with some studies suggesting that they are over-represented in services4. Their potential to generate growth means that HGSMEs can act as catalysts for change, helping economies to recover from recession and restructure quickly in response to changing economic, social and market conditions.
Governments – in partnership with other stakeholders – can play a crucial role in shaping the environment in which HGSMEs can flourish, providing appropriate business information, supporting networks and skills development, and ensuring the availability of suitable business finance. Creating an enabling environment and effective support programmes for HGSMEs is not easy, however, and as policy targeted at HGSMEs has developed rapidly in recent years, the evaluation evidence from existing policy programmes is relatively limited5. Central to many of the HGSME support programmes reviewed here, however, are the provision of business information and knowledge transfer between firms, and between firms and universities/research institutes. Network contacts and relationships with larger firms both nationally and internationally are also often seen as important as HGSMEs grow and develop. Beyond the start-up phase, managerial and marketing skills allied with adequate financing and effective protection for intellectual property rights are also vital to sustain innovation and growth.6
In the remainder of this Section we provide a brief overview of the rationale for and the range of support measures for high-growth SMEs. Section 1.2 focuses on the rationale for SME policy and the position of high-growth support within the overall range of SME support measures. Section 1.3 focuses on the question of which firms to support, while Section 1.4 focuses on the types of support services typically offered to high-growth SMEs.
Policy for growth and high growth
SME growth remains something of an enigma. Numerous studies have been undertaken over the years in an attempt to understand what determines business growth but attempts to conceptualise and statistically model growth remain partial at best. The implication is that the evidence base on which SME policy is based remains partial with a number of contested areas. Some studies have focussed primarily on factors internal to the firm - the background and characteristics of the entrepreneur or owner-manager, the nature
3 Henrekson, M. & Johansson, D. 2010. Gazelles as job creators: a survey and interpretation of the evidence.
Small Business Economics, 35, 227-244, p. 240. 4 Op. Cit. 5 OECD 2008 Working Party on SMEs and Entrepreneurship (WPSMEE) Review of HGSMEs, innovation
and intellectual property, p. 23. 6 Llisterri, J and Garcia-Alba, J (2008) ‘HGSMEs in Latin American Emerging Economies’, paper prepared
for the OECD Kansas City Workshop, 2008.
11
of the business itself and the strategies adopted by the firm7. Other studies have focussed more on the organisational and regulatory context within which the SME is operating, suggesting that firms with similar entrepreneurial resources and characteristics might perform very differently in different national environments8. A firm’s location in a supportive entrepreneurial regional innovation system may also be a potential stimulus to entrepreneurship and contribute to innovation and business growth9. Social networks too may be an important stimulus for growth, influencing the entrepreneur’s ability to take advantage of market opportunities and external resources10.
While some uncertainty remains about the best forms of intervention to support SMEs there are clear arguments about why such intervention may be important11. First, it is argued that small firms play a unique role in the economy creating jobs and stimulating market renewal. This suggests that entrepreneurship generates positive externalities, meaning that the ‘social’ value of entrepreneurship is greater than its ‘private’ value. Decisions about whether to become an entrepreneur or not, for example, are based only on the private benefits and ignore wider social benefits. This represents a ‘market failure’ in that individual entrepreneurs are not able to capture all of the benefits of being an entrepreneur – i.e. they are able to capture the private but not the social benefits. Without government intervention to capture the social benefits of entrepreneurship the number of entrepreneurs in the economy will remain too low. Government intervention to reduce the costs or risks of entrepreneurship is therefore justified to raise the level of entrepreneurial activity to that closer to the social optimum.
Similar types of market failures also exist which have been suggested as a justification for government intervention to support SME development. For example, SMEs may find it more difficult to obtain finance than larger firms due to a lack of collateral, their unproven track record and the proportionally greater cost of small transactions. SMEs may also find it more difficult to adopt new technologies than larger firms due to their greater need to use external technologies but their weaker internal technical resources. In each case, the ‘market failure’ might justify government intervention to support SME lending, to help small firms adopt new technologies or perhaps provide SMEs with marketing or export information.
These arguments about market failure stem largely from neo-classical economics, which some have argued provides only a weak basis for real world policy making12. Other perspectives, based on evolutionary economics, provide a different type of justification for policy intervention, arguing that government can develop a strategic vision for the economy or a particular sector which individual SMEs cannot. Government may also see other types of strategic priorities such as supporting high tech firms,
7 Storey, D. J. 1994. Understanding the Small Business Sector, London, Routledge 8 Capelleras, J.-L., Mole, K. F., Greene, F. J. & Storey, D. J. 2008. Do more heavily regulated economies
have poorer performing new ventures? Evidence from Britain and Spain. Journal of International Business Studies, 39.
9 Audretsch, D. B. 2005. The knowledge spillover theory of entrepreneurship and economic growth In: Vinig, G. T. & Van der Voort, R. C. (eds.) The emergence of entrepreneurial economics Elsevier
10 Hoang, H. & Antoncic, B. 2003. Network-based research in entrepreneurship - A critical review. Journal of Business Venturing, 18, 165-187. Zhao, X. Y., Frese, M. & Giardini, A. 2010. Business owners' network size and business growth in China: The role of comprehensive social competency. Entrepreneurship And Regional Development, 22, 675-705
11 Bennett, R. 2008. SME policy support in Britain since the 1990s: what have we learnt? Environment And Planning C-Government And Policy, 26, 375-397.
12 Metcalfe, S. 1997. Technology Systems and Technology Policy in an Evolutionary Framework, Cambridge University Press.

12
women’s entrepreneurship or entrepreneurship among disadvantaged or ethnic minority groups. In each case, the policy justification is likely to be strategic – or social – rather than depending on some narrowly defined ‘market failure’.
Once a decision has been made that a government should intervene to support entrepreneurship or growth the next question is what type of intervention is appropriate? The first decision to be made is at what ‘level’ intervention should take place. A useful distinction can be made between four ‘levels’ of policy intervention13:
• Macro-economic conditions – these set the national context for business development and include issues related to economic stability and growth, national legislative frameworks, social and political stability. Uncertainty about either future growth or policy continuity, for example, may undermine individuals’ willingness to invest.
• Framework conditions – provide the more specific context for entrepreneurship and small business and relate, for example, to resource and factor availability, regulation, legislation and property rights as well as transport, environmental and legislatory systems.
• Mainstream SME support – relates to broadly-based policy initiative targeted to support entrepreneurship and small business. This would include measures to support enterprise culture and enterprise education as well as business and advice centres, and grants, loans or guarantees aimed specifically at SMEs. Web-based portals such as Singapore’s ‘EnterpriseOne’ (http://www.business.gov.sg) provide this type of mainstream support and an initial point of information and access to government services.
• Targeted SME measures – relates to narrowly-focussed initiatives intended to support the development of a particular group of entrepreneurs or SMEs. Examples would be support offered to women’s enterprise through specialist advice services and business centres while specialist support agencies such as Catalonia’s ACC10 provide services to individual firms to support their growth and development.
Measures designed to support high-growth businesses fall into this latter category – targeted measures – and in most countries are seen as complementary to mainstream entrepreneurship and SME growth measures.
Who to support? Determining eligibility for high-growth support
The rarity of HGSMEs and gazelle companies poses particular problems in targeting policy support on the ‘right’ firms. Is it possible, for example, to identify certain types of enterprises or entrepreneurs which are most likely to achieve high growth? Are firms in high-tech sectors a better bet than those in low-tech or more traditional sectors? Are well-educated entrepreneurs more likely to establish fast growing firms? Or, is it better for governments to focus on developing the institutional environment within which all small firms can grow? Even where high growth firms can be identified, periods of high growth generally seem episodic for particular firms rather than persistent. Two recent UK studies provide some empirical evidence. One study which investigated the growth profile of a group of 100 high-growth UK firms which achieved mean sales growth of 36 per cent p.a. between 1992 and 1996 concluded: ‘surviving gazelles grew by just 8 per cent between 1996 and 2001. Thus, gazelle-like growth appears to be fragile, 13 Autio, E Kronlund, M and Kovalainen, A (2007) High-Growth SME Support Initiatives in Nine Countries:
Analysis, Categorization, and Recommendations, Report prepared for the Finnish Ministry of Trade and Industry.

13
having failed to persist over a decade, even in a period of impressive macroeconomic growth’14. Based on a broader analysis of all UK firms, a second study reaches an essentially similar conclusion: ‘Not only was the experience of high-growth relatively rare, but multiple instances were even rarer, affecting only one-third of high-growth firms’15.
A key issue in high growth policy is therefore how to identify firms with the potential for high growth given that the potential for high growth is neither visible nor measurable, and that high growth itself exhibits little persistence. As a result eligibility conditions for public support programmes for high-growth firms have varied widely among countries and schemes and have included:
• Newness: The Australian Commercialising Emerging Technologies scheme which operated until 2010 required firms to be less than five years old16.
• Size and growth: Some programmes insist that firms have already achieved a size (turnover) threshold, in some cases linked to an age limit. The Dutch Growth Accelerator reviewed later in this report requires, for example, that firms have starting turnover of more than €2m and have the potential to grow to €20m in five years.
• Estimated growth potential: New Zealand’s Growth Services Range required potential growth of 20% a year sustained over five years or revenue growth of $5m within five years17.
• R&D intensity: The Spanish Support Programme for Innovative Young Firms required at least 35% of staff to be engaged in R&D activities and minimum R&D expenditure criteria;
• Defined growth strategy: Turkish KOSGEB support is conditional on a firm developing a strategic road map or business plan.
Overall, however, eligibility criteria vary widely and often have a strong subjective element relying on the judgement of programme managers to determine high-growth potential.
Delivering high-growth support
The decision to start any business and, in particular, a HGSME requires a combination of opportunity, entrepreneurial and innovative inclinations and capabilities. Perhaps the key starting point in developing entrepreneurial inclinations is a business and entrepreneurship-friendly atmosphere in which business success is seen as positive and there are positive entrepreneurial role models. Creating this type of environment is, of course, a long-term project requiring engagement from a wide range of different organisations including the education system. At best, these initiatives have involved a network of actors at regional and national level and generated valuable co-ordination and partnering activity. 14 Parker, S. C., Storey, D. J. & van Witteloostuijn, A. 2010. What happens to gazelles? The importance of
dynamic management strategy. Small Business Economics, 35, 203-226. 15 Anyadike-Danes, M., Bonner, K., Hart, M. & Mason, C. 2009. Measuring business growth: high growth
firms and their contribution to employment in the UK. London: NESTA, p. 31. 16 See http://www.ausindustry.gov.au/index.cfm and also Autio, E Kronlund, M and Kovalainen, A (2007)
High-Growth SME Support Initiatives in Nine Countries: Analysis, Categorization, and Recommendations, Report prepared for the Finnish Ministry of Trade and Industry, pp. 34-35.
17 Ministry of Economic Development (2009) Evaluation of the Growth Services Range:
Available at: http://www.med.govt.nz/about-us/publications/publications-by-topic/evaluation-of-government-programmes/GSR-evaluation-final-report-1.pdf

14
Alongside such general measures (which can be taken to promote a positive climate for enterprise), specific measures have been adopted in some countries to encourage start-up among different population groups. In Ireland, for example, the Enterprise Start programme has proved effective in encouraging those currently employed to move from employment to business start-up often with high-growth potential18. More generally measures designed to promote enterprise awareness and entrepreneurship around universities may be particularly important in stimulating high growth. The University of Waterloo, for example, situated at the heart of Canada’s Technology Triangle provides a good example of a university which focuses on supporting start-up businesses. Strongly embedded within the regional community, dense co-operative networks on technology and enterprise between the university and local community are complemented by the university’s co-operative education programme. “The rotation of students to industry and back to the classroom solidified already tight relations with local industry. The reflexive relationship has allowed the curriculum to keep up with the ever changing technological frontiers of industry.”19 Over 250 spin-outs from the university have resulted in part from the university policy of allowing ownership of intellectual property to rest with its creator (faculty or student), encouraging both creativity and enterprise.
High-quality business services also provide a key input to HGSMEs particularly in the start-up and expansion phases. Such services may be accessed privately by firms or may provide the mechanism through which publicly funded support services are provided. In general, however, HGSMEs are likely to require more sophisticated services than most start-up businesses and are more likely to draw on private, and often internationalised, business services. Key areas of importance to HGSMEs are likely to be broadly based business development services – dealing for example with legal or regulatory aspects of business start-up, technology-based services supporting R&D and innovation, and support for internationalisation. Issues around intellectual property (IP) may also be important for technology-based HGSMEs. For most HGSMEs the difficulty lies in being able to identify and access the appropriate services quickly and effectively. Public sector agencies can play a key role here in brokering both public and private sector services to HGSMEs and this is one of the key features of a number of the programmes described later in this report.
A rather different mechanism for providing HGSMEs with access to support services is through business incubators. Incubation first emerged in the US in the mid-1980s to support start-up development and tackle problems associated with lack of capital, poor management and insufficient market understanding. In general terms, business incubators provide support for high-growth ventures during their early years when they are most vulnerable. Typically “the role of business incubators is to provide a supportive environment, where new entrepreneurs receive training and assistance in business management and marketing, various other business services, and access to seed capital.”20 It has been suggested that incubators add value to their tenants in four areas: diagnosing business needs, selecting and monitoring their tenants, providing access to business networks and providing of access to capital. It has also been suggested that incubators may enhance the entrepreneurial culture of an area and act as a magnet for highly skilled individuals looking to benefit from the services provided by the incubator21.
18 See www.enterprise-ireland.com and discussion of the programme at
http://www.oecd.org/secure/pdfDocument/0,2834,en_21571361_38013663_39137502_1_1_1_1,00.pdf 19 Bramwell, A Nelles, J and Wolfe, D A (2008) ‘Knowledge, Innovation and Institutions: Global and Local
Dimensions of the ICT Cluster in Waterloo, Canada’, Regional Studies, 42,1, p. 105. 20 Avinimelech, G Schwartz, D and Bar-El, Raphael (2007) ‘Entrepreneurial high-tech cluster development:
Israel’s experience with venture capital and technological incubators’, European planning studies, 15, 9, p, 1185.
21 Op. Cit. p. 1195.

15
Two key success factors emerge from the incubator literature. First, the context in which the incubator is located is a very significant influence on its success. In the Israeli case, for example, research has shown that incubator success rates increase sharply where they are closely related to venture capital provision.22 The example of Oxford Innovation in the UK highlights a similar point emphasising the importance of business incubation and support alongside the provision of appropriate capital. The implication is that incubators can form a valuable part of a systematic approach to supporting the growth and development of HGSMEs but are unlikely to succeed in isolation. Second, the evidence suggests that the management and operation of the incubator itself can also be a significant determinant of its success with different forms of incubation service of value to different types of company.23
HGSMEs also have greater need and make greater use of external sources of finance than other SMEs, with both debt and equity funding being important.24 Even in situations where loan and equity finance are plentiful and legal structures are well established, however, it is widely recognized that SMEs often have limited access to institutional finance. Four main reasons for this have been suggested25:
• Lending to SMEs may carry higher risks than that attached to larger and more established firms. Reflecting the ‘liability of newness’, small firms generally have higher mortality rates than larger companies and may be more vulnerable to market and economic changes26.
• Banks and financial institutions may be institutionally biased towards lending to large corporate borrowers. This may reflect prior relationships – joint directorships, track record etc. – or simply a preference for prestige clients.
• Transaction costs are likely to be proportionally higher on the relatively small loans required by smaller firms. This is likely to reduce the profitability of this type of lending and its attractiveness to finance institutions.
• Finally, SMEs seeking loans may be unable or unwilling to provide accounting records or securities or collateral for loans. This may – either unintentionally or intentionally - create informational asymmetries which make it difficult for lenders to accurately assess lending risk27.
22 Avinimelech, G Schwartz, D and Bar-El, Raphael (2007) ‘Entrepreneurial high-tech cluster development:
Israel’s experience with venture capital and technological incubators’, European planning studies, 15, 9, p. 1185.
23 Duff, A (1994) Best Practice in Business Incubator management, AUSTEP Strategic Partnering Pty Ltd, Available at: http://www.eifn.ipacv.ro/include/documentations_files/bestpracrpt.pdf.
24 Cassar, G and Holmes, S (2003) ‘Capital Structure and the financing of SMEs: Australian evidence’, Accounting and Finance, 43, pp 123-147. Bhaird, C and Lucey, B (2006) An Explanatory Cross-Sectional study of the capital structures of Irish SMEs’ paper presented at the International Conference on the Financing of SMEs at CSME, Warwick Business School.
25 Levitsky, J and Prasad, R N (1989) ‘Credit Guarantee Schemes for Small and Medium Enterprises’, World Bank Technical Paper No. 58, New York; Duan, H Han, X and Y, Hongbo (2009) ‘An analysis of causes for SMEs financing difficulties’, International Journal of Business and Management, 4,6, June 2009, 73-75.
26 See Stinchcombe, Arthur L. (1965). Social Structure and Organizations. In the Handbook of Organizations, James G. March (Ed.). Chicagok: Rand McNally & Co. On access to capital specifically see also: Coleman, S (2004) ‘The Liability of newness and small firm access to debt capital: Is there a link?’, paper presented at the Annual Conference of the Academy of Entrepreneurial Finance, April 29, 2004, Washington D.C.

16
SME financing issues arise not solely on the supply side, however, with recent research also reflecting demand-side issues both in terms of the reluctance of SMEs to take advantage of external finance and the ‘investment readiness’ of many SMEs. Pecking order models for example, suggest that due to adverse selection firms prefer internal to external finance and, where outside funds are necessary, firms prefer debt to equity due to the lower information and dilution costs associated with debt28. Even where SMEs do want external finance questions have been raised about the investment readiness of some firms in terms of the quality of their business planning as well as financial management and governance systems29. The implication is that measures to promote SME finance from the supply-side cannot be considered in isolation. The willingness and readiness of SMEs to access external finance – particularly equity – also needs to be considered.
A range of different mechanisms have been used to support the availability of finance to HGSMEs and a number of the schemes reviewed later in this report involve the provision of finance, sometimes alongside other support. Credit, loan or export guarantee schemes, for example, may help meet the potentially higher debt capital requirements of HGSMEs and their need to invest in advanced technologies. Equity investment may also be important to HGSMEs, particularly in sectors where rapid growth is anticipated and defensible (typically IP-based) such as in ICT and biotechnology. Experience has shown that both supply-side and demand-side measures can be effective. On the demand side, measures can be taken to strengthen firms’ investment readiness, with a potential role for banks and agencies in helping businesses to assess and develop their business plans and propositions. On the supply side, the policy focus has been on equity gaps (or market failures) and trying to ensure adequate financing for HGSMEs at different stages of development. Here, there is a need to recognise the potential value for HGSMEs of both informal and formal private equity funding. Informal private equity funding (primarily through business angels) may be important for firms in the early stages of development; policy can play a role in encouraging angel investment and facilitating angel networks30.
Summary points
A recent review of international practice in terms of HGSME policy, conducted for the Finnish Ministry of Trade and Industry, tried to identify the principles which should govern policy for HGSMEs.31 It suggested policy should:
27 Ono, A and Uesugi, I (2005) The role of collateral and personal gaurentees in relationship lending:
evidence from Japan’s small business loan market’, paper presented at the International Conference on Financing of SMEs in Developed Countries, CSME, Warwick Business School.
28 On SMEs particularly see, for example, Watson, R and Wilson, N (2002) ‘SME financing: a note on some of the empirical implications of a pecking order, Journal of Business Finance and Accounting, 29, 557-578. More generally see: Frank, M Z and Goyal, V K (2003) ‘Testing the pecking order theory of capital structure’, Journal of Financial Economics, 67, 217-248.
29 Measures to promote investment readiness have been adopted in a number of countries including the UK (Access to Finance Programme - www.gos.gov.uk/gol/European_funding/Objective_2/Obj2_accesstofinance), Spain and Greece (Entrepreneurship Environment and Policies: Exploiting the Science and Technology Base in the Region of Halle", in: OECD LEED Local Entrepreneurship Series, January 2007).
30 See, for example, Robinson, M J and Cotterell, T J (2007) ‘Investment patterns of informal investors in the Alberta private equity market, Journal of Small Business Management, 45, 1, pp. 47-67.
31 Autio, E Kronlund, M and Kovalainen, A (2007) High-Growth SME Support Initiatives in Nine Countries: Analysis, Categorization, and Recommendations, Report prepared for the Finnish Ministry of Trade and Industry, p.76.

17
• Be highly selective, particularly when addressing later stages of venture development;
• Require strong growth motivation from participants;
• Be proactive in trying to identify prospective growth firms;
• Consistently address managerial motivation and skills;
• Involve close collaboration with private-sector service providers;
• Nurture an image of professionalism, competence, and a certain degree of exclusivity;
• Implement sustained and focused development efforts;
• Involve highly tailored management development activities that involve experience sharing and apply an interactive approach;
• Link grants and participation to growth aspiration and achievement of milestones;
• Be prepared to accept casualties;
• Involve seasoned managers who have experience in rapid growth.
There is, of course, the danger of generating an overly complex set of SME and HGSME policy initiatives, and a number of countries (Japan, Mexico and the UK) have or are moving towards simplified frameworks for business support.32 More generally there is a move towards the one-stop-shop approach where a single agency or contact point can provide access to the full range of public (or public and private) support services. This approach is epitomised by a number of schemes included in this review including the Danish Growth Houses, the Scottish Companies of Scale Programme and the Dutch Growth Accelerator. Considerable variety remains, however, in the way in which these schemes are organised and in the range of services that are offered to HGSMEs.
32 OECD 2008 Working Party on SMEs and Entrepreneurship (WPSMEE) Review of HGSMEs, innovation
and intellectual property. See p. 8.
18
CHAPTER 2. THE HIGH-GROWTH PROGRAMME ASSESSMENT FRAMEWORK
Framework structure and methodology
The OECD LEED Programme has designed a ‘high-growth firm programme assessment framework’ for the purpose of carrying out the benchmarking analysis of the six high-growth entrepreneurship programmes that are examined in detail in this report. In this chapter we introduce the framework and its rationale.
The tool consists of 35 indicators grouped in seven categories:
1. Context of the programme (objectives, governance, etc.);
2. Staff profile (work and educational background);
3. Client firms (firm selection, average client firm, firm relationships with the programme, etc.);
4. Business diagnosis (covered themes);
5. Delivery arrangements (direct provision by public sector vs. use of external intermediaries);
6. Monitoring and evaluation (type, frequency, use etc.);
7. Performance of participant firms (on turnover, export, and employment of participant firms).
Each indicator is linked to a set of questions, typically between one and three, which have assisted in assigning a score between 1 and 5. Every score depicts a situation that progressively moves towards a best-practice scenario, based on the experience of the OECD LEED programme in the analysis of entrepreneurship and SME development policies at national and local levels.
For each of the six benchmarked programmes a local expert has been charged with filling the questionnaire through a face-to-face interview with a programme manager. Besides the closed questions leading to the assignment of a score, additional open questions have also been formulated to cover issues that do not lend themselves so easily to the identification of a good-practice. Examples are the rationale, objectives and institutional context of the programme, as well as the type of business support services offered by the programme itself. The scores have subsequently been validated by the OECD secretariat, based on the fact-finding missions carried out in Denmark, the Netherlands and Scotland, a review of descriptive papers on the programmes prepared by the same local experts charged with the submission of the questionnaire, and a review of export responses to open questions.
The full assessment framework is available in Annex A of this report. The remainder of this chapter presents the structure and scoring rationale for the indicators in each of the seven categories of the tool.

19
Institutional and geographical context
Table 2.1. Indicators under “institutional and geographical context” of the high-growth programme
Indicator 1 2 3 4 5
Qualitative objectives of the high-growth programme
The high-growth programme has not set specific qualitative objectives to attain
Qualitative objectives have been set but they do not appear clear and consistent
Qualitative objectives have been set and they appear clear and consistent
Quantitative objectives of the high-growth programme
The high-growth programme has not set specific quantitative objectives to attain
Few quantitative objectives (less than 3) have been set, but they appear incoherent
Many quantitative objectives (3 or more) have been set, but they appear incoherent
Few quantitative objectives (less than 3) have been set, and they appear coherent
Many quantitative objectives (3 or more) have been set, and they appear coherent
Governance in the design of the high-growth programme
The programme has been designed by one single ministry without any external inputs
The programme has been designed with inputs from different government ministries
The programme has been designed with inputs also from regional (if national programme) and local governments (if regional programme)
The programme has been designed also with inputs from business associations and other private stakeholders, but not from regional and local governments
The programme has been designed with inputs both from business associations and private stakeholders and from regional and local governments
Geographical scope of the high-growth programme
The high growth programme is available in only one region of the country
The high growth programme is available in more than one but not in most regions of the country
The high growth programme is available in most regions of the country
The high growth programme is available in all regions of the country
The first set of questions concern whether the programme has established coherent qualitative and quantitative objectives. It is assumed in the second indicator that having at least three quantitative goals will help programme managers be more rigorous in the implementation of the scheme, although it is equally true that too many objectives can make the programme unfocused (something which is not captured in the indicator). The indicator on “governance” puts a premium on policy collaboration, emphasising the importance of receiving feedbacks by other relevant ministries, local governments and private sector stakeholders, especially business associations. Collaborative policy design should lead to programmes that better meet the needs of local business, including high-growth companies. The last indicator regards the geographical scope of the programme and rewards schemes that are present in as many regions of the country as possible. Empirical evidence has shown that high-growth enterprises are more concentrated in local urban areas that outperform the national average with regard, for example, to GDP per capita and levels of employment. However, past work of the OECD LEED Programme and the fact-finding missions carried out for this project tell us that successful high-growth firms can be located anywhere, also in peripheral regions, and that the latter are often in more need of support than high-growth enterprises in metropolitan areas endowed with a wider range of business development services.

20
Staff profile
Table 2.2. Indicators under 'staff profile' of the high-growth programme
Indicator 1 2 3 4 5
Academic background of the programme’s professional staff
Less than 20% holds a bachelor’s degree or more
More than 20% but less than 40% holds a bachelor’s degree or more
More than 40% but less than 60% holds a bachelor’s degree or more
More than 60% but less than 80% holds a bachelor’s degree or more
More than 80% holds a bachelor’s degree or more
Academic background in management (BA mgmt. or MBA) of the programme’s professional staff
Less than 20% holds a university degree in management
More than 20% but less than 40% holds a university degree in management
More than 40% but less than 60% holds a university degree in management
More than 60% but less than 80% holds a university degree in management
More than 80% holds a university degree in management
Academic background in applied sciences (BSc. or MSc.) of the programme’s professional staff
Less than 20% holds a university degree in applied sciences
More than 20% but less than 40% holds a university degree in applied sciences
More than 40% but less than 60% holds a university degree in applied sciences
More than 60% but less than 80% holds a university degree in applied sciences
More than 80% holds a university degree in applied sciences
Average number of years of work experience of the programme’s professional staff
Less than 3 years
More than 3 but less than 6 years
More than 6 but less than 9 years
More than 9 but less than 12 years
More than 12 years
Average number of years of industry experience of the programme’s professional staff
Less than 3 years
More than 3 but less than 6 years
More than 6 but less than 9 years
More than 9 but less than 12 years
More than 12 years
Average number of years of experience as business owner of the programme’s professional staff
Less than 3 years
More than 3 but less than 6 years
More than 6 but less than 9 years
More than 9 but less than 12 years
More than 12 years
The second group of indicators looks at the educational background and work experience of the professional staff charged with the management of the scheme. It makes the assumption that, from the point of view of education, professionals with tertiary education and university education in management or applied sciences will be more suited to handling a public intervention aimed at high-growth firms. The latter are faced with significant management and organisational challenges when they go through rapid growth. Moreover, while not all growth-oriented companies operate in technology-intensive sectors, a sizeable number of them do so.
With regard to the professional background of programme staff, the underlying assumption is on the other hand that the more experienced the staff members and the more the staff members have accrued direct work experience in the industry and/or as business owners, the more they will be able to understand the needs of client firms.

21
Client firms
Table 2.3. Indicators under 'client firms' of the high-growth programme
Indicator 1 2 3 4 5
Selection of client firms by the high-growth programme
There is not any selection of firms. The principle ‘first come, first served’ is applied.
Firm selection is based exclusively on a qualitative assessment of the firm.
Firm selection is based prevalently on a qualitative assessment of the firm, but some quantitative criteria are also considered
Firm selection is based exclusively on a quantitative assessment of the firm.
Firm selection is based prevalently on a quantitative assessment of the firm, but qualitative criteria are also considered
Sector concentration of the high-growth programme
The high-growth programme is focused only on one specific industry or sector
The high-growth programme is focused only on one transversal technology
The high-growth programme is focused on more than one transversal technology
The high-growth programme does not have any sector or technology focus, but is limited to either manufacturing or services
The high-growth programme does not have any sector or technology focus and includes both services and manufacturing
Market orientation of the high-growth programme
Less than 20% of client firms have an international market
More than 20% but less than 40% of client firms have an international market
More than 40% but less than 60% of client firms have an international market
More than 60% but less than 80% of client firms have an international market
More than 80% of client firms have an international market
Follow-up of client firms after the intervention
There is not any follow-up of client firms.
Follow-up is done only informally (no collection and storage of information) and erratically (less than once every 2 years)
Follow-up is done only informally (no collection and storage of information) but regularly (at least once every 2 years)
There is a formal follow up of client firms (collection and storage of information) but is done erratically (less than once every 2 years)
There is a formal follow up of client firms (collection and storage of information) and this is done regularly (at least once every 2 years)
“Client firms” indicators assess how participant firms have been selected, where they are found in terms of sector and market orientation, and what relationships they entertain with the programme. The main rationale behind the selection of this indicator is that quantitative metrics of performance should be favoured when trying to identify firms with high-growth potential. Nonetheless, there are important aspects of growth such as the entrepreneur’s ambition, the firm’s market prospects or still business internal organisations that will not transpire from any metrics and that make a qualitative assessment also relevant.
“Sector concentration” points to the prevailing sector characteristics of the enterprises participating in the programme. Evidence from the literature reveals that industry is not a strong determinant of business growth and that high-growth firms are found across many economic sectors, although there is a stronger incidence in services (Henrekson and Johansson, 2010; Hart and Temouri, forthcoming). It follows that it is considered good practice for general high-growth programmes to maintain as comprehensive a sector approach as possible. This is not meant to diminish the importance of technology-based programmes, but in these cases it must be clear that the programme’s objectives are to promote high-tech enterprises rather than high-growth firms in general.
22
“Market orientation” picks up the extent to which client firms are internationalised. In a time of globalised markets, business enterprises that go international at an early stage of development have more chances to become fast-growers. This is especially true for firms whose domestic market is limited by the home country’s size, and which are prompted earlier than others to venture into foreign markets. As a result, high-growth programmes that have among their recipients a larger number of exporting companies are held to be more likely to hit the right target.
The last client firm indicator deals with the relationship between client firms and programme managers and, namely, with programme managers’ follow-up of client firms. In this case, the more formalised and regular the follow-up is, the more programme managers will be able to keep track of the effects of the intervention.
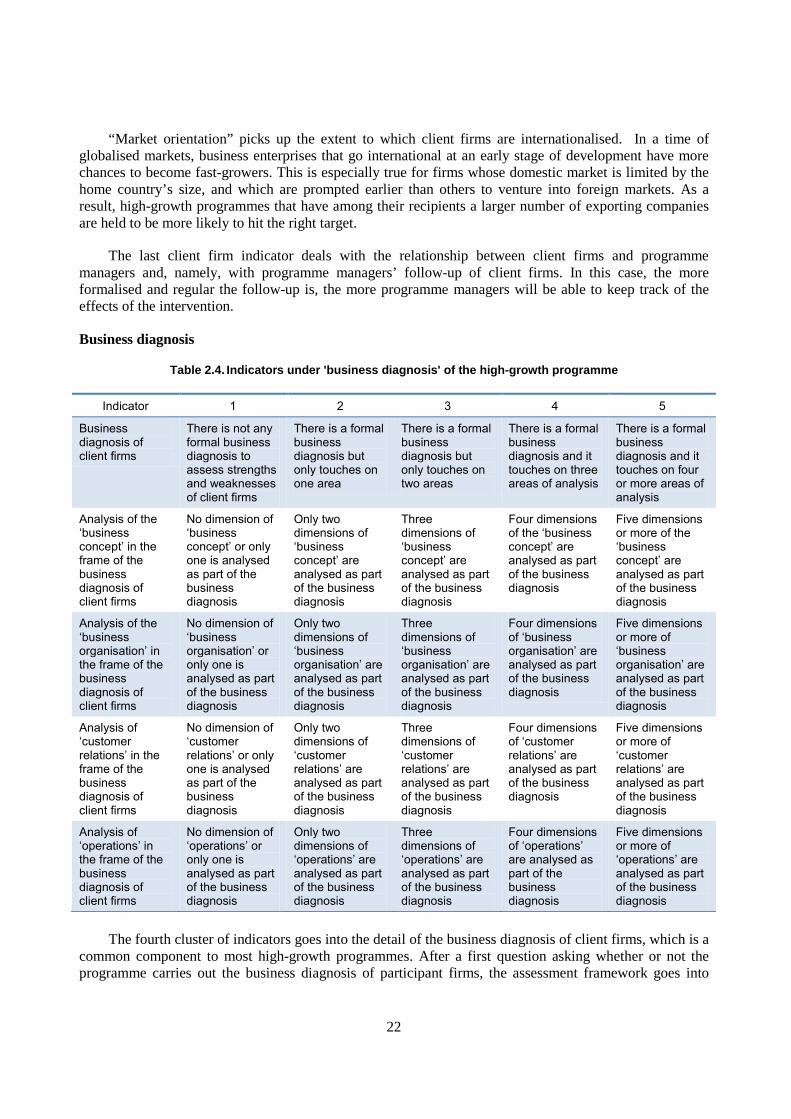
Business diagnosis
Table 2.4. Indicators under 'business diagnosis' of the high-growth programme
Indicator 1 2 3 4 5
Business diagnosis of client firms
There is not any formal business diagnosis to assess strengths and weaknesses of client firms
There is a formal business diagnosis but only touches on one area
There is a formal business diagnosis but only touches on two areas
There is a formal business diagnosis and it touches on three areas of analysis
There is a formal business diagnosis and it touches on four or more areas of analysis
Analysis of the ‘business concept’ in the frame of the business diagnosis of client firms
No dimension of ‘business concept’ or only one is analysed as part of the business diagnosis
Only two dimensions of ‘business concept’ are analysed as part of the business diagnosis
Three dimensions of ‘business concept’ are analysed as part of the business diagnosis
Four dimensions of the ‘business concept’ are analysed as part of the business diagnosis
Five dimensions or more of the ‘business concept’ are analysed as part of the business diagnosis
Analysis of the ‘business organisation’ in the frame of the business diagnosis of client firms
No dimension of ‘business organisation’ or only one is analysed as part of the business diagnosis
Only two dimensions of ‘business organisation’ are analysed as part of the business diagnosis
Three dimensions of ‘business organisation’ are analysed as part of the business diagnosis
Four dimensions of ‘business organisation’ are analysed as part of the business diagnosis
Five dimensions or more of ‘business organisation’ are analysed as part of the business diagnosis
Analysis of ‘customer relations’ in the frame of the business diagnosis of client firms
No dimension of ‘customer relations’ or only one is analysed as part of the business diagnosis
Only two dimensions of ‘customer relations’ are analysed as part of the business diagnosis
Three dimensions of ‘customer relations’ are analysed as part of the business diagnosis
Four dimensions of ‘customer relations’ are analysed as part of the business diagnosis
Five dimensions or more of ‘customer relations’ are analysed as part of the business diagnosis
Analysis of ‘operations’ in the frame of the business diagnosis of client firms
No dimension of ‘operations’ or only one is analysed as part of the business diagnosis
Only two dimensions of ‘operations’ are analysed as part of the business diagnosis
Three dimensions of ‘operations’ are analysed as part of the business diagnosis
Four dimensions of ‘operations’ are analysed as part of the business diagnosis
Five dimensions or more of ‘operations’ are analysed as part of the business diagnosis
The fourth cluster of indicators goes into the detail of the business diagnosis of client firms, which is a common component to most high-growth programmes. After a first question asking whether or not the programme carries out the business diagnosis of participant firms, the assessment framework goes into

23
what issues are scrutinised as part of this exercise. “Business diagnosis” as a whole is ideally taken to encompass business concept, business organisation, customer relations and operations, where each of these items is further broken down into subthemes through additional questions: i) business concept (business idea, product portfolio, business model, customer portfolio and market position); ii) business organisation (ownership and management structure; staff organisation; internal business process; formal partnerships; legal affairs); iii) customer relations (sales, commercial networks, marketing, branding, communications and public relations); iv) operations (accounting, business financing, production management, IT system, facilities).
This part of the assessment framework has been openly inspired by the business diagnosis tool utilised by the Danish Growth Houses, one of the six benchmarked programmes, and whose graphical representation is given below. The more far-reaching the diagnosis will be, the more likely it will be for programme managers to identify the real needs of participant firms and propose an appropriate support activity.
Figure 2.1. The 'Growth Wheel' business diagnosis model
Source: Danish Business Authority

24
Delivery arrangements
Table 2.5. Indicators under 'delivery arrangements' of the high-growth programme
Indicator 1 2 3 4 5
Extent to which support delivery is internalised (by staff) or externalised (by intermediaries)
All support is internalised. There is no referral by the programme to intermediaries
Most support is internalised but some specialist advice is externalised to intermediaries.
Support is approximately equally provided by programme staff and intermediaries
Most support is externalised to intermediaries but some specialised advice is internalised
All support is externalised except for a first business diagnosis of client firms.
Direct involvement of programme staff with client firms (in 12 months)
The programme staff meets with the client firms only once
The programme staff meets with the client firms twice
The programme staff meets with the client firms three times
The programme staff meets with the client firms four/five times
The programme staff meets with the client firms more than five times
Annual “client firms/programme adviser” ratio
Less than 25 Between 25 and 49
Between 50 and 74
Between 75 and 100
More than 100
Proactiveness of programme staff towards client firms
Programme staff exclusively receives client firms in the premises of the programme
Programme staff mostly receives client firms at the premises of the programme, but occasionally visit them at their establishments
Programme staff approx. equally receives client firms at the premises of the programme and visits them at their establishments
Programme staff occasionally receives client firms at the premises of the programme, but mostly visit them at their establishments
Programme staff exclusively visits client firms at their establishments
Selection of intermediary organisations by the programme
The programme works with a restricted number of intermediaries (less than 10) that do not go through a competitive selection process
The programme works with a large number (more than 10) of intermediaries that do not go through a competitive selection process
The programme works with a restricted number of intermediaries (less than 10) that go through a competitive selection process
The programme works with a large number of intermediaries (more than 10) that go through a competitive selection process
Proactiveness of intermediary organisations towards client firms
Intermediaries exclusively receive client firms at their premises
Intermediaries mostly receive client firms at their premises, but occasionally visit them at their establishments
Intermediaries approx. equally receive client firms at their premises and visits them at their establishments
Intermediaries occasionally receive client firms at their premises, but mostly visit them at their establishments
Intermediaries exclusively visit client firms at their establishments
Evaluation of the intermediary organisations
The programme does not evaluate the work of its intermediaries
The programme evaluates the work of its intermediaries through ad-hoc surveys of the intermediaries themselves
The programme evaluates the work of its intermediaries through regular surveys of the intermediaries themselves
The programme evaluates the work of its intermediaries through ad-hoc surveys of client firms
The programme evaluates the work of its intermediaries through regular surveys of client firms

25
The fifth group of indicators deals with the implementation of the programme, namely the extent to which the programme is delivered by the internal staff (i.e. public sector workers) or by external intermediary organisations (i.e. private or semi-private organisations), as well as the type and frequency of interactions between client firms and programme staff or between client firms and intermediary organisations in the case that the scheme is delivered by private sector organisations.
Whilst this report only looks at interventions that receive funding from the public sector, the first indicator recognises that growth-oriented entrepreneurs are best served by external private organisations (i.e. consulting companies and other business development services providers) that are taken to know their needs better than civil servants. Hence, the indicator grants a higher score to measures that are delivered through the help of private intermediary organisations rather than directly by people working for a public sector organisation. Nonetheless, there are nuances and it may happen that the government hires staff with private sector experience to deliver programmes that deal closely with entrepreneurs, as in the case of the Danish Growth House initiative analysed in this report. Doubtless, this complicates the interpretation of the score although we presume that the longer someone works in a public organisation, the more s/he will lose touch with the reality of business management even if s/he used to work in the business sector.
The second, third and fourth indicators assess the relationship between programme managers and client firms, awarding the intensity of such relationship based on the number of times they meet in a year, the number of client firms each programme manager/adviser has in its portfolio, and the extent to which managers/advisers are pro-active in their support. These scores, too, should be taken with a grain of salt because public programmes aimed at the same target of high-growth companies can have slightly different objectives, for example providing intensive support to a small batch of highly promising enterprises as opposed to trying to reach as many growth-oriented businesses as possible to the detriment of a more intense relationship.
The last three indicators of this category finally apply only to schemes that have used intermediary organisations for the full or partial implementation of programme activities. The first of the three examines how intermediaries are selected, giving better scores when a larger number of them is chosen through a competitive selection process. The availability of more intermediary organisations should, in principle, enable client firms to choose the organisation best suited to their needs, while a competitive selection process will result in the choice of intermediaries that offer a better quality/price ratio. The second indicator measures the pro-activeness of intermediary organisations in the same fashion as the corresponding indicator for programme managers. The third and last indicator on intermediaries assess how the public sector evaluates their work, giving better scores when the evaluation is done through direct surveys of the entrepreneurs.

26
Monitoring and evaluation
Table 2.6. Indicators under the 'Monitoring & Evaluation' of the high-growth programme
Indicator 1 2 3 4 5
Coverage of the evaluation of the high-growth programme
No component of the high-growth programme is evaluated
Only few components (the major ones) of the high-growth programme are evaluated
Most components of the high growth programme are evaluated
All components of the high growth programme are evaluated
Type of evaluation of the high-growth programme
Evaluation is based on the measurement of activity (e.g. take up rate)
The opinions of client firms about the programme are also collected
Evaluation is also based on client firm views of outcomes
The performance of client firms is compared with a control group of typical or ‘match firms’
Econometric techniques are used to assess the impact of selection bias
Independence of the evaluation of the high-growth programme
The evaluation of the programme is made exclusively internally by programme staff
The evaluation of the programme is made by programme staff and an independent organisation together
The evaluation of the programme is made exclusively by an independent organisation
Frequency of the evaluation of the high-growth programme
The evaluation of the programme is not planned in a regular way and is done ad hoc
The programme is evaluated every 5-6 years
The programme is evaluated every 3-4 years
The programme is evaluated every other year
The programme is evaluated each year
Use of the evaluation of the high-growth programme
The evaluation has been done in an ad-hoc manner and has not informed any change in the programme
The evaluation was planned at early stage but has not informed any change in the programme
The evaluation has been done in an ad-hoc manner, but has informed changes in the programme
The evaluation was planned at early stage and has informed changes in the programme
Evaluation is crucial to determine whether public programmes have an impact and taxpayers are receiving value for money, which is what the sixth group of indicators in the assessment framework seeks to establish. The first indicator looks at how comprehensive the evaluation exercise is, since high-growth programmes can consist of different support activities (e.g. coaching, training, executive education, financing, networking, peer learning, etc.) and not all of them may be covered in the evaluation of the programme. The second indicator assesses the type of evaluation, creating a ranking that is shaped to the OECD “six steps to heaven” in the evaluation practice of SME and entrepreneurship policies and programmes (OECD, 2007). The six steps are: i) take-up of schemes; ii) recipients’ opinions; iii) recipients’ views of the difference made by the assistance; iv) comparison of the performance of the assisted with typical firms; v) comparison with match firms; vi) taking account of selection bias. The third indicator sets whether the evaluation is done internally or externally, putting a premium on external and independent evaluations. External evaluators may well lack some detailed information on the real situation of the programme, but they present the advantages of being seen as independent by external observers, less likely to be influenced by politics, and more likely to bring up new ideas (OECD, 2007). Evaluation should also be done quite regularly, which is what the fourth indicator in the list tries to capture. Finally, the

27
evaluation exercise should be done with the objective to inform policy change, and this is more likely to happen if it is planned at an early stage in the design of the programme. This is what the fifth and last indicator is set to gauge.
Performance of participant firms
Table 2.7. Indicators under 'performance of participant firms’ in high-growth programmes
Indicator 1 2 3 4 5
Average annual turnover growth rate of client firms (over 3 years following the support)
Lower than -2% (negative growth)
Higher than -2% but lower than 2% (negligible growth)
Higher than 2% but lower than 10% (moderate growth)
Higher than 10% but lower than 20% (robust growth)
Higher than 20% (fast growth)
Average annual employment growth rate of client firms (over 3 years following the support)
Lower than -2% (negative growth)
Higher than -2% but lower than 2% (negligible growth)
Higher than 2% but lower than 10% (moderate growth)
Higher than 10% but lower than 20% (robust growth)
Higher than 20% (fast growth)
Average annual export growth rate of client firms (over 3 years following the support)
Lower than -2% (negative growth)
Higher than -2% but lower than 2% (negligible growth)
Higher than 2% but lower than 10% (moderate growth)
Higher than 10% but lower than 20% (robust growth)
Higher than 20% (fast growth)
The questions linked to seventh and last group of indicators gather information on the performance of beneficiary firms, where this information has originally been collected by the evaluators of the selected programmes. The first two indicators largely refer to the OECD definition of a high-growth enterprise as one with “average annualised growth in turnover or employees greater than 20% a year, over a three-year period, and with ten or more employees at the beginning of the observation period” (OECD, 2012). The highest score has thus been assigned to programmes able to help recipients achieve the OECD definition of high-growth, with lower scores progressively assigned to less-than-optimal outcomes. The third indicator mirrors the logic of the first two but is applied to export given the importance of internationalisation for business growth. It should be noted that the indicators in this section address the absolute performance of participant firms, rather than their performance relative to a control group of typical or matched firms.

28
CHAPTER 3. THE BENCHMARKING RESULTS
This chapter provides the results of the benchmark analysis based on the OECD assessment framework introduced in chapter 2. The assessment framework has been applied to six schemes, four of which mainly provide business diagnosis together with coaching and mentoring services (Denmark’s Growth Houses, Scotland’s Companies of Scale, the Netherlands’ Growth Accelerator and Flanders’ Gazelle Jump), while two focus on the provision of finance (Germany’s High-tech Start-up Fund and Commercialisation Australia).
Institutional and geographical context
Table 3.1 Summary of assessment indicators on context of the programme
Denmark's
Growth Houses
Scotland's Companies of
Scale
The Netherlands'
Growth Accelerator
Flanders' Gazelle Jump
Germany's High-tech
Start-up Fund
Commercial isation
Australia
Qualitative objectives
5 5 5 5 5 5
Quantitative objectives
5 1 4 1 4 1
Governance in programme design
5 5 4 5 4 5
Geographical scope
5 4 5 5 5 5
While all six high-growth firm programmes have set consistent qualitative objectives, it is perhaps surprising that half of them have not set clear quantitative objectives to achieve and against which to evaluate programme performance. In the case of Scotland this is possibly related to the very small batch of firms enrolled in the Companies of Scale programme (17 participants), while in Flanders the implementation of the programme through 10 organisations each delivering a slightly different initiative has not helped the definition of clear quantitative objectives for the programme as a whole. Commercialisation Australia is also a peculiar case, because although it does collect information on participant firms before, during and after the support, it decided not to fix specific objectives, recognising that success can take multiple forms, including early discontinuation of assistance for bound-to-fail participants.
Denmark and its Growth House initiative lie at the opposite end of the scale thanks to a comprehensive set of nine indicators included in the contract of rules that govern programme implementation. The monitoring of the objectives set in the contract of rules enables policy makers at the Danish Business Authority to know quite well which targets are being reached and which ones are being missed, where the programme is on track and where it needs to do better with regard not only to the satisfaction of client firms but also to their actual turnover and employment performance. Quantitative objectives also facilitate the task of the Danish government in evaluating the programme against its objectives.
Most programmes have been designed in an inclusive manner, listening to the opinions and feedbacks of the private sector and sub-national governments (i.e. the cases from Denmark, Scotland, Flanders and

29
Australia). This is, indeed, very relevant for public interventions whose intention is to serve business needs. The programmes in the Netherlands and Germany, however, have not involved regional governments either in the stage of design or in that of implementation, and this could undermine policy coherence with similar local programmes as well as the tailoring of the programme to local development needs. In the case of the Netherlands, the small size of the country and the limited powers of local authorities in economic policy possibly explain the lack of consultation with the sub-national level. Germany’s High-Tech Start-up Fund, on the other hand, emerges as quite a top-down initiative in which the Federal Ministry of Economic Affairs and Technology takes up a clear leadership role in a public-private partnership with 13 large private companies.
Finally, all benchmarked programmes are available in most, if not all, regions/provinces of each respective country/region. This is important because while growth is often geographically concentrated high-growth firms can emerge almost anywhere, with those located in more peripheral regions in more need of public support than those in urban areas where more private business services are available.33 Nonetheless, by looking at the geographical distribution of participant firms, it appears true that high-growth policies are inherently biased towards the most developed regions where more high-growth enterprises are located, thereby running the risk of favouring regional disparities if they are not balanced by broader SME support policies. For example, as much as 77% of Commercialisation Australia’s client firms come from the Eastern Seaboard states of Victoria, New South Wales and Queensland.
Staff profile
Table 3.2 Summary of assessment indicators on "staff profile"
Denmark's
Growth Houses
Scotland's Companies of
Scale
The Netherlands'
Growth Accelerator
Flanders' Gazelle Jump
Germany's High-tech
Start-up Fund
Commercial isation
Australia
Academic background
5 5 5 5 5 5
Academic BG in mgmt.
4 5 2 4 3 3
Academic BG in applied sciences
2 3 2 2 3 3
Work experience
5 4 5 3 4 5
Industry experience
5 4 4 2 3 5
“Business owner experience”
3 1 2 1 2 3
Assessment indicators under “staff profile” gauge whether the professional staff of the benchmarked programmes (i.e. not taking into consideration administrative support employees) have the right education and professional skills set to dialogue with the business sector. It is positive finding that in all six schemes more than 80% of professional staff has at least a Bachelor degree. However, differences surface through a
33. For example, one of the business success stories visited in Scotland (i.e. Hydrasun Ltd.) was neither in
Glasgow nor in Edinburgh but rather in Aberdeen, the third most populous city of Scotland and home of a strong oil industry.

30
more in-depth analysis. For example, an education background in management (i.e. Bachelor’s degree or MBA) is much more common in Scotland’s Companies of Scale (more than 80% of the professional staff) than in the Netherlands’ Growth Accelerator (between 20% and 40% of the professional staff).
Unsurprisingly, an academic background in applied sciences is strongest in the initiatives that are more technology-oriented, i.e. Germany’s High-tech Start-up Fund and Commercialisation Australia, although the share of staff members with this education profile remains below 60% in these programmes. There is scope for high-growth programmes, especially technology-based ones, to increase their access to technology expertise through the use of advisory boards that include scientists at the stages of selection and implementation.
The past work experience of programme staff is perhaps even more important than their educational background. In this respect the Flemish scheme emerges as the weakest, underperforming the other benchmarked initiatives in all three indicators (i.e. work experience as a whole, industry experience, entrepreneurial experience). The staff members of other programmes all have strong work experience. However, strong entrepreneurial experience is lacking in most programmes, with the partial exception of the Danish Growth Houses and Commercialisation Australia, where professional staff members have between 6 and 9 years of past experience as business owners. As with the technology expertise, programmes can make up for the possible lack of entrepreneurial expertise by setting up advisory boards and selection panels that include local successful entrepreneurs.
Client firms
Table 3.3 Summary of assessment indicators on "client firms"
Denmark's
Growth Houses
Scotland's Companies of
Scale
The Netherlands'
Growth Accelerator
Flanders' Gazelle Jump
Germany's High-tech
Start-up Fund
Commercial isation
Australia
Selection 3 3 3 3 3 3
Sector concentration
5 5 5 5 5 5
Market orientation
3 5 4 4 4 1
Follow-up 5 5 5 N/A 5 5
There are strong similarities across the benchmarked programmes in how client firms are selected, the sectors and markets they operate in, and how they interact with programme managers. For example, all six programmes select participant firms through a mix of qualitative and quantitative criteria in which the qualitative measures are relatively important. This choice responds to the fact that key growth factors such as the entrepreneur’s ambition or business dynamics are not easily captured by quantitative metrics and call for the subjective assessment of a manager knowledgeable about business development. On the other hand, more structured selection processes where quantitative metrics have a bigger influence would reduce principal-agent problems in the stage of programme implementation and protect programme managers from possible allegations of favouring some enterprises over others for noneconomic reasons. The Dutch and Scottish schemes are those that have set more strict quantitative criteria for participation – e.g. a minimum turnover of EUR 2 million in the first case and of GBP 10 million in the second case – but they also continue to rely on a strong subjective assessment of potential client firms by programme managers.

31
For example, account managers on the Scottish Companies of Scale Programme seek to single out what they call “trigger points” in the life of a business that are likely to set off a period of fast growth. 34
The six benchmarked programmes are also similar from the viewpoint of sector focus. None of them has a narrow industry focus and all welcome both manufacturing and services firms. This reflects a best-practice scenario because empirical evidence shows that fast-growers are not necessarily in technology- or knowledge-based sectors and can be found in both manufacturing and services, although with a slight predominance in the latter. 35
“Market orientation”, which measures the international market activity of the client firms in programmes, is the indicator where there are the strongest differences across the benchmarked schemes. At one extreme is Scotland’s Companies of Scale where more than 80% of businesses have an international market. This is related to the fact this is the only programme that works with very large companies. By contrast, only 10% of companies on the Commercialisation Australia programme are already exporting, which is related to the young age (less than 5 years) of the large majority of participants. In between are the other four schemes with Denmark’s Growth Houses working with proportionally fewer exporting companies than the Dutch, Flemish and German initiatives, probably because of the larger number of businesses they target.
Finally, the follow-up of participant companies is quite common in all six programmes although it takes different forms that cannot be summarised in a single score. It is stronger and more action-oriented in intensive programmes such as Scotland’s Companies of Scale, the Netherlands’ Growth Accelerator, and Commercialisation Australia. In the latter, for example, client firms receiving support are required to report on a number of key performance indicators every year, for 5 years following the completion of their funding project. Follow-up is much less intense in the Danish case which keeps a light-touch signposting approach where programme managers are in fact discouraged from working with the same companies more than once.36
34. Brown R. and Mawson S. (undated), “Trigger points and high-growth firms: A conceptualisation and
review of public policy implications”, unpublished paper.
35. Henrekson M. and Johansson D. (2010), “Gazelles as Job Creators: A Survey and Interpretation of the Evidence”, Small Business Economics, vol. 35, pp. 227-44; OECD (2012), Entrepreneurship at a Glance: 2012, Paris.
36. For example, repeated users are not counted towards the goal of the number of firms to be attended in one year and advisers are encouraged to work with as many new firms as possible each year.

32
Business diagnosis
Table 3.4 Summary of assessment indicators under "business diagnosis"
Denmark's
Growth Houses
Scotland's Companies of
Scale
The Netherlands'
Growth Accelerator
Flanders' Gazelle Jump
Germany's High-tech
Start-up Fund
Commercial isation
Australia
Business diagnosis (general)
5 5 5 N/A 5 5
Business concept
5 5 5 N/A 5 5
Business organisation
5 5 4 N/A 5 3
Customer relations
5 3 3 N/A 5 5
Operations 5 4 5 N/A 3 3
The diagnosis of the business strengths and weaknesses of client firms is a common trait of most high-growth programmes, so it is unsurprising that all programmes benchmarked in this report have an element of business diagnosis at the beginning of their intervention. When comparing the practices of the programmes in their company diagnosis approaches, few striking elements stand out. Scotland’s Companies of Scale and the Netherlands’ Growth Accelerator do not undertake such a thorough analysis of the customer relations of support firms as the other initiatives, with neither digging into branding and communication/public relations issues. Similarly, the German and Australian programmes do not investigate business “operations” (i.e. accounting, business financing, production management, IT system and facilities) in as much detail. For example, managers at Germany’s High-tech Start-up Fund did not reckon IT system and facilities as key issues at the early stage of the business lifecycle that many recipient firms go through at the time of support.

33
Delivery arrangements
Table 3.5 Summary of assessment indicators on delivery arrangements
Denmark's Growth Houses
Scotland's Companies
of Scale
The Netherlands'
Growth Accelerator
Flanders' Gazelle Jump
Germany's High-tech Start-up
Fund
Commercial isation
Australia
Extent to which support is internalised or externalised 4 2 1 5 2 2
Direct involvement of programme staff with client firms 3 5 5 3 4 5
Annual ratio "client firms/programme adviser" 2 1 1 1 1 1
Pro-activeness of programme staff towards client firms 4 3 3 1 3 N/A
Pro-activeness of intermediary organisations towards client firms 4 2 1 3 3 N/A
Selection of intermediary organisations by programme 2 4 4 4 2 N/A
Evaluation of intermediary organisations 1 4 5 2 1 N/A
The delivery arrangements of the different programmes vary significantly. There are marked differences with respect to the degree to which services are internalised or externalised. The Dutch Growth Accelerator provides support for participating companies solely by members of the consortium operating the scheme. By contrast, the most open schemes are the Danish Growth Houses and the Flanders Gazelle Jump. In both cases support is provided by private sector organisations on a contractual basis, although the basis of contracting is rather different – at the level of the individual enterprise in Denmark and for a particular service type in Flanders. Other schemes considered here operate a more hybrid approach with some aspects of support provided by the scheme operator and some by other organisations. In Commercialisation Australia, for example, the skills and knowledge-building components of the scheme are implemented through external consultants, other aspects of the programme are delivered by case managers.
These contrasts between the schemes are also reflected in the extent to which programme staff are directly engaged with client companies, and the number of clients which each member of programme staff works with each year: the most intensive engagement occurs in Scotland, the Netherlands and Australia with weaker engagement elsewhere. The annual ratio "client firms/programme adviser” shows that programme staff in the Danish Growth Houses work with the largest number of companies each year (more than 25), with advisors in each of the other schemes working with less than 25 companies each year. However, participating firms often stress the benefits of intensive engagement with growth programme staff where this is offered.
Schemes also differ in terms of how and where they interact with client companies. The Growth Houses are more proactive than the other programmes in the degree to which they reach out to client firms. Thus the staff of the Growth Houses will often visit companies as part of the evaluation and diagnosis of development needs. This type of company-based activity is also relatively frequent in each of the other schemes, with the exception of the Flemish Gazelle Jump scheme where client firms are required to visit

34
programme offices. A broadly similar pattern is also evident in terms of how intermediaries involved in the different schemes work with high-growth participants. Intermediaries are again most likely to do business on clients’ premises in Denmark, with this slightly less likely in each of the other countries. The exception here is the Dutch scheme, where the vast majority of the interaction takes place on the premises of the scheme operators. In large part this reflects the very structured and programmed nature of the training activity which firms follow as part of this ‘high-growth college’ scheme, with much input organised as modules or specifically focussed study days.
The final two delivery arrangements indicators relate to the selection and evaluation of intermediaries. Here again significant differences emerge in the ways in which schemes are delivered. The Scottish, Dutch and Belgian programmes work with a restricted number of intermediaries (less than 10) that go through a competitive selection process before they are able to participate in the programmes. In the Netherlands, for example, intermediaries are drawn primarily from partners in the consortium, which deliver the scheme in their specialist areas of expertise. In Scotland, external providers to Scottish Enterprise are only used when the expertise are not available within Scottish Enterprise. When this is done, global experts in the relevant field are identified and after evaluation used in the programme. Interestingly, these externally run training sessions are also sometimes opened up to other Scottish Enterprise account managed firms outside the Companies of Scale programme generating wider benefits for the economy. By contrast, the Danish and German models work with large numbers of intermediaries.
As well as working with larger numbers of intermediaries, the German and Danish programmes undertake relatively little regular, formal evaluation of the performance of intermediaries. In the German scheme, the evaluation is limited to the perceptions of high-growth participants of the support they receive. In Denmark, after the initial diagnosis by the Growth House firms are quickly passed on to a range of private sector mentors and consultants. There is no formal feedback or evaluation loop following the interaction between the client firm and consultant, although informal feedback is sometimes obtained, particularly where a firm has a negative experience with a consultant. The lack of any formal evaluation mechanism in the Danish context makes it difficult for the Growth Houses to guarantee the quality of the support services which firms receive after their initial diagnosis.
Monitoring and evaluation
Table 3.6 Summary of assessment indicators on monitoring and evaluation
Denmark's Growth Houses
Scotland's Companies
of Scale
The Netherlands'
Growth Accelerator
Flanders' Gazelle Jump
Germany's High-tech Start-up
Fund
Commercial isation
Australia
Coverage of the evaluation 5 5 5 5 5 5
Type of evaluation 4 3 4 1 3 3
Independence of the evaluation 5 5 5 N/A 5 5
Frequency of the evaluation 5 3 2 3 1 3
Use of the evaluation 5 4 4 1 or N/A 4 5
Monitoring and evaluation of the impacts of the programmes themselves are crucial in assessing the effectiveness and value for money of high-growth support measures and in upgrading and improving interventions. Each of the schemes considered here has engaged in some evaluation and monitoring activity although these differ in structure, intention and sophistication. It is also important to note in this context the rather different performance metrics which each scheme is intended to achieve. In the case of

35
the Growth Houses, for example, a detailed set of quantitative metrics are specified as part of the Contract of Requirements which govern some aspects of funding for the scheme. By contrast Commercialisation Australia does not have quantitative targets for its key performance indicators, acknowledging that success can take many different forms, including the fast failure of a project and re-allocation of resources. Other schemes – notably the Dutch programme – have throughput and sustainability targets but no specified growth targets for the scheme as a whole (although there are criteria for anticipated growth on entry to the scheme). These contrasts are important as they provide the context for the monitoring and evaluation of each scheme and what constitutes ‘success’.
In this benchmarking exercise, the first evaluation indicator reflects whether programme evaluations are full or partial, in other words, whether any evaluation covers all elements of a scheme. This has been the case with the evaluation arrangements for all the programmes. In the Dutch and Danish schemes, for example, quantitative control group comparisons have been undertaken between high-growth firms participating in the scheme and matched groups of non-participants. This type of scheme-wide holistic evaluation approach has both strengths and weaknesses. Its strength is its ability to reflect the entire impact of the scheme and capture any positive synergies between different elements of scheme provision. To the extent that it reflects the impact of the scheme, it may also provide the basis for good value for money estimates. The weaknesses of this approach, however, are that it makes it difficult to know which element of the provision is actually making the most difference to the growth of the participating firms. Is it the mentoring element of the schemes? The personal development activities with the entrepreneurs themselves? Or, is it some of the more specialist advice or training provided on exporting, innovation or marketing? Gaining this type of more detailed insight is likely to require a more mixed-methods evaluation approach combining quantitative analysis with more qualitative feedback or analysis. The interim evaluation of Commercialisation Australia used this type of more qualitative approach, providing insight into the value placed by participants on different elements of the programme.
The second monitoring and evaluation indicator reflects the sophistication of current evaluation approaches using the six-step ladder of the sophistication of SME policy evaluation outlined previously by OECD37. The key idea here is that at each ‘step’ the counterfactual is better defined and so, the impact or additionality of the policy initiative can be more accurately measured. Evaluation approaches are most advanced in the Netherlands and Denmark both of which have undertaken control group evaluations which fall in Step 5 of the OECD six-step model. In these evaluations the aggregated performance of assisted firms is compared to that of a group of matched enterprises, with the inference that the difference in performance is linked to scheme participation. In both cases - the Growth Houses and the Dutch Growth Accelerator programmes – this type of comparison casts a very positive light on the effectiveness of the measures. As the OECD report notes, however, Step 5 evaluations may match the control group in terms of size, sector, and perhaps location of the assisted and control groups but still cannot take into account other, less readily observable, differences between the characteristics of the two groups of firms. These may for example be linked to entrepreneurial ability or the willingness of firms to take on board advice from outside the firm. As a result the potential exists for mis-attribution of performance differences between the assisted and control group to be attributed to the intervention. Controlling for these issues requires more complex econometric approaches or the adoption of a more experimental evaluation approach.
Evaluation approaches to date in countries other than Denmark and the Netherlands have been less sophisticated – in terms of the OECD typology – and fall into the formative rather than summative category. In some cases – Germany, Scotland and Australia – evaluations have been predominantly qualitative and considered as ‘interim’ providing information on the general acceptability of the schemes and suggestions for improvement. These evaluations fall into Steps 2 and 3 of the OECD typology, 37 Potter, J. & Storey, D. 2007. OECD Framework for the Evaluation of SME and Entrepreneurship Policy
and Programmes. Paris OECD.

36
reflecting monitoring measures which reflect subjective opinion-based views of the different schemes. Interestingly in the Netherlands both qualitative and control group evaluations have been undertaken providing a strong all around picture of the scheme and the strengths and weaknesses of the different elements of the Growth Accelerator programme.
In all the benchmarked programmes the evaluations were undertaken by independent evaluators. This independence is seen as an important element of any evaluation approach in the OECD guidelines. Typically evaluations are undertaken by consultants but the national statistics offices in Denmark and the Netherlands have also been involved in the two control group evaluations discussed previously.
More variation is observed in terms of the frequency of the evaluation and the use which is made of evaluation data. Here the evaluation of the Danish Growth Houses stands out with the control group evaluation being done each year as part of the assessment of whether the programme is meeting its planned growth and performance targets. As a result the Danish scheme evaluation is one of only two countries – the other being Australia – in which the evaluation was a planned element of the scheme design and where the results of the evaluation have led to changes in the scheme. In the majority of other countries the indicators suggests that evaluations are rather ad hoc and are conducted every 3 to 6 years. Nonetheless in the Scottish Companies of Scale, the German High-tech Start Fund and the Dutch Growth Accelerator programme these evaluations had resulted in improvements in the schemes.
Performance of participant firms
Table 3.7 Summary of assessment indicators on performance of participant firms (over 3 years from support)
Denmark's Growth Houses
Scotland's Companies
of Scale
The Netherlands'
Growth Accelerator
Flanders' Gazelle Jump
Germany's High-tech Start-up
Fund
Commercial isation
Australia
Average annual turnover growth rate 2 5 5 N/A 3 N/A
Average annual export growth rate 4 3 5 N/A 3 N/A
Average annual employment growth rate 3 3 3 N/A 4 N/A
The impacts of the schemes are difficult to assess for each programme due to the newness of each of the measures, the formative rather than summative nature of much evaluation activity to date and the more standard issues of attribution which relate to any policy evaluation. The evidence summarised here therefore simply refers to the performance of participant firms following enrolment in the programme, without trying to ascribe such performance to the impact of the programme. Considerable care also needs to be taken in drawing any inferences about the comparative performance of each measure because of the very different objectives of the different schemes and differences in evaluation methodologies.
Having sounded this note of caution there is positive evidence from each of the four schemes where data is available of good turnover, employment and export growth performance among participant firms. Looking at turnover growth first, two schemes, the Scottish Companies of Scale Programme and the Dutch Growth Accelerator, reported a turnover growth rate of 20 per cent plus by client firms in the three years after joining the programme. More modest results of between 2 and 10 per cent were reported for the Danish and German measures. Only in the Dutch scheme does this very high growth turnover performance carry over into exporting, although the Danish, Scottish and German schemes all report significant export and sales growth improvements.

37
Two points stand out here. First, there is a tentative relationship between the ‘intensity’ of each scheme and its benefits for sales growth of participant firms: the two schemes involving the most intensive interaction between programme staff and firms – the Dutch and Scottish programmes – also report the highest turnover growth rates; the scheme with the least intensive interaction – the Danish programme – reports the lowest average turnover growth rate in participants. This is not perhaps surprising. In both the Dutch and Scottish schemes entry into the scheme is strongly selective and both schemes provide very intensive and costly support to the firms engaged in the scheme. Secondly the evidence suggests a rather inconsistent relationship between the growth of turnover, exports and employment. In the case of the Danish Growth Houses, employment growth was reported as stronger than that on sales while in both the Scottish and Dutch schemes the employment gains were less significant than those for turnover. The implication is that while high growth schemes may deliver in terms of, say, sales growth, equal levels of job creation are not guaranteed.
Benchmarking summary
While the benchmarked programmes have the common objective of supporting high-growth firms, they differ significantly in their structure, delivery arrangements, intensity and forms of support provided and their outcomes.
It is interesting, for example, to note that not all programmes have set clear quantitative objectives to achieve, although this influences the ability to carry out a more rigorous evaluation. The Danish programme is a good-practice in this case. Thanks to a comprehensive set of indicators addressing not only the satisfaction of client firms but also their turnover and employment performance after the intervention, the Growth Houses have been able to compare the performance of client firms with a control group of matched firms by industry, size and location. This is not the most sophisticated possible evaluation exercise, but it remains nonetheless the most sophisticated among the benchmarked programmes.
The experience of the six programmes subject to the benchmark analysis has also shown us that collaboration in policy design is increasingly common among policy makers, although consultation with the private sector is more frequent than co-operation across different levels of government. Lack of consultation between national and regional governments can result in poor coordination between similar initiatives at different levels as well as in limited adaptation of national policies to different local business needs.
In the anecdotal narrative of SME programmes, qualified managers are often considered a key resource instrumental to the success of the initiative. What emerges from the benchmark analysis is that all programmes have a highly skilled staff, but that entrepreneurial skills (i.e. staff with past experience as business owners) and technological skills (i.e. staff with education in applied sciences) are not always strongly available internally. Arguably, this gap can be partly compensated by including people with an entrepreneurial and scientific profile in the advisory boards and selection panels of high-growth programmes.
A characteristic shared by all the benchmarked programmes is the prevalent use of qualitative assessment criteria over quantitative metrics to select participant firms. This is the result of difficult to measure factors such as the entrepreneur’s ambition and internal business organisation being regarded as at the core of fast business growth. However, a good match of qualitative and quantitative selection criteria needs to be found to ensure a more objective implementation of the programme that, inter alia, eschew typical principal-agent problems of diverging interests between the policy makers who design the intervention and programme managers who implement it.

38
Delivery arrangements also differ widely across benchmarked schemes. At one extreme the Scottish Companies of Scale programme and the Dutch Growth Accelerator programme provide very intensive support for a small group of carefully selected firms. At the other extreme the Danish Growth Houses provide relatively light-touch diagnosis and brokering services to large numbers of Danish firms before referring firms to private sector providers. An indication of the varying intensity of these services is provided by the average number of hours spent with a client company in the different schemes. In Denmark, Growth House staff spend an average of 20-26 hours with each firm, depending on the region, and firms are discouraged from seeking support in successive years; in Scotland each Company of Scale receives 250-300 hours of programme staff time annually for up to three years. Other schemes considered here sit somewhere between these two extremes in terms of intensity.
Performance of participant firms seems to reflect the intensity of the benchmarked schemes. Reported turnover growth rates were greatest in the Dutch and Scottish programmes and less marked in the less intensive schemes. There is considerable inconsistency, however, in the performance of participant firms with respect to turnover, employment and exports, which suggests that sales growth, for example, is not necessarily a guarantee of job creation.
Evaluation and monitoring activity is undertaken by each of the schemes benchmarked here. The sophistication and regularity of the evaluation which is conducted varies considerably, however. In part this relates to the legal framework which surrounds each scheme but also to the relative newness of a number of the measures which means full-scale evaluation is not yet feasible. In the case of the Dutch Growth Accelerator programme, for example, the first cohort of companies will not finish the full five-year programme until mid-2013, and it will be sometime after that before the potential longer-term benefits of the scheme will become evident. Two schemes stand out in terms of conducting control group evaluations – Denmark and the Netherlands – with the Dutch control group evaluation also supported by more qualitative evaluation. Evaluation of other schemes has been less rigorous and largely formative as the schemes have developed.
None of the schemes considered here has, however, to date adopted what would be considered best practice in terms of scheme evaluation. Step 5 control group evaluations such as those conducted in the Netherlands and Denmark may match the control group in terms of size, sector, and perhaps location of the assisted and control groups but still cannot take into account other, less readily observable, differences between the characteristics of the two groups of firms. As a result the potential exists for mis-attribution of performance differences between the assisted and control group to be attributed to the intervention. Two possibilities are evident for the future. First, it may be possible to undertake more detailed econometric evaluations – Step 6 evaluations in the OECD typology – which deal more effectively with selection bias and therefore provide a better indication of the effectiveness of the various initiatives. This type of approach may be applicable to the Dutch Growth Accelerator and Danish Growth Houses but is unlikely to be suited to the much smaller Scottish scheme. Second, at least in the case of the Growth Houses it may be possible to conduct evaluations based on randomised control trials with potential growth firms being routed on a random basis to alternative service providers. Monitoring comparable outcomes would then provide an indication of differential impacts.

39
CHAPTER 4. KEY MESSAGES FOR DENMARK
Introduction
Since their establishment the Danish Growth Houses have made a significant contribution towards the goal of making Denmark one of the world’s most entrepreneurial economies. Between 2007 and 2012 they provided support to over 14,000 potential high-growth firms with high levels of satisfaction registered by client firms and intermediaries. The Growth Houses have also managed successfully to balance national and regional objectives, maintaining the coherence of the national system while responding effectively to local business needs.
The international benchmarking analysis identifies several significant differences between the Growth Houses and the other programmes. The Danish Growth Houses differ somewhat from all of the other initiatives reviewed, playing a primarily diagnostic and brokering role within the Danish entrepreneurship system. The other initiatives are more targeted schemes or initiatives working with smaller numbers of companies more intensively. Notwithstanding these differences, however, the comparison with other programmes sharing the objective of helping firms with high-growth potential to become high-growth firms suggests a number of potential learning points for the Growth Houses and insights into how the Growth House system might be developed and improved.
Broadly-based or more intensive support?
The first and very obvious difference between the Growth Houses and the other schemes relates to the numbers of companies assisted. The Growth Houses provide relatively light touch support to a wide range of companies with the quantitative objectives of the programme in terms of the numbers of businesses to be served, spelt out in detail in the Contract of Requirements. Most of the other schemes adopt a much more intensive approach working with a small number of companies. Unlike the Growth Houses other schemes also adopt a very different philosophical approach with regard to setting objectives. Commercialisation Australia, for example, has clear KPIs which guide reporting metrics but no quantitative targets.
The quantitative, largely throughput-based targets specified for the Growth Houses in the Contract of Requirements have clear implications for the time which Growth Houses staff can spend with any company. This is an obvious contrast with the approach adopted in the Dutch and Scottish schemes, for example. It may be worth the Growth Houses considering a tiered approach to support reflecting approaches adopted elsewhere. For example, the Scottish Account Management system is a first tier approach in some ways parallel to the baseline diagnostic service provided by the Growth Houses. However, it is also possible within this type of system to offer more intensive support – as in the Scottish Companies of Scale scheme –working more intensively with a smaller number of those firms with the most significant growth potential.
This is potentially important as the benchmark exercise provides some tentative information that the growth effects of more intensive support – such as that provided in Scotland and the Netherlands – may actually have the most significant growth benefits, growth benefits which very rapidly significantly outweigh the increased costs of providing a more intensive service. Similar results are evident from

40
academic studies in different settings which suggest the potentially significant value of more intensive (rather than more extensive) business support38.
One way to facilitate this type of more intensive engagement between the Growth Houses and firms within the Danish system within the existing structure would be to relax the restriction on the proportion of firms which the Growth Houses can work with in successive years. This would allow the Growth Houses to develop longer-term engagements with firms. There are important potential benefits from facilitating longer-term client relationships in terms of:
• Growth Houses’ knowledge and understanding of individual firms would improve and deepen and this may enable Growth Houses to provide a more informed service to the business than otherwise.
• Personal relationships between Growth Houses staff and firms would develop and strengthen. This type of close personal relationship plays an important role in both the Scottish and Dutch schemes, a role much valued by high-growth firms.
• The possibility of offering this type of more intensive service might be welcomed by Growth Houses staff as it would enable them to work with a firm through the entire cycle of diagnosis and implementation rather than having to pass a firm on to a private sector provider after the diagnosis is completed.
Leadership skills diagnostics and peer learning
The diagnostic tools which have been developed for use in the Growth Houses are generally regarded very positively by both Growth Houses staff and clients. The approaches developed by the other schemes, however, do suggest some ways in which this might be extended. Perhaps the most sophisticated and appealing approach reviewed has been developed in the Dutch Growth Accelerator Scheme. The key insight here is that high growth requires very significant changes in managerial priorities and capabilities as the firm itself experiences high growth. Individual entrepreneurs therefore need to develop their skill set alongside growing the firm. In the Dutch scheme this idea of the dual approach to business and personal development is captured in the vision for the business or ‘Strategic Picture’ and the entrepreneur’s own future or “Personal Picture”.
There may be scope within the Growth Houses system to expand and develop the current diagnostics which are applied to the entrepreneur or leadership team – perhaps drawing on the approaches developed in the Dutch model - to better anticipate leadership training needs.
Another key feature of the learning model adopted in the Dutch Growth Accelerator programme is peer-group learning, based on the pedagogically well-established idea that learners benefit substantially from interaction with other similar learners. It is not clear what role peer-group learning plays in the learning model implicit in interventions by the Growth Houses. Indeed, it could be argued that the Growth House model in which firms are brokered to a diverse group of intermediaries may actually reduce the potential for peer-group interaction and learning. Organisational mechanisms which integrate peer-group learning more strongly into the Growth House offering might valuably be explored.
38 Mole, K. F., Hart, M., Roper, S. & Saal, D. S. 2011. Broader or deeper? Exploring the most effective
intervention profile for public small business support. Environment and Planning A, 43, 87-105.

41
Selection and evaluation of intermediaries
In each of the schemes considered in the benchmarking exercise there is an element of brokerage – the firm’s advisors working with the entrepreneur to identify the types and providers of support which can best support growth. The way in which this brokerage works, however, differs between the programmes depending on the delivery mechanism. The most ‘open’ or least restricted brokerage model is that of the Danish Growth Houses where the Growth House is free to broker activity following the original diagnosis to a wide range of private sector providers. The Scottish Companies of Scale programme is perhaps the most ‘closed’ programme in that the majority of follow-on or specialist support is provided primarily from within Scottish Enterprise.
As currently operated, the Growth Houses’ system of brokerage raises two issues for client companies and Growth House staff. First, there is substantial complexity in the system, both in terms of the number of services offered by the GHs and in terms of the number of potential intermediaries. On the homepage ‘start-growth’ (Startvækst.dk) alone, for example, 220 different public services are available, aiming to support growth in new and established businesses. Additionally, there are 2,537 private consultants to choose from at the website Rådgiverbørsen. The sheer number of different services and offerings complicates the system, making it difficult and costly in terms of search time for firms and Growth Houses staff to identify appropriate services and service providers. Secondly, the wide range of services and intermediaries in the Danish system make it difficult to either assess (or guarantee) the quality of any individual service or intermediary. This is not helped by the fact that the Growth Houses only receive evaluations on intermediaries on an aggregate level rather than feedback on individual intermediaries. In particular, there is no public evaluation of private intermediaries other than through online user evaluations, which are rarely filled out by client enterprises. As a result the Growth Houses can only assess the quality of private intermediaries though informal discussions with client companies.
The Growth Houses stand out here from the other high-growth schemes considered in two related ways: the number of consultants used and the lack of any formal evaluation framework for their services. These issues are clearly inter-related, but an obvious step that could be taken would be to try to develop some more formal feedback system on individual service providers and perhaps, as in the German scheme, to consider some accreditation programme. Both, however, are likely to require some restriction on the number of private consultants who the Growth Houses work with. An alternative approach which may also be interesting at least to pilot would be to experiment with an on-line market place for support services. Here, after the completion of the initial diagnosis, service requirements from the Growth Houses could be posted together with geographical and other details of the client firm. Consultants could then be required to bid for assignments. After their assignment or project was completed, firms (and perhaps consultants) could be required to submit on-line feedback which could be used both in guiding future contract awards and in providing an input to project evaluation.
Introducing ‘Step 6’ evaluation and qualitative measures
Robust evaluation of the impacts of high-growth entrepreneurship programmes poses significant methodological issues, particularly given their short history. The evaluation of the Growth Houses is nonetheless one of the most robust available with respect to establishing quantitative impacts, although it does not fully account for selection bias or unobservable differences between the characteristics of the assisted and control group firms.
Two possibilities are evident for extending quantitative evaluation in terms of the Growth Houses. First, it may be possible to undertake more detailed econometric evaluations – Step 6 evaluations in the OECD typology – which deal more effectively with selection bias and therefore provide a better indication of the effectiveness of the Growth House intervention. Alternatively, it may be possible to conduct

42
evaluations based on randomised control trials with potential growth firms being routed on a random basis to alternative service providers. Monitoring comparable outcomes would then provide an indication of differential impacts providing information on the relative effectiveness of alternative service providers.
It may also be useful for the Growth Houses to develop more subjective or perhaps qualitative monitoring data. Data could, for example, be collected on the experience of client enterprises throughout the growth process as well as on programme advisors and their interactions. The aim of this would not be summative but instead formative – helping the Growth Houses to develop and enhance their services in terms of the drivers of success, effective counselling, knowledge sharing, enterprise behaviour, individual or organizational dominant logic, as well as collaboration with the municipalities.
Delivery arrangements
The regionally-organised Growth House system has dealt effectively with the need to maintain a unified national policy approach while responding to local needs. However, two aspects of the system structure may have detrimental impacts on effectiveness. First, the choice of having five Growth Houses raises co-ordination issues since each nationally-provided service has to be operationalised five times. It also makes it difficult to ensure that in any particular Growth House the flow of companies is sufficient to allow specific industry expertise to develop. It may therefore be worth considering some changes to structure which allow specialist units to develop which have a national remit for a specific type of companiy. One such unit might provide the more intensive support for firms suggested earlier or provide the specific support required by particular classes of firms, e.g. academic spin outs or energy start-ups.
A second issue relates to the parallel nature of the Growth Houses and access to finance systems. This could potentially reduce the effectiveness of both and make it more difficult for firms to access co-ordinated support. It may be worth reviewing the structure of these two systems and considering whether any closer integration is possible.

43
PART II – THE BENCHMARKED PROGRAMMES

44
CHAPTER 5. DENMARK'S GROWTH HOUSES
Introduction
Like so many other European countries, Denmark faces the challenge of reversing the decline in economic growth. Whilst, on the one hand, wages have increased at a higher pace than in similar OECD-countries during the past ten years, on the other, Danish growth in productivity is among the weakest within OECD-countries (Danish Business Authority 2011a: 7). Indeed, a Danish benchmarking report on entrepreneurship and start-ups warns that jobs will be lost unless Danish enterprises increase their level of competitiveness (Danish Business Authority 2011a: 7).
Such warnings emphasize that it is necessary to promote growth in start-ups as well as established enterprises as a solution to the pressing challenges. Research shows that where start-ups in general create four new jobs over a three-year period, growth start-ups create 15 new jobs during the same period of time (Danish Business Authority 2011a). It has been documented that although Denmark is among the best performing countries in the world in terms of creating start-ups, Denmark performs less well in terms of high-growth start-ups and can be found in the median range in international comparisons of high-growth start-ups’; reflecting negatively on job and wealth creation (Danish Enterprise and Construction Authority39 2010).
Additionally, in the long term few growth enterprises develop to become larger corporations in a Danish context. In comparison with the United States, for instance, where 20% of growth enterprises, with 250-499 employees, are ten years or younger, this is only the case for two percent of enterprises in Denmark. Hence, even growth enterprises sustain growth at a significantly slower pace in Denmark (Danish Business Authority 2011a). The challenge for Denmark is thus twofold: (i) to increase the number of growth enterprises, whilst also (ii) sustaining and increasing growth within established enterprises.
Acknowledging the criticality of these challenges for stimulating the Danish economy, in 2007 five Growth Houses (GHs) were established. The aim was and is to sustain and support the growth potential of start-ups and growth businesses in general.
In the following, this report evaluates the performance of the Danish GHs, their work on an operational and strategic level, and integration into a wider support system as well as making recommendations concerning potential improvement. It is based on the following sources of primary and secondary material: (i) interviews with all GH managers (ii) policy reports, (iii) existing evaluations, and (iv) available statistics.
39 The name of the ’Danish Enterprise and Construction Authority’ was altered to the ’Danish Business
Authority’ with the change of government in 2011

45
Legal Context
In the autumn of 2005, the concept of GHs as a mechanism for promoting entrepreneurship was developed. In June 2006, the five Growth Houses, one per region, were officially launched, and in January 2007 they were formally opened. The implementation of the GHs was part of a larger Danish reform and centralization process in the Danish structure of governance where prior civic territorial divides and their respective political institutions were reorganized into five major regions. Thus, in 2007, the GHs replaced 15 local business service centres and further defined a specific focus on growth businesses (Danish Enterprise and Construction Authority 2009: 1). The GHs are organized as independent, commercial, non-profit foundations by local municipalities, referring to the Law on Business Development on judicial matters, and governed by the Danish Business Authority. To ensure the successful collaboration between the regional GHs and local municipalities, the responsibility for the GHs was transferred from national to municipal level in 2011. Concurrently, the financing of the GHs was also moved to the local municipalities in cooperation with the Danish Business Authority. Quintessentially, local municipalities finance the GHs through national block grants.
Table 1 shows the annual budget of the GHs from 2007-2013. The financial resources are divided among the five regions based on the number of inhabitants in each region. Up until 2011, a bonus system rewarded the regions’ degree of achievement in relation to the stated objectives in the Agreement between Local Government Denmark and the Ministry of Economy and Business Affairs; commonly referred to as the Contract on Results (in the following referred to as CR). However, as of 2011, when the municipalities became the financiers of the GHs, this bonus system was discontinued and compensated through the grants.
Table 5.1 Basic Annual Budget of the all five Growth Houses provided through national block grants, 2007-2013 in million USD
Year 2007 2008 2009 2010 2011 2012 2013
Total budget for GHs 15.6 15.5 15.98 16.08 16.3 16.74 16.98
The budgets, as illustrated in Table 5.1, only serves as the basic means of funding for the GHs. In addition to national block grants, each GH operates funding for regional, national and/or European projects and programmes which are established to tackle specific regional growth problems. The size of the total budget of each GH thus varies significantly across regions and is higher in Central and Northern Jutland due to funding from the European Union designated to partially compensate for enterprises’ expenditures to private intermediaries. For instance, the basic budget of Central Jutland in 2012 is USD 4,53 mill. while they operate a total budget of USD 18,79 mill. In comparison, Southern Jutland in receives an annual budget of USD 3,46 mill. through national block grants and operates a total budget of approximately USD 13,86 mill. in the same year40.
Rationale
The GH initiative was launched subsequent to the Globalization Strategy introduced in April 2006 (The Government 2006), that by 201541 Denmark should (i) be a leading knowledge society; (ii) offer world class education; (iii) be the most competitive society in the world and (iv) be a leading entrepreneurial society and one of the societies in the world where most growth enterprises are launched. The later goal was also adopted as the vision of the GH programme. Its mission was defined as the creation
40 Unfortunately, detailed figures for all the regions have not been available. 41 In the CR for 2010 the year of 2015 was altered to the year of 2020.

46
of growth in new and small and medium-sized enterprises (SMEs). In effect, the expected impact of growth enterprises includes increases in: job creation, innovation, productivity, wealth and the general welfare in Denmark (Danish Business Authority 2011a).
The public infrastructure of the service to growth entrepreneurs were in essence initiated to balance public and private offerings to generate the optimal conditions possible for Danish businesses (Danish Business Authority 2011a: 112). The GH initiative was created to address the potential negative consequences of a market failure of insufficient supply and demand in the consulting market because research indicated that start-ups and SMEs hesitate to request and acquire external specialist advice to initiate growth (Wren and Storey 2002; Danish Business Authority 2011a: 103).
To achieve an increase in jobs, growth and social inclusion, the GH is, as illustrated in Figure 5.1 designed like a house with three floors as part of a larger service support system to promote businesses in Denmark. The ground floor of the house; i.e. the CR of 2011, builds the foundation of how ‘the GHs will impartially and without compensation assist enterprises in mapping their growth potential, make a growth plan and refer enterprises to public or private business service that can contribute to realize their growth potential’ (Danish Ministry of Economics and Business Affairs 2011a: 1).
Figure 5.1 Key Tasks and Responsibilities of the Growth Houses
Source: Based on notes from the Danish Business Authority
The first floor of the house demonstrates the GHs as ‘the main hub in an integrated system of services where the GHs generate collaboration between actors and are the ‘drivers’ of further developing the initiatives in a direction that sustains a growth culture as well as growth on the part of the enterprises’ (Danish Ministry of Economic and Business Affairs 2011a: 1-2). In collaboration with the local business service centres, the GHs are established to offer an integrated, streamlined and transparent business service system with a specific focus on enabling and supporting growth start-ups and businesses with high-growth

47
potential. Collaborating partners include education and research institutions, ministries, service centres and technological service institutes among others; actors whom the GHs aim to engage to create a balance between public and private offerings (Danish Business Authority 2011). The purpose of the GHs is, in this respect, to guide companies in the right direction and thereby decrease information asymmetries and search costs, while reducing the potential market failure of insufficient supply and demand in the consulting market (Wren and Storey 2002; Danish Business Authority 2011).
The top floor of the GH indicates that the GHs can be operators on various regional projects that create growth possibilities for businesses, for instance, projects financed by municipalities, regions, the state or EU (Danish Ministry of Economics and Business Affairs 2011a: 2).
The homepage Startvækst.dk (i.e. start-growth) is the central online hub aimed at entrepreneurs and growth businesses. Apart from linking to the GHs, startvækst.dk offers a vast variety of services on everything from online business and webshops, business forms, contracts, financial strategies and how to employ the first employee, among others. At startvækst.dk links are available to ‘vækstguiden’ (The Growth Guide) and Rådgiverbørsen (The Consultant Exchange). Vækstguiden alone offers 224 public service opportunities on financing and consulting. Figure 5.2 shows the GH as the central ‘hub’ to a wide range of initiatives in the Danish infrastructure of support to businesses. The GH is portrayed as the ‘front door’ into an elaborate business support system.
Figure 5.2 The Growth House as a Central Hub
Source: Based on notes from the Danish Business Authority
Objectives
The GHs have both national and regional objectives. The Danish Ministry of Economics and Business Affairs and the Local Government Denmark designed nine objectives to be applied to all regions and used in a cross-regional evaluation (see table 2). Apart from these, the CR states a variety of goals to help strengthen the work of the GHs. These include (i) the united identity of the GHs, (ii) constantly developing the GHs, making them more efficient as well as enabling sharing knowledge on regional activities continuously, (iii) the increase of an effective and coherent service system with local service providers, (iv) the creation of an overview and transparency in the service system as well as (v) the focus on the

48
development of competencies among different actors involved at both regional and local level (Danish Ministry of Economics and Business Affairs 2011a).
Table 5.2 The objectives of the GHS for 2012
# Objective 1 A minimum of 2.650 high-growth enterprises is selected each year through business diagnosis and these
are provided a growth plan and further undertake a user-evaluation.
2 At least 80 % of the selected enterprises are referred to intermediaries.
3 At least 70 % of the selected enterprises will recommend GHs to others.
4 At least 80 % of the intermediaries are satisfied with the particular GH.
5 At least 80% of local collaborators are satisfied with the GHs.
6 At least 70% of the selected enterprises will refer intermediary to others.
7 High-growth enterprises will increase employment by at least 10% in comparison to similar enterprises in the control group from 2011 to 2012.
8 High-growth enterprises will increase turnover by at least 15% in comparison to similar enterprises in the control group from 2011 to 2012.
9 High-growth enterprises will increase export by at least 10% in comparison to similar enterprises in the control group from 2011 to 2012.
Source: Danish Ministry of Economics and Business Affairs 2011a
The objectives are clear, specific, and measurable. The first two goals account for the number of client enterprises and the share of customers referred to private consultants and public operators evaluating the basic set-up of the GHs. The majority of the objectives focus on the satisfaction of intermediaries and client enterprises (objectives 3 to 6). This is worth noting as the chosen satisfaction measures fail to capture whether the advice influences client performance. The target numbers correspond to the satisfaction level that all programmes of business advice throughout the developed world report, which is around 75% (OECD 2007). One third of the presented goals analyse the performance of client enterprises (objectives 7 to 9). It needs to be emphasized that due to the widespread use of intermediaries the GHs have only an indirect influence on these outcomes. The use of a control group for these three objectives, however, indicates that the measure is reliable.
Geographical scope
The five regional GHs have a nationwide outreach. The number of inhabitants in each region determines the expected quantity of performed business diagnosis’ similar to the way that block grants are divided among regions based on population counts. With the exception of the GH in the region Zealand, located in Vordingborg, the GH offices are located within the four largest cities of Denmark; Copenhagen, Aarhus, Odense and Aalborg (see Figure 5.3). The GH manager of Northern Jutland reports concern that locating the GHs in major cities may distort an equal availability and access to services as enterprises nearer the larger cities are assessed to be more liable to seek the services of GHs than enterprises further away. On a national level, he warns that this may potentially skew enterprises’ access to services, especially for enterprises located in the west coast areas of Jutland and the islands.

49
Of the five GHs, only Northern Jutland targets growth enterprises in lagging regions. This is, however, a new initiative of 2012, hence, there is presently no evaluation of the success rate of this activity.
Figure 5.3 The location of each Growth House (Væksthus) in Denmark
1. The five colours indicate the five different regions. Starting on the right, going clockwise is the Capital Region, Region Zealand, Southern Denmark, Central Jutland and Northern Jutland.
Source: based on notes from the Danish Business Authority
Beneficiary (client) enterprises
Target enterprises
The GH programme targets ‘new and small businesses with growth ambitions and growth potential’ (Ministry of Economic and Business Affairs 2011a: 2), independent of age, sector, business ownership, and market orientation etc. A ‘growth start-up’ has in a Danish context been defined as ’a business that is maximum five years old and through the first two years employs minimum five employees. In the following three years its average increase in growth and employment will be minimum 20 percent’ (Danish Business Authority 2011a). This definition differs from the OECD definition of Gazelles that is used in international comparisons and is a term for enterprises that within the first two years employ at least ten employees (Danish Business Authority 2011a). Thus, growth start-ups and Gazelles are not the same.
The age of client enterprises vary significantly across regions. Recent statistics show that the Capital Region has the youngest client enterprises with almost 60% being a maximum of five years old or younger and almost 20% being from 2011. In comparison almost 70% of enterprises in Southern Denmark were founded prior to 2007, hence, only around 30% are five years old or younger and the GH manager informs that the average age is about 17 years (Danish Business Authority 2012a). GH managers report that prior to the crisis enterprises tended to be younger. The manager of Southern Denmark explains that she perceives this is in part due to the need for many enterprises ‘to reinvent themselves’ during the crisis that they have

50
to e.g. look to new markets; in other words, several enterprises have returned to forge a different strategy for growth.
Companies from all industries are supported by the GHs. Across all GHs almost 30% of the client enterprises supported in the first two quarters of 2012 were in industry, raw material extraction, and utility services; 20% in trade and transport; 20% in business services; 12% in information and communication, 5% in building and civil engineering works; 2% in culture; 2 % in public administration, education and health; and 1% in real estate and rentals. There are some variations across the regions, e.g. the Capital Region has the largest percentage of enterprises within the business of information and communication, whereas Southern Denmark has the highest activity within business services and transport (Danish Business Authority 2012a: 10).
Table 5.3 shows the average turnover in USD and average employment of enterprises supported by the GHs in the first two quarters of 2012. With regard to employment, these figures are at present only available for 82% of the firms. The figures show that many of those enterprises approaching the GHs and receive support are micro-enterprises both in terms of turnover and employment.
Table 5.3 Turnover and Employment at GH Entry
Turnover In USD
<90.000 91.000-173.000
174.000-860.000
870.000-1.720.000
1.730.000-3.450.000
>3.460.000
Percentage of firms
45% 10% 27% 10% 4% 4%
Number of employees
1-9 10-19 20-49 50-99 >100
Percentage of firms
50% 15% 13% 3% 1%
Source: based on figures from the Danish Business Authority
Enterprise selection
The high growth enterprise selection process is based on the assessed potential to increase job creation, turnover, export and finally enterprises’ high growth ambition. More specifically, programme advisors assess whether the individual enterprise, over a period of one year, will be able to increase employment with at least 10%, its turnover at least 15% and its export with at least 10% in comparison to control groups of similar characteristics (Ministry of Economic and Business Affairs 2011). Whenever possible, this is achieved through an evaluation of the enterprise’s past metrics of business performance in addition to the programme advisors’ professional assessment. Frequently, as with start-ups and younger enterprises, there are no past metrics of performance on which to base estimations, hence the selections of these enterprises are based on the programme advisors’ professional experience.
Subsequently to the first screening, client enterprises meet with a programme advisor. If special service needs are detected during the screening process, the enterprises are, when possible, matched with a programme advisor that holds expertise within the particular field in question.

51
Range of services
Business diagnosis
Enterprises with high growth potential are subjected to a business diagnosis based on which a tailored growth plan is developed and signposting to intermediaries are performed. To aid the business diagnosis, the Growth Wheel is used see Figure 5.4 (www.vaeksthjulet.dk). The Growth Wheel was designed to identify and visually clarify both growth potentials as well as barriers to growth while aiming to set an agenda and timetable for actions. The main idea of the Growth Wheel is ‘to do’ rather than ‘plan to do’ specific activities to achieve growth. In this way, it counters the mainstream consolidation of the appraised usefulness of a formal business plan. The Growth Wheel focuses on four different areas estimated to represent the major challenges to growth namely the business concept, the organization, customer relations and operations.
Figure 5.4 The Growth Wheel
Source: www.vaeksthjulet.dk
According to GH managers, the Growth Wheel is used regularly to assist programme advisors in performing the initial business diagnosis and to further develop a growth plan, which is considered critical for an enterprise’s success. Programme advisors’ frequently find that the owner’s perception of an enterprise’s greatest challenges and opportunities does not correspond with the advisor’s assessment. The Growth Wheel helps illustrate this misconception. The advisors are therefore well content with using the Growth Wheel to help owners define new strategies for growth.
Other commonly used tools and processes include e.g. Transformation Maps, the Business Model Canvas, and SWOT Analysis, GH managers emphasize that the choice of tools is based on the individual programme advisor’s personal and professional experience.

52
Support services
The GHs are the hubs and operators of services as illustrated in Figure 5.1. Programme advisors refer enterprises to what is assessed the most appropriate business service based on the business diagnosis and the growth plan. In this process, programme advisors do not offer advice to generate a particular type of innovation such as technological innovation. Instead, enterprises are guided towards the service, which will help achieve the necessary growth.
Up to 20% of the client enterprises can be referred to in-house programmes. Some of these programmes are funded and implemented within the region – e.g. Southern Denmark offers a programme targeting cleantech companies as there is a big cluster of cleantech companies in this part of Denmark and they all face common challenges. Additionally, all GHs collaborate on some projects. These projects are initiated when all GHs experience certain demands to support growth more comprehensible. One area e.g. within which GH managers report of a diminished focus is in relation to upgrading human resources; whether managerial skills of the entrepreneur or the technical skills of the workforce or staff in general. Therefore, all five GHs commenced recently a joint initiative called Growth via Leadership (Vækst via Ledelse), which has been launched to place a renewed focus on the link between competent leadership and successful organizations (see www.vvl.dk).
Delivery arrangements
The CR requests that at least 80% of high-growth enterprises are referred to public or private intermediaries and that 70% of these 80% are referrals to private intermediaries such as business development service providers, consulting agencies, etc. In 2011, the GHs referred between 83 - 97,7% of client enterprises to intermediaries. 71,6 - 92,2% of these were private (Danish Business Authority 2012b: 1).
At Rådgiverbørsen.dk, an Internet site where private service providers may create a business profile for enterprises to choose from, enterprises can choose among 2.537 private service providers. The site also offers the opportunity for enterprises to make tenders for services for which service providers can make a bid. There is no selection process as to who can, and cannot, create a business profile at Rådgiverbørsen and GH advisors cannot point to any specific consult.
In order to grow, enterprises need finance. Indeed, the most commonly requested service, GH managers report, concerns advice on, and access to, finance. Despite bank packages to stimulate the Danish economy in the aftermath of the economic crisis, SMEs still have limited access to loan capital compared to pre-crisis years (Økonomi- og Erhvervsministeriet 2011b). Enterprises can draw on a plethora of initiatives in the public infrastructure for finance; still, the central national actor in the financial market is Vækstfonden. Vækstfonden is a state investment fund that provides venture capital, loans and guaranties in collaboration with private partners and Danish financial institutions to start-ups and SMEs (www.vf.dk). In 2010 Vækstfonden co-invested 260,8 million USD in Danish enterprises, many with international outreach (Vækstfonden 2010). Programme advisers also aim to match enterprises with Business Angels or other investors.
Measurement and evaluation system and proven impact
Measurement & Evaluation system
The policy formulation of the CR is the foundation of the evaluation system of the GHs. The formulation of the contract has been modified and reformulated throughout the years to take account for the learning process involved in initiating regional business support systems. Based on the objectives in the CR, the GHs are evaluated by the Danish Business Authority annually. These evaluations draw on data

53
from Statistics Denmark as well as data from the GHs’ customer relationship management (CRM) system. Programme advisors register all enterprise referrals in the CRM system and provide basic information. Statistics Denmark, combines data from the tax registration with data on number of employees, turnover, and rate of export, etc. With regard to the evaluation on increase in job creation, turnover and export, enterprises are compared to control groups. The control group is drawn as to control for region, size and industry. It includes all “active” enterprises with fewer than 250 employees and sales below a threshold, which varies by sector.
Data on client satisfaction is collected differently. Here the client mail address is sent automatically to an independent private enterprise commissioned to seek clients views on the Growth Houses and on any private consultants to which they were referred. The independent private enterprise uses the Net Promoter Score for measuring client referral willingness.
The evaluation system is unique in that GH managers can consult updated statistics of the performance of their GH on the measures provided by the CR at any time. Yet, a challenge with the CRM system used in evaluations is that enterprises diagnosed in December 2011 will be evaluated on progressive growth in 2012, in other words, at a time where the implementation of the diagnosis is unlikely to have had an effect. Viewed from the perspective of the GHs that strive for measurable success, this potentially skews the results of the evaluation unfavourably.
Furthermore, every three years, a more inclusive evaluation of the GHs is made. The last was undertaken in 2009, whilst the 2012 version is under way and will be completed by the end of the year. Finally, some regions conduct additional monitoring and evaluation using impartial regional private businesses evaluations of programme outputs.
Proven impact
The evaluation of 2011 shows that the GHs perform either satisfactory or near satisfactory in relation to most stated objectives for 2011 as presented in Table 5.3. Due to changes within the Danish tax registration system of enterprises’ value added tax (VAT), it has not been possible to draw data on enterprises’ increase in turnover and export in the 2011 evaluation from Statistics Denmark. Data on these objectives as presented in Table 5.4 includes new measures from the first two quarters of 2012; while data on control groups is yet missing for 2012. Furthermore, two of the objectives for 2011 were not transferred to the CR of 2012. Firstly, in 2011, GHs were expected to develop a minimum of three new initiatives in relation to GHs’ unified way of functioning and providing services; initiatives that were intended to increase the effect of the offerings and decrease the costs involved. In relation to this, GHs were expected to perform a nationwide process of competence development for local business service centres. Even though two initiatives were fully developed and a third was only partially developed (Danish Business Authority 2012b). Secondly, it was an objective that a growth culture was to be strengthened through a 10% increase in numbers of press releases and knowledge of the GHs, the latter measured by number of homepage users and enterprises’ knowledge of the GH. This goal was reached (Danish Business Authority 2012b).

54
Table 5.4 Evaluation of Growth Houses in 2011
# Objective Goal Result Comments 1 Business
diagnosis 2.650 enterprises are business diagnosed
2807 business diagnosis; 6% (157) above the goal
Between 79,9 and 82,2% of enterprises were new; i.e. not client enterprises in 2010
2 Enterprise referrals 80% of enterprises are referred to public or private offerings and that 70% of the 80% are referrals to private service providers
Between 83 and 97,2% of enterprises were referred to public or private offerings. Between 69,8 and 90,2% were referred to private service providers
The measure is on enterprises registered the user evaluation in the CRM system. It is programme advisor that register enterprises in the CRM
3* Recommendation of GHs by others
At least 70% of enterprises will recommend the GH to others
The Net Promoter Score on enterprises’ willingness to recommend the GH range from 48,1 to 63,1.
*This is a Net Promoter Score from the first two quarters of the 2012 evaluation
4 User satisfaction with GHs
At least 80% of enterprises are satisfied or very satisfied with the GH
Between 85,8-92,4% of entrepreneurs or enterprises are satisfied or very satisfied with the service. On average 90,1%
This is a slight decrease from the evaluation of 2010
5 User satisfaction with intermediaries
At least 80% of enterprises are satisfied or very satisfied with the intermediary they are referred to by the GH
Between 92,2 and 97,8% are satisfied or very satisfied with the intermediaries. On average 95%.
The measure is based on enterprises registered in the user evaluation in 2011
6 Intermediaries degree of satisfaction with the GHs
At least 80% of collaborating partners or service providers are satisfied or very satisfied with the collaboration
Between 71,4 and 91,9% of collaborating partners or service providers are satisfied or very satisfied with the collaboration. On average 85%.
The measure is based on three separate questionnaires sent, by DBA, to local business centres, collaborating partners and service providers
7 Impact on employment
Growth in employment is at least 10% higher than in other enterprises in the region
The difference among client enterprises and control groups are between -0,92 and 4,94%; the average difference is 3,31%.
The measure is based on enterprises registered in the user evaluation in 2010
8 Impact on turnover Growth in turnover is at least 15% higher than in other enterprises in the region
Growth in turnover of enterprises diagnosed in 2009 is in 2010: 6% and 2010-2011: 8,8% on average.42
Evaluation of the first two quarters of 2012
9 Impact on export Growth in export is at least 10% higher than in other enterprises in the region
Growth in export of enterprises diagnosed in 2009 is in 2010: 14% and 2010-2011: 4,7% on average.43
Evaluation of the first two quarters of 2012
Source: Danish Business Authority 2012a&b
42 The last figure available with control group is from 2010 and shows a difference in growth in turnover by
4% (Danish Enterprise and Construction Authority 2011b). 43 The last figure available with control group is from 2010 and shows a difference in growth in export by
6,8% (Danish Enterprise and Construction Authority 2011b).

55
Strengths
The design of the GH programme largely follows recent recommendations on how to design high-growth support systems which, as opposed to prior recommendations, point to the inclusion of companies of all ages, industry foci and location, as growth is possible everywhere (Lilischkis 2011). Additionally, the national strategic framework of the GHs appears to be flexible in a way that leaves room for regions to dynamically forge their own specific policies in accordance with their specific regional context. This is rewarded by success as all available measures on the objectives within the CR indicate that (i) the GH enterprises grow faster than control group enterprises, and (ii) client enterprises as well as intermediaries are satisfied with the services provided by the GHs.
Within the last five years, the GHs have established themselves as hubs in a growth ecosystem that are linked to and knowledgeable about numerous private enterprises and public institutions and can therefore guide business owners and start-ups to the support needed. Furthermore, the continuous use of intermediaries strengthens all enterprises and institutions involved permanently and allows for an effective resource allocation. However, it is more than merely logistics and market design: The GHs support a growth culture in Denmark, push ambitions of company owners, and through the creation of action plans, they help enterprises overcome initial barriers to get “out of the building”, thus, fostering an outgoing, network-focused and entrepreneurial business community. In the past, in certain industries such as the furniture industry, there has been a tradition for not collaborating or a tendency to stick to neighbouring export markets (Neergaard 1999). The GH initiative may help alleviate these problems.
The GHs have highly educated programme advisors, generally with several years of experience from private companies either as business owners or employees. This appears valuable with regard to creating the necessary respect when interacting with enterprise owners. The face-to-face interaction between the programme advisor and the enterprise owner is a major asset of the GH setup as explained by GH managers. In this interaction, ‘the moment of truth’ concerns changing the perceptions and mindset of the owners (GH manager, Central Jutland) as a key to an enterprise’s success (GH manager, Region Zealand) and largely dependent on the managers experience. Moreover, the selection of enterprises to be offered the GHs services is largely based on the professional experience of the programme advisors, as start-ups for instance do not have a history, based on which a track record for growth can be estimated. In these situations, the programme advisor’s long standing experience with high growth enterprises is used as a guide in the on-going identification processes of selecting high growth enterprises. In addition to their experience, the growth wheel has been perceived as valuable for the execution of business diagnosis due to its action-focus. It is considered a central tool in the Danish high-growth support system.
Weaknesses
First and foremost, based on the limited data available, it should be noted that the assisted growth companies do not reach their targets with regard to growth in turnover, export and employment as stipulated in the CR (see table 5.3). It therefore needs to be discussed if this is due to 1) the chosen measurement system used to evaluate growth based on one year data, 2) the fact that the GHs are in their start-up and thus in a learning phase and/or 3) the influence of the financial crisis. Due to the above, no definite conclusion can be made about why enterprises do not reach the growth target as expected. We must therefore conclude that there is much potential for improvement with regard to data types and sources as well as data analysis techniques. Especially, the lack of qualitative data in evaluations of GHs; i.e. missing data on the experience of client enterprises throughout the growth process, as well as programme advisors and their interaction, does not unleash the full potential of an evaluation that could otherwise be used more effectively to improve GH strategies. Furthermore, with regards to evaluation, it is questionable why the GHs are evaluated on client enterprises’ satisfaction with their interaction with intermediaries (see Table 5.4; Objective Nr. 5), as GHs do not have any influence on which intermediaries client enterprises

56
choose and no pre-selection or recommendation is allowed. This does not imply that the measure is unimportant but it could be questioned if indeed the CR is the right platform for this objective. In addition, the GHs only receive evaluations on intermediaries on an aggregate level, which complicates the legitimization of strategic changes based on the data provided. As there are no public screenings or evaluation of private intermediaries other than online user evaluations, which are rarely filled out by client enterprises, the GHs can only learn through informal talks with their client companies. This may represent both a time consuming task for both parties and one, which cannot be generalized.
As previously mentioned, the GHs are established as hubs in a wider support ecosystem for enterprises in Denmark. However, viewed through the lens of the client enterprise the complexity with regard to the number of services offered and intermediaries is high. On the homepage ‘start-growth’ (Startvækst.dk) alone, there are 220 different public services available, aiming to create growth in enterprises; new and established. ‘Service offers include advice and finance; for instance subsidies and loans, networks and partnerships’ (startvaekst.dk/forside/0/2). Additionally, there are 2,537 private consultants to choose from at the website Rådgiverbørsen. The sheer number of these offerings complicates an overview of the different services enterprises can draw on and diminish the transparency within the general system of offerings divided across national, regional and local service levels. In light of the challenge of experienced complexity by the client enterprise, Central Jutland is implementing new strategies in the fall of 2012 aiming to simplify the client enterprises’ experience of meeting the public palette of services available to them. The manager of Central Jutland emphasizes the importance of being critical and selective in relation to which information is communicated to client enterprises.
As described before the GHs stand on a two-pronged national strategy as both united and divided. It is accentuated in the CR that the GHs are to safeguard their shared identity through various measures including public relations, marketing initiatives and branding material with shared design work (Ministry of Business and Growth 2012). It is a concern, however, by some GH managers that the GHs are becoming progressively more divided than united. This strength of the GHs may therefore become a weakness as the GH brand may suffer from any dissociation among the GHs as may possibly the frequency of knowledge sharing in addition to motivational factors based on a sense of belonging and sharing mutual goals.
Lastly, the lack of follow-up activities with client enterprises is a weakness of the current design of the GH. To achieve the goal of the CR all GHs together need to consult minimum 2,650 companies per annum, leaving little time for follow-up activities. Companies are allowed to return but may not be pro-actively encouraged to do so; denying challenges that are naturally following any initiated growth. GHs are also not allowed to register enterprises if they come back within three years after their first consultation making resource allocation towards new clients more attractive and necessary. This approach is especially questionable in the light of prior research, which has shown that ‘the short-term effects of high-growth start-ups with regard to job creation are indisputable’ (Gjerløv-Juel and Guenther 2012: 39). However, they also argue that to actively pursue such short-term economic gains of high-growth start-ups is to risk the consequences of initial high growth in terms of higher tendency to eventually lose these jobs once again. Using the Danish Integrated Database for Labour Market Research they found ‘that former gazelles are not able to sustain their head start in terms of performance in the long run’ as ‘gazelles are often outperformed by initially slower growing competitors, as high initial growth negatively affects a enterprise’s long-term survival’ (Gjerløv-Juel and Guenther 2012: 1). Note, however, that Gjerløv-Juel and Guenther are talking about Gazelles and not start-up growth enterprises, cf the earlier definitions.
57
Recommendations
Derived from the description and analysis of the GHs provided in the above, recommendations are put forward for further reflection and consideration as regards processes, strategies and evaluations of the GHs. The themes of recommendations cover: market failure versus system failure, absence of qualitative data, transparency and visual designs, follow-up activities, the milestone plan and the CRM system.
Market failure versus system failure
GH managers report infrequent enterprise referrals to knowledge institutions. This is an expected outcome given the CR policy objective that 80% of enterprises are to be referred to intermediaries and that 70% of these referrals are to be private service providers. This objective in the high growth support system might, however, cause system failure; that is ‘a lack of interaction between enterprises and knowledge institutes, leading to a suboptimal exploitation of new scientific knowledge’ (Bosma and Stam 2012: 7). In other words, the motivation to eliminate a market failure, by means of increasing interaction among enterprises and private service providers, can in turn generate a different system failure. Policy recommendations, aiming to increase uses of private service providers, should therefore be approached with caution, to ensure that they do not discourage knowledge sharing and learning processes potentially exploited through interaction with knowledge institutions.
Absence of qualitative data
The present evaluation system successfully measures the objectives of the CR, yet a limitation is represented by its lack of process knowledge at the level of the programme advisors and at enterprise level as well as of the interaction between the two. An in-depth qualitative process analysis of the overall activities, both during and after consultations, can potentially advance the GHs’ performance as a business support system in several ways providing more in-depth knowledge about factors of success, effective counselling, knowledge sharing, enterprise behaviour, individual or organizational dominant logic, as well as collaboration with municipalities and strategizing.
Factors of success
A qualitative analysis can advance understanding and explanation of how and why business diagnoses’ and growth plans determine and link up with enterprise practices that may result in increases in growth. In other words; what essentially affects client enterprises’ increase in growth as compared to the control groups? This is important to reproduce constructive practices that positively effectuate high growth.
Effective counselling
Pinpointing particular constructive sub-processes within the general counselling process is important to counselling development initiatives. Moreover, knowledge of how particular types of advice and counselling may prove to be, for instance, industry specific, age specific, business life-cycle specific and so forth, are examples of information that is critical to enhance the competence development process of programme advisors.
Knowledge sharing
Qualitative knowledge; including knowledge of success factors and effective counselling in a situational and regional context, is important to improve the quality of intra- and inter-regional knowledge sharing at the level of programme advisors to encourage knowledge exchange based on each others’ success’ and failures.

58
Enterprise behaviour
Analysis at this level can provide valuable knowledge of enterprise behaviour in relation to referrals of intermediaries; in other words, basic knowledge of the practices enterprises undertake, or do not undertake, when referred to intermediaries are needed. Questions arise such as: what are the challenges enterprises encounter in relation to contacting or choosing not to contact external intermediaries; what characterizes the process when the contact is made and are enterprises that have made the first contact to intermediaries more prone to buy professional assistance in the future and so forth. On the one hand, these insights are useful for improving counselling sessions; on the other hand, they also connect to the recommendation of initiating formal follow-up activities as discussed below; or more specifically, they inquire into how follow-up strategies are best planned for and implemented.
Individual or organisational dominant logic
The dominant logic (mindset) may be a barrier for high growth in enterprises where owners or groups of organizational members are mentally set on implementing specific strategies that are unsuitable for unleashing the enterprises’ full growth potential. Consequently, the dominant logic may also be a barrier for receiving programme advisor’ advice, because the communication of new strategies and their reception can be complicated if they oppose existing perceptions of best practice. GH managers emphasize that a change in the mindset of the owner is commonly required to set a high growth strategic course for the enterprise; a qualitative analysis can inform what happens in the intersection between programme advisors and owners when opinions of strategies differ, and further how owners subsequently work with the advice given. Again, this is important information when aiming to work pre-emptively with potential pitfalls in relation to enterprises’ degree of the implementation of the advice provided. Moreover, information on programme managers’ and owners’ experience on these matters can be considered to be integrated into programmes such as Vækst via Ledelse (Growth through Leadership) to educate managers on the opportunities that exist in viewing strategies as dynamic in relation to environmental circumstances, turbulence and so forth, as opposed to working with pre-set strategies.
Collaboration with municipalities
A qualitative process analysis can further provide a more precise picture of the functions and services of the GH and of programme advisors specifically and finally of how functions are integrated among actors intra-organizationally in the specific GH. This is significant in relation to the objective of the CR that emphasizes the criticality of local collaboration and strives to integrate the business service system between GHs and local municipalities through policy formulation (see Økonomi- og Erhvervsministeriet 2011a).
Strategising:
An in-depth qualitative analysis can aspire and optimize the generation of more effective and efficient strategy work, enhance strategic management and finally improve counselling processes to progress and sustain enterprises’ high growth. Qualitative measures may be formally included in the objectives of the RC, as analyses have shown that the CR ‘overrules’ other strategies in status (Danish Business and Construction Authority 2009), yet a fuller analysis will by necessity of scope be a separate measure and report.
Transparency and visual designs
As mentioned throughout this report the complexity with regard to the number of services offered and intermediaries is very high. This is not a new issue: Transparency has been addressed in general by policy work undertaken by the Danish Business Authority through for instance the ‘no wrong door’ slogan and it
59
has previously been part of the CR objectives and Central Jutland is further implementing specific strategies to diminish complexities in the system and increase transparency. However, creating transparency within a programme that counts hundreds of offerings is difficult, and visual aids need to be considered to assist homepage viewers and users, existing and future client enterprises in establishing an overview of activities and offerings at the GHs. Similar to the way organizational charts can aid the overview of extensively complex organizational infrastructures, visual designs can illustrate the different offerings and how they are integrated and organized within the greater support system. ‘Design thinking’ is suggested as an aid to help enterprises navigate through the great number of service offerings; create an overview of offerings and further follow the path searched for and to dissect away paths that have no interest.
Enterprise follow-up activities
Some regions perform follow-up activities to identify to which degree enterprises perform according to the business diagnosis and the initial growth plan and to assess whether the enterprise requires further assistance to realize strategies for growth and growth in general. However, follow-up activities are not formally included as part of the GHs responsibilities. In fact, the CR can be viewed as a discouraging incentive system with regard to GHs responsibility for implementing follow-up activities. Presently, GHs are rewarded status, and previously economic resources, based on their degree of achievement; i.e. reaching the objectives of the CR. Since one of the objectives in the CR is the annual performance of a pre-set number of business diagnoses, and because returning enterprises are not counted in the statistics of business diagnosis until three years after their first encounter, GHs are, with regard to the CR, discouraged to undertake follow-up activities. In light of prior research and Danish statistics on high growth start-ups’ inability to maintain growth and increase in employment, there is reason to consider if follow-up activities should be formalized and further included in the objectives of the CR. On the one hand, the benefits of follow-up activities are to be exploited more systematically; on the other hand, and perhaps more importantly, policy changes, including that of the CR, are to encourage and to create incentives for GHs to strategize and implement follow-up activities.
A milestone plan
One way to exploit follow-up activities more systematically as well as formalize and encourage these activities is to consider what GH managers have called a ‘mile-stone-plan’. Incorporating the milestone plan within the GH strategy involves setting up incentives for enterprises’ achievement in the design of the support process. Accordingly, enterprises that have implemented advice and reached the goals set in the growth plan at prior consultations are rewarded supplementary consultations and potentially suggested additional referrals for assistance with new challenges given they are at another growth stage. Integrating the milestone plan in the CR; hence formulating objectives based on this approach, is a way to warrant and promote the consolidation of growth in both upcoming and established high-growth enterprises.
Mentoring network
Furthermore, these follow-up activities could also serve another goal indirectly. Through building up stronger ties with the client enterprises, the GH should be able to encourage managers to be part of a mentoring network. A mentoring network could work subsequently to the GH system and strengthen the entrepreneurial culture and community. Additionally, managers could e.g. act formally and informally in other enterprises’ advisory boards in the beginning of growth phases to integrate learning and support mechanism.

60
The CRM system
The CRM system provides essential measures in relation to CR evaluations, yet, according to GH managers, it suffers low popularity by its user; the programme advisors. The resistance of the CRM system by several programme advisors has arisen, explains GH manager of Northern Jutland, because it is perceived as a control mechanism implemented to monitor programme advisors’ work achievements and because advisors assess the system deficient. Improving the CRM system is to be considered in combination with launching a simultaneous strategic reframing of the system, emphasizing the value of it as a tool for, for example, following the trajectories of growth enterprises as opposed to using it as a monitoring devise. Additionally, it could build a platform to collect the more qualitative data mentioned above and thus support process learning.
Conclusions
Following the vision and ambition that Denmark is, in 2020, one of the entrepreneurial societies in the world where most growth enterprises are launched, the GHs have provided support to more than 14.000 potential high-growth companies between 2007 and 2012. The GHs received 95.93 million USD in funding in this first six years and were transferred successfully from national to municipal level. Corresponding to national policy objectives, the five GHs have managed to advance as inter-connected, yet independent, entities, while implementing objectives in a dissimilar fashion to take account of regional diversity and context in general.
The GHs have showed immense achievements with regard to several objectives in the CR; documenting the majority of client enterprises’ and intermediaries’ satisfaction with the GHs and their services and offerings over the years. In the future, the GHs are to retain their balance between following national as well as local goals and interests to support Denmark’s vision as an entrepreneurial society. Turning more vigorously towards the sustainability of growth enterprises, instead of emphasizing the initiation of growth enterprises, will allow for a lasting impact of support, since it recognizes, and takes into consideration, the different challenges associated with various phases of growth. A future step to take might be the creation of a GH alumni mentoring network; fostering relations among the growth ambitious companies and leaders in Denmark. This would add a missing element in the growth ecosystem that could enable networking, learning and co-operations i.e. successful growth managers could act as non-executive board members for growth newcomers. Furthermore, as some growth companies launch at the stock market (IPO) or are sold, the opportunity to expand the existing business angel networks and/or build up organically the lacking venture capital scene in Denmark may arise. Within the greater policy environment, and in cooperation with the GHs, frameworks to support this development will need to be built.

61
References
Bosma, N. and E. Stam (2012). Local Policies for High-Employment Growth Enterprises, Report prepared for the OECD/DBA International Workshop on “High-growth firms: local policies and local determinants”, March 2012.
Danish Business Authority (2012a). Væksthus-statistik 2. kvartal 2012.
Danish Business Authority (2012b). Notat: Opgørelse af Væksthusenes resultater for 2011.
Danish Enterprise and Construction Agency (2009). Evaluering af Væksthusene og dertil knyttede initiativer.
Danish Enterprise and Construction Authority (2010). 2010 Entrepreneruship Index: Entrepreneurship conditions in Denmark.
Danish Enterprise and Construction Authority (2011a). Iværksætterindeks 2011: Vilkår for iværksættere i Danmark.
Danish Enterprise and Construction Authority (2011b). Notat: Opgørelse af Væksthusenes resultater for 2010.
Gjerløv-Juel, P. and C. Guenther (2012). Heroes today – but what about tomorrow? Gazelles and their long-term performance. Preliminary Draft.
Ministry of Business and Growth (2012). Aftale mellem KL og Erhvervs- og Vækstministeriet of væksthusene I 2013.
Lilischkis, S. (2011). Policies in support of high-growth innovative SMEs; INNO-Grips Policy Brief No. 2.
The Government (2006). Fremgang, fornyelse og tryghed. Strategi for Danmark i den globale økonomi.
Ministry of Economic and Business Affairs (2011a). Aftale mellem KL og Økonomi- og Erhvervsministeriet om Væksthusene i 2012.
Ministry of Economic and Business Affairs (2011b). Redegørelse om udviklingen i kreditmulighederne i Danmark, 1. halvår 2010.
Neergaard, H (1999) Networks as vehicles of internationalization. PhD Thesis. Aarhus School of Business.
OECD (2007). OECD Framework for the Evaluation of SME and Entrepreneurship Policies and Programmes, Paris
Vækstfonden (2010). Årsrapport 2010.
Wren C. and D. Storey (2002). Evaluating the effect of soft business support upon small firm performance. Oxford University Press.

62
ANNEX 5.A1.
INTERVIEWS WITH GH MANAGERS
Table 5.A1 Overview of interviews with the five GH managers in September 2012
Interview Region Manager Date of interview Length of interview
1 Southern Denmark Liselotte Stockholm 11. September 2012 1h 42min.
2 Central Denmark Erik Krarup 12. September 2012 2h 50min.
3 Capital Region Marlene Haugaard 13. September 2012 2h
4 Zealand Mads Kragh 13. September 2012 1 h 46 min.
5 Northern Jutland Flemming Larsen 18. September 2012 2h 20 min.
• All five interviews were recorded in their entirety.
• Managers of the GH Southern Denmark, Central Jutland and the Capital Region were interviewed on site. The manager of the GH Zealand was interviewed in the GH Capital Region and the manager of Northern Jutland was interviewed at Aarhus University, Aarhus.
• Four of the five interviews were conducted in English. As concerns the fifth interview, questions were posed in English and translated when necessary to assist the respondents understanding of the questions. The manager responded in Danish.
• The Standardized Assessment Framework provided by the OECD was followed as an interview guide.

63
ANNEX 5.A2.
TRANSFERABILITY
• Enhancing growth is perceived as a desirable goal for all societies and therefore entrepreneurship and growth policies are continuously developed in almost all developed countries. The approach chosen in Denmark is based on current research findings and was mainly inspired by one-stop-shop examples from the UK.
• The GHs were designed to support the achievement of certain goals articulated in the Globalization Strategy. If transferring the GH concept to another setting this needs to be kept in mind.
• Consideration when transferring the presented GH approach to any other social system have to be given to the type of welfare state, existing policy work that it inevitable will connect to, as well as social, cultural and environmental factors regarding growth firms.
• It needs to be emphasized once more that the GH programme is not a stand-alone initiative but is embedded in a wider entrepreneurial support context. It can only be successful when national and local systems are designed together.
• The Danish framework leaves room for regional adaptation although Denmark is small in comparison with most other countries; such flexibility is cornerstone when transferring the concept into any other social context.
• The availability of client enterprises and control group data through the companies CVR number is unique to Denmark and other Scandinavian countries; thus the measurement system is not easily transferrable.
• The Growth Wheel as a tool for business diagnosis is transferable and is not context specific.
• Other countries or regions may increase learning from analyzing the progress that the GHs have made through the last six years. The continuous development of goals as well as the continuous design of new programmes and the triggers for change might be the most important sources for cross-country learning.

64
CHAPTER 6. SCOTLAND’S COMPANIES OF SCALE PROGRAMME
Introduction
Scotland’s business base, like those of many other European countries, is dominated by micro businesses. Only a small proportion of Scotland’s businesses employ more than ten employees44 and there are few indigenously-owned, larger-scale companies. Indeed, Scotland, in common with the rest of the UK economy, has struggled to grow small businesses into larger businesses of “scale” that can be major contributors to economic growth through their role as large scale employers, large scale exporters, generators of supply chains for other local companies and incubators for new spin-offs (CBI, 2011).
Where previously inward investment had been the main focus of public policy, a recognition of the importance of having a significant presence of large, domestic owned firms emerged as a strong theme within Scottish economic policy during the early 2000s (Brown and Mason, 2012). At this time an influential report was published which found that Scotland had only 12 firms with a turnover between GBP 250 million and GBP 1billion, 5 per cent of the total number in the UK (Royal Bank of Scotland, 2004). This research also found that the less than 50% of the top 100 firms in Scotland were Scottish-owned, and these were mainly concentrated in four sectors: banking, oil and gas, electricity and transport. The study concluded that a strong medium-sized corporate base provides important links within an economy “as a supplier to larger firms and a customer for smaller firms” (Royal Bank of Scotland, 2004, p.6).
As a consequence of this study, there were renewed efforts to increase the number of larger businesses in Scotland. To address the perceived lack of larger scale businesses in Scotland, in 2004 a team from Scottish Enterprise (SE), the main economic development agency for Scotland45, established the pilot “Companies of Scale” (CofS) programme. The pilot began in 2005 with seven companies and has since grown and achieved considerable success, delivering significant economic impact and recognition as an innovative business support programme. Today, the CofS programme is designed to support high growth businesses in their ambitions to grow to become larger, internationalised businesses.
The programme provides bespoke, specialist support, targeted at companies whose current turnover exceeds GBP 10 million and who have ambitions to become GBP 100 million plus businesses. To be eligible for participation, companies must demonstrate considerable growth ambition. The main focus of the programme is to provide an intensive form of “account management”46 support, which provides a strategic challenge to the firm’s top management team to help the business upscale and achieve further rapid growth.
44 There are approximately 20 000 businesses in Scotland employing more than ten employees, out of a wider
business base of 300 000. 45 Excluding the Highlands and Islands, which are covered by Highlands and Islands Enterprise 46 Scottish Enterprise operates an “account management” programme, where 2,000 high performing Scottish
firms have a dedicated “account manager”. The Companies of Scale programme operates a similar system of intensive account management.

65
Rationale
SMEs dominate the Scottish economy. At present there are 339 105 SMEs (0 – 249 employees) in Scotland which represent 99.3%of all enterprises and account for 54.5% of all employment (Scottish Government, 2012). While SMEs are numerically dominant, larger firms account for the majority of turnover and employment in Scotland. As of March 2012, there were only 2 250 large businesses employing more than 250 employees. Large businesses account for 45% of employment and 62.3 per cent of turnover in Scotland (Scottish Government, 2012). In other words, less than one percent of Scottish businesses employ more than 250 employees.
Despite being few in number, larger scale businesses are clearly very important for the economy. Indeed, recent research by the Confederation of British Industry highlights that mid-sized businesses (defined as those with GBP 10 million to GDP 100 million) are typically more important in terms of aggregate employment in more peripheral parts of the UK economy than they are in southern regions. In Scotland, for example, mid-sized businesses account for 18.6% of all employment but only 14.3% in the East of England.
Recent analysis reveals that Scotland presently performs quite well in terms of the number of its businesses which meet the OECD high growth threshold (Mason and Brown, 2012) (see Figure 1). A HGFs is defined by the OECD as “an enterprise with average annualised growth (in number of employees or turnover) greater than 20% per annum, over a three year period, with a minimum of 10 employees at the beginning of the growth period” (OECD, 2008, p. 61). Scotland’s high growth firms (henceforth HGFs) should therefore provide a strong conduit for generating larger scale businesses. However, many of these rapidly growing SMEs have yet to make the transition into larger scale businesses. The precise reasons for a lack of companies of scale in Scotland remains unclear, but it could partly owe to a lack of management ambition to become globalised businesses coupled with the tendency for some high growth companies to become acquired before they make the transition to a larger scale internationalised company (Mason and Brown, 2011).
Figure 1. High growth firms (by turnover growth) in the UK Regions 2007 - 2010 (as a proportion of
all firms with 10+ Employees)
WM - West Midlands SW - South West WA - Wales EM - East Midlands YH - Yorkshire & Humber NE - North East NI - Northern Ireland NW - North West EN - Eastern SE - South East SC - Scotland GL - Greater London UK - United Kingdom
Source: ONS Business Structure Database
0%
2%
4%
6%
8%
10%
12%
14%
16%
18%
20%
WM SW WA EM YH NE NI NW EN SE SC GL UK
HGFs
as %
of A
ll Firm
s 10+
Empl
oyee
s

66
This lack of businesses of scale has a direct impact on the Scottish economy, for example; preventing
important local supply chain development, This also deprives other growing businesses of role models to encourage scaled growth. With these issues in mind, the primary rationale for the CofS programme providing wider positive externalities for the Scottish economy.
Objectives
The primary objective of the CofS programme is to support high growth Scottish firms to become large companies of scale and to remain firmly embedded in Scotland, At present, Scottish Enterprise operates a process of ‘account management’ through which around 2000 Scottish firms are appointed a dedicated account manager to support their growth plans through a range of support services. This enables SE to understand each company’s growth opportunities and challenges and to support them to implement and accelerate these growth opportunities. Examples include support for strategy and leadership development and financial support for capital expansion, innovation and training.
The CofS programme was specifically designed to provide bespoke forms of account management support for firms who have already grown rapidly. Therefore, the programme is designed to work with a small number of successful businesses to help accelerate their existing growth performance through transitional growth “triggers” (see Figure 2). These growth triggers could include ownership changes (e.g. management buy outs), new product development or the entry into a new market. A specific aim of the CofS programme is to help grow these businesses into larger companies of scale to a turnover of GBP 100 million plus. As such, a common feature of CofS’s support is to help grow these businesses internationally.
Figure 2. The growth “trigger point” process
The objectives of the CofS programme have evolved over time. When it was first established in 2005, it was a pilot programme and seven companies were recruited to test this new approach. The review confirmed that significant economic impact had been achieved and CofS was expanded and additional companies were recruited.
In terms of the nature of the programme’s key objectives, it is important to emphasise that the main principle underlying the programme is to provide a deeper relational form of support to participating companies rather than to provide transactional forms of assistance common in support programmes

67
delivered by economic development agencies (e.g. grants or loans). Moreover, the programme is specifically designed to target support around three key themes: Leadership, Strategy and Structure.
A key feature of the programme is its strong focus on providing a strategic challenge to the leadership of the participating firms. Indeed, a considerable part of the initial contact with the firm centres on assessing the leadership capabilities of the top management team. Plus, a core component of the CofS support tools focuses on leadership development and executive education. In tandem with this the CofS approach provides a critique of a firm’s strategic direction. Here the main objective is to ensure that the strategic direction is sufficiently well developed and robust in order to meet their growth objectives. In line with this is the related objective of assessing the structure of the business. This involves assessing whether the firm has an operational configuration which is capable of accommodating growth. A key aspect of this is assessing the nature of organisational development needs required by the company, specifically whether functions in the organisational can be scaled.
Geographical scope
The CofS programme is a Scottish Enterprise programme, providing support to firms with a significant Scottish presence and footprint. It is only eligible for companies operating within the area covered by Scottish Enterprise which represents approximately 90% of the Scottish population. It excludes companies located in the Highlands and Islands who are serviced by Highlands and Islands Enterprise (HIE). Companies operating in Scotland are eligible, provided that they meet the selection criteria detailed in the next section. No preference (or spatial targeting) is given to firms from any particular sub-national spatial location in Scotland.
Beneficiary firms
Illustrating the focused nature of the programme, there are only 16 companies on the CofS programme at present. They represent a mixture of industries and sectors, highlighting the inclusive nature of the programme. Whilst the programme is open to all businesses, local and foreign-owned, the majority of participating firms are indigenous businesses.
Target firms
The CofS programme is targeted at firms with a significant Scottish presence and footprint. In order to participate on the CofS programme, potential participants must fulfil a set of eligibility criteria regarding their current size and future growth ambitions. In terms of the former, only firms whose current turnover exceeds GBP 10 million and who have ambitions to become GBP 100 million plus businesses are eligible. Regarding the latter, eligibility is also restricted to firms that are currently experiencing high levels of growth. Firms must expect to be growing at around 50% over the next three years: ambitions are just as important, if not more so, than a track record of growth. Owing to the fact that projected growth is a pre-requisite under this selection procedure, targeting and selection obviously involves an element of subjective assessment on behalf of the programme’s management. Indeed, a key aspect of identifying suitable firms for participation is to undertake a rigorous (and mostly qualitative) process of identifying the kind of “growth-oriented” companies who can most benefit from the programme.
In terms of the nature of the beneficiary firms, there are no specific industrial or sectoral criteria for determining potential inclusion on the CofS programme. To date, participating firms have come from a variety of industry sectors. During the pilot phase of the programme, the average turnover of the participating companies was GBP 77 million (Alan Brazewell Economics, 2007). At present, the majority of the participants are technology-based businesses, particularly software companies. There are also a large number of energy-related firms on the programme, reflecting Scotland’s growing Oil & Gas sector.

68
Highlighting dither diverse nature of CofS, examples of supported firms include traditional companies such as Grahams Family Dairy who provide milk and dairy-based products to UK supermarket outlets; Black Circles, who are a web-based tyre replacement businesses; and niche-based organisations such as Vets Now, the UK’s innovative leading provider of “out of hours” veterinary care (see Figure 3). The programme also has a number of more conventional technology-related participants, for example, the Amor Group, a technology solutions provider to businesses in the energy, transport and public service sectors.
Figure 3. Companies of Scale: Example Company “Vets Now”
Firm selection
As noted above, there are a number of eligibility criteria that firms must meet for inclusion on the programme. Measures against which prospective firms are evaluated include:
• A demonstrated commitment to retain a significant presence in Scotland;
• Current turnover in excess of GBP 10 million;
• A demonstrated ambition to grow rapidly;
• The capability to achieve turnover growth of at least 50% within the three years47;
• Evidence that the company will shortly navigate key growth “triggers” or transformational points and will therefore have specific challenges requiring assistance;
• Articulated vision to grow turnover to GBP 100 million plus; and
• Demonstrated willingness from senior management to fully engage with the programme.
The combination of past performance and future growth ambitions are key criteria used by Scottish
Enterprise for assessing the suitability of companies to take part in the programme. There are obviously potential limitations in using historical performance as guide to future growth potential, and a large part of the CofS selection process involves a qualitative and subjective assessment by CofS staff (based on their 47 This is marginally below the high growth definition used by the OECD (at least 20% growth p.a. for three
consecutive years) but is still nevertheless an extremely high growth target. The OECD definition was used during the CofS pilot phase, but has since been revised given the current economic climate.
“Vets Now” was founded seven years ago to address a gap in the market for providing an alternative to the ‘on call’ service which vets are required to provide. Vets Now was built on the model that it would take away the ‘Out of Hours’ work that vets undertook by putting teams of dedicated Emergency and Critical Care professionals to provide the equivalent of an A&E service for pets. In the space of seven years, Vets Now has opened 34 emergency clinics across the UK, with over 400 Member Practices subscribing to the service. Treating over 65 000 small animal emergencies every year, Vets Now has not only changed the work structure of the veterinary profession, becoming the first national company to employ Veterinary Surgeons and Veterinary Nurses who work purely in ‘Out of Hours’ emergency practice, it has also created a specialist sector of the profession, raising the standard of pet and client care and creating loyalty from both pet owners and the veterinary profession. Through acquisition, Vets Now is currently the UK’s only multi-site animal-care operator and is expanding revenue streams by offering other B2B services, in addition to targeting the pet owners within their B2C strategy.

69
own extensive business experience) of the likelihood that the firm will be able to achieve their growth targets. Another subjective assessment is that firms are chosen on the basis of their willingness to engage in the programme and to closely interact with other companies on the programme.
Range of services
The CofS programme is unlike normal business development programmes as it is not a “fixed” offering which has a universal package of support tools for all of the programme’s participants. A rather unique element of the programme is that the participating firms work intensively with Scottish Enterprise to help identify the specific and bespoke types of support which are needed to achieve growth. Therefore the CofS offering is highly flexible and adaptive to the needs of participating companies.
The core elements of the programme are outlined below.
Business diagnosis
Before embarking on the CofS programme, each participating firm is required to undergo a comprehensive strategic review conducted by CofS staff. This review covers all aspects of the firm and its performance, with a focus on company leadership, firm strategy and organisational structure. This is a central element of the programme as it allows the firm to identify their growth constraints and what is required to overcome these constraints. Helping firms to recognise the nature of these capacity or resources constraints is a fundamental part of the CofS process..
Building on insights gleaned during this review, the contents of the programme are then specifically designed for the individual company. Recent research has highlighted the critical role of catalysts or “trigger points” for instigating a period of rapid firm growth (Brown and Mawson, forthcoming), so the special attention is paid to any current or future triggers that could affect the company’s growth and development. These triggers can be endogenous to the firm, exogenous or “co-determined” - examples of these are outlined below in Table 1. This list is by no means exhaustive, but rather indicative of the breadth and variety of different types of growth trigger points.
Table 1. Classification of growth trigger points
Endogenous Exogenous Co-Determined New product/service offering Technological development Entry into a joint venture Change in company ownership (e.g. MBO, MBI, employee-share ownership etc.)
Government regulatory issues Acquisition by another firm
Acquisition of another firm Macroeconomic changes Major new capital investment Change in management or Board personnel
Changes to public policy Adoption (or adaptation) of new business models
Development of a new production process
Access to public sector assistance (e.g. R&D or capital expenditure grants)
Injection of risk capital or new bank funding
Implementation of new management systems
Product failure in the marketplace
Receipt of a major contract or obtaining a new customer
Source: Brown and Mawson (forthcoming)
CofS support is sensitive to the unique capabilities and needs of firms as they move through the scaling process. As firms get increasingly larger, their capabilities and needs change (e.g. moving from

70
securing funding as a main concern to prioritising and requiring structural realignment), requiring programme inputs to be flexible and sensitive to any such changes. Ultimately, as a result of assistance through the CofS programme, participating companies should become mature scaled organisations.
Figure 4. Stages of company scaling
Mature scaling
Turnover GBP 60 million+
Early scaling
GBP 5-10 million turnover
Realising scale
GBP 10-60 million turnover
• strategy not fixed• organic growth• entrepreneurial management• informal communications
• scaleable strategy• OD needs recognised• potential acquisition interests• funding requirements
• global organisation• addressing OD needs• larger acquisitions• global partnerships• complex structure
Whilst the stages of company scaling model depicted looks quite straightforward, often there are a number of issues which cut across the three scaling stages. For example, often the challenges of becoming a global organisation and sometimes non-organic growth arise earlier than the model suggests. Indeed, recent research suggests that in order to sustain a period of rapid growth, many HGFs become “buy globals” early in the life-span. This seems especially the case for technology-based firms in Scotland (Mason and Brown, 2012).
Support services
The CofS programme’s strength lies in its flexibility and capability to provide highly bespoke assistance designed specifically for each of the individual participants in the programme. Previous research conducted on high growth firms in Scotland has helped shape some of the support within the programme (Mason and Brown, 2010), including a decreased emphasis on R&D and innovation support and more support for holistic business development and growth. This business support falls into three main areas: leadership, strategy and structure.
Business Leadership
CofS specialists work with companies to determine the capabilities of their leadership teams, for example by identifying and developing future leaders through succession planning, and providing bespoke interventions to facilitate leadership development, including targeted continued professional development and executive coaching. This support is particularly important for companies in the early growth stages as they move from relatively entrepreneurial management teams towards a more formalised management and leadership structure. Examples of bespoke support include:
71
• Executive coaching delivery to CEOs;
• Developing the capabilities of the broader leadership team, through access to world leading learning opportunities, networking and company visits;
• Contributing to Advisory Panels and observing at Board Meetings;
• Working with HR departments on succession planning to identify and develop emerging leaders;
• Highly customised and targeted Executive Education focusing on Resonant Leadership/360 degree assessments/Emotional Intelligence;
• Business Parallel benchmarking to harness a leadership vision on the stages required to seize a global market position and for rapid transfer of bespoke learning from experienced business leaders in other sectors; and
• Strengthening Boards to drive growth e.g. introduction of potential new non executive members.
Business Strategy
Strategy development is an important focus of the CofS programme. The CofS team first gain a deep understanding of a company’s business model and then try to determine whether the company’s vision and values are aligned with step-change growth potential and ambitions. From here, the programme can provide companies with specialist assistance, drawing on a network of skilled and experienced staff within SE. Some examples of the specialist support include courses on Accelerating Sales, Customer Service Excellence, Appreciative Enquiry, Strategy, Innovation by Design or Structuring for Growth.
Assistance covers a wide range of support, including change management, strategic advice, product development and innovation, sales management and marketing support, business internationalisation and merger/acquisition guidance. Examples of bespoke support include:
• Developing and accelerating growth strategies, supported by internationally recognised business schools (e.g. supported by faculty from IMD, Case Western Reserve University);
• Strategic sales development supported by world-class universities (e.g. supported by faculty from Harvard Business School);
• Forming collaborations between companies of scale to secure new business opportunities;
• Informal group sessions focused on customer centricity, public sector procurement and collaboration in delivering software solutions; and
• Supporting and facilitating the creation and implementation of complex multi-geography international growth strategies.
Business Structure
The CofS programme also works with businesses to develop a strong and scaleable structure. After reviewing a company’s functional strategies and structural change needs, the CofS team helps the firm to recognise the importance of economies of scale and to build scalable structures for transformational growth. This can involve support to improve efficiencies, improve and manage quality and delivery, streamline procurement and sourcing, as well as development of supply chains. Examples of bespoke support include:

72
• Supporting strategic graduate development via the Saltire Foundation48;
• Supporting tailored in-company specialist Academies to grow key commercial and technical skills (e.g. leadership or project management);
• Driving HR strategic reviews or using specialist non-executive advisers to re-work organisation structures which will enable growth; and
• Developing expert solutions to overcome scaling challenges such as faster new product development, logistics challenges and relationship management strategies.
Whilst direct support services fall into the three thematic areas discussed above (leadership, strategy
and structure), a significant part of the CofS programme remit is to facilitate relationship building between successful companies operating in Scotland. Evidence demonstrates that entrepreneurs in high growth firms benefit hugely from the advice they receive from other successful entrepreneurs and this is something policy makers can facilitate, relatively inexpensively, through activities such as peer-based networking initiatives (Fischer and Rueber, 2003). The CofS programme therefore actively facilitates peer-to-peer networking between CofS companies and other high growth businesses in Scotland, through events (e.g. “CEO Forums” and the “CofS Conference”), personal contacts and participation in the GlobalScot49 programme. Illustrating the value that companies obtain from these activities, this kind of peer-based networking continues even once a firm leaves the CofS programme (without any participation from policy makers such as Scottish Enterprise).
Figure 5. Companies of Scale: Example Company “Hydrasun”
Delivery arrangements
The CofS programme is wholly operated and managed by Scottish Enterprise. At present there is a small team of three people in Scottish Enterprise who work on the CofS programme. However, the 48 The Saltire Foundation supports the development of Scotland’s next generation of business leaders, offering
scholarships and fellowships for people to experience working in Scotland’s high performing businesses. 49 The GlobalScot programme seeks to develop and expand Scotland's standing in the global business
community by utilising the talents of leading Scots, and of people with an affinity for Scotland, to establish a worldwide network of individuals who are outstanding in their field. Scottish companies can freely draw on this network for advice, contacts, assistance and support.
Founded in 1976 by two entrepreneurs, Hydrasun is an Aberdeen-based supplier of fluid transfer, power and subsea control systems to the energy industry. In 2002 the original entrepreneurs were bought out via a management buy-in, which was to prove to be an important growth trigger for Hydrasun. Following a period of rapid growth, in 2008 Hydrasun entered the Companies of Scale programme with a focus on restructuring the organisation (and its business model) for growth, particularly to exploit higher-value opportunities in the sub-sea oil and gas industry. Hydrasun adopted an export-led model, looking to overseas markets (e.g. Azerbaijan, Kazakhstan and Brazil) for growth, following their customers (many of which are large multi-national corporations) into new growth markets. From its beginning as a traditional supplier of valves to the oil and gas industry, Hydrasun has moved up the value chain and now provides customers around the world with bespoke sub-sea systems, including umbilical assemblies. This new emphasis has been a major source of growth for the company and has allowed turnover to increase by 250% over the last seven years.

73
programme draws on the wide range of resources within Scottish Enterprise for support across a broad range of thematic areas such as support for innovation, internationalisation and organisational development. The programme’s core staff all have strong and extensive business experience and work very closely with participating companies, often attending company board meetings and other meetings of a strategic nature. Whilst most support is designed and delivered “in house”, some of the services delivered to companies are undertaken by external providers, procured by the companies and supported financially by CofS. This delivery set up allows for timely and cost effective use of existing SE resources and capabilities, whilst ensuring that companies can access specialist support that SE does not have in-house. Often these external services are provided to a group of companies participating on the programme.
The programme operates in conjunction with Scottish Enterprise’s Account Management programme, a programme of indepth support to around 2000 companies in Scotland that have significant growth potential50, whereby CofS companies are selected for specialist support from the account management portfolio (see Figure 6). It should be noted that while the programme draws a number of the participants from this source this does not preclude non-account managed businesses from taking part in the programme. Most companies then transition through the CofS programme, ultimately returning back into the account management portfolio (after approximately 18-36 months on the CofS programme) or remaining CofS alumnae. Therefore, the programme operates as part of a wider business support eco-system.
50 http://www.scottish-enterprise.com/start-your-business/high-growth-start-up/account-managed-
companies.aspx

74
Figure 6. Companies of Scale pipeline
Strengths
There are a number of strengths that can be identified:
Relational and Flexible Nature
First, a very important aspect of the CofS programme is the relational and flexible nature of the programme. As mentioned previously, the programme is not a “fixed” offering. On the contrary, the essence of the programme is predicated on the in-depth relationship which forms between the participating firms and their CofS account manager. The real strength of the CofS programme lies in the wide range of products and services it is capable of delivering and the fact that these are specifically customised towards the needs of the participating companies. It is also worth noting that this customisation process occurs at two different levels: 1) the level of the firm and 2) at the level of the group (e.g. learning, interaction and alumni). Often the growth bottlenecks and organisational issues affecting rapidly growing companies are very specific to the particular firm. Therefore, participants on the programme are able to help shape the nature of their support in an interactive and experiential way. This degree of flexibility is unlike traditional forms of business development and the CofS participants very much appreciate the ability to “tailor” their
Scottish Enterprise c. 20,000
companies working with SE
c. 2,000 companies in the account
management portfolio
Growth within Account Management portfolio
Further continuous growth with appropriate SE service
Engagement with CofS alumni companies
16 – 20 companies in CofS portfolio, focusing on achieving transformational growth and adding significant value to the Scottish economy
CofS team and account managers aiming to identify potential companies of scale. Characteristics may include: -Rapid growth in turnover -Turnover over GBP 10 million -Ambition to scale rapidly towards GBP 100 million+ -Need for intensive support
Regular reviews to assess impact of support: -Current turnover -Rate of turnover growth -Confidence in achieving growth targets
Continuing engagement with CofS alumni companies and key contacts via networking events and other communications
Companies continue to grow and add value to Scottish economy Case by case review to determine appropriate service level
Transition point Transition based on defined eligibility criteria
Significant growth
Transformational growth
Transition point

75
support under the programme. Very high quality management development programmes operated by Harvard and other leading business schools are specifically customised for the participating companies. This ensures that no areas of support are excluded under the programme. For example, many HGFs often wish to grow through acquisition (Acs et al., 2008). Clearly, this kind of approach to growth requires a different type of support than firms who grow organically and a number of companies on the programme have received assistance in relation to identification of potential acquisition targets.
Time Sensitive
Second, another of the key attributes of the programme is the temporal nature of the assistance. As we discussed earlier, the programme tends to focus on companies that are undergoing key growth triggers. These triggers are often related to a change of ownership, the introduction of a new product or service, entry into a new market or new governmental legislation. During these turbulent periods firms are often very vulnerable to the problems of leadership overload and “organisational overstretch” (Brown and Mawson, forthcoming). The CofS programme aims to work companies to help them ease these growth bottlenecks. The time sensitive “rapid-response” nature of this support is therefore a key ingredient underpinning the programme’s success. Once firms successfully navigate these destabilising growth period(s) they are often able to resume growing the business without the close level of support offered under the programme.
Peer-based
Third, as others have noted, a key feature of the type of business support which is deemed most desirable for HGFs is a high degree of interaction with other entrepreneurial “peers” (Fischer and Rueber, 2003). Highly ambitious entrepreneurial companies often benefit greatly from advice from other like-minded entrepreneurs. In some respects this is a central facet of the CofS programme which sets it apart from other business support programmes in Scotland. The nature of peer-based interaction has two elements. First, the programme aims to bring participants together to share experiences and learn from one another (e.g. “CEO Forums”). This sometimes involves participating on management development programmes and executive education courses with other CofS companies and can also include social events such as an annual dinner featuring speakers from some of Scotland’s most successful companies. Secondly, as well as structured opportunities for “peer-based” learning, the programme also encourages contact between the participating companies in a more ad hoc fashion. Sometimes this involves connecting CofS companies with HGFs and entrepreneurs outside of the programme.
Holistic
Finally, it is worth highlighting that one of the most important elements of the programme is the holistic nature of the support. Rather than focusing on one particular thematic aspect of the business (which most business support programmes do), the programme undoubtedly benefits from taking a very wide ranging approach which encompasses a “big picture” mentality towards business growth. Most of the participating companies need soft forms of strategic assistance not grant monies. The ability to offer holistic support which encompasses lots of time but few hard resources is undoubtedly one of the programme’s main strengths.
Linked to the holistic nature of the support is that being on the CofS programme enables participants to access other services offered by Scottish Enterprise. One of the key aspects of the programme is how it links in with other forms of assistance which is provided by Scottish Enterprise. The ability to move firms from the system of account management towards more intensive forms of support in the CofS scheme is critically important. This ‘escalator approach’ towards business development assistance is one of the main

76
benefits of having a structured and segmented approach towards supporting companies with different growth requirements
Weaknesses
Very few public policy interventions are without limitations. Whilst the CofS programme has been viewed very favourably by participating companies, there are certain aspects of the programme which potentially reduce its overall effectiveness. These limitations have a number of different dimensions and relate to three key areas: programme size and progression.
Programme Size
It must be acknowledged that CofS constitutes a very small element of the business support framework within Scotland. Indeed, the programme has a FTE staff of 3 people (plus part-time administrative support) and at any given time there are only around 15-20 companies involved on the programme. Although having a small number of companies on the programme enables a high level of customisation for participants, it does mean that only a very small stock of companies receive support under the programme. The small scale of the programme clearly means that, whilst very beneficial for the firms involved, the overall impact of the programme on the Scottish economy is limited (although the impacts to the individual companies can be substantial). It should be noted, however, that the potential number of Scottish companies with the level of growth ambition necessary for involvement in the programme would restrict any significant expansion.
Identifying Suitable Companies
At present, the bulk of the participating companies are identified and referred through the Scottish Enterprise system of account management, as mentioned previously. Because the CofS programme draws on this pool of companies, it may overlook very good growth-oriented companies based in Scotland that would benefit from CofS support. It is therefore important that all potential high growth companies are identified for entry into this kind of sophisticated form of business support.
Monitoring & Evaluation system and proven impact
Since the CofS programme’s inception in 2005, twenty three companies have been supported. This has resulted in an increase in total sales from GBP 907 million to GBP 1,444 million and increasing the number of Companies of Scale (companies with annual sales of more than GBP 100 million) by four, with currently two further companies approaching this threshold (circa GBP 90 million). The CofS programme places great emphasis on continuous improvement and thus has a monitoring and evaluation framework in place. This framework includes a number of key metrics to determine the success of the programme (and of CofS companies) including (i) company rate of turnover growth (average of 26%), (ii) confidence of management team and SE support in achieving growth ambition, (iii) total number of Companies of Scale in Scotland and (iv) and gross value added (GVA) (approx. GBP 132 million)51.
The pilot phase of the programme was evaluated in 2007 which provided some very tentative aggregate performance information (Alan Brazewell Economics, 2007). This initial evaluation concluded that benefits from the programme were varied but too early to be definitive. At the time of the evaluation there were only 9 companies on the programme, however the evaluation concluded that the initial results were promising. The work discovered that that overall project spend was approximately GBP 38 000 per company and found that the companies involved had benefitted to the value of GBP 59 000 per company.
51 GVA is used by SE as a measure to assess the impact of SE intervention on the Scottish economy.

77
Overall, the pilot therefore can be “judged to be a success, as far as the evidence so far indicates” (Alan Brazewell Economics 2007, p.23).
Measuring benefits of support
At present many of the types of support companies receive through the programme involve management and strategy development. Whilst this can reap significant benefits for the companies, it can be difficult to directly measure the impacts of this type of support on the business, not least because impacts arising may only manifest over the long term. Plus, if companies cannot see tangible benefits from the intervention in the short term, they may not commit sufficient internal resources in order to maximise a sufficient return from their investment of management time. Therefore, it is important that the monitoring and evaluation system utilised under the programme is sufficiently nuanced to capture the longer-term benefits from the programme.
To date there has not yet been an economic impact evaluation of the programme, however a formative learning review has just been completed on the programme in 2011. Some of the findings from the most recent review are highlighted below and have already been used to modify the nature of the programme.
Participant’s Impression of Programme
Overall, the vast majority of the feedback from the participating companies was very positive about the CofS programme. All the firms that took part in this review exercise were very positive about the nature of the programme and the support they had received. Many of the companies mentioned that participation on the programme requires a high level of commitment on the company’s behalf, although this commitment is worth it for the perceived value the firms obtain from the programme. During the interviews with the participating companies a number of common issues were raised.
Reasons for Involvement
The majority of the CofS firms were existing account managed firms. Many were made aware about the programme by their account manager, who referred them to the CofS team for potential inclusion in the programme. Only a minority of firms actively sought entry into the programme. While some companies openly admit that they joined with a view to attracting grant monies, the vast majority viewed the programme as a strategic way of challenging their current business models and strategies. Quite a number of the firms were keen that programme entry criteria remain high, so that only dynamic, growth-oriented firms are admitted. The quality of other firms on the programme is a key incentive for participation on the programme.
Importance of strategic challenge
Involvement in of the CofS programme was thought to help inform the strategic thinking within the organisations involved. In fact one of the most important aspects of the programme which was highlighted by the companies involved was the fact that it brings a strategic challenge. This kind of strategic challenge or “trusted advisor” role seems an essential component and one which offers very valuable learning for participating companies. To get to a position to act as a critical friend a very close and trust-based relationship must be established.
Importance of the CofS Account Manager
Linked to the issue above was the instrumental role played by the CofS account managers in the programme. Nearly every firm interviewed mentioned the importance of the account manager relationship as one of the primary benefits of the programme with the strategic input that the CofS account manager
78
provides. Quite often businesses welcomed the ability of someone external to the business to assess the firm’s strategy with a “fresh pair of eyes”. Owing to the close relationships developed between the account manager and the participating firms, the businesses felt like they could really develop a strong trusting relationship. This is particularly important given the importance of disclosure of important strategic decisions and also admitting to weaknesses within existing organisational structures. Many companies mentioned they would like to get their respective account managers even more deeply integrated within their businesses. One suggested the idea of the account manager being seconded to the firm for the duration of a project and another wanted their account manager to visit their overseas operations to get a better insight into how that operates.
Importance of Leadership Development
One of the key elements of the CofS programme is assistance with leadership and organisational development. Firms have received a variety of different types of support such as involvement in learning journeys, attendance at leadership training courses and individual 360 degree leadership reviews. The majority of companies interviewed were very positive about this type of assistance. Many found the work on emotional intelligence to be very important and the individual learning journeys that had been undertaken were also very well received. The only criticism was that some of the training by university personnel was too “academic” and not sufficiently grounded in practice: a number of businesses mentioned that it was difficult getting members of their staff to “buy-in” to these types of initiatives.
Bespoke Nature of the Service
A number of the companies appreciated the bespoke nature of the CofS programme and many felt that the types of assistance they require is not available through conventional sources of grant funding. Although involvement in the programme sometimes leads to access to other support packages from Scottish Enterprise, the companies appreciate that the dedicated types of support are the most effective for obtaining “buy-in” from senior staff within their organisations. Plus, some companies like more intensive interaction with SE than others, therefore a bespoke approach allows the individual companies to have a service tailored to their own requirements. They also feel that the bespoke and targeted nature of the programme enables them to interact with other “like-minded” growth companies.
Recommendations
Following our review process, there are a number of areas of the CofS programme which merit discussion.
First, given the small scale of the programme, there may be an argument for expansion beyond its current size. In order to upscale, more resources would have to be made available. While this is unlikely given the fiscal constraints facing public organisations such as Scottish Enterprise, the tangible benefits of the programme make this a worthwhile long-term objective. In tandem with this, there may also be an argument for increasing the portfolio of companies on the programme, but offering more intensive interactions with a fewer number of participants experiencing key growth triggers. Under this arrangement, the programme would keep a close “watching brief” on some companies while interacting intensively with a similar total to the current population of 17 participants. Another option to increase the size of the programme would be to widen the eligibility criteria so that smaller companies who aspire to grow to at least £50m turnover within three years could be included. Some estimate that this could enable the programme to be expanded to double the current numbers of participants (Alan Brazewell Economics, 2007).

79
Second, at present most companies spend between 18 months to 36 months on the programme. There may be a case for increasing the levels of churn for those participating on the programme. Potentially, if the time period for involvement on the programme is reduced, more companies could receive assistance. While difficult to implement, increasing the levels of churn on the programme would have to be done in close conjunction with the traditional forms of account management offered by Scottish Enterprise, so that the transition process is managed effectively.
Third, another aspect of the programme which could potentially be modified concerns the peer-based nature of the programme. At present, the programme provides a number of planned and ad hoc peer-based interactions. An example of this was one firm receiving guidance on their projected entry into the Chinese market for medical devices. However, there may be opportunities for the programme to bring experienced entrepreneurs (not involved in the programme but who have grown a sizeable business) to provide strategic critique or challenge of a company’s current growth plans. Whilst difficult to organise, this could potentially strongly augment the intensive forms of assistance received from the CofS programme. Similarly, there may be scope to provide more internal “case reviews”, whereby a working-group of staff within Scottish Enterprise periodically assess the effectiveness and integration of the assistance a firm receives.
Fourth, the small scale of the programme means that novel forms of evaluation can be implemented to assess the performance of companies on the programme. One such novel technique would be to contrast the growth performance of the participating companies with a “control group” of similar non-assisted firms. Whilst determining the specific attribution of the programme will always be difficult to do, this method would at least allow the growth performance of the companies to be benchmarked against non-assisted companies.
Conclusions
This paper has provided an in-depth overview and assessment of the Companies of Scale programme in Scotland. Since the programme’s inception in the mid-2000s, it has grown considerably and has evolved substantively. From a small scale pilot programme in 2005 involving five companies, the programme is now a permanent feature within the business support infrastructure offered by Scottish Enterprise. In total, it has assisted 23 companies. The programme has a number of unique elements which differentiates it from many other public policies designed to support HGFs, which typically focus on thematic areas such as support for innovation and access to finance (see OECD, 2010). Some observers have been critical of these thematic types of support policies and have called for more bespoke solutions, such as those offered by the CofS programme (Mason and Brown, 2011).
The novelty of the CofS programme hinges on five main areas:
• First, the programme is specifically targeted at highly “growth-oriented” companies who have already achieved significant levels of growth and who aim to upscale into larger scale corporate entities. The testing eligibility criteria (e.g. past and projected growth levels) means that the programme is not appropriate for most Scottish firms.
• Second, the main focus of the programme revolves around the development of a strategic relationship between participating firms and the CofS team. In other words, the main thrust of the programme is relational rather than transactional. Within this context, firms receive time-intensive support of a strategic nature, rather than support of a more conventional nature such as grants, loans etc.

80
• Third, a key element of this approach is the desire to develop highly customised support to each of the participating companies. There is no one single “offering” within the programme and firms help shape the nature of the support they receive.
• Fourth, the key thematic nature of the support firms receive takes the form of leadership development and management development. Working with executives to fulfil their own potential as leaders helps firms become better equipped to deal with the onerous and multiple challenges of growing an international business.
• Finally, a key benefit for the participating companies is the ability to participate in peer-based activities with similarly ambitious Scottish companies. This is one of the most important aspects of the programme.
Having examined the programme closely, it appears that it has a number of key strengths. Without wishing to repeat these in depth, our analysis suggests that the main strengths of the programme revolve around its inherent flexibility. Not all growing companies are the same; therefore no single fixed programme can offer them the kind of support they require. The ability to customise support for each of the companies involved is undoubtedly the programme’s key strength. However, this aspect of the CofS programme is also a potential area of weakness. Due to its highly customised nature, only a relatively small number of companies can be supported under this kind of approach. Owing to this, the programme’s overall economic impact will always be limited by the small number of companies that can participate. It is also worth pointing out that in an economy with a weak overall entrepreneurial climate such as Scotland, the size of such a programme will also always be heavily circumscribed by the lack of suitable “growth ambitious” companies.

81
Annex: Transferability
The following assessment of the CofS programme in Scotland enables us to draw some potential lessons in terms of its transferability. To date, we are unaware of any direct attempts to transfer the programme to another geographical or institutional context. This probably owes to the fact that the programme is closely integrated into the wider operational context of Scottish Enterprise. In particular, the CofS programme is deeply embedded into the wider system of account management operated by Scottish Enterprise. Additionally, one of the programme’s key strengths is the ability to connect CofS participants to other parts of Scottish Enterprise for more specialist forms of support around innovation, internationalisation (export and in-country support) and capital expansion projects. Owing to these problematic issues, wholesale transferability of the programme probably is neither feasible nor desirable (see Figure 5 below).
Bearing this in mind, we do believe that there are certain core elements of the programme which could be adopted or customised to other contexts. For instance, we see no reason why certain core elements of the programme (such as targeting a small number of high growth businesses for intensive support to help them grow globally) cannot be replicated. Indeed, we believe that there are certain core components of the programme which could be transferred elsewhere (see Table 2 below). The elements which seem best equipped for policy transfer relate to the customised nature of the programme, which offers a close strategic relationship with a small number of beneficiaries. Whilst the in-depth requirements for assistance will vary from organisation to organisation, assistance with leadership and organisational development (often on a peer-based basis) are universal requirements which most high growth firms desire. Therefore, certain elements of the programme could be customised elsewhere.
Table 2. Elements of the CofS programme and degree of transferability
Elements of the Programme
Transferable Non-Transferable
Flexible structure Yes. Small number of growth-oriented participants
Yes.
Focus on strategic relationship building
Yes.
Account management support No. In order to identify relevant companies for the CofS programme, Scottish Enterprise draw on connections with a large pool of 2000 account managed businesses. Establishing such a programme from “scratch” would be potentially very time consuming and costly.
Time sensitive nature of support No. Unless an organisation has good connections with a wide pool of businesses, identifying suitable firms who are undergoing significant growth triggers may prove difficult. Establishing and

82
maintaining such connections requires considerable time and resource.
Thematic focus on leadership, organisational development and strategic challenge
Yes.
Peer-based elements of programme Yes. However, the appetite for peer-based learning may well be context specific. Companies in particular countries may not wish to divulge aspects of their businesses to other (potential) competitors.
Links to other products and services offered by Scottish Enterprise
No. This will depend on whether the programme is operated by a discrete body, or by a wider regional development agency with a comprehensive set of functional responsibilities.

83
References
Acs, Z. J., W. Parsons and S. Tracy (2008), High-Impact Firms: Gazelles Revisited, Office of Advocacy of
the US Small Business Administration (SBA), Washington, DC.
Alan Brazewell Economics (2007), Review of the Companies of Scale Pilot Programme, Scottish Enterprise, Glasgow, UK.
Brown, R. and C. Mason (2012), “The Evolution of Enterprise Policy in Scotland”, in R. Blackburn and M. Schaper (eds.), Government, SMEs and Entrepreneurship Development: Policy, Practice and Challenges, Gower Publishing, London.
Brown, R. and S. Mawson (Forthcoming), “Trigger Points and High Growth Firms: A Conceptualisation and Review of Public Policy Implications”, Journal of Small Business and Enterprise Development.
Fischer, E. and A. R. Reuber (2003), “Support for Rapid-Growth Firms: A Comparison of the Views of Founders, Government Policymakers, and Private Sector Resource Providers”, Journal of Small Business Management, Vol. 41, pp. 346-365.
Freel, M. (1998), “Policy, prediction and growth: Picking start-up winners?”, Journal of Small Business and Enterprise Development, Vol. 5, No. 1, pp. 19-32.
Mason, C. and R. Brown (2010), High Growth Firms in Scotland, Scottish Enterprise, Glasgow, UK. Download from http://www.scottish-enterprise.com/start-your-business/~/media/publications/About% 20Us/economic%20research/HighGrowthFirmsReportNovember2010.ashx
Mason, C. and R. Brown (2011), “Creating good public policy to support high growth firms”, Small Business Economics, published online before print.
Mason, C. and R. Brown (2012), Technology-Based Firms in Scotland, Scottish Enterprise, Glasgow, UK. Download from: http://www.scottish-enterprise.com/resources/reports/technology-based-firms-in-scotland.aspx
Mawson, S. (2012), Scotland’s high growth firms: What makes a top performing company?, Scottish Enterprise, Glasgow, UK.
McDougall, P., S. Shane and B. Oviatt (1994), “Explaining the formation of international new ventures: The limits of theories from international business research”, Journal of Business Venturing, Vol. 9, pp. 469-487.
OECD (2008), Measuring Entrepreneurship: A Digest of Indicators, OECD-Eurostat Entrepreneurship Indicators Program, OECD, Paris.
OECD (2010), High-growth enterprises: What governments can do to make a difference, OECD studies on SMEs and entrepreneurship, OECD, Paris.
Owen, G. (2004), “Where are all the Big Gorillas? High Technology Entrepreneurship and the Role of Public Policy”, London School of Economics, unpublished paper, Download from: http://cep.lse.ac.uk/seminarpapers/09-05-05-OWE.pdf
Royal Bank of Scotland (2004), Wealth Creation in Scotland: A Study of Scotland’s Top 100 Companies, Royal Bank of Scotland Group in association with Company Reporting Ltd, Edinburgh, UK.

84
Scottish Executive (2004), Smart Successful Scotland: Ambitions for the Enterprise Networks, Scottish Executive, Edinburgh, UK. Download from http://www.scotland.gov.uk/Resource/ Doc/158455/0042945.pdf
Scottish Government (2010), Scottish Corporate Sector Statistics 2010, Scottish Government, Edinburgh, UK. Download from: http://www.scotland.gov.uk/Resource/ Doc/982/0106216.pdf.
CBI http://www.cbi.org.uk/media/1125696/future_champions__finalb_.pdf

85
CHAPTER 7. THE NETHERLANDS’ GROWTH ACCELERATOR
Introduction
Legal context
The history of the Dutch Growth Accelerator Programme goes back to 2004 when a report titled “High Growth Firms and Innovation” was published, presenting results of a study assigned by the Dutch Ministry of Economic Affairs on legitimacy for policy for high growth firms in the Netherlands (Dutch Ministry of Economic Affairs, 2004). According to this report, high growth firms were (and still are) an interesting target group for the Ministry in fulfilling its mission to stimulate sustainable economic growth in the Netherlands due to their reputation concerning job creation and above average innovative performance. The report showed that the Netherlands was lagging behind compared to surrounding countries in Europe with regard to both the number of fast growing companies as well as the rate of their growth. To tackle this issue the Ministry developed additional policy to improve the Dutch position in terms of the quantity of high growth firms in relation to certain benchmark countries. Fundamental to this policy was removal of growth bottlenecks for entrepreneurs.
In 2006, the report “Entrepreneurship in the Netherlands, High growth enterprises; Running fast but still keeping control” (Dutch Ministry of Economic Affairs and EIM, 2006) revisited the policy focus on high growth firms. It explained that in the Action Plan for Entrepreneurs called “Entrepreneurship policy in the Netherlands”, the aim was not just to create more entrepreneurs, but also to improve the quality of entrepreneurship. According to the Ministry of Economic Affairs, many entrepreneurs in the Netherlands were still not fully exploiting the capacities of their businesses, often due to lack of preparation and insufficient knowledge. The action plan also stipulated fast-growing companies as an important target group for Dutch entrepreneurship policy, aiming to meet the average share of fast growing firms as a proportion of the business population in the benchmark countries (i.e. the US, UK, Denmark, Belgium and Germany) by 2010.
The report goes on to explain the role the Ministry of Economic Affairs was for itself in the area of entrepreneurship. The two main pillars to tackle bottlenecks encountered by entrepreneurs were realising an entrepreneurial culture as expressed through a positive attitude towards entrepreneurship, and improving the workings of the markets for labour, education and capital. Also, a great focus was put on cutting the number of superfluous and obstructive regulations and by reducing the administrative burden on business so that entrepreneurs could concentrate on entrepreneurship.
In addition to the general entrepreneurship policy, specific policy instruments for high growth enterprises were put in place since they encounter obstacles sooner, tend to find them even more insurmountable than “ordinary” businesses do, and run into hurdles particular to this kind of business. Four categories of instruments were put in place: Awareness; Supporting managerial capabilities;52 Improved public services through so-called ‘Enterprise Zones’; and Financing.
Despite stressing the importance of high growth companies for the Dutch economy and the recognition that the quality of public services to high growth companies needed to be improved (Dutch Ministry of Economic Affairs and EIM, 2006), it took some time before the Growth Accelerator
52 Port4Growth and De Baak Management Centre, two of the consortium partners running the Growth
Accelerator Programme, were involved in activities in the Awareness and Supporting managerial capabilities areas.

86
Programme was established. In 2009, a new perspective on entrepreneurship policy was introduced (Dutch Ministry of Economic Affairs and EIM, 2009) in which policies were not only put in place to contribute to economic growth, but also to help meet the challenges being faced by Dutch society. Increasing the number of fast-growing businesses was one of the Dutch entrepreneurship policy ambitions and key to this policy ambition was the establishment of the Growth Accelerator Programme:
Fast-growing businesses generate much of the productivity and employment growth in a country. This is bad news for the Netherlands, which has relatively few fast growing businesses at present. The government has responded to this need by developing a Growth Accelerator to stimulate companies with an annual turnover of between € 3 million and € 5 million to reach an annual turnover of € 20 million within five years. The aim is to reach this target through coaching and feedback, sharing information and knowledge, and developing the abilities of the managers or owners of the companies concerned. Companies are only allowed to join the programme if they show the ambition to achieve a turnover of € 20 million per year within 5 years.
The programme was introduced by the Ministry together with the Innovation Platform – a platform of representatives from Dutch the knowledge economy aiming to stimulate innovation en entrepreneurship in the Netherlands – in 2008 (Dutch Ministry of Economic Affairs and EIM, 2009). A national tender was released in 2008 and awarded to the High Growth Stars Consortium, a group of five parties including PwC (finance and organization), De Baak Management Centre (personal development), AKD (law), Philips Innovation Services (lean management) and Port4Growth (platform for fast growing companies). The first companies started participating in the programme in 2009 (Growth Accelerator, 2012a). The total budget for the five-year programme is five million Euros.53 This is matched by the contributions of the participating entrepreneurs.
Rationale
The idea behind supporting high growth companies via government policy in the Netherlands started from their significant contribution to innovation, employment and productivity, and thus a competitive nation (Dutch Ministry of Economic Affairs and EIM, 2006). By combining speed and excellence – quick acting by entrepreneurs in a turbulent and high-risk economic environment to exploit the best opportunities as soon as they arise – successful high-growth companies are seen as an indicator of the Dutch economy’s ability to adapt and modernise. Moreover, they often act as an example to other entrepreneurs and thus also help boost entrepreneurship as such Dutch Ministry of Economic Affairs and EIM, 2009).
Due to the fact that the Netherlands found itself lagging behind with regard to both the number of fast growing companies as well as the rate of their growth, a study investigating the obstacles to growth was commissioned. The study found that the following issues were both obstacles encountered specifically by high growth companies and factors underlying growth (Dutch Ministry of Economic Affairs, 2004):
• Staff: Trouble in finding qualified staff able to work in a quick changing work environment with shifting tasks and responsibilities;
53 The total annual Dutch entrepreneurship policy budget is not easy to determine since it is divided among
various ministries in addition tot the Ministry of EA&I and among various programmes. The annual budget for the Entrepreneurship and Innovation departments within the Ministry of EA&I alone for 2009 was two billion Euros. Thus, the Growth Accelerator Programme budget at an average of one million Euros per year is a very small part of the total Dutch entrepreneurship policy budget.

87
• Processes and systems: Difficulties in finding, installing and maintaining suitable processes and systems for client and knowledge management that meet the organisation’s continuously changing needs;
• Capital and subsidies: Problems with obtaining capital at reasonable conditions, and lack of awareness and understanding regarding subsidy opportunities and requirements;
• Management and Organisation: Lack of clarity with regards to role allocation in the organisation; not being able to delegate tasks to others in the organisation; lack of a clearly defined strategy; and a lacking adaptive capacity in a fast changing environment. An important point made here also is that the entrepreneur’s personality can have a significant impact on the success of the firm, as had been shown in previous studies (Dutch Ministry of Economic Affairs. 2000).
The study recommended that the government aim its policy for high growth businesses at tackling bottlenecks that:
• were much more often identified as main bottleneck by a large part of the fast growing companies than by non-fast growing companies;
• when mentioned as being overcome by fast growing companies were also identified as potentially stimulating growth;
• were not or hardly being addressed by current policy instruments;
• were not being tackled due to market imperfections.
Especially the ‘Management and Organisation’ bottleneck(s) were given a high priority and were thought to be best addressed by establishing networks of fast growers and coaches.
Objectives
The objectives of the Growth Accelerator Programme are twofold:
• To support and facilitate the growth of two hundred SMEs from a turnover of approximately two million Euros to a turnover of twenty million Euros in a period of five years;
• To ensure that each company has a Strategic Picture, a Growth Strategy and Growth Path, including milestones and a Personal Development Plan (these concepts are explained further on in the section on Support Services).
By achieving these objectives the idea is to ultimately lead to increased employment and internationalisation (Growth Accelerator, 2012b). The programme management considers these objectives to be feasible in the current socioeconomic context.
Geographical scope
The Growth Accelerator is a national programme and with that is open to SMEs from all sectors and all regions of the Netherlands. The majority of the participating companies come from the most developed regions in the western part of the Netherlands, such as Rotterdam, Amsterdam, Utrecht and Eindhoven. Although there is no explicit attempt to target high growth firms in lagging regions some firms from these regions such as Limburg, Zeeland and Groningen do participate.

88
Beneficiary (client) firms
Target firms
The Growth Accelerator programme is open to all companies running at a turnover of at least two million Euros with the ambition and the drive to grow significantly within 5 years (Growth Accelerator, 2012a). No specific sector or age bracket of the business population is targeted. The average firm participating in the programme is five to ten years old at the beginning of the programme, has fifteen employees, and operates at 3.6 million Euros turnover in a fast-growing sector such as IT, Services, High-tech industry, and Healthcare. It has a highly ambitious Director-Manager of approximately 40 years old on average who has full ownership of the company.
Since its founding, 130 firms have joined the programme. These companies can be categorised according to the top sectors as defined by the Dutch Ministry of Economic Affairs, Agriculture, and Innovation in the following way (including examples of the types of activities participants engage in):
• High Tech sector (IT, telecommunications, sensors): 25%;
• Creative industries (fashion, digital printing, online gifts, industrial design): 15%;
• Energy (electrical engineering, sustainable energy), Life Sciences and health (medical devices), and Logistics (transport safety, mobility): each 8%;
• Agri-food (food packaging, processing): 6%
• Chemicals (injection moulding, composites, plastics): 5%
• Horticulture: 3%
• Water: 1%
• Other (recruiting, realty, accounting): 20%

89
Box 7.1. shows an example of a supported company and explains how it has benefited from the programme.
Box 7.1 Contronics
Contronic’s mission is to "Develop and produce equipment which can make a positive contribution to: Keeping fresh food fresh; Living healthy and enjoying life; Sustainable environmental management." (Contronics, 2012) It makes a range of products for humidifying food kept in cold stores or refrigerated cabinets. Its main product creates a mist that covers vegetables and fruit, thereby ensuring vitamins and minerals stay in the produce and it doesn’t spoil.
Frank Bakker, co-owner of Contronic, describes the added value of participating in the Growth Accelerator Programme in a blog on the programme’s website. He explains that Contronic was the first to make this type of product and the only company to deliver it. The company had trouble keeping up with the demand for its products and Frank was consumed by the day-to-day running of the business. Before taking part in the Growth Accelerator, he was working in the business and now he is mainly working on the business. He now is able to leave work in the company to his team and focus on going out to do business more. The programme helped him to ask himself relevant questions such as: What do I like to do? What am I good at? His plan became clearer and he became more convinced of the choices he was making and things he was working on. The programme also gave him the courage to decide to keep investing, even in these difficult economic times.
Source : Growth Accelerator, 2012c
Firm selection
Firms interested in participating in the programme go through a rigorous selection process in which the following questions are answered:
• What were the turnover results from the past two years? The minimum turnover accepted to be part of the programme is 2 million Euros.
• Does the company have a healthy balance?
• How is the business performing?
• Does the company/Director-Manager have growth ambitions? No ‘hard criteria’ are used to measure growth ambition. Rather, they are assessed by the selections committee in meetings in which the potential participant is asked to present his/her plan and vision for the future. In addition, sector information is used as a benchmark to consider whether the presented growth ambitions are realistic.
• To which extent is the company/Director-Manager prepared to participate in peer-review?
• What is the growth potential of their core business? This is derived from the same information that is used to benchmark the growth ambitions, i.e. data on average performance of the sector the potential participant operates in, and performance of companies from the same sector already participating in the programme.
Thus, in addition to undergoing a ‘financial scan’ that focuses on the business metrics (turnover, solvency, number of employees, etc.), the Director-Manager’s motivation and determination plays an important role. The type of company and characteristics of the entrepreneur behind the company are also taken into account. Demanding a matching contribution by the participants (actually 75 thousand Euros for the five-year period) secures their commitment.

90
A new group of participants starts once or twice a year.
Range of services
Programme set-up and theoretical background
The Growth Accelerator programme (Growth Accelerator, 2011) is based on the idea that there are no better advisors for fast growing companies than colleague entrepreneurs who have been or are going through the fast growth process themselves. Thus, companies are supported by their colleagues, and in addition to this, by experienced professionals from the consortium partners on a number of growth related topics. Another characteristic of the programme is that it is not only centred on business development, but also on personal development of the companies’ Director-Managers.
Programme set-up
Figure 7.1 The Growth Accelerator Programme Phases
Source: The Growth Accelerator
The programme consists of four phases:
1. Planning (year one): the first year lays the fundamentals for the rest of the programme. Participants work on their ‘Strategic Picture’ (see below) and based on this, a growth strategy and path is developed. This first phase also centres on personal development and teambuilding resulting in a “Personal Picture”. In addition, at the end of the first year, participants are supported in choosing a focus in their approach in two dimensions:
1. Fundamental focus: choice between Strategy and Organisation, or Marketing and Sales

91
2. Strategic focus: choice between Internationalisation, Mergers and Acquisition, or Capital and Finance.
2. Realisation (years two and three): Based on the outcomes of year one, the organisation and its surroundings are prepared for growth via six different knowledge modules per year (twenty modules are available) associated with the chosen focus. Besides following the modules, the class also comes together twice a year to discuss individual progress, personal development and learn from each other in the process (special continuing growth workshops). In addition, per year each participating director has access to eight hours personal senior advice on growth topics and has a personal ‘’growth’’ coach. Also, twice a year the programme management organises inspiration sessions for all participants with successful entrepreneurs as ambassadors for growth, workshops, networking sessions and matchmaking. At the end of the second year the Strategic focus is re-evaluated and possibly a new focus is chosen for the third year. Consequently, a similar programme as described above is followed during year three.
3. Growth start (year four): Year four starts with an assessment to judge whether there are any blank spots left to be filled in order to progress with the growth process. This includes both aspects at the company and/or personal level, as well as issues related to the execution of the Growth Plan. The assessment results in an advice with a number of action points to be addressed during year 4. In addition, the group comes together twice a year to discuss individual progress, personal development and learn from each other in the process (special continuing growth workshops). Also, each participating director has access to 8 hours personal senior advice on growth topics and has a personal ‘’growth’’ coach.
4. After addressing these points in year four, year five consists of concluding the execution of the Growth Path and Personal Development Plan established in year 1. In addition, each Director-Manager will construct a new Strategic Picture and Growth Strategy/Path for the five years after the program and present these to successful entrepreneurs and venture capitalists in the setting of an executive Round Table and a Dragon’s Den. Year five will be concluded with an official graduation event and an alumni group.
Theoretical background
The programme has a theoretical background including the aspects ‘Visualisation and Inspiration’, the Peer Group Learning Method, and a Growth Model.
Visualisation and Inspiration
The concepts Visualisation and Inspiration are based on work by various researchers on theoretical backgrounds and fundaments underlying the growth process in practice. The Strategic Picture and the Growth Path are founded on this research including work from:
• Stephen Covey: Covey (1989) discusses the principle of “beginning with the end in mind”, and argued that being able to imagine the future (visualisation), and to understand where one is now, where one is going and what one values most, leads to effectiveness and success.
• Jim Collins: In Built to Last (1994), Collins and Porras write about visualising goals and use the concept “Big Hairy Audacious Goal – BHAG” as a condition for success. They explain that a BHAG is in fact a “bold mission”, “a huge, daunting challenge”, and state that it “… is clear and compelling, serves as unifying focal point of effort, and acts as a clear catalyst for team spirit. It has a clear finish line, so the organization can know when it has achieved the goal; people like to shoot for finish lines.” (Collins and Porras, 1996).

92
• Vern Harnish: Harnish develops the BHAG concept further in his book “Mastering the Rockefeller Habits: What You Must Do to Increase the Value of Your Growing Firm” (2002) and provides strategy checklists.
• Manfred Kets de Vries: Manfred Kets de Vries conducted research on renowned entrepreneurs for his book “The New Global Leaders” (1999) and found that the most important success factor is having a clear vision of what they wish to accomplish. In addition he addresses the importance of inspirers to motivate people in an organisation to realise goals.
Lynda Gratton: Finally, Gratton (2000) argues that putting people at the heart of the corporate strategy helps to increase business performance. She defines six steps for strategy development, visualisation being one of them.
Peer Group Learning
Peter Senge (1990) wrote a book on the “Five Disciplines” essential to the learning organisation, one of which he refers to as “Team Learning”. The idea is that an organisation cannot learn unless a team can learn, and the learning ability of the group is greater than the learning ability of any individual in the group. Senge argues that adults learn the best when they work on real-life challenges, and exchange experiences with people who are in the same situation. He found that adults learn best by learning from others, by reflecting on how they address problems, question assumptions, and by receiving feedback from their peers.
Since groups of high growth entrepreneurs faced many comparable real-life challenges, the team learning principle, or peer group learning principle, was chosen as the basis for learning in the Growth Accelerator Programme.
Growth Model
The Growth Model used by the programme is based on the one developed for the report “High Growth Firms and Innovation” mentioned in the introduction (Dutch Ministry of Economic Affairs, 2004). After this it was compared it to other models:
• Greiner (1972): The phases of business growth
• Adizes (1979): Organizational Lifecycles
• Churchill en Lewis (1983): The five stages of small business growth
• Scott and Bruce (1987): Five stages of growth in small business
• Miller and Friesen (1984): The Miller and Friesen life cycle model
• Flamholz and Randle (1995): Growing Pains
• Kazanjian (1984): Model of the growth of technology-based firms
• Quinn and Cameron (1983): Organizational life cycle
• Hanks (1993): Four configurational stages

93
Finally, 140 high growth entrepreneurs from companies varying in size, sector, from different regions and in various growth phases were asked to provide feedback on the model presents the resulting final growth model, which is made up of bottlenecks encountered in the various growth phases based on personal experiences and categorized in six themes. Entrepreneurs use the model to compare their situation to in order to define priorities, and to communicate with colleague entrepreneurs in the different sessions.

94
Table 7.1 The Growth Accelerator Programme Growth Model
Source: The translation of Port4Growth’s Growth Model by Technopolis Group
Growth Theme Growth Bottlenecks Growth Phase 1: Start Growth Phase 2: Ad hoc Rapid Growth
Growth Phase 3: Controlled Rapid Growth
Growth Phase 4: Restricted Growth
1. Strategy Company Strategy Not defined explicitly Clear and defined No longer up-to-date Out of date
Management By the entrepreneur Need for a manager Loss of control Ineffective management
Organisational Structure Poorly structured, unclear role allocation
Structure does not match actual working methods
Working methods between departments more and more formal
Changes are difficult to realise and time consuming
Staff Difficult to find capable staff Company needs more and more specialists
Formal culture/poorly performing staff
Good staff’s motivation decreases as well
2. Market Position Product versus Customer Focus Product/service is unique and sells itself
Changing client needs are not met adequately
Product/service isn’t new, but still focus on unique selling points
Product/service isn’t new anymore, a lot of competition
Customer Relations First customers dominate the company’s time
Customers are important but cost a lot of time
Unclear in which customers to invest
Even though customer value is management focus, still a lot of exchange
3. Automation Processes Many face-to-face appointments and problems in fine-tuning
Due to mistakes forced to define processes
Employees leave, breaking in new employees costs time
Processes run more and more difficultly, bureaucracy
Systems Current systems are band-aid solutions
Growth is restricted by suboptimal ICT environment
Company considers system integration, is this necessary?
More focus on cost efficiency, also in ICT
4. Capital & Finance Capital Primarily equity, no co-owners Capital need, but on which conditions?
Little in-house knowledge about the capital market
Share proportions become strategic issues
Bank Financing Notion of needs and possibilities is unclear
Financing from cash flow, liquidity problems
Extra financing is needed, but making choices is difficult
Financing is an expense, need to cut down
5. Business Partners Service Providers Cooperating with small, local service providers
Small parties are not able to keep up with growth adequately
Many service providers, but effectiveness/efficiency is low
Value-adding service providers are very scarce
Turnover increase Cooperating with many parties; opportunistic
Aim is yield increase, how to begin and with whom?
Strategic choice for partnership but which kind?
Partnerships difficult to control
Cost control Hardly cooperating, keeping everything in-house
Initial structural outsourcing steps Varying experiences with outsourcing, doubts
Outsourcing is necessary, but regarding which parts in particular?
6. Acquisition & Succession Strategic Acquisitions n.a. n.a. Aim is acquisition but not a good strategy
Integrating the target company is a difficult and long process
Succession n.a. Recognising/appointing capable successor difficult
Succession keeps on being delayed
Danger lingers of two captains sinking the ship

95
Business diagnosis
Business diagnosis takes place in the first year of the programme. The first year (business part) is made up of three steps: the Strategic Picture, the Growth Strategy, and the Growth Path. These are explained below.
The Strategic Picture
The Strategic Picture is a detailed description of where the company would like to be in five years. It is developed starting from the future, meaning that it is not intended to be an extrapolation of the current situation, but rather a vision of the state of the company after finishing the programme, based on the dream of the entrepreneur. This picture is important for determining the following steps (see below), but also in communicating the new strategy to the rest of the company including the other members of the management team, employees, clients, financiers, etc. It is developed in various steps and includes feedback moments after each step during which the entrepreneurs and consortium professionals act as a sounding or review board for each other.
The Strategic Picture comprises development of a vision, a business model based on the Business Model Canvas method, and an exit strategy. Thus it starts out by defining what the company's core values, purpose and envisaged future is (Cybaea, 2004). This serves to provide inspiration and a guide for the plan including specific choices for achieving the vision.
The Business Model Canvas (Osterwalder & Pigneur, 2009) is a strategic management template for developing new or documenting existing business models. It was designed by Alexander Osterwalder based on his previous work for his Ph.D. dissertation, and via a co-creational process with entrepreneurs, consultants and executives. The Canvas is a concept that allows entrepreneurs to describe and think through the business model via nine basic building blocks that show the logic of how a company intends to make money. The ‘blocks’ cover four main areas of a business: customers, offer, infrastructure, and financial viability. The model is an outline for a strategy to be implemented through organizational structures, processes, and systems. The nine building blocks are: Customer Segments, Value Propositions, Channels, Value propositions, Customer Relationships, Revenue Streams, Key Resources, Key Activities, Key Partnerships, and Cost Structure.
Finally, the Strategic Picture is completed with an exit strategy.
The Growth Strategy
The next step consists of translating the Strategic Picture into a Growth Strategy. It entails making choices concerning the way(s) the company believes it can realise its goals as described in the Strategic Picture. As with the Strategic Picture, developing the strategy is also a process gone through in stages, each stage being subject to feedback moments with the peer-group. Once the participating companies have completed this process, they will have made an analysis of their current status and chosen a strategy.
The analysis of the company’s current situation is achieved by analysing its current business model, by making a SWOT-analysis (Strengths-Weaknesses-Opportunities-Threats), and by drawing conclusions as to which points of attention can be drawn from these analyses.

96
Strategic choices are then made based on various models, examples of which are:
• The Ansoff Matrix - the Product/Market Expansion Grid (I.Ansoff, 1957)
• The Blue Ocean Strategy (W.C. Kim, R. Mauborgne, 2005)
The Value Disciplines Model (Treacy and Wiersema, 1993)
Also, choices concerning autonomic growth versus growth via mergers, acquisitions and/or partnerships, and regional, national and international growth are made.
Finally, the company groups the strategic choices made into so-called combined strategies and incorporates combined strategies into a strategic roadmap.
The Growth Path
The first two steps lead to constructing the Growth Path, a description of which themes need to be addressed related to the different management areas, and setting milestones for the end of each period accordingly. Essentially, the Growth Path is a tailor-made step-by-step guide through the programme for the company. It is a tactical plan that should provide the participant with a framework for operational actions, monitoring progress and should end in completing the Strategic Picture. Participants develop this plan by determining which milestones are necessary and applicable based on the Strategic Picture and Growth Strategy, putting them in the context of the Business Model Canvas and placing them in time, thereby ensuring their consistence and logical sequence.
Support services
The Growth Accelerator Programme delivers wide-ranging support consisting of personal development training, inspirational sessions, a personal ‘growth coach’, a module portfolio, senior consultancy services and special continuing growth workshops.
Personal Development Training
As mentioned before, the programme puts a great emphasis on personal development of the participating company’s Director-Manager. It starts with a test to provide insight into the Director’s personal profile and development of a ‘Personal Picture’. This picture constitutes where the Director-Manager sees him or her self in five years in terms of personal development. Groups of five people come together periodically to discuss personal issues in sessions lead by moderators to work on achieving the personal goals set in the Personal Picture.
Inspirational Sessions
In these sessions all of the participants come together to exchange ideas. Companies who have just started the programme can learn from and be inspired by progress made by firms that are further along in the programme. Also, successful entrepreneurs from outside the programme are invited to tell their story. In addition, workshops, networking sessions and matchmaking are being organized during the inspirational sessions.
Personal ‘growth coach’
The participant meets with his or her personal ‘growth coach’ every 2 months to discuss to which extent he or she and the company are on track in reaching the milestones set in the Growth Path. The coach

97
helps the entrepreneur to decide whether adjustments need to be made in chosen programme elements, to look at the near future and make decisions for the next period, and in general to ensure that he or she utilises the programme to its fullest.
Modules
Participants have access to a range of modules based on the Fundamental and Strategic Focus they design during the first year of the programme. The portfolio of offered modules is continuously adapted to the wishes of participating companies. The 2012-2013 portfolio is presented in Box 7.2.
Box 7.2 The Growth Accelerator Programme Modules 2012-2013
Fundamental focus
• Strategy and Organisation
− Performance and Risk Management − Structural and Cultural Change − Human Capital − ICT and Growth − Value driven leadership − Effective leadership − Change management
Marketing and Sales
• External orientation and market position • Client Management and Sales
Strategic focus
• Internationalisation
− International Contracts and Risk Management − International entrepreneurship
Mergers, Acquisition and Partnerships
• Mergers and Acquisitions • Strategic Partnerships
Capital and Finance
• Due Diligence • Capital, Finance, and Changing Regulations • Structure of shares and investments
Modules depending on specific situations
• Management in crisis • Product and Process Innovation • Lean management • Entering and ending Contracts
Dealing with resistance
Source : The Growth Accelerator Programme

98
Participants choose six modules per year, and are allowed to bring fellow managers when relevant. Each module lasts a day and is organised in a vertical manner, meaning that participants from various groups take part in them together.
Senior consultancy services
In addition to the basic training and modules (see below), a firm may make use of senior consultancy services. It is seen as an added service aimed at addressing specific issues the individual entrepreneur may face and is provided for a maximum of 8 hours per year. These services offer the participants a chance to go deeper into a topic when needed and some of the themes are the same as for the modules. Examples of other topics are Fiscal and Legal Matters, Human Resources and Culture, and Organisation and Projects.
Special Continuing Growth workshops
Every period starting from year two the groups meet up to discuss progress made and to update the Strategic Picture, Personal Picture and Growth Path.
The programme’s focus is on growth in general. Due to this, and the fact that participating companies come from different sectors and have various growth ambitions, innovation is promoted to the extent that it is a way to achieve growth, and it may be a large focus for some companies, and a smaller priority for others. Consortium partner Philips Innovation Services provides a module on Product and Process Innovation and offers senior advice on innovation processes to individual participating companies.
Besides business development the programme is centred on personal development considering the influence the personality of the company’s entrepreneur has on successful growth. The workforce’s technical skills are supported (indirectly) via modules and senior consultancy services when needed. By making use of consortium partners’ international networks access to international markets is ensured as well.
Delivery arrangements
1. The Growth Accelerator programme is managed by the High Growth Stars Consortium, a group of five parties including (Growth Accelerator, 2011):
2. Port4Growth: Port4Growth (2012) is an independent platform for high growth firms that was established by a number of entrepreneurs in 2004. The founding entrepreneurs had been involved in the research team for the previously mentioned report “High Growth Firms and Innovation” (2004, see section 1) and after analysing growth characteristics and bottlenecks, they decided to put this knowledge and their own entrepreneurial experience to use in assisting other entrepreneurs to reach their growth ambitions. Port4Growth organises various events such as the ‘High Growth Forum’, ‘High Growth Awards’, and thematic workshops.
3. PricewaterhouseCoopers (PwC): PwC (2012) delivers consultancy services based on the growth model developed for the Growth Accelerator Programme. Its international presence enables specific assistance in the area of internationalisation of participating firms.
4. De Baak: De Baak Management Center (2012) is a training institute that has evolved from the Confederation of Netherlands Industry and Employers (VNO-NCW), the largest employer’s organisation in the Netherlands. De Baak delivers a number of courses related to leadership, personal development, entrepreneurship, and innovation.
5. AKD: AKD (2012) is a Dutch company specialised in delivering legal services.

99
6. Philips Innovation Services: Philips Innovation Services (2012) offers a range of innovation services, expertise and high-tech facilities across the whole innovation process. It developed the “Design and Production Model” together with Port4Growth specifically aimed at high growth firms.
This group of intermediaries was selected by means of a tender. The following issues motivated the Ministry of Economic Affairs, Agriculture and Innovation to choose this the consortium:
• The ‘begin with the end in mind’ approach: This refers to the principle described by Stephen Covey in his book “The Seven Habits of Highly Effective People” in which he explains that the ability to visualise the future leads to effectiveness and success. It is one of the main principles behind the Growth Accelerator Programme and is used to develop the individual Strategic Pictures.
• Broad set of competences demonstrated by the consortium partners.
• Structure of the programme: The programme is set up in a way that a class starts once or twice a year. This design ensures that the programme is longer lasting than when all participants were to start and finish at the same time. Associated with this, it ensures long-term commitment by the programme management to go beyond the years during which government funding is promised since it has to guarantee that all participants will be able to complete the programme.
The financial arrangements between government, private companies, and beneficiary firms are set up in the following way:
• The Dutch government finances five million Euros over the entire five-year-period. These funds are used primarily for programme development.
• Beneficiary firms contribute a fixed amount of 75 thousand Euros to take part in the 5-year programme.
• The private companies involved in the consortium do not provide any funding towards the programme.
• After the first five-year-period, the programme will be self-sustainable and be directly funded via beneficiary firms’ contributions.
Strengths
The Dutch Growth Accelerator programme has not yet concluded a five-year cycle and therefore a full evaluation has not taken place yet. However, based on the information gained during the course of writing this paper, so far the following strengths can be identified:
• The Growth Accelerator Programme is managed by a professional consortium of five partners with long-term experience on growth issues. The programme management organisation has a constant focus on adaptation of the programme structure and elements, based on feedback and observations to ensure that it meets participants’ needs. In addition, they remain impartial (they have no financial participations in participating SMEs) and have committed themselves to prolonging the measure after the first five-year period expires.

100
• The programme is based on thorough research on bottlenecks incurred by high growth entrepreneurs, and a strong theoretical foundation in the work of global management experts on best practices in high growth firms and learning processes. By focusing on continuous improvement and regular evaluations of the support services, the use of the models in practice is a priority.
• The programme elements are well received by participants. Especially the ‘Strategic Picture’ concept and the Peer Group Learning method are considered to be valuable and unique. Entrepreneurs are forced to come out of their comfort zone more. This, together with the class type setting in which individuals stay together throughout the programme, creates a safe and challenging learning environment, which can lead to exceptional personal growth.
Weaknesses
Keeping in mind the earlier note on lack of a full evaluation, based on the information gained during the course of writing this paper, so far the following weaknesses can be noticed:
• The five-year length of the programme is a relatively long period. Even though for some entrepreneurs, this allows time to develop their organisation thoroughly at an acceptable pace, for others it is difficult to make a five-year commitment. Not only does the lengthy period put high demands on participants’ dedication, which is especially problematic in tough economic times, but there is also the issue of the dynamic world we live in. Circumstances change too fast to be accounted for in such an extensive programme.
• The programme’s outreach is limited. A relatively small number of companies participate in the programme. More study is necessary to determine the reasons for this but it seems that, in addition to the length of the programme, issues such as the eligibility criteria and perhaps lack of awareness about the programme may have something to do with this.
• In the Netherlands there are a number of organisations active in supporting entrepreneurs. In general, actors are lacking awareness of or linkages to initiatives outside of their own, when in some cases this could be valuable not only from a policy perspective, but also lead to benefiting the individual programmes. The impression is that this is also the case with the Growth Accelerator programme. In the short time of its existence it is reasonable that the focus has been on running the programme and continuously improving the programme structure, set-up and support services. However, more attention for its positioning in the wider setting of available programmes could benefit the programme.
M&E system and proven impact
In 2011, results of the participating companies were compared to a control group based on a number of performance indicators (Growth Accelerator, 2012a). The Dutch organisation Statistics Netherlands (Statistics Netherlands, 2012), which is responsible for collecting and processing data in order to publish statistics to be used in practice by policymakers and for scientific research, constructed the control group. The control group is composed of companies with a gross turnover between one and 25 million Euros with at least five employees and operating in different sectors.
The performance of programme participants was compared to the performance of companies in the control group based on the following indicators:

101
• Gross turnover development;
• Foreign gross turnover development;
• Development in the number of countries in which the entity operates;
• Development of the amount spent on innovation and product development;
• Development in the number of employees;
• Development in the number of entrepreneurs (outside of the programme) for which the participating company acted as a sparring partner.
Results of the analysis are presented in Table 6.2.
Table 7.2 Results of the midterm evaluation of the Growth Accelerator Programme
Performance indicator Index Control group 2009 with respect to 2008
Index Programme Participant Group
2009 with respect to 2008 (n=41)
Gross turnover development 93 115
Foreign gross turnover development 88 143
Development in the number of countries in which the entity operates
** 110
Development of the amount spent on innovation and product development
** 145
Development in the number of employees 100 108
Development in the number of entrepreneurs (outside of the programme) for which the participating company acted as a sparring partner
** 133
** Statistics Netherlands was not able to determine an index for the control group
Source: The Growth Accelerator Programme
Results of the analysis showed that programme participants’ performance is better than the performance of companies in the control group. Firms that started the programme in 2009 had a 22 percent higher gross turnover increase than firms in the control group. Other results showed an eight percent average employee increase and a 55 percent higher foreign turnover increase. The programme’s website claims satisfied participants. Furthermore, participants’ feedback has been used over the years to continuously improve the programme.
The benefit of performing a control group analysis is that it allows for correcting the effects of the economic crises. On the other hand, companies in the control group did not undergo the same rigorous selection process that the participating companies did go through, which needs to be noted when discussing the results. In addition, since lean management is an important aspect of the programme, the average employee increase may undermine growth results.
This analysis will be repeated each year. Furthermore, an evaluation of the programme is planned for 2013 after the first class of companies completes the programme. It will be assessed based on the extent to which it has reached the target set at the beginning of the programme. After five years a minimum of 65

102
companies must have reached a turnover of at least twenty million Euros, or be expected to do so (for those companies who have not yet completed the full five-year cycle).
Additional impacts mentioned in interviews are that the Growth Accelerator Programme leads to more awareness by providing role models of high growth entrepreneurs.
Recommendations for improvement
Recommendations for improvement can be given on two points:
1. Programme design: As explained before, the five-year-period is not ideal for participants, and a relatively low number of companies participate in the programme. Potential improvement could be achieved by reconsidering the programme set-up. Even though more information is needed to determine in which areas and which way exactly improvements could be made, some of the following issues or options should be considered:
i. Length of the programme and offering different versions of the programme in terms of duration;
ii. Focus: the programme is now open to all sectors. This is beneficial in the way that differences lie at the heart of the interaction between entrepreneurs and ensure a good quality peer group learning process. However, in some cases a sector focus, or a focus based on shared challenges (for instance forming a group of companies all aiming to expand in the US) may deepen learning experiences.
iii. Eligibility criteria and allowing companies to take part in individual programme modules, thereby increasing programme accessibility.
2. Positioning of the programme:
i. Since the start of the programme, the world has changed significantly. Not only have we been confronted by economic crises, but in the Netherlands we have also had a change of government and policy, and are currently awaiting the consequences of yet another round of elections. It should be explored what the positioning of Growth Accelerator is in this new reality, including exploring synergies with the Top Sector policy that has been established since in which the Ministry of EA&I has defined certain domains of excellency (also related to the recommendation on focus above), and/or policy made by the new government.
ii. In addition, as mentioned before there are various initiatives in the Netherlands to support (high growth) entrepreneurs. Even if they are aimed at a (slightly) different target group, awareness of the positioning of the Growth Accelerator in the total supply of support services, and linkages to other initiatives should benefit the programme. By exploiting synergies, it could lead to more participants, more efficiency, and more impact.
Conclusions
The Growth Accelerator Programme started in 2009 and is implemented by the High Growth Stars Consortium, a group of five private companies specialised in different areas of fast growing company support. The programme was established to tackle bottlenecks that high growth businesses encounter during the growth process. It aims to support and facilitate the growth of two hundred SMEs from a turnover of approximately two million Euros to a turnover of twenty million Euros in a period of five years. It is a national programme and is open to SMEs from all sectors and all regions of the Netherlands.

103
The total budget for the five-year programme is five million Euros. This is matched by the contributions of the participating entrepreneurs.
Beneficiary firms are selected in a rigorous selection process in which business performance and the Director-Manager’s motivation and determination are taken into account. The programme design is based on research on the bottlenecks for high growth companies in various growth phases and uses concepts such as ‘Visualisation and Inspiration’, the Peer Group Learning Method. During the five-year-period, the participants complete a Strategic Picture (a description of where they see themselves in five years), a Growth Strategy (a collection of strategic choices on how to realise their goals), and a Growth Path (a tactical plan with milestones). They have access to numerous support services including personal development training, inspirational sessions, a personal ‘growth coach’, various thematic modules and one-on-one senior consultancy services.
Keeping in mind that a full evaluation of the programme is yet to be conducted, the impression is that the Growth Accelerator programme stands out regarding its professional programme management which focuses on continuous programme improvement, and its high-expertise support services providers. Also the programme’s strong theoretical foundation and creation of a safe and challenging learning environment well received by participants are strong points. On the other hand, the programme is very long, a relatively small number of companies participate in the programme, and more attention could be paid to the positioning of the programme in the wider setting of available support to (high growth) entrepreneurs. Suggested points of improvement relate to the programme design (in terms of length, focus, and eligibility criteria) and determining the programme’s position and exploiting synergies in terms of new socio-economic context, new governments and policies, and other initiatives aimed at (high growth) entrepreneurs.
The impression is that the Growth Accelerator Programme is a well-functioning programme from the participants’ perspective. However, since the number of participants is relatively low, from a policy point of view, attention is needed concerning outreach to the rest of the Dutch high growth companies. The Ministry of EA&I is working on combining efforts and bringing together the various stakeholders who are involved in supporting (beginning) fast growth entrepreneurship. It will be interesting to see how the Growth Accelerator programme will evolve bearing in mind the upcoming stop of government funding, the new Dutch government’s policy, and the thorough evaluation of the Growth Accelerator programme next year.
Transferability
As far as the programme manager is aware, the programme has not yet inspired any transferability attempt. Considering the first indications of success and high expectations, and the willingness to share experience and knowledge on the subject, there is much interest to cooperate internationally.
Most of the key elements of the program consisting of creating a Strategic Picture, a Growth Path and a Personal Picture, and providing tailor-made advice as well as feedback by experts are elements that could be easily transferred to other countries. The elements are based on theories and models that were developed from research on companies from various countries, and thus have an international character built in. In addition, the tailor-made approach ensures a good fit with beneficiary firms regardless of which country they are from.
The peer group learning method deserves some special attention. The Dutch are known for their direct communication and open culture. This makes them especially suited for the peer group learning method, which demands candid input and an open attitude from participants to maximise learning results. However, it may be that in other, more closed, cultures characterised by less open communication, this method could

104
scare potential participants off or lead to lesser results. On the other hand, entrepreneurs may not be as susceptible to these cultural differences as the average person. These considerations (which may also apply to certain work format choices) will need to be discussed with local experts.
In general the main parts of the programme should be transferred easily, especially since the program’s approach and content is well described in manuals and workbooks. For each country or region the specific subparts and work formats should be made to fit local learning culture to ensure maximum results.
References
Adizes, I., 1979, Organizational passages—Diagnosing and treating lifecycle problems of organizations, Organizational Dynamics, Volume 8, Issue 1, Summer 1979, Pages 3–25
Ansoff, I., 1957, Strategies for Diversification, Harvard Business Review, Vol. 35 Issue 5,Sep-Oct 1957, pp. 113-124
AKD, 2012, http://www.akd.nl/en, visited September 4, 2012
Chan Kim, W. and Mauborgne, R., 2005, Blue Ocean Strategy: How to Create Uncontested Market Space and Make Competition Irrelevant, Harvard Business Press, 1 feb. 2005
Collins, J. and Porras, J.I., 1994, Built to Last: Successful Habits of Visionary Companies (Harper Business Essentials), Harper Business
Collins, J. and Porras, J.I., 1996, Building Your Company’s Vision, Harvard Business Review, SEPTEMBER-OCTOBER 1996, Reprint 96501
Contronics, 2012, http://www.contronics.nl/home/our-mission, visited October 5, 2012
Covey, S.R., 1989, Seven Habits of Highly Effective People: Restoring the Character Ethic, Simon & Schuster
Cybaea, 2004, http://www.cybaea.net/Blogs/Journal/Vision_2.html, visited September 4, 2012
De Baak, 2012, http://www.debaak.com/, visited September 4, 2012
Dutch Ministry of Economic Affairs, 2000, “Succesvol Ondernemen: eerder een kwestie van karakter dan van kennis” April 2000
Dutch Ministry of Economic Affairs and EIM, 2004, “Snelle Groeiers & Innovatie”, June 2, 2004
Dutch Ministry of Economic Affairs and EIM Business & Policy Research. 2006, Entrepreneurship in the Netherlands, High growth enterprises; Running fast but still keeping control, December 2006
Dutch Ministry of Economic Affairs and EIM business & Policy Research, 2009, Ten years entrepreneurship policy: a global overview, January 2009
Dutch Ministry of EA&I, 2009, http://www.rijksoverheid.nl/nieuws/2009/01/21/van-der-hoeven-opent-programma-groeiversneller.html, visited September 3, 2012
Flamholtz, E.G. and Randle, Y., 2007. Growing Pains (4rd Edition). San Francisco: Jossey-Bass.
Gratton, L., 2000, Living Strategy: Putting People at the Heart of Corporate Purpose, Financial Times Prentice Hall
Greiner, L.E., 1972, Evolution and revolution as organizations grow, Harvard Business Review, July–August, Reprint 98308
Growth Accelerator, 2011, Informatie Groeiversneller, http://www.groeiversneller.nl/wp-content/uploads/2012/05/algemeneinfo_PG_12082011.pdf, downloaded September 3, 2012

105
Growth Accelerator, 2012a, http://www.groeiversneller.nl/informatie/programma-groeiversneller/, visited September 3, 2012
Growth Accelerator, 2012b, http://www.programmagroeiversneller.nl/pagina/initiatief_2/, visited September 3, 2012
Growth Accelerator, 2012c, http://www.groeiversneller.nl/bijeenkomsten/, visited October 5, 2012
Hanks, S.H., Watson, C.J., Jansen, E. & Chandler, G.N., 1993, ‘Tightening the life-cycle construct: a taxonomic study of growth stage configurations in high-technology organizations’, Entrepreneurship Theory and Practice, vol. 18, no. 2, pp. 5-29.
Harnish, V., 2002, Mastering the Rockefeller Habits: What You Must Do to Increase the Value of Your Fast-Growth Firm, Select Books
Kazanjian, R., 1984, Operationalizing Stages of Growth: An Empirical Assessment of Dominant Problems. In Hornaday, J. et al (editors). Frontiers in Entrepreneurship Research. Babson College, Center for Entrepreneurial Studies, Wellesley, Massachusetts, USA, 144-158.
Lewis, V.L. and Churchill, N.C., 1983, The Five Stages of Small Business Growth. Harvard Business Review, Vol. 61, Issue 3, p. 30-50 1983
Miller, D. and Friesen, P.R., 1984, A longitudinal study of the corporate life cycle. Management Science, 30: 1161-1183.
Osterwalder and Pigneur, 2009, Business model generation: a handbook for visionaries, game changers, and challengers, downloaded via http://www.businessmodelgeneration.com/canvas, visited September 4, 2012
Port4Growth, 2012, http://www.port4growth.nl/, visited September 4, 2012
PwC, 2012, http://www.pwc.nl/nl/index.jhtml, visited September 4, 2012
Quinn, R.E. and Cameron, K., 1983, Organizational Life Cycles and Shifting Criteria of Effectiveness: Some Preliminary Evidence, Management Science January 1983 vol. 29 no. 1 33-51
Scott, M. and Bruce, R., 1987, Five stages of growth in small business, Long Range Planning, Volume 20, Issue 3, June 1987, Pages 45–52
Senge, P.M., 1990, The Fifth Discipline: The Art and Practice of the Learning Organization, New York: Doubleday
Statistics Netherlands, 2012, http://www.cbs.nl/nlNL/menu/informatie/beleid/publicaties/maatwerk/archief/2011/110304controlegroep-groeiversneller2009-uit-mwxls.htm, visited September 3, 2012
Treacy, M. and Wiersema, F., 1993, Customer intimacy and other value disciplines, Harvard business review, January-February 1993, pp. 83-93, Reprint 93107
Kets de Vries, M.F.R. and Florent-Treacy, E., 1999, The New Global Leaders, San Francisco: Jossey-Bass, April 1999

106
CHAPTER 8. FLANDERS’ GAZELLE JUMP
Concept and rationale
A sprong means a jump. Gazellensprong means a company that jumps from the status of a “normal grower” to that of a “fast grower”, a so-called Gazelle. The scheme Gazellensprong should hence help potential Gazelles to make the jump by accelerating their growth.
Legal and political context
Since the third State reform in 1989, the competence for economic and innovation policy has been transferred from the Belgian federal to the regional level. The fourth State Reform in 1993 enlarged the economic competences of the regions by including the so-called national sectors (steel, textile, etc.). The fifth State Reform took place in 2002 and regionalised the competence of external trade. And finally the sixth Reform of the State, taking place in 2012, transferred some parts of the labour market policy. Unemployment schemes remain at the federal level but the control mechanisms will be regionalised54. Labour market regulation and fiscal policy related to income and corporate taxes remains however mainly - at least for the moment - at the federal level.
Due to this reform process, during the latest decennia, the three Belgian regions, i.e. the Flemish Region, the Walloon Region and the Brussels Region, developed hence gradually their own economic and enterprise policy.
Following the Global Entrepreneurship Monitor (GEM), the entrepreneurship level in the regions of Flanders and Wallonia are amongst the lowest in Europe. Hence, both regions have developed an important entrepreneurial policy. In this article we will focus on the Flemish region only55.
The Flemish region, historically mainly based on car industry, steel and chemicals, is the fourth richest region in Europe in terms of GDP per capita. The welfare state is well developed with a, federally paid and organised, very generous social security. Belgium is for instance the only country in the world that foresees unemployment allocations unlimited in time. As was shown by a study exploring the GEM data, the two factors having a negative correlation with entrepreneurship are the level of public involvement in GDP (R = – 0,49) and the social and tax burden on salaries (R = – 0, 61). Hence necessity entrepreneurship does hardly exist in the Belgian regions56.
The Entrepreneurship policy developed in Flanders is called Flanders in Action57. The plan is composed of three pillars:
54 Effective transfer should be realised in 2013. 55 For an analysis of the Walloon entrepreneurship policy program, we refer to R. Aernoudt, Wallonia as
bench for promoting entrepreneurship, in OECD, Compendium for entrepreneurship, 2009. 56 See R. Aernoudt, European Enterprise Policy, Intersentia, 2003.
57 VIA stands for Vlaanderen in actie and at the same time refers to the Latin word VIA, the way to go.

107
1. A global approach of the life cycle of companies distinguishing actions for four phases of the company: prestart, starters, fast growers and generation switch.
2. The keys of success. Based on development of entrepreneurs skills, transfer of knowledge, access to capital and space to undertake
3. An entrepreneurship climate stimulating entrepreneurship based on three axes: avoiding red tape, fine-tuning of different governance levels and sectoral policy
The action ‘Gazellensprong’ is hence part of the first axe as one of the phases of the life of a company. The entrepreneurship policy is part of the wider policy at regional level. This policy includes strategic support to enterprises, general actions to promote enterpreneurship and actions linked to enterprise environmental aspects. In budget terms, the Gazellensprong is only a very small part of the enterprise policy. We can distinguish between classical investment subsidies, support towards industrial zoning, actions for entrepreneurship and support for advice.
Table 8.1 Overview economic policy in Flanders
Subsidised activity In million Euro (figures 2011)
Comments
Strategic Investment support 33 Enterprises fulfilling certain criteria receive a subsidy of x% of their investment
Ecologic support 73,5 Subsidy for ecologic-friendly investments General investment support 9,5 Focused on SMEs Total classical investment support
116 Are classical investment subsidies expressed as percentage of the invested amount
Industrial zoning 15,5 Including support to loans for companies suffering from public works
ERDF cofinancing 16 Mainly focused on investments for development of industrial areas
Support to industrial sites 31,5 Mainly development industrial zoning and re-use of brownfields
General entrepreneurship actions
6,5 Includes enterprise friendly commune, support to BANVlaanderen, Flanders District of Creativity, Design Vlaanderen, Business plan game, etc
Specific entrepreneurship actions
3,5 Includes gazellensprong and generationswitch
Total entrepreneurship 10 KMO-portfolio 31,1 Financing consultancy services, voucher system
based Total support to advice 31,1 Realised budget always lower that forecast as
systemic underutilisation despite subsequent reforms Total 188
Source: Hermesfund
We can see from the analysis of the Hermes fund58, that entrepreneurship in the broad sense, including actions at schools, the action “enterprise friendly commune”, the Business plan games and support to different organisations such as the business angel network, the Flanders District of Creativity
58 The Hermes Fund represents the budget of all economic actions of the economic policy in Flanders. If we
deduct from the total budget of 195 million the allocations to third parties and own functioning costs, the total available amount for economic policy is 188 million euro a year.

108
and Design Flanders, accounts for ten million euro a year, or around 5% of the global budget. The Gazellensprong counts for 1,5 million and represents less than 1% of the budget59.
Moreover, still 60% of the fund is old-fashioned investment support and 17% goes to the development of industrial zonings. Support to consultancy services is of the same order, but mostly the foreseen budget is not entirely consumed, as the take-up of companies is too low. Only a small portion of the total resources is invested in the area of entrepreneurship policy compared to enterprise policy. The support to Gazelles is over hundred times less important than the investment support. To illustrate, Ford Genk alone received a grant of 52 million to maintain its employment in the car factory, or thirty times more that the support for the 170 identified Gazelles60.
In order to complete the picture, it should be added that support for innovation is granted by another agency: the institute for science and technology. The support given by this institute for innovation to enterprise and research centres is around 250 million a year. Finally, the Flanders Investment and Trade agency gives financial support for internationalisation. This support is mainly focused on prospection and information.
Table 8.2 Overview of the three pillars of enterprise support
Process Undertake Innovate Internationalise Agency Flemish Agency for
enterprises Agency for Science and innovation
Flanders Investment and Trade
Grants Mainly investment support; Ecologic support; Enterpreneurship
R&D feasibility projects, R & D enterprise projects, R&D Support programs
Counselling for exporting enterprises; Support for international networking
Although the innovation agency and the international trade agency falls beyond the scope of enterprise policy, and beyond the scope of the Gazellensprong, it is evident that Gazelles are supported through the innovation and internationalisation programs. Fast growers innovate and internationalise which makes them eligible for support from the different organisations.
This hypothesis is confirmed by an analysis that showed that on a year basis, 135 companies considered as Gazelle benefitted from direct support through one of these three agencies, before the implementation of the Gazellensprong: 91 got coaching support through the SME portfolio, within the framework of the Hermesfund, 84 got support from the internationalization agency in order to create contacts abroad and 20 got support from the innovation agency61. Based on the sample of 500 gazelles, the study concluded that 27% of the Gazelles received subsidies from at least one of the three subsidy agencies.
Rationale for support to Gazelles
The concept Gazelle is based on research in the late eighties by David Birch, who concluded that mice, but especially Gazelles were more important for the maintenance and the creation of jobs than 59 In fact Gazellensprong runs over two years and hence represents 0,5% of the economic policy budget of
the region. 60 The yearly investment support is 116 million compared to the 1,6 million support to gazelles support over
two years time. 61 Figures are related to 2008. The summation of the different figures is bigger that the total mentioned, given
that some enterprises got support from different agencies. Source: S. Vandenbogaerde, The use of procurement for the stimulation of innovation, University Ghent, 2009.

109
elephants62. Flanders, confronted with a closing of industrial plants, mainly in the car industry, involving a lot of Job destruction, tried to compensate this loss by promoting the fast growers.
Moreover, often it was the case that enterprises with a huge growth potential were sold to foreign investors at an early stage as the Flemish owner refused to open its capital. Refusing venture capital backing impeded their growth. The fact that Gazelles at a certain stage no longer seek internal financing but prefer external participation is an important element of a growth strategy. Their preference towards control, rather than to growth, implied a loss of potential growth and job opportunities for the region. A study showed that indeed more than half of the growth potential was untapped63. A luxury one cannot permit, especially in times of crises and confronted with a massive closing down of industrial plants64.
In this context, it is logic that policy makers should try to cope with the barriers to growth impeding Gazelles to develop their potential. Seven barriers to growth have been identified: three are internal, four external. They are very similar to the barriers defined in other European countries:
• Internal: lack of qualified labour force, lack of management skills and lack of capital
• External: hugely competitive market, negative macro-economic context, red tape, government restrictions (eg in the field of competition or labour market), limited external partners
Concerning the internal barriers, we can see that they are the same as the barriers with which low growers are confronted, but the barriers are felt much more65.
Figure 8.1 Barriers to growth
%
62 D. Birch, Birch D., 1987, Job creation in America: How our smallest companies Put the most people to
work, New York. 63 Bains & Cie, using Belgian’s growth Potential, 2002. 64 For a detailed analysis, see R. Aernoudt, Leven zonder Job, Roularta, 2011. 65 Growth companies in Flanders, Flemish Agency for Enterprises, 2010.
0
10
20
30
40
50
60
Gazelle Averagegrowers
Gazelle Averagegrower
Gazelle Averagegrower
Finance Finance Man. Man. HR HR

110
Source: Flemish Agency for Enterprises, (2010), Growth companies in Flanders.
The potential growth is often based on disruptive technological innovation or on business model innovation. The innovation can be both high tech and lowtech, and can take place in all sectors66. A sector-oriented policy is hence not a good instrument to promote Gazelles. It is hence better to tackle the barriers at a general level.
Concerning the problem to finance, there is a demand issue and a supply issue. On demand, entrepreneurs should be investment-ready. A potential Gazelle unwilling to open its capital will never realise its growth potential. On demand side, it was estimated that companies needs at least 1,1 million euro at the starting phase, in order to realise a growth higher than average growth67. The study concludes that there is a need for big venture capital funds in Flanders as the classical seed funds are too small to be significant in the Gazelle scene.
In relation to the lack of management skills, the setting up of an enterprise team including technical, commercial and financial capacities is crucial for the success of a Gazelle. Policymakers should act here as a facilitator by bringing together managers and potential team members. Policy could facilitate the matching process68.
Concerning human resources, one of the main aspects is the high cost of labour and the rigidity of labour markets. This is considered as the real bottleneck for the development of Gazelles in Flanders and considered by the entrepreneurs as the biggest obstacle69.
Finally, the external barrier on which the Government could have a huge impact is of course the red tape. Regulation must be as simple and easy as possible. A taskforce could be set up to analyse if Gazelles have specific needs in that field70.
The entrepreneurs’ view
The impact of growth barriers is confirmed if you ask growing companies what they want from the government, and what would really make them grow, then the focus is on lowering social charges (59%) and taxes (43%). The fact the Belgium has one of the highest tax rates is Europe can explain this attitude. The high level of social charges makes companies reluctant to create more jobs and hence to use their growth potential.
Besides, once people have been recruited, layoff is very difficult and can cost a lot of money. Therefore, the second most important things that growing companies wants from the Government is a flexible labour organisation (50%). Again, very easy to understand knowing that Belgium, together with France, has the most rigid labour market regulation in Europe71.
66 Durven Groeien in Vlaanderen, Steunpunt Ondernemerschap, Trends Business Books, 2007, p. 258. 67 Durven Groeien in Vlaanderen, Steunpunt Ondernemerschap, Trends Business Books, 2007, p. 178 68 Durven Groeien in Vlaanderen, Steunpunt Ondernemerschap, Trends Business Books, 2007, p. 261. 69 Will be explained in more detail in the chapter evaluation and monitoring of this paper. 70 Durven Groeien in Vlaanderen, Steunpunt Ondernemerschap, Trends Business Books, 2007, p. 251. 71 Out of 117 countries analysed by the World Economic Forum, Belgium was at place 113, see
Competitiveness Report, WEF, 2009.

111
Third thing to do is cut red tape (43%) and simplify regulation (36%). Those two factors are considered by the fast growing enterprises as major obstacles for growth.
All those aspects, as explained earlier, are mainly of a competence at the federal level. Regional Governments are incompetent, except for the red tape linked to their competences. The different government levels and the lack of transparency can explain why almost one out of four entrepreneurs (23%) consider the single info point as an important facilitator for Gazelles.
Obstacles that can be influenced by the governments at regional level are, in the perception of the entrepreneurs, of a less importance. Gazelles quote access to finance (18%), which is partly a regionalised matter, as important matter for government intervention. Coaching ((7%) and subsidies (2%), which are regional matters, are considered of little importance. Coaching may however be more relevant for companies that have a non-used growth potential. And probably most of the actual Gazelles have been through one or another kind of coaching before getting at that stage
Figure 8.2 What Gazelles want from Government?
Source: Durven Groeien in Vlaanderen, (2007), Steunpunt Ondernemerschap
Facts & figures
One of the difficulties when measuring the presence of gazelles in a region is to find a measurable definition of gazelles. Thereby three definitions were used as a starting point:
1. Definition of David Birch: Gazelles are medium companies with a growth of their turnover of 100% during the last four years, and with a turnover at the starting of the reference period of at least 100 000 $.
2. OECD definition: a company of at least five years old with a average growth rate the last three years of at least 20%. Companies should have at least 10 employees.
3. As a defined percentage of the companies when ranked based on a growth index.
0
10
20
30
40
50
60
70
reducesocial
charges
flexiblelabor
market
reduce redtape
reducetaxes
single infopoint
access tofinance
Coaching Subsidies

112
Based on the latter approach, an index of six criteria was composed:
4. Total growth in employment in absolute figure
5. Organic growth of employment in absolute figure
6. Total growth of turnover in absolute figure
7. Total growth in employment in percentage
8. Organic growth of employment in percentage
9. Total growth of turnover in percentage
Based on these six criteria the top 10% companies are considered as gazelles.
The above-described tendencies were confirmed by figures on the number of Gazelles. If we stick to the definition that a Gazelle is a company with a growth of turnover of 60% over the last three years, then Belgium was placed as the weakest country in Europe, having only 5,6% Gazelles. On world level, only Japan did worse72. Another study, focused on the Flemish region arrived at similar conclusions by estimating that only 4% of the entrepreneurs active in the Flemish region were focused on growth73.
At the same time their importance was confirmed as the 10% fastest growers in Flanders in terms of turnover, were responsible for 42% of the new created jobs. The 2% companies in Flanders who realized a growth of 100% both in turnover and in employment were responsible for 20% of the new job creation. This corresponded to other studies on the United States, showing that four percent of the companies were responsible for 80% of the job creation74. Their importance for growth is even more important: 1% of the most extreme growers are responsible for 50% of the growth of the economy75. Given their impact on growth and employment creation, it’s normal that a region wants to have more Gazelles.
Besides the impact on employment, gazelles are more innovative than an average growing enterprise. Focusing on Gazelles, especially in a region where they are lacking, can give a better value for public money than a non-focused enterprise policy.
Gazellensprong objectives
The objective of the Gazellensprong is hence to have more Gazelles in the region. Hence, the objective was not to have more entrepreneurs in the region, but to have the right entrepreneurs. A generic non-discriminatory SME policy focused on subsidies and access to information, should be replaced, or at least complemented, with a policy focused on Gazelles. This policy would include private financing, accurate coaching and based on a selected number of companies.
We can summarise the difference between a generic SME policy and a Gazelle focused policy as follows:
72 EIM, (2008), High-Growth SMEs Evidence from the Netherlands. 73 Durven Groeien, Steunpunt ondernemerschap, Trends business books, 2007. 74 D. Birch, US Summary Corporate Change Tables, US Department of Commerce, 1997. 75 Durven Groeien in Vlaanderen, Steunpunt Ondernemerschap, Trends Business Books, 2007, p. 256.

113
Table 8.3 Generic SME versus focused Gazelle policy
Generic SME policy Focused Gazelle policy
Objective More starters, more entrepreneurs More growers, better use of growth potential
Main instruments Subsidies and access to information
Private financing and coaching
Target group Non-discriminatory (SME’s) Focused on selected target group with growth potential
Regulation Focused on barriers to entry Focused on bottlenecks to growth Administrative costs and taxes Reduce for starters and small
enterprises Reduce for growers
Failure & second chance Focused on attitude towards failure Focused on reducing socio-economic costs in case of failure
It is obvious however that a Gazelle focused policy can only be efficient in an enterprise-friendly environment. Moreover, it is clear from the table that the main challenge for a Gazelle-focused policy is the selection of the target companies. This is also the view of the Gazelles. A survey based on a representative sample of Gazelles, defined as companies that grew in turnover over 100% in the last four years, can show the real problems growers are confronted with. The survey is hence not based on potential growers, but on real growers, most of them linked to traditional sectors76.
Based on the different studies and the surveys mentioned above, it was decided to work on two parallel approaches:
Direct Government support
In the short run, a subsidy would be given to a number of selected projects that assist and coaches Gazelles in their growth path.
Environmental policy
In the longer run, and based on this coaching experience, a more Gazelle-friendly administrative and fiscal policy would be developed.
We can consider the subsidy projects as a kind of pilot projects in order to better determine the real needs of Gazelles. The results and concepts developed by projects considered successful will be used for the development of the future Gazelle-friendly environment policy.
Geographical scope
The Flanders Region, one of the three regions of Belgium, has around six million inhabitants. It is administratively divided in five provinces, but which have only few competence left. The five provinces are: Antwerp, Limburg, West-vlaanderen, Oost-Vlaanderen and Flemish Brabant (the province around Brussels). Companies benefitting from the Gazellensprong should have an activity within the Flemish region. Brussels is not part of the Flemish Region. Companies active in the Brussels’ region are hence not eligible for the Gazellensprong. For some companies this is hard to understand as both the Flemish Government and the Flemish administration are based in Brussels. They are in fact based outside their geographical scope. 76 The survey was carried out by iGMO, the Institute for Growth companies, which is part of the Vlerick
Business School. See Durven Groeien in Vlaanderen, Steunpunt Ondernemerschap, Trends Business Books, 2008.

114
Target firms and selection procedure
Target firms
Before launching the project, studies were made in order to try to describe the concept of a Gazelle. These studies concluded that gazelles have following characteristics77:
1. They are relatively young: average is 17 yrs for small companies, 25 years for medium enterprise and 35 years for big enterprises;
2. They want to grow. Growth doesn’t happen by coincidence. Their will to grow is mostly translated into a growth plan;
3. They are innovative with a relatively high percentage of high qualified, including academic, staff;
4. The entrepreneur, who is in the driving seat of the gazelle, is a highly educated and a very ambitious entrepreneur who is personally committed in the company and attaches a great importance to innovation;
5. The management team is highly qualified, export oriented, human resource minded and adapts the organisation structure in line with the growth cycle.
From a pragmatic approach, the study defined the potential Gazelle as a company fulfilling five criteria78:
1. An entrepreneur with the ambition to grow and a vision how to do it;
2. An company strategy based on growth through organisational investment and integration of innovation concepts;
3. An open and employee friendly enterprise culture where the owner is closely involved with the recruitment of the employees;
4. Reluctant towards subsidies but focused in automation, if possible mandated and paid by the customer;
5. Creativity in the field of financing;
We could summarise by saying that Gazelles must have the capacity to grow and the willingness to grow.
77 Based on Flemish Agency for Enterprises, (2010), Growth companies in Flanders. 78 Based on Flemish Agency for Enterprises, (2010), Growth companies in Flanders.

115
Figure 8.3 Target group for policy intervention79
Source: Aernoudt, R. (2012), Financieel Management toegepast (Corporate Finance), Intersentia.
Support to Gazelles should hence be based on Gazelles and on potential Gazelles, meaning companies with Growth potential and Growth ambitions. Companies with growth potential, but without growth ambitions, are reluctant to open their capital and hence are often the financial constraint is insurmountable. This so-called life style companies, should not be neglected as a strategy change could make them contribute to exploit the untapped growth potential of a region. From a policy point of view, those life style companies might deliver good value for public money. Investment-readiness program have shown their efficiency in this context80.
Firm selection
The direct Government support for Gazelles is focused on coaching. It started at the end of 2010 and runs as a pilot project until the end of 2012. The total amount of support is 1,5 million euro, and projects are selected on the basis of a call for proposals81.
Projects must be additional to the actual existing policy instruments. The general objective of the call is to promote entrepreneurship and to promote the image of entrepreneurs and entrepreneurship. The specific objective of the call is to focus on the bottlenecks for Gazelles linked to human resource policy, management techniques, organisational aspects, internal procedures and access to capital.
79 Based on R. Aernoudt, Financieel Management toegepast (Corporate Finance), Intersentia, 2012 80 The Investment Readiness Program is part of a national DTI initiative for privately run businesses in the
UK. It's designed to groom entrepreneurial businesses to the point where they are an attractive proposition to outside investment capital, DTI report, 2008.
81 Call for proposals; launched 2009, deadline 12 mars 2009, for projects running in 2011 – 2012.

116
The project must be managed by a private entity, such as a professional or interprofessional organisation or universities, or by an enterprise. The project should clearly indicate the target group of the project and the geographical scope in case the project is subregional.
Projects should have a maximum duration of two years. The maximal budget by project is 250 000 euro and the maximum subsidy by projects is 200 000 euro. At least 20% of the project should be financed by the project organisation or enterprise. The ‘own contribution’ can be in cash or in kind, or even gained through sponsoring or through revenues based on the project.
Besides, projects should indicate maximum five attitudes or competences they want to stimulate with the project amongst the list below82.
Table 8.4 Attitudes & competences to be developed
The 14 attitudes & competences Analytic competences Perseverance
Assertiveness Pro-activity Capacity to learn Reliability
Commercial insight Risk attitude Communication techniques Self-confidence
Financial knowledge Sense of initiative Flexibility Sense of reality
Independency Sense of responsibility Management Capacity Stress resistance
Market oriented thinking Technical knowledge Organisational skills Others
Selection criteria
Receivable projects, that met the formal conditions listed above, were selected based on the content of the services offered to potential Gazelles. The selection took place on the basis of eight non-weighted criteria based on two sets of criteria: a set linked to the quality, a set linked to the content.
Five selection criteria were based on quality:
1. The societal added value generated by the project:
2. Are new development foreseen, not in place actually and are these developments sufficiently developed?
3. The transferability of the realised knowledge.
4. Which activities are foreseen to disseminate and implement the results? How will the media, including new media, be used for this goal? Which launching and closing events are foreseen?
5. The competence of the project organisers
6. To what extent the organisation, and the responsible persons, have they experience with this kind of projects? How are the different tasks organised?
82 Based on the limitative list integral part of the call.

117
7. The efficient use of funds
8. How big is the private contribution in the overall budget? What is the expected output in relation to the budget?
9. The level of collaboration with other actors
10. What other organisations will be collaborated with and how this collaboration will be structured?
On content, three criteria have been retained:
1. The extent to which the project fits into the specific objectives. These objectives concern the development of Gazelles as explained above.
2. The innovative character of the project. Innovation has to be understood as something new within the organisation. The project-idea can hence be based on a project already developed elsewhere
3. The methodological approach. How do the different components of the project collaborate to the global objective?
Results: nine pilot projects retained
Based on the criteria, the projects were ranked83 and the best ranked were retained based on the budget possibilities. As a result of this process, from the thirty projects introduced, nine have been selected, involving direct support for in total 170 enterprises.
Out of the intermediates, four are semi-public (three employers’ organisations and one competence pool), two non-profit organisations (BAN & Tango), two are private consultants (senior consultants, BECO) and one intermediate is a university (Antwerp).
Most of the projects started in 2011 and will run until the end of 2012. Each project has a total budget between 200 000 and 250 000 - the latter being the maximum - with a subsidy of maximum 80%. The average subsidy per project is 166 000 euro.
In terms of targeted companies, one should note that two projects – the Groeigazellen (BANVlaanderen) and the creative jumpers (Management School Antwerp) – count for almost half of number the target companies. This makes the Gazellensprong rather vulnerable, at least in terms of the number of companies to be coached. Moreover, it implies that the support to companies varies a lot from one project to another. Let’s look to those projects in more detail. In this context, and in order to better understand the different projects, a short description of the project organiser will be given before entering into the project.
83 Each criterion was marked from 1 to 5; from insufficient to excellent.

118
Table 8.5 Overview of the nine Gazelle projects
Project Intermediate Service offered Geographical scope Companies involved
Groeigazellen BAN Vlaanderen Coaching 2 provinces (Antwerp & Limburg)
30
TanGo Strategisch platform Kempen
Competence training
Part of the province of Antwerp
20
Growth VOKA West-Vlaanderen Support for the making of the growth plan
One province (West-vlaanderen)
20
Growth coach Unizo Limburg A swot analysis of the company
One province (Limburg)
15
Born global Voka Oost-Vlaanderen Individual coaching and training program
One province (Oost-vlaanderen)
10 to 15
The second phase Senior-consultants (organisers of bootcamps)
Development of new business activity through a bootcamp
Flemish region 10
Creative jumpers Management school Antwerp
Management training for managers in the design sector
Flemish region 50
Business Model Innovation
BECO Development of a new business model
Flemish region 3 to 5
Growth for design management
Flanders In Shape Strategic support for quasi-gazelles
Flemish region 8
Description of the projects
Groeigazellen (Business Angel Network Flanders)
The project organizer:
The Business Angel Network Flanders was a merger of the previously five existing business angel networks of the Flemish region. The merger was a condition to be further subsidized by the Flemish Government. BANVlaanderen is a not for profit organisation. The network has gained maturity and became the reference in Flanders for companies looking for a business angel to invest in their company.
The project:
Gazelles can take advice from successful entrepreneurs. Those coachers are member of the Business Angel Network and have a similar profile as the potential Gazelle. Besides the individual coaching, group activities such as info sessions, panel discussions are foreseen. The focus is on non-financial issues such as human resources, management capacities, organisational issues and intellectual property rights. A book will be published with the output of the project.

119
Tango (Strategic Project organisation Kempen)
The project organizer:
The Strategic Project Organization Kempen is a not for profit organisation aiming at developing the region of the Kempen, part of the province of Antwerp, as a region to life, to work and to enjoy. Therefore the objective of the organisation is to develop a knowledge-based, innovative and environment-friendly region.
The project:
This project, called Tango, standing for Target – Action – Growth, focuses on strategic coaching of enterprises, and in a second time set up external advisory boards on company level. It focuses on four chronologic modules: financial audit, strategy development, strategy implementation and strategy monitoring. An experienced mentor will give individual and six group sessions based on gathering knowledge.
Growth! (Voka West-Vlaanderen)
The project organizer:
Voka is the Flemish network for enterprises representing around 16 000 companies in Flanders and Brussels. The organisation is a result of a merger between the Flemish Chambers of Commerce and the Flemish economic alliance (VEV standing for Vlaams economisch verbond). Those companies account for 65% of the private jobs in the region. Voka defends the employers’ interest and aims to create a optimal environment for enterprises and entrepreneurs in Flanders. Beside their headquarters (in Antwerp), they are represented in every province. The project organizer is one of this provincial units; namely West-Vlaanderen.
The project:
Growth! foresees support to companies that are or might enter at the short term in a growth phase. The support will be focused on the growth plan whereby the gazelles will be coached by a ‘dream team’, composed of five experts having each of them a specific knowledge. The fields of competence are: sales; finance, organisation, human resources, and internationalisation. Besides, two experienced coaches, namely entrepreneurs who managed a growth company, will share their experiences with the group. Through an e-platform exchange between the participating companies will be facilitated.
Growth coach (UNIZO Limburg)
The project organizer:
UNIZO is the union of independent entrepreneurs and has 85 000 members being companies, entrepreneurs, SME’s and professionals. In number of members UNIZO is the biggest organisation. UNIZO defends the interest of its members, give advice, training and organises networking sessions.
The project:
Growth coach, mainly focused on small companies, will assist potential growing companies in two phases. First a scan of the company will be made which will be the basis of a SWOT analysis. Based on this scan, a growth plan will be developed and a one-day training a month will be foreseen. Besides, a growth coach platform, which is at the same time a reflection and evaluation group, manages the project. A

120
growth coach book will be published at the end of the project, collecting best practises. If the project is successful, UNIZO will develop the project in all provinces by appointing a growth coach in every province.
Born Global (VOKA Oost-Vlaanderen)
The project organizer:
Voka, the Flemish network for enterprises, is managing the earlier discussed ‘Growth!’ Project as well. The project organizer for the ‘Born Global’ project is one of the provincial units; namely Oost-Vlaanderen.
The project:
Within ‘born global’, the companies will have a group training including all aspects of internationalization. These sessions will be organised together with a consultant (Deloitte), with the innovation centre Oost-Vlaanderen and with Flanders Inshape (see below). Afterwards, successful growers will be put into the picture through the press and own media in order to inspire other companies. Second part of the project is a scan whereby a swot analysis will be made of the company in relation to their capacities for internationalisation. A committee of experts will give advice on the innovation and internationalisation capacity.
Second-Phase
The project organizer:
The second phase is a private company composed of two private senior consultants, having an experience in the field of intrapreneurship. They consulted over 35 teams on how to develop the concept of intrapreneurship in their company.
The project:
The first phase of creative entrepreneurship is generating ideas. This project focuses on the second phase, namely evaluating the ideas on their business potential. Companies with a not yet developed business idea will be put together into a bootcamp in order to develop the idea and to translate it into a business plan. The project will develop intrapreneurship and accelerate the internal dynamic innovation culture.
The individual coaching takes place in four phases:
• Preparation phase: the criteria for new business opportunities are clarified. Enterprise get insight in their innovation capacity, the innovation climate and starts a strategic dialogue on how to develop innovation;
• Mobilisation phase: ideas with potential will be developed. For each idea retained, a team will be composed of three to five persons that will develop the idea;
• Entrepreneurial bootcamp phase: the team will be taught by the top management schools of Flanders on how to translate their idea into a business plan. A final public presentation of the case in front of a jury, composed of financial experts, marketing specialists, etcetera will allow a decision on the feasibility of the idea;

121
• Incubation phase: for retained ideas, financiers will be mobilised, market studies will be finalised and the first prototypes will be developed.
The second phase project aims to change the passive entrepreneurial mentality towards a pro-active
entrepreneurial mindset
Creative Jumpers (University Antwerp)
The project organiser:
The Antwerp Management School give training to managers and future managers from private companies, from public services and from the non-profit sector. The Antwerp Management School is fully integrated in the University of Antwerp84.
The project:
This project focuses on the creative sector. Indeed, a study shows that 66% of the projects in the creative sector that are looking for money don’t have a business plan. Young gazelles from the creative industry will be assisted in their growth strategy through two bootcamps. The business plan will be presented in front of a jury. Ten results of the bootcamps will be published in a casebook, in order to inspire other entrepreneurs from the creative sector.
Business Model Innovation (BECO)
The project organiser:
The BECO Group is an international advising organisation focused on sustainability. In Belgium the company is mainly active in topics such as eco-efficiency, energy, industry and sustainable development. Responsible entrepreneurship and respect for stakeholders is their core business
The project:
The aim of the project is to develop a sustainable strategy based on stakeholders’ value. Five heterogeneous test cases will be developed in order to demonstrate how sustainability can be included in the business model. The focus is on three types of SMEs: the first target group are SMEs with a non-differential product; the second group are SME with a very short product life cycle and the third group are the high-tech companies. Based on these test cases the market position and the business model of the companies will be adapted.
Flanders InShape
The project organiser:
Flanders In Shape is a competence pool for product development and industrial design. It’s collaboration between Industry Flanders, specialised centres of knowledge, university colleges and some private companies. 84 To make the picture complete, Flanders has two business schools: the Antwerp Management School and
the Vlerick Business school. The latter is independent from universities and is mainly active in Ghent and Leuven. The Vlerick business school manages since years a privately financed growth program, called IGMO (see below).

122
The project:
Selected companies will be explained in workshops how designmanagement works in practise. Three topics are considered: brand management, stakeholder satisfaction and enterprise culture. After the theory sessions, the consultants will develop an application in the enterprise whereby the opportunities of each company will be detected.
Strength and weaknesses
As most of the projects run until the end of 2012, it is only by the end of 2013 that one might expect results from the first ex post evaluations. Therefore, this SWOT analysis is only based on the conception and first implementation of the scheme. We will consecutively analyse the awareness impact, the selection mechanism on intermediary level, the selection mechanism on company level and the delivery mechanisms.
Awareness
The project will surely create a lot awareness amongst the different actors on the importance of gazelles and the necessity for a prosperous region like Flanders to take structural measures in order to cope with the identified barriers to growth by reforming the labour market, cutting red tape and further develop the financial instruments. Given that the different projects organises launching and closing events, the project will surely succeed in sensibilizing the region for the importance of Gazelles. It’s worth nothing that since many years the leading economic magazine of Flanders (Trends & Trends-Tendances) organises yearly and in every province events with the best Gazelles of each province and publishes the Top 500 gazelles of the year. The pilot projects, and the event organised in that context, contributes to the further awareness of the importance of Gazelles. The objective of creating awareness will be largely achieved.
Selection of the intermediaries
The selection of the intermediaries has been done on Government level. Criteria for selection have been determined and published in the call. Out of the thirty projects, nine have been selected. We consider is as a good approach to retain so many projects. One could have imagined retaining only a few. By retaining different projects, the Gazellensprong offered a wide entry road for the different Gazelles, lowering hence the barriers to access.
The multitude of projects retained did not only allow to test different approaches, but increased competition amongst the different projects which in turn can have a positive impact on their efficiency. Moreover, a huge program focused on Gazelles and growth already exists since years in Flanders, organised by the Vlerick Business School, called Institute for Growth Management (IGMO). The project is now dealing with its eight generation of potential growers. Participants have to pay to participate. The organization is mainly financed through sponsorship of private companies. As this IGMO project was considered very accurate, based on the IGMO bench, a similar project was set up in Wallonia called Académie de Croissance (ACE). The fact that now the offer of coaching services towards Gazelles will be enlarged will set this existing scheme in a more competitive position and break its quasi-monopoly position.
It is of course plausible that within the non-retained projects, potential interesting approaches will be lost. Moreover, we see, that probably the ‘geographical spread’ has been used as non-announced selection criteria. For five projects, which have a less than regional scope, a subregional equilibrium exists enabling every province to have a project. This subregional equilibrium may imply that not always the most efficient proposal has been retained. At the same time, this approach that no province is left behind.

123
Selection of companies
While the characteristics of gazelles can relatively easy been identified, the target firms for an action is much harder to define. Indeed, one should focus on potential Gazelles. But what is a potential Gazelle? This is of course the tricky issue.
Potential gazelles could be identified based on their characteristics described above. But is the government better placed that the market to determine what company is a potential gazelle, and what company isn’t. Alternatively, the selection can be delegated tot the intermediaries. In that case, clear selection criteria should be adopted.
Indeed, studies have been realised looking for accurate definitions on Gazelles but in order to avoid bureaucracy, selection did not happen on Government level. In the case of the Gazellensprong, the selection issue has not been solved on Government level. No criteria were retained for the selection in the call. The target group is hence quite vague. The call only mentions that the focus would be on growing enterprises.
At the same time, the Gazellensprong did reduce the risk of ‘missing the target’ by transferring the selection process to the intermediates. As we have seen before, for the selection of those intermediaries, selection criteria have been established and used. Moreover, by assuring heterogeneity in the type of intermediates, a multitude of potential entry routes was offered to the potential Gazelles. The use of intermediaries might generate management and training products that are close to the real needs of the firms, as the intermediates are all involved in the business communities, much more that the government officials are. Moreover, we can assume that the coaching will be delivered in a more flexible way than if the programme were directly implemented by the government.
We consider that by focusing the selection on the intermediates, a subtle solution has been found to cope with the trade-off between bureaucracy, in case of Government selection of strict selection criteria, and danger of missing the target, in case of total absence of selection criteria. So, it is up to the nine project organizers to identify and select the companies benefitting from the coaching, with a certain freedom in order to identify these companies85.
The selection depends hence on the professionalism and objectivism of the selected intermediaries. The ex ante studies can be a guidance to the intermediates for the selection and the setting up, eventually, of selections criteria for the companies. The fact that these intermediaries are close to the business community, gives the advantage that they know the target companies.
There might however be a danger that some companies could benefit from the programme simply because they have very good connections with the intermediate organization. In quantitative terms participation at the Gazellen growth is indeed for the happy few. Amongst the growing firms 170 have been selected. The total number of Gazelles is hard to determine. A study estimated the total number of Gazelles at 2100, or 4% of the total enterprise population in Flanders86. This means that if the pilot project is fully realised, 8% of the Gazelles are considered.
In this context it is interesting to note that the intermediate can decide if participating companies have to pay or not. Some projects opted for free access others decided to make companies pay for the coaching
85 We refer to the concrete analysis of Tango for an illustration of this 86 Durven Groeien in Vlaanderen, Steunpunt Ondernemerschap, Trends Business Books, 2007, p. 71

124
services. For Gazelles that are not part of the Gazellensprong, they can have access to another grant scheme such as the KMO portfolio that finances half of the costs. Even for projects who opted to let participants pays, fees are very reasonable and do not reach the level for instance applied in the Dutch approach whereby participating companies have to pay 54 000 euro when then want to participate to the growth accelerator program. The advantage of the Dutch system is of course that only very motivated companies will participate. On the other hand, for small company, this level of fees might be an obstacle. It’s our opinion that coaching services should better not be completely free, but be fixed at a reasonable level. Companies accepting to pay a fee are convinced of the added value of coaching and will invest, besides money, time which is an essential condition for the coaching to succeed.
The ex post evaluation of the different projects might lead to a better insight of what the potential Gazelles really need and might allow to fine-tune the selection criteria and the policy measures to be taken in the future. Finally, the non-sectoral approach seems to be the right one for a policy focused on the development of Gazelles.
Delivery mechanism
The heterogeneity of the intermediates can be positive, as different approaches will be tested. The delivery mechanism through nine different channels however seems complicated and for potential beneficiaries, in absence of published selection criteria on intermediary level, it will not always be easy, due to the lack of transparency, to identify the most suitable project. Moreover the sub-regional division of the delivery mechanisms might create a negative selection argument whereby local imperatives become more important than the objectives of the program.
Nevertheless the pilot project could enhance other companies, not retained, to appeal on caching. The KMO Portfolio, which is a kind of voucher scheme to buy advice, allows Gazelles to buy coaching services. In this would happen the Gazellensprong would achieve its goal well beyond the participating companies.
Monitoring and impact estimations
Concerning the monitoring, evaluation and impact issues, we will each time analyse the topic on project level and on the level of the Gazellensprong as a whole.
Monitoring
1. On project level
Each project has to set up a steering committee, which is responsible for the monitoring of the content. For projects lasting longer than one year, an intermediate report should be made, including: explication of the results of the project, financial statements, eventual re-actualization of the objectives and work plan for the second year. At the end of each project, accounting documents, a detailed report and an evaluation of the project has to be made showing that the objectives of the project have been realised.
2. On the level of Gazellensprong
A platform was set up to monitor and follow the projects. The platform is composed of the different ministries and public agencies: ministry of economics, subsidy-agency for economics, agency for the promotion of export, agency for the promotion of innovation and the agency for the financial instruments. The platform gathers twice a year.

125
On a yearly basis, an inventory is made of all the projects based on the interim report. At the end of 2011, the state of play was as follows.
Table 8.6 State of play of the nine Gazelle projects
Project Intermediate Target Companies involved
State of play (end 2011)
Groeigazellen BAN Vlaanderen 30 17 TanGo Strategisch platform
Kempen 20 17
Growth VOKA West-Vlaanderen 20 17 Growth coach Unizo Limburg 15 15 Born global Voka Oost-Vlaanderen 10 to 15 15 The second phase Senior-consultants
(organisers of bootcamps)
10 7
Creative jumpers Management school Antwerp
50 Will start in 2012
Business Model Innovation
BECO 3 to 5 4
Growth for design management
Flanders In Shape 8 8
Total 58% achieved 170 100
Source: Flemish Agency for Enterprises, (2012), Activity report 2011
In total, based on the activity report, out of the target of 170, 100 were in a coaching process by the end of 2011, or 58% of the target. However, the creative Jumpers program confirmed they have realised their project and finalised it in august 2012.
The monitoring considers, unfortunately, only the number of companies coached. No other quantitative indicators are set out upfront. One could have imagined, although it is not easy, that targets would be set out in terms of turnover or employment growth of the coached companies.
Evaluation
An in-depth evaluation is foreseen for each of the projects at the end of the program (2013). The final objective is an evaluation and reorientation of the global action plan. As the objectives are rather on the long run, this global evaluation will only take place after a certain period in order to be capable to have sustainable results.
Based on the experience and the ex post evaluation of the nine projects taking place in 2013, the steering platform will propose further suggestions for the policy linked to high growth potentials for the period 2014 - 2019 when the next Flemish government will be in place. As it stands, on the basis of lessons learned from these pilot projects the idea is to develop, besides the general framework conditions, two different policies, one focused on the high potential growers and one on the average growers.
Impact assessment:
The different projects are quite heterogeneous, but most are focused on coaching and business plans. The awareness around the program might trigger other companies to appeal on coaching. The pilot project might fine-tune the different mechanisms of coaching and lead to a benchmarking of coaching approaches.

126
Of course, one should realise that the action doesn’t involve big money. The average amount of intervention by beneficiary is 8500 euro. Out of this amount, overhead and administrative costs at the level of the intermediaries will be paid. So the real additional amount for each beneficiary becomes rather low. Nevertheless, the multiplier effect on non-participating companies and the impact of strategy towards growth amongst the participating companies could lead to good value for public money.
There is a danger that existing structures delivers their classical services to enterprises, but are now partly subsidized for doing so. For example, three out of the nine projects are run by employers’ organisations which core business it is to coach enterprises. One might wonder if the project is really additional to their existing activities or will only provoke a switch in priorities of the target group. Therefore, the real additionality of the project could be limited, both in budget terms and in quantitative terms. As no quantitative indicators, beside the number of companies to be in the target group, are set out, it will be hard to analyse if targets in terms of turnover or employment growth of the coached companies have been achieved and if the additionality principle has been fully respected.
Benchmarking and best practise
Within the framework of this study we can of course not make a detailed analysis of each individual project. However, in order to illustrate or test our general conclusions, we will go in depth into one of the projects. The seven elements considered below can, in our opinion, be considered as benchmarks at project level. As the Tango project scores very good on these criteria, we can consider it as a best practise.
1. The organisation is self-supporting. The organisation running the project is fully project-financed without any structural funding or membership fee model. The organisation has hence to prove on a permanent basis its added value. Therefore, it is logic that companies have to pay to be part of the scheme, which is, as we stated before, the first best option. We consider the level of the fee, fixed at 4500 euro, reasonable.
2. The management of the intermediary is entrepreneurial. Indeed, the manager is seconded by, and paid by, a big company. Companies such as Philips, BNPParibas and Alcatel succeeded in seconding consequently the manager, in principle for a period of three years. Managers are hence enterprise minded and have a enterprise experience which they use for the benefit of the companies of the region for a couple of year, before reintegrating their ‘mother’ company.
3. The intermediate has a proven experience in coaching and is regionally very encored. The coaching process is identified in ten, accurately described, steps: from analysis to implementation.
4. High standards are put on their coaches. Their great network and expertise allows them to be selective and put high standards on their coaches. The coach profile has to match with the company profile.
5. Selection criteria for companies are well developed. Three criteria, in order of importance, are retained for the selection of the companies:
1. Personality and drive of the entrepreneur. This criterion is judged by looking at the growth ambition, the vision on the future, the openness for collaboration, the capacity to delegate and the growth in terms of employment;
2. The growth potential of the company. This criterion is measured by looking at the concrete growth projects, the organisational structure, the insight in market tendencies, the commercial approach and the HR approach;

127
3. The track record. This criterion is measured in terms of turnover growth, level of investment, internationalisation and increase in personnel.
6. No sector preferences or sector priorities are retained. Companies are both industrial, service linked and even from the agriculture sector.
7. Permanent evaluation takes place at company level. First evaluation results show that:
1. The process should be kept simple and focused on strategy;
2. The coaching should not be considered as a deus ex machina. So it is important to say from the beginning what one can expect from the project and what should not be expected from it;
3. The involvement of the personnel is crucial for tapping the growth potential;
4. The coach becomes a real confidence person and is consulted on very heterogeneous matters.
Two examples of companies have been selected to show the impact of the project on company level (see boxes).
Box 8.1 Garden architecture
Name of the company: Garden architecture Wim Verrezen Ltd
This company, active in conception, creation and maintenance of gardens and swimming pools realised through the Tango project a strategic plan. The coach was an ex-entrepreneur. The company installed an external advisory board whose focus is to follow-up the agreed milestones. The manager decided, based on Tango, to recruit two personal collaborators, one on finances, on as his backup, allowing him to focus on commercial issues. The last three years the turnover increased by 80%, although the turnover was in a negative trend just before entering the Tango project. The company staff grew from 9 to 16 in four years time.
Box 8.2 Lab
Name of the company: Lavetan Ltd
This company is an independent lab working for the food industry, the industrial animal production and the pharmaceutical industry. The company has focused on customer oriented process innovation and customer intimacy. The development of the USP in that field allowed the company to create a big market share in their home market (25%). Based on the Tango process, the manager delegates parts of the operational aspects in order to focus on strategic matters. The turnover has risen by 15% in three years, but more important, the financial indicators are looking significantly better. The staff increased from 29 to 40.
Conclusions
In relation to the specific action towards Gazelles, the difficult issue remains to identify Gazelles, and especially potential Gazelles. Of course in the setting up of such a policy, one should avoid red tape and use as much as possible monitoring and evaluation tools. A too bureaucratic definition of a Gazelle might create supplementary red tape and could make the high potential growers reluctant to participate. On the

128
other side of the spectrum, the total absence of selection criteria implies a high risk of missing the target. So, there is a trade-off between bureaucracy and danger of missing the target.
In the case of the Gazellensprong, the tricky selection issue has not been solved on Government level. Although the ex ante study tried to define what a Gazelle or a potential Gazelle looks like, no criteria were retained for the selection in the call. In the call, it’s only mentioned that the focus is on growth. In this way they avoided the pitfall of bureaucracy.
At the same time, the Gazellensprong did reduce the risk of ‘missing the target’ by focusing the selection process at government level on the intermediates. By assuring heterogeneity in the type of intermediates, this offered a multitude of potential entry routes for the potential Gazelles. Moreover, the use of intermediaries generates management and training products that are closer to the real needs of the firms and are delivered in a more flexible way than if the programme were directly implemented by the government. By focusing the selection on the intermediates a subtle solution to cope with the trade-off between bureaucracy and danger of missing the target seems to be found.
The efficiency of the Gazellensprong depends hence on the goodwill of the nine project organisers. But here again, the fact that there is a certain competition between those intermediate actors could be a push for the beneficiaries to be efficient in the implementation of the projects. In addition, already existing ‘good practices’, such as the Growth project run by the Vlerick institute, can be pushed to increase their competitiveness as for potential Gazelles interested in coaching different options are now available. Indeed, before the Gazellensprong the coaching market was a quasi-monopoly with all potential inherent inefficiency dangers.
However, in order to enhance the efficiency gains due to an increased competition, the Gazellensprong should define more the impact indicators, and not limit them to the number of beneficiaries, but set out targets in terms of employment, turnover and profit growth.
In evaluating the scheme, we must take into account that the pilot scheme reaches only eight percent of the gazelles selected to receive one or another form of coaching. This implies that the macro-economic impact of the scheme will be limited. However, the general awareness created through the Gazellensprong and the trigger effect on non-participating companies can lead to a multiplier effect. Indeed, many potential Gazelles may be seduced by the program and may be motivated to appeal on coaching services. As the Flemish region has a voucher system, called KMO-Portfolio, Gazelles not being part of the Gazellensprong, could apply for grants within this scheme. In that sense, the Gazellensprong can be considered as a real pilot scheme complementary to the demand driven voucher system. Therefore, one can assume that giving subsidies of 1,5 million euro spread over 170 companies, or an average of 8 500 euro per company, is at first sight a very small amount, but could deliver good value for public money.
Of course, we have to wait for final evaluations - expected by the end of 2013 - to see if the results of the pilot schemes are useful to be further explored in the elaboration of an enterprise policy focused on fast growers. This evaluation should take into account that the efficiency of a Gazelle focused policy will largely depend on a Gazelle entrepreneurial-friendliness of the society. The elements that create the favourable humus for the creation and development of Gazelles are widely known, i.e. access to (big) capital; sufficient, qualified, motivated and affordable human resources; limited red tape; smooth regulation and flexible hire and fire procedures.

129
Summary of main findings
1. The main advantage of the Gazellensprong is that it creates awareness about the importance of Gazelles. This is particularly relevant in a region depending on a huge public sector and large traditional industries.
2. The developed approach is not sector based, which is the best option to promote Gazelles.
3. By focusing the selection on the intermediates, a subtle solution has been found to cope with the trade-off between bureaucracy and danger of missing the target. The analysed example of Tango shows that this approach can work on the field.
4. Existing initiatives could be pushed to gain in efficiency given that a more competitive market is created for coaching services for Gazelles.
5. Specific Gazelle-focused programs should go together with more generic enterprise policy creating a prosperous context for Gazelles. The different competences levels do not facilitate the setting of a coherent framework.
6. The impact indicators should be more detailed and go beyond the number of enterprises.
The ex post evaluation, scheduled for the end of 2013, could deliver nice insights in the best way of coaching potential Gazelles. This element can be very interesting for countries considering to set up or to ameliorate coaching schemes for high growth potentials.
Transferability
The approach could easily be transferred to other countries. The lesson to be learned from the Gazellensprong is how to find a subtle midway between bureaucratic ex ante criteria and avoiding to ‘miss the target’ in of total absence of selection criteria.
When using the Groeigazellen as a bench, more attention should be given to set up and monitor quantitative indicators related to output in terms of employment, growth and turnover. This needs to be further explored whilst transferring the initiative. Besides, it could be useful before launching such an initiative, to make an in-depth inventory of the already existing initiatives, public and private, linked to the development of Gazelles in order to see how they can be integrated or ameliorated, and what the real supply gaps are.
The most important element for benchmark will probably be based on the ex post evaluation that might suggests the best method of coaching for potential Gazelles based on the nine experiences. Moreover, this evaluation could compare the supply-driven approach by the Gazellensprong with the demand driven approach for a voucher-based intervention. Probably both approaches should go together as is the case in Flanders.

130
References
Aernoudt, R. (2012), Financieel Management toegepast (Corporate Finance), Intersentia.
Aernoudt, R. (2009), Wallonia as bench for promoting entrepreneurship, in OECD, Compendium for entrepreneurship.
Aernoudt, R. (2003), European Enterprise Policy, Intersentia, New York - Cambridge.
Bains & Cie, (2001), How to improve the Growth Potential of Belgian Companies.
Birch, D. (1997), US Summary Corporate Change Tables, US Department of Commerce.
Birch, D. (1987), Job creation in America: How our smallest companies Put the most people to work, New York.
Durven Groeien in Vlaanderen, (2007), Steunpunt Ondernemerschap, Trends Business Books.
Flemish Agency for Enterprises, (2012), Activity report 2011.
EIM, (2008), High-Growth SMEs Evidence from the Netherlands.
Flemish Agency for Enterprises, (2010), Growth companies in Flanders.
GLE, (2008), Greater London experience in investment-readiness, DTI report.
Lambrecht, J. (2002), Heeft meer dan 70 jaar KMO beleid de KMO’s gediend?, EHSAL.
Vandenbogaerde, S. (2009), The use of procurement for the stimulation of innovation, University Ghent.World Economic Forum, (2009), Competitiveness Report.

131
CHAPTER 9. GERMANY'S HIGH-TECH GRUNDERFONDS
Introduction
The High-Tech Gründerfonds (HTGF) was first introduced in 2005 with the aim of financing young technology- or innovation-oriented companies that are burdened with serious (technological- or market-related) risks because of their early phase of development (“liability of newness”, “liability of smallness”). In doing so, the HTGF is pursuing the overall national objective of stimulating the seed financing or “early-stage” financing market in Germany and improving the financing conditions for technology-oriented start-ups in a sustainable manner. Although not explicitly formulated as an objective, the HTGF can nevertheless be characterised as a “high-growth” initiative or a programme which focuses on firms with growth potential because the selection process takes into account features of the firm or the business concept that provide evidence of certain growth potentials. Thus, by concentrating on a relatively small number of promising business concepts and ventures – compared to the overall number of firms in Germany – and by pursuing a strategy of “picking winners”, the HTGF is able to combine various objectives, namely improving the framework conditions for seed financing of young high-tech companies, supporting innovation and technological development and contributing to growth, competitiveness and employment.
In the narrower sense, the HTGF can be described as a public-private partnership with the German Ministry of Economics and Technology (and thus the state) as the main investor or stakeholder, followed by the KfW (German government-owned development bank), and several, mostly large, private German companies. In the first phase of the HTGF, from 2005 to 2011, €272 million were invested (Gründerfonds I). The second phase started on 27 October 2011 (Gründerfonds II) with funds of €288.5 million. Again, the main investor is the German government with €220 million, followed by the KfW promotional bank with €40 million. With twelve private sector companies like BASF, Bosch, Daimler, Deutsche Telekom, Deutsche Post DHL, RWE, etc., the Gründerfonds II now boasts twice as many private investors as during its first phase.
The HTGF is integrated into a wider entrepreneurship/SME and innovation strategy of the German government. The HTGF is mentioned in the “High-Tech-Strategy for Germany”, initiated by the government, and the SME-Initiative of the Federal Ministry of Economics and Technology (BMWi) “Auf den Mittelstand setzen: Verantwortung stärken – Freiräume erweitern” (“Building on SMEs: greater responsibility – greater freedom”) under the topics entrepreneurship and innovation financing. The HTGF is considered to be an important part of the BMWi’s support for entrepreneurs. Within the broader technology and innovation policy of the BMWi, the HTGF is also mentioned as being crucial to support innovation and growth by bridging the financing gap in the early start-up stage of new companies (“Neue Initiativen für ein technologiefreundliches Deutschland” – “New initiatives for a technology friendly Germany”). However, given the significance of the HTGF, its share in the overall national entrepreneurship/SME/innovation policy is relatively small when taking into consideration fields of intervention like SME investment support, innovation support (e.g. “Central innovation programme for SMEs – ZIM”), start-ups from science (“EXIST” as a infrastructure measure) and other initiatives.
The main rationale of the HTGF is to close the financing gap in the early, high-risk phase of new or young technology-oriented companies and to create jobs based on the assumption that the High-Tech Gründerfonds selects promising companies with high growth potentials. Providing start-ups87 with seed
87 The terms „start-up“, „firm foundation“ and „young companies“ are used as synonyms in the report and
comprise all companies operating less than 12 months; same applies to „founders“ and „entrepreneurs“.

132
capital aims to finance R&D projects, which result in prototypes or “proof of concepts” or a commercial launch. Furthermore, special advice and management support are provided via (“hands-on”) coaching services. Another objective of the HTGF is to safeguard the follow-up investment after the first 12-18 months in which the HTGF acts as the main investor. By introducing young companies to follow-up investors (which also include the HTGF but no longer as the main investor), the HTGF helps to stimulate the seed money market in Germany.
The programme design is based on the assumption that there is a market failure in the seed phase of high-technology companies in Germany which results in an investment gap as profit-oriented VC companies or informal investors like business angels tend to shy away from taking technology and market risks in this particular phase. However, the rationale and design of the HTGF envisages the market failure to be eliminated accordant to market principles. This is why the programme has been designed as a public-private partnership with important companies as stakeholders, which guarantees market conformity at the same time. Basically, the HTGF acts like a private VC company, but is much more risk oriented (however, the HTGF has no guidelines regarding the return-on-investment).
In line with the above mentioned main objectives, the HTGF has elaborated a system with quantitative and qualitative objectives. The most important objectives are to:
• create assets,
• acquire follow-up investments,
• generate returns.
The following five general principles have been formulated (“Leitbild”):
• The High-Tech Gründerfonds will stimulate the market for seed financing in Germany
• The High-Tech Gründerfonds finances young technology-oriented companies with a reasonable chance/risk profile which are – due to their early development phase - still afflicted with high risk
• The High-Tech Gründerfonds operates in a client oriented manner, efficiently and professionally in line with managerial criteria
• The High-Tech Gründerfonds is cooperative and relies on networks and partnerships
• The staff see themselves as a team working independently, faithful and respectful.
Regarding the quantitative objectives, concrete investment objectives have been formulated: 40-50 seed investments per year are planned, which is equivalent to €16-22.5 million. No quantitative specifications have been set concerning the return on investment. Given the fact that only 200-400 start-ups in the high-tech sector possess high growth potentials, the quantitative objectives appear to be realistic (10-20% market share of the HTGF in the seed financing segment).
As the HTGF is a national programme – initiated by the German government and therefore pursuing national objectives - the geographical outreach of the programme is nationwide. The programme has no spatial priorities in terms of a geographically balanced distribution of the portfolio firms or in terms of targeting firms in lagging regions. However, in line with the settlement structure in Germany, most of the high-growth start-ups are in densely populated urban regions (e.g. Munich, Stuttgart, the Ruhr-Valley, Hamburg, Berlin, Dresden, the Rhine-Neckar Triangle). The only geographical dimension in the funding

133
rationale relates to the share of equity to be realised by the companies, which amounts to only 10% in the East German regions compared to 20% in West German regions.
Beneficiary (client) firms
The High-Tech Gründerfonds focuses on young, technology-oriented companies which carry out one or more R&D projects. As a rule, the companies are younger than 12 months (with operating activities) and have already been formally founded. There are some exceptions where the companies have not yet been founded but a business plan (and a concrete business idea) already exists. Regardless of the formal establishment of the company, the financing period is less than 18 months. The HTGF invests seed capital solely in limited liability companies (predominantly GmbH). Liability is therefore limited to the company’s assets and the founders do not have to provide security.
Table 9.1 Structure and portfolio of the HTGF according to industries and technology fields from 2005 to May 2012
(280 shareholdings, €188 million investment volume)
Industry Shareholdings Share (%)
Examples
Software as a service 73 26 Media, gaming, industrial software
Application software 22 8 Embedded, mobile & system software
Internet, e-commerce 25 9 Internet & Web 2.0 software
Biotechnology, pharmaceutics
31 11 Health care, drug development, diagnostics
Medicine technology, diagnostics
45 16 Diagnostics
Automation, electronics, cleantech, enabling technologies and others
84 30 Microelectronics, sensor technology, energy, environment, new materials, chemical technologies, optics, manufacturing technologies
Total 280 100
Source: Homepage of High-Tech Gründerfonds (http://www.high-tech-gruenderfonds.de)
Table 9.1 shows the current priorities regarding the sectoral or technology distribution of the HTGF portfolio companies. Although the distribution indicates that certain priorities clearly exist, the programme does not formally target specific sectors. The figures represent the selected portfolio firms and therefore the segment of start-up companies with high growth potential rather than the real distribution of firms in Germany. As a single industry, ICT – software and internet/e-commerce - is by far the most important segment for HTGF seed investments: 43% or 120 shareholdings are in application software, software as a service and internet/e-commerce. Industries or technology fields like automation, electronics, cleantech, enabling technologies, etc. account for 30% or 84 of the shareholdings. Looking at the age bracket of the client firms, the HTGF provides seed financing to start-ups younger than 12 months.
Given that the programme invests in only a relatively small number of companies, those with the potential to grow (rapidly), the selection process is crucial for the programme’s success as well as the success or development of the portfolio companies. In order to analyse and assess the business idea, a transparent four-step process has been developed prior to the investment decision. A central element in this selection process is the business plan, which needs to be submitted to the High-Tech Gründerfonds and serves as the main document for further decisions. Assistance with finalising the business plan is already

134
provided in this particular phase. If no business plan has been elaborated, a draft concept with the entrepreneur’s business idea can also be submitted to the HTGF. Once the business plan or draft concept has been positively evaluated, the HTGF offers the company a “Term Sheet” outlining the investment terms. “Due Diligence” is undertaken once the term sheet has been signed. The company’s concept is analysed in detail in this phase. The following investment criteria are used to evaluate the business concept:
• Technology orientation
− Company is based around a technological innovation (close to proof of concept)
− Technological knowledge and expertise is a core component of the company
− Protected patent rights and other intellectual property are exclusively and unreservedly available and incorporated to the company
• Market perspective
− Clearly recognisable customer benefits
− Distinctive, unique selling features and strategic competitive advantages
− Major market entry barriers for competition
− Target market with a significant volume and/or high growth potential
− Financing will enable the company to achieve key milestones on route to market or towards further investment
• Key characteristics of the company team
− Know-how and complementary skills and relevant business experience
− High degree of motivation, determination, persistence, commitment and the will to succeed
− Appropriate financial involvement in the company
• Formal requirements
− Age of company: company is operating for less than one year
− Company size: company must comply with European Union criteria for small companies: a maximum of 50 employees and an annual turnover or an annual balance sheet not exceeding 10 million Euro
− Location of the company: Germany, but international founders are also considered
− Extent of financing: Seed financing is ideally assured for a minimum period of 12 to 18 months
If Due Diligence has a positive outcome, an investment recommendation is made to one of HTGF’s three investment committees, which focus on different fields of technology and make the final decision about all investment proposals. A key constituent of the decision-making process is a presentation by the start-up team to the investment committee. In general, the four-step selection process requires a high evaluation effort, because an independent expert group is responsible for each step.

135

136
Box 9.1 6 Wunderkinder GmbH (Example of beneficiary firm)
6 Wunderkinder GmbH was founded in late 2010 and has grown continuously since then. The company develops cloud-based apps which run on mobile as well as stationary devices. The software offers end-users the possibility to plan and manage tasks and projects virtually. The task administration programme Wunderlist has been downloaded 1.7 million times and has 650,000 users.
The Berlin-based company was financed with 500,000 euros by High-Tech Gründerfonds shortly after its foundation in late 2010. The HTGF investment was primarily used to finance the technical realisation of Wunderkit, the firm’s first product, which is intended to help companies, freelancers, and other groups connect and work efficiently on one working platform that embraces all the necessary tools. In addition to the investment, HTGF also helped 6 Wunderkinder by providing know-how and consulting.
With the investment from T-Venture (a 100% subsidiary of Deutsche Telekom), 6Wunderkind was able to acquire new capital in mid-2011 (end investment phase). The company intends to use the new capital to develop new products and push its international market presence. In November 2011, Skype founder Niklas Zennströme and its investment company Atomico invested 3.1 million euros. In mid-2012, Earlybird finally replaced HTGF, taking over its shares and safeguarding its interests.
6 Wunderkinder is a good example of HTGF’s role as early-stage investor in a newly-founded company. HTGF provided 6 Wunderkinder with seed finance and assumed the role as lead investor. This enabled the company to take their R&D project (Wunderkit) through to creation of a prototype and the market launch. As 6 Wunderkinder was quite successful right from the beginning and showed considerable growth, other investors could be acquired. By acting as the main investor in the early, high-risk phase of the company, HTGF made 6 Wunderkinder attractive to private VC companies and investors who were not willing to invest in the early phase. After 2.5 years of being a shareholder (HTGF also participates as a follow-on investor in subsequent investment phases), HTGF finally exited the company in mid-2012 when the current seed phase ended.
Box 9.2 Krauttools GmbH (Example of beneficiary firm)
Krauttools GmbH, founded in 2010, develops and markets the “reqorder” customer/user feedback platform and is the first German provider serving this growth market with a solution complying with data protection requirements. “reqorder” offers self-service or app-economy companies the possibility to poll customer opinions and therefore to further develop their products in line with customer requirements. In particular, providers of mobile apps or news and shopping services on the web, who otherwise have virtually no direct customer contact, benefit from the feedback gained from each type of usage situation.
In mid-2011, HTGF invested 500,000 euros seed capital in Krauttools GmbH and safeguarded the follow-on investment after the EXIST entrepreneurship scholarship (another measure within the framework of German entrepreneurship support policy – run by the Federal Ministry of Economics and Technology). The HTGF-seed-investment was used to further develop the reqorder platform and to establish marketing and sales activities. This involved closer cooperation with internet and market research agencies that can use “reqorder” to significantly increase their margins in customer projects. The seed-investment was considered as an important milestone by the company`s CEO.

137
The HTGF selection procedure was analysed within the programme evaluation carried out in 2009 (see below for further information on the evaluation). Figure 9.1 illustrates the respective results for the HTGF portfolio firms and – as a control group (see Box 3 below) – for other, non-HTGF start-ups. One main result of the survey is that HTGF portfolio firms are clearly happier with the selection procedure than the other non-HTGF companies. The biggest differences between the two groups are observable for the indicators “transparency of financing criteria” and “comprehensibility of the evaluation”. For all the other indicators, the differences are also quite significant. The main reasons for the differences may have to do with the public mandate of the HTGF, which is geared less towards profit-maximising and more to taking high risks in the early phases of high-tech companies. As the selection process is an important success factor of the programme, the input for human resources and the effort put into the business diagnosis are quite high.
Figure 9.1. Appraisal of the HTGF selection procedure by the portfolio firms
Source: Technopolis 2009, survey among founders during the course of the HTGF evaluation
Box 9.3 Methodological remarks: The “control group”
The methodology allowed firms financed by the HTGF to be analysed as well as firms/persons who contacted the HTGF regarding financing/investment. The latter group is naturally quite heterogeneous and comprises persons and firms, who may have simply had a conversation with the HTGF (partly via the HTGF-network partners), but also foundations which went through the whole HTGF application process but did not get an investment deal for various reasons (see selection process in Chapter 2). This group comprises persons and start-ups in the investment focus of the HTGF, but also those which cannot be considered for investment due to aspects like sector (not a technology-based foundation) or age (start of business operation one year before submitting the draft business concept). The control group (i.e. “other founders” in Figures 1 and 2) contains 1,167 persons/founders who approached the HTGF and were included in the HTGF-database (at least with one email-address).
91%
72%
70%
88%
82%
83%
66%
58%
52%
65%
58%
35%
63%
64%
54%
24%
34%
31%
0 10 20 30 40 50 60 70 80 90 100
Information on HTGF financing principles are easy to access
Information on HTGF financing principles are easy to understand
Criteria for HTGF financing are transparent
Requirements for submission of draft business concept are adequate
Requirements on term sheet/self-disclosure are adequate
Requirements on Due Diligence evaluation are adequate
Evaluation of the business idea by evaluator was comprehensible
Requirements on the completion of the deal are adequate
Duration of the procedure is adequate
Other founders HTGF-Portfolio firms

138
Range of services
As pointed out above, both the business plan and the draft concept with the business idea are used as diagnostic tools to detect the strengths and weaknesses of the client firms. Within this process, an assessment grid with differentiated selection criteria is applied. First of all, business diagnosis has to consider the formal and contents related requirements, which are laid down in the investment guideline. The general requirements are the following:
• Age of the company: Companies which apply for investment are not allowed to operate longer than 12 months at the time of the submission of the business concept;
• Size of the company: At the time of closing the investment contract, the start-up company’s have to fulfil the definition for small companies of the EU. Therefore, a HTGF-investment is only possible when the company has less than 50 employees and an annual turnover of less than 10 million Euro;
• Company’s location: the start-up company must be located in Germany;
• Technology-orientation: HTGF invests in technology-oriented start-ups which are established on the basis of an R&D project. The technology should be ambitious on the one side, on the other side be applied-oriented so that the development of a prototype or the proof-of-concept is realistic. The required know-how and intellectual property should be exclusively available for the company;
• High degree of innovation: The technology or the business idea should constitute a unique feature vis-a-vis competitors; the benefit of the innovation for the client must be visible; the target markets should have a significant size and a growth potential; an imitation of the business idea by competitors should be difficult or combined with high entry barriers;
• The founder persons or entrepreneurs should have a high motivation, persuasive power, power of endurance, the will to succeed and a readiness for action. At least one member of the management team should have the necessary technological-natural sciences-oriented know-how which is needed for the R&D project. Furthermore it is expected that the founders commit themselves financially.
On the whole, HTGF’s business diagnosis covers various areas like business concept, business idea, business organisation (as far as already existing), staff, internal business processes, customer relations, commercial networks, operations, etc. As the start-up companies do not have a long history, it is impossible to make a company valuation. This is also the reason why qualitative criteria are important when diagnosing the business concept (e.g. assessment of the start-up team). Advice is already given during the phase of concept development, particularly by the coaches (see further down below on the coaching concept). The draft concept, for instance, should contain a reference from one of the HTGF’s partner institutions like coaches, investors or research organisations (see Chapter 4 for more details of HTGF’s delivery arrangement). The referees declare they have analysed the business concept and expect it to be successful. Apart from the role played by the partner institutions, the founders are free to directly approach the HTGF for a first assessment of the business concept (carried out by the investment managers).
A first meeting or conversation with the founder team is set up during the course of evaluating the business plan or the draft business concept. This is also the basis for the decision about whether a due diligence check will be started. In the due diligence phase, the HTGF conducts a systematic examination which

139
gathers expertise on the technological potential, the level of innovation, and the market chances of the start-up project. Following this stage a further personal meeting between the HTGF staff, the founder(s), the coach and other possible investors is organised. The so-called co- or side-investors now reveal the amount and conditions of their investments. The initial maximum investment of the HTGF amounts to €500,000 and a nominal share of 15% of the company. In the course of follow-on financing, a further €1.5 million can be reserved. The start-up company’s own contribution amounts to 20% (or 10% in East Germany) of HTGF’s investment.
• As a rule the HTGF is also involved in follow-on financing88, which is provided by business angels with a share of 55% and domestic VC companies (roughly 52%). Other public funds make up 37% of the projects and the Bank for Reconstruction (KfW) provides 27% from its ERP-Start-Up funds. According to HTGF, the following amounts were invested in follow-up financing in 2011:
• €29.4 million from domestic VC companies,
• €22.1 million from other public funds (for instance from single German federal states),
• €17.2 million from business angels,
• €16.0 million from corporate VC companies,
• €14.5 million from the Bank of Reconstruction (KfW),
• €13.5 million from HTGF, and
• €10.8 million from foreign VC companies.
In total €123.5 million were invested in HTGF’s portfolio companies in the course of follow-on financing. Since 2008, the amount of follow-on financing has increased constantly (from €70 million), which demonstrates that the further development of the German seed-capital market has been achieved, which was one of the main objectives of the programme. Especially business angels, other public funds and the Bank for Reconstruction (KfW) are increasingly participating in follow-on financing.
The HTGF’s investments are linked with strategic support by the investment managers or a local coach who is accredited at the HTGF (“hands-on” support or “intelligent capital”). As the HTGF becomes a shareholder of the company, it shares the objective with the founder to increase the value of the company. Thus, upgrading the managerial skills of the entrepreneur and providing operational assistance in developing the company are some of the main tasks of the external coaches.
88 The following information is based on a presentation by Dr. M. Brandkamp at the German Venture Day
2012; see also Kulicke/Leimbach 2012.

140
Delivery arrangements
As mentioned above in relation to the evaluation of the draft business concepts and the business plans, the HTGF acts in close co-operation with external partner institutions. Particularly with regard to follow-on financing institutions, the “externalisation” of services can be considered an integral part of the HTGF approach (i.e. mobilise additional seed capital and therefore support the establishment of a seed capital market in Germany). Thus, in line with the key question of this study, support services are indeed externalised in a way. The following actors are the main “delivery channels”:
• Coaches,
• Other investors (e.g. business angels, private investors’ circle, national and international VC companies),
• Research institutions,
• Network members like potential managers and personal coaches, M&A consultants),
• Network of HTGF’s portfolio companies.
The coaching concept has been developed to support start-up companies strategically and for business management reasons. HTGF has established a pool of experts from which the founders can select a coach (the coaches are accredited at the HTGF). As a rule, the co-operation between the coach and the start-up company is established regionally. Coaches are compensated directly by the founder and this is regulated by a bilateral contract between founder and coach. The accreditation agreement between the coach and HTGF comprises the financial guidelines which allow a maximum daily fee of 1,000 euros net, success-related one-off payments and a maximum budget for the various phases. The decision to select a coach lies with the company. The coaching concept is not a mandatory part of the programme, as potential to be financed start-up company doesn’t need support and abstains from the coaching (in accordance with the HTGF).
The HTGF is pursuing several objectives with its coaching concept. The cooperation between the coach and the start-up company is customized and tailored to the specific needs of the individual company. These needs are jointly determined by the company, the coach and the responsible investment manager of HTGF. In general, the coaching concept aims to support promising equity holdings. The coaches should introduce the HTGF to potential founders, private investors and other partners in order to construct and continuously extend a high-quality network. Coaches can either be seed investors like business angels or other seed funders, or public institutions supporting start-ups from universities and research institutes or consultants with expertise in coaching technology-oriented start-ups. Qualified consultants, experts or managers can be accredited as coaches at the HTGF. At present, the HTGF portfolio companies can draw on 70 coaches.
The coaches serve as contact partners for the companies but should not intervene in management. They should have experience in managing a company or knowledge of the respective industry. The coaches can also act as co-investors in the start-ups. The company selects a suitable coach; the HTGF supports competition between coaches.
Coaching takes place at two key stages: the initial investment phase when the term sheet is signed and the mentoring phase of the investment. The role of the coach in the acquisition phase is to identify young companies/possible start-up companies, support the founders during HTGFs Due Diligence process, and provide operational assistance in developing the company. The acquisition phase ends when investment by

141
the HTGF has been successfully finalised (closing). In detail, the coach supports the start-up in the acquisition phase in the following areas:
• Explaining the different requirements during the different stages of the business proposal evaluation by HTGF,
• Initial analysis of the business concept and business plan,
• Support with compiling a business plan,
• Calculating the need for capital,
• R&D planning,
• Team building,
• Development of a strategic roadmap, etc.
The objective of the mentoring phase is to provide operational support and further development the companies in close interaction with the management of the company and the HTGF’s investment manager. The mentoring phase begins with “the closing” and ends with the completion of the seed-phase, i.e. when the company secured follow-on financing and achieves break-even.
In the mentoring phase the coach should – in agreement with the HTGF’s investment manager – offer practical help to the company covering aspects like
• Operational and strategic support within the agreed range of activities,
• Follow-up on road map activities,
• Identifying possible friction in management and helping to set up a moderation process,
• Monitoring the company’s development,
• Help with monthly reports, etc.
The HTGF can link certain topics of the mentoring concept to milestones which can be coupled to financial payment. The mentoring phase begins with the investment of HTGF and ends with the completion of the seed-phase (i.e. the moment when follow-on investment kicks in, or the break-even point is reached).
Founders and HTGF’s investment manager jointly evaluate the quality of the coaches’ services. The agreed milestones between the company and the coach form the basis for the evaluation. After reaching a certain milestone, the coach bills the company. HTGF receives a copy of the bill and, in addition, an evaluation note from the coach on the company’s management. The evaluation procedure is carried out by HTGF’s Relationship Management, which is responsible for all the general aspects of the coaching. In addition, it serves as the main contact point for the coaches. The investment managers are responsible for dealing with the coach regarding company-specific questions.
The support services of the coaches were assessed by the founders in the course of an evaluation carried out in 2009/2010. Figure 9.2 presents the results – which are based on a quantitative survey – of the

142
HTGF-portfolio firms and “other firms”, which were not funded by the HTGF (see Box 9.3 above for methodological remarks regarding the “control group”). The figure only contains the assessment of the founders regarding the support of coaches in the acquisition phase89. Not surprisingly, the other firms assessed the coaches much more negatively than the HTGF-portfolio firms. Of all the topics requested, support in elaborating the draft business concept/business plan, establishing cooperation networks, expanding the competencies related to management, and economic assessment were rated particularly positively. In contrast, the coach’s support related to establishing sales channels and further developing the business idea received comparatively weak reviews.
Figure 9.2 Assessment of founders regarding the support of coaches in the acquisition phase (share of companies giving a positive assessment)
Source: Assessment of founders regarding the support of coaches in the acquisition phase (share of companies giving a positive assessment)
Figure 9.3. shows the results of assessing the coaches in the actual mentoring phase – this time only from the HTGF-financed start-up companies (there was no control group here as the mentoring phase only included the start-ups actually financed by the HTGF). The overall results are very similar to the acquisition phase. The specific strengths of the coaching are seen in the further development of the company’s organisation and ensuring the follow-on financing. The coaches are obviously less helpful to the founders or start-up companies with regard to aspects like safeguarding intellectual property rights for the business concept or establishing sales channels.
89 At this time in the HTGF process, the actual investment deal has not yet been made, which results in a
situation where founders or start-up companies have already been coached, but the deal has not been concluded and the firms have not yet benefitted from the HTGF. This is the reason why the “other firms” in Figure 2 are able to assess the coaching concept, even though they were not financed by the HTGF.
8%
28%
22%
19%
47%
25%
32%
28%
47%
25%
32%
57%
63%
23%
57%
51%
32%
52%
76%
48%
0 10 20 30 40 50 60 70 80
Establishment of sales channels
Expansion of competencies related to management
Establishment of cooperation networks
Further development of business idea
Economic assessment of business idea
Setting up company organisation
Technical assessment of business idea
Safeguarding overall financing (e.g. search for side-investors)
Elaboration of draft business concept and business plan
Identification of appropriate experts
HTGF-Portfolio firms Other founders

143
Figure 9.3 Assessment of the HTGF-financed start-up companies regarding the support of coaches in the mentoring phase
(Share of companies giving a positive response)
Source: Technopolis 2009, survey among founders in the course of the HTGF-evaluation
In addition to the coaching concept, the HTGF relies on other partners and networks to fulfil its mission. The network of other investors is important as the HTGF tries to mobilise other investors for the follow-on investments after 12-18 months. However, as the HTGF has a holding in nearly all of its companies in the follow-on investment phase, a strong partnership between HTGF and its co-investors is inevitable. The research institutes are important network partners, because they provide a first reference for the draft business concept or the business plan for start-ups originating from their institutes. Network members like potential managers, personal coaches or M&A consultants are important as potential investors, shareholders, coaches or for preparing the IPO. Finally, HTGF has established a network of its portfolio companies, for which a “Family Day” is organised once a year. The Family Day offers a platform for the whole German seed capital community and offers the companies a chance to meet potential investors. According to the evaluation (Geyer et al. 2010), the Family Day concept has been accepted quite well by founders, business angels, representatives of VC companies and the portfolio companies.
Strengths
Based on the interview with the CEO of the HTGF, Dr. Michael Brandkamp, the programme evaluation and our own assessments, it can be concluded that the HTGF has various strengths which have contributed to its quite successful performance. First of all, the programme has been designed on the basis of market principles in relation to its internal organisation and management structure, the rationale of its existence and regarding the delivery principles, particularly with regard to follow-on investors. The design of the HTGF is based on the assumption that the seed phase of high-technology start-ups is characterised by a market failure due to the fact that the early, high-risk phase of a venture is not particularly interesting for profit-oriented VC companies (or other more traditional sources of financing). Rather than implementing a public programme operating along bureaucratic lines, the German government decided to set up a public-private partnership model (PPP) in which well-known (large) companies act as stakeholders and consulting partners. Thus, the entrepreneurial philosophy of the HTGF is clearly mirrored in the structure of its stakeholders with the respective expertise.
34%
57%
24%
54%
56%
67%
69%
60%
0 10 20 30 40 50 60 70 80
Establishment of sales channels
Expansion of competencies related to management
Safeguarding of intellectual property-rights for the business concept
Upgrade of cooperation networks
Further development of business idea
Safeguarding follow-on financing
Further development of company organisation
Identification of appropriate experts
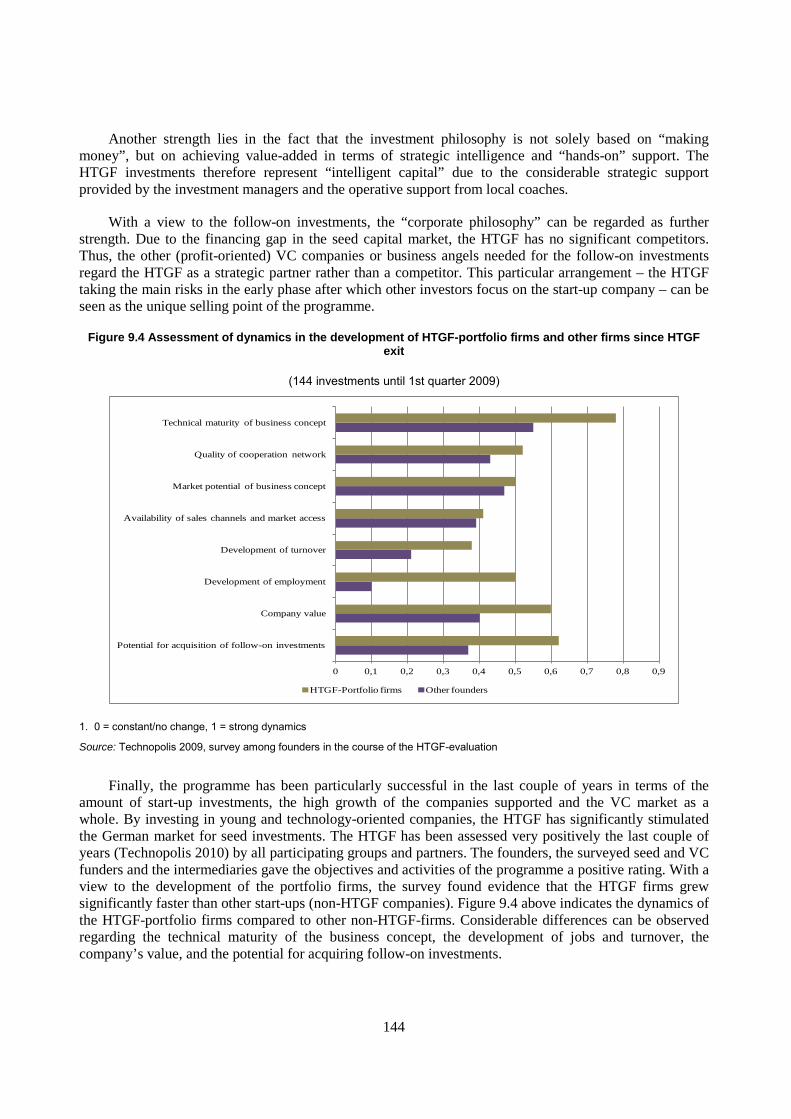
144
Another strength lies in the fact that the investment philosophy is not solely based on “making money”, but on achieving value-added in terms of strategic intelligence and “hands-on” support. The HTGF investments therefore represent “intelligent capital” due to the considerable strategic support provided by the investment managers and the operative support from local coaches.
With a view to the follow-on investments, the “corporate philosophy” can be regarded as further strength. Due to the financing gap in the seed capital market, the HTGF has no significant competitors. Thus, the other (profit-oriented) VC companies or business angels needed for the follow-on investments regard the HTGF as a strategic partner rather than a competitor. This particular arrangement – the HTGF taking the main risks in the early phase after which other investors focus on the start-up company – can be seen as the unique selling point of the programme.
Figure 9.4 Assessment of dynamics in the development of HTGF-portfolio firms and other firms since HTGF exit
(144 investments until 1st quarter 2009)
1. 0 = constant/no change, 1 = strong dynamics
Source: Technopolis 2009, survey among founders in the course of the HTGF-evaluation
Finally, the programme has been particularly successful in the last couple of years in terms of the amount of start-up investments, the high growth of the companies supported and the VC market as a whole. By investing in young and technology-oriented companies, the HTGF has significantly stimulated the German market for seed investments. The HTGF has been assessed very positively the last couple of years (Technopolis 2010) by all participating groups and partners. The founders, the surveyed seed and VC funders and the intermediaries gave the objectives and activities of the programme a positive rating. With a view to the development of the portfolio firms, the survey found evidence that the HTGF firms grew significantly faster than other start-ups (non-HTGF companies). Figure 9.4 above indicates the dynamics of the HTGF-portfolio firms compared to other non-HTGF-firms. Considerable differences can be observed regarding the technical maturity of the business concept, the development of jobs and turnover, the company’s value, and the potential for acquiring follow-on investments.
0 0,1 0,2 0,3 0,4 0,5 0,6 0,7 0,8 0,9
Potential for acquisition of follow-on investments
Company value
Development of employment
Development of turnover
Availability of sales channels and market access
Market potential of business concept
Quality of cooperation network
Technical maturity of business concept
HTGF-Portfolio firms Other founders

145
Weaknesses
Although extraordinarily successful on the whole, a few weakness of the HTGF can also be observed. First of all, the rate of return is significantly lower compared to private VC companies. This is due to the fact that the early phase of start-up companies in the high-technology sector is characterised by R&D activities and the establishment of a company organisation rather than by generating high profits. As the HTGF invests in the seed-phase as well as in the following phase in most cases (2nd financing round), returns are higher than in the seed-phase, but still lower than in the following years (3rd financing round) where primarily private VC companies are the lead investors. So the relatively low return rate is due to the fact that the start-up companies only become attractive to private investors after the main risks have been overcome and growth perspectives are much more certain.
Another weakness relates to the uneven industry focus of the HTGF. Although no specific target branches exist, the evaluation of the HTGF shows that certain branches have not been adequately addressed due to industry- and technology-related specific aspects. The investments in the last couple of years have been clearly targeted at ICT-based start-ups. The typically limited investment requirements make the HTGF particularly interesting for ICT-based start-ups. However, at the same time, the technological depth of innovations in this industry field is comparatively low. Furthermore, the investment volume in manufacturing industries like energy, material or environmental technologies is less than was originally planned when the HTGF was established. Foundations in these fields usually need much higher financing in the seed-phase which clearly exceeds the existing possibilities of the HTGF.
Finally, according to the investment guideline, the HTGF can only take shares in companies which did not start operating more than 12 months before approaching the HTGF (submission of draft business concept). This stipulation can constitute a barrier in specific cases, for instance in service companies which prepare their start-up idea although they have been operating longer than 12 months. The investment guideline can also be a drawback in the case of company spin-offs from existing SMEs. In such cases, the guideline could allow an exception for the 12 months deadline if all the other investment pre-conditions are met.
Monitoring & evaluation system and proven impact
As long as the HTGF acts as a shareholder of its portfolio companies, their business development is monitored using a system which contains both qualitative and quantitative indicators. In addition, the early phase is characterised by close interaction between the investment manager and the portfolio company (“hands-on”-support) resulting in constant monitoring of the company’s development. It has to be noted once again that the seed phase of the start-up companies in which the HTGF holds shares is not usually characterised by particularly dynamic growth, but more by R&D and setting up the organisational structure of the firm.
In 2009/2010, 4-5 years after the HTGF was established, an evaluation was carried out to assess the performance of the programme and the supported firms. The evaluation was conducted by the Technopolis Group in cooperation with the Frankfurt School of Finance & Management. The key objective was to collect evidence for whether the original assumptions in terms of the underlying innovation policy objectives are coherent and can be aligned with the chosen intervention strategy and its implementation. The methodology comprised a literature analysis (on the seed and VC market and its development in Germany), secondary data research, interviews with important stakeholders (e.g. experts from HTGFs networks like their stakeholders, members of the investment committee, coaches, private VC companies and business angels), ethnographic approaches and an online-survey of persons and firms having contacted the HTGF since its foundation. The evaluation featured both HTGF-portfolio firms and firms from a “control group”. The latter group was primarily made up of those firms which had approached the HTGF

146
but were not selected as client firms or portfolio-companies. Some of the main results from the comparative analysis have already been presented above in relation to the development and dynamics of the firms.
Proven impact – assessment of HTGF’s performance
The funding and innovation policy were assessed by combining quantitative and qualitative methodologies, both at the level of HTGF-portfolio firms and the programme as a whole. The following paragraphs summarise the main results of the evaluation.
Regarding the financing gap, the interviewees (mainly experts from VC companies, HTGF-stakeholders and funding agencies) stated that the original basic assumptions which led to the establishment of the HTGF are still valid even after 5 years. Private VC companies are still reluctant to finance early, high-risk projects and firms. The market failure is still the main justification for the HTGF-activities. Economic and technological risks reduce the expected returns when investing in the early phase. Furthermore, the significantly greater efforts for mentoring and support compared to later phases result in higher management costs and the greater possibility of an investment loss.
Most of the interviewees did not see any danger of “crowding-out” caused by public measures like the HTGF. On the contrary, the experts pointed out that the market for seed-financing in Germany would not exist without instruments like the HTGF. This statement was underpinned by the quantitative results of the online survey among HTGF-portfolio-firms: the majority of the HTGF-start-ups had already been looking for financing options prior to approaching the HTGF – without success. 79% of the HTGF-financed firms said they had searched for financing options for their business idea.
On the whole, the HTGF was assessed quite positively by the interviewed experts. The simple existence of the fund and its considerable budget is why the HTGF is regarded as the public measure to improve seed financing for entrepreneurs. The programme is considered the guarantor for financing interesting start-ups independent of economic cycles, which is particularly important in periods of recession due to the pro-cyclical tendencies of the VC market. The following figure shows the development of the seed-investments in Germany prior and after the implementation of the HTGF. A take-off can be observed in 2006, when the seed-investments of the HTGF were much larger than the other seed-investments (which may also come from other public seed-funds, not necessarily from private investors). In the period 2007-2011 the HTGF had always a share of the total seed-investments between 30-40%. Within this context, it has to be noted, that the private and other public seed funds (for instance from the federal states) in this particular period would not be that large without the impulses by the HTGF.

147
Figure 9.5 Development of German seed investments and role of HTGF
(in million Euro)
Source: Kulicke/Leimbach (2012) on the basis of BVK Statistik 2011 and special statistical evaluation.
The positive assessment of the HTGF by both experts and the portfolio-firms themselves is ultimately due to the capability of the HTGF staff and its management, who are considered extremely competent. The fund is operated in a flexible, transparent and fair manner. Particularly those interviewees who had positive experiences in the course of joint investments underline the professionalism of cooperating with the HTGF. Its legal autonomy and entrepreneurial claim were also mentioned as additional “success factors”. Indeed, although it is predominantly publicly funded, the HTGF operates like an entrepreneur in the seed market. Due to its role as a lead investor, the HTGF is quite active and distinguishes itself from other public support measures. The final factor relates to its financial capability and budget, which results in the HTGF being recognized as a key actor in the German VC landscape.
The assessment also analysed how the business activities of the HTGF itself developed based on an evaluation of the portfolio-companies. By analysing indicators like enquiries from founders or start-up companies, the personal and institutional background of founders, success factors in terms of the role of coaches and other network members, sectoral distribution and technological priorities, etc., the general conclusion was that the HTGF has clearly contributed to the development of a seed-capital market in Germany and acted as an important stimulus for investors and high-tech start-up firms. However, the programme also has room for improvement.
Recommendations for improvement
In general, analysing the data and information provided by the HTGF shows that the programme is a conceptually coherent model for improving the financing conditions for high-technology start-ups with growth potential which appears to have become well accepted in Germany since its foundation. The recommendations for improving the programme only refer to individual features.

148
One of the main challenges in the years to come is how start-up companies should develop an exit strategy or an IPO. The sale of the shares held by HTGF is certainly one of the main challenges to avoid publicly-owned companies (which is only partially the case in reality as the HTGF only acts as a minority stakeholder). Within this context, the CEO of the HTGF stressed that the success prospects for young high-tech companies could be significantly better, referring to the fact that the HTGF can only stimulate the seed-capital market, but cannot close the financing gap completely.
Regarding the investment focus, the data on the industry and technology priorities of the HTGF show that the technological depth of the start-up firms is often substituted by innovation potentials. The investment criteria “high degree of innovation activities”, which particularly applies to ICT firms, should be retained, but should not completely replace the “technological potential” criteria of a business concept. The HTGF should still strive to finance manufacturing-oriented or technology-based start-ups, rather than service firms. However, taking demand-side aspects into consideration, i.e. firms and individual entrepreneurs who approach the HTGF with a concrete business concept, the number of successful investments will still be the result of available equity holdings.
As already mentioned above, according to its investment guidelines, the HTGF can only invest in firms that began operating not longer than twelve months before approaching the HTGF (submission of the draft business concept). In some cases, this principle can result in an undesirable obstacle to an investment by the HTGF, for instance if the business concept has been developed and prepared by a service company, which has been operating for longer than 12 months. However, on the whole, the “age criteria” should be retained. Defining the 12 month period clearly differentiates the HTGF from other public and private financing options in the seed market. The HTGF invests in young companies at a time when significant risks exist which tend to discourage private investors. These above average risks justify the significant public investment share of the fund. If the age criteria were abandoned or softened, the HTGF would probably be approached with many more “mature” business concepts.
With regard to the investment, the framework conditions should be designed to allow successful start-up companies to progress from early-stage investment to follow-on investment to the IPO. In the course of the early-stage investment, HTGF usually acquires a 15% share of the respective company. A larger share of up to 25% is possible during the financing period according to the investment guideline. Follow-on investments can be realized up to €500,000. In the case of higher investment amounts, additional (private) investors are the main actors. This principle is intended to guarantee the transition from a mostly publicly financed start-up to a private company. However, there remains the question of how to handle cases which require higher investment than that available at the HTGF (even when considering the follow-on investment) to develop the start-up company to a stage which renders it attractive to private follow-on investors. For such cases, a further adaption of the investment guidelines in terms of changing the financing limit for follow-on investments has to be considered. The recommendation is to raise the financing limit from 1 million euros to 2-3 million euros. Even under this scenario, crowding-out effects are not be expected.
Regarding the coaching concept, companies/founders - particularly those who where declined for investment by HTGF’s investment committee -, have criticised the concept pointing to the costs and a general mismatch between the specific needs of the founder and the competencies of the coach. It is recommended that – despite their accreditation – the HTGF improves the coaching concept in terms of achieving a better connection between investment manager and coach.
Finally, the communication of the investment decisions (particularly when a negative investment decision has been made) should be paid more attention to – according to several founders interviewed in the course of the evaluation.

149
Conclusions
The German programme High-Tech Gründerfonds (HTGF) was implemented in 2005 by the German Ministry of Economic Affairs and Technology (BMWi) with the aim to give impulses to the seed-capital market in Germany and thus, improve the financing conditions for technology oriented firms or founders. The HTGF is a public-private partnership with the BMWi as the main stakeholder, followed by the KfW (promotional bank of the federal republic) and several, mostly large private German companies. In the first phase of the HTGF, from 2005 to 2011, €272 million were invested (Gründerfonds I). The second phase started on 27 October 2011 (Gründerfonds II) with funds of €288.5 million. The programme design is based on the assumption that there is a market failure in the seed phase of high-technology companies in Germany which results in an investment gap as profit-oriented VC companies or informal investors like business angels tend to shy away from taking technology and market risks in this particular phase.
The initial maximum investment of the HTGF amounts to €500,000 and a nominal share of 15% of the start-up company. In the course of follow-on financing, a further €1.5 million can be reserved. The start-up company’s own contribution amounts to 20% (or 10% in East Germany) of HTGF’s investment. The major follow-on investments are provided by business angels with a share of 55% and domestic VC companies (roughly 52%). Other public funds make up 37% of the projects and the Bank for Reconstruction (KfW) provides 27% from its ERP-Start-Up funds. The HTGF’s investments are linked with strategic support by the investment managers or a local coach who is accredited at the HTGF (“hands-on” support or “intelligent capital”). As the HTGF becomes a shareholder of the company, it shares the objective with the founder to increase the value of the company.
On the basis of the analysis and research carried out for this case study, the general conclusion can be drawn, that the HTGF has been particularly successful in the last couple of years in terms of the amount of start-up investments, the high growth of the companies supported and the VC market as a whole. By investing in young and technology-oriented companies, the HTGF has significantly stimulated the German market for seed investments. In the period 2007-2011 the HTGF had always a share of the total seed-investments in Germany between 30-40%. “Crowding-Out” effects caused by the HTGF can not be observed. Experts consider the programme as a guarantor for financing interesting start-ups independent of economic cycles, which is particularly important in periods of recession due to the pro-cyclical tendencies of the VC market. The fund operates flexible, transparent and fair; HTGF’s management team acts competent and professional.
Weaknesses of the programme primarily relate to a significantly lower return rate of the HTGF compared to private VC companies. This is caused by the fact that the start-up companies become attractive for private investors after the main risks are overcome and growth perspectives are much more concrete. Regarding HTGF’s industry focus, the evaluation has observed that due to industry- and technology related specifics, different branches have not been adequately addressed. The investments in the last couple of years have been clearly targeted at ICT-based start-ups. Particularly technology-oriented industries like energy-, material- or environmental technologies have not been adequately considered – due to a much higher financing volume in the seed-phase. Finally, the “age criteria” (less than 12 months operating period prior to approaching the HTGF) could constitute a barrier in specific cases, as several service firms for instance may prepare foundation ideas or concepts although they are operating longer than 12 months. However, the retention of the 12 months criteria should be the rule, because by defining the period it clearly differentiates the HTGF from other public and private financing options in the seed market.
On the whole, the HTGF can be regarded as a conceptually coherent model which since its implementation is well accepted to improve the financing conditions for high-tech start-ups with growth potential. On the basis of the programme’s strengths and its achievements in the last six years,

150
recommendations for improvement only relate to single features, like reduction the technological or industries priorities, re-thinking the 12-months period, adaptation of the investment guidelines, possibility of higher-investments, improving the coaching concept or guarantee a better transparency with a view to the negative investment decisions.

151
ANNEX 9.A1.
TRANSFERABILITY
On the basis of the structural characteristics of the HTGF and the experience made since its implementation in 2005, a few lessons of the measure for similar other places can be drawn. “Similar” in this sense means, that a certain scientific-technological infrastructure, an entrepreneurial climate, a venture capital market and a public funding architecture should be existing. These environmental aspects appear to be crucial as the HTGF has be considered as only one measure within the context of a much broader institutional framework.
In terms of a general legitimation of a programme like the HTGF, a market-failure for seed-investments (early-stage, high-risk) can be observed in most of the European countries. Profit-oriented VC companies and partly also private investors like Business Angles for instance are seeking for investment opportunities not only in Germany but rather in many countries. Thus, from a supply-oriented perspective, follow-on investors or pre-seed investors who are operating internationally shy away from particularly risky investments in young (start-up) companies. So, the basic assumptions for a legitimation of a high-growth programme like the HTGF are not only observable in Germany but rather in many other countries. This appears to be important as the strengths of the HTGF lies in a certain market compliance, accepted by private investors and also by companies being shareholders of the HTGF itself. Thus, one important lesson would be to design a measure in the shape of a public-private partnership (PPP) which operates more like a private investor rather than a bureaucratic organisation. Important criteria of such a PPP-organisation relate to selection criteria of the start-up companies (“picking the winners”), internal (management) organisation, rationality in terms of investments and support (“hands-on”), and exit-strategies (IPO).
Second, a private VC market focusing on high-growth companies and a general climate for innovations are certainly crucial features for a public programme like the HTGF to achieve a leverage effect. The objective of the HTGF to give impulses to the VC market can only be a realistic perspective insofar as potential co- or follow-on investors are present, which accept the public measure as a partner, and which operate in a business environment that is conducive for growth and competitiveness.
Third, a high-growth programme like the HTGF can have a certain impact when an entrepreneurial climate, at least in certain industries or regions (e.g. capital cities or urban regions) exists. For Germany, data provided by the Centre for European Economic Research (ZEW) show that the amount of potential high-growth start-ups is limited, but nevertheless from a demand-side perspective, even those business concepts need to be developed and probably supported from the respective “mother-organisation” or incubator. Against this background, a start-up supporting (public) infrastructure, like the EXIST programme in Germany (“Start-ups from science”) or various cluster programmes, may be helpful.
Apart from the quite specific recommendations or corrections for the HTGF as described above, no major adjustments are needed for the programme to be successful elsewhere. Regarding transferability or adaptation to another country or region, the existing public support infrastructure both in terms of the innovation system in general and regarding new ventures (incl. entrepreneurship education and motivation) in particular need to be taken into account in order to avoid redundancies among the institutions and achieve acceptance among private companies and the entrepreneurs or start-ups.

152
References
Bundesministerium für Wirtschaft und Technologie (BMWi) (2012): Technologie- und Innovationspolitik. Neue Initiativen für ein technologiefreundliches Deutschland.
High-Tech Gründerfonds (o.J.): Leitbild des High-Tech Gründerfonds.
Kulicke, M.; Leimbach, T. (2012): Venture Capital und weitere Rahmenbedingungen für eine Gründungskultur. Unveröffentlichtes Gutachten für das Sekretariat der Enquete-Kommission “Internet und digitale Gesellschaft” des Deutschen Bundestags.
Technopolis Group; Frankfurt School of Finance & Management (2010): Evaluierung des High-Tech Gründerfonds. Endbericht im Auftrag des Bundesministeriums für Wirtschaft und Technologie.
Other sources:
High-Tech Gründerfonds (HTGF):
http://www.high-tech-gruenderfonds.de
Ministry of Economic Affairs and Technology (BMWi):
Existenzgründung: http://www.bmwi.de/DE/Themen/Mittelstand/existenzgruendung
Auf den Mittelstand setzen: Verantwortung stärken – Freiräume erweitern: http://www.bmwi.de/DE/Themen/mittelstand,did=378166.html
Politik für den Mittelstand: http://www.bmwi.de/DE/Themen/Mittelstand/mittelstandspolitik,did=468.html
Förderdatenbank – Förderprogramme und Finanzhilfen des Bundes, der Länder und der EU: High-Tech Gründerfonds: http://www.foerderdatenbank.de/Foerder-DB/Navigation/Foerderrecherche/suche.htm
Ministry of Education and Research (BMBF):
http://www.bmbf.de
Ideen. Innovation. Wachstum: Hightech-Strategie 2020 für Deutschland (http://www.bmbf.de/pub/hts_2020.pdf)

153
CHAPTER 10. COMMERCIALISATION AUSTRALIA
Introduction
Legal context
A key priority of the Australian Government is to build a stronger, fairer Australia which is prepared for the challenges of the future. The Government outlined its innovation agenda for Australia over the next decade in Powering Ideas, an Innovation Agenda for the 21st Century. Implementing the Government’s innovation agenda will assist in increasing Australia’s productivity, leading to a more prosperous Australia that is equipped to deal with the dynamic global environment.
Powering Ideas outlines a vision for a national innovation system in 2020 in which:
• The Australian Government clearly articulates its national priorities and aspirations to make the best use of resources, drive change and provide benchmarks against which to measure success.
• Universities and research organisations attract the best and brightest minds to conduct world-class research, fuelling the innovation system with new knowledge and ideas.
• Businesses of all sizes and in all sectors embrace innovation as the pathway to greater competitiveness, supported by government policies that minimise barriers and maximise opportunities for the commercialisation of new ideas and new technologies.
• Government and community sectors consciously seek to improve policy development and service delivery through innovation.
• Researchers, businesses and governments work collaboratively to secure value from commercial innovation and to address national and global challenges.
• This vision requires Australia to do better in building innovation skills, supporting research to create new knowledge, increasing business innovation and boosting collaboration. In keeping with this vision and Powering Ideas, on 12 May 2009 the Government announced that it would establish a Commonwealth Commercialisation Institute to develop a radical new approach to commercialising Australian research and ideas.
• The Department of Industry, Innovation, Science, Research and Tertiary Education (DIISRTE) developed options for implementing the initiative in consultation with over 250 key stakeholders. Public submissions were invited via the DIISRTE website. A Focus Group comprising representatives from key stakeholder groups was used to generate ideas and consider various options. A cross-government Committee was then established to consider the preferred options for the format, governance and delivery of the initiative. Initially called the Commonwealth Commercialisation Institute, the name was changed following the consultation and development phase to reduce confusion with other organisations in existence. The findings of the Government

154
Committee formed the basis of the model agreed to by the Australian Government in September 2009.
• On 21 October 2009 the Australian Government announced a broad outline of Commercialisation Australia, including its funding profile of $278 million for the five years to June 2014 and ongoing funding of $82 million per year thereafter. The program was due to open for applications in January 2010. An Interim Commercialisation Australia Board was convened to establish program and operational documentation, and to confirm the details of each program component. The Minister for Industry and Innovation signed the Program Guidelines on 18 December 2009. Full details and program documentation became publicly available with the launch of the Commercialisation Australia website on 21 December 2009. The program opened to applications on 4 January 2010.
A permanent Commercialisation Australia Board was established in February 2010 ahead of its first meeting in March 2010, where it began assessing applications for funding. The first funding agreement with a participant was signed in April 2010, and the first block of grant offers were announced on 15 April 2010. Following an open recruitment process the Chief Executive Officer (CEO) of Commercialisation Australia was appointed in April 2010. Interim Case Managers were put in place in January 2010 and operated until the end of June 2010 when 15 permanent Case Managers were contracted. The Volunteer Business Mentor component became operational in November 2010.
Commercialisation Australia is a key element of the Australian Government’s long term policy priorities for innovation and is the primary source of Australian Government assistance for the commercialisation of new intellectual property. As such Commercialisation Australia is part of the broader government initiative to promote and create an innovation framework within Australia that nurtures and promotes entrepreneurial activity and new, high growth business development.
Commercialisation Australia was established in the context of the guiding principles of the Framework of Innovation, affirming and supporting the governments of Australia to improve the consistency of innovation programs across federal, state and territory bodies. Thus Commercialisation Australia is complementary with other current government initiatives both on a federal and state level.
Rationale
Innovation is a key determinant of Australia’s productivity and is vital to increasing economic growth and living standards. Australia’s recent innovation performance has been uneven, performing well in science and research but underperforming in commercialising research outcomes and creating value from inventions. According to the Australian Innovation System Report 2011, Australia has a relatively poor record in developing new-to-market innovations compared to other OECD countries.
Australian Bureau of Statistics (ABS) data for 2006-07 suggested that less than 1 per cent of Australian firms get information or ideas for innovation from universities. Less than 2 per cent get ideas and information from government agencies – including research agencies. Only about one third of Australian firms are undertaking any innovation.
The Venturous Australia Report90, commissioned by the Australian Government in 2008, identified several factors that may have contributed to the slowdown of innovation in Australia in the new millennium:
90 Venturous Australia Report, Cutler & Company Pty Ltd, 2008, ISBN 978-0-646-50110-9, pp.13-14

155
• A declining rate of public investment in education over the past decade.
• Public investment in research has declined since 1995.
• The vastly improved terms of trade have been associated with a significant strengthening of the Australian dollar. “This has made it difficult for non-resource sector exporters, with adverse effects on investments in imported capital goods that embody technological improvements and facilitate both process and product innovations. The ‘Resource Curse’ (or ‘Dutch Disease’) may have become relevant since 2003 with attendant effects on innovation and productivity growth.”
Studies undertaken during the establishment and design phase of the Commercialisation Australia program confirmed the need for government intervention to assist inventors overcoming what is commonly referred to as the ‘valley of death’ between invention and first sales of a new product, process or service. Market failures identified in the proof of concept, demonstration and commercialisation phases of the innovation chain include:
1. Information asymmetries – innovators and investors lack accurate or adequate information about factors such as prices, value chains, industry capability or potential domestic and international demand to make effective and efficient decisions about the commercial value of a new product, process or service.
2. Depth of capital market – the Australian venture capital market is relatively immature and characterised by risk-averse investors. Existing private funds tend to concentrate on specific technology areas and cluster at the latter stages of development to avoid the high technical and market risk associated with new-to-market innovations.
3. Positive externalities – in most new industries, the early movers bear the costs of demonstrating and bringing a new idea to market, while later movers share in the benefits that spill over from the early movers’ investments. This results in a strong disincentive for any firm to be a pioneer and leads to an undersupply of demonstration and commercialisation activities.
These gaps in skills, knowledge and funding in the market along the path from experimental development to commercialisation cause new concepts to fail (technically and/or financially) before achieving commercial viability. Commercialisation Australia aims to bridge this gap between research and successful commercialisation in Australia by providing both financial and non-financial assistance tailored to the needs of each applicant (refer to Figure 10.1.)

156
Figure 10.1 Progression of business maturity and the Australian Government initiatives aimed at bridging these challenges
The Australian government invests significantly in research and development through direct funding of research institutions and the R&D Tax Incentive program for businesses. Commercialisation Australia is there to assist inventors, whether they are researchers at a university, individuals or companies, in proving the commercial viability of their innovation and/or assist them in taking their innovation to market. It is at this very early stage that inventors and entrepreneurs find it difficult to raise capital. Commercialisation Australia effectively leverages the scarce resources available to better prepare business opportunities for downstream commercial interests. Venture capital funds (some of which receive government funding) will invest in the most promising inventions once they have proven commercial viability. Enterprise Connect offers comprehensive advice and support to established Australian small and medium-sized enterprises to help them transform and reach their full potential.
Objective
Qualitative Objectives
Commercialisation Australia aims to build the capacity of, and opportunities for, Australia’s researchers, entrepreneurs and innovative firms to convert ideas into successful commercial ventures, enhancing Australia’s participation and competitiveness in the global economy and generating commercial returns from Australia’s significant investment in public sector research.
1. The objectives of Commercialisation Australia will be achieved by:
2. Providing a range of assistance tailored to the timing and needs of individual applicants, taking account of their stage of development.

157
3. Commercialisation Australia offers funding for commercialisation projects through four different components, which can be accessed by applicants in the order and combination that suits their needs. Commercialisation Australia employs highly experienced business builders and entrepreneurs as Case Managers, who assist program applicants in identifying the most appropriate support strategy.
4. Providing a single coordinated commercialisation support service with multiple entry and exit points, and referrals to other sources of support as appropriate.
5. Commercialisation Australia has customer service representatives in all capital cities as well as the major regional centres around the country, offering one-stop advice on all government support for innovation and commercialisation in their particular jurisdiction. Interested parties may contact their nearest office directly, or phone a free hotline, or contact a Case Manager directly, all of which can provide initial advice on government support available and refer to other organisations where appropriate.
6. Using stringent initial assessment processes to select applicants with high potential for growth and commercial success, while acknowledging the risk inherent in the pathway to commercialisation.
7. Commercialisation Australia’s main focus in selecting participants is the likelihood of commercial success, instead of, for example, focusing on the strength of the applicant’s intellectual property. In other words, applicants must demonstrate a clear and convincing market opportunity, value proposition and execution plan in order to be competitive against other applicants. However, applicants must also demonstrate a need for government funding, and those with relatively low risk in their pathway to commercialisation and high potential for growth and success are unlikely to satisfy this criterion as it would not be unreasonable to expect that these applicants should be able to secure alternative funding.
8. Ensuring efficient delivery by building on current innovation activities and working with existing service providers.
9. Commercialisation Australia has been designed to be complementary to existing government programs supporting innovation. The Chief Executive Officer of Commercialisation Australia and the Case Managers have used their extensive networks in the innovation eco-system to build highly effective linkages that improve both the efficiency and effectiveness of the initiative.
10. Leveraging private capital to maximise the effectiveness of Commercialisation Australia support.
11. Commercialisation Australia applicants must contribute at least 50% of the funding required to complete their commercialisation project (with the exception of Skills and Knowledge applicants, who only need to contribute 20%). Many applicants are able to secure professional investment in conjunction with (or as a result of) Commercialisation Australia support. These applicants have a potential source of additional funding beyond the period during which they receive government support. This ultimately increases their chance of success in the market.
12. Rigorously monitoring the progress of each participant and, if necessary, redirect funding from underperforming participants.
13. Participants are monitored closely and on-going Commercialisation Australia support depends on them successfully achieving agreed performance milestones as detailed in the funding agreement.

158
14. Enhancing access to business services and domain expertise across the nation.
The Skills and Knowledge grants, and the knowledge, expertise and networks of the Case Managers and Volunteer Business Mentors are all designed to enhance participants’ access to business services and domain expertise across the nation and beyond. This is particularly valuable to researchers applying through their research organisation’s commercialisation office, who often lack access to the necessary knowledge and skills required to determine the most appropriate commercialisation strategy for their invention. Enhancing the skills, knowledge and networks of commercialisation offices through their interactions with Commercialisation Australia Case Managers is an important objective of the initiative.
In addition, it is worth noting that Commercialisation Australia has a broader mandate that goes beyond providing assistance to commercialisation projects and also includes;
• assembling information on the early stage commercialisation system which can be used to develop evidence-based policy and to investigate new commercialisation policy approaches and their applicability to the Australian innovation system; and
• identifying a program of research to measure the effectiveness of the Commercialisation Australia program, to support any potential amendment, or development, of the Commercialisation Australia program and to provide input to Government on commercialisation policy.
The pilot programs component of Commercialisation Australia is geared towards this broader mandate. The intent behind pilot programs is to assess the practicality and effectiveness of new, alternative methods of support for commercialisation that will contribute to building the capacity of, and opportunities for, Australia’s researchers, entrepreneurs and innovative firms to convert ideas into successful commercial ventures.
Quantitative Objectives
Commercialisation Australia gathers significant data from client firms before, during and after they receive Commercialisation Australia support. These key performance indicators cover a range of measures, including, human capital, business capabilities, company sales, revenue and capital, innovation and IP, advice and collaboration, finance and development and questions specific to the Commercialisation Australia program. In the future, this data will be used to evaluate the benefit and impact Commercialisation Australia has to client firms.

159
Geographical scope
Commercialisation Australia is a national initiative, reaching all Australian states and territories, however, there is a trend for Commercialisation Australia participants to be based in the eastern states and territories (Victoria, New South Wales, Queensland, Tasmania and Australian Capital Territory). This is explained by the fact that 81.6% of Australia’s population distribution is located on the Eastern Seaboard91.
The central and western states and territories (Western Australia, South Australia and Northern Territory), comparable to their population distribution, account for around 17% of Commercialisation Australia participants. Recently, additional Case Managers have been recruited to these states and territories to increase awareness of Commercialisation Australia support within these areas and to help identify innovative firms who may benefit from the Commercialisation Australia program. Targeting these regions is important as Western Australia in particular is seeing significant growth as a result of the mining and resources boom and now accounts for more than 50 per cent of Australia’s overall economic growth92.
Figure 10.2 Participant support to June 2012 by State and Territory
Beneficiary Firms
Target Firms
Commercialisation Australia provides support to a range of applicants across a variety of business sectors. This support is provided through four grant components, tailored to the growth and commercialisation needs of individual applicants.
91 Australian Demographic Statistics, Dec 2011, Australian Bureau of Statistics, catalogue no. 3101.0 92 Australian National Accounts: National Income, Expenditure and Product, Mar 2012, Australian Bureau of
Statistics, catalogue no. 5206.0
29 1 78
81
18
10
10
73

160
• Skills and Knowledge (S&K) grants of up to $50,000 for expert advice and services;
• Experience Executives (EE) grants up to $350,000 over two years to engage an experienced CEO or other executive;
• Proof of Concept (POC) grants from $50,000-$250,000 to assist with testing the commercial viability of a new product, process or service; and
• Early Stage Commercialisation (ESC) grants of $50,000 to $2 million to assist with taking a new product, process or service to market.
Most program participants are small, privately owned companies limited by shares. On average, they have 4.5 employees. None of the participants were publicly listed companies at the time of application.
The other main group of participants are researchers who successfully applied for Commercialisation Australia assistance through their university or research organisation’s commercialisation office. However, they represent only 6% of total participants.
The average age of participants who are companies at time of application is 5.6 years. This is broken down further by grant component in Figure 10.3.
Figure 10.3 Average age of participants who are companies at time of application by grant component
0
50
100
150
200
250
300
350
Total S&K EE POC ESC
> 20 years
10-20 years
5-10 years
3-5 years
2-3 years
1-2 years
incorporated 0-1 year
Not incorporated at date of application
Years incorporated at application
Commercialisation Australia does not specifically target new firms, however the eligibility
requirements for the program are such that it is highly likely that most applicants are less than 10 years old. For example, applicants for an S&K, POC or EE grant must have annual turnover of less than $10 million, and must aim to commercialise a new, clearly identified product, process or service. Indeed, the program is not designed to assist with the development of new internal processes to enhance overall productivity, or minor incremental improvements and derivatives of established products, processes or services in the marketplace which tend to occur more often in older more established companies.

161
Notably, the program does not target any particular technology or market sectors although, to date, the majority of Commercialisation Australia participants are developing new products and services in the information technology (IT) domain ). This is spread between those focussing on software and web design technologies, and those developing computer systems and hardware applications. A significant number of participants are also developing biotechnology-based products. While most of these products target the health and medical market, there are also a number of biotech-based products for the agricultural and clean technology markets. Manufacturing, Engineering and Design is the other key technology area for Commercialisation Australia participants.
To date, the health and medical market is the largest single target sector and encompasses products from all technology areas. Products being supported include pharmaceuticals, medical devices and IT-based products to improve health management. Other key target markets include agriculture; business marketing and communication; energy and resources; and infrastructure, housing and transport.
Figure 10.4 Technologies supported by Commercialisation Australia
Figure 10.5 Key Markets supported by Commercialisation Australia

162
Firm Selection
Commercialisation Australia is a highly competitive, merit based program, and only the strongest applications are successful. All applicants are assigned a dedicated Commercialisation Australia Case Manager who provides guidance and feedback during this process. Case Managers are contracted to the Department and are all successful business builders, with a wealth of business knowledge. Once an application is submitted as final, Case Managers prepare a detailed assessment of the applicant’s ability to satisfy the merit criteria.
Eligibility Criteria Applications for Commercialisation Australia assistance must meet eligibility criteria to be considered
for support. As such applications for Commercialisation Australia support must demonstrate among other requirements that;
• the applicant has the ability to fund their share of the project costs;
• the project aims to produce, establish the commercial viability of, or commercialise a new, clearly identified product, process or service; and it must involve eligible activities;
Notably, Commercialisation Australia does not fund Research & Development projects where the focus is on basic research or the applicant is proving a technology to itself. There must be a high likelihood of a commercial transaction at the end of the project.
The following organisations are eligible applicants under the program:
• Australian companies that are not tax exempt and that have an annual (grouped) turnover of less than $50 million if applying for the ESC component, or less than $10 million if applying for any of the other three components.
• Individuals (including researchers) who agree to form a company if their application is successful (they must form a company before a funding agreement is signed).
• Researchers applying through their commercialisation office are eligible to apply for the S&K and/or the POC component without the need to form a company first. This allows researchers and their employers to investigate the commercial potential and most appropriate commercialisation strategy for their invention without having to lock themselves into a particular corporate vehicle and ownership structure first.
Matched Funding
The ability of applicants to financially contribute to the costs of their commercialisation project is part of the eligibility criteria of Commercialisation Australia and applicants need to show they have (or will have) access to the necessary funds. For all components, except Skills and Knowledge, participants are required to contribute on a 50:50 basis - that is, for every dollar of Commercialisation Australia assistance they apply for, they need to show that they are able to contribute at least the same amount. The rate of contribution for the Skills and Knowledge component is set at a much lower rate of 80:20, with participants contributing at a rate of 20% to account for the very early stage commercialisation process that these applicants are generally in and the relative risk.

163
Merit Criteria
Commercialisation Australia is a competitive merit based program and assesses and prioritises applications against the merit criteria. The Commercialisation Australia Board assesses applications first against the ‘Need for funding’ criterion and only applications that demonstrate a need for funding will be assessed against the remaining merit criteria, outlined below, and receive a merit ranking.

164
Need for funding
The Australian Productivity Commission, in its 2007 report Public Support for Science and Innovation, argued that previous innovation programs failed to generate additionality because they supported projects that were likely to proceed without government support.
The Productivity Commission’s findings were carefully considered during the design of Commercialisation Australia and it was agreed that need for funding should feature strongly in the merit criteria for the program. Commercialisation Australia addressed this concern by tightening the rules around need for funding. Previous programs considered need for funding as one of several merit criteria and the combined rating against all merit criteria determined whether an application is competitive or not. Commercialisation Australia is different in that applications are assessed first against the ‘Need for Funding’ criterion. Only applications that clearly demonstrate a need for funding may be supported by the Board. This means that applications with a low need for funding cannot compensate for low merit against this criterion through high merit against the other criteria. As such applicants for Commercialisation Australia support must demonstrate that they;
• have insufficient financing to fund the entire project
• it would be unreasonable to expect that the applicant should obtain financing from alternative sources
Market opportunity
Market opportunity assesses the customer problem that the applicant has solved and/or what market demand there is for the product, process or service. This provides an opportunity for the applicant to define their target market and the potential size of the market. Applicants must therefore address;
• the need for the new product, process or service
• the type of customer
• the size of the target market
• the strength of the Intellectual Property (including novelty)
Value proposition
Assessment of the value proposition requires applicants to explain the customer’s needs, desires and drivers and what would motivate them to purchase the product, process or service. The applicant must detail the value of the new product, process or service from the customer’s perspective and the competitive advantage that their product, process or service will have over what is currently available. Applicants must provide evidence to confirm the functionality and/or technical viability of their product, process or service and outline an appropriate business and delivery model. Applicants will therefore be assessed against whether they have;
• a clear, concise and compelling value proposition, detailing why the customer wants the product, process or service

165
Execution plan
Applicants are assessed against their ability to clearly outline overall objectives and the tactics that will be used to achieve these objectives. These include the path to market, the key structural or market challenges to be resolved, the core elements of the operational plan and communications, revenue/cost and profit projections over the next 12 to 36 months. The ability of the applicant to manage any intellectual property necessary for successful commercialisation is also vital, as is their ability to identify anticipated future capital requirements to exploit the market opportunity. Applications must therefore have;
• A sound execution plan to capture the opportunity and manage the risks, for example
− a clear set of objectives
− a clearly defined path to market
− an understanding of the key structural or market challenges to be resolved
− a sound IP strategy
− a sound manufacturing strategy (where applicable)
Management capability
The management capability of the applicant is critical to their future success. As such applications must;
• Demonstrate an appropriate level of expertise in; commercialisation management, project management, business management, the relevant sector/technology domain.
National benefits
Projects that promise significant public benefits and positive externalities to the wider community have stronger justification for government support. Thus applications must demonstrate how;
• The project will improve Australia’s participation and competitiveness in the global economy.
• significant spill-over benefits will accrue to Australia through the conduct of the project and/or commercialisation of its results, including:
− diffusion of knowledge and skills;
− diffusion of new products, processes or services; and/or
− increased collaboration between businesses and/or businesses and research institutions.
Case Manager Assessment
Applications are assessed against the above merit criteria by a Commercialisation Australia Case Manager, who provides a recommendation to the Commercialisation Australia Board. Case Managers meet with applicants and provide them with guidance and feedback during the application process. Once an application is submitted as final, Case Managers undertake the necessary due diligence before preparing a

166
detailed assessment for the benefit of the Board. Due diligence includes verification of critical evidence and statements made by the applicant.
Case Managers familiarise themselves with the past performance of the applicant’s business and the track record of the management team, which often provides a better indicator of future business performance. As successful business builders with a wealth of business knowledge, Case Managers consider and critique, amongst other areas, the applicant’s business idea, product portfolio, proposed business model, current and future customer portfolio and market position. The Case Manager’s detailed assessment is provided to the Commercialisation Australia Board for consideration along with the original application.
Commercialisation Australia Board Assessment
The Commercialisation Australia Board is an independent Board appointed by the Minister to assess grant applications and provide other advice to the Department. Board members are equipped with the technical and commercial expertise to assess and provide advice on the merit of applications. The Chief Executive Officer of Commercialisation Australia is an ex-officio member of the Board.
The Commercialisation Australia Board meets regularly to undertake merit assessment of eligible Commercialisation Australia applications against the program merit criteria. Applications can be submitted at any time and will be considered at the next possible Board meeting.
Once the Board has rated all applications, it provides the Program Delegate (a Departmental employee empowered by the Minister to approve grant funding and enter into funding agreements) with a merit ranking of the applications it has considered.
The Program Delegate has the final decision in determining the quantum, terms and conditions of support and funding under the Commercialisation Australia program. The Program Delegate's decision is final in all matters.
As of August 2012, the Board had considered 537 applications, of which 343 were approved for funding by the Program Delegate (a 63% success rate).
Range of Services
Business Diagnosis
Case Managers meet with applicants and provide them with guidance and feedback during the application process. Case Managers provide advice to potential applicants on whether the application will be competitive in its current form and areas that may need strengthening. The Commercialisation Australia application form requires applicants to address the sorts of questions facing every company and entrepreneur trying to take a new product or service to market. They must assess market opportunity for the new product, identify a compelling value proposition (i.e. why customers will purchase the product) and outline a plan to reach the market (an execution plan). The application process itself is highly beneficial to potential firms as evidenced by the fact that applicants completing this process have subsequently been able to attract external investment.
There is one particular example where a successful applicant was offered Commercialisation Australia funding but had to decline the offer because in between submitting their application and receiving the offer of funding, the company had secured private seed funding. It now had sufficient funds and expertise to cover all costs and tasks specified in their grant application. In notifying Commercialisation Australia of their decision, the company pointed out that it was the rigorous process

167
required to submit the grant application that made it attractive to private investment and the offer for grant funding allowed them to negotiate from a position of strength and secure seed funding arrangements with very favourable terms.
Once an application is submitted as final, appraisal of the strengths and weaknesses of the application are assessed by the Case Managers. Case Managers undertake due diligence during this evaluation, to verify and substantiate the applicants claims. For example, they speak to investors and customers and they visit the applicant’s premises to view product demonstrations and talk to staff. They draw on their skills and experience in conducting the due diligence and making relative judgements on the strengths and weaknesses of applicants. This process typically takes about a week. Case Managers tend not to use any particular business diagnosis tools as most applicants are in a start-up phase and the focus of the application is on the proposed project. The Case Manager’s assessment is provided to the Commercialisation Australia Board for consideration with the company’s original application. Additional information on the due diligence process is at Annex 10.A2.
Support Services
Funding Support
Commercialisation Australia provides support through four grant components, designed to tailor assistance to the growth and commercialisation needs of individual applicants. Details on the components are included below and a breakdown of the funding components used by Commercialisation Australia participants is illustrated in Figure 10.6.
• Skills and Knowledge offers grants of up to $50,000 to purchase expert advice and services. This component is most suited to people new to commercialisation - researchers, individuals and small companies - who know their intellectual property has commercial potential, but who don’t know what to do next. Case Managers help participants identify what specialist advice they most need and where to access it. Participants in the Skills and Knowledge component can apply for other components of the program at any time. Applicants need to match the grant funding on an 80:20 basis, where the applicant contributes 20%. Participants must complete this component within 12 months.
• Experienced Executives provides grants of up to $350,000 over two years to engage an experienced Chief Executive Officer or other executive. This component is designed to give small innovative firms and people new to business the experienced management skills they need. Applicants need to match the grant funding on a 50:50 basis. Only companies can apply for Experienced Executives grants.
• Proof of Concept grants from $50,000 up to $250,000 are available to assist with establishing the commercial viability of a new product, process or service. Participants need to match the grant funding on a 50:50 basis and complete this component within 12 months.
• Early Stage Commercialisation provides grants from $50,000 up to $2 million to assist in bringing a new product, process or service to market. Participants need to match the grant funding on a 50:50 basis and are expected to complete this component within two years. Only companies can apply for Early Stage Commercialisation grants.

168
Figure 10.6 Commercialisation Australia funding components used by participants
Multiple Grant Components, 16%
Skills & Knowledge, 28%
Experienced Executive, 4%
Proof of Concept, 30%
Early Stage Commercialisation,
22%
Case Managers
It has been said that inventors make poor business people, perhaps because they care too much about what they are developing. Often researchers, entrepreneurs and small companies know that their product has commercial potential, but don’t know what to do next.
Commercialisation Australia aims to address this by assigning all participants a dedicated Case Manager who guides them through the commercialisation process. Participants have access to their Case Manager for the duration of their project and in some cases up to six months after project completion. The commitment of Case Managers reflects the importance Commercialisation Australia has put on quality assistance and guidance for new ventures as opposed to just providing financial assistance.
Case Managers are the public face of Commercialisation Australia, delivering assistance and advice to participants, and identifying the key activities needed to move along the commercialisation pathway. They are all successful business builders, with a wealth of knowledge to impart to participants, and are often able to facilitate crucial linkages to business partners within their own networks or within Commercialisation Australia’s own Volunteer Business Network.
Case Managers can provide invaluable guidance, from strategic and operational advice, through to business planning and evaluation, to development of long-term goals. They draw on their own experience to alert participants to potential road blocks and to strengthen a company’s overall position when taking a new product to market. Importantly, Case Managers can also act as a sounding board and encourage participants to take a step back and assess the strategic direction of the project. They provide a fresh perspective, highlight overlooked opportunities and assist in developing a robust commercialisation plan.
Commercialisation Australia continues to monitor the demand for Case Managers, and specifically where demand for Case Manager assistance is coming from in terms of geography and industry sectors, and the type of assistance and advice participants expect to get from their Case Manager.

169
Volunteer Business Mentors
Successful business relies on strong networks. The right connections can accelerate a company’s access to the marketplace. Commercialisation Australia provides participants with networking opportunities not readily available to other start-up businesses. Case Managers introduce participants to service providers, investors, industry representatives and even potential customers who can become a support network. Commercialisation Australia also provides participants with the opportunity to attend a range of events aimed at helping them make valuable business contacts.
Key to this are Commercialisation Australia Volunteer Business Mentors (VBMs) who are a vital element of the tailored assistance Commercialisation Australia offers to its participants. Small companies and people new to business often do not know who to talk to and how to make the business connections necessary to develop their intellectual property. VBMs extend the networking reach of participants by enabling Case Managers to identify highly skilled and experienced people who can further assist participants along their commercialisation journey. The constant addition of talent to this database enriches the Commercialisation Australia ecosystem thereby increasing the value Commercialisation Australia offers to participants over time.
The VBMs have hands-on experience in building and/or selling a business, specialist domain expertise, knowledge of international markets and extensive networks in their areas of expertise. The mentors are well placed to offer guidance and practical approaches to assist participants tackle specific commercialisation hurdles and to build valuable business networks.
The VBMs complement the assistance provided by the Case Managers. As a first step, the Case Managers will work with participants to determine their specific business needs and match them to appropriately skilled mentors. As participants move through the commercialisation process, their needs may change and they can be matched to one or more mentors as required.
Commercialisation Australia facilitates an introductory meeting between a participant and a mentor. These meetings tend to be relatively short and topic specific but may lead to the formation of ongoing relationships. Commercialisation Australia steps back after the first meeting to allow commercial relationships to establish naturally without any restrictions and to the mutual benefit of participant and mentor. Having no formal role beyond the introductory meeting also reduces potential liability issues for the Commonwealth.
Individuals interested in joining the Commercialisation Australia VBM network undergo a screening process and if selected, need to sign a declaration to act ethically and respect confidentiality of information. The screening process has focussed on identifying suitable mentors in three categories - those with direct commercialisation experience; domain experts in technical fields and professional investors, angels and high net worth individuals. VBMs do not get paid for their services but may be reimbursed for travel expenses.

170
Does the programme mainly promote innovation? If so, only technological innovation or also other forms?
These support services help Commercialisation Australia promote innovation in the Australian ecosystem by aiding the commercialisation of a new product, process or service. Importantly, support is not limited to technological innovation and indeed, Commercialisation Australia supports a number of innovative services and processes.
Does it help firms get debt or equity finance?
Commercialisation Australia provides support for participants to attract debt and equity finance as 42% of Commercialisation Australia participants initially indicate they have the intention of raising capital (borrowings or equity) while participating in the Commercialisation Australia program. Commercialisation Australia Case Managers work closely with participants to review and advise firms on their options for attracting further investment. Moreover, the application process alone, due to the steps required, has helped firms become attractive to external investment.
All Commercialisation Australia participants also have access to the Volunteer Business Mentor Network. The Commercialisation Australia VBM Network includes a number of venture capital managers, angel investors and high net worth personal investors through whose networks new financing may be achieved. Case Managers also have their own extensive networks and these are available to help facilitate introductions to potential investors.
The Skills and Knowledge funding component also provides for the retention of expert advice which may help identify new debt and/or equity financing options. Furthermore the Experienced Executive funding component provides for the full time employment of a knowledgeable executive who has considerable business networks and can potentially facilitate new investment opportunities.
Does it try to upgrade the managerial skills of the entrepreneur or the technical skills of the workforce?
Commercialisation Australia support extends to improving the managerial and technical skills of participants. The program provides support through the Experienced Executives grant which assists firms in the engagement of an experienced CEO or other executive. This creates an environment conducive to the transfer of skills. Support is also offered through Case Managers who help build business skills and experience by imparting technical and managerial expertise.
Does it support access to international markets? Through which specific tools, does the programme bolster each of these areas?
About half of all participants have a formal internationalisation strategy when they start receiving Commercialisation Australia support. The program supports projects that aim to make first sales or other commercial transactions in an overseas market, however the overseas market must be the key market for the new product, process or service and the need for funding must be clearly established, especially where the applicant has already sold the new product, process or service in Australia.
Commercialisation Australia provides opportunities for participants to build market internationalisation. This support is provided through the Case Managers, who often have both national and international networks within participants’ business sectors. The Volunteer Business Mentor network also links participants with business mentors who may have knowledge of international markets and extensive networks with which introductions can be made. Furthermore, client firms receiving the Experience Executive funding component may similarly receive the benefit of international contacts who may aid in business internationalisation. Several participants have used the Experienced Executives grant to engage a business development or market development executive in a specific international market.

171
Fast Failure
Commercialisation Australia accepts the reality that some projects will fail. Some participants may fail to achieve technical milestones and others may fail to achieve commercial milestones. Commercialisation Australia has adopted a process of ‘fast failure’ whereby failing projects are managed in one of three ways:
• bringing forward the project end date;
• mutual termination of the funding agreement (where the Commonwealth and the participant agree to terminate the funding agreement); or
• unilateral termination (where the Commonwealth terminates the funding agreement).
The most appropriate option will depend upon the particular circumstances in each case. This approach ensures that failing projects are not continued and that financial and other resources of both Commercialisation Australia and the participant are reallocated to projects with greater potential.
It is expected that in most cases the participant agrees that the project is a failure and the funding agreement is mutually terminated. The Case Managers monitor the progress of projects closely and also look at any changes to markets that may impact on the potential commercial success of a project. Participants who exit the program under “fast failure” may be eligible to reapply for Commercialisation Australia assistance with a new commercialisation project. If the applicant can demonstrate how they have learnt from past experience the Board will not view the earlier failure negatively.
An example of fast failure is a company that received a $250,000 grant to prove the commercial viability of a new software tool for the water industry. The project was heavily reliant on cooperation with an industry partner who was to trial the tool and potentially acquire ongoing licences across its operations. Unfortunately, the industry partner pulled out of the project after six months due to a lack of available funding. This caused a significant delay to the project and the company decided, after a strategic review of its operations, to end the project in order to make the best use of available resources. Commercialisation Australia funding for the project ceased and the company ended up drawing just $78,000 of the $250,000 grant it was awarded for this project.
Delivery Arrangements
Commercialisation Australia is headed by a Chief Executive Officer (CEO), and is delivered in partnership with AusIndustry, the program delivery arm of the Department of Industry, Innovation, Science, Research and Tertiary Education. The CEO of Commercialisation Australia is responsible for the overall design and functioning of the program. The CEO is also responsible for selecting and managing the Case Managers.
Delivery of Commercialisation Australia support services is fully internalised and principally provided to participants through Commercialisation Australia Case Managers. The contract for Case Manager services is between the Commonwealth and a company that undertakes to provide the required services for the Commonwealth. The contract specifies the personnel that must deliver the services, and the approval process that must be followed if the company proposes a change to the specified personnel. The company may provide other services not related to Commercialisation Australia but must follow stringent conflict of interest obligations.
Delivery of Commercialisation Australia support in this manner provides greater flexibility in controlling the quality of the support provided to participants thereby improving outcomes. Although Case

172
Managers are contracted directly to Commercialisation Australia they may be viewed, in some respects as intermediaries.
Recruitment of new Case Managers requires a formal open tender selection process as per Government guidelines. Case Managers also undergo continual evaluation throughout their employment and among others, feedback is sought from Commercialisation Australia participants, Customer Service Managers and the Commercialisation Australia CEO.
Case Managers are recruited as per Departmental Contracts and Procurement guidelines through an open tender process. Open tendering offers a framework and selection process that is accountable, consistent and objective. A Request for Tender document is advertised on the AusTender website outlining the Case Manager selection criteria. Interested candidates then submit an application, addressing the selection requirements. An evaluation panel assesses each application against these selection criteria and eligible applicants are invited for interview. During the interview process candidates are again assessed against selection criteria and offers are made.
The open tender selection criteria assess the tenderer’s capability and capacity to fulfil the role of a Commercialisation Australia Case Manager to the highest standard. As such Case Managers must demonstrate;
Capability
• Direct experience in successfully commercialising new intellectual property. The following aspects are highly regarded:
− Experience as a founder and/or CEO of a start-up business focused on commercialising new technology and/or novel intellectual property;
− International experience, including one or more of sales/marketing, channel distribution and/or corporate flip-ups.
• Professional investing and/or advisory experience at the seed or start-up stage of company development.
• Extensive domestic and international networks within the commercialisation field.
• Excellent written and oral communication skills.
• Experience advising entrepreneurs and/or inventors with respect to commercialisation activities, such as business development, value proposition construction, raising capital and operational management.
Capacity
• Capacity to provide face-to-face Case Manager services to clients based in key metropolitan and regional areas of each state and territory of Australia.
• Capacity to provide Case Manager services on a full or part-time basis.
• Technical and/or business domain qualifications.

173
Strengths
• Commercialisation Australia has already made a significant difference to the innovation landscape in Australia. It has assisted 300 participants as per the end of August 2012, helping them progress to or reach the market with their new product, process or service through the provision of funding, advice and linking them to new networks. These projects would not have proceeded or proceeded much slower without this government support. The program has been highly competitive, with many meritorious applications missing out on funding because of the quality of applications received.
• Of the 300 participants assisted so far, 69 have completed their Commercialisation Australia project. Most of these (50) were satisfied with project outcomes and have either entered the market, or are progressing towards entering the market, with their new product, process or service. Only four projects failed and will not proceed, while 16 were at least partially successful and commercialisation may still occur but additional work will be required.
• Commercialisation Australia has facilitated the building of a synergistic innovation eco-system in Australia by connecting innovative companies and research organisations with the key networks and contacts they require. Some of these include Case Managers, Volunteer Business Mentors, professional investors, commercial partners, other inventors, service providers, other government agencies such as Austrade, and even Australian expatriates through Advance (a non-profit organisation that encourages global connections for Australians all around the world). Commercialisation Australia has been able to attract over 150 Volunteer Business Mentors to the program.
• Commercialisation Australia has worked very well in complementing the R&D Tax Incentive program, allowing companies to continue using the tax incentive to support ongoing research and development before, during and after commercialisation.
• Commercialisation Australia was able to recruit an experienced entrepreneur and investor as Chief Executive Officer (CEO) for the program. As a result, the program is highly focused on commercialisation and is employing many concepts used in the professional investment world. The CEO has been instrumental in attracting and selecting highly experienced professionals as Case Managers. These are the key factors that made Commercialisation Australia a very well embedded and respected government initiative within the Australian innovation eco-system.
• Case Managers are critical to Commercialisation Australia. Program participants consider assistance by an experienced Case Manager as highly beneficial to the success of their commercialisation project, and Case Managers are central in putting forward high quality applications to the Board.
• Case Managers work as a team, accessing each others’ skills, knowledge and networks to provide high quality support and assistance to program participants.
• Feedback at this early stage of the program indicates that Commercialisation Australia provides excellent customer service, through Case Managers and the AusIndustry network, to all applicants regardless of their success with obtaining funding. Several participants have noted that their Case Manager has made a real difference to the success of their business.
• Commercialisation Australia applications are assessed on a continuous basis, meaning applicants can submit their application (and in some cases start their project) at any time during the year.

174
The application process is in two stages, with a short Stage 1 Application to provide early feedback on eligibility and merit, followed by a comprehensive Stage 2 Application for those who are eligible for the program and want to continue the process. The two stage process is an efficient, customer friendly and equitable way of filtering applications.
Box 10.1 Case managers' statements
“I think the major strength of the program is that it is about more than just the money: the business advice and network connections are very valuable. Much of this stems from the Case Manager model, with people who have been there and done it (and made some of the mistakes before) interacting with the companies. The Commercialisation Australia CEO is also of the same mould, having built businesses himself and been in the venture capital space. He has been very instrumental in shaping the program to much better reflect commercial reality.
“Being an entrepreneur myself, I know my biggest challenge was not having that ‘objective sounding board’ who would give me honest, constructive feedback, that wasn’t an investor, client or friend, but had sound experience and knowledge to draw from and was committed to seeing me succeed. This, I believe, is the core value of the Commercialisation Australia Case Manager experience, and one that both applicants and participants come away with.”
Weaknesses
• Commercialisation Australia has four components that address different project stages and are suited to different types of applicants, with grants ranging from as little as $10,000 up to $2 million. However, many of the governing documents and application processes are the same, regardless of the component. This makes administration of the program simpler and in some ways fairer, but makes it harder to determine the right level of due diligence and risk management.
• Commercialisation Australia has to operate within the budget framework of the Commonwealth, which allocates fixed funding for each financial year and thereby makes it difficult to respond flexibly to revised funding requirements from participants whose projects are not proceeding according to plan.
• Commercialisation Australia has experienced business builders as Case Managers and Board members, which is of great benefit to the program and its participants. However, the extensive personal linkages they bring to the program also means Commercialisation Australia must maintain a stringent management of conflicts of interest, whether actual or perceived, to preserve the integrity of the program in the face of the public scrutiny, especially from applicants.
• The Volunteer Business Mentor scheme requires careful risk management to protect the Commonwealth from any potential claims for damages where a participant may have an unsatisfactory experience with a particular VBM. Similarly, the participants and VBMs themselves require some protection from litigations. The risk mitigation measures create additional hurdles that may prevent some interested and highly qualified people from joining the VBM network.

175
M&E system and proven impact
Commercialisation Australia has established an evaluation strategy including a full set of metrics based on the Key Performance Indicators agreed to by the Commercialisation Australia Board. In addition to the monitoring of funding agreements and financial arrangements, participants will be studied both during and post completion of Commercialisation Australia activities in order to track outcomes and overall effects of involvement with the program. Annex C provides further details on metrics used in the M&E system.
Commercialisation Australia underwent an interim evaluation of the initiative in 2010. The purpose of the interim evaluation was to review implementation of the new model and to determine whether the funding profile remains appropriate. The interim evaluation found that Commercialisation Australia performed very well during the initial period of operation and that early program data suggests there will be sufficient demand for Commercialisation Australia support to fully allocate the program’s forward budget profile. Commercialisation Australia dealt with very high pent-up demand for government assistance at the same time as introducing a program that is quite different from any of its predecessors in its governance, its delivery, and its flexible multi-component benefits structure heavily focused on commercialisation.
The Interim Evaluation found that stakeholders are highly satisfied with the program. The type and level of assistance provided by Commercialisation Australia is considered appropriate and there is high demand for each individual program component. The program is reaching its target market of small innovative start-up companies, however uptake from the university and research sector has been slower than anticipated.
Stakeholder responses and program data indicated the Need for Funding criterion is being applied appropriately to ensure Commercialisation Australia funding achieves additionality. However, there was scope to improve communication to applicants to increase their understanding and acceptance of this criterion.
The flexible program design was welcomed by applicants as the different program components are relevant to their needs at various stages of the commercialisation process. Moreover, the additional support of an experienced Case Manager adds significant value to grant funding.
Departmental processes were generally operating efficiently, but there was scope to streamline application and approval processes, particularly in relation to the Skills and Knowledge granting component.
All recommendations of the Interim Evaluation have now been actioned.
A full evaluation of Commercialisation Australia inputs, outputs and outcomes will be undertaken in 2013. This evaluation will provide scope to assess the outcomes and impact associated with CA support, although the number of participants that have completed their project and provided post completion reports will still be relatively small given the program opened less than three years ago.
It is expected that Commercialisation Australia will be the subject of an independent evaluation about every third year of operation. The program will be assessed against the criteria of appropriateness, effectiveness, efficiency, integration, performance assessment and strategic policy alignment, as described in the Expenditure Review Principles published by the Department of Finance and Deregulation.
Performance of the program is measured through tracking the progress of participants in achieving project and business success for up to five years after the project was completed. Data collection is based

176
on a longitudinal design whereby participants complete a baseline data collection form at the time of signing their first funding agreement with Commercialisation Australia. Participants will complete an interim performance report every year during the period their project receives Commercialisation Australia assistance. Once the project is completed the participants submits a project completion report. Post project completion reports are required every year for five years thereafter. The value of the data collected during and post participation is only realised when viewed in comparison with the pre-Commercialisation Australia snapshot of the participant taken through the baseline form.
Commercialisation Australia does not have quantitative targets for its key performance indicators, acknowledging that success can take many different forms, including the fast failure of a project and re-allocation of resources.
Recommendations for improvement
Given the program has been in operation for less than three years and the first full evaluation is not due until 2013, it is too early to recommend any improvements.
Conclusions In response to market and systemic failures in the pathway to commercialisation, Commercialisation
Australia aims to build the capacity of, and opportunities for, Australia’s talented researchers, entrepreneurs and innovative firms to convert ideas into commercial ventures, enhancing Australia’s participation and competitiveness in the global economy.
Commercialisation Australia supports innovation through an integrated suite of assistance tailored to the needs of each participant, working with existing systems and infrastructure, and leveraging private sector investment. Key strengths of the program are its commercial focus, the quality of its Case Managers and VBMs, and the suite of funding options that are available to applicants. Participants have access to skills, knowledge and expert advice for the duration of their interaction with Commercialisation Australia, to build their capacity, as well as provide assistance, to commercialise.
Commercialisation Australia has already made a significant difference to the innovation landscape in Australia. It has assisted 300 participants (or past participants) as per the end of August 2012, helping them progress to or reach the market with their new product, process or service through the provision of funding, advice and linking them to new networks. These projects would not have proceeded or proceeded much slower without this government support. The program has been highly competitive, with many meritorious applications missing out on funding because of the quality of applications received.
Commercialisation Australia has established an evaluation strategy including a full set of metrics based on the Key Performance Indicators agreed to by the Commercialisation Australia Board. In addition to the monitoring of funding agreements and financial arrangements, participants will be studied both during and post completion of Commercialisation Australia activities in order to track outcomes and overall effects of involvement with the program.
A full evaluation of Commercialisation Australia inputs, outputs and outcomes will be undertaken in 2013. This evaluation will provide scope to assess the outcomes and impact associated with CA support, although the number of participants that have completed their project and provided post completion reports will still be relatively small given the program opened less than three years ago.
Commercialisation Australia is a critical element of the Government’s long-term commitment to building innovation performance and has the flexibility to adapt, ensuring it remains relevant into the future.

177
ANNEX 10.A1.
TRANSFERABILITY
Commercialisation Australia has become a highly reputable source of assistance for innovative firms and researchers in Australia because it offers much more than just money. The overall design of the program would appear to be suitable to other places without any major adjustments or corrections necessary. However, it would be worthwhile considering whether the specifics of a particular jurisdiction, such as economic conditions, market failures and government structures, would warrant some adjustments, for example:
• Are the funding limits for each of the four components appropriate?
• Are the co-contribution ratios for each of the four components appropriate?
• Are the turnover limits for eligible applicants appropriate?
• What level of autonomy from government is possible in the delivery arrangements to allow for maximum flexibility in responding to participant needs and changing market conditions?
Commercialisation Australia has been approached by the New Zealand government, the South African government and the Canadian government for information about the program, but there has been no actual attempt to transfer the program to another jurisdiction as yet.

178
ANNEX 10.A2.
ASSESSMENT AND DUE DILIGENCE PROCESS
Assessment and due diligence is undertaken in three stages
1. AusIndustry: assess against the Eligibility Criteria.
2. Case Managers: assess against the Merit Criteria, complete due diligence, and recommend to the Commercialisation Australia (CA) Board.
3. CA Board: assess and prioritise against the merit criteria, and provide a merit ranking to the Program Delegate for decision.
Additional information is available in the current Customer Information Guide available on the CA website: www.commercialisationaustralia.gov.au
Merit criteria and Due Diligence
The CA Board assesses applications first against the ‘Need for funding’ criterion. Only applications that demonstrate a need for funding are assessed against the remaining merit criteria and receive a merit ranking.

179
Merit criterion Additional information Examples of due diligence completed by case managers
Need for Funding • The applicant has insufficient financing to fund the entire project.
• It would be unreasonable to expect that the applicant should obtain financing from alternative sources.
• Financial information – includes discussions with applicant’s accountants and existing finance providers.
• Information from bank re limits on loans (if appropriate) or reasons for not providing loans – includes follow-up by phone.
• Discussions with prospective investors approached by applicant to understand reasons for declining opportunity.
Market Opportunity
• The need for the new product, process or service is clearly defined.
• The type of customer is clearly defined. • The size of the target market. • The strength of the IP and how it will
address the market opportunity.
• Web-based research to scope out market, incl opportunity, competitors (direct & indirect), size and “crowdedness.”
• Use of own networks (incl other Case Managers & CA’s Volunteer Business Mentors) to obtain additional detail relating to relevant markets.
• Access databases available on line or via own sources. • Discussions with applicant’s IP attorneys.
Value Proposition
• A clear, concise and compelling value
proposition, i.e. why the customer wants the product, process or service.
• Request evidence (letters/email) from potential & current customers, follow-up by phone – a critical “reality check.”
− Use of networks to confirm: − Market interest in the product, process or service. − Competitive advantage, incl identifying new direct & indirect
competitors. − Relevance of business & delivery model.
Execution Plan
• A sound execution plan to capture the
opportunity and manage the risks, for example
− a clear set of objectives − a clearly defined path to market − an understanding of the key structural
or market challenges to be resolved − a sound IP strategy
• Web research, know-how and networks used to confirm:
− the described path to market, including timing and cost, is appropriate and likely to succeed;
− the appropriate regulatory approvals have been identified; − the key risks have been identified and appropriate risk mitigation
strategies are in place; − the IP strategy is appropriate for the business – includes discussion
with the applicant’s IP attorneys.

180
Management Capability
• The applicant demonstrates an appropriate
level of expertise in:
− commercialisation management − project management − business management − relevant sector/technology domain
• Networks and know-how to ensure that the applicant has the relevant expertise in place to complete the project and leverage from this project through to commercialisation.
• Review of the management team, board, advisory board and/or external consultants, including via other Case Managers.
• CA’s Volunteer Business Mentor program can assist participants (ie successful applicants) with advice, skills and knowledge.
National Benefits
• The project will improve Australia’s
participation and competitiveness in the global economy.
• Significant spill-over benefits will accrue to Australia through the conduct of the project and/or commercialisation of its results, including:
− diffusion of knowledge and skills; − diffusion of new products, processes or
services; and/or − increased collaboration between
businesses and/or businesses and research institutions.
• Networks and know-how to confirm that the benefits described are likely to result from the project.
• This often includes providing applicants with information on broader National Benefits that they have not described.
1. Confidentiality is maintained at all times; confidential information is never disclosed without the applicant’s written consent.

181
ANNEX 10.A3
KEY PERFORMANCE INDICATORS AND MEASURES
Convert intellectual property into commercial
outcomes: Indicators
Measure When What it may show
Companies active and trading
Active businesses (ABN) and trading status (indicated by active GST). Identify formation of new companies and changes to company structures.
Entry Interim
Completion Post Completion
Sustainability. Monitor individuals forming new companies, and also track divestment of businesses.
Employment
Number of full-time, part-time and contractors employed and academic qualifications.
Entry Interim
Completion Post Completion
Changes in company needs (eg. shift from contractors to permanent staff). New jobs and skills generated
Revenue and Profit
Revenue generated from direct sales and other activities (e.g. licensing).
Entry Interim
Completion Post Completion
Revenue and profit, new market entry (project) and provide information on business activity and skills development.(company)
IP portfolios
Methods of IP protection, development of IP skills, plans and strategies, total % of a company's IP portfolio that the CA project represents
Entry Interim
Completion Post Completion
New IP generated; value of existing IP of CA project to company; skills (relating to protection methods/strategies)
Collaborative partners
Networking and collaboration activities. Linking of business-to-business and business-to-academia. Number of strategic alliances and joint ventures (existing continuing, new). Types of advice sought and from whom.
Entry Interim Completion Post Completion
Linkages in business, industry, associations, partnerships, links to state and territory programs, skills needs and areas where external advice actively sought.
Investment capital
Amount and sources of private capital and other funding attracted to CA project.
Entry Interim
Completion Post Completion
Leveraged public funds, demonstrate whether CA project success results in increased investment. Skills in sourcing and attracting funds
Investment in R&D
Capital and human resource investment in R&D of the company (not project specific)
Entry Interim
Completion Post Completion
A measure of innovation in a company (although R&D is not a focus of the CA program)
Internationalisation
Development of business activity including business activities, overseas, exports and strategic
Entry Interim
Competitive businesses and business activity, skills for networking,

182
sales, including planning. Completion Post Completion
commercialisation and marketing
Achievement of milestones
Based on CA project plan – achievement of milestones and payment acquittals. Projects that ‘fast fail’ and ensuring participants develop skills and obtain resources required to achieve results.
Entry (project plan)
Interim Completion Post Completion
Ability to meet identified milestones and undertake realistic planning. Demonstrate ability to change and adapt new plans.
Funds invested including grants received
Amount of capital CA project consumed and what value the project provided to the company/individual (i.e. has the enterprise value increased beyond the capital input) (also links to indicator 6. Investment capital)
Entry Interim
Completion Post Completion
Company valuations where projects are successfully commercialised. Total capital input to project and company investments.

183
PART III – OTHER LEARNING MODELS

184
CHAPTER 11. ENGLAND'S GROWTH ACCELERATOR
Background
Recent UK research has highlighted the significant role of high-growth firms in job generation, reflecting the international evidence93. One recent UK report found, for example, that over a three year period, 6 per cent, or around 11,000 UK businesses with 10 or more employees created around half of all net employment growth94. Despite this positive, aspect the demographics of business growth in the UK remain stark. Of the 250,000 businesses started in 2007, only some 7,000 businesses managed to achieve at least £1m annual turnover after three years. Of the overall pool of UK firms, only 7% qualified as high-growth firms by sustaining an annual employment growth of 20% for three consecutive years95. And, compared to a number of other OECD economies, UK firms suffer from a distinctive ‘growth’ deficit in terms of both aspired and realised growth96.
The GrowthAccelerator Programme is intended to address these issues accelerating growth among SMEs with significant growth potential. Launched in May 2012 the scheme provides structured coaching for SMEs’ leadership teams97. The scheme aims to assist 26,000 firms over a three-year period, with public investment in the scheme approaching €250m (£200m). The GrowthAccelerator Programme relates only to England, other arrangements for supporting high-growth firms exist in other parts of the UK.
Programme Rationale
There is significant evidence linking business coaching to subsequent growth. There is also a strong preference among SME owners for the type of individualised and informal knowledge transfer which is provided by coaching. The accessibility of coaching schemes to under-represented groups is also an attractive feature of this type of scheme98. Evidence from the UK Small Business Survey 2010 also illustrates that the use of external mentoring is related to past and anticipated future growth: 13 per cent of
93 Henrekson, M., & Johansson, D. 2010. Gazelles as job creators: a survey and interpretation of the
evidence. Small Business Economics, 35(2): 227-244. 94 NESTA (2009) ‘Measuring business growth’ 95 Anyadike-Danes, M Bonner, K and Hart, M, 2011, Job Creation and Destruction in the UK, for
Department of Business Innovation & Skills, October. 96 Bravo Biosca, A (2010) “Growth Dynamics: Exploring business growth and contraction in Europe and the
US” NESTA Research report: November 2010 97 The GrowthAccelerator Programme launch was essentially a rebranding and re-launch of an existing
programme called ‘Coaching for High Growth’ originally launched in January 2012. 98 UK small business survey data suggested that in 2010 women-led SME employers (15 per cent) and
Minority Ethnic Group led SME employers (14 per cent) were more likely (15 per cent) to have used a business mentor in the last year than all SME employers (11 per cent). Source: BIS (2011) ‘The use of Business Mentoring by Small and Medium Sized Enterprises’, available at: http://www.bis.gov.uk/assets/biscore/enterprise/docs/b/business-mentoring-by-smes-summary.ppt.

185
SMEs using business mentoring grew last year and anticipated growth in the next year compared to 5 per cent of SMEs not using business mentoring99.
Despite the attractiveness of this type of support there are arguments – market failures - which suggest that SMEs tend to under-utilise external coaching or mentoring services. Potential sources of market failure include:
• A lack of information, awareness or understanding of the benefits of taking external advice;
• Difficult in identifying impartial and trustworthy sources of advice
• Difficulty in placing a value on external advice so are reluctant to pay for it
Resource constraints – lack of finance, pressures on managerial time - may also lead SMEs to under-utilise sources of external advice. The GrowthAccelerator aims to address these market failures as part of the UK government’s broader strategy to support SME growth and development100.
Coaching for high-growth – policy development in the UK
In 2005 the East Midlands Development Agency, one of England’s now closed Regional Development Agencies (RDAs), published a report called ‘High Growth Business Coaching’. This provided a review of the provision of high-growth support in the UK and emphasised the value of coaching as a means of supporting high-growth companies. The report concludes:
It is clear that coaching,[ rather than alternative forms of support such as counselling or consultancy] is the only solution that ‘transfers’ knowledge, know-how and experience to the business rather than doing it for them. This must be the only sustainable approach that will ensure the high growth prospect has the presence and understanding to fulfil its potential and plan its growth rather than simply outsourcing part of its competitive advantage to a third party
The publication of this report was welcomed by the UK government and led to the development of a number of regional schemes. These schemes aimed to ‘help entrepreneurs to meet the challenges of rapid growth, particularly in the areas of investment readiness and access to finance, developing markets, skills, innovation and technology transfer’101. Subsequently, in 2008, building on a successful pilot scheme, EMDA launched High Growth East Midlands (HGEM) which provided coaching support and related specialist support for existing high-growth and potential high-growth businesses. Evaluations of the HGEM scheme, based primarily on self-reported future growth, were considered positive. In 2008 ‘Coaching for High Growth’ was also included in the slimmed-down portfolio of ‘Solutions for Business’ developed by BERR, an indication of central government’s commitment to this form of business support102. Regional schemes such as the HGEM ended with the closure of the RDAs creating the
99 Source: BIS (2011) ‘The use of Business Mentoring by Small and Medium Sized Enterprises’, available at:
http://www.bis.gov.uk/assets/biscore/enterprise/docs/b/business-mentoring-by-smes-summary.ppt 100 Department of Business, Innovation and Skills (Jan 2011), BIGGER, BETTER BUSINESS, Helping small
firms start, grow and prosper, JANUARY 2011 101 From HM Treasury (2005) ‘Investing for our future – fairness and opportunity for Britain’s hard-working
families’, HM Treasury, Budget report, HC 372, p. 59. 102 High Growth Coach (2010) ‘High Growth Coaching in Europe’, EU Education and Culture DG, Lifelong
Learning Programme, Ref: 2010-1-GB2-LE005-03512. Available at: http://www.adam-europe.eu/prj/6731/prj/HighGrowthCoachingReportFINAL.pdf
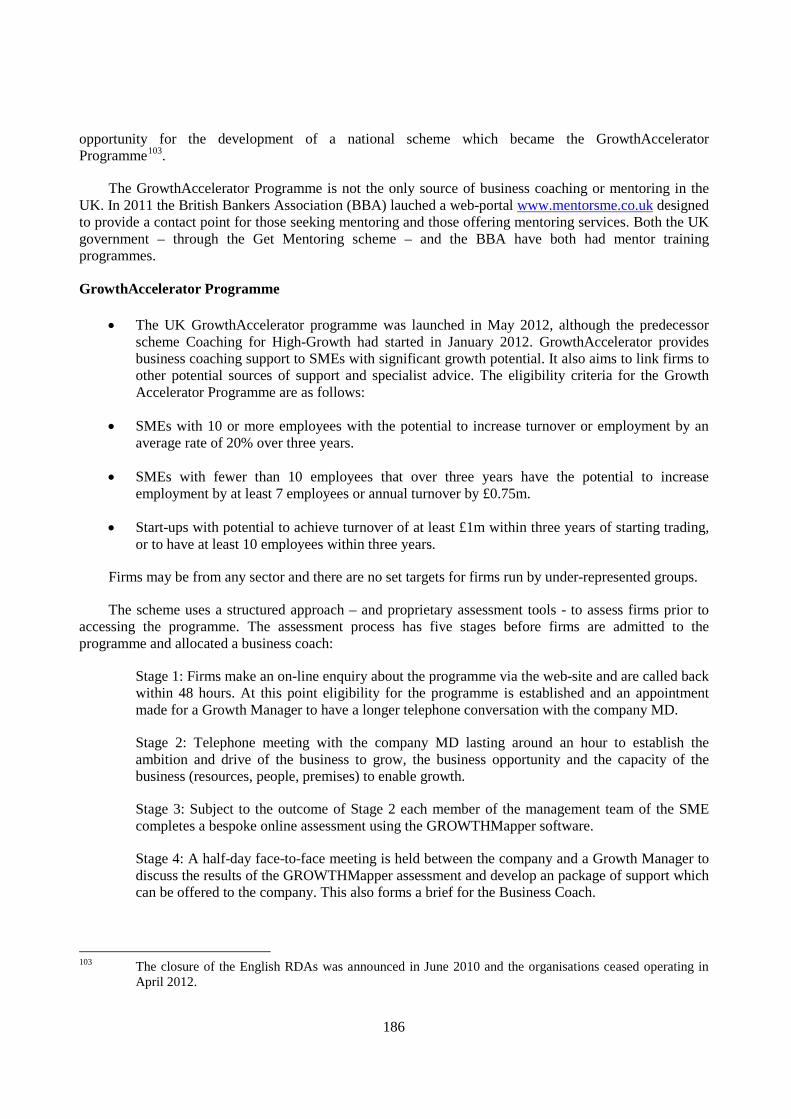
186
opportunity for the development of a national scheme which became the GrowthAccelerator Programme103.
The GrowthAccelerator Programme is not the only source of business coaching or mentoring in the UK. In 2011 the British Bankers Association (BBA) lauched a web-portal www.mentorsme.co.uk designed to provide a contact point for those seeking mentoring and those offering mentoring services. Both the UK government – through the Get Mentoring scheme – and the BBA have both had mentor training programmes.
GrowthAccelerator Programme
• The UK GrowthAccelerator programme was launched in May 2012, although the predecessor scheme Coaching for High-Growth had started in January 2012. GrowthAccelerator provides business coaching support to SMEs with significant growth potential. It also aims to link firms to other potential sources of support and specialist advice. The eligibility criteria for the Growth Accelerator Programme are as follows:
• SMEs with 10 or more employees with the potential to increase turnover or employment by an average rate of 20% over three years.
• SMEs with fewer than 10 employees that over three years have the potential to increase employment by at least 7 employees or annual turnover by £0.75m.
• Start-ups with potential to achieve turnover of at least £1m within three years of starting trading, or to have at least 10 employees within three years.
Firms may be from any sector and there are no set targets for firms run by under-represented groups.
The scheme uses a structured approach – and proprietary assessment tools - to assess firms prior to accessing the programme. The assessment process has five stages before firms are admitted to the programme and allocated a business coach:
Stage 1: Firms make an on-line enquiry about the programme via the web-site and are called back within 48 hours. At this point eligibility for the programme is established and an appointment made for a Growth Manager to have a longer telephone conversation with the company MD.
Stage 2: Telephone meeting with the company MD lasting around an hour to establish the ambition and drive of the business to grow, the business opportunity and the capacity of the business (resources, people, premises) to enable growth.
Stage 3: Subject to the outcome of Stage 2 each member of the management team of the SME completes a bespoke online assessment using the GROWTHMapper software.
Stage 4: A half-day face-to-face meeting is held between the company and a Growth Manager to discuss the results of the GROWTHMapper assessment and develop an package of support which can be offered to the company. This also forms a brief for the Business Coach.
103 The closure of the English RDAs was announced in June 2010 and the organisations ceased operating in
April 2012.

187
Stage 5: A Business Coach would be appointed to work with the company based on the needs of the company, sector and the business location.
Firms taking advantage of the scheme and the potential for business coaching receive an average of 7 days coaching over a 12-18 month period, and are expected to pay a contribution to the cost of coaching. However, both the costs to the firm and the actual number of days coaching each firm receives varies with firm size. Micro firms with up to 9 employees pay £600, small firms with 10-49 employees pay £1,500 and larger firms with 50-249 employees pay £3,000. By contrast, on the basis of the scheme budget and anticipated take-up, the average public investment in the programme (per intervention) is expected to be around £7,500104.
The network of 800 GrowthAccelerator business coaches across the country are employed on a freelance basis to work with participating companies. Coaches typically have an extensive business background having either run or been part of the senior management team of a larger firm. Coaches would also have an established record of business coaching or mentoring.
Delivery
Delivery of the GrowthAccelerator programme was the subject of an open tender and is delivered across England by four main private sector partners (Grant Thornton, Pera, Oxford Innovation and Winning Pitch) working with a range of specialist local partners105. on Reflecting the emphases of earlier business coaching programmes in the UK – particularly the High Growth East Midlands programme – GrowthAccelerator focuses on four key themes106:
• Commercialising innovation – helping SMEs to identify new opportunities for innovation, providing support for commercialising and obtaining finance for innovation;
• Business planning – help SMEs to create and implement a high growth strategy with coaching support, tailored training and facilitating network access;
• Access to Finance – help SMEs to improve their investment readiness and ability to attract growth finance;
• Developing leadership skills – through coaching help SME leaders to develop their management skills. Funding of up to £2000 is available (on a matched basis) for specific training needs.
Within the delivery partnership, Grant Thornton are delivering support for Access to Finance. Each of the four partners is providing some business development coaching (covering Business Planning and Developing Leadership Skills) on a regional basis and PERA and Oxford Innovation are collaborating on support for Commercialising Innovation. The GROWTHMapper suite of assessment tools used across the programme have been developed by Oxford Innovation (http://www.growthmapper.co.uk/).
104 Public investment in the GrowthAccelerator Programme is projected to be £200m over three years and
throughput was anticipated as being 26,000 SMEs. Source: http://news.bis.gov.uk/Press-Releases/-200-million-programme-delivers-growth-support-to-ambitious-SMEs-67a65.aspx
105 The contract notice was published in the Official Journal S69, 8th April 2011, No: 112706. 106 Source: www.growthaccelerator .com

188
Impact
It is too early in the life of the GrowthAccelerator programme to have any evidence of impact or effectiveness although illustrative company success stories have been publicised (www.growthaccelerator.com). Ex ante assessments of the likely impact of the programme, however, suggest that it might create 55,000 jobs (an average of 2.1 jobs per planned intervention) and generate £2.2bn in terms of additional gross value added. Both estimates seem at odds with the aspiration of the programme to promote high growth and significant job creation.

189
CHAPTER 12. IRELAND'S MANAGEMENT FOR GROWTH PROGRAMME
Context and Rationale of the Initiative
The Management 4 Growth Programme was initiated by Enterprise Ireland which is the government organisation responsible for the development and growth of Irish enterprises in world markets. Enterprise Ireland work in partnership with Irish enterprises to help them start, grow, innovate and win export sales on global markets, and in this way they support sustainable economic growth, regional development and secure employment. The purpose of the Management 4 Growth Programme is to develop a cohort of world-class, highly competent and confident management teams who can, through the development of the productivity, innovation and competitiveness of their firms, grow their businesses internationally.
The programme arose as a result of reports such as the ‘Management Development in Ireland’ by the Management Development Council (February 2010), ‘Management Matters in Northern Ireland and Republic of Ireland’ by InterTrade Ireland (March 2009), research by Mackenzie identifying gaps in the sophistication of management practices of Irish SME Managers, and the ongoing need for management development for Enterprise Ireland’s ‘established’ client base – supporting these companies to scale to the next level of export growth. The ultimate ambition of the programme is that it will support participating SME management teams to further develop their strategy, operations and people management practices to drive sales and export growth.
Client Firms (target group and firm selection)
The programme is open to the Management Teams (CEOs, COOs, Marketing Managers, HR Managers, R&D Managers, CFOs, etc) of SME client companies of Enterprise Ireland that are classified by Enterprise Ireland as ‘established’ and are now ready to grow their international sales/exports. Broadly potential applicants are asked three questions:
• Is your company at a point in the growth curve where you need to build a more professional management structure to grow the business internationally?
• Are you the initial founder or driving force of the firm? Do you now need to take an enhanced leadership role which requires a more confident management team and more sophisticated operation in place to support company expansion?
• Has your business grown rapidly in recent years, yet you have not had the opportunity to focus on establishing processes that support growth?
The firms can come from any industry sector, with particular attention being given to companies in the Food, Services, Software, Life Sciences, Clean Tech, Electronics, Construction and Consumer industries. The maximum participation per company is limited to three individuals (CEO + 2 senior managers).
Services Offer
The Management 4 Growth Programme presents an unprecedented opportunity for SME management teams to develop themselves into highly effective managers of their firms through three elements:
• Executive education learning modules specifically geared towards companies ready to make a more significant footprint in international markets. The content will be focused on management

190
competence, practical tools and techniques, case studies and will include inputs from industry keynote speakers drawn from the SME entrepreneurial sphere;
• Appointment of a business advisor/coach (BAC) working directly with each participating management team to apply the tools and techniques to their own business challenges;
• Peer networks established to support participants from multi sector backgrounds. These peer networks will focus on individual participant challenges and encourage peer to peer learning during the programme with the ultimate aim of building networks that are sustainable into the future.
The benefits of the programme to the participating companies are stated as follows:
• A stronger, more effective and confident management team with a defined roadmap for business growth;
• The ability to develop and implement strategies that drive sustainability and international growth;
• Enhanced management skills and techniques ensuring all aspects of the business are aligned with and delivering against strategic plans;
• Enhanced performance in all facets of company operations including people management;
• Implemented an in-company improvement project specifically identified to support company growth;
• Established a network of peers, sustainable into the future.
The programme is very much action-orientated whereby much of the learning takes place through the simultaneous development of the participating company.
Delivery Arrangements
The Management 4 Growth Programme is an integrated management team development programme which is delivered in partnership with Dublin City University and the Irish Management Institute, with independent end-to-end evaluation facilitated by the University of Limerick. The programme is delivered through the following methods:
• 12 days of educational workshops delivered by Irish and International experts covering areas of Management Practice and Leadership Competence – faculty includes DCU, Harvard, Babson, Wales, Bath, Cranfield, Warwick, EM Lyon and Lausanne);
• Peer Networks facilitated at each educational workshop – to support peer learning and support in mixed sector environment;
• Inputs from Industry Speakers – company success and pitfall stories;
• 6 x half days of in-company management team Business Advisory sessions to support specific in-company improvements;
• 3 x 2-hour individual leadership coaching sessions and 360 degree feedback;

191
• Signposting to other Enterprise Ireland services and management development supports;
• Online library available via M4G Moodle;
Additionally the organisers are currently working on the delivery of some modules/part-modules through online delivery, plus the potential use of social media channels.
The programme is delivered by experts who are from a range of academic and training institutions (from Ireland and abroad). These experts are supported by contributions from successful entrepreneurs and enterprise support agents. The objective of the programme designers was to ensure that a particular expert for each module would be located to deliver to relevant content and that a wide mix of presenters would ensure that the programme would not get stale. This commitment to quality obviously increased the cost of the programme for the participating companies but it is heavily subsidised by Enterprise Ireland as part of its remit to improve management capability in Irish industry and so the final cost per participant remains reasonable within the current economic climate. The fee structure for the programme is as follows:
Total Programme Cost Subsidised Fee Payable by Company
CEO + 1 Manager €23,000 €10,000
CEO + 2 Managers €27,000 €12,000
Learning Modules for the Management 4 Growth Programme
The following is the structure of the programme which is delivered over a period of one year:
Launch
• • Programme Introductions & Journey
• • Innovation Mapping & Measurement
Module 1 (residential)
• • Personal Leadership Awareness
• • Irish SMEs: Successes and Pitfalls
• • Roadmap for Strategy: Part 1
• • Strategy & Structure
Module 2
• • Transformational Leadership
• • Top Team as an Effective Driver
• • Strategy for Performance
• • Leading International Growth: Part 1

192
Module 3
• • Learning from Great Business Leaders
• • Innovation Strategy
• • What Shapes Innovation
• • Sales & Marketing Strategy
Module 4
• • Leading Change
• • Networks & Networking
• • Sustainable Innovation & Development
• • Info-tech for Business
Module 5
• • Roadmap for Strategy: Part 2
• • Leading International Growth: Part 2
• • Foresight & Future Horizons
Finale
• • In-company Improvements Review
• • Envisioning the Future
• • Next steps beyond the programme
Strengths and Weaknesses
Following the initial delivery of the programme, an early review of the programme was undertaken by the organisers of the programme, while a detailed report will be presented in 2013 by the External Evaluator. There is no publicly available report currently available but the following feedback was offered by the Programme Manager:
Strengths:
• The integrated approach to this programme with the use of educational modules supported by Business Advisory and Coaching sessions. This ensured that the learning is embedded in-company and therefore more than just the participant is benefiting from the programme experience. This also has subsequent positive learning implications for other employees within the participating company and has led to the development of in-company learning cultures.

193
• The multi-sector approach considering the management practices and leadership challenges that are common to all supports peer-to-peer learning in the SME manager community. This meant that participants could understand that many of the challenges that they faced were not unique to their specific industry and together the participants were able to identify solutions to key difficulties that they faced.
• The value that the participants received from the programme was considered to be excellent relative to the cost of the programme. The report by the External Evaluator will provide details of the improvements achieved by participating companies in terms of their financial performance but anecdotal evidence suggests that it will be quite positive. The feedback at the end of the programme by participants highlighted that they ‘felt’ that the programme was excellent value.
Weaknesses:
• It can be difficult to customise module elements considering the diverse audience in the room. The core educational team have worked hard to deliver content that is directly relevant to the audience by designing ‘just-in-time’ material along with the support provided by Business Advisors and Coaches to help participants disseminate module content considering their own specific needs. However, no matter how well planned, some of the material will inevitably be irrelevant to some participants during specific modules. Constant feedback and communication with the participants is the only way in which this situation can be minimised (but not eliminated).
It is difficult to offer a complete evaluation at this early stage of the initiative since the real measurement is with regard to long-term results. Additionally, the detailed report evaluating the first programme is due to be presented in 2013 and therefore any further analysis at this time would be speculative.
Monitoring and Evaluation System and Impact
The programme incorporated an End-to-End evaluation approach which was established from the beginning and is facilitated by personnel from the University of Limerick. The evaluation aims to establish a causal link between programme content, company performance and ultimately by Return on Investment (ROI). Data is gathered in various formats through pre-programme baseline questionnaires, end of module forms, manager competency audit surveys, learning transfer style audits and post programme data collection, along with stakeholder interviews. The results of the data generated in the first programme will not be known until early 2013 and will initially not be publically available.
Recommendations for Improvement
The programme team continuously work with the independent evaluator to make well informed decisions about the programme structure, content and delivery methods. To date they have made small changes to the Peer Network structures and to the 360 degree feedback process, based on feedback received.
It is broadly agreed that if a firm is to achieve sustained expansion, it must satisfy a number of requirements for growth: it must increase its sales, it must have access to additional resources, it must expand its management team, and it must extend its knowledge base. But each set of requirements establishes a different set of obstacles for the entrepreneur. While some of these challenges are external to the firm, a feature of the firm's operating environment that is impracticable to alter, many of the challenges will be internal, generated by the growth of the firm. Indeed, the principal challenges that exist in most
194
firms are weak management skills, lack of finance, and poor knowledge of international markets. However, many of these issues can be addressed through tailored training programmes.
According to a report by the European Commission in 2006, the development of management capacity relates to four main fields of expertise relating to the owner/manager:
1. Strategic and management knowledge aspects (including human resource management, accounting, financing, marketing, strategy and organisational issues).
2. Understanding the running of the business and of the potential opportunities or threats.
3. Willingness to question and maybe review the established patterns.
4. Attitudes towards investing time in management development or other needed competencies.
One of the primary reasons that management development programmes can fail to improve a firm's performance has been that certain conditions must exist for the programme to have meaningful benefit. But primary amongst these conditions is that for any progress to be achieved the entrepreneurs themselves must be motivated to grow the business. Additionally, the entrepreneurs participating in such programmes must also be provided with increased access to networks, finance and international markets if they are to grow the business beyond small scale achievements that do not make any material difference in terms of job creation.
Possibly the strongest finding to come from the research regarding existing programmes on management skill development for growth-orientated entrepreneurs is the role of mentoring and how the mentors must be people who have already achieved significant business success. The mentor must be a person who has the experience and access to networks that enables the growth-orientated entrepreneur to expand their horizons. The mentor also acts as a role model and reinforces the belief of what ambitions can be achieved.
While a country urgently needs a larger pool of entrepreneurs who wish to grow their business internationally, thereby generating thousands of additional jobs, the reality is that the desire to grow a business is not a goal for all entrepreneurs. Therefore it is critically important that those entrepreneurs who do view their future as international success stories must be afforded tailored support and mentoring to ensure they have the best prospects of succeeding. It is certainly true that such support requires greater levels of financial and personnel resources, plus any positive results will not be immediately visible, but increasingly global research is providing strong evidence highlighting that such a strategy will generate the best results.

195
CHAPTER 13. SWEDEN’S NATIONAL INCUBATOR PROGRAM
Context and rationale of the initiative
In Sweden, academic research and policy making has paid particular attention to academic entrepreneurship as a central, but underutilised, mechanism for exploiting the results of academic research. In the Swedish context, this mechanism began to receive attention in the early 1990s. A great deal of concern has been raised over an allegedly poor propensity to spin off firms from academia and over limited growth, and associated little direct impact on the economy, of those that have been spun off. Consequently, many policy initiatives have centred on promoting academic entrepreneurship. The more prominent among these are the Innovationsbron and its predecessors – the VINNOVA Incubator programme and seven Teknikbro-organisations (bridging organisations) that have both had a clear focus on increasing the number and (direct) growth of academic spin-offs, e.g. by providing seed funding. The ambition of the Innovationsbron is to help researchers, innovators and entrepreneurs with business development and commercialisation, and to increase knowledge transfer and sharing between industry and university. When introducing this new organisation in 2005, the Swedish Minister of Industry wrote that “During a ten year period, Innovationsbron AB will spend 1.8 billion SEK to enhance the conditions for commercialising research results and ideas in industry” (DN, 2005). Hence, both the predecessor and the new Innovationsbron focus on academic entrepreneurship (and on seed funding). One main activity is the Swedish national incubator programme.
Sweden’s first national incubator programme was initiated in 2003. It was actually named the National Incubator Programme (NIP), and run by VINNOVA, the Swedish Governmental Agency for Innovation Systems. Based on experiences in NIP a second national incubator programme –IBIP, Innovationsbrons Incubator Programme – was launched in 2008. This was replaced by the third programme BIG (Business Incubation for Growth) in the autumn of 2011. Between 2008 and 2011 Innovationsbron spent 180 million SEK on IBIP.
The number of incubators with financial support increased from 14 in the NIP programme (2003) to 21 in the IBIP programme (2010) and 24 in the BIG programme (2012). In BIG the annual budget is approx. 60 MSEK. In total the BIG incubation program includes 46 incubators, but only 24 of these have been granted performance-based funding. The remaining 22 participate in meetings and educational activities. When they are able to fulfill the performance-based criteria of BIG they can apply for funding of their operations (so called Summit-funding, see below). Besides supporting the incubators themselves, the Innovationsbron also offers seed financing for ventures in the incubators.
Client firms (target group and firm selection)
All three national incubator programs have targeted the best performing Swedish incubators. The program targets leading incubators and offer them performance-based funding. Other incubators have been able to participate in the programme without funding. Thus, the number of high-performing incubators has increased from 14 to 24 during the ten years. To obtain performance-based funding from SUMMIT the incubator must also have co-financing (at least 50%). The financed incubators are supposed to deliver top-class business coaching to prospective growth companies.

196
The incubator activities should be in line with the SiSPs (Swedish Incubators and Science Parks association) definition: "Incubators offer a dynamic process for the development of people, businesses and companies. The incubator provides entrepreneurs with active and appropriate management support, financial, technical and commercial networks, and creative growth environment and related office services. The incubator should offer incubator companies physical venues and should be able to offer office to all projects and companies in the incubator. ”
To participate in the national incubator programme an incubator should promote the development of sustainable businesses, companies and jobs and thereby strengthen local, regional and national economic growth. Incubator activities shall aim to develop profitable and sustainable incorporated companies, although the projects may initially be of a different legal form. In addition, the incubators operations shall be independent and sustainable and should have been conducted for at least two years. The incubator also undertakes to report its results in a structured manner in the database Focus Analys (owned by Innovationsbron). All business coaches, including relevant consultants, shall participate in Innovationsbron’s skill development program Focus Business Development.
Politis and Lindholm-Dahlstrand (2011) used Innovationsbrons database Focus Analys to analyze 793107 ventures in 19 of the financed incubators, see Table below.
Table 13.1 Incubators in IBIP
Source: Politis and Lindholm Dahlstrand 2011
As can be seen in the table the majority of the incubators with national funding are either focusing technical (36.8% of the incubators) or medical/life science client firms (21.1% of the incubators). 42.1% of the incubators target clients with a more general growth ambition. The incubators focusing technical client firms are younger than the others and most often located in metropolitan areas. They have fewer client firms and also a much lower share of women-led projects.
Incubators focusing medical venture clients are older, have relatively few clients but a higher share of women-led firms. Also these incubators are found in metropolitan areas. Instead, the incubators targeting
107 In total Lindholm Dahlstrand and Politis (2011) analyzed 1429 ventures in the 19 incubators. Out of these
503 were incubatees and 926 alumni. 793 of the firms were established between 2006 and 2009 (Politis and Lindholm Dahlstrand 2011).
Incubator Starting Incubator Geographic location Number of projects Women-led projects year target Metropolitan (Y/N) (2006-2009) (2006-2009)
A 2005 Technical No 22 13.6%B 2005 Technical No 26 15.4%C 1998 General No 30 16.7%D 1999 Technical Yes 26 0%E 1998 General No 114 22.8%F 2001 Technical Yes 52 17.3%G 1999 General No 30 20.%H 1995 General Yes 16 18.8%I 2007 Medical Yes 12 8.3%J 2004 Technical Yes 24 12.5%K 2004 General No 74 24.3%L 1996 Medical Yes 30 26.7%M 2002 Technical No 27 7.4%N 2004 Medical Yes 36 22.2%O 2002 Technical Yes 36 11.1%P 2006 General Yes 40 20%Q 2005 General No 63 20.6%R 2003 Medical No 17 40%S 2003 General No 118 17.8%
793 18.8%

197
more general growth focused clients are less likely to be found in metropolitan areas. Also, these incubators have a higher number of client firms and a higher share of women-led projects.
In 2010, the incubators in the programme:
• evaluated over 4200 ideas
• spent over 140 working years (full time eqv) of coaching in the ventures
• generated approximately 140 alumni (incorporated firms)
• accepted approximately 700 new ventures and firms as clients
• … together employing some 1700 persons
• Attracted almost 520 MSEK in client equity
Accepting 700 out of 4200 ideas means the incubators have an acceptance rate of 1/6th. In general, the high-performing Swedish incubators use a ‘‘picking-the-winners’’ selection strategy. Most often there is a rigorous evaluation process with multiple criteria and a high reject rate (over 80% in many cases). Very few incubators use a “survival-of-the fittest approach” to selection (where often around 40% of the candidates are accepted).
Services offer
The new programme BIG (Business Incubation for Growth) offers three kinds of funding for incubators. First, all 46 incubators in the programme have Base-camp funding for skill development. With Base-Camp funding Innovationsbron offers 50 000 SEK / year to facilitate participation in joint activities in BIG Sweden. Second, 24 incubators have performance-based SUMMIT-funding (in general around 1 to 5 MSEK/year). There a few examples of Explorer funding, which is for joint projects with several cooperating BIG incubators.
SUMMIT funding is the main part of the programme. With SUMMIT financing the incubator will receive funding to operate and develop its business processes and flow. To support the incubator in the development Innovationsbron implements quality assurance through Assessment, follow-up meetings and strategy meetings with the incubator and local and regional stakeholders. The aim is that the incubator should strive towards improving their own performance as well as the objectives defined for BIG Sweden.
There is a huge variation in the services offered to client firms. At the lower end of the scale (Bergek and Norrman 2008) there are incubators with minor intervention that is initiated by the entrepreneurs. At the other end are a few incubators acting as venture capital investors (including ownership of the firm and active participation in the management of the firm). In between these extremes the majority of the incubators have a support system in terms of a structured step-wise programme, which incubatees are obligated to follow. Typical here is financing issues, business support, marketing assistance, networking and coaching. A few incubators also offer help with HR and internationalization.
Delivery arrangements
Service delivery is left to incubators to carry out. All 24 incubators that have succeeded in receiving SUMMIT financing have a clear focus on conditions that generate a critical mass of excellent ideas, entrepreneurs and employees. They have a well established, focused, effective and sustainable leadership.

198
They are able to assist in developing business ideas with a view to strengthening the commercialization potential. There is a huge variation in how much of this is made internally by coaches employed in the incubators, or externally by coaches and consultants in the network of respective incubator. The smallest incubator only has one person employed as incubator manager, while the larger ones have teams of over ten persons.
Being granted SUMMMIT financing means that the incubator has proved that it is able (with internal or external resources) to provide the clients with resources for business development, and an ability to prepare projects and companies for sales and growth in export markets. It must be able to provide an entrepreneurial culture that is stimulating, inspiring, educating and increasing requirements. The incubator should be able to assist incubator companies where necessary to attract seed funding from different sources. There must also be criteria for entry and exit and continuous record of projects and companies in the incubator. The incubator must have competence to evaluate and develop venture teams in terms of skills, personality and experience and complement the team in terms of skills, experience, gender, and background.
SUMMIT financing requires that the incubator has legitimacy in the innovation system and the economy. It should be well integrated into a complete support structure for business creation, and have relationship with university and industry stakeholders to ensure a qualitative inflow of business ideas and access to relevant expertise.
M&E system and impact
Innovationsbron continuously evaluates the incubator operations. Innovationsbron determines whether the incubator meets the requirements and commitments in the agreement for BIG Sweden. To evaluate the effects of interventions Innovationsbron has established the following measurable indicators:
• Relevant influx of ideas
• Increased private / public financing in the early stages
• High level of customer satisfaction
• High efficiency and quality of products and processes
• Increased sales and employment
• Higher survival rates
• Increased export revenues
For the incubator to keep the SUMMIT funding at the decided level, the operations must meet the requirements of continuous development and show a high effectiveness in relation to the BIG Sweden's goal. The development and effectiveness is checked at the regular follow-up meetings, the information in Focus Analys, Annual Assessment, Annual review and the annual strategy meeting. If the incubator demonstrates a weak performance of the activities or lack of effectiveness, Innovationsbron reduces or cancels the performance-based funding from the SUMMIT.
Lindholm Dahlstrand and Politis (2011) used data from Focus Analys as well as general national statistics, to analyse 1429 ventures in 19 of the incubators. Special attention was paid to gender differences of venture champions, see Table 13.2.

199
Table 13.2 Ventures in Swedish incubators
Total Male
Female Statistics Significance level (two-tailed)
Venture performance
Survival 85.6% 85 % 89 % 2.432 b .119
Sales (million SEK)d 2.35c 2.22 c 3.23 c .799 a .426
Number of employees 3.34 3.39 c 3.08 c -.247 a .805
University related variables
R&D revenues (million SEK)d 1124.0 1141.4 1017.0 -2.173 a .031*
Entrepreneurship education 37.4% 39.6% 25.2% 15.841 b .000**
Share female students 56.3% 55.6% 60.2% 4.886 a .000**
Share female professors 14.5% 14.4% 15.6% 1.807 a .071+
Incubator related variables
Number of ventures in incubator 111.3 111.3 112.4 0.147 a .883
Age incubator 7.17 7.24 6.79 -1.724 a .085
Venture related variables
Limited liability company 58.8% 62.2% 38.6% 41.138 b .000**
Alumni 64.8% 66.6% 53.8% 12.855 b .000**
Life science 22.9% 20.6% 34.8% 20.335 b .000**
ICT 30.1% 32.5% 16.7% 21.271 b .000**
Clean tech 6.9% 7.2% 5.7% 0.448 b .575
Industrial 40.1% 39.7% 42.9% 0.733 b .392
Origin idea: university 51.9% 51.8% 51.9% 0.001 b .980
Origin idea: private industry 17.9% 17.5% 20.5% 1.065 b .302
Origin idea: innovator 19.5% 20.1% 16.1% 1.782 b .182
Loans (thousand SEK)d 114.9 111.9 134.0 0.627 a .531
Grants (thousand SEK)d 105.6 94.6 172.9 1.233 a .219 Significance levels: + < .10, *p < .05, and **p < .01 a t-value, b Pearson chi square value, c Inactive ventures are excluded in the figures of sales and number of employees. d 1 SEK equals about 0.11 EUR and 0.15 USD
Source: Politis and Lindholm Dahlstrand 2011
The 1429 ventures in the sample represent 503 ventures active inside incubators (incubatees) and 926 ventures that have exited the incubator (alumni). 14.7% (or 210) of the ventures are started by women entrepreneurs and 85.3 % (1216) by men. The ventures were on average 4.53 years old, where the incubatees were 2.68 years old and the alumni were 5.54 years.

200
The survival rate in the total sample is as high as 86%. Ventures championed by females have a higher survival as incubatees (92% vs. 82% for men). There is no difference in survival after the ventures have exited and become alumni. Moreover, Table 2 reports that the average sales in the total sample is 2.35 MSEK. The ventures with women entrepreneurs have on average 3.24 MSEK in sales, which can be compared to men-led ventures with an average of 2.22 MSEK. The average number of employed persons for the ventures in the sample is 3.37.
Interestingly, larger universities (as measured by R&D revenues) tend to encourage men’s entrepreneurship. Also the existence of an entrepreneurship education seems to favour male academic entrepreneurs. The incubator-related variables in Table 2 suggest that older incubators attract men rather than women entrepreneurs. The size of the incubator as measured by the accumulated number of ventures does not create any significant differences between the two groups.
The multivariate statistical analysis of the data shows that both the university and the incubator contexts are important for venture survival. While the age of the incubators has a negative effect on survival, the size of the incubators (in terms of the accumulated number of ventures) has instead a positive effect. Both the size of the universities’ R&D budgets and the existence of advanced Entrepreneurship and Innovation education have negative effects on venture survival.
Strengths and weaknesses
From the point of view of Incubator managers, important strengths are that the programme has made it possible for them to get to know each other in the incubators. Naturally the money itself is important, and it also helps to get additional financing. This is almost the only financing incubators can get that is not in the form of project-financing.
A main weakness pointed out by incubators is that the seed financing and incubator program does not really fit together. Also, Innovationsbron cannot live up to all needs of funding and support. For this, Innovationsbron would need a larger mandate.
The incubators in the national incubator programme have very strong connections to the Swedish universities. Incubators without links to universities are rare in the program. This also means that there is a strong focus on university ideas in the incubators, and that external individual inventors sometimes face difficulties in entering incubators. This situation is improving and recent data show a higher share of ideas originating from outside the university context.
The majority of the incubators with performance-based financing are found in technology or life science sectors. Both technology-based, and especially ventures in the life sciences might need relatively large resources to develop into viable firms. Thus, having incubators targeting these sectors is important. However, there is a risk that the limited resources of the national funding will not be enough to also address the specific needs of other sectors with other needs.
Former national incubation programs have been relatively successful especially when it comes to support networking and combining the breadth and excellence, however, improvement areas identified include internationalization and increased flexibility in funding to address differences in needs. A key success factor has been the monitoring in the Focus Analys.
Recommendations for improvement
It may at first sight seem paradoxical that Sweden, in the absence of a clear and long-term political commitment to a national innovation strategy, synchronized focused efforts and a matching funding, yet has such a prominent incubator program. If one look a little deeper one will find that incubators and the

201
incubation process are very good class, but start-up companies in incubators have less funding than in other countries, both during the incubation but especially after they leave the incubators.
This result in a development of start-up businesses that is slower and it takes longer to reach the market. Because of the scarcity of funding, it takes more time to discover a "failure" in cases where the idea is not commercially sustainable. More money in the system makes it possible to work more efficiently and more quickly reach “go” or “no-go”. The incubators need to get better at formalizing the examination/exit, and to take care of alumni to get them to grow into gazelles.
The number of ventures created by women in the incubators is less than a fifth. There is a large potential for improvement. Partly this issue is related to technologies and industries focused by incubators. Also creative industries and services are topics identified as potential growth areas. These sectors offer great possibilities for improvement. The incubator program could benefit from using multiple models for measuring and evaluating results of incubators. To only go for “low-hanging-fruit” may well create good results but there is a risk that long-term effects are hampered. Thus a national incubator program should include models for both picking winners and survival of the fittest.

202
CHAPTER 14. THE U.S. JOBS AND INNOVATION ACCELERATOR CHALLENGE
Context of the initiative
In May 2011, as part of its regional cluster initiative, the Obama Administration announced the creation of an inter-agency collaboration, known as the Jobs and Innovation Accelerator Challenge (Jobs Accelerator). The program provides a mix of funding and technical expertise to regional partnerships that identify existing industrial strengths upon which to build. Is so doing, the Jobs Accelerator program addresses the following stated purpose: to enhance the development of high-growth place-based clusters throughout the United States.
In September 2011, $37 million was awarded to projects in 21 states, covering industrial activities ranging from bioscience to interactive media. The program was reformulated in 2012 to address two distinct niches identified as priorities by the Administration: advanced manufacturing (Advanced Manufacturing Jobs and Innovation Accelerator Challenge) and jobs in rural areas (Rural Jobs and Innovation Accelerator Challenge). In October 2012, 12 projects, worth a total of $7 million, were awarded for the Rural Jobs Accelerator; the Advanced Manufacturing Jobs Accelerator program awarded ten projects worth a combined $26 million.
This report focuses on the Advanced Manufacturing Jobs Accelerator program.1 The backbone of the Jobs Accelerator program consists of simultaneous investments made by five agencies in each chosen high-growth cluster. The intention is to pool resources to jointly improve capacity across several perceived cluster needs, on the basis that such a concerted and coordinated ‘big push’ will yield better results than narrower, and more fragmented support. For the 2012 round, the Department of Commerce’s Economic Development Administration (EDA) made up to $10 million available for the Accelerator for cluster development through the Economic Adjustment Assistance (EAA) program.2 The National Institute of Standards and Technology (NIST), also part of Commerce, provided up to $3 million for solutions to new and emerging manufacturing challenges, through the Hollings Manufacturing Extension Partnership (MEP) Program.3 Through its Advanced Manufacturing Office, the Department of Energy (DOE) provided up to $5 million for R&D assistance and demonstration project efforts.4 The Department of Labor’s Employment and Training Administration (ETA) provided $5 million for training and human capital development, via the H1-B Technical Skills Training Grant funds.5 The Small Business Administration made funds of up to $2 million available through its Technical Assistance Program.6 These funds generally support project durations of three years.
In addition to these core investments, other agencies and bureaus play a supportive role. Through its Small Business Innovation Research (SBIR) program, the National Science Foundation (NSF) committed to providing up to $1 million in additional funds to awardee organizations that are already Small Business Innovation Research (SBIR) phase II recipients (for-profit organizations that have received SBIR funding for initial research (phase I) and have received further support to develop the research on the basis of technical and commercial merit). A variety of other government departments and agencies, ranging from the Environmental Protection Agency (EPA) to the Patent and Trademark Office (USPTO) have agreed to provide technical support on a project-by-project basis.

203
Rationale and objectives
The stated objectives of the Jobs Accelerator program are to (1) create jobs (2) expand economic activity, and (3) enhance the global competitiveness of U.S. manufacturers (Economic Development Administration, 2012). Behind these objectives lie two central premises. First, the Obama administration considers that regional industrial clusters are central to economic development, skill development and long-run regional competitiveness. Clusters were initially mentioned during the 2008 presidential campaign, and interest in this topic was formalized in the budget of the federal government for the fiscal year 2010, in which regional clusters were given particular emphasis. With the launch of the Jobs Accelerator in 2011, as well as other ‘cluster initiatives’ totaling over $200 million, the federal government has made considerable investments in stimulating development by seeking to strengthen metropolitan industrial agglomerations.
A second premise is that advanced manufacturing represents a viable and valuable area in which to intervene in the U.S. economy. In its 2012 policy document, ‘A National Strategic Plan for Advanced Manufacturing’, the federal government defines advanced manufacturing as:
a family of activities that (a) depend on the use and coordination of information, automation, computation, software, sensing, and networking, and/or (b) make use of cutting edge materials and emerging capabilities enabled by the physical and biological sciences (for example, nanotechnology, chemistry, and biology (National Science and Technology Council, 2012, p.2).
Motivating interest in these economic activities, several reports note that manufacturing constitutes a large proportion of U.S. exports, generates a large multiplier and employs as much as 60% of the national R&D workforce. Advanced manufacturing is seen as a particularly crucial subset of the overall manufacturing base, because it yields innovations that have the potential to spur entirely new industries. Relatedly, it is believed that advanced manufacturing may generate local jobs and ideas that are hard to imitate, ensuring that the U.S. will capture a considerable portion of the return on investments to stimulate such activities (ibid).
To the extent that these two premises are accurate, they point to the importance of advanced manufacturing in the evolution of the U.S. economy, and of regional clusters as a crucial staging ground in which this sector will develop.
To motivate government intervention toward enhancing these alleged foundations of U.S. competitiveness, several principal arguments are made. Government reports identify what are considered to be a worrying trend: while U.S. R&D intensity (R&D expenditures as a share of GDP) remains relatively high by international standards, with the U.S. ranked eighth among countries tracked by the OECD and UNESCO (National Science Foundation, 2012), R&D investments in manufacturing, as well as the national trade balance for advanced technology products have both suffered considerable declines over the past decade. Progress toward increasing innovative capacity in this area has been sluggish (Atkinson and Andes, 2011). It is perceived that these challenges may be remedied through government intervention.
Two major market failures motivate the Jobs Accelerator. First, it is argued that gaps have emerged in the national innovation system that the market alone has been unable to bridge. Specifically, despite continued federal investments in basic pre-commercial research, market failures have occurred downstream in the innovation process, in the translation from R&D to domestic production. Second, it is observed that much of the advanced manufacturing work is occurring in localized industrial clusters, in which small- and medium-sized enterprises (SMEs) commingle with large firms, academia, training institutions that produce appropriately trained workers, as well as other organizations. Collectively, these represent “industrial commons” (National Science and Technology Council, 2012, p.8) in which firms can

204
compete, collaborate, share ideas, and ultimately enhance each other’s productivity. Since individual firms cannot reap the full benefits of this complex clustering of organizations of various kinds, its strengthening and enabling presents a collective action problem to which government can respond as a co-investor and convener.
The Jobs Accelerator program is also motivated by national security concerns. The U.S. Defense Production Act Committee (ibid) has identified that the ongoing offshoring of advanced manufacturing has weakened domestic capability for a variety of goods considered vital to national security, including low cost composites and nuclear power components. It is perceived that this problem is partly related to a dearth of adequate training institutions for the domestic labor force. A further rationale for the program is the fact that regional economic activity in the United States commonly spills beyond administrative boundaries, necessitating higher-order responsibility for public investment in such regional development schemes (Council on Competitiveness, 2010).
Target firms
Applications are accepted from regional partnerships that focus on advanced manufacturing, as defined above. Targeted clusters are those with the opportunity to produce goods and technologies that can compete in the global marketplace. Regional partnerships can consist of one or multiple organizations, however a single organization would need to satisfy the eligibility requirements of each grantor, making it likely that partnerships will consist of teams of organizations gathered around a common purpose. Private firms cannot be the sole applicants – EDA, NIST and ETA each constrain eligibility to various types of non-profit organizations and higher educational institutions; for this program, only SBA and DOE can provide services to private businesses.
Firm selection
Partnerships are evaluated and selected on the basis of a detailed framework defined in the initial announcement of the Federal Funding Opportunity (FFO). Key criteria include the careful identification of the regional economic ecosystem and cluster, including major organizations and their roles; a project concept that integrates the investments of each agency in a complementary manner; detailed agency-specific scopes of work including costs; clear definitions of project impact and measurable outcomes; and an analysis of the sustainability of the project outcomes over the long run.
Evaluation will be conducted to determine the extent to which proposals leverage the various resources in order to enhance the development of advanced manufacturing; the likelihood that the proposed project addresses the opportunities present in the cluster; as well as the extent to which projects are likely to grow the cluster, stimulate entrepreneurship, create jobs and train appropriately skilled workers.
Initial evaluation is performed separately by each funding agency to determine proposal completeness and appropriateness. Subsequently, Merit Review Panels, consisting of at least three qualified individuals, review the applications against the stipulated criteria. The Policy Review and Recommendation Committee, made up of experts from each agency, then further evaluates, considering the mix of industry types and geographic variation. Recommendations are then made to each agency, upon which authorized individuals make final award decisions. Government agencies do not systematically appraise the veracity of partnerships’ claims. Determination of growth potential will be decided by partnerships and then judged by government evaluators.

205
Range of services and delivery
Services are agency-specific, and are intended to be complementary. They are delivered to cluster actors through the member of regional partnership that has applied to this specific subcomponent of the larger Jobs Accelerator program. Diagnostics chiefly occur in the proposal stage.
The EDA-funded component is aimed at ‘Enhancing Cluster Networks and Regional Assets.’ Recipients must be economic development organizations (academic institution, subnational government or non-profit organization) located in what the EDA terms a ‘distressed’ region. The recipient organization’s purpose is to research and identify potential domestic and foreign markets for the cluster to exploit.
DOE provides funding to non-profit or for profit organizations in order to develop and demonstrate advanced manufacturing processes or products, supporting such activities as early-stage R&D, technical expertise for proof-of-concept, or demonstrations to incentivize investment. DOE investments are intended to be public-private partnerships.
The NIST portion of an award goes to an existing Manufacturing Extension Partnership (MEP). MEP Centers form a national network of organizations that leverage the technical knowledge of over 1,400 experts to assist U.S. SME manufacturers in enhancing competitiveness, in part by strengthening product and process innovation, and advising on market expansion strategies. For the Jobs Accelerator, funds provided to an MEP Center are aimed at ensuring that advanced manufacturing SMEs are involved in cluster activities.
The ETA’s contribution to the larger Jobs Accelerator program goes to nonprofits and education and training providers, targeting specific advanced manufacturing occupations within the cluster for which the United States is currently awarding temporary H1-B visas to high-skill foreign workers. The intention is to eventually replace foreigners with skilled domestic workers, as well as to bolster regional cluster capacity.
Services provided by the SBA as part of the Jobs Accelerator program are aimed at small businesses within the cluster that can benefit from technical assistance toward improved business training; export-readiness; national and international marketing; and to strengthen SME links to existing supply chains.
Monitoring & Evaluation and Impact
Monitoring and evaluation efforts follow from the scopes of work defined during the proposal process. Project selection is in part informed by the extent to which proposals describe clear and measurable outcomes. Proposals will additionally include an ‘integrated work plan’ that synthesizes the proposed activities across each of the funders. This document will include timelines and specific dates for each activity, along with clearly defined and measurable outcomes, and estimates of the type and scale of impacts in the cluster.
This work plan forms the basis for project monitoring efforts. The partnership is required to submit quarterly reports on objectives; resources; activities and timelines; activity output metrics; agency outcome metrics; outcome data sources; and a general progress report. The nature of reporting on each items flows from the integrated work plan: in some cases this may involve quantitative data, in other cases narrative descriptions of activities and outcomes are sufficient. The program encourages (but does not require) that these reports synthesize activities across all funded components. Individual funders also have regular reporting requirements, most of which include financial information.
Because the Jobs Accelerator program is relatively new, and projects typically span three years (with some articulation of benefits over a six year period), it is not yet possible to evaluate the effectiveness and impact that this program has had upon recipient partnerships, as well as the clusters and broader regions in

206
which they are inserted. Proposals are judged on the basis by which prospective applicants can demonstrate ‘proven impact,’ but there is no evidence that questions of additionality can or will be accounted for; at present, project evaluation is self-reported by regional partnerships that may have little capacity to address the considerable challenges of such rigorous policy evaluation. Funding agencies are purportedly interested in conducting careful project impact evaluation, and require consent from recipients to participate in such evaluations. At present, however, no such system is currently in place.
References
Atkinson R., and Andes, S. (2011) The Atlantic Century II: Benchmarking EU and US Innovation and Competitiveness. Information Technology and Innovation Foundation, Washington DC.
Council on Competitiveness (2010) Compete. Retrieved October 29, 2012 from: http://www.compete.org/images/uploads/File/PDF%20Files/Final_Collaborate.pdf
Economic Development Administration (2012) Announcement of Federal Funding Opportunity: Advanced Manufacturing Jobs and Innovation Accelerator Challenge.
Mills, K., Reynolds, E.B., and Reamer, A (2008) Blueprint for American Prosperity: Unleashing the Potential for a Metropolitan Nation. Brookings Metropolitan Policy Program. April.
National Science and Technology Council, (2012) A National Strategic Plan for Advanced Manufacturing, Executive Office of the President. February.
National Science Foundation (2012) Science and Engineering Indicators 2012. Retrieved October 30, 2012, from: http://www.nsf.gov/statistics/seind12.

207
CHAPTER 15. ONTARIO'S MEDICAL AND RELATED SCIENCE DISCOVERY DISTRICT
Context and rationale
MaRS was founded to build the commercialization capacity of the province of Ontario. MaRS has three strategic goals: (a) to build great companies; (b) to develop a vibrant innovation hub; and (c) to strengthen Canada’s global innovation brand.
MaRS is located in Toronto, Ontario, which is the largest centre of science and engineering research in Canada. When MaRS opened in 2005, its focus was science and technology, and particularly biotechnology. That focus has expanded and MaRS is now active in five areas: (a) advanced materials and engineering; (b) cleantech; (c) information technology, communications and entertainment; (d) life sciences and health care; and (e) social innovation. “MaRS” was initially an acronym for “Medical and Related Sciences,” but when the organisation’s mandate expanded, the acronym became its full name.
MaRS is a public-private partnership, funded by diverse parties, including the municipal, provincial and federal governments, high net worth individuals and private foundations, non-profit organisations such as universities and hospitals, and private sector organisations such as banks, law firms, pharmaceutical companies, telecommunications providers, and IT companies. Its legal form is a not-for-profit corporation.
MaRS is located in a renovated 750,000 square foot heritage building, where roughly 2,300 people currently work. Space in the building can be rented, and includes a mix of laboratories, office space and events space. Construction has begun on a MaRS Centre Phase 2, which is scheduled to be completed in September 2013. The new 20-storey building will provide an additional 780,000 square feet, 60% of which is designed as lab space and 40% as office space.
Client firms
MaRS clients are early-stage organisations in one of its five focus areas. As of the fall of 2009 (the most recent figures available), MaRS had worked with more than 1,300 companies.
Services offered
Advisory Services
Advisory services are the key services offered by MaRS. Companies need to be approved before they can participate. Table 1 provides a summary of the information that is requested on the online application form, in order for a company to be qualified. Besides being assigned a MaRS advisor, companies participating in this program are able to access, free-of-charge, third party market intelligence reports, such as Gartner and Forrester reports.
JOLT
The JOLT program provides specialized technology acceleration services for high growth potential web and mobile companies that are changing the way people work or are entertained. Companies must be located in Canada (and preferably in Toronto), have a prototype or proof of concept in hand, have a
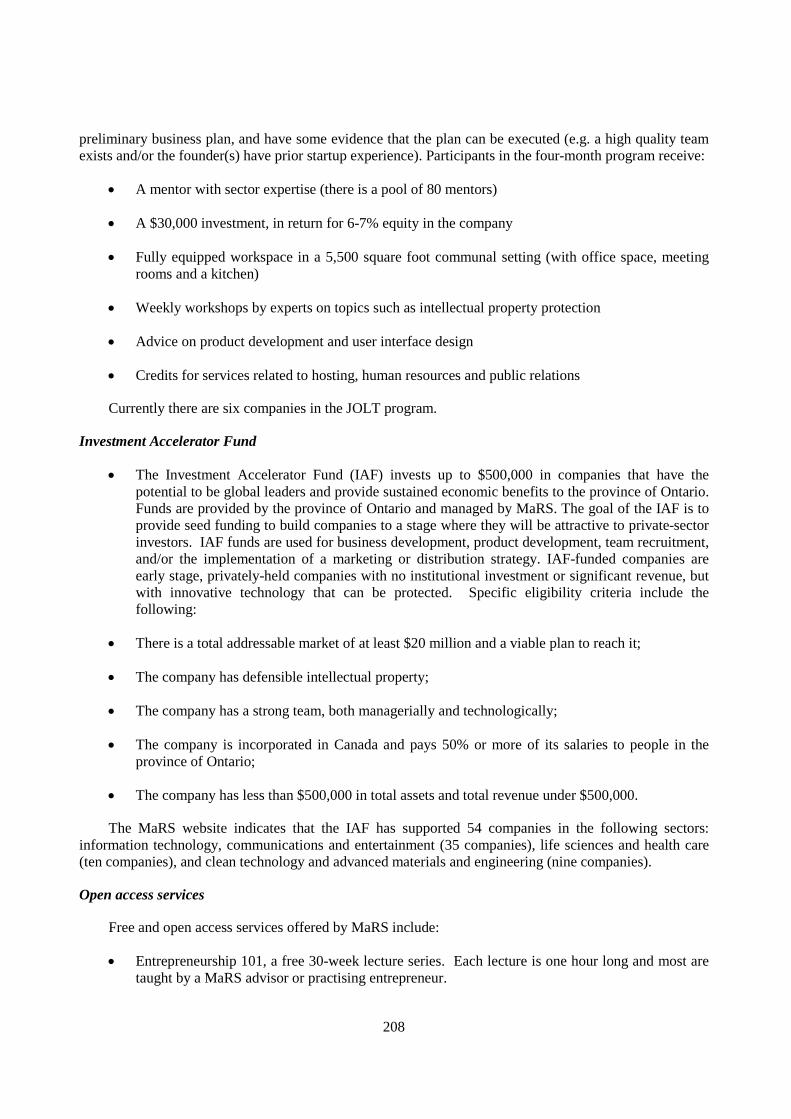
208
preliminary business plan, and have some evidence that the plan can be executed (e.g. a high quality team exists and/or the founder(s) have prior startup experience). Participants in the four-month program receive:
• A mentor with sector expertise (there is a pool of 80 mentors)
• A $30,000 investment, in return for 6-7% equity in the company
• Fully equipped workspace in a 5,500 square foot communal setting (with office space, meeting rooms and a kitchen)
• Weekly workshops by experts on topics such as intellectual property protection
• Advice on product development and user interface design
• Credits for services related to hosting, human resources and public relations
Currently there are six companies in the JOLT program.
Investment Accelerator Fund
• The Investment Accelerator Fund (IAF) invests up to $500,000 in companies that have the potential to be global leaders and provide sustained economic benefits to the province of Ontario. Funds are provided by the province of Ontario and managed by MaRS. The goal of the IAF is to provide seed funding to build companies to a stage where they will be attractive to private-sector investors. IAF funds are used for business development, product development, team recruitment, and/or the implementation of a marketing or distribution strategy. IAF-funded companies are early stage, privately-held companies with no institutional investment or significant revenue, but with innovative technology that can be protected. Specific eligibility criteria include the following:
• There is a total addressable market of at least $20 million and a viable plan to reach it;
• The company has defensible intellectual property;
• The company has a strong team, both managerially and technologically;
• The company is incorporated in Canada and pays 50% or more of its salaries to people in the province of Ontario;
• The company has less than $500,000 in total assets and total revenue under $500,000.
The MaRS website indicates that the IAF has supported 54 companies in the following sectors: information technology, communications and entertainment (35 companies), life sciences and health care (ten companies), and clean technology and advanced materials and engineering (nine companies).
Open access services
Free and open access services offered by MaRS include:
• Entrepreneurship 101, a free 30-week lecture series. Each lecture is one hour long and most are taught by a MaRS advisor or practising entrepreneur.

209
• The online Entrepreneur’s Toolkit, which is a set of online guides and resources on various topics such as Governance, Legal and IP and Human Resources.
Delivery arrangements
The MaRS programs have full-time managers, but much of the advisory services work is done by people who have entrepreneurial experience and are providing assistance on a contractual basis. The information is not available to determine the relevant extent to which delivery arrangements are funded by clients, the private sector and the public.
Strengths and weaknesses
This discussion of the strengths and weaknesses of MaRS is necessarily incomplete because there is little publicly available information about its program outcomes. Because MaRS has the legal form of a charitable organization, some of the financial information reported to the Canada Revenue Agency, the tax authority in Canada, is publicly available. Information from these reports over the period 2009-2010 is shown in Table 2. The figures for 2011 are not shown because the year-end changed and they represent only three months of activity.
Strengths
• One of the strategic objectives of MaRS is to create a vibrant innovation hub and its physical space is an asset in this regard. The building is within walking distance of two universities, Toronto’s geographic cluster of hospitals, Toronto’s financial district, and Toronto’s downtown. It is on a subway line that provides access from further afield. It is a well-used venue for innovation-related events, some run by MaRS, such as the upcoming two-day Social Finance Forum, and some run by other entities, such as the Canadian Innovation Exchange (CIX).
• The MaRS building is also an asset that provides substantial rental revenue. MaRS received $95 million in start-up capital from the government of Ontario (McDowell, 2010). Its building is its primary asset, and provided revenue close to $13 million in each of 2009 and 2010 which accounted for 55% (2009) and 64% (2010) of the organisation’s total revenue. Many of the tenants are not associated with start-ups; for example, some hospital-based medical research programs rent space at MaRS.
• According to Alexa.com, the MaRS website is ranked 5,017 in Canada in terms of traffic, reflecting its specialized nature. Half the visitors to its website are from Canada, almost 10% are from India, and just over 9% are from the U.S. MaRS is more visible in terms of social media: its Klout score of 66 indicates that there is a high level of social media activity about MaRS.
• MaRS has been successful in developing partnership with a host of public and private sector organizations. For example, in 2012 MaRS launched the Centre for Impact Investing through a partnership with TMX Group, a private sector organization which has multiple lines of business, including the Toronto Stock Exchange. As with other partnerships, the TMX Group will provide funding, resources and capital markets expertise to the Centre.
• Anecdotally, we know that start-ups are keenly interested in becoming affiliated with MaRS, which suggests that there are positive consequences to such an affiliation.

210
Weaknesses
• There is no publicly available information on the program outcomes of MaRS. The government of Ontario is an important funding source, comprising 40% of total revenue in 2009 and 30% of total revenue in 2010. Because MaRS has the legal form of a charitable organisation, it is accountable to its Board of Directors and has no legal requirement for public reporting beyond the financial reporting required by the federal government because of its charitable status.
• It is difficult to gain insights from the reporting of expenditures since a large and growing percent are accounted for in an “other” category: 39% in 2009 and 42% in 2010.
Measurement & evaluation system and impact
It is not possible to provide a description of, or a commentary on, the measurement and evaluation system used because relevant information about it is not publicly available.
The numbers that are released are difficult to interpret because key definitions are unclear. MaRS measures and reports on the following outcomes: total amount of capital raised in client firms, total client firm revenue, and number of new jobs reported in client firms. However, what counts as a “client firm” is unspecified, and there is a wide spectrum of involvement, ranging from attendance at a free event to incubation and investment. For example, a recent report indicates that in 2011, $277 million in capital was raised for client firms, client revenue totaled $159 million, and 1,500 new jobs were reported by portfolio companies, and there were 1,054 clients in the MaRS portfolio. Without knowing the extent to which these clients were involved with MaRS, and the nature of the program intervention, it is not possible to link these outcomes with MaRS programs. Similarly, MaRS reports that 10,500 people attended educational events at MaRS in 2011, but it is not specified whether this number includes only events put on by MaRS, or whether it also includes events put on at MaRS (the venue) by other organisations.
Recommendations for improvement
Because information on program outcomes is not available, it is not possible to make program-related recommendations. However, MaRS has recently issued an RFP for a two-part engagement to assess the organisation’s impact since its founding and possible growth plans for the future, and this initiative is likely to provide recommendations for improvement.

211
Table 15.1 Information Requested for Access to MaRS Advisory Services
Topic Information requested
Timing What date did you start working on this idea?
Team How many people are currently on your team? Who's on your team? What's their role?
Pitch Tell us your story
Customers For whom are you creating value? Who are your most important customers? Which group of customers does your solution target? What customer problem are you solving? What needs are you satisfying? What is your solution? What bundles of products and services are you offering your customers?
Product Tell us what you know about the market opportunity and competitive landscape for your solution. What do you know about direct and indirect competitors in the market? Who else is trying to solve your customer's pain point? How are they doing it? What about your product is unique? Why do you believe you have a competitive advantage? Tell us about your differentiation and why it's going to make you the winner in the market.
Revenue model Tell us how you will generate revenue to operate your business. What traction do you have? Provide some evidence that there is demand for your solution in the marketplace. If you’re making money, please tell us your revenue earned last year.
Development Stage
Please select your product development stage: Ideation, Product under development, Minimum viable product built, Proof of concept achieved, Product being tested or in trials, Minimum viable product in market, We're at a later stage
Intellectual property
Do you have any provisional or pending patents or do you believe you have proprietary intellectual property (e.g. trade secrets)?
Capital If you’ve raised capital for your venture, how much you’ve raised since inception? If you are currently seeking to raise capital, please tell us how much.
Milestones Looking back, what 3 milestones have you accomplished?
Goals Looking forward, what goals are you working towards in 6 months? 12 months? 18 months?
Help required Tell us how you’re hoping we can help. What particular challenges are you currently facing and how are you hoping we can help? Please be specific.
Source: The MaRS website: http://www.marsdd.com/working-with-mars/application/

212
Table 15.2 Financial information reported by MaRS, 2009-2010
Financial category 2010 2009
Total assets $144,955,060 $154,945,404
Land and buildings 132,385,881 91% 131,322,169 85%
Total revenue 19,932,161 23,963,317
From the government of Ontario 6,028,852 30% 9,561,438 40%
From rental of land or buildings 12,784,438 64% 13,079,143 55%
From sales of goods and services 605,371 3% 487,698 2%
Total expenditures 28,976,938 29,102,712
Breakdown by expenditure type
Advertising and promotion 120,441 137,086
Travel and vehicle 142,952 273,617 1%
Interest and bank charges 1,093,084 4% 1,133,755 4%
Licenses, memberships and dues 10,257 6,280
Office supplies and expenses 430,481 1% 912,124 3%
Occupancy costs 6,559,012 23% 7,112,185 24%
Professional and consulting fees 2,637,019 9% 2,848,552 10%
Education and training 46,638 38,573
Compensation 4,814,688 17% 4,256,081 15%
Amortization of capital assets 1,020,761 4% 917,777 3%
Other expenditures 12,065,970 42% 11,424,828 39%
Breakdown by expenditure use
Charitable programs 21,304,491 74% 21,832,651 75%
Management and administration 5,120,433 18% 6,052,711 21%
Fundraising 1,325,848 5% 1,217,350 4%
Political activities 37,500 0
1. All dollar figures are in CAD, as of the year reported.
2. Percentages are calculated as the percent of the line item from the total directly above. Only percentages over 1% are included in the table.
3. Some asset and revenue categories are omitted because they are negligible compared to the high proportion accounted for by the categories shown in the table.
Source: Canada Revenue Agency, Registered Charity Information Return for MaRS: http://www.cra-arc.gc.ca/ebci/haip/srch/t3010returnlist-eng.action?b=876682717RR0001&n=MARS+DISCOVERY+DISTRICT&r=http%3A%2F%2Fwww.cra-arc.gc.ca%3A80%2Febci%2Fhaip%2Fsrch%2Fbasicsearchresult-eng.action%3Fk%3Dmars%26s%3Dregistered%26p%3D1%26b%3Dtrue

213
References
All information is from the MaRS website (www.marsdd.com) unless otherwise stated.
McDowell, A. (2010), “Discovering Life at MaRS: Toronto’s Premier Innovation District Celebrates its Fifth Anniversary,” Financial Post, 28 August, p. A10.
Canada Revenue Agency, Registered Charity Information Return for MaRS:
http://www.cra-arc.gc.ca/ebci/haip/srch/t3010returnlist-eng.action?b=876682717RR0001&n=MARS+DISCOVERY+DISTRICT&r=http%3A%2F%2Fwww.cra-arc.gc.ca%3A80%2Febci%2Fhaip%2Fsrch%2Fbasicsearchresult-eng.action%3Fk%3Dmars%26s%3Dregistered%26p%3D1%26b%3Dtrue

214
CHAPTER 16. CHILE'S SEED CAPITAL PROGRAMME
Context and rationale of the initiative
Created by law in 1939, CORFO is the Chilean agency responsible for fostering economic development.. Throughout its history, CORFO has completed a variety of tasks related to the promotion of national economic activity, including the creation of state owned enterprises and offering direct credit to businesses. Nevertheless, since the return of democracy at the beginning of the 1990s, CORFO has focused its actions on stimulating innovation, entrepreneurship and the development of small and medium enterprises (SME). To SMEs CORFO offers matching grants and channels financial support through financial intermediaries (CORFO acting as second tier bank). Currently, CORFO’s mission is defined as: “To foster entrepreneurship and innovation to improve Chilean productivity and competitiviness in the global market.”108
CORFO’s Seed Capital Program (SCP) was created in 2001, with the objective of supporting the initial launch of innovation-based start-ups with high growth potential (dynamic entrepreneurship). The SCP was created as part of a package of initiatives designed to promote the development of dynamic start-ups in the country. These efforts began at the end of the 1990s with the establishment of credit lines to stimulate the creation of private venture capital funds, but later on, based in a diagnostic that pointed out the necessity of improving the deal flow of technological start-ups, a number of programs to encourage entrepreneurship were added. These programs, in addition to the SCP, have included support for: the creation of business incubators (2001); the development of angel investors (2006), corporate entrepreneurship (2008) and the installation of foreign start-ups in Chile (2011).
The SCP, along with business incubator programs for technological industries, arose as a response to the lack of attractive entrepreneurial projects for Venture Capital Funds investors. One of the barriers identified to generating an adequate flow of projects was the difficulty faced by new, innovative start-ups in gaining access to finance at the beginning of the planning and implementation stages of their businesses (the so-called Valley of Death in the life cycle of companies). Despite the fact that the credit market in Chile is quite well developed, these types of start-ups are challenged with particularly difficult conditions for obtaining bank credit. This is due to the higher levels of uncertainty that characterize innovative businesses, the absence of credit track record for new start-ups, and the often intangible nature of their assets. Another problem mentioned by the Venture Capital Funds was that entrepreneurs were not properly prepared to formulate and implement their business plans. On many occasions, interesting ideas or projects were not able to take off due to these weaknesses in the entrepreneurs, particularly those trying to get funds for launching a venture based upon innovative technology.
Client firms
The SCP aimed to solve these problems through a scheme that sought to combine the transfer of financial resources with expert assistance. To achieve this double objective, the program transfers resources only to enterprises introduced by organizations that have been pre-qualified as “sponsors”. These sponsors are charged with supporting entrepreneurs in the development of a project to be presented for 108 http://www.corfo.cl/sobre-corfo Accessed Sep 19, 2012

215
financing and then helping the selected start-ups through-out the implementation of their project. The sponsors receive a fee depending on the successful completion of each task. Although this program has suffered a series of important changes since its inception, the basic core scheme of the operation has been maintained.
The SCP targets businesses in the initial phases of operations. Beneficiaries may be persons or corporations which have been operating for less than 24 months, and whose sales have not exceeded 100 million pesos (about US$200,000) during the six months prior to application.109 Although SCP has always been intended to support innovative enterprises, there has been continuous fluctuation as to the technological nature required of the companies supported. Initially, the SCP focused exclusively on technological start-ups, but after a few years the low demand led to use wider criteria to assess the innovative merit of the projects (innovation in business models, for example). At the end of the last decade, the focus returned to technological businesses; however, the change lasted little more than a year, and in 2010 the criteria for considering the innovative merit of a business were extended to become even more generous than previously.
Services offer
The SCP was designed to channel both financial and technical support to start-ups. Financial support is directly provided by CORFO to the firms that are selected, but the accompanying activities depend upon the specific needs of each firm as assessed by the sponsor working with it. There is no blueprint for the services provided by the sponsor, but they need to submit a program of activities to CORFO when they propose a firm to the SCP. Normally this include helping in drawing up a business plan, providing financial and marketing counseling, access to new clients and technological partners and contact with new potential investors. Firms are supposed to shop around and look for the best sponsor according to their needs. If they are not satisfied with the services provided, they have the option of changing sponsor.
Delivery arrangements
Since its inception, SCP has had three modes of operation. In the first period (2001 – 2004) the selected projects were supported with a matching grant provided in one installment. In the next period, the program was divided into two different lines, named L1 and L2. L1 was designated for supporting the first phases of starting up a business, including market studies and formulating a business plan. To this end, resources were provided for up to 80% of the costs of an approved project, with a maximum of approximately US$14,000. This support included remuneration of up to US$2,000 for the sponsoring entities. This line was created because the sponsors indicated that many high-potential start-ups were left out of the process, since they required more initial support than the sponsors could afford. The second line (L2) provided financial resources for properly launching the start-ups. In this case, the support provided was up to approximately US$80,000, requiring co-financing of only 10% of the total cost for the project from the business start-up. The remuneration paid to the sponsors was limited to approximately US$12,000. Application to these two lines was independent, but anyone who applied for L2 could have applied previously for L1.
Since May 2012, the SCP has been working under a new operational format.110 The program now operates in two phases. The first provides resources of up to seven million pesos (about US$14,500), and the second phase may reach up to 33 million pesos (about US$69,000). In both cases, the amount of the 109 Seed Capital financial line Technical bases and their annexes” CORFO CEO’s exempted resolution May
17, 2012 [resolution exempted of control by the Comptroller Office.] 110 Seed Capital financial line: Technical bases and their annexes” www.corfo.cl. Accessed September 20,
2012.

216
matching grant may not exceed 75% of the total financial cost of the project. To pass to the second phase, the beneficiaries must present a report showing that they have completed certain critical milestones (a “trigger” report), established when the first phase of the project is approved. The total timeline for the implementation of the project, taking into account both phases, is 24 months. The applicants themselves establish the duration of each of the phases and the particular objectives that will be targeted in each one.
This new mode of operation also considers a change in the way sponsors are remunerated; they are now paid not for completing activities in the approved projects, but in proportion to the results obtained. There are three possible attainable goals: (i) initiation of sales, achieving an increase in sales of at least 50 million pesos (about US$100,000) in the six months preceding accreditation of the completed goal; (ii) increase in sales, whereby an additional payment exists if the project can prove sales growth superior to the equivalent of 50% annually within a period of six months. The base for calculating the increase is the total sales reported for completion of the previous outcome; (iii) amount of new investment, achieved when the business obtains additional capital from Investment Funds or Angel Investors. In each of these cases, the amount to be paid to the sponsors is defined by a formula involving the percentage of the goal that has been achieved and with a ceiling of 60 million pesos (about US$120,000). Projects have a timeline of 48 months from initiation to complete the stated goals.
Additionally, sponsors have a right to a share option of up to 7% of the business they are supporting, but this option may be taken up only after the conclusion of CORFO support.
Sponsors are the key to how this program functions, because they are responsible for identifying and selecting the start-ups that participate in the program. The selection of sponsors has also changed over time. Initially sponsors were chosen by CORFO through an open call, based on criteria such as experience, financial solvency and the applicant’s objectives. Given that the beginnings of the SCP coincided with the launch of a stimulus program for the creation of technological business incubators (and the strengthening of those few already in existence), these entities made up the great majority of accredited sponsors. Due to the expansion of incubator (there are now more than 25 incubators throughout the country, the majority associated with Universities) and pressure to extend the SCP, there was a sharp increase in the number of accredited sponsors, reaching a peak of 37111, although the majority showed little activity. In 2009, the status of sponsor was restricted to a group of business incubators that had accredited specific competencies through a special application process.
Despite the central role of sponsors in identifying attractive projects, the final selection procedure is carried out by CORFO through a process that includes two stages. The first is a review of the project by CORFO staff. This analysis is not merely formal, but often involves interaction with the sponsors, above all to resolve doubts about the potential of the business and the suitability of the proposed plan of activities. For this stage, CORFO can draw on a staff of 10 professionals from diverse backgrounds, including engineers, agronomists and business management experts. It also has an administrative and legal support team. Once the projects have passed through this first filter, they then are presented to a committee made up of one representative from CORFO, one from the Ministry of Economy, one from the Ministry of the Finance and two representatives from the private sector with experience in entrepreneurship. This is the body that decides whether or not to support the project.
111 Rivas, G. (2010): Generation and systematization of support for the evaluation of National Innovation
Strategy in the area of business innovation; Background Report prepared for the National Council on Innovation and Competitiveness, Santiago, March 2010

217
Strengths and weaknesses
The SCP has two interesting features that deserve to be underlined. First, it provides both financial and non-financial support to start-up, thus recognizing that at that stage the challenges that face newly born firms are not merely related to accessing capital, but also to counseling and access to relevant networks. Second, it works through a network of private agents, which allows the program to expand its coverage and provides a specialized filter in the first selection of the beneficiaries. The fact that it has remained in place for more than ten years it is also a worthy attribute of the program because it permits CORFO a learning process in this field.
The main weaknesses of the SCP are the following. In the first place, the program objectives have been changed more than once, oscillating between a narrow focus on businesses based on technological development, and a wider one that admits other types of innovations in its support for new business. Sponsors and CORFO staff must develop distinct capabilities for one case or the other. Frequent changes of the objective may have an impact on program outcomes and in the types of signals generated toward potential clients. In the second place, a perception exists that the SCP is excessively bureaucratic and that process timelines are too long, sometimes more than 10 months from the first contact by the company to when they receive support. This is the main complaint expressed in the survey of clients done by CORFO in 2008112 and is also the opinion among sponsors. If the SCP is considered slow and bureaucratic, this probably generates an adverse self-selection process among applicants. In the third place, when a business wants to modify some of its activities or expense items in a project that has been approved, it requires the authorization of CORFO. Given that in its initial phases a business must frequently re-define itself as it grows, this situation introduces additional bureaucratic red tape for the operation of the SCP. Finally, the way in which the PCS has operated does not offer incentives to the sponsors associated with the success of the business they support. The new scheme that has recently been introduced is intended to do precisely that, but it is still too early to evaluate how it will operate.
M&E system and impact evidence
By 2010, the SCP had supported 419 new business start-ups with US$23 million, and 533 pre-investment studies (L1) with US$5.9 million. In 2010 and 2011, the program helped around 500 projects per year, reflecting the change toward more generous innovation criteria previously mentioned.
Two studies have been done to assess the results generated by the SCP. One was done in 2008, as part of a general effort by CORFO to analyze its institutional performance, and the second in 2009, to develop inputs within the framework of an instrument design review process. In both cases, the analysis asked beneficiaries to complete a survey as the basic input.
The 2008 study113 worked with a population of 163 beneficiaries which had received support for their start-ups to December 2007. Of this total, the institution in charge of carrying out the study was able to locate 103 (63%), ultimately applying the survey to a sample of 83. The survey showed that of those businesses who responded, a high concentration were located in the country’s capital (64% of the projects), coming from diverse sectors (those related to information technology and communication having the highest participation at 22%), and that the majority had based their businesses on the development of a new product (40%) or service (25%).114 From the point of view of the results, the businesses surveyed showed an average increase of sales of 44% in their fourth year of existence and on average created eight stable
112 45% of those who responded indicated something to that effect. 113 CORFO (2009): “Projects of INNOVACHILE, results report”, Santiago, Chile. 114 5% had innovated in processes and 12% in commercialization.

218
jobs. In terms of additional financing, one case had obtained resources from an Angel Investor, seven from private investors, and 12 through bank loans. The majority of businesses surveyed (75%) showed sales destined solely for national markets. The survey also indicated that the performance of businesses supported by incubators was markedly superior to that of start-ups helped by other types of sponsors.
The study from the following year115 worked with the same population. It located 100 clients, of whom 76 were still operating, but could only survey 40. The results in terms of sales and job creation were similar to those expressed above, and the proportion achieving subsequent financing was also similar. This suggests that the 40 businesses well disposed to answer the second survey probably included those that had achieved better results. This study also found that incubators worked better with businesses than other sponsors. An additional element in this study was the effort made to contact start-ups whose projects were rejected by CORFO. Of the 44 cases reviewed, only one had prospered. This indicates good judgment ability by CORFO to decide which projects to support, although it is also indicative of how many applicants come to the program with little potential.
The SCP is an instrument designed to support companies in their earliest stages, where a high rates of failures is to be expected. Nevertheless, a program that aims to back businesses with high growth potential should also be able to demonstrate a few great success stories. This has not been the case so far with the SCP. Part of the problem may be the absence of sufficiently attractive projects in Chile, which simultaneously relates to a low level of investment in R&D and a low degree of development in companies with a technological base. Nevertheless, the weaknesses previously referred may also be conspiring against better results.
Recommendations for improvement
The SCP has recently been radically modified and it is too early to assess the effects of the changes implemented. In principle they are headed in the right direction in the sense that they aim to provide more results-oriented incentives to the sponsors for their work, which is one of the weakness identified for the program. The big question is whether sponsors can be found who are prepared to depend on remuneration determined entirely by the good performance of their projects. CORFO should consider exploring a mechanism that could preserve the idea of providing a strong result-oriented incentive to the sponsor but also support then in developing some crucial capabilities (i.e. trough a performance contract).
115 Support and Consultancies in Development (2009): “Consultancy for the design, measurement and
intermediate results analysis and impact on instruments of the INNOVACHILE Sub-Department of Innovative Start-ups for CORFO”, final report, Santiago, Chile.

219
CHAPTER 17. BRAZIL’S INOVAR VENTURE CAPITAL PROGRAMME
The Inovar Project is an initiative planned and funded by the Brazilian government’s Agency for Innovation (FINEP) and the Multilateral Investment Fund (MIF) together with the Inter-American Development Bank (IDB), through an international cooperation agreement. The project has been executed by FINEP, with support from MIF, in two phases. The first phase, or Inovar I, lasted from 2000 until 2007 and the initial financial commitment was divided in a ratio of US$ 3.00 from FINEP for every US$ 1.00 from MIF. Its project budget was US$ 4.9 million, but FINEPs disbursements added up to roughly US$ 10 million, making the phase I one of the project achieve approximately US$ 11 million in disbursements for operating costs. The second phase of the project, also known as Inovar II, was planned to last from 2008 until 2012, but has been prolonged until 2013. The project budget for this phase was around US$ 5.4 million and the commitments were set to a 1:1 ratio between FINEP and MIF.
Context and rationale
FINEP was founded in 1967 and has operated several instruments, such as grants to universities, low and zero interest financing to companies, aimed at fostering innovation and innovative companies and projects. In 1999, concerned with the lack of innovation transfer into the market through new products or services, mainly fueled by the scarcity of financing for innovative companies, FINEP decided to do a diagnosis of Brazil’s innovation environment and decided that venture capital could be the perfect instrument to foster innovation in companies. In this diagnosis FINEP was able to identify some relevant gaps that were to be addressed if the venture capital industry in Brazil had to be fostered.
• There were very few domestic Venture Capital (VC) fund managers with any significant track record.
• Local pension funds were unwilling to invest in private equity, particularly venture capital. In 1999, Brazil’s private pension funds alone had US$70 billion under management (13.5% of GDP), but very little invested in private equity.
• There was no national organization for private equity firms to share lessons they had learned or to lobby for regulatory change.
• There was no effective bridge between investors and SMEs. It was difficult for SMEs to find global partners (GPs) that might be interested in investing, and when they did so, few GPs had the skills to assess the opportunity. Moreover, few entrepreneurs were comfortable with active, equity-owning investors.
• The regulatory and legal framework for on-shore VC and later stage investments needed development. Exits from VC investments almost always occurred through strategic or trade sales as the market for Initial Public Offerings (IPOs) was limited. For example, between 1995 and 1999, Brazil’s main stock exchange (BOVESPA) had only four IPOs.
• Few companies regardless of their size were familiar with private equity as a financing vehicle.

220
Client firms (target group and firm selection)
To address the identified gaps, the project had to focus on 3 “clients”:
• Investors : FINEP needed to attract investors, more notably pension funds, who would be willing to finance innovation for the expectation of above average returns;
• Global Partners (GPs): FINEP needed to attract and train new GPs who would be interested in managing the investments, finding and helping innovative companies grow;
• Companies: FINEP had to attract and familiarize the companies with venture capital;
The attraction of investors was done through institutional presentations and invitations to Private Equity and Venture Capital (PE/VC) events so that the investors could feel more comfortable with the asset class. The obvious choices of investors to go after first were the biggest pension funds in Brazil.
Concerning the GPs, FINEP started holding public calls for PE/VC fund proposals through what became known as Inovar’s fund incubator. This also served as a great instrument to attract investors because they could analyze fund proposals together. For the GPs this was perfect because they would have the chance to, in one day, present their fund to most of the major investors who were interested in the asset class in Brazil.
The selection of companies is done through the process developed for Inovar’s Venture Forum. The Venture Forum was focused in selecting the best innovative companies, providing them with business and pitch coaching and giving them a chance to present their companies to investors at the event (the actual venture Forum). This also served as a way to attract other investors, more specifically the ones that were interested in investing directly into companies.
Services offer
Besides the ones cited above such as the Fund Incubator, which by itself serves as a learning and experience sharing process for investors, FINEP, through Inovar, has been offering courses in PE/VC, either in Brazil or abroad, for the investors who are official partners of Inovar. Also for the GPs, FINEP has held courses for new GPs and sent professionals abroad for courses such as VCI (Venture Capital Institute).
Strengths and weaknesses
The focus on innovation and returns has provided FINEP with the incentive to develop its most important strengths. One of them would be the adaptability to changes in the market. The Inovar program has been able to change and adapt its programs and components according to the interest prevailing in the market. This has also been possible due to the market oriented design and implementation of the components.
As to weaknesses, we could consider that the Inovar team, which has to be highly skilled, is paid in a government salary band and there is an obvious greater political risk.
Monitoring and evaluation system and impact
The monitoring of results and impact has been done using the models determined by IDB, reported 2 times a year and the program has been evaluated 3 times already (2 for Inovar I and once for Inovar II). Some of the most expressive results are as follows:

221
• FINEP has committed approximately US$ 200 million to 27 PE/VC/Seed funds, serving as anchor investors for most of them. In turn, these 27 funds represent a total of around US$ 2 billion in capital commitments. Of these 27 funds, 18 are operating and they have invested in close to 100 companies.
• Concerning investor attraction, the 5 biggest pension funds in Brazil are some of the official partners of Inovar. All the Inovar partners represent together approximately 10% of Brazils GDP in assets.
• On the Venture Forums, FINEP has held 39 Forums (between Venture, Seed and IPO), attracting over 4,000 companies and coaching almost 400 innovative companies. Approximately 20-25% of the companies that received coaching have been able to secure funding from investors.
Recommendations for improvement
The experience FINEP has gained in the last twelve years with Inovar, and the maturity the Brazilian VC market has achieved due to the efforts of so many alongside FINEP, may qualify FINEP to be a more direct instrument for the government in developing key sectors.
References
Leamon A. and J. Lerner (2012), “Creating a Venture Eco-system in Brazil: FINEP’s INOVAR Project”, Harvard Business School Working Paper, n. 12-099.
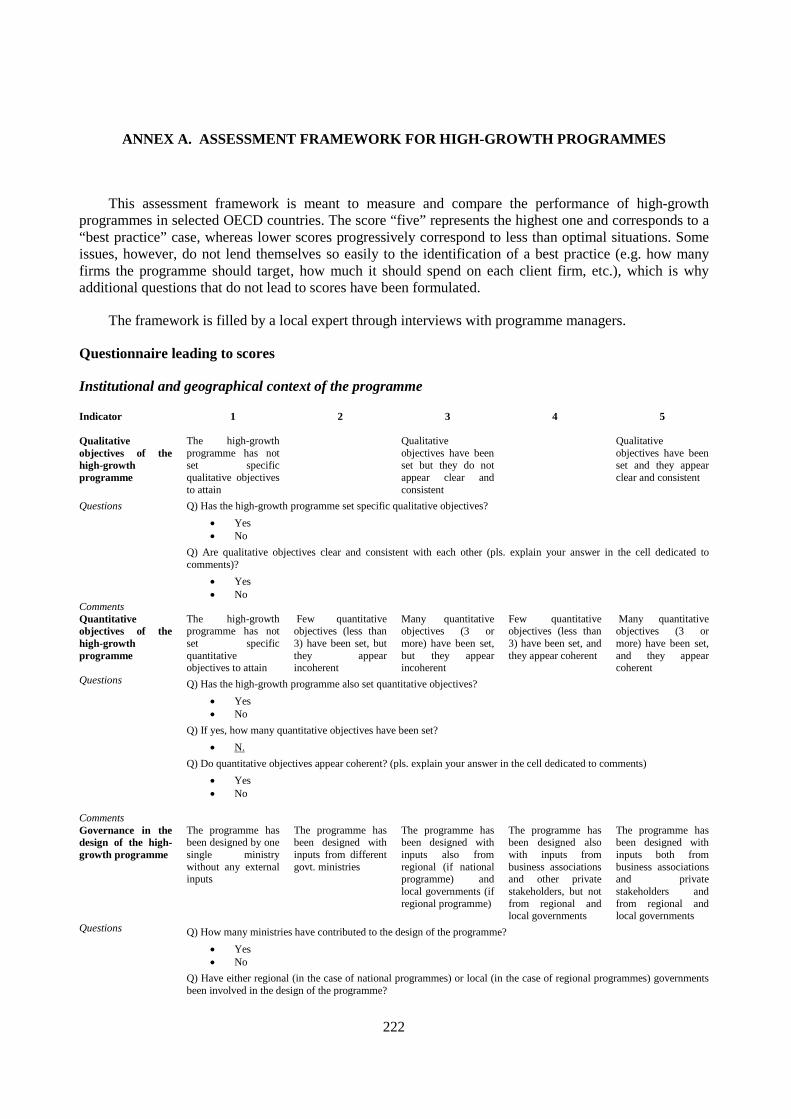
222
ANNEX A. ASSESSMENT FRAMEWORK FOR HIGH-GROWTH PROGRAMMES
This assessment framework is meant to measure and compare the performance of high-growth programmes in selected OECD countries. The score “five” represents the highest one and corresponds to a “best practice” case, whereas lower scores progressively correspond to less than optimal situations. Some issues, however, do not lend themselves so easily to the identification of a best practice (e.g. how many firms the programme should target, how much it should spend on each client firm, etc.), which is why additional questions that do not lead to scores have been formulated.
The framework is filled by a local expert through interviews with programme managers.
Questionnaire leading to scores
Institutional and geographical context of the programme
Indicator 1 2 3 4 5 Qualitative objectives of the high-growth programme
The high-growth programme has not set specific qualitative objectives to attain
Qualitative objectives have been set but they do not appear clear and consistent
Qualitative objectives have been set and they appear clear and consistent
Questions Q) Has the high-growth programme set specific qualitative objectives? • Yes • No
Q) Are qualitative objectives clear and consistent with each other (pls. explain your answer in the cell dedicated to comments)?
• Yes • No
Comments Quantitative objectives of the high-growth programme
The high-growth programme has not set specific quantitative objectives to attain
Few quantitative objectives (less than 3) have been set, but they appear incoherent
Many quantitative objectives (3 or more) have been set, but they appear incoherent
Few quantitative objectives (less than 3) have been set, and they appear coherent
Many quantitative objectives (3 or more) have been set, and they appear coherent
Questions Q) Has the high-growth programme also set quantitative objectives? • Yes • No
Q) If yes, how many quantitative objectives have been set? • N.
Q) Do quantitative objectives appear coherent? (pls. explain your answer in the cell dedicated to comments) • Yes • No
Comments Governance in the design of the high-growth programme
The programme has been designed by one single ministry without any external inputs
The programme has been designed with inputs from different govt. ministries
The programme has been designed with inputs also from regional (if national programme) and local governments (if regional programme)
The programme has been designed also with inputs from business associations and other private stakeholders, but not from regional and local governments
The programme has been designed with inputs both from business associations and private stakeholders and from regional and local governments
Questions Q) How many ministries have contributed to the design of the programme? • Yes • No
Q) Have either regional (in the case of national programmes) or local (in the case of regional programmes) governments been involved in the design of the programme?

223
• Yes • No
Q) Have business associations and other private stakeholders been involved in the design of the programme? • Yes • No
Comments Geographical scope of the high-growth programme
The high growth programme is available in only one region of the country
The high growth programme is available in more than one but not in most regions of the country
The high growth programme is available in most regions of the country
The high growth programme is available in all regions of the country
Questions Q) How many regions are in the country? • N.
Q) In how many regions of the country is the high growth programme active? • N.
Comments
Staff profile of the programme
Indicator 1 2 3 4 5 Academic background of the programme’s professional staff
Less than 20% holds a bachelor’s degree or more
More than 20% but less than 40% holds a bachelor’s degree or more
More than 40% but less than 60% holds a bachelor’s degree or more
More than 60% but less than 80% holds a bachelor’s degree or more
More than 80% holds a bachelor’s degree or more
Questions Q) What is, even approximately, the percentage of professional staff in the programme with at least a bachelor degree? • %
Comments Academic background in management (BA mgmt. or MBA) of the programme’s professional staff
Less than 20% holds a university degree in management
More than 20% but less than 40% holds a university degree in management
More than 40% but less than 60% holds a university degree in management
More than 60% but less than 80% holds a university degree in management
More than 80% holds a university degree in management
Questions Q) What is, even approximately, the percentage of professional staff in the programme with a university degree in management (bachelor or MBA)?
• %
Comments Academic background in applied sciences (BSc. or MSc.) of the programme’s professional staff
Less than 20% holds a university degree in applied sciences
More than 20% but less than 40% holds a university degree in applied sciences
More than 40% but less than 60% holds a university degree in applied sciences
More than 60% but less than 80% holds a university degree in applied sciences
More than 80% holds a university degree in applied sciences
Questions Q) What is, even approximately, the percentage of professional staff in the programme with a university degree in applied sciences (BSc. or Msc.)?
• %
Comments Average number of years of work experience of the programme’s professional staff
Less than 3 years More than 3 but less than 6 years
More than 6 but less than 9 years
More than 9 but less than 12 years
More than 12 years
Questions Q) What is, even approximately, the average number of years of work experience of the programme’s professional staff? • N.

224
Comments Average number of years of industry experience of the programme’s professional staff
Less than 3 years More than 3 but less than 6 years
More than 6 but less than 9 years
More than 9 but less than 12 years
More than 12 years
Questions Q) What is, even approximately, the average number of years of work experience of the programme’s professional staff? • N.
Comments Average number of years of experience as business owner of the programme’s professional staff
Less than 3 years More than 3 but less than 6 years
More than 6 but less than 9 years
More than 9 but less than 12 years
More than 12 years
Questions Q) What is, even approximately, the average number of years of experience as business owner of the programme’s professional staff?
• N.
Comments
Client firms of the programme
Indicator 1 2 3 4 5 Selection of client firms by the high-growth programme
There is not any selection of firms. The principle ‘first come, first served’ is applied.
Firm selection is based exclusively on a qualitative assessment of the firm.
Firm selection is based prevalently on a qualitative assessment of the firm, but some quantitative criteria are also considered
Firm selection is based exclusively on a quantitative assessment of the firm.
Firm selection is based prevalently on a quantitative assessment of the firm, but qualitative criteria are also considered
Questions Q) Is there any selection of client firms by the programme staff? • Yes • No
Q) If yes, what types of criteria are used in the selection process? • Only qualitative • Only quantitative • Prevalently qualitative • Prevalently quantitative
Comments Sector concentration of the high-growth programme
The high-growth programme is focused only on one specific industry or sector
The high-growth programme is focused only on one transversal technology
The high-growth programme is focused on more than one transversal technology
The high-growth programme does not have any sector or technology focus, but is limited to either manufacturing or services
The high-growth programme does not have any sector or technology focus and includes both services and manufacturing
Questions Q) Does the programme target a narrow economic sector (i.e. NACE sectors such as pharmaceuticals, medical instruments, food processing, etc)?
• Yes • No
Q) Does the programme target any specific technology with multiple industry applications (e.g. biotech, nanotech, ICT, etc.)?
• Yes, one (pls. specify which one): ______________ • Yes, more than one (pls. specify which ones): ______________ • No
Q) Does the programme target both manufacturing and services? • Only manufacturing • Only services (unlikely) • Both

225
Comments Market orientation of the high-growth programme
Less than 20% of client firms have an international market
More than 20% but less than 40% of client firms have an international market
More than 40% but less than 60% of client firms have an international market
More than 60% but less than 80% of client firms have an international market
More than 80% of client firms have an international market
Questions Q) What is the (approximate) share of client firms of the programme that have an international market (i.e. they export)? • %
Comments Follow-up of client firms after the intervention
There is not any follow-up of client firms.
Follow-up is done only informally (no collection and storage of information) and erratically (less than once every 2 years)
Follow-up is done only informally (no collection and storage of information) but regularly (at least once every 2 years)
There is a formal follow up of client firms (collection and storage of information) but is done erratically (less than once every 2 years)
There is a formal follow up of client firms (collection and storage of information) and this is done regularly (at least once every 2 years)
Questions Q) Does programme staff do any follow up activity with client firms after the intervention? • Yes • No
Q) If yes, does the follow-up activity imply the formal collection and storage of information about the client firms? • Yes • No
Q) If yes, what is the frequency of the follow-up activity? • At least once every 2 years • Less than once every 2 years
Comments
Business diagnosis in the programme
Indicator 1 2 3 4 5 Business diagnosis of client firms
There is not any formal business diagnosis to assess strengths and weaknesses of client firms
There is a formal business diagnosis but only touches on one area
There is a formal business diagnosis but only touches on two areas
There is a formal business diagnosis and it touches on three areas of analysis
There is a formal business diagnosis and it touches on four or more areas of analysis
Questions Q) Does the programme carry out a formal business diagnosis of client firms? • Y • N
Q) If yes, does it touch on any of the following areas? (multiple answers are possible) • Business concept • Business organisation • Customer relations • Operations • Other areas (pls. specify):
Comments Analysis of the ‘business concept’ in the frame of the business diagnosis of client firms
No dimension of ‘business concept’ or only one is analysed as part of the business diagnosis
Only two dimensions of ‘business concept’ are analysed as part of the business diagnosis
Three dimensions of ‘business concept’ are analysed as part of the business diagnosis
Four dimensions of the ‘business concept’ are analysed as part of the business diagnosis
Five dimensions or more of the ‘business concept’ are analysed as part of the business diagnosis
Questions Q) What of the following themes, if any, is analysed in the frame of the business diagnosis of client firms? • Business idea • Product portfolio • Business model • Customer portfolio • Market position • None of the above themes

226
• Other themes (pls. specify): ___________ Comments Analysis of the ‘business organisation’ in the frame of the business diagnosis of client firms
No dimension of ‘business organisation’ or only one is analysed as part of the business diagnosis
Only two dimensions of ‘business organisation’ are analysed as part of the business diagnosis
Three dimensions of ‘business organisation’ are analysed as part of the business diagnosis
Four dimensions of ‘business organisation’ are analysed as part of the business diagnosis
Five dimensions or more of ‘business organisation’ are analysed as part of the business diagnosis
Questions Q) What of the following themes, if any, is analysed in the frame of the business diagnosis of client firms? • Ownership and management structure • Staff organisation • Internal business process • Formal partnerships with other organisations • Legal affairs • None of the above themes • Other themes (pls. specify): _____________
Comments Analysis of ‘customer relations’ in the frame of the business diagnosis of client firms
No dimension of ‘customer relations’ or only one is analysed as part of the business diagnosis
Only two dimensions of ‘customer relations’ are analysed as part of the business diagnosis
Three dimensions of ‘customer relations’ are analysed as part of the business diagnosis
Four dimensions of ‘customer relations’ are analysed as part of the business diagnosis
Five dimensions or more of ‘customer relations’ are analysed as part of the business diagnosis
Questions Q) What of the following themes, if any, is analysed in the frame of the business diagnosis of client firms? • Sales • Commercial networks • Marketing • Branding • Communication and public relations • None of the above themes • Other themes (pls. specify): _____________
Comments Analysis of ‘operations’ in the frame of the business diagnosis of client firms
No dimension of ‘operations’ or only one is analysed as part of the business diagnosis
Only two dimensions of ‘operations’ are analysed as part of the business diagnosis
Three dimensions of ‘operations’ are analysed as part of the business diagnosis
Four dimensions of ‘operations’ are analysed as part of the business diagnosis
Five dimensions or more of ‘operations’ are analysed as part of the business diagnosis
Questions Q) What of the following themes, if any, is analysed in the frame of the business diagnosis of client firms? • Accounting • Business financing • Production management • IT system • Facilities • None of the above themes • Other themes (pls. specify): _____________
Comments
Delivery arrangements of the programme
(It is assumed that programme support can be delivered either directly (internalised) or indirectly (externalised) through intermediary organisations such as business support providers, semi-public organisations, etc.)
Indicator 1 2 3 4 5 Extent to which support delivery is internalised (by staff) or externalised (by intermediaries)
All support is internalised. There is no referral by the programme to intermediaries
Most support is internalised but some specialist advice is externalised to intermediaries.
Support is approx. equally provided by programme staff and intermediaries
Most support is externalised to intermediaries but some specialised advice is internalised
All support is externalised except for a first business diagnosis of client firms.

227
Questions Q) Does the programme use intermediary organisations (as defined above) to deliver support services? • Yes • No
Q) If yes, how common is this practice? • Seldom • Sometimes • Often • Always
Comments Direct involvement of programme staff with client firms (in 12 months)
The programme staff meets with the client firms only once
The programme staff meets with the client firms twice
The programme staff meets with the client firms three times
The programme staff meets with the client firms four/five times
The programme staff meets with the client firms more than five times
Questions Q) How many times does the programme staff meet with a client firm in the 12 months following the first meeting (first meeting included)?
• N
Comments Annual “client firms/programme adviser” ratio
Less than 25 Between 25 and 49 Between 50 and 74 Between 75 and 100 More than 100
Questions Q) How many firms does each programme adviser (i.e. professional staff member) follow on average each year? • N.
Comments Proactiveness of programme staff towards client firms
Programme staff exclusively receives client firms in the premises of the programme
Programme staff mostly receives client firms at the premises of the programme, but occasionally visit them at their establishments
Programme staff approx. equally receives client firms at the premises of the programme and visits them at their establishments
Programme staff occasionally receives client firms at the premises of the programme, but mostly visit them at their establishments
Programme staff exclusively visits client firms at their establishments
Questions Q) Does the programme staff visit client firms at their establishments? • Yes • No
Q) If yes, how common is this practice? • Occasional (firms are mostly received at the premises of the programme) • Quite common (firms are approx. equally received at the premises of the programme and visited at their
establishment) • Very common (firms are mostly visited at their establishments) • Regular (firms are exclusively visited at their establishments)
Comments Selection of intermediary organisations by the programme
The programme works with a restricted number of intermediaries (less than 10) that do not go through a competitive selection process
The programme works with a large number (more than 10) of intermediaries that do not go through a competitive selection process
The programme works with a restricted number of intermediaries (less than 10) that go through a competitive selection process
The programme works with a large number of intermediaries (more than 10) that go through a competitive selection process
Questions Q) With how many intermediary organisations does the programme work on average each year? (approx. estimate will be enough)
• N Q) Are intermediary organisations selected through a competitive process? (pls. give details in either case)
• Yes (pls. give details on how the selection process is organised and who selected them) • No (pls. give details on how intermediaries are chosen)
Comments Proactiveness of intermediary organisations towards client firms
Intermediaries exclusively receive client firms at their premises
Intermediaries mostly receive client firms at their premises, but
Intermediaries approx. equally receive client firms at their premises and
Intermediaries occasionally receive client firms at their premises, but mostly
Intermediaries exclusively visit client firms at their establishments

228
occasionally visit them at their establishments
visits them at their establishments
visit them at their establishments
Q) Do intermediaries visit client firms at their establishments? • Yes • No
Q) If yes, how common is this practice? • Occasional (firms are mostly received at the premises of intermediary organisations) • Quite common (firms are approx. equally received at the premises of intermediary organisations and visited at
their establishments) • Very common (firms are mostly visited at their establishments) • Regular (firms are exclusively visited at their establishments)
Comments Evaluation of the intermediary organisations
The programme does not evaluate the work of its intermediaries
The programme evaluates the work of its intermediaries through ad-hoc surveys of the intermediaries themselves
The programme evaluates the work of its intermediaries through regular surveys of the intermediaries themselves
The programme evaluates the work of its intermediaries through ad-hoc surveys of client firms
The programme evaluates the work of its intermediaries through regular surveys of client firms
Questions Q) Does the programme evaluate the work of its intermediaries? • Yes • No
Q) If yes, how is the work of intermediaries evaluated by the programme? • Direct surveys of the intermediaries • Survey of client firms (on satisfaction with services received) • Both types of surveys • Other methods (please specify): _____________
Q) If yes, is the evaluation of intermediaries done at regular intervals (twice a year, once a year, once every other year, etc.)?
• Yes (please specify the interval):_____________ • No (please specify when it was done the last time): _____________
Comments
Monitoring and evaluation of the programme
Indicator 1 2 3 4 5 Coverage of the evaluation
No component of the high growth programme is evaluated
Only few components (the major ones) of the high-growth programme are evaluated
Most components of the high growth programme are evaluated
All components of the high growth programme are evaluated
Questions Q) How many components/initiatives in the frame of the high programme are formally evaluated? • None • Some • Most • All (even if the high-growth programme consists of one only initiative)
Comments Type of evaluation Evaluation is based
on the measurement of outputs (e.g. take up rate)
The opinions of client firms about the programme are also collected
Evaluation is also based on the measurement of outcomes
The performance of client firms is compared with a control group of ‘match firms’
Econometric techniques are used to assess the impact of the programme on client firms
Questions Q) In the evaluation of the programme, do you collect information on outputs (e.g. n. of firms using the programme, n. of hours of advice, etc.)?
• Yes • No

229
Q) In the evaluation of the programme, do you collect information on outcomes (e.g. turnover, export value, employment of the firm after intervention)?
• Yes • No
Q) In the evaluation of the programme, do you collect information on the opinions of client firms about the programme? • Yes • No
Q) In the evaluation of the programme, do you compare the performance of client firms with a control group of match firms with similar characteristics?
• Yes • No
Q) In the evaluation of the programme do you aim at assessing the sheer impact of the programme on the performance of client firms through the use of econometric techniques?
• Yes • No
Please provide below further details in one paragraph on how the evaluation of the programme is conducted:
Comments Independence of the evaluation
The evaluation of the programme is done exclusively internally by programme staff
The evaluation of the programme is done by programme staff and an independent organisation together
The evaluation of the programme is done exclusively by an independent organisation
Questions Q) Who does the evaluation of the high-growth programme? • The programme staff • An independent organisation • Both of them working together
Comments Frequency of the evaluation
The evaluation of the programme is not planned in a regular way and is done ad hoc
The programme is evaluated every 5-6 years
The programme is evaluated every 3-4 years
The programme is evaluated every other year
The programme is evaluated each year
Questions Q) Was the evaluation of the programme planned at the early stage of programme design and foreseen since the launch of the programme?
• Yes • No
Q) How often is the programme evaluated? (pls. provide the answer in number of years) • N. of years: _______
Q) Which was the last year when the programme was evaluated? • Year: _________
Comments Use of the evaluation
The evaluation has been done in an ad-hoc manner and has not informed any change in the programme
The evaluation was planned at early stage but has not informed any change in the programme
The evaluation has been done in an ad-hoc manner, but has informed changes in the programme
The evaluation was planned at early stage and has informed changes in the programme
Questions Q) Was the evaluation of the programme planned at the early stage of programme design and foreseen since the launch of the programme? (from previous answer)
• Yes • No
Q) Do you reckon that the results of the evaluation have contributed to introducing improvements in the programme? • Yes
No Comments

230
Performance of client firms (over 3 years following the support)
Indicator 1 2 3 4 5 Average annual turnover growth rate of client firms
Lower than -2% (negative growth)
Higher than -2% but lower than 2% (negligible growth)
Higher than 2% but lower than 10% (moderate growth)
Higher than 10% but lower than 20% (robust growth)
Higher than 20% (fast growth)
Questions Q) What has been the average annual turnover growth rate of client firms (over the three years following the support)?
• %
Comments Average annual employment growth rate of client firms
Lower than -2% (negative growth)
Higher than -2% but lower than 2% (negligible growth)
Higher than 2% but lower than 10% (moderate growth)
Higher than 10% but lower than 20% (robust growth)
Higher than 20% (fast growth)
Questions Q) What has been the average annual export growth rate of client firms (over the three years following the support)?
• %
Comments Average annual export growth rate of client firms
Lower than -2% (negative growth)
Higher than -2% but lower than 2% (negligible growth)
Higher than 2% but lower than 10% (moderate growth)
Higher than 10% but lower than 20% (robust growth)
Higher than 20% (fast growth)
Questions Q) What has been the average annual employment growth rate of client firms (over the three years following the support)?
• %
Comments
Additional questions not leading to scores
Rationale and objectives
Q) Does the high-growth programme aim to tackle any specific market failures? If so, which ones? And in which way? (open answer)
•
Q) Does the high-growth programme aim to tackle any specific system lock-ins? If so, which ones? And in which way? (open answer)
•
Q) Does the high-growth programme aim to generate positive externalities? If so, in which way? (open answer)
•
Q) What are the stated objectives of the high-growth programme? (open answer) •

231
Context of the high-growth programme
Q) Is the high-growth programme integrated into a wider entrepreneurship/SME strategy at national or regional level?
• Yes • No
Q) What is the annual budget of the high growth programme (pls. provide value in both national currency and US dollars)?
• USD
Q) What share of the overall national/regional entrepreneurship/SME policy does the high-growth programme represent in terms of budget?
• %
Q) How would you rank the importance of the high-growth programme in the context of the wider entrepreneurship/SME policy?
• A pilot initiative • A minor initiative • An important initiative • The most important initiative
Q) Does the high-growth programme specifically target lagging regions as against the most developed ones?116
• Yes • No
Client firms: outreach and annual budget
Q) How many firms are reached by the high-growth programme each year? • N.
Q) How many firms make up the total population of firms in the country (region, if the programme is a regional one)?
• N.
Q) Based on the figures above, what is the share of firms out of total business population reached by the programme? 117
• %
Q) If it is not possible to have access to the previous figures, could you alternatively give a rough estimate of the share? (pls. justify your answer in the cell dedicated to comments)
• %
116 The rationale is that, all else being equal, high-growth programmes may end favouring regions that are
already forging ahead as compared to lagging regions. 117 High-growth firms are a small share of the total business population, between 3-6% when growth is
measured by employment. It is therefore important that high-growth programs are focused and do not become general business support schemes.

232
Q) What is the annual budget of the programme in US dollars (and local currency) with regard to counselling, mentoring and training?
• USD
Q) Based on the figures above, what is the annual budget of the programme spent per client firm in US dollars? 118
• USD
Q) If it is not possible to have access to the previous figures, could you alternatively give a rough estimate of the annual budget of the programme spent per client firm in US dollars? (pls. justify your answer in the cell dedicated to comments)
• USD
Q) Does the high-growth programme only target new firms (less than 5 years)? • Yes • No
Q) What is the average age of the client firms of the programme? • N
Range of support services of the high-growth programme119
Q) What is (even approximately) the share of client firms of the programme that receive support for business internationalisation? 120
• %
Q) What are the most common forms of programme support (up to three) to business internationalisation? 1. 2. 3.
Q) What is (even approximately) the share of client firms of the programme that receive support for innovation services? 121
• %
Q) What are the most common forms of programme support (up to three) for innovation services? 1. 2. 3.
118 Only counselling, mentoring or training costs should be included. Direct financing, fiscal incentives (e.g.
tax breaks) and subsidised renting should NOT be included. Provide further details in the cell of comments on what this value expressly covers.
119 Services can be provided either directly by programme staff or indirectly through intermediary organisations such as business development service (BDS) providers, semi public organisations, etc.
120 Support to business internationalisation includes export credits, export promotion, cross-border alliances, foreign direct investment, etc.
121 Support to innovation services includes R&D advice, innovation consulting, technology incubators, science parks, innovation vouchers, and industry-university relations in general.

233
Q) What is (even approximately) the share of client firms of the programme that receive support in access to finance?
• %
Q) What are the most common forms of programme support (up to three) for access to finance? 122 1. 2. 3.
Q) What is (even approximately) the share of client firms of the programme that receive support to human capital development? 123
• %
Q) What are the most common forms of programme support (up to three) to human capital development? 1. 2. 3.
122 Access to finance includes the provision of direct grants, subsidised loans, credit guarantees, direct equity
investment, investment guarantees, investor clubs, etc. 123 Human capital development includes mainly training, but also continued professional development, non-
innovation consulting, subsidisation of hiring skilled workers, etc.

234
1 This is the program for which the richest information is available.
2 Using appropriations from section 209 of the Public Works and Economic Development Act of 1965, known as PWEDA (42 U.S.C. § 3149). Selected regions must satisfy EDA criteria for economic distress.
3 15 U.S.C. § 278k(f)
4 Authorised as part of the Energy Policy Act of 2005 (42 U.S.C. § 16191)
5 Authorised under Section 414(c) of the American Competitiveness and Workforce Improvement Act of 1998 (29 U.S.C. § 2916a)
6 Authorised under section 7(j) of the Small Business Act (15 U.S.C. § 638(j)(l)).

ORGANISATION FOR ECONOMIC CO-OPERATION AND DEVELOPMENT
The Organisation for Economic Co-operation and Development (OECD) is a unique forum where the governments
of 34 market democracies work together to address the economic, social and governance challenges of globalisation as
well as to exploit its opportunities. The OECD’s way of working consists of a highly effective process that begins with data collection and analysis and moves on to collective discussion of policy, then decision making and implementation. Mutual examination by governments, multi-lateral surveillance and peer pressure to conform or reform are at the heart of the OECD’s effectiveness.
Much of the material collected and analysed at the OECD is published on paper or online: from press releases and regular compilations of data and projections to one-off publications or monographs on particular issues; from economic surveys of each member country to regular reviews of education systems, science and technology policies or environmental performance. For more information on the OECD, please visit www.oecd.org/about.
LOCAL ECONOMIC AND EMPLOYMENT DEVELOPMENT (LEED)
The OECD Programme on Local Economic and Employment Development (LEED) has advised governments and communities since 1982 on how to respond to economic change and tackle complex problems in a fast-changing world. Its mission is to contribute to the creation of more and better quality jobs through more effective policy implementation, innovative practices, stronger capacities and integrated strategies at the local level. LEED draws on a comparative analysis of experience from the five continents in fostering economic growth, employment and
inclusion. For more information on the LEED Programme, please visit www.oecd.org/cfe/leed.
OECD PUBLISHING, 2, rue André-Pascal, 375775 PARIS CEDEX 16 (00 2013 09 1 P) –
No. 90161 2013