an intersection test for the cointegrating rank in
TRANSCRIPT

An intersection test for the cointegrating rank in dependent panel dataArsova, Antonia; Karaman Örsal, Deniz Dilan
Publication date:2016
Document VersionPublisher's PDF, also known as Version of record
Link to publication
Citation for pulished version (APA):Arsova, A., & Karaman Örsal, D. D. (2016). An intersection test for the cointegrating rank in dependent paneldata. (Working Paper Series in Economics ; No. 357). Institut für Volkswirtschaftslehre der Universität Lüneburg.
General rightsCopyright and moral rights for the publications made accessible in the public portal are retained by the authors and/or other copyright ownersand it is a condition of accessing publications that users recognise and abide by the legal requirements associated with these rights.
• Users may download and print one copy of any publication from the public portal for the purpose of private study or research. • You may not further distribute the material or use it for any profit-making activity or commercial gain • You may freely distribute the URL identifying the publication in the public portal ?
Take down policyIf you believe that this document breaches copyright please contact us providing details, and we will remove access to the work immediatelyand investigate your claim.
Download date: 02. Feb. 2022

WO
RK
ING
PA
PE
R
An intersection test for the cointegrating rank
in dependent panel data
University of Lüneburg Working Paper Series in Economics
No. 357
March 2016
www.leuphana.de/institute/ivwl/publikationen/working-papers.html
ISSN 1860 - 5508
by
Antonia Arsova and Deniz Dilan Karaman Örsal

An intersection test for the cointegrating rank
in dependent panel data
Antonia Arsova† , Deniz Dilan Karaman Orsal†,‡
†Corresponding author.Center for Methods, Leuphana Universitat Luneburg
Scharnhorststr. 1, 21335 Luneburg, Germany(e-mail: [email protected])
‡Center for Methods and Institute of Economics,Leuphana Universitat Luneburg
(e-mail: [email protected])
Abstract
This paper takes a multiple testing perspective on the problem ofdetermining the cointegrating rank in macroeconometric panel datawith cross-sectional dependence. The testing procedure for a commonrank among the panel units is based on Simes’ (1986) intersection testand requires only the p-values of suitable individual test statistics. AMonte Carlo study demonstrates that this simple test is robust to cross-sectional dependence and has reasonable size and power properties. Amultivariate version of Kendall’s tau is used to test an important as-sumption underlying Simes’ procedure for dependent statistics. Themethod is illustrated by testing the validity of the monetary exchangerate model for 8 OECD countries in the post-Bretton Woods era.
Keywords: panel cointegration rank test, cross-sectional dependence, multipletesting, common factors, likelihood-ratioJEL classification: C12, C15, C33
∗Financial support by the German Research Foundation (DFG) through the project KA-3145/1-1 is gratefully acknowledged. The data for the empirical analysis was in part collectedduring a research stay of the second author at the Humboldt Universitat in Berlin. The firstauthor would also like to thank Plamen Trayanov for helpful discussions.
1

1 Introduction
Testing for unit roots and cointegration is an essential pre-modelling stepin the analysis of Vector Autoregressive (VAR) models, which have become aprimary tool for empirical macroeconometric analyses. Cointegration describesthe existence of a long-run linear relationship between two or more integratedtime series, which is integrated of a lower order than the series themselves. Inmost applications the series are integrated of order one (i.e. I(1), or unit-rootnonstationary), while their cointegrating relation is stationary (i.e. I(0)). Thenumber of linearly independent cointegrating relations between multiple timeseries is called a cointegrating rank.
Panel unit root and cointegration tests have been developed to improve thepower of tests based on individual time series when extension of the data inthe time dimension is not possible. The increased information set, however,comes at a price. One of the major difficulties inherent in panel data is thepresence of dependence between the cross-sectional units, as it may distort theperformance of the so called “first-generation” panel cointegration tests whichrely on the assumption of independence. 1
The common factor framework has grown increasingly popular in describingthe co-movements of macroeconomic time series, and has therefore becomewidely adopted as a tool to model the cross-sectional dependence in second-generation panel unit-root and cointegration tests. In testing for cointegrationit has been employed by Gengenbach et al. (2006), Westerlund and Edgerton(2008), Westerlund (2008), Carrion-i Silvestre and Surdeanu (2011), Bai andCarrion-i Silvestre (2013), Arsova and Orsal (2017) and Banerjee and Carrion-iSilvestre (2015) to name but a few. The only two studies on panel rank testingamong them (Carrion-i Silvestre and Surdeanu, 2011 and Arsova and Orsal,2017), however, focus on the unobserved idiosyncratic components of the data,and their tests can thus yield information on the rank of the observed variablesonly when the common factors are I(0).
In the present work we avoid the latter issue and propose a simple paneltest for the common cointegrating rank of the observed variables, which are ofprimary interest in empirical work. The test is easy to implement, not requir-ing estimation of unobserved components or resampling schemes. It belongs tothe class of meta-type tests based on p-values and hence allows for more flexi-bility (e.g. heterogeneous lag orders and/or different deterministic terms overcross-sections) than tests based on pooled statistics. The test builds on the im-proved Bonferroni procedure for combining significance levels of independentindividual tests developed by Simes (1986). The independence assumption hasbeen relaxed by Sarkar (1998), who proves the Simes’ conjecture for statis-tics whose joint distribution is multivariate totally positive of order 2 (MTP2).Simes’ procedure has recently been applied to panel unit root testing by Hanck
1Theoretical implications of factor-driven dependence for first-generation tests are dis-cussed in Gengenbach et al. (2006); Wagner and Hlouskova (2010) provide simulation evi-dence of size distortions for several first-generation panel cointegration tests under differentdependence structures.
2

(2013). He demonstrates by simulation its applicability to panels with vari-ous types of cross-sectional dependence without a formal proof of whether theMTP2 condition holds. We go a step further and provide a measure and nu-merical evidence of the suitability of the MTP2 assumption in panels wherethe cross-sectional dependence is driven by common factors. In a Monte Carlostudy we show that the proposed panel cointegration rank test has reasonablesize and power properties in dependent panels of sizes typically encounteredin practice.
The paper is organised as follows. Section 2 presents the panel testingprocedure, whose finite sample properties are examined by Monte Carlo sim-ulations in Section 3. Section 4 applies it to test the validity of the monetaryexchange rate model for eight OECD countries, and Section 5 concludes.
2 The intersection-type panel cointegration rank
test
Simes’ procedure can be applied to any test from which p-values are avail-able. In view of our empirical application, below we describe it in a panelsetting employing a likelihood-ratio (LR) cointegration rank test for a systemwith a linear time trend. Two such tests are the well-known Johansen’s (1995)(henceforth J) LR trace test and its GLS detrended counterpart proposed bySaikkonen and Lutkepohl (2000) (henceforth SL). The test statistic for thelatter is computed as Johansen’s LR trace statistic, but from trend-adjustedobservations obtained by subtracting GLS estimates of the deterministic termsfrom the observed data. Saikkonen and Lutkepohl (2000) demonstrate byMonte Carlo simulations that in some situations their test has better finite-sample properties than Johansen’s test. It is worth noting that both tests areimplemented in the free software JMulTi, which makes the LR J and SL tracestatistics and their p-values easily obtainable in practice.
In the panel setting, assume that there exist N cross-sectional units, withthe observed variables in each one following an m-variate VAR(si) processYit = (Y1i,t, . . . , Ymi,t)
′. It is further assumed that Yit ∼ I(1) and it has at mosta linear time trend:
Yit = µ0i + µ1it+Xit, t = 1, . . . , T ; i = 1, . . . N, (1)
Xit = Ai1Xi,t−1 + . . .+ Ai,siXi,t−si + uit. (2)
The error terms uit form a martingale difference sequence such that E(uit|uis, s <t) = 0 and E(uitu
′it|uis, s < t) = Ωi, ∀i = 1, . . . , N . The deterministic terms
µ0i, µ1i, the coefficient matrices Aij (j = 1, . . . , si), the covariance matrices Ωi
and the lag orders si are assumed to be heterogeneous across units. LettingΠi = − (Im − Ai1 − . . .− Ai,si), the null and alternative hypotheses are:
H0 : rk(Πi) = r0, ∀i = 1, . . . , N, (3)
H1 : rk(Πi) > r0 for at least one i = 1, . . . , N.
3

In general, the LR trace statistic for unit i is computed as
LRi(r0) = −Tm∑
j=r0+1
ln(1− λi,j), (4)
where λi,1 ≥ . . . ≥ λi,m are the ordered solutions to the generalized eigenvalueproblem
∣
∣λSi,11 − Si,10S−1i,00Si,01
∣
∣ = 0. The matrices Si,kl for k, l = 0, 1 are
defined as Si,kl = 1T
∑Tt=1Ri,ktR
′i,lt, where Ri,0t and Ri,1t are the vectors of
residuals from regressing the first-differenced and lagged processes ∆Yit andYi,t−1, respectively, on the deterministic terms and the lagged first differencesof Yit.
2
Ordering the p-values of the individual LR test statistics as p(1) ≤ . . . ≤p(N), the joint null hypothesis in (3) is rejected by Simes’ test at significancelevel α if
p(i) ≤iα
Nfor any i = 1, . . . , N. (5)
Simes’ test can be applied for evaluating the joint significance of the teststatistics at each step of the sequential rank testing procedure, i.e. for r0 =0, . . . ,m− 1.
Simes shows that the test is conservative under independence of the indi-vidual test statistics, that is
PH0
p(i) ≥iα
N, i = 1, . . . , N
≥ 1− α. (6)
In practice, however, we would expect the cointegration test statistics toexhibit positive dependence. This would be the case when the processes in theindividual units are influenced by unobserved common factors, for example.The common shocks would generate more or less similar dynamics of the Yit’sacross units, which, in turn, would induce positive dependence among theindividual cointegration statistics.
A general class of multivariate distribution functions, which are positivelydependent, is defined by the MTP2 condition. For convenience we next givethe definition of MTP2 as it appears in Sarkar (1998).
Definition 2.1. An N-dimensional random vector X = (X1, . . . , XN)′ is said
to have an MTP2 (TP2 when N = 2) distribution if the corresponding proba-bility density, f(x), satisfies the following condition:
f(x ∨ y)f(x ∧ y) ≥ f(x)f(y) for all x,y ∈ RN , (7)
where, with x = (x1, . . . , xN)′ and y = (y1, . . . , yN)
′,x∨y = (max(x1, y1), . . . ,max(xN , yN))
′ and x∧y = (min(x1, y1), . . . ,min(xN , yN))′.
2For more details on the computation of the J and SL trace test statistics we refer toJohansen (1995) and Saikkonen and Lutkepohl (2000).
4

Sarkar (1998) proves Simes’ conjecture (6) for MTP2 distributions withcommon marginals. However, whether the joint distribution function F (x1, . . . , xN)of the individual LR trace statistics satisfies the MTP2 property is difficultto establish analytically. The challenge is the unknown functional form ofF (x1, . . . , xN). The individual LR trace statistics of the J and SL tests arecomplex non-linear functions of the observations Yit and have non-standarddistributions. It has been established by Doornik (1998) and Trenkler (2008)that the limiting (as T → ∞) distributions of these statistics, i.e. the univari-ate marginal distributions Fi(xi) = P (LRi(r0) ≤ xi), i = 1, . . . , N , are wellapproximated by gamma distributions. As the parameters of the gamma distri-butions are functions only of the dimension of the systemm and the cointegrat-ing rank under the null hypothesis r0, under the null hypothesis of a commoncointegrating rank (3) the marginal distribution functions Fi(·) would be thesame for each i. For Simes’ conjecture to be valid, also the joint distributionfunction F (x1, . . . , xN) has to be MTP2. The form of F (x1, . . . , xN) dependson both the marginals Fi(xi) and the dependence structure among them, whichthen is carried by the copula C: F (x1, . . . , xN) = C F1(x1), . . . , FN(xN).
Various families of copulas have been proposed in the literature. Para-metric ones often use only one or two parameters to describe the dependencestructure, which may not be enough to capture the heterogeneity in the depen-dencies between the individual LR cointegration statistics. Also, in practicethe true copula of the individual test statistics would be unknown, hence as-suming a particular functional form for which to analytically establish theMTP2 condition seems quite restrictive.3
To circumvent this problem we propose to empirically measure the suit-ability of the MTP2 assumption for the vector of LR (trace) statistics L =(LR1(r0), . . . ,LRN(r0))
′ in the practically relevant case when the cross-sectionaldependence is modelled by common factors. This is achieved by a multivariateversion of Kendall’s tau, defined in Nelsen (1996) as
τN =1
2N−1 − 1
2N
∫
[0,1]N
C(u)dC(u)− 1
, (8)
where C(u) denotes the copula of the random vector L, and [0, 1]N is theN -dimensional unit interval.
Nelsen (1996) shows that this measure of concordance, initially proposedby Joe (1990), is also a measure of average multivariate total positivity of ordertwo. In particular, he argues that
f(x ∨ y)f(x ∧ y)− f(x)f(y), x,y ∈ RN , (9)
3Even factor copula models, newly developed by e.g. Krupskii and Joe (2013) and Ohand Patton (2015), may not be suitable as they either assume specific parametric copulas, orlack closed-form density in general. These models further assume linear relationship betweenthe random variables of interest and the common factors, which may or may not be true forthe elements of L = (LR1(r0), . . . , LRN (r0)). The latter is impossible to verify in practicedue to the single available observation on L, in contrast to the assumption of multifactorerror structure for the process innovations uit.
5

measures “local” MTP2 for a distribution with density f . Denoting its averageby
TN =
∫
R2
∫
R2
[f(x ∨ y)f(x ∧ y)− f(x)f(y)] dx1dx2 . . . dxNdy1dy2 . . . dyN , (10)
he shows that τN , defined by (8), is a scaled version of TN , bounded between− 1
2N−1and 1. τN takes value 0 when the components of the random vector L are
independent and achieves its upper bound under perfect positive dependence.A non-negative value of τN can thus be interpreted as an indicator that, onaverage,
f(x ∨ y)f(x ∧ y)− f(x)f(y) ≥ 0 for x,y ∈ RN , (11)
i.e. that the joint distribution of L satisfies the MTP2 condition.Although the true copula of L will be unknown in practice, if a sample of
n independent observations on L were available, then an estimator τN basedon the empirical copula Cn(u) could be computed. The empirical copula hasbeen introduced by Deheuvels (1979) and is given by the empirical distributionfunction of the sample of rank-transformed data:
Cn(u1, . . . , un) :=1
n
n∑
j=1
N∏
i=1
1
(
Uij,n ≤ ui
)
, (12)
where 1(.) denotes the indicator function, u = (u1, . . . , uN) ∈ [0, 1]N and thepseudo-observations Uij,n are estimated as
Uij,n =1
n+ 1(rank of LRij(r0) in LRi1(r0), . . . , LRin(r0)) . (13)
Using the expression for Cn(u) in (12), τN can be estimated as
τN =1
2N−1 − 1
2N
n2
n∑
j=1
n∑
k=1k 6=j
N∏
i=1
1
(
Uij,n ≤ Uik,n
)
− 1
. (14)
Genest et al. (2011) show that τN is asymptotically normally distributedaround its true value τN and provide an expression for its finite-sample varianceσ2τN:
σ2τN
=
(
2N−1
2N−1 − 1
)22
n(n− 1)
[
2(n− 2)(Q− P 2) + P (1− P )]
(15)
with
P = 2
∫
[0,1]N
C(u)dC(u), (16)
Q =
∫
[0,1]N
[
C(u) + C(u)]2dC(u), (17)
6

where C(u) denotes the survival function of a random vector U with distribu-tion C(u). The estimators of P and Q in terms of the empirical copula can becomputed as
P =2
n(n− 1)
n∑
j=1
n∑
k=1k 6=j
N∏
i=1
1
(
Uij,n ≤ Uik,n
)
, (18)
Q =1
n2(n− 2)
n∑
j=1
n∑
k=1
n∑
l=1l 6=j,k
N∏
i=1
1
(
Uij,n ≤ Uil,n, Uik,n ≤ Uil,n
)
(19)
+ 2n
∑
j=1
n∑
k=1
n∑
l=1l 6=j,k
N∏
i=1
1
(
Uij,n ≤ Uil,n, Uik,n > Uil,n
)
+n
∑
j=1
n∑
k=1
n∑
l=1l 6=j,k
N∏
i=1
1
(
Uij,n > Uil,n, Uik,n > Uil,n
)
.
These expressions enable us to evaluate the significance of the estimatedτN by means of the t-statistic tτN = τN/στN .
In practice only a single observation on the vector L would be available,so computing τN would not be feasible. Our aim, however, is rather to illus-trate how common factors, despite heterogeneous and possibly negative factorloadings across cross-sections, induce non-negative dependence between the in-dividual statistics as measured by τN . This would show that the multivariatedistribution of L fulfils the MTP2 condition, thus rendering the Simes’ proce-dure valid for combining the individual cointegration rank tests in the panelsetting. We therefore resort to simulation methods to generate samples of in-dependent observations over L in different settings, from which we computeτN and tτN ; details are provided in Section 3 below. When cross-sectional de-pendence between the panel units is present we expect to have a significantlypositive tτN which would rejectH0 : τN ≤ 0, while in the absence of dependencewe rather expect to get τN insignificantly different from 0.
3 Simulation study
We first examine the finite-sample properties of the Simes’ procedure em-ploying the J and SL LR trace tests (henceforth Simes-J and Simes-SL, respec-tively), and then present results for the tτN statistics backing up the MTP2
assumption.With our empirical application to the monetary exchange rate model in
mind, where common factors are present in the observed relative variables byconstruction, we introduce cross-sectional dependence in the panels by lettingmultiple common factors affect the innovations to the data generating process.
7

Preliminary simulations with other correlation structures, e.g. constant pos-itive correlation or spatial-type correlation between the innovations, reveal avery similar picture and are not reported for brevity.
We employ a 3-variate VAR(1) Toda-type process (Toda, 1994, 1995)Yit = µ0i + µ1it+Xit with k = 2 common factors in the errors:
Xit =
ψa,i 0 00 ψb,i 00 0 1
Xi,t−1 + uit, (20)
uit = λift + εit, (21)
where ft ∼ i.i.d.N (0, I2), εit ∼ i.i.d.N (0,Ωi) and Ωi =
0.47 0.20 0.180.20 0.32 0.270.18 0.27 0.30
.
The Toda process is frequently used in the literature for investigating theproperties of LR cointegration rank tests as it provides an easy way to controlthe parameters governing the unit-root behaviour of the process (ψi). Althoughit itself is not cointegrated in the classical sense4, it is suitable for the task dueto the invariance of the LR trace statistics to linear transformations of the typeZit = HXit for a full-rank matrix H. The size of the panel tests is investigatedwhen the true rank is r = 0 with ψa,i = ψb,i = 1 for all units, while poweragainst H0 : r = 0 is examined when the true rank is r = 1 with ψa,i ∼i.i.d. U [0.7, 1) and ψb,i = 1, and against H0 : r = 1 when r = 2 with ψa,i ∼i.i.d. U [0.7, 1) and ψb,i = 0.5. The factor loadings λi are simulated as (m× k)matrices with (a) i.i.d. U [−0.4, 0.4], (b) i.i.d. U [0, 1], or (c) i.i.d. U [−1, 3]entries for every cross-section; for cross-sectional independence we set λi =0, ∀i.
Throughout we set µ0i = µ1i = (0.2, 0.2, 0.2)′, ∀i; we allow for a linear trendboth in the variables and in the cointegrating relations when computing theindividual LR trace test statistics. The processes Xit are initialised with 0 andthe first 30 observations are discarded to mitigate the effect of initial values.The p-values for the J and SL LR trace statistics are obtained by approximatingtheir limiting distributions by gamma distributions as in Doornik (1998) andin Trenkler (2008), respectively. We consider all combinations of T − 1 ∈50, 100, 150, 200 and N ∈ 5, 10, 20. The simulations are carried out inGAUSS and the number of replications is 5000.
Table 1 presents the empirical size of the Simes-SL and Simes-J tests inthe cases with cross-sectional dependence (a) – (c) and in the independencecase. Although both panel tests appear slightly oversized for T = 50, wenote that this is a consequence of the individual SL and J LR trace testsbeing size distorted for small T and relatively large systems, and that no sizedistortions arise due to cross-sectional dependence alone. The size results forthe dependence cases are very similar across each other and match those for
4An m-dimensional process Xit is cointegrated as CI(d, b) if all its elements are I(d),and there exists at least one linear combination of them β′Xit which is I(d−b), b > 0 (Engleand Granger, 1987).
8

the cross-sectionally independent case. Overall, Simes-SL has slightly bettersize properties than Simes-J. In terms of power against H0 : r = 0 when r = 15
(Table 2) both the Simes-SL and Simes-J tests exhibit substantial increase inpower as N grows; both tests perform equally well for T ≥ 150. The Simes-SLtest outperforms the Simes-J test for T = 100 when no or only weak cross-sectional dependence (as in case (a)) is present; otherwise, for small T (T = 50)the Simes-J test performs better, perhaps due to its greater size. The increasedpower in the cross-sectional dependence cases compared to the independencecase may be attributed to the stronger covariances in E(uiu
′i) = Ωi + λiλ
′i,
which are exploited by both LR tests.We now turn to assessing the appropriateness of the MTP2 assumption for
the joint distribution of the individual LR trace statistics. Table 3 reports esti-mated τN and their corresponding t-statistics for the simulated N -dimensionalvectors LJ and LSL of individual SL and J statistics, respectively, used withinthe Simes’ procedure for T − 1 ∈ 100, 200, N ∈ 5, 10, 20 and n = 1000replications under H0 : r = 0, ∀i.6 Results with T − 1 ∈ 50, 150 are qualita-tively the same and available upon request.
As may be expected, greater (in absolute value) factor loadings inducea greater degree of positive dependence between the individual statistics, asmeasured by the estimated values τN , which are highest for cases with cross-sectional dependence (c) and closest to zero for the case of no dependence. Thedecreasing values of τN overN for fixed T can be explained by its interpretationas a scaled probability of concordance (Nelsen, 1996) – the probability that theelements of an N -vector are all small or all large simultaneously diminishes asN grows. In the cases with cross-sectional dependence τN is in general positiveand the t-statistic – highly significant, while τN is insignificantly different from0 in most cases where there is no cross-sectional dependence.
An illustration of this point is provided by Figures 1 and 2. Figure 1presents the estimates of τN under H0 : r = 0 for a DGP with constantcorrelation ρε between the panel units. This process is a modification of theDGP (20), such that uit ≡ εit. The (Nm × 1) vector of innovations εt =(ε′1t, . . . , ε
′Nt)
′ is simulated as εt ∼ i.i.d.N(0,Σ) with Σ = ρεI ⊗ Ωi, ∀t, where⊗ denotes the Kronecker product. We note that ρε ≥ − 1
N−1in order for Σ
to be positive definite. In Figure 1 τN remains non-negative even for negativevalues of ρε. The same observation holds for the graphs in Figure 2, whichpresent the estimated τN for DGP (20) with multifactor error structure andvarious factor loadings under H0 : r = r0 for r0 = 0, 1, 2. Hence the non-negative average MTP2-dependence between the individual LR test statistics
5Results for power against H0 : r = 1 when r = 2 are similar and not reported forbrevity. They are available upon request.
6It turns out that n = 1000 replications are enough for a good approximation of theempirical distribution function of the vectors LJ and LSL in order to illustrate our point. Werefrain from using a higher number of replications to avoid precision issues in the computationof σ2
τNin the cross-sectional independence case. Results with n ∈ 100, 200, 500 reveal a
similar picture, with estimates of τN of the same magnitude, but with t-statistics generallysmaller in absolute value due to the larger estimated variance. These results are availableupon request.
9

is present regardless of the null hypothesis under investigation.In order to evaluate how well στN , computed in terms of P and Q (eqs.
(18) and (19)), approximates the true variance of τN , we have computed thet-statistics for the cross-sectionally independent case using the expression forστN in the special case of the independence copula derived by Genest et al.(2011, p. 164):
σ2,indτN
=n(
22N+1 + 2N+1 − 4× 3N)
+ 3N(
2N + 6)
− 2N+2(
2N + 1)
3N (2N−1 − 1)2 n(n− 1). (22)
As the lowest panel of Table 3 shows, the t-statistics computed with σindτN
arequite similar to those computed with στN , despite some discrepancies when τNis negative, which increase with the absolute value of τN .
To summarise, these findings corroborate our conjecture that the MTP2
condition is met for the multivariate distribution of the individual LR tracestatistics when the variables in the panel are influenced by unobserved commonfactors.
4 The monetary exchange rate model
In this section we apply the Simes-SL and the Simes-J tests to assess thevalidity of the monetary exchange rate model in the post-Bretton Woods era.The model postulates a stationary long-term relationship between nominal ex-change rate and monetary fundamentals, assuming that the purchasing powerparity and the uncovered interest rate parity hold. The empirical evidencewhether the monetary exchange rate model holds in practice is rather mixed.For example, Rapach and Wohar (2002) find only limited support for the modelon a country-by-country basis for 14 industrialized countries, while using panelerror-correction-based techniques Dabrowski et al. (2014) report evidence ofcointegration in a recent panel of 8 central and eastern European countries.
In our study we follow Dabrowski et al. (2014) and define the testableequation of the model as
sit = dit + βi1(mit −m∗it) + βi2(yit − y∗t ) + βi3
[
(pit − pTit)− (p∗t − pT∗t )
]
+ uit,(23)
where sit is nominal exchange rate between country i and the numeraire coun-try, mit is nominal money supply, yit is real output, pit and pTit are domesticgeneral and tradable goods price levels respectively, and dit is a country-specificdeterministic term. The asterisk symbol denotes the corresponding quanti-ties for the numeraire country, which in our study is the USA. All variablesare taken in natural logarithms. The price level of non-tradables for countryi, approximated by (pit − pTit), is included in the model to mitigate possibleBalassa-Samuelson effects.
We employ monthly data in the period 1995/01− 2007/12 (T = 156) for 8OECD countries: Canada, Denmark, Japan, Korea, Norway, Sweden, Switzer-land and the UK; a brief description of the data is given in Table 4. As monthly
10
GDP figures are unavailable, national income yit has been approximated bythe industrial production index (IPI). Unlike other studies, we refrain fromincluding Eurozone countries in our analysis due to their adoption of a com-mon currency in 1999 or later. The sample window is restricted by the dataavailability in order to obtain a balanced panel: the IPI series for Switzerlandstart in 1995/01 and end in 2007/12, along with the producer price index seriesfor Norway.
Before testing for cointegration, all four relative variables in (23) are testedfor nonstationarity in levels and in first differences using panel unit root tests.We employ Pesaran’s (2007) simple panel unit root test and Breitung andDas’ (2005) panel unit root test, both of which are robust to cross-sectionaldependence.7 With only two exceptions for relative output, which is ratherclassified as trend-stationary when a small lag order (2 or less) is chosen,8 andfor exchange rate at lags 2 and 3 according to Pesaran’s (2007) test, there ispredominant evidence in favour of the unit root null hypothesis. Therefore weproceed with the cointegration analysis assuming that the relative variablesare I(1).
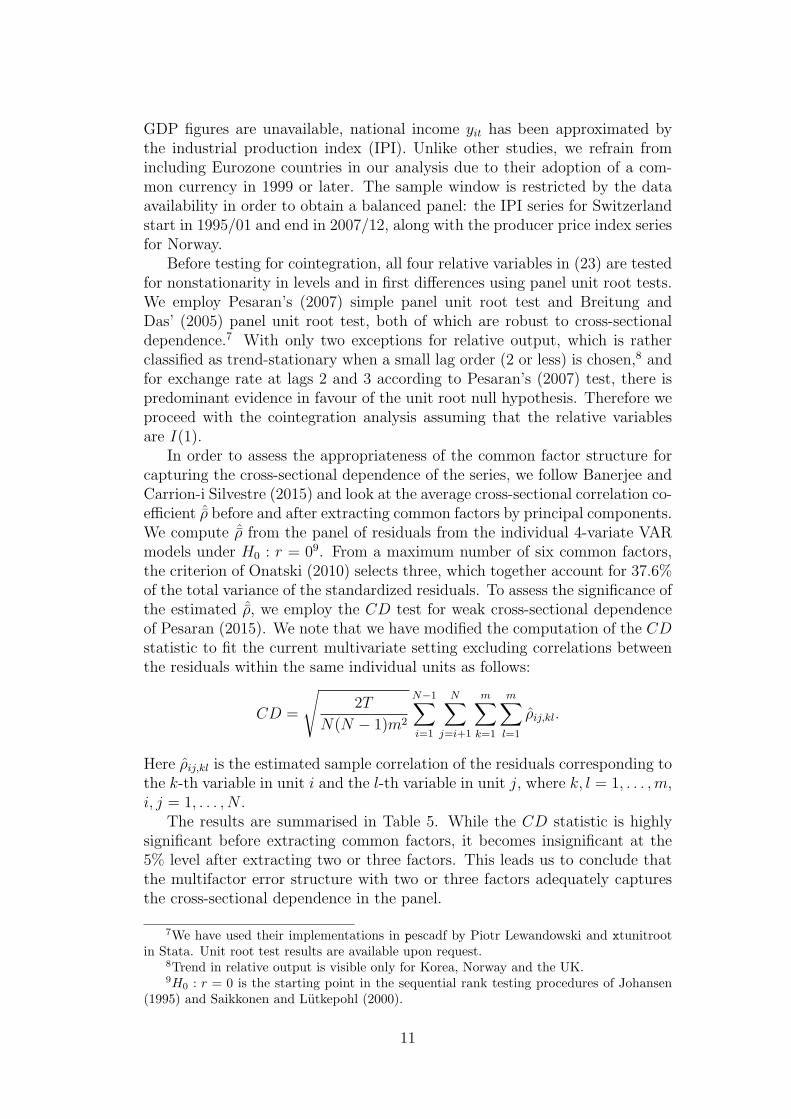
In order to assess the appropriateness of the common factor structure forcapturing the cross-sectional dependence of the series, we follow Banerjee andCarrion-i Silvestre (2015) and look at the average cross-sectional correlation co-efficient ˆρ before and after extracting common factors by principal components.We compute ˆρ from the panel of residuals from the individual 4-variate VARmodels under H0 : r = 09. From a maximum number of six common factors,the criterion of Onatski (2010) selects three, which together account for 37.6%of the total variance of the standardized residuals. To assess the significance ofthe estimated ˆρ, we employ the CD test for weak cross-sectional dependenceof Pesaran (2015). We note that we have modified the computation of the CDstatistic to fit the current multivariate setting excluding correlations betweenthe residuals within the same individual units as follows:
CD =
√
2T
N(N − 1)m2
N−1∑
i=1
N∑
j=i+1
m∑
k=1
m∑
l=1
ρij,kl.
Here ρij,kl is the estimated sample correlation of the residuals corresponding tothe k-th variable in unit i and the l-th variable in unit j, where k, l = 1, . . . ,m,i, j = 1, . . . , N .
The results are summarised in Table 5. While the CD statistic is highlysignificant before extracting common factors, it becomes insignificant at the5% level after extracting two or three factors. This leads us to conclude thatthe multifactor error structure with two or three factors adequately capturesthe cross-sectional dependence in the panel.
7We have used their implementations in pescadf by Piotr Lewandowski and xtunitrootin Stata. Unit root test results are available upon request.
8Trend in relative output is visible only for Korea, Norway and the UK.9H0 : r = 0 is the starting point in the sequential rank testing procedures of Johansen
(1995) and Saikkonen and Lutkepohl (2000).
11

Finally, Table 6 presents the results of the Simes-SL and Simes-J tests.Both reject H0 : r = 0 at the 5% level (that is, at least one p-value satisfiescondition (5)), but neither rejects H0 : r = 1 (when the corresponding p-valueswould be in ascending order). Hence both tests point to the existence of asingle cointegrating relationship between the nominal exchange rate and themacroeconomic fundamentals at the panel level.
5 Conclusion
In this paper we employ Simes’ (1986) p-values intersection procedure topropose a new and computationally simple likelihood-based panel cointegrationrank test. A crucial assumption for the validity of the intersection test when theindividual test statistics are dependent is that their multivariate distributionshould be multivariate totally positive of order 2.
Following Nelsen (1996), we adopt a multivariate version of Kendall’s tau(τN) as a measure for the suitability of the MTP2 assumption. EstimatingτN by means of the empirical copula, in our Monte Carlo study we show thatthe MTP2 condition is met in panels where the dependence is driven by unob-served common factors – an assumption which is commonly made in appliedwork. The simulation study as well demonstrates that the new panel ranktesting procedure is robust to cross-sectional dependence and exhibits goodsize and power in finite samples. These properties, along with its simple com-putation, make the intersection panel cointegration rank test an attractive toolfor empirical analysis.
As an application, we employ the intersection test to explore the validity ofthe monetary exchange rate model for eight OECD countries. Implementationsof the test with both Johansen’s (1995) and Saikkonen and Lutkepohl’s (2000)individual LR trace tests point to the existence of a single cointegrating rela-tionship between the nominal exchange rate and macroeconomic fundamentalsat the panel level.
12

Table 1: Empirical size of Simes-SL and Simes-J LR tracetests, true rank r = 0, ∀i = 1, . . . , N
Simes-SL test Simes-J test
T\N 1 5 10 20 1 5 10 20
Cross-sectional dependence (a): λi ∼ i.i.d. U [−0.4, 0.4]
50 0.056 0.066 0.074 0.078 0.070 0.079 0.090 0.104
100 0.054 0.062 0.061 0.071 0.062 0.066 0.067 0.073
150 0.062 0.066 0.059 0.068 0.058 0.064 0.064 0.066
200 0.053 0.057 0.066 0.069 0.060 0.055 0.063 0.070
Cross-sectional dependence (b): λi ∼ i.i.d. U [0, 1]
50 0.056 0.072 0.073 0.079 0.068 0.081 0.091 0.095
100 0.055 0.063 0.063 0.074 0.066 0.066 0.070 0.072
150 0.051 0.058 0.064 0.068 0.055 0.062 0.069 0.072
200 0.055 0.053 0.063 0.068 0.060 0.060 0.061 0.068
Cross-sectional dependence (c): λi ∼ i.i.d. U [−1, 3]
50 0.060 0.067 0.068 0.062 0.070 0.076 0.074 0.084
100 0.058 0.061 0.056 0.065 0.063 0.064 0.065 0.066
150 0.054 0.061 0.059 0.059 0.057 0.056 0.059 0.058
200 0.056 0.054 0.057 0.063 0.059 0.059 0.060 0.054
Cross-sectional independence
50 0.056 0.070 0.074 0.082 0.072 0.087 0.095 0.106
100 0.057 0.061 0.067 0.065 0.062 0.067 0.071 0.077
150 0.056 0.061 0.069 0.070 0.060 0.062 0.069 0.072
200 0.056 0.055 0.061 0.068 0.053 0.065 0.071 0.067
Notes: Rejection frequencies at 5% significance level.
Table 2: Empirical power of Simes-SL and Simes-J LR tracetests against H0 : r = 0, true rank r = 1, ∀i
Simes-SL test Simes-J test
T\N 1 5 10 20 1 5 10 20
Cross-sectional dependence (a): λi ∼ i.i.d. U [−0.4, 0.4]
50 0.109 0.156 0.178 0.211 0.110 0.168 0.183 0.220
100 0.273 0.475 0.591 0.713 0.262 0.455 0.560 0.679
150 0.437 0.787 0.924 0.983 0.436 0.783 0.910 0.980
200 0.554 0.926 0.990 1.000 0.562 0.934 0.992 1.000
Cross-sectional dependence (b): λi ∼ i.i.d. U [0, 1]
50 0.204 0.361 0.461 0.568 0.216 0.393 0.494 0.601
100 0.452 0.820 0.930 0.977 0.468 0.850 0.952 0.991
150 0.604 0.956 0.993 1.000 0.623 0.965 0.998 1.000
200 0.711 0.987 1.000 1.000 0.728 0.992 1.000 1.000
Cross-sectional dependence (c): λi ∼ i.i.d. U [−1, 3]
50 0.369 0.739 0.882 0.958 0.418 0.817 0.938 0.991
100 0.597 0.960 0.995 0.999 0.622 0.972 0.999 1.000
150 0.715 0.992 1.000 1.000 0.738 0.994 1.000 1.000
200 0.786 0.996 1.000 1.000 0.801 0.999 1.000 1.000
Cross-sectional independence
50 0.111 0.153 0.181 0.201 0.121 0.169 0.196 0.231
100 0.269 0.473 0.596 0.725 0.252 0.453 0.547 0.667
150 0.434 0.798 0.926 0.985 0.443 0.791 0.920 0.982
200 0.552 0.930 0.991 0.999 0.564 0.940 0.992 1.000
Notes: Rejection frequencies at 5% significance level.
13

Table 3: Empirical estimates of τN for the Simes-SLand Simes-J tests under H0 : r = 0, true rank r = 0,∀i
Simes-SL test Simes-J test
T\N 5 10 20 5 10 20
Cross-sectional dependence (a): λi ∼ i.i.d. U [−0.4, 0.4]
1000.015 0.001 0.000 0.019 0.004 0.000
(2.66) (2.41) (1.03) (3.49) (4.44) (1.93)
2000.013 0.001 0.000 0.028 0.002 0.000
(2.33) (2.62) (0.72) (4.61) (2.93) (2.17)
Cross-sectional dependence (b): λi ∼ i.i.d. U [0, 1]
1000.036 0.007 0.000 0.049 0.016 0.001
(5.66) (5.39) (2.81) (7.43) (7.14) (4.04)
2000.027 0.005 0.000 0.053 0.009 0.001
(4.51) (5.10) (3.20) (7.37) (6.25) (3.22)
Cross-sectional dependence (c): λi ∼ i.i.d. U [−1, 3]
1000.107 0.048 0.009 0.143 0.072 0.020
(12.30) (9.76) (6.62) (14.6) (12.3) (7.76)
2000.135 0.039 0.010 0.162 0.068 0.021
(14.6) (10.8) (6.43) (15.8) (13.4) (7.68)
Cross-sectional independence
100
0.007 −0.001 0.000 0.002 0.000 0.000
(1.48) (−3.61) (−∞) (0.41) (0.24) (0.03)
[1.60] [−2.02] [−0.81] [0.43] [0.26] [0.03]
200−0.007 0.000 0.000 0.011 0.000 0.000
(−1.48) (−1.56) (0.03) (2.07) (−0.28) (0.03)
[−1.42] [−1.10] [0.03] [2.33] [−0.27] [0.03]
Notes: t-statistics computed as τ /στNshown in parentheses.
t-statistics computed as τ /σindτN
shown in square brackets.
Figure 1: Estimated τN for the vector of LR trace statis-tics for DGP with equal correlation between the inno-vations of the individual units ρε, T = 100, n = 1000replications under H0 : r = 0
−0.1
00.1
0.2
0.3
0.4
0.5
−0.9 −0.5 −0.1 0.3 0.7
ρε
τN
N = 2
Simes−SL test
95% confidence bands Simes−SL
Simes−J test
95% confidence bands Simes−J
−0.1
00.1
0.2
0.3
0.4
0.5
−0.2 0 0.2 0.4 0.6 0.8
ρε
τN
N = 5
Simes−SL test
95% confidence bands Simes−SL
Simes−J test
95% confidence bands Simes−J
−0.1
00.1
0.2
0.3
0.4
0.5
−0.1 0.1 0.3 0.5 0.7 0.9
ρε
τN
N = 10
Simes−SL test
95% confidence bands Simes−SL
Simes−J test
95% confidence bands Simes−J
Figure 2: Estimated τN for the vector of LR trace statis-tics for DGP (20) with multifactor error structure underthe true null hypothesis H0 : r = r0, T = 100, N = 10,n = 1000 with factor loadings λi ∼ i.i.d.U [−k, k]
00.0
50.1
0.1
50.2
1 2 3 4 5 6 7 8 9
k
τN
H0 : r = 0
Simes−SL test
95% confidence bands Simes−SL
Simes−J test
95% confidence bands Simes−J
00.0
50.1
0.1
50.2
1 2 3 4 5 6 7 8 9
k
τN
H0 : r = 1
Simes−SL test
95% confidence bands Simes−SL
Simes−J test
95% confidence bands Simes−J
00.0
50.1
0.1
50.2
1 2 3 4 5 6 7 8 9
k
τN
H0 : r = 2
Simes−SL test
95% confidence bands Simes−SL
Simes−J test
95% confidence bands Simes−J
14

Table 4: Data description
Variable Description Source
s Nominal exchange rate per 1 USD; end-of-period
IMF IFSy Industrial production indexp Consumer price indexpT Producer price index
m
M2 for Switzerland, UK and USOECD
M2+ for Canada, M1 for Denmark, M3 for SwedenM2 for Norway and Korea MacrobondMonetary base for Japan Bank of Japan
Table 5: Average cross-sectional correlation coefficient and Pesaran’s (2015) CD
statistic before and after extracting common factors from estimated residuals ofindividual VAR models under H0 : r = 0
kAvg. corr.coef. ˆρ
CDstatistic
% expl.variance
Cum. % expl.variance
Before extracting factors 0.066 17.17 – –
Afterextractingk factors
1 0.096 24.86 0.18 0.182 −0.001 −0.24 0.12 0.293 −0.001 −0.32 0.08 0.38
Notes: The CD statistic has a N(0, 1) distribution under the null hypothesis of weak cross-sectionaldependence.
Table 6: Simes-SL and Simes-J panel cointegration tests
Country pAICi
Det.terms
LRr=0 p-value LRr=1 p-valueSimes’
sign. level5 % 10%
Simes-SL test
Canada 2 trend 71.11 0.000∗∗ 28.88 0.045 0.006 0.013Switzerland 1 trend 57.04 0.002∗∗ 14.30 0.812 0.013 0.025Denmark 3 const 43.60 0.020∗ 15.82 0.400 0.019 0.038Korea 4 trend 47.57 0.029∗ 29.35 0.039 0.025 0.050Japan 2 trend 45.64 0.046∗ 20.24 0.376 0.031 0.063Norway 5 trend 42.09 0.104 17.01 0.619 0.038 0.075Sweden 3 const 35.16 0.148 16.63 0.342 0.044 0.088UK 2 trend 39.81 0.164 17.64 0.570 0.050 0.100
Simes-J test
Canada 2 trend 95.08 0.000∗∗ 44.73 0.031 0.006 0.013Switzerland 1 trend 85.68 0.000∗∗ 32.99 0.342 0.013 0.025Denmark 3 const 60.57 0.011∗∗ 24.71 0.423 0.019 0.038Korea 4 trend 68.97 0.016∗∗ 42.51 0.053 0.025 0.050Norway 5 trend 57.62 0.150 29.18 0.557 0.031 0.063Japan 2 trend 56.95 0.167 31.91 0.400 0.038 0.075UK 2 trend 55.91 0.195 33.91 0.297 0.044 0.088Sweden 3 const 42.87 0.339 22.21 0.585 0.050 0.100
Notes: ∗∗ and ∗ denote significance at the corresponding Simes’ 5% and 10% nominal levels,respectively.
15

References
Arsova, A., Orsal, D. D. K., 2017. Likelihood-Based Panel Cointegration Test in the
Presence of a Linear Time Trend and Cross-Sectional Dependence. Econometric
Reviews, forthcoming.
Bai, J., Carrion-i Silvestre, J. L., 2013. Testing panel cointegration with unobservable
dynamic common factors that are correlated with the regressors. The Economet-
rics Journal 16 (2), 222–249.
Banerjee, A., Carrion-i Silvestre, J. L., 2015. Cointegration in panel data with
structural breaks and cross-secional dependence. Journal of Applied Econometrics
30 (1), 1–23.
Breitung, J., Das, S., 2005. Panel unit root tests under cross-sectional dependence.
Statistica Neerlandica 59 (414-443).
Carrion-i Silvestre, J. L., Surdeanu, L., 2011. Panel cointegration rank testing with
cross-section dependence. Studies in Nonlinear Dynamics and Econometrics 15,
Issue 4, Article 4.
Dabrowski, M. A., Papiez, M., Smiech, S., 2014. Exchange rates and monetary
fundamentals in CEE countries: Evidence from a panel approach. Journal of
Macroeconomics 41, 148–159.
Deheuvels, P., 1979. La fonction de dependance empirique et ses proprietes: Un test
nonparametrique d’independance. Academie Royale de Belgique. Bulletin de la
Classe des Sciences 65 (5), 274–292.
Doornik, J. A., 1998. Approximations to the asymptotic distribution of cointegration
tests. Journal of Economic Surveys 12, 573–593.
Engle, R. F., Granger, C., 1987. Co-Integration and Error Correction: Representa-
tion, Estimation and Testing. Econometrica 55 (2), 251–276.
Genest, C., Neslehova, J., Ben Ghorbal, N., 2011. Estimators based on Kendall’s tau
in multivariate copula models. Australian & New Zealand Journal of Statistics
53 (2), 157–177.
Gengenbach, C., Palm, F., Urbain, J., 2006. Cointegration testing in panels with
common factors. Oxford Bulletin of Economics and Statistics 68 (Supplement),
683–719.
Hanck, C., 2013. An intersection test for panel unit roots. Econometric Reviews
32 (2), 183–203.
16

Joe, H., 1990. Multivariate concordance. Journal of Multivariate Analysis 35, 12–30.
Johansen, S., 1995. Likelihood-based inference in cointegrated vector autoregressive
models. Advanced Texts in Econometrics. Oxford University Press, Oxford.
Krupskii, P., Joe, H., 2013. Factor copula models for multivariate data. Journal of
Multivariate Analysis 120, 85–101.
Nelsen, R. B., 1996. Nonparametric measures of multivariate association. Institute
of Mathematical Statistics Lecture Notes – Monograph Series 28, Distributions
with Fixed Marginals and Related Topics, 223–232.
Oh, D. H., Patton, A. J., 2015. Modelling Dependence in High Dimensions with Fac-
tor Copulas. Tech. Rep. 2015-051, Divisions of Research & Statistics and Monetary
Affairs, Federal Reserve Board, Washington, D.C., Washington, D.C.
Onatski, A., 2010. Determining the number of factors from empirical distribution of
eigenvalues. Review of Economics and Statistics 92 (4), 1004–1016.
Pesaran, M. H., 2007. A simple panel unit root test in the presence of cross-section
dependence. Journal of Applied Econometrics 22, 265–312.
Pesaran, M. H., 2015. Testing weak cross-sectional dependence in large panels.
Econometric Reviews 34 (6-10), 1089–1117.
Rapach, D. E., Wohar, M. E., 2002. Testing the monetary model of exchange rate
determination: new evidence from a century of data. Journal of International
Economics 58, 359–385.
Saikkonen, P., Lutkepohl, H., 2000. Trend adjustment prior to testing for the coin-
tegrating rank of a vector autoregressive process. Journal of Time Series Analysis
21 (4), 435–456.
Sarkar, S. K., 1998. Probability inequalities for ordered MTP2 random variables: A
proof of the Simes Conjecture. The Annals of Statistics 26 (2), 494–504.
Simes, R. J., 1986. An improved Bonferroni procedure for multiple tests of signifi-
cance. Biometrika 73 (3), 751–754.
Toda, H. Y., 1994. Finite sample properties of likelihood ratio tests for cointegrating
ranks when linear trends are present. The Review of Economics and Statistics
76 (1), 66–79.
Toda, H. Y., 1995. Finite sample performance of likelihood ratio tests for cointe-
grating ranks in vector autoregressions. Econometric Theory 11 (5), 1015–1032.
17

Trenkler, C., 2008. Determining p-values for systems cointegration tests with a prior
adjustment for deterministic terms. Computational Statistics 23, 19–39.
Wagner, M., Hlouskova, J., 2010. The performance of panel cointegration methods:
Results from a large scale simulation study. Econometric Reviews 29 (2), 182–223.
Westerlund, J., 2008. Panel cointegration tests of the Fischer effect. Journal of Ap-
plied Econometrics 23 (193-233).
Westerlund, J., Edgerton, D., 2008. A simple test for cointegration in dependent
panels with structural breaks. Oxford Bulletin of Economics and Statistics 70,
665–704.
18

Working Paper Series in Economics
(recent issues)
No.356: Institut für Volkswirtschaftslehre: Forschungsbericht 2015, Januar 2016
No.355: Christoph Kleineberg and Thomas Wein: Relevance and Detection Problems of Margin Squeeze – The Case of German Gasoline Prices, December 2015
No.354: Karsten Mau: US Policy Spillover(?) - China's Accession to the WTO and Rising Exports to the EU, December 2015
No.353: Andree Ehlert, Thomas Wein and Peter Zweifel: Overcoming Resistance Against Managed Care – Insights from a Bargaining Model, December 2015
No.352: Arne Neukirch und Thomas Wein: Marktbeherrschung im Tankstellenmarkt - Fehlender Binnen- und Außenwettbewerb an der Tankstelle? Deskriptive Evidenz für Marktbeherrschung, Dezember 2015
No.351: Jana Stoever and John P. Weche: Environmental regulation and sustainable competitiveness: Evaluating the role of firm-level green investments in the context of the Porter hypothesis, November 2015
No.350: John P. Weche: Does green corporate investment really crowd out other business investment?, November 2015
No.349: Deniz Dilan Karaman Örsal and Antonia Arsova: Meta-analytic cointegrating rank tests for dependent panels, November 2015
No.348: Joachim Wagner: Trade Dynamics and Trade Costs: First Evidence from the Exporter and Importer Dynamics Database for Germany, October 2015
No.347: Markus Groth, Maria Brück and Teresa Oberascher: Climate change related risks, opportunities and adaptation actions in European cities – Insights from responses to the CDP cities program, October 2015
No.346: Joachim Wagner: 25 Jahre Nutzung vertraulicher Firmenpaneldaten der amtlichen Statistik für wirtschaftswissenschaftliche Forschung: Produkte, Projekte, Probleme, Perspektiven, September 2015 [publiziert in: AStA Wirtschafts- und Sozialstatistisches Archiv 9 (2015), 2, 83-106]
No.345: Christian Pfeifer: Unfair Wage Perceptions and Sleep: Evidence from German Survey Data, August 2015
No.344: Joachim Wagner: Share of exports to low-income countries, productivity, and innovation: A replication study with firm-level data from six European countries, July 2015 [published in: Economics Bulletin 35 (2015), 4, 2409-2417]
No.343: Joachim Wagner: R&D activities and extensive margins of exports in manufacturing enterprises: First evidence for Germany, July 2015
No.342: Joachim Wagner: A survey of empirical studies using transaction level data on exports and imports, June 2015 [published in: Review of World Economics 152 (2016), 1, 215-225]
No.341: Joachim Wagner: All Along the Data Watch Tower - 15 Years of European Data Watch in Schmollers Jahrbuch, June 2015

No.340: Joachim Wagner: Kombinierte Firmenpaneldaten – Datenangebot und Analyse-potenziale, Mai 2015
No.339: Anne Maria Busch: Drug Prices, Rents, and Votes in the German Health Care Market: An Application of the Peltzman Model, May 2015
No.338: Anne Maria Busch: Drug Prices and Pressure Group Activities in the German Health Care Market: An Application of the Becker Model, May 2015
No.337: Inna Petrunyk and Christian Pfeifer: Life satisfaction in Germany after reunification: Additional insights on the pattern of convergence, May 2015
No.336: Joachim Wagner: Credit constraints and the extensive margins of exports: First evidence for German manufacturing, March 2015 [published in: Economics: The Open-Access, Open-Assessment E-Journal, 9(2015-18): 1-17]
No.335: Markus Groth und Jörg Cortekar: Die Relevanz von Klimawandelfolgen für Kritische Infrastrukturen am Beispiel des deutschen Energiesektors, Januar 2015
No.334: Institut für Volkswirtschaftslehre: Forschungsbericht 2014, Januar 2015
No.333: Annette Brunsmeier and Markus Groth: Hidden climate change related risks for the private sector, January 2015
No.332: Tim W. Dornis and Thomas Wein: Trademark Rights, Comparative Advertising, and “Perfume Comparison Lists” – An Untold Story of Law and Economics, December 2014
No.331: Julia Jauer, Thomas Liebig, John P. Martin and Patrick Puhani: Migration as an Adjustment Mechanism in the Crisis? A Comparison of Europe and the United States, October 2014
No.330: T. Addison, McKinley L. Blackburn and Chad D. Cotti: On the Robustness of Minimum Wage Effects: Geographically-Disparate Trends and Job Growth Equations, September 2014
No.329: Joachim Möller and Marcus Zierer: The Impact of the German Autobahn Net on Regional Labor Market Performance: A Study using Historical Instrument Variables, November 2014
No.328: Ahmed Fayez Abdelgouad, Christian Pfeifer and John P. Weche Gelübcke: Ownership Structure and Firm Performance in the Egyptian Manufacturing Sector, September 2014
No.327: Stephan Humpert: Working time, satisfaction and work life balance: A European perspective. September 2014
No.326: Arnd Kölling: Labor Demand and Unequal Payment: Does Wage Inequality matter? Analyzing the Influence of Intra-firm Wage Dispersion on Labor Demand with German Employer-Employee Data, November 2014
No.325: Horst Raff and Natalia Trofimenko: World Market Access of Emerging-Market Firms: The Role of Foreign Ownership and Access to External Finance, November 2014
No.324: Boris Hirsch, Michael Oberfichtner and Claus Schnabel: The levelling effect of product market competition on gender wage discrimination, September 2014
No.323: Jürgen Bitzer, Erkan Gören and Sanne Hiller: International Knowledge Spillovers: The Benefits from Employing Immigrants, November 2014
No.322: Michael Gold: Kosten eines Tarifabschlusses: Verschiedene Perspektiven der Bewertung, November 2014

(see www.leuphana.de/institute/ivwl/publikationen/working-papers.html for a complete list)
No.321: Gesine Stephan und Sven Uthmann: Wann wird negative Reziprozität am Arbeitsplatz akzeptiert? Eine quasi-experimentelle Untersuchung, November 2014
No.320: Lutz Bellmann, Hans-Dieter Gerner and Christian Hohendanner: Fixed-term contracts and dismissal protection. Evidence from a policy reform in Germany, November 2014
No.319: Knut Gerlach, Olaf Hübler und Wolfgang Meyer: Betriebliche Suche und Besetzung von Arbeitsplätzen für qualifizierte Tätigkeiten in Niedersachsen - Gibt es Defizite an geeigneten Bewerbern?, Oktober 2014
No.318: Sebastian Fischer, Inna Petrunyk, Christian Pfeifer and Anita Wiemer: Before-after differences in labor market outcomes for participants in medical rehabilitation in Germany, December 2014
No.317: Annika Pape und Thomas Wein: Der deutsche Taximarkt - das letzte (Kollektiv-) Monopol im Sturm der „neuen Zeit“, November 2014
No.316: Nils Braakmann and John Wildman: Reconsidering the impact of family size on labour supply: The twin-problems of the twin-birth instrument, November 2014
No.315: Markus Groth and Jörg Cortekar: Climate change adaptation strategies within the framework of the German “Energiewende” – Is there a need for government interventions and legal obligations?, November 2014
No.314: Ahmed Fayez Abdelgouad: Labor Law Reforms and Labor Market Performance in Egypt, October 2014
No.313: Joachim Wagner: Still different after all these years. Extensive and intensive margins of exports in East and West German manufacturing enterprises, October 2014 [published in: Journal of Economics and Statistics 236 (2016), 2, 297-322]
No.312: Joachim Wagner: A note on the granular nature of imports in German manufacturing industries, October 2014 [published in: Review of Economics 65 (2014), 3, 241-252]
No.311: Nikolai Hoberg and Stefan Baumgärtner: Value pluralism, trade-offs and efficiencies, October 2014
No.310: Joachim Wagner: Exports, R&D and Productivity: A test of the Bustos-model with enterprise data from France, Italy and Spain, October 2014 [ published in: Economics Bulletin 35 (2015), 1, 716-719]
No.309: Thomas Wein: Preventing Margin Squeeze: An Unsolvable Puzzle for Competition Policy? The Case of the German Gasoline Market, September 2014
No.308: Joachim Wagner: Firm age and the margins of international trade: Comparable evidence from five European countries, September 2014
No.307: John P. Weche Gelübcke: Auslandskontrollierte Industrie- und Dienstleistungsunternehmen in Niedersachsen: Performancedifferentiale und Dynamik in Krisenzeiten, August 2014
No.306: Joachim Wagner: New Data from Official Statistics for Imports and Exports of Goods by German Enterprises, August 2014 [published in: Schmollers Jahrbuch / Journal of Applied Social Sciences Studies 134 (2014), 3, 371-378]
No.305: Joachim Wagner: A note on firm age and the margins of imports: First evidence from Germany, August 2014 [published in: Applied Economics Letters 22 (2015), 9, 679-682]

Leuphana Universität Lüneburg
Institut für Volkswirtschaftslehre
Postfach 2440
D-21314 Lüneburg
Tel.: ++49 4131 677 2321
email: [email protected]
www.leuphana.de/institute/ivwl/publikationen/working-papers.html