an introduction to basic farm financial statements
TRANSCRIPT

The image part with relationship ID rId2 was not found in the file.
An Introduction to Basic
Farm Financial Statements: Balance Sheet
Victoria Campbell, Extension Intern S. Aaron Smith, Associate Professor
Christopher N. Boyer, Associate Professor Andrew P. Griffith, Associate Professor
Department of Agricultural and Resource Economics
W 884

2
An Introduction to Basic Farm Financial Statements: Balance Sheet
Introduction Tennessee agriculture includes a diverse list of livestock, poultry, fruits and vegetables, row crop, nursery, forestry, ornamental, agri-tourism, value added and other nontraditional enterprises. These farms vary in size from less than a quarter of an acre to thousands of acres, and the specific goal for each farm can vary. For example, producers’ goals might include maximizing profits, maintaining a way of life, enjoyment, transitioning the operation to the next generation, etc. Regardless of the farm size, enterprises and objectives, it is important to keep proper farm financial records to improve the long-term viability of the farm. Accurate recordkeeping and organized financial statements allow producers to measure key financial components of their business such as profitability, liquidity and solvency. These measurements are vital to making knowledgeable decisions to achieve farm goals.
The goal of this publication is to introduce balance sheets. A balance sheet is a financial statement that shows a detailed list of all assets, liabilities and the owner’s equity position of the farming operation at a specific point in time. This publication provides an overview of the three principal components of a balance sheet: 1) assets; 2) liabilities; and 3) owner’s equity. It also discusses important farm financial measures that can be derived and analyzed from the balance sheet.
Basic Accounting Overview To begin constructing a balance sheet, we need to first start with the standard accounting equation:
Total Assets = Total Liabilities + Owner’s Equity
The balance sheet is designed with assets on the left-hand side and liabilities plus owner’s equity on the right-hand side. This format allows both sides of the balance sheet to equal each other. After all, a balance sheet must balance.
A change in liquidity, solvency and equity can be found by comparing balance sheets from two different time periods. Typically, changes in the balance sheet measurements are analyzed for the operation’s fiscal year (i.e., January 1 to December 31); however, these values can be compared for any time interval. A change in owner’s equity occurs from two sources: 1) income or loss from operations; and/or 2) a change in the value of an asset or liability. Changes in owner’s equity can indicate whether the farm is heading in a profitable direction. However, the balance sheet must be analyzed in conjunction with the income statement (Best et al., 2020) to determine profitability. The income statement summarizes revenue and expenses and is used to compute profit over a period of time. (Best et al., 2020).

3
An Introduction to Basic Farm Financial Statements: Balance Sheet
Assets
Assets are items of value that a farm owns or uses. Assets are split into two categories: current and noncurrent.1 A current asset is either cash (or cash equivalents) or an item that will become cash within a fiscal year (12 months). A noncurrent asset is something the farm owns or uses that will not turn into cash within the next accounting period and typically has a multiyear useful life. Some balance sheets further divide noncurrent assets into intermediate and long-term assets. In general, an intermediate asset is an asset with a useful life of one to 10 years (e.g., a tractor), while a long-term asset has a useful life of greater than 10 years (e.g., land) (Holland, 1997). For the sake of simplicity, the example balance sheet in Appendix 1 uses current and noncurrent assets.
Noncurrent Asset Valuation Assets can be valued using two different approaches: cost value and market value.
Cost valuation, sometimes referred to as book value, is the original price paid for the asset minus the accumulated depreciation of that asset. Because the cost method takes into consideration depreciation, a producer can examine changes in the farm owner’s equity (net worth) and the overall invested capital performance (Langemeier, 2017).
Market valuation is an estimate of what the asset would sell for on the date of the balance sheet. This valuation considers current prices, meaning the asset is valued based on what a buyer would pay at a specific point in time. For example, the
1 Not included in the examples and text of this publication are discussions regarding nonfarm assets and liabilities. Balance sheets such as those generated in FINPACK and used by ag lenders may include options to quantify nonfarm assets and liabilities (see Appendix 5 for definitions).
market value for a tractor might be the trade-in value or what it could sell for at auction. The market value approach is important because it provides an estimate of what the farmer would actually receive for an asset if it was liquidated that day (sale proceeds could be less due to transaction costs and contingent liabilities). When selling costs are taken out of the market value, a farmer then has a clear picture of the cost or gain of that asset disposal (Langemeier, 2017). Appendix 1 depicts a simple example of a balance sheet template.
Depreciation There are two common methods in which assets can be depreciated: straight-line depreciation and declining balance depreciation. Straight-line depreciation is when an asset is depreciated by the same amount each year. It is also the simplest type of depreciation to calculate. Table 1 in Appendix 3 displays the calculation for the straight-line depreciation method for the building and machinery that appear on the example balance sheet (Appendix 1). The equation for the straight-line depreciation method is (Warren, 2013):
Annual Depreciation = Original Cost – Salvage Value Useful Life
Declining balance depreciation is a method in which an asset depreciates rapidly in the first few years, and then the annual depreciation expense, in dollar terms, becomes smaller the closer the asset gets to reaching the end of its useful life. For the example depicted in Appendix 3, initially, the depreciation rate for the declining balance method is double the straight-line depreciation rate (20 percent compared to 10 percent).2
Nonfarm assets and liabilities can influence the viability of the farming operation and the ability of the farm to obtain credit. 2 This is an example of the concept of declining balance depreciation and not reflective of current tax rules. Interested readers are referred to: IRS, Farmer’s

4
An Introduction to Basic Farm Financial Statements: Balance Sheet
The graph below (Figure 1) illustrates the two depreciation methods. With straight-line depreciation, the asset depreciates steadily (by the same amount each year) until it reaches its salvage value.
With the declining balance method, the asset depreciates more rapidly initially but then slowly depreciates until the end of its useful life. In this example, both methods produce the same amount of accumulated depreciation at the end of the useful life of the asset. Table 2 of Appendix 3 shows the declining balance method of depreciation calculated for the same building and machinery.
Liabilities
An obligation to pay a debt is known as a liability. Just like assets, the liabilities section of the balance sheet can be separated into two sections (current and noncurrent) or three sections (current, intermediate and long-term). A current liability is a debt that must be paid within one fiscal year (12 months); an intermediate liability is a debt that is due within one to 10 years; and a long-
Tax Guide, Publication 225, for current farm tax information.
term liability has a payback term longer than 10 years.
Assets Liabilities
Current Current
Intermediate (useful life 1-10 years)
Intermediate (due within the next 1-10 years)
Long-term (useful life > 10 years)
Long-term (not payable till > 10 years)
Total Assets Total Liabilities * Current: turn to cash or is due in the current fiscal year. * Noncurrent: intermediate + long-term.
In farming, liabilities are commonly associated with different loan types. An example of a current liability would be an operating or production loan. Operating loans are normally used to finance short-term cash flow short falls and/or to cover day-to-day business expenses. Interest on operating loans is typically paid monthly, with no set terms of principal repayment (operating loans should be paid in full annually upon the sale of commodities or liquidation of other current assets).
An example of an intermediate liability is a machinery loan. Machinery loans are typically considered intermediate because most farm machinery has an estimated useful life of 10 years or less (the machine may require constant repairs, be less dependable or become technologically obsolete). Intermediate loans should be amortized for fewer years than the useful life of the asset being purchased. These loans can be paid
Straight-line
Declining balance
Cost Value ($)
Useful life (years)
Figure 1. Illustration of straight-line and declining balance depreciation. methods

5
An Introduction to Basic Farm Financial Statements: Balance Sheet
annually or monthly. The payment that is due consists of both interest and part of the principal balance.
Lastly, an example of a long-term liability would be a farm real estate loan for purchase of land. Typically, farm land can be amortized over a maximum of 30 years. Long-term farm loans are normally paid on an annual basis; however, loan payments should coincide with income (i.e., a dairy may desire monthly payments, rather than annually).
The loan schedule in Appendix 4 displays all three types of loans, and their payments have been calculated based on individual interest rates and the remaining term of the loan.
Owner’s Equity
The difference between a farm’s assets and its liabilities is called owner’s equity. It is sometimes referred to as a farm’s net worth. Depending on the legal entity of the farm (sole proprietorship, partnership, LLC, etc.), owner’s equity can be referred to differently. As a result, each owner’s equity section on the balance sheet will vary. For the purposes of this publication, owner’s equity is simply the farm’s net worth, which can be calculated by taking total assets less total liabilities.
Important Farm Financial Measures
Two important farm financial measures that can be calculated from a balance sheet include liquidity and solvency.
Liquidity is the ability to meet the short-term cash needs of a farm. Two common liquidity measures are the current ratio and working capital. The current ratio is current assets
divided by current liabilities. In Appendix 1, the current ratio for the beginning of the year was 2.76, meaning that the farm has $2.76 of current assets for every $1 of current liabilities. A current ratio greater than 2.0 is classified as strong (FINPACK, 2016). Working capital is a farm’s current assets less its current liabilities. This is the amount of cash the farm would have if all current assets were converted to cash and all current debts (including principal payments on term debts that are due in 12 months) were paid (excluding contingent liabilities and transaction costs).
Solvency is the ability to repay the money loaned if a farm stopped doing business today. There are three commonly used ratios to measure solvency.
The first is the debt-to-asset ratio, and it is calculated as total liabilities divided by total assets. This ratio signifies a farm’s debt load compared to its assets. The higher or closer to 1 (if over 1, the business has become insolvent; liabilities exceed assets) a debt-to-asset ratio is, the greater the percentage of farm assets financed by debt (Holland, 1997). In the ratio analysis in Appendix 1, the debt-to-asset ratio at the beginning of the year was 0.229. This means roughly 23 percent of the farm’s assets are financed through debt.
The equity-to-asset ratio (total owner’s equity divided by total assets) represents the proportion of total assets that are unencumbered (or debt free). A farm will have a higher equity-to-asset ratio the more it is able to pay its expenses without the use of loans.
The last ratio is a measure of how much capital is being supplied by creditors, compared to capital used from farm equity. This is called the debt-to-equity ratio and is

6
An Introduction to Basic Farm Financial Statements: Balance Sheet
calculated by dividing the total liabilities by total owner’s equity. A lower debt-to-equity ratio is more desirable because that means the proportion of capital the farm is supplying through equity is greater than the portion supplied by creditors (debt).
Appendix 2 contains a breakdown of each of the ratios and includes the desired outcome of each. When calculating solvency, a consistent value method needs to be used, either cost value or market value but not both. Conclusion Understanding how to construct and analyze a balance sheet is important for farmers. Farmers should utilize a balance sheet annually to examine and implement changes to improve their operations’ financial position. A farmer can use farm financial analysis to identify financial components of his or her business that could be improved (one cannot manage what they cannot measure). Improved financial performance can provide access to credit, reduced interest rates and open opportunities for expanding the farm.
7
An Introduction to Basic Farm Financial Statements: Balance Sheet
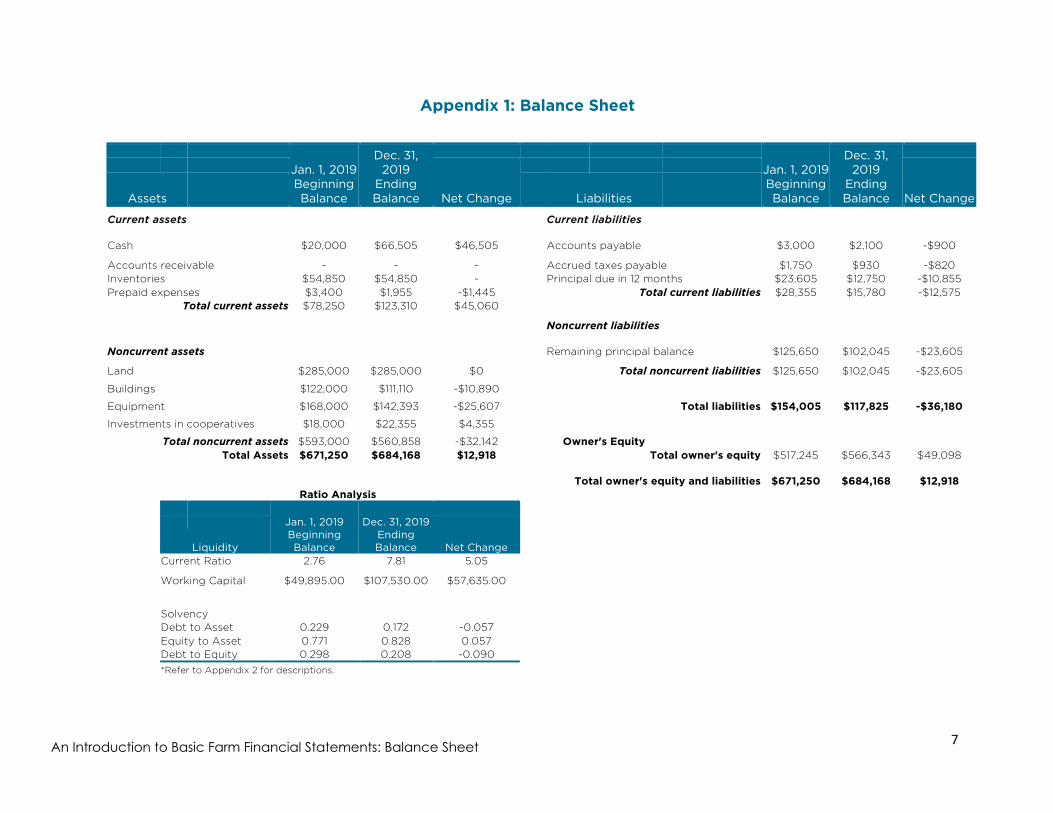
Appendix 1: Balance Sheet
Jan. 1, 2019 Beginning Balance
Dec. 31, 2019
Ending Balance
Jan. 1, 2019 Beginning Balance
Dec. 31, 2019
Ending Balance
Net Change
Net Change Assets Liabilities Current assets Current liabilities
Cash $20,000 $66,505 $46,505 Accounts payable $3,000 $2,100 -$900
Accounts receivable - - - Accrued taxes payable $1,750 $930 -$820 Inventories $54,850 $54,850 - Principal due in 12 months $23,605 $12,750 -$10,855 Prepaid expenses $3,400 $1,955 -$1,445 Total current liabilities $28,355 $15,780 -$12,575
Total current assets $78,250 $123,310 $45,060
Noncurrent liabilities
Noncurrent assets Remaining principal balance $125,650 $102,045 -$23,605
Land $285,000 $285,000 $0 Total noncurrent liabilities $125,650 $102,045 -$23,605
Buildings $122,000 $111,110 -$10,890
Equipment $168,000 $142,393 -$25,607 Total liabilities $154,005 $117,825 -$36,180 Investments in cooperatives $18,000 $22,355 $4,355
Total noncurrent assets $593,000 $560,858 -$32,142 Owner's Equity Total Assets $671,250 $684,168 $12,918 Total owner's equity $517,245 $566,343 $49,098
Total owner's equity and liabilities $671,250 $684,168 $12,918 Ratio Analysis
Jan. 1, 2019 Beginning Balance
Dec. 31, 2019 Ending Balance
Net Change
Liquidity
Current Ratio 2.76 7.81 5.05
Working Capital $49,895.00 $107,530.00 $57,635.00
Solvency Debt to Asset 0.229 0.172 -0.057 Equity to Asset 0.771 0.828 0.057 Debt to Equity 0.298 0.208 -0.090 *Refer to Appendix 2 for descriptions.

8
An Introduction to Basic Farm Financial Statements: Balance Sheet
Appendix 2: Ratios and Equations
Accounting Equation
Total Assets = Owner’s Equity - Total Liabilities
Liquidity
Current Ratio = Total Current Assets
Total Current Liabilities
Working Capital = Total Current Assets - Total Current Liabilities
Desired outcome: positive number
Solvency
Debt-to-Asset Ratio = Total Liabilities
Total Assets
Equity-to-Asset Ratio = Total Owner's EquityTotal Assets
Debt-to-Equity Ratio = Total Liabilities
Total Owner's Equity
Straight-line Depreciation Annual Depreciation = Price - Salvage Value
Useful Life
Source: Liquidity and solvency ratios sourced from Klinefelter (2008) and Berry (Penn State).

9
An Introduction to Basic Farm Financial Statements: Balance Sheet
Appendix 3: Depreciation Schedules3
Table 1. Straight-line Depreciation
Asset
Opening Value (Jan. 1,
2019) Useful Life (in Years) Salvage Value
Annual Depreciation
Rate
Annual Depreciation
Expense
Closing Value (Dec.
31, 2019) Building $122,000 10 $13,100 10% $10,890 $111,110 Machinery $168,000 6 $14,661 17% $25,557 $142,444
Table 2. Declining Balance Depreciation
Asset
Beginning
Book Value Depreciation
Rate Depreciation
Expense
Ending Accumulated Depreciation
Ending Book Value Year
Building 2019 $122,000 20% $24,400 $24,400 $97,600 2020 $97,600 20% $19,520 $43,920 $78,080 2021 $78,080 20% $15,616 $59,536 $62,464 2022 $62,464 20% $12,493 $72,029 $49,971 2023 $49,971 20% $9,994 $82,023 $39,977 2024 $39,977 20% $7,995 $90,018 $31,982 2025 $31,982 20% $6,396 $96,415 $25,585 2026 $25,585 20% $5,117 $101,532 $20,468 2027 $20,468 20% $4,094 $105,625 $16,375 2028 $16,375 20% $3,275 $108,900 $13,100 Machinery 2019 $168,000 33% $56,112 $56,112 $111,888 2020 $111,888 33% $37,371 $93,483 $74,517 2021 $74,517 33% $24,889 $118,371 $49,629
2022 $49,629 33% $16,576 $134,947 $33,053 2023 $33,053 33% $11,040 $145,987 $22,013 2024 $22,013 33% $7,352 $153,339 $14,661
3 The information depicted is an example of depreciation concepts and not reflective of current tax rules. Interested readers are referred to: IRS, Farmer’s Tax Guide, Publication 225, for current farm tax information.

10
An Introduction to Basic Farm Financial Statements: Balance Sheet
Appendix 4: Loan Schedules
Loan Classification Loan Type Start Date End Date Limit Balance Interest
Rate
Remaining Term/ Amortization*
(months)
Payment Due in the Next 12 months Payment
Frequency Payment Due Payment Due Date Remaining Balance
Interest Principal Current (1) Operating 1/1/2019 12/31/2019 $100,000.00 $75,000.00 6% 12/12 $375.00 - Monthly $375.00 2/1/2019 $75,000.00
Intermediate (2) Machinery 1/1/2019 12/31/2022 $80,000.00 $80,000.00 5% 36/60 $2,516.01 $15,961.98 Annually $18,477.99 12/31/2019 $61,522.01
Long-term (3) Land 1/1/2019 12/31/2038 $160,000.00 $160,000.00 4% 240/240 $6,400.00 $5,373.08 Annually $11,773.08 12/31/2019 $154,626.92
(1) Operating
(3) Land
For a current operating loan, the balance of the loan changes daily, so monthly interest-only payments are calculated. The principal for operating loans is normally paid at one specific time of year (e.g., after the sale of a crop).
Year Beginning
Balance Payment Interest Principal Ending Balance
19 $160,000.00 $11,773.08 $6,400.00 $5,373.08 $154,626.92
20 $154,626.92 $11,773.08 $6,185.08 $5,588.00 $149,038.92 Example: Monthly interest payment = ($75,000 * (0.06/12))
21 $149,038.92 $11,773.08 $5,961.56 $5,811.52 $143,227.39
22 $143,227.39 $11,773.08 $5,729.10 $6,043.98 $137,183.41
(2) Machinery 23 $137,183.41 $11,773.08 $5,487.34 $6,285.74 $130,897.67
24 $130,897.67 $11,773.08 $5,235.91 $6,537.17 $124,360.49
Year Beginning Balance Payment Interest Principal
Ending Balance
25 $124,360.49 $11,773.08 $4,974.42 $6,798.66 $117,561.83
19 $80,000.00 $18,477.98 $4,000.00 $14,477.98 $65,522.02 26 $117,561.83 $11,773.08 $4,702.47 $7,070.61 $110,491.22
20 $65,522.02 $18,477.98 $3,276.10 $15,201.88 $50,320.13 27 $110,491.22 $11,773.08 $4,419.65 $7,353.43 $103,137.79
21 $50,320.13 $18,477.98 $2,516.01 $15,961.98 $34,358.16 28 $103,137.79 $11,773.08 $4,125.51 $7,647.57 $95,490.23
22 $34,358.16 $18,477.98 $1,717.91 $16,760.08 $17,598.08 29 $95,490.23 $11,773.08 $3,819.61 $7,953.47 $87,536.75
23 $17,598.08 $18,477.98 $879.90 $17,598.08 $0.00 30 $87,536.75 $11,773.08 $3,501.47 $8,271.61 $79,265.14
31 $79,265.14 $11,773.08 $3,170.61 $8,602.47 $70,662.67
Annual payment = principal + interest 32 $70,662.67 $11,773.08 $2,826.51 $8,946.57 $61,716.10
33 $61,716.10 $11,773.08 $2,468.64 $9,304.44 $52,411.66
Interest payment = balance * interest rate 34 $52,411.66 $11,773.08 $2,096.47 $9,676.61 $42,735.05
35 $42,735.05 $11,773.08 $1,709.40 $10,063.68 $32,671.37
Principal payment = annual payment - interest 36 $32,671.37 $11,773.08 $1,306.85 $10,466.23 $22,205.14
37 $22,205.14 $11,773.08 $888.21 $10,884.87 $11,320.27 *For the current loan, the annual interest rate is divided by 12 to find the monthly payment.
38 $11,320.27 $11,773.08 $452.81 $11,320.27 $0.00
*In this example, interest is compounded annually for both intermediate and long-term loans.

11
An Introduction to Basic Farm Financial Statements: Balance Sheet
Appendix 5: Definitions to Know
Accounts payable: amount of money owed, by a firm, to others for goods or services bought on credit and for which payment is to be made before the end of the current accounting period.
Accounts receivable: debts that others owe the business, usually arising from previous credit sales. Amortization: paying off debt with a fixed repayment schedule in regular installments over a period of time. Asset: something of value a firm owns or uses.
Balance Sheet: a statement of the financial condition of a business on a specific date.
Contingent liability: potential liabilities if certain events occur in the future (i.e., debts that come about due to litigation, environmental matters, guarantees, estate taxes, etc.) (Warren, 2013).
Cost value: amount of cash paid for an asset, plus the basis of a trade-in, if any (Holland, 1997).
Current asset: either cash or an item that will become cash within the accounting period.
Current liability: a debt that must be paid within the next accounting period.
Current ratio: current assets divided by current liabilities as listed on the balance sheet.
Debt-to-asset ratio: measures the debt load of a business compared to its assets (Holland, 1997).
Debt-to-equity ratio: measures the relative size of claims on a firm’s assets between creditors and the owners.
Declining balance depreciation: provides periodic depreciation expense based on the declining book value of a fixed (noncurrent) asset over its estimated life (Warren, 2013).
Depreciation: decline in market value that occurs in capital assets over time and which reflects the “consumption” of these assets due to wear and tear and so forth.
Equity-to-asset ratio: measures the proportion of total assets financed by equity in the farm (UT Extension, PB 1583).
Intermediate asset: asset with a longer life in the operation (usually up to 10 years) (Hachfeld, 2016).

12
An Introduction to Basic Farm Financial Statements: Balance Sheet
Intermediate liability: debt that is due over the next 10 or fewer years (Hachfeld, 2016).
Liability: an obligation to pay a debt.
Liquidity: ability to meet the day-to-day cash needs of the firm.
Long-term asset: asset with a useful life of longer than 10 years.
Long-term liability: debt with a payback term longer than 10 years.
Market value: an estimate of an asset’s sale price, less any expected selling cost (Holland, 1997). Noncurrent asset: something the firm owns or uses that will not turn into cash within the next accounting period.
Noncurrent liability: debt whose payment will be made after the next accounting period.
Non-farm assets: personal and non-farm business assets of the farm family (Holland, 1997).
Non-farm liabilities: personal and non-farm business liabilities incurred by the farm family (Holland, 1997).
Owner’s equity: difference between a firm’s assets and its liabilities, sometimes referred to as net worth.
Salvage value: value of an asset at the end of its useful life (Warren, 2013).
Solvency: ability to repay the money loaned if the firm stopped doing business today; measure of a firm’s debts to its equity.
Straight-line depreciation: depreciation that provides for equal periodic depreciation expense over the estimated life of a fixed (noncurrent) asset (Warren, 2013).
Useful life: an estimate of the number of years an asset is likely to remain in service for its intended purpose.
Working capital: a firm’s current assets less its current liabilities; measures the funds that would be available if current assets were sold and current farm liabilities paid (Holland, 1997). *All definitions provided by the following source unless otherwise cited: Beierlein (2008).

13
An Introduction to Basic Farm Financial Statements: Balance Sheet
References
Beierlein, J.G., K. Schneeberger, and D. Osburn. Principles of Agribusiness Management: Fourth Edition, 2008. Illinois: Waveland Press, Inc.
Berry, J. “Calculating the ‘Sweet 16’ Farm Financial Measures.” Penn State Cooperative Extension — Agricultural Marketing. Internet site: http://extension.psu.edu/business/farm/management/financialmanagement/topics/calculating-the-sweet-16-farm-financial-measures
Best, S.E., S.A. Smith, C.N. Boyer, and A.P. Griffith. 2020. “An Introduction to Basic Farm Financial Statements: Income Statement.” University of Tennessee Extension publication, (forthcoming).
Campbell, V., S. Best, S.A. Smith, and C.N. Boyer. 2019. “Corn and Soybean Case Study.” University of Tennessee Extension publication, (in review).
Doye, D., and B. Ladd. “Developing a Balance Sheet.” 2015. Oklahoma Cooperative Extension Service, Division of Agricultural Sciences and Natural Resources, AGEC-752. Internet site: http://pods.dasnr.okstate.edu/docushare/dsweb/Get/Document-1805/AGEC-752web2010.pdf
FINPACK. 2016. “Financial Analysis Executive Summary.” University of Minnesota: Center for Farm Financial Management, 2016 Analysis.
Hachfeld, G.A, D. Bau, and C. Holcomb. 2016. “Balance Sheet: Agricultural Business Management.” University of Minnesota Extension, Financial Management Series #1. Internet site: https://www.extension.umn.edu/agriculture/business/farm-financial-management/docs/financial-management-series-all.pdf
Holland, R.W., and D.C. Gerloff, 1997. “The Development and Use of Financial Statements: The Balance Sheet.” University of Tennessee Extension publication PB 1583. Internet site: http://economics.ag.utk.edu/publications/mgmt/pb1583.pdf
Internal Revenue Service. “Farmer’s Tax Guide.” Publication 225. https://www.irs.gov/pub/irs-pdf/p225.pdf
Klinefelter, D. 2008. “Balance Sheet — A Financial Management Tool.” Texas A&M System, Texas AgriLife Extension Service, E-482. Internet site: http://agecoext.tamu.edu/files/2013/10/rm5-5.pdf
Langemeier, M. 2017. “Market Value Balance Sheet and Analysis.” Purdue University, Center for Commercial Agriculture. Internet site: https://ag.purdue.edu/commercialag/Documents/Resources/Finance/Financial-Analysis/2017_04_05_Langemeier_Market_Value.pdf
Warren, C.S. Survey of Accounting: Sixth Edition, 2013. South-Western: Cengage Learning.

14
An Introduction to Basic Farm Financial Statements: Balance Sheet
AG.TENNESSEE.EDU
W 884 4/20 Programs in agriculture and natural resources, 4-H youth development, family and consumer sciences, and resource development. University of Tennessee Institute of Agriculture, U.S. Department of Agriculture and county governments cooperating. UT
Extension provides equal opportunities in programs and employment.