an introduction to lean six sigma
DESCRIPTION
An Introduction to Lean Six Sigma. “We don’t know what we don’t know. We can’t act on what we don’t know. We won’t know until we search. We won’t search for what we don’t question. We don’t question what we don’t measure. Hence, we just don’t know.” Dr. Mikel Harry. Process Improvement. - PowerPoint PPT PresentationTRANSCRIPT
An Introduction to Lean Six Sigma
“We don’t know what we don’t know.We can’t act on what we don’t know.We won’t know until we search.We won’t search for what we don’t question.We don’t question what we don’t measure.Hence, we just don’t know.”
Dr. Mikel Harry
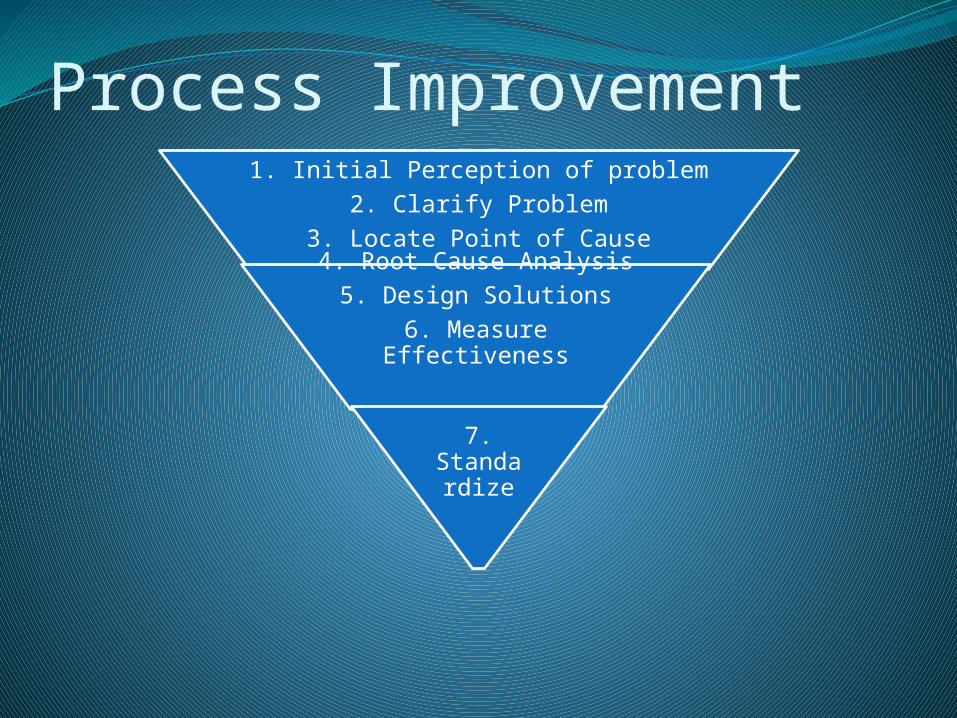
Process Improvement1. Initial Perception of problem
2. Clarify Problem3. Locate Point of Cause4. Root Cause Analysis
5. Design Solutions6. Measure Effectiveness
7. Standardize
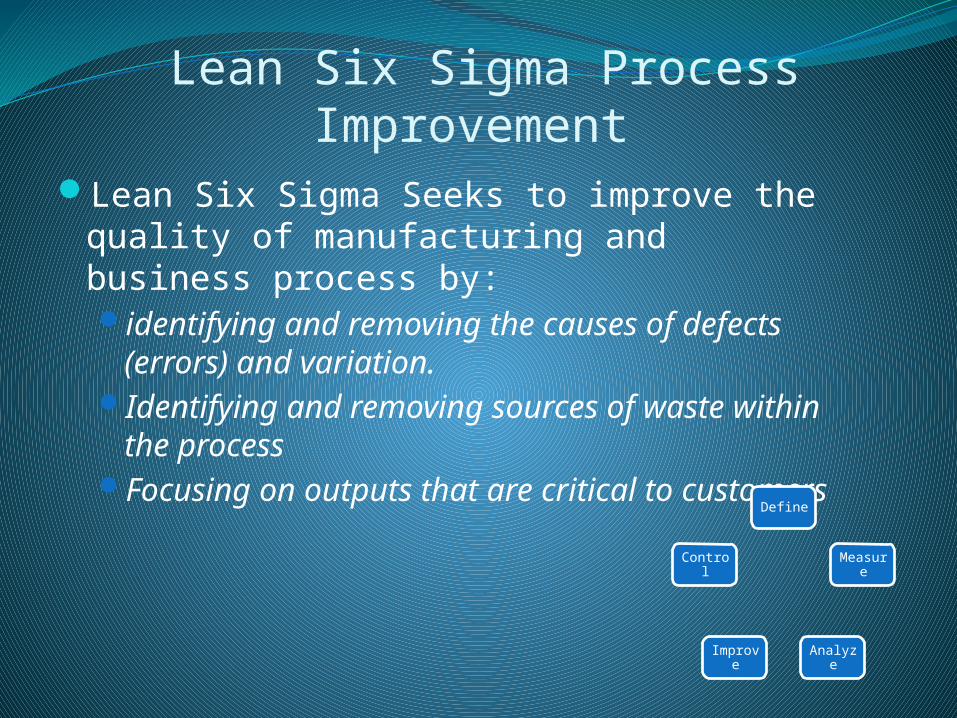
Lean Six Sigma Process ImprovementLean Six Sigma Seeks to improve the
quality of manufacturing and business process by:identifying and removing the causes of
defects (errors) and variation.Identifying and removing sources of waste
within the processFocusing on outputs that are critical to
customersDefine
Measure
Analyze
Improve
Control
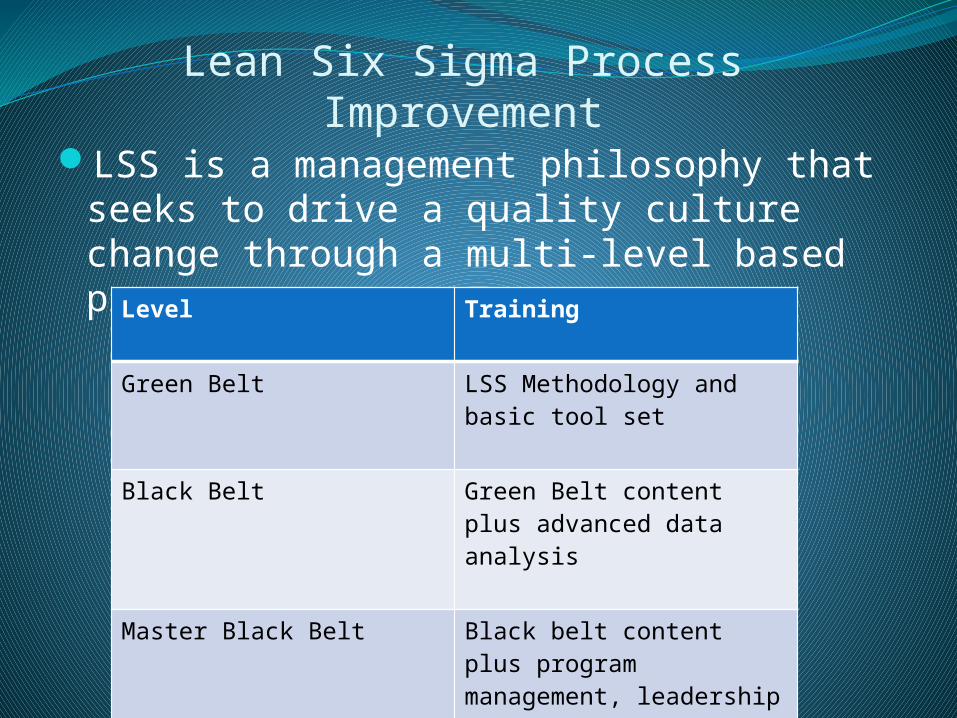
Lean Six Sigma Process ImprovementLSS is a management philosophy that
seeks to drive a quality culture change through a multi-level based program
Level Training
Green Belt LSS Methodology and basic tool set
Black Belt Green Belt content plus advanced data analysis
Master Black Belt Black belt content plus program management, leadership skills, some advanced tools
L6s
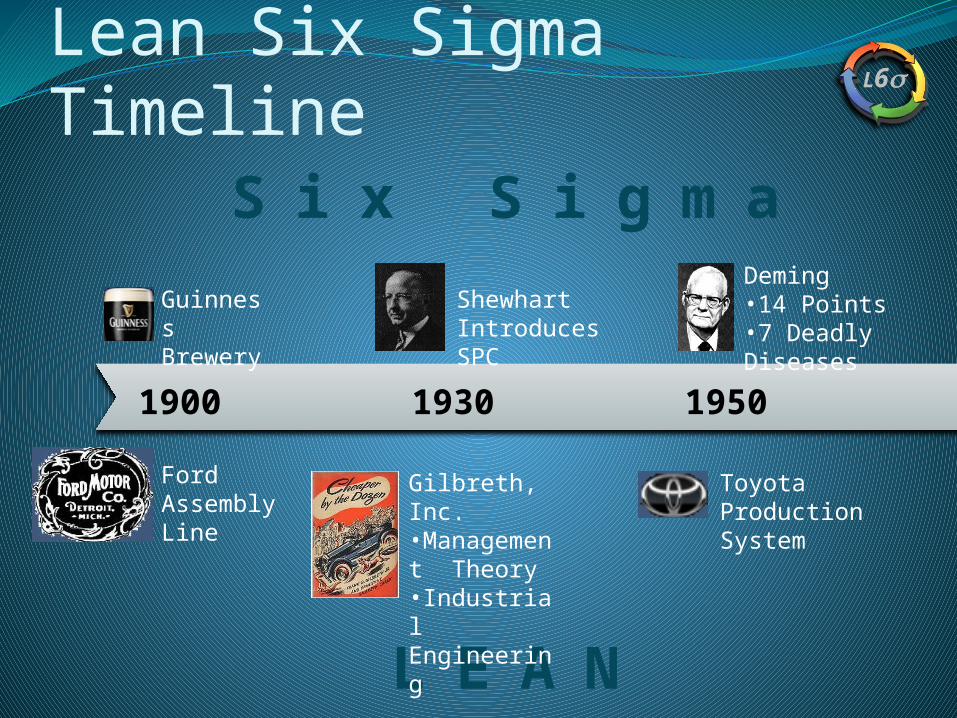
1930 19501900
L E A N
S i x S i g m a
Ford Assembly Line
Guinness Brewery
Shewhart Introduces SPC
Gilbreth, Inc.•Management Theory•Industrial Engineering
Deming•14 Points•7 Deadly Diseases
Toyota Production System
Lean Six Sigma Timeline
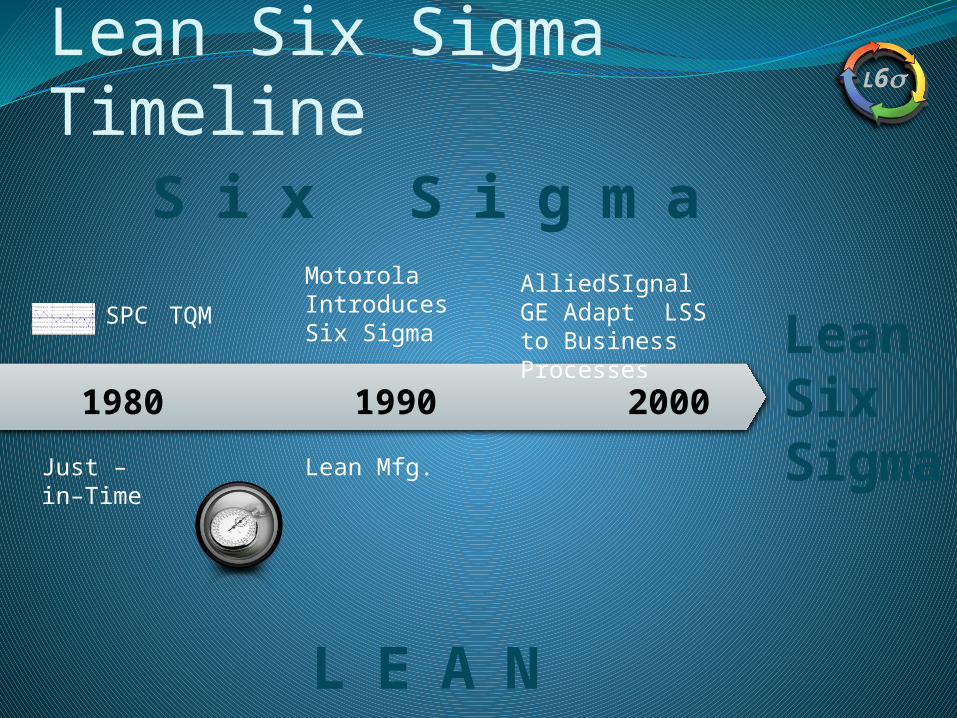
L6s
1990 20001980
Motorola Introduces Six Sigma
S i x S i g m a
L E A N
Just – in–Time
SPC
Lean Mfg.
TQMAlliedSIgnalGE Adapt LSS to Business Processes
Lean
Six Sigma
Lean Six Sigma Timeline
Background on LeanLean comes out of the industrial engineering worldTaiichi Ohno – Toyota Production System.
1940s-1950s company was on verge of bankruptcyDynamics of industry were changing – moving from mass
production to more flexible, shorter, varied batch runs (people wanted more colors, different features, more models, etc).
Ohno was inspired by 3 observations on a trip to AmericaHenry Ford’s assembly line inspired the principle of flow (keep
products moving because no value is added while it is sitting still)
The Indy 500 – Rapid ChangeoverThe American Grocery Store – led to the Pull system – material
use signals when and how stock needs to be replenished
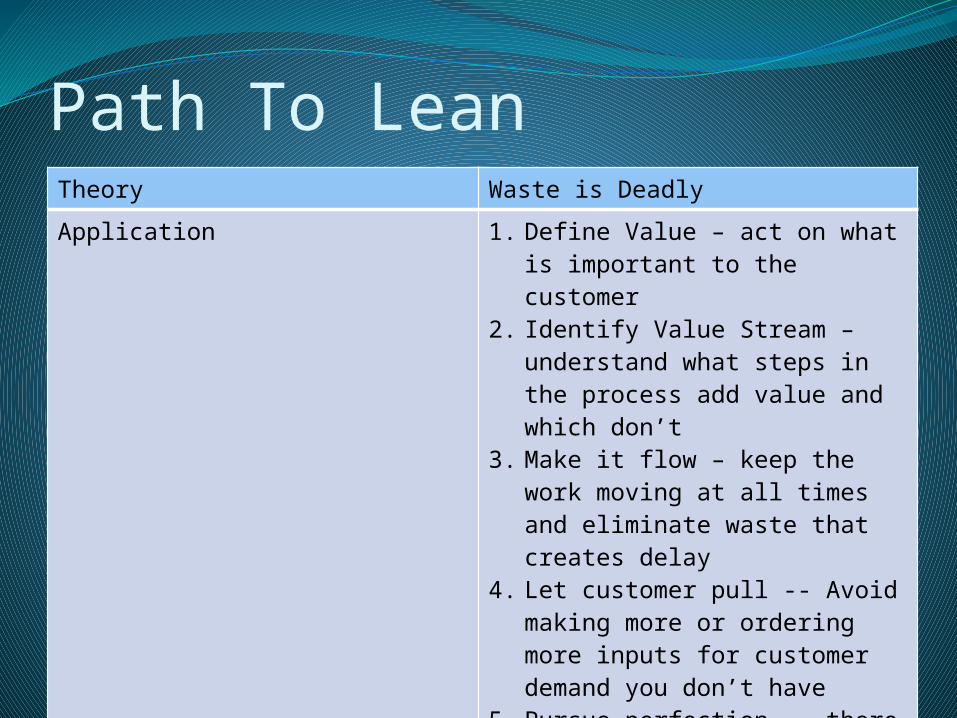
Path To LeanTheory Waste is DeadlyApplication 1. Define Value – act on what is
important to the customer2. Identify Value Stream –
understand what steps in the process add value and which don’t
3. Make it flow – keep the work moving at all times and eliminate waste that creates delay
4. Let customer pull -- Avoid making more or ordering more inputs for customer demand you don’t have
5. Pursue perfection -- there is no optimum level of performance
Focus Flow FocusedAssumptions Non-Value added steps exitResults Reduced cycle time
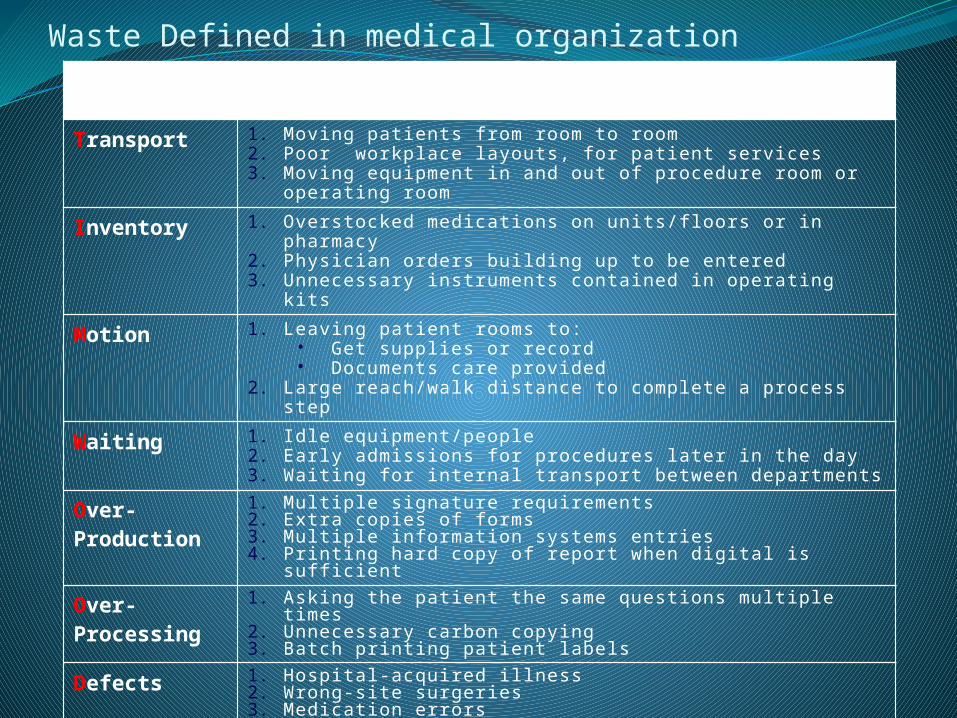
Waste Defined in medical organizationWastes Healthcare Examples
Transport 1. Moving patients from room to room2. Poor workplace layouts, for patient services3. Moving equipment in and out of procedure room or
operating room
Inventory 1. Overstocked medications on units/floors or in pharmacy2. Physician orders building up to be entered 3. Unnecessary instruments contained in operating kits
Motion 1. Leaving patient rooms to:• Get supplies or record• Documents care provided
2. Large reach/walk distance to complete a process step
Waiting 1. Idle equipment/people2. Early admissions for procedures later in the day3. Waiting for internal transport between departments
Over-Production
1. Multiple signature requirements2. Extra copies of forms3. Multiple information systems entries4. Printing hard copy of report when digital is sufficient
Over-Processing
1. Asking the patient the same questions multiple times2. Unnecessary carbon copying3. Batch printing patient labels
Defects 1. Hospital-acquired illness2. Wrong-site surgeries3. Medication errors4. Dealing with service complaints5. Illegible, handwritten information6. Collection of incorrect patient information
Skills 1. Not using people’s mental, creative, and physical abilities2. Staff not involved in redesigning processes in their
workplace3. Nurses and Doctors spending time locating equipment
and supplies4. Staff rework due to system failures
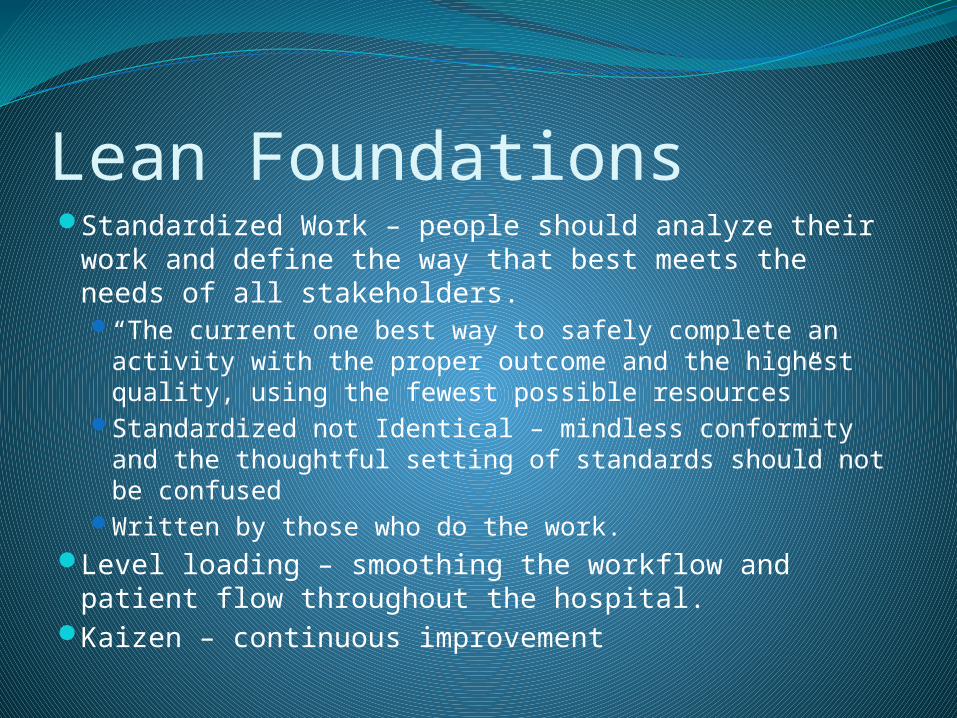
Lean FoundationsStandardized Work – people should analyze their work
and define the way that best meets the needs of all stakeholders. “The current one best way to safely complete an activity
with the proper outcome and the highest quality, using the fewest possible resources”
Standardized not Identical – mindless conformity and the thoughtful setting of standards should not be confused
Written by those who do the work.Level loading – smoothing the workflow and patient
flow throughout the hospital.Kaizen – continuous improvement
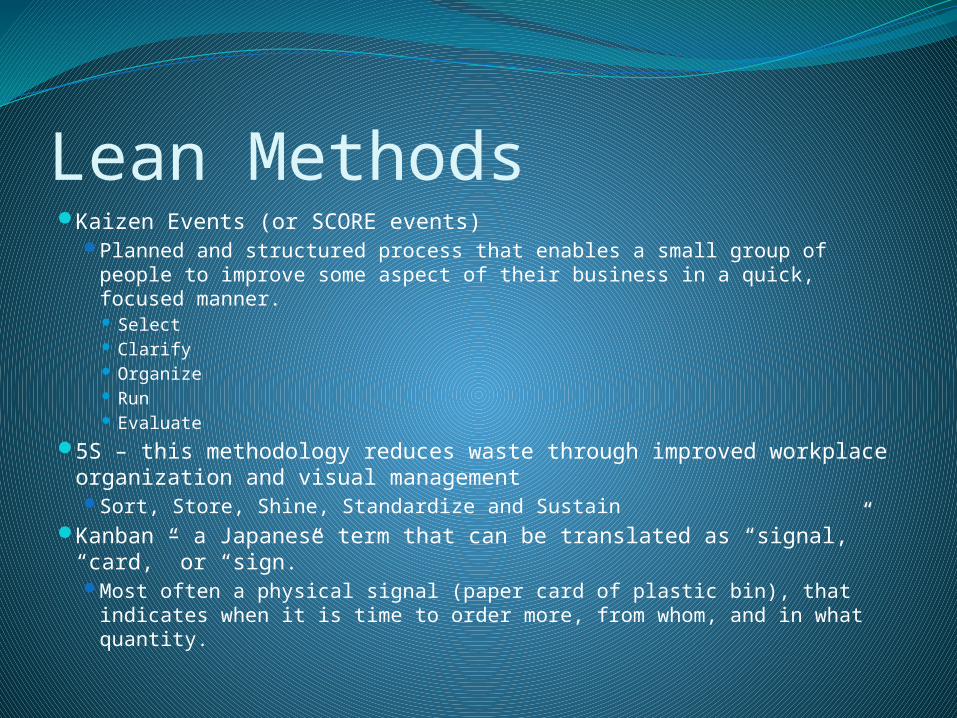
Lean MethodsKaizen Events (or SCORE events)
Planned and structured process that enables a small group of people to improve some aspect of their business in a quick, focused manner. Select Clarify Organize Run Evaluate
5S – this methodology reduces waste through improved workplace organization and visual management Sort, Store, Shine, Standardize and Sustain
Kanban – a Japanese term that can be translated as “signal,” “card,” or “sign.” Most often a physical signal (paper card of plastic bin), that indicates
when it is time to order more, from whom, and in what quantity.
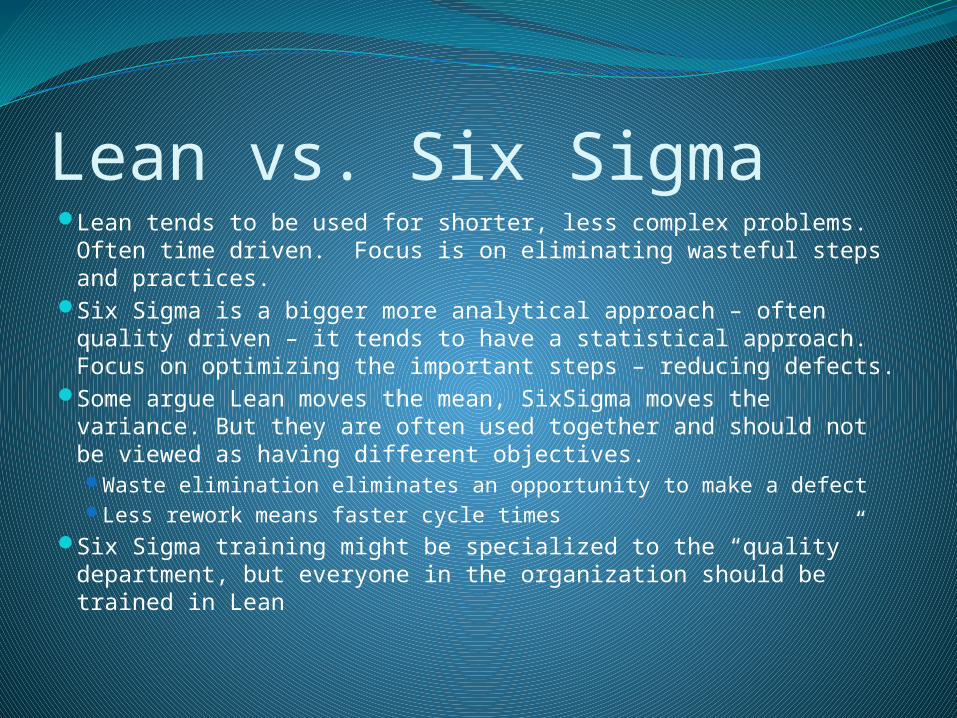
Lean vs. Six SigmaLean tends to be used for shorter, less complex problems.
Often time driven. Focus is on eliminating wasteful steps and practices.
Six Sigma is a bigger more analytical approach – often quality driven – it tends to have a statistical approach. Focus on optimizing the important steps – reducing defects.
Some argue Lean moves the mean, SixSigma moves the variance. But they are often used together and should not be viewed as having different objectives.Waste elimination eliminates an opportunity to make a defectLess rework means faster cycle times
Six Sigma training might be specialized to the “quality” department, but everyone in the organization should be trained in Lean
L6s
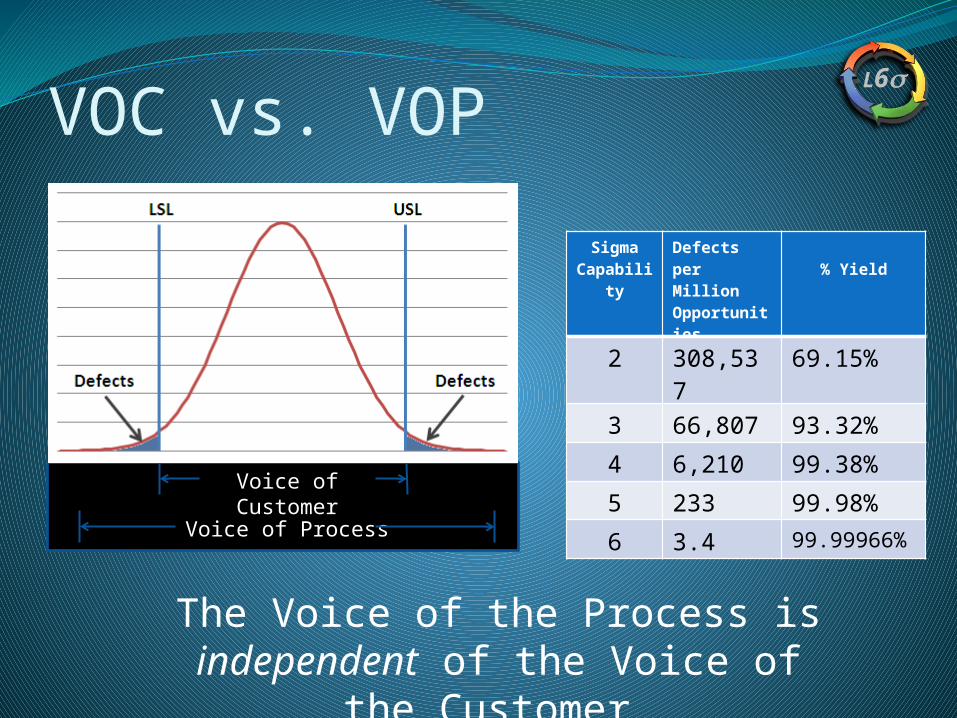
VOC vs. VOP
Voice of Customer
Voice of Process
The Voice of the Process is independent of the Voice of the
Customer
SigmaCapabili
ty
Defects per Million Opportunities
% Yield
2 308,537 69.15%3 66,807 93.32%4 6,210 99.38%5 233 99.98%6 3.4 99.99966%
L6s
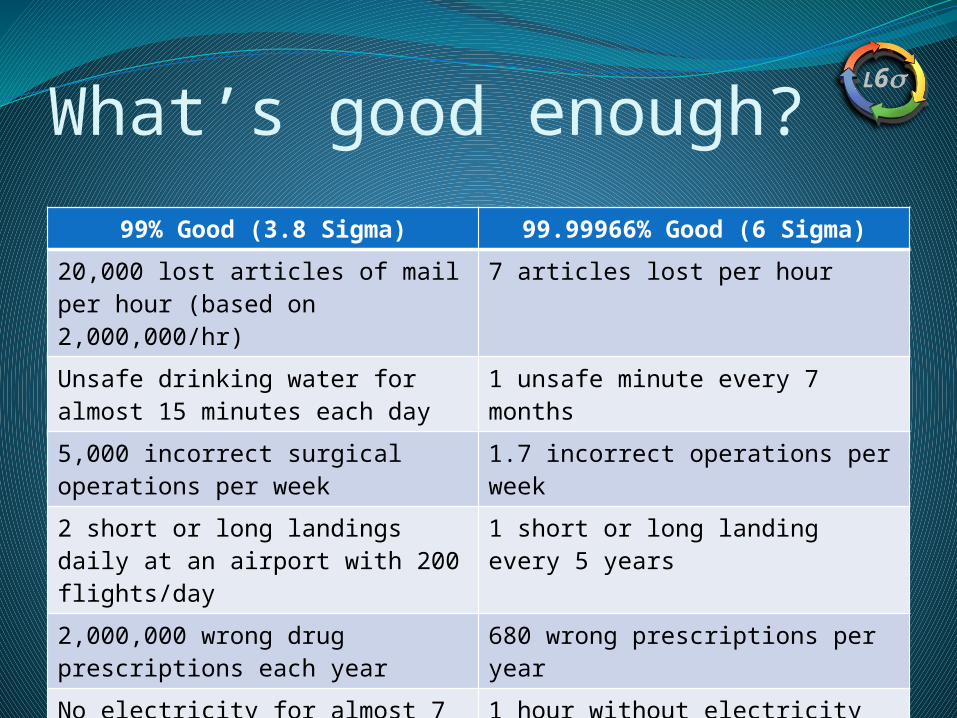
What’s good enough?99% Good (3.8 Sigma) 99.99966% Good (6 Sigma)
20,000 lost articles of mail per hour (based on 2,000,000/hr)
7 articles lost per hour
Unsafe drinking water for almost 15 minutes each day
1 unsafe minute every 7 months
5,000 incorrect surgical operations per week
1.7 incorrect operations per week
2 short or long landings daily at an airport with 200 flights/day
1 short or long landing every 5 years
2,000,000 wrong drug prescriptions each year
680 wrong prescriptions per year
No electricity for almost 7 hours each month
1 hour without electricity every 34 years
L6s
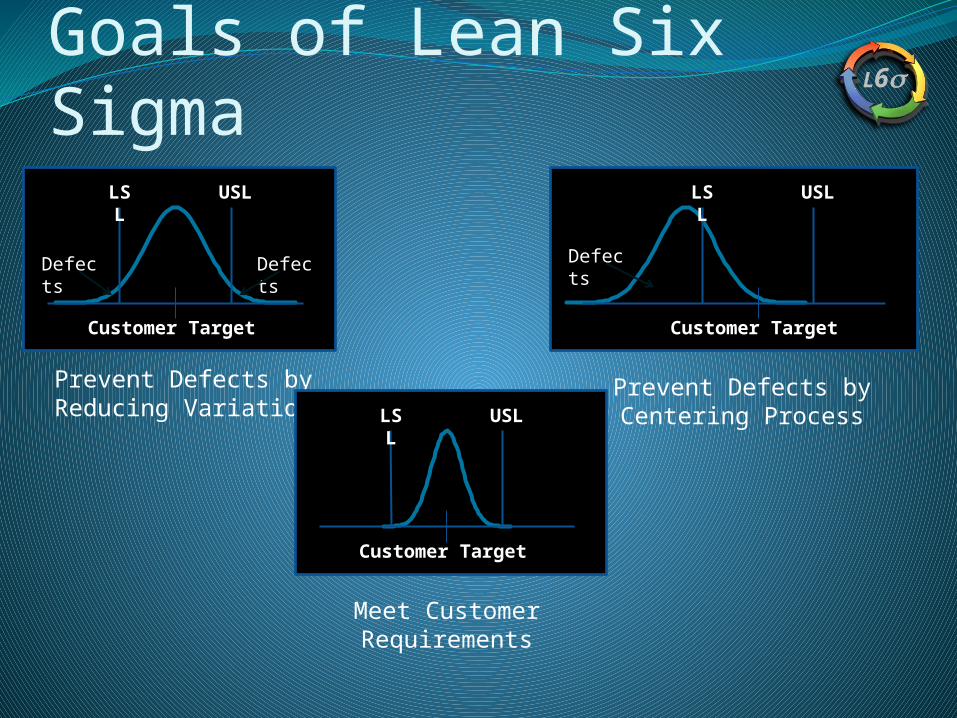
Goals of Lean Six SigmaLSL
USL
Customer Target
Defects
Defects
Prevent Defects byReducing Variation
LSL
USL
Customer Target
Defects
Prevent Defects byCentering ProcessLS
LUSL
Customer Target
Meet Customer Requirements
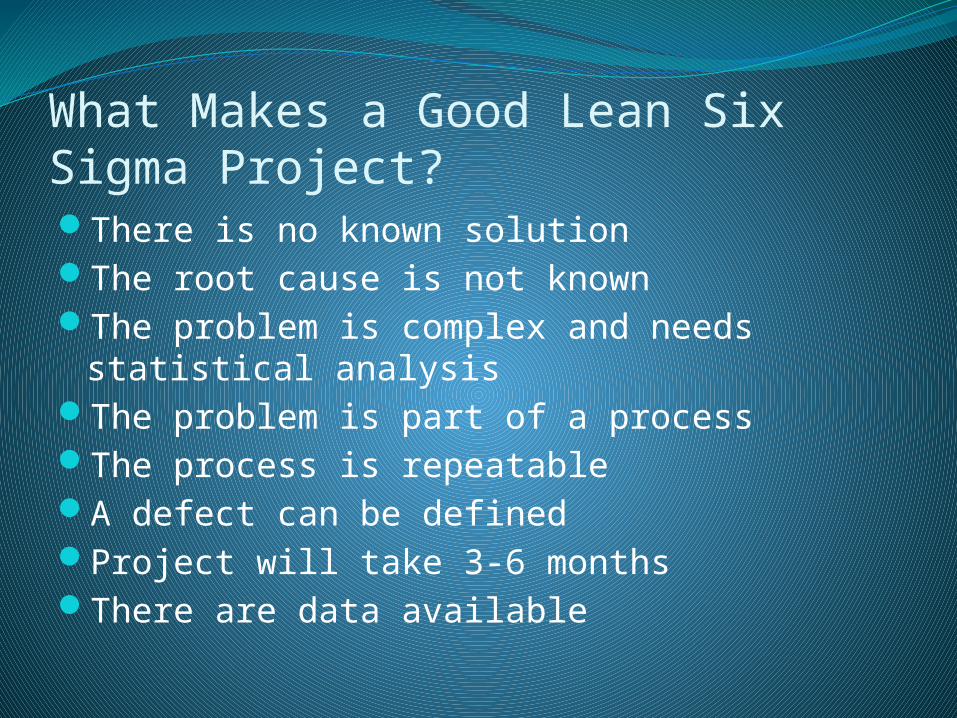
What Makes a Good Lean Six Sigma Project?There is no known solutionThe root cause is not knownThe problem is complex and needs statistical
analysisThe problem is part of a processThe process is repeatableA defect can be defined Project will take 3-6 monthsThere are data available
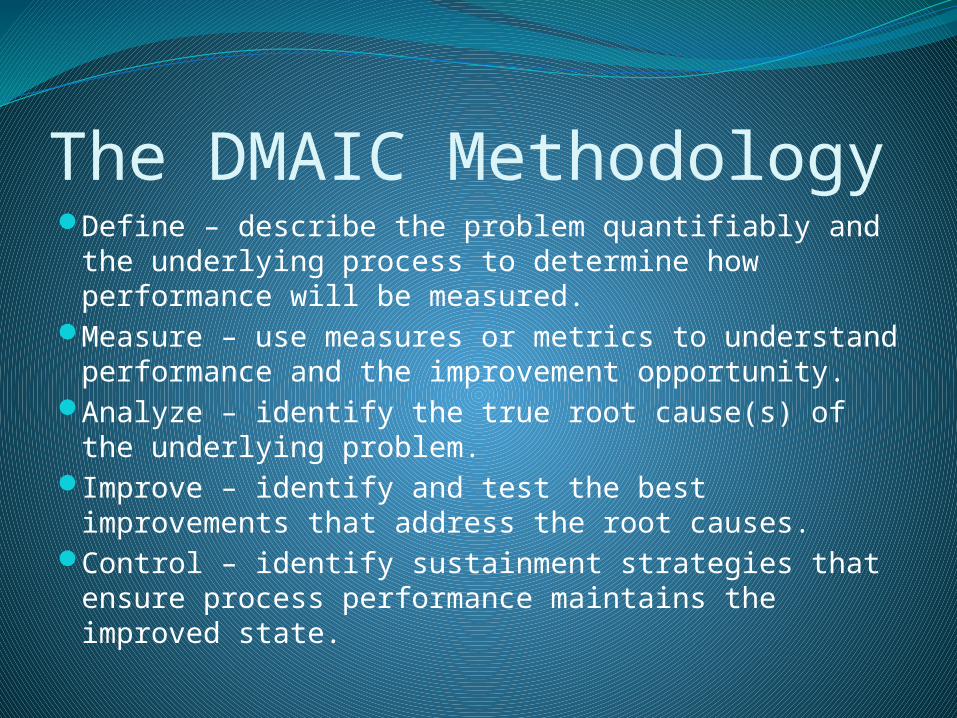
The DMAIC MethodologyDefine – describe the problem quantifiably and the
underlying process to determine how performance will be measured.
Measure – use measures or metrics to understand performance and the improvement opportunity.
Analyze – identify the true root cause(s) of the underlying problem.
Improve – identify and test the best improvements that address the root causes.
Control – identify sustainment strategies that ensure process performance maintains the improved state.
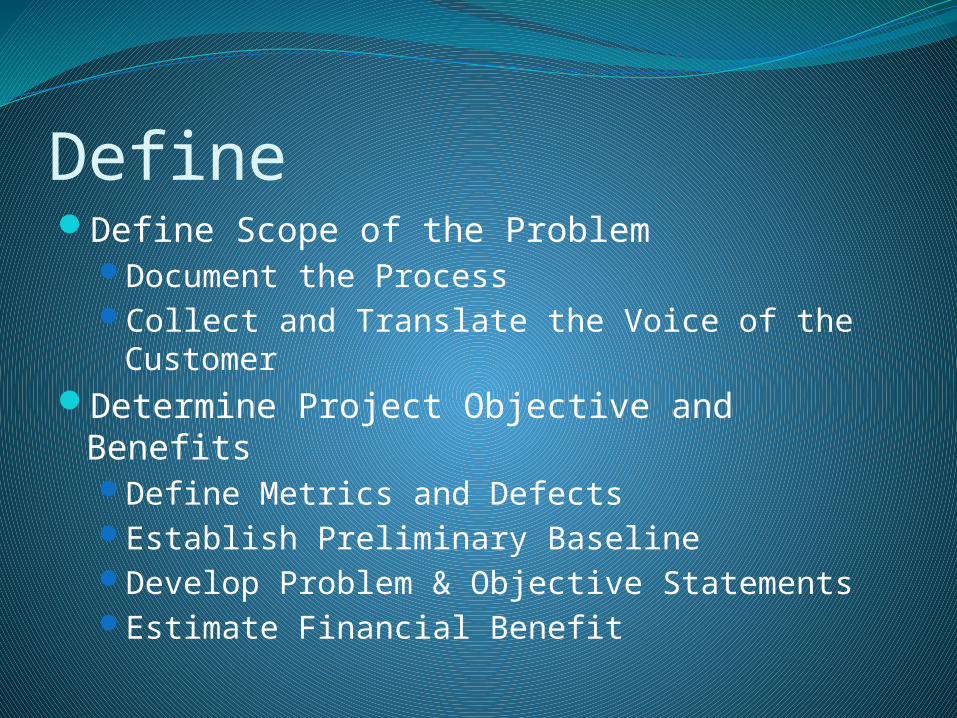
DefineDefine Scope of the Problem
Document the ProcessCollect and Translate the Voice of the
CustomerDetermine Project Objective and Benefits
Define Metrics and DefectsEstablish Preliminary BaselineDevelop Problem & Objective StatementsEstimate Financial Benefit
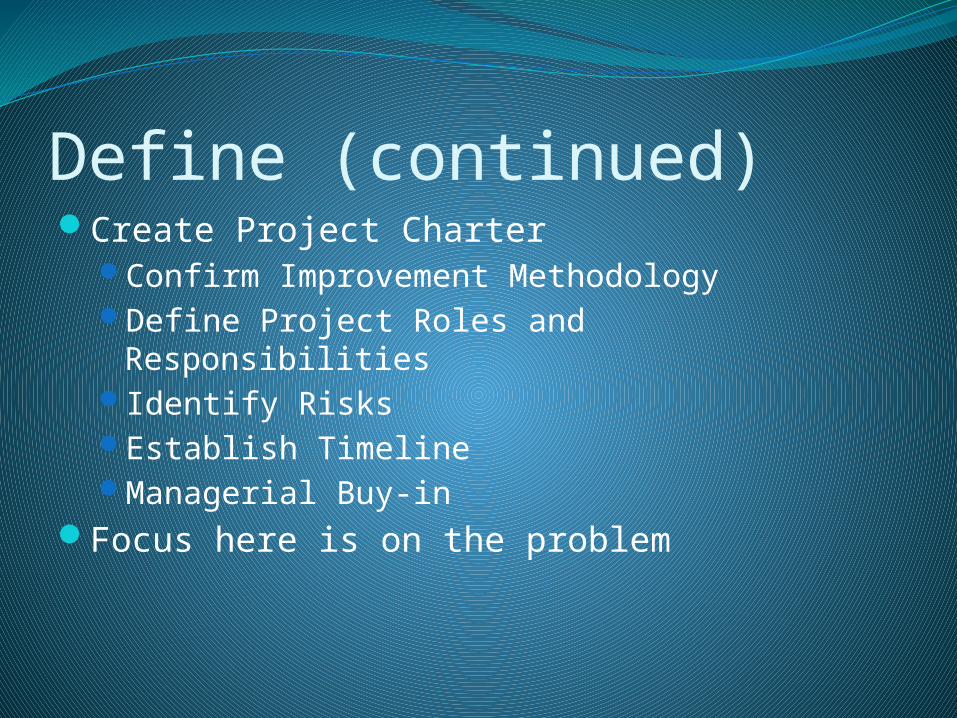
Define (continued)Create Project Charter
Confirm Improvement MethodologyDefine Project Roles and ResponsibilitiesIdentify RisksEstablish TimelineManagerial Buy-in
Focus here is on the problem
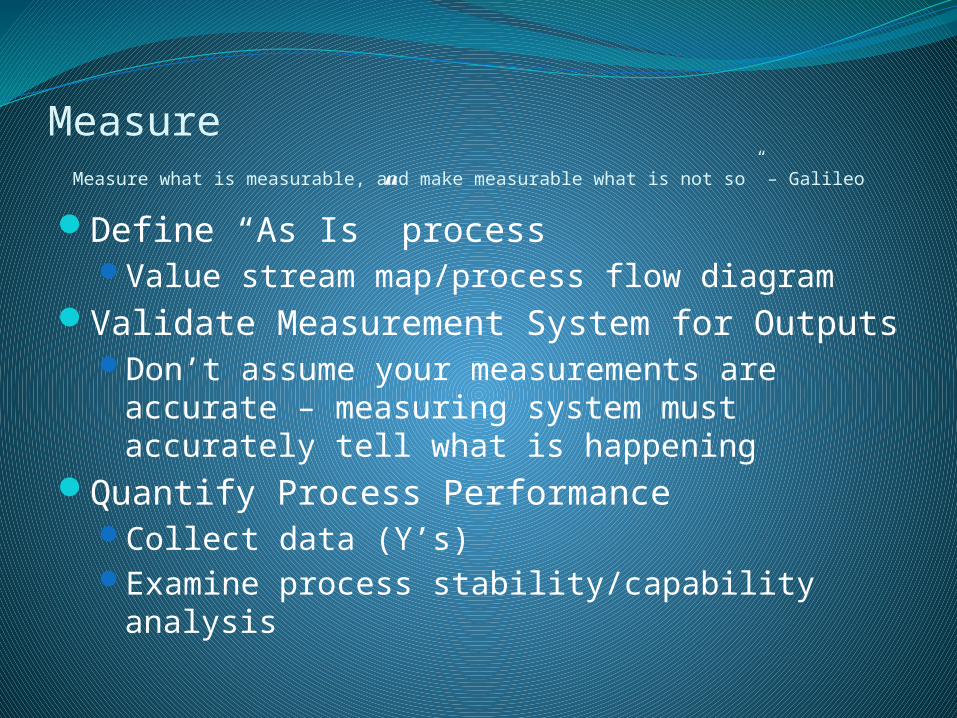
Measure Measure what is measurable, and make measurable what is not so” – Galileo
Define “As Is” processValue stream map/process flow diagram
Validate Measurement System for OutputsDon’t assume your measurements are accurate
– measuring system must accurately tell what is happening
Quantify Process PerformanceCollect data (Y’s)Examine process stability/capability analysis
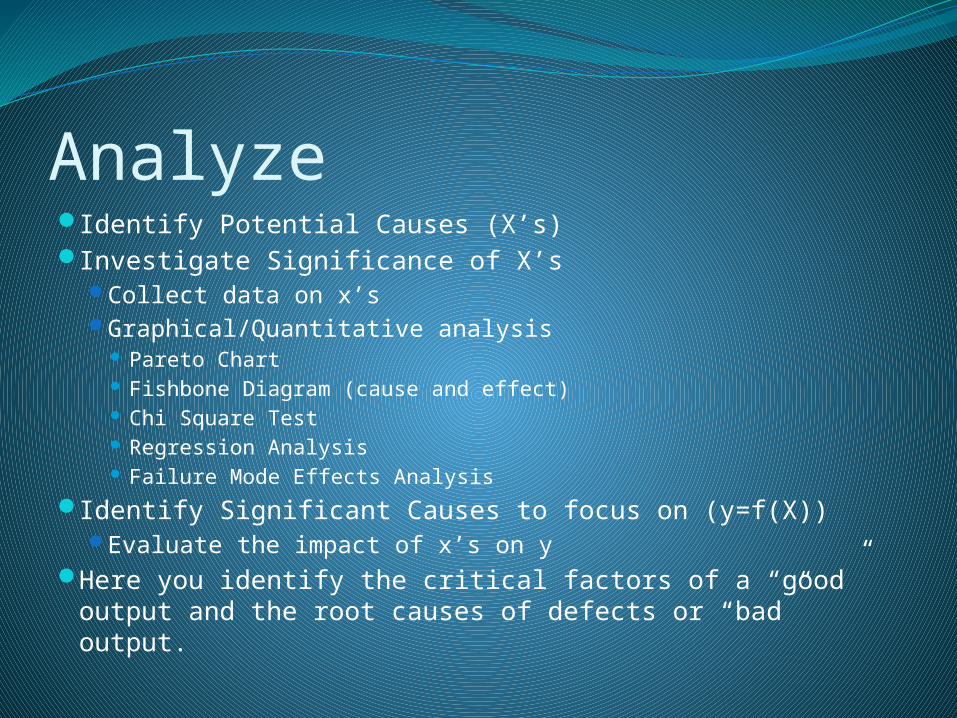
AnalyzeIdentify Potential Causes (X’s)Investigate Significance of X’s
Collect data on x’sGraphical/Quantitative analysis
Pareto Chart Fishbone Diagram (cause and effect) Chi Square Test Regression Analysis Failure Mode Effects Analysis
Identify Significant Causes to focus on (y=f(X))Evaluate the impact of x’s on y
Here you identify the critical factors of a “good” output and the root causes of defects or “bad” output.
ImproveGenerate Potential SolutionsSelect & Test SolutionDevelop Implementation Plan
ControlCreate Control & Monitoring Plan
Mistake proof the processDetermine the x’s to control and methodsDetermine Y’s to monitor
Implement Full Scale SolutionRevise/develop processImplement and evaluate solution
Finalize TransitionDevelop transition planHandoff process to owner