an introduction to liquid chromatography-mass … · larly appropriate for the analysis of bulk...
TRANSCRIPT
33
Phytochem. Anal. 2010, 21, 33–47 Copyright © 2009 John Wiley & Sons, Ltd.
Review
(www.interscience.wiley.com) DOI 10.1002/pca.1187
An Introduction to Liquid Chromatography–Mass Spectrometry Instrumentation Applied in Plant Metabolomic Analyses†
J. William Allwooda* and Royston Goodacrea,b
ABSTRACT: Over the past decade the application of non-targeted high-throughput metabolomic analysis within the plant sciences has gained ever increasing interest and has truly established itself as a valuable tool for plant functional genomics and studies of plant biochemical composition. Whilst proton nuclear magnetic resonance (1H-NMR) spectroscopy is particu-larly appropriate for the analysis of bulk metabolites and gas chromatography mass spectrometry (GC-MS) to the analysis of volatile organic compounds (VOC’s) and derivatised primary metabolites, liquid chromatography (LC)-MS is highly applicable to the analysis of a wide range of semi-polar compounds including many secondary metabolites of interest to plant research-ers and nutritionists. In view of the recent developments in the separation sciences, leading to the advent of ultra high per-formance liquid chromatography (UHPLC) and MS based technology showing the ever improving resolution of metabolite species and precision of mass measurements (sub-ppm accuracy now being achievable), this review sets out to introduce the background and update the reader upon LC, high performance (HP)LC and UHPLC, as well as the large range of MS instruments that are being applied in current plant metabolomic studies. As well as covering the theory behind modern day LC-MS, the review also discusses the most relevant metabolomics applications for the wide range of MS instruments that are currently being applied to LC. Copyright 2009 John Wiley & Sons, Ltd.
Keywords: plant; metabolomics; high performance liquid chromatography (HPLC); ultra high performance (UHP)LC; mass spectrometry (MS)
* Correspondence to: J. W. Allwood, School of Chemistry, Manchester Interdisciplinary Biocentre, University of Manchester, 131 Princess Street, Manchester M1 7DN, UK. E-mail: [email protected]
a School of Chemistry, Manchester Interdisciplinary Biocentre, University of Manchester, 131 Princess Street, Manchester M1 7DN, UK
b Manchester Centre for Integrative Systems Biology (MCISB), Manchester Interdisciplinary Biocentre, University of Manchester, 131 Princess Street, Manchester, M1 7DN, UK
† This article is published in Phytochemical Analysis as a special issue on Metabolomics in Plant and Herbal Medicine Research, edited by Young Hae Choi, Hye Kyong Kim and Robert Verpoorte, all from Leiden University in the Netherlands.
Untargeted Plant Metabolomics and the Potential of Liquid Chromatography Mass SpectrometryMetabolomics has proven to be a valuable tool for the compre-hensive profi ling of plant derived samples for the study of plant systems (Fiehn et al., 2000; Ratcliff e and Shachar-Hill, 2001; Catchpole et al., 2005; Krishnan et al., 2005; von Roepenack-Lahaye et al., 2004; Moco et al., 2006) and natural products research (Dixon and Sumner, 2003; Ketchum et al., 2003; Pauli et al., 2005), especially when combined with chemometric data analysis approaches (Goodacre et al., 2004; Jonsson et al., 2004; van der Greef and Smilde, 2005; Goodacre, 2007). Plants provide a great challenge in metabolomics due to the rich chemical diver-sity of metabolites that they possess across a huge range of con-centrations; estimates of 100000–200000 metabolites have been made for the plant kingdom (Oksman-Caldentey and Inzé, 2004). Currently no single analytical method or combination of analyti-cal methods (i.e. chromatography combined with mass spec-trometry (MS) or nuclear magnetic resonance (NMR) spectroscopy is capable of detecting all metabolites within a given biological sample (Sumner et al., 2003; Hall, 2006; Allwood et al., 2008). Over the past decade many methods for the high-throughput metab-olomic analysis of plant derived samples have been established for gas chromatography combined with MS (GC-MS; Fiehn et al., 2000; Fernie et al., 2004; Lisec et al., 2006), direct injection mass spectrometry (DIMS; Goodacre et al., 2003; Catchpole et al., 2005; Allwood et al., 2006), liquid chromatography MS (LC-MS; Tolstikov
et al., 2003; Jander et al., 2004; von Roepenack-Lahaye et al., 2004; Vorst et al., 2005; Moco et al., 2006; Rischer et al., 2006; De Vos et al., 2007), capillary electrophoresis MS (CE-MS; Sato et al., 2004), and 1H-NMR (Ratcliff e and Shachar-Hill, 2001; Le Gall et al., 2003; Ward et al., 2003; Choi et al., 2004, 2006).
1H-NMR has proven to be an appropriate tool for untargeted plant metabolomics, especially where studies focus upon samples that contain highly abundant bulk metabolite species, for example sugars in fruits (Biais et al., 2009). 1H-NMR has the advantage that it produces signals that correlate directly and linearly with compound abundance (Lewis et al., 2007), although for many studies it lacks the sensitivity required to obtain infor-mation on low-level metabolites that can alternatively be
Received: 28 August 2009; Revised: 6 October 2009; Accepted: 6 October 2009 Published online in Wiley Interscience: 19 November 2009

J. W. Allwood and R. Goodacre
www.interscience.wiley.com/journal/pca Copyright © 2009 John Wiley & Sons, Ltd. Phytochem. Anal. 2010, 21, 33–47
34
provided by MS based approaches. DIMS provides a rapid (∼2 min per sample) metabolite fi ngerprint (Goodacre et al., 2003; Allwood et al., 2006), which has proven to be valuable for a fi rst-round screen of material (indicating robust sample growth, collection and extraction methods) prior to more expensive and time-consuming chromatography combined with MS approaches (Catchpole et al., 2005). DIMS is also gaining in popularity with the advent of high-resolution and -precision Fourier transform ion cyclotron resonance (FT-ICR)-MS instruments (Aharoni et al., 2002; Hirai et al., 2004; Southam et al., 2007), although without the application of chromatography, DIMS alone cannot resolve isobaric metabolites. GC-MS has proven to be a robust and repro-ducible tool for the study of volatile organic compounds (VOCs; Li et al., 2006, 2008; Zhang and Li, 2007; Riazanskaia et al., 2008) as well as a range of largely primary metabolites made amenable to GC-MS detection via the addition of volatile trimethylsyl (TMS) groups by N-methyl-N-trifl uoroacetamide (MSTFA) based deriva-tisation (Fiehn et al., 2000; Fernie et al., 2004; Lisec et al., 2006; Biais et al., 2009; Allwood et al. 2009). LC-MS alternatively does not necessitate the prior derivatisation of samples to make metabolite groups of interest amenable to detection and has been shown to be appropriate for the detection of a wide range of metabolite classes (De Vos et al., 2007).
It is predicted that LC-MS-based approaches will be of particu-lar importance for non-targeted plant metabolomics, largely owing to the plant kingdoms’ rich metabolite diversity. Plant metabolism embodies a huge range of semi-polar compounds, including many key groups of secondary metabolites, which are best separated and detected by LC-MS approaches (Tolstikov et al., 2003; von Roepenack-Lahaye et al., 2004; Dixon et al., 2006; Hall, 2006; Moco et al., 2006; De Vos et al., 2007). MS-based tech-niques which are applicable to LC are also undergoing continual development, showing ever improving levels of mass resolution and precision and thus aiding metabolite detection and identifi -cation greatly (Kind and Fiehn, 2007; Draper et al., 2009). Plant-derived secondary metabolites have already been shown to be of phenotypic and physiological importance, for example, pro-tective properties in disease or stress scenarios (Allwood et al., 2006, 2008; Jansen et al., 2009), antioxidant properties, colour and fl avour characteristics (Beekwider et al., 2005; Dixon et al., 2006). Such quality traits of plant materials are commonly related to a delicate balance of various mixtures of metabolites from diverse related and unrelated metabolite groups as opposed to a small number of key biomarker metabolites. As a result, untar-geted LC-MS-based metabolomics approaches will be of huge value to better understand the complexity of plant metabolism, to detect and identify which metabolic components contribute the most highly to key phenotypic and physiological traits, and how the biosynthesis of such components is controlled (DeVos et al., 2007). This review, largely aimed towards scientists new to or unfamiliar with the plant metabolomics fi eld and/or analytical chemistry, aims to give an introduction to, the background of LC, high-performance (HP)LC and ultra-high-performance (UHP)LC, as well as the large range of MS instruments that may be applied to LC for metabolomic analysis.
An Introduction to Liquid ChromatographyLiquid chromatography (LC) defi ned in its simplest terms can be regarded as the separation of components of a mixture based upon the rates at which they elute from a stationary phase
typically over a mobile phase gradient. Diff ering affi nities of the mixtures components for the stationary and mobile phases leads to their separation, since certain components will be more attracted to the mobile phase and will elute quickly whilst others will be retained by the stationary phase for longer and therefore will elute more slowly, i.e. have a later retention time (RT). The simplest forms of LC are based upon the separation of a sample’s components either on paper with a solvent, known as paper chromatography, or on a thin layer of stationary phase coated onto a slide which is placed in solvent—thin-layer chromatogra-phy (TLC). Column chromatography-based LC, a much more powerful technique than the planar paper chromatography and TLC methods, and with a greater sample capacity, was fi rst cred-ited to Mikhail S. Tswett, a Russian-born botanist who in the early 1900s successfully separated plant pigments from a complex extract using a basic calcium carbonate and alumina-packed glass column stationary phase and liquid solvent mobile phase (Ettre and Sakodynskii, 1992).
For column chromatography, fl ow of the mobile phase solvent is achieved in several ways. Gravity or a vacuum may be used where columns are not designed to withstand high pressures, as with the open glass columns employed by Tswett. Such columns employ large-diameter solid-phase particles (>50 µm), so that there is less resistance to fl ow and less chance of building up pressure (Novakova et al., 2006). One modern day application of this technique is solid-phase extraction (SPE), where typically a plastic cartridge is packed with particles which a liquid sample is passed through under vacuum-assisted fl ow. Diff erent SPE packing materials have diff ering affi nities towards certain classes or polarities of compound, so that SPE cartridges are available for the removal of specifi c small molecules from samples, for example SPE for the removal of free sugars (Suzuki et al., 2002). By employ-ing smaller solid-phase particle sizes (<10 µm), improved chro-matographic separation can be achieved due to the overall greater solid-phase surface area, improving compound retention (Novakova et al., 2006); however, due to smaller particles having a greater fl ow resistance, there is a need for greater pressures to drive the liquid mobile phase solvent through the column. Thus high pressure pumps and columns packed within metal casing are employed to create and withstand the high pressures neces-sary for the technique known as high-performance (HP) LC (Horváth et al., 1981; Snyder et al., 1997; Meyer, 2004).
Column chromatography in its simplest form may employ a mobile phase of constant single composition in a procedure termed isocratic elution. A disadvantage of isocratic elution is that peak width increases with RT according to the equation for the number of theoretical plates, thus leading to peak broadening and fl attening for late eluting peaks. In a later devel-opment known as gradient elution, the mobile phase com-position is altered during the chromatographic separation process. For example, a polar elution gradient may begin with 5% acetonitrile or methanol in water and end with 95% acetoni-trile or methanol in water; a nonpolar gradient may employ solvents such as toluene (Snyder et al., 1997). In reverse-phase HPLC employing typical silica-C18 based columns, the two mobile phase components are referred to as solvent ‘A’ and ‘B’, ‘A’ typically being a highly aqueous solvent which elutes sample compo-nents from the stationary phase slowly, while ‘B’ is typically a highly organic solvent which rapidly elutes sample components off the column’s stationary phase. By starting the elution with 100% A and 0% B, then step-wise increasing the percentage of B over time until 100% B is reached, an elution gradient is achieved.
LC-MS Instrumentation Employed in Plant Metabolomics
Phytochem. Anal. 2010, 21, 33–47 Copyright © 2009 John Wiley & Sons, Ltd. www.interscience.wiley.com/journal/pca
35
The increasing organic composition of the mobile phase dis-places the stationary phase’s retention of the late eluting sample components, thus preventing peak broadening and fl attening, as well as reducing peak tailing eff ects (Snyder et al., 1997; Meyer, 2004). The elution gradient steps and time periods between them can be optimised for specifi c plant matrices so that the maximum number of components can be resolved within a reasonable analysis time that lends itself to high sample throughput.
There are many diff erent variations of LC which are largely dependent on the stationary phase chemistry. The simplest forms of LC thus far discussed, paper chromatography and TLC, are categorised as partition chromatography methods, here a solvent is retained on or within the stationary phase, thus sample components are retained by equilibrium between the liquid stationary and liquid mobile phases (Hao et al., 2008). Hydrophilic interaction chromatography (HILIC) is a modern example of normal-phase partition chromatography applied in HPLC; here polar analytes diff use into a bonded polar stationary phase (being more polar than the mobile phase) the interaction between which depends upon an analyte polarity dictated by the various functional groups that the analyte possesses (Hao et al., 2008; Cubbon et al., 2009). By starting the gradient elution with a highly organic mobile phase solvent, the non-polar metabolites elute rapidly, whereas the retention of polar metab-olites is maximised. Thus, HILIC is particularly appropriate for the analysis of polar metabolites but until recently has been largely redundant in metabolomics due to a lack of column stationary phase stability and robustness; however, with the recent improvements being made in column chemistry stability, the development of robust HILIC analytical methods for HPLC and UHPLC is currently an ongoing focus (Hao et al., 2008; Cubbon et al., 2009).
Adsorption chromatography was another early development in LC and as the name suggests involves the adsorption of a samples components or metabolites directly onto a solid station-ary phase, the retention of which again is related to the metabo-lite and stationary phase polarities (Horváth et al., 1981; Snyder et al., 1997; Meyer, 2004). Adsorption chromatography typically employs silica packed columns, the silica stationary phase particles possess R groups which can be polar (e.g. amine or nitrile groups) or nonpolar hydrocarbons (e.g. C8H17 or C18H37). Adsorption chromatography is further divided into two sub-categories: (i) normal-phase liquid chromatography (NP-LC), which employs polar stationary phase materials and so by start-ing the gradient elution with a non-polar mobile phase solvent, the non-polar metabolites elute fi rst; (ii) reversed-phase liquid chromatography (RP-LC), which employs non-polar stationary phase materials and so by starting the gradient elution with a highly polar aqueous mobile phase solvent, the most polar metabolites elute fi rst; by increasing the mobile phase organic composition with solvents such as methanol or acetonitrile, the retention of non-polar compounds to the column is weakened (i.e. separation on the basis of hydrophobicity) and thus they elute at later RTs (Snyder et al., 1997; Meyer, 2004). RP-LC has been and still is the most commonly employed method in metabolo-mics due to the high stability off ered by the silica-C8H17/C18H37 stationary phase materials, robust analytical methodologies have also been developed by several plant research groups (Tolstikov et al., 2003; von Roepenack-Lahaye et al., 2004; Rischer et al., 2006; De Vos et al., 2007); therefore this review will focus upon the analysis of semi-polar plant metabolites with RP-LC.
High-performance Liquid Chromatography, Increasing Its Effi ciency, and the Development of Ultra-high-performance Liquid ChromatographyThe technique known as HPLC was fi rst coined by C. Horváth in 1970, who by combining high pressure pumps (∼500 psi) and strengthened packed columns, created the high pressures and strengths of column necessary for the technique then known as high-pressure LC. Tremendous leaps in technology were seen over the following decade with new instruments being produced that could develop ∼6000 psi of pressure and which directly incorporated injector systems, detectors and columns. By com-bining improved instruments with improved column chemistries (smaller particles and higher pressures), improved separations were achieved, therefore the technique was re-coined as high-performance liquid chromatography, thus preserving the origi-nal HPLC acronym (Horváth et al., 1981). HPLC is now one of the most widely used tools in analytical chemistry, having been applied to the analysis of a huge range of samples from across science and industry. Almost any compound that dissolves in liquid can be analysed, even in trace concentrations as low as parts per trillion (Snyder et al., 1997; Meyer, 2004).
The components of a basic HPLC system are shown in Fig. 1A. The HPLC consists of solvent reservoirs, one for each of the mobile phase eluents (solvent A and B), as well as further reser-voirs for autosampler syringe and line washes. A high-pressure pump forms the solvent delivery system, which generates and meters a specifi ed fl ow rate (typically millimetres per min). A solvent partitioning valve allows the mixing of solvents A and B at specifi ed ratios and time gaps, thus permitting the operator to programme the HPLC to perform gradient elution steps (Meyer, 2004). To commence the HPLC cycle of a single sample analysis, the HPLC system fi rst introduces 100% solvent A (e.g. 5% aqueous acetonitrile acidifi ed for control of pH with 0.1% formic acid); an autosampler injector system introduces the sample to the mobile phase stream and is carried to the HPLC column (Fig. 1B). High-pressure tubing and fi ttings are used to interconnect the pump, autosampler injector system, column, and detector(s), thus forming a conduit for the sample, mobile phase, and separated sample components. In the case of RP-HPLC, the column is packed typically with silica–C18H37 particles to act as a non-polar retaining stationary phase. At an appropriate time point during the HPLC separation (which is sample matrix-dependent and must be optimised to allow for the elution of the maximum number of polar sample components), solvent B (e.g. 95% aqueous acetonitrile acidifi ed with 0.1% formic acid) is intro-duced to the mobile phase in increasing ratios in an incremental manner, thus the increasing organic content of the solvent leads to the elution of the retained non-polar compounds from the stationary phase (Fig. 1C). The elution gradient continues until 100% solvent B is reached; this mobile phase composition is maintained for a fi nal hold period. Throughout the chromato-graphic run a detector is recording the signal of the eluted sample components, the signal is amplifi ed and delivered to a computer where it is processed and displayed as a chromato-gram. In the case of hyphenated HPLC approaches, the eluting sample components are further delivered to a linked detector such as a mass spectrometer for in-depth characterisation. There are a huge range of various detectors that may be linked to HPLC, some of which will be discussed later; HPLC can also be linked to

J. W. Allwood and R. Goodacre
www.interscience.wiley.com/journal/pca Copyright © 2009 John Wiley & Sons, Ltd. Phytochem. Anal. 2010, 21, 33–47
36
(A)
(B)
(C)
(D)
Line wash
Syringe wash
A B
Pumps
Solvent proportioning
valveFlow valve
and monitor
Auto sampler injector
DetectorHPLC / UHPLCColumn
Personal Computer
Waste
Secondary Detector :UV / Vis MSNMR
Chromatogram
Solvent A 5% Aq Acetonitrile + 0.1% Formic acidSolvent B 95% Aq Acetonitrile + 0.1% Formic acid
Plant sample introduced to mobile phase
Polar metabolites elute
Line
washSyringe
washA B
DetectorHPLC / UHPLCColumn
Personal Computer
Waste
Secondary Detector :UV / Vis MSNMR
Chromatogram
Non-polar metabolites elute
Line
washSyringe
washA B
DetectorHPLC / UHPLCColumn
Personal Computer
Waste
Secondary Detector :UV / Vis MSNMR
Chromatogram
Line
washSyringe
washA B
DetectorHPLC / UHPLCColumn
Personal Computer
Waste
Secondary Detector :UV / Vis MSNMR
ChromatogramSystem Purge
LC-MS Instrumentation Employed in Plant Metabolomics
Phytochem. Anal. 2010, 21, 33–47 Copyright © 2009 John Wiley & Sons, Ltd. www.interscience.wiley.com/journal/pca
37
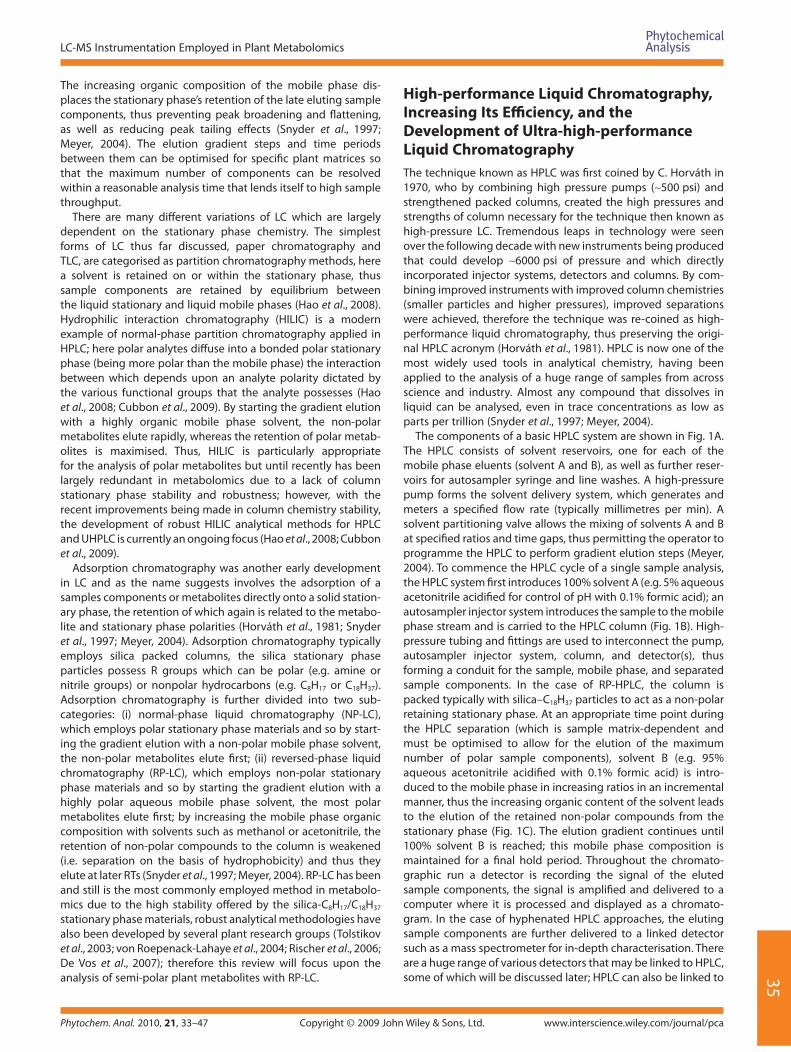
fraction collection systems for purifi ed sample preparation. At the end of the HPLC cycle the system purges itself with clean fl ow solvents, undertakes the syringe and line washes and equili-brates the starting mobile phase composition (Fig. 1D), thus returning the system to a background state clear of the previ-ously analysed sample and ready to commence the cycle for the analysis of the next sample. The excess fl ow and wash solvents created throughout the HPLC cycle are delivered to a waste solvent reservoir. Providing that a compound within a sample can be cleanly chromatographically resolved and does not have overlapping peaks from other sample components, it can be iso-lated and potentially identifi ed. This is achieved by matching the RT of the compound within the sample to the RT that a pure standard of the same compound elutes at under the same chro-matographic conditions. By constructing a calibration curve based upon the detected chromatographic peak areas for the pure compound serially diluted across a concentration series, the unknown concentration of the compound within the sample can be quantifi ed by its detected peak area (Fig. 2) (Kimura and Rodriguez-Amaya, 2002; Allwood et al., 2006). However, for the analysis of complex metabolomics samples there are many co-eluting peaks which can prevent identifi cation and quantifi ca-tion in this manner, thus MS is employed to perform these tasks (Tolstikov et al., 2003).
Thus far this section has largely focused upon the separation of compounds based upon three factors: the polarity of the sample compounds that are being analysed; the composition of the mobile phase; and the chemical properties of the stationary phase. However, there are several other parameters which all infl uence the effi ciency of HPLC separations and were utilised in the development of UHPLC. The fi rst of these parameters to be considered is column length; providing that a column bed is uniformly packed and stable, the chromatographic separation effi ciency is determined by the particle size and column length. Longer lengths of column enhance chromatographic separation, but at the expense of increased analysis times and system back pressure (Romanyshyn and Tiller, 2001). Smaller particle sizes lead to an increased surface area, thus improving compound retention and providing improved chromatographic separation at the expense of an increased pressure being required to drive the mobile phase (Nguyen et al., 2006; Novakova et al., 2006). The chromatographic separation effi ciency is commonly expressed as a theoretical plate value, with greater effi ciencies having greater theoretical plate values. The height equivalent to the theoretical plate (HETP) shows an inverse relationship to the theoretical plate value; thus as particle size decreases or column length increases, the column separation effi ciency increases and the HETP decreases (Fig. 3). Unfortunately, decreases in column
Figure 1. An illustration of high- and ultra-high-performance liquid chromatography instrumentation and the analysis of a single sample with reverse phase separation by hydrophobicity. (A) A simplifi ed illustration of high-performance liquid chromatography instrumentation. (B) Initially 100% solvent A (5% aqueous acetonitrile acidifi ed with 0.1% formic acid) is introduced to the system; the sample is injected into the mobile phase fl ow; solvent B (95% aqueous acetonitrile acidifi ed with 0.1% formic acid) is introduced to the mobile phase until a ratio of 70 : 30% solvent A : B is reached. Over this period polar components of the sample elute from the column and the signal is detected amplifi ed and sent to a personal computer. (C) Solvent B continues to be introduced to the mobile phase until the composition reaches 100% solvent B. Over this period the non-polar sample components, initially retained within the column when the mobile phase was highly aqueous, start to elute with the increasing strength of the organic solvent B. Once the mobile phase reaches a composition of 100% solvent B there is a fi nal hold period of typically several minutes, after which the system purges itself with clean solvents to remove all traces of the sample. The lines, column and autosampler components of the HPLC system are all purged and left clean, the mobile phase solvents are returned to starting equilibrium and the system is ready for the introduction of the next sample.�
Figure 2. An illustration of compound identifi cation and quantifi cation by high-performance liquid chromatography.

J. W. Allwood and R. Goodacre
www.interscience.wiley.com/journal/pca Copyright © 2009 John Wiley & Sons, Ltd. Phytochem. Anal. 2010, 21, 33–47
38
particle size result in greater system back pressures, as does increases in column length along with increased solvent con-sumption and sample analysis times (Romanyshyn and Tiller, 2001; Nguyen et al., 2006). In modern HPLC and UHPLC sub-2 µm particles are commonly employed to maximise the chromato-graphic resolution power along with short column lengths to reduce sample analysis times, backpressure, and solvent con-sumption (Novakova et al., 2006). The column’s internal diameter (i.d.) infl uences the selectivity of separation and detection sensi-tivity in gradient elution as well as determining the volume of sample that can be loaded. Large-i.d. columns (10 mm) are typically applied in industry and analytical-scale columns (i.d. 4.6 mm) for standard HPLC applications; narrow-bore columns (i.d. 1–2 mm) are commonly used in LC-MS applications since they off er greater sensitivity than the larger-i.d. columns, although they restrict the volume of sample that can be loaded (Snyder et al., 1997; Meyer, 2004). The fi nal signifi cant parameter is the pump pressure, which drives the mobile phase fl ow veloc-ity. Generally as fl ow velocity increases, the effi ciency of chro-matographic separation decreases, as does the analysis time, since the sample is being driven through the column more rapidly (Nguyen et al., 2006). This trend generally applies to columns that employ particle sizes of 3 µm and larger, however with sub-2 µm particles separation effi ciency is maintained with increasing mobile phase fl ow velocity (Fig. 3). By combining sub-2 µm particle short length columns and HPLC instrumenta-tion capable of generating and withstanding constant pressures up to 15000 psi and thus establishing highly stable mobile phase fl ow rates, the newly coined technique UHPLC was created (Novakova et al., 2006). Over conventional HPLC, UHPLC gives enhanced chromatographic separation, permitting resolution of chemical species not possible with HPLC and with faster analysis times and reduced use and waste of solvents. A further param-eter that can help reduce analysis times that is now being applied to UHPLC is operation at high temperatures (Gika et al., 2008). Both the column and mobile phase temperatures can be increased, which reduces mobile phase viscosity allowing opera-
tion at higher fl ow rates. For plant metabolomic analysis this may well cause problems due to the low thermal stability of both sample metabolites and stationary phase silica.
An Introduction to Mass Spectrometry InstrumentationMass spectrometry is just one of many varieties of detector that can be linked to HPLC or UHPLC. Alternative routes of detection that are commonly employed include visible radiation methods such as measuring light scattering or refractive index and absor-bance methods such as UV or fl uorescence spectroscopy and photodiode array (PDA) detection (Snyder et al., 1997; Meyer, 2004). These latter methods can be extremely useful for detect-ing certain classes of compound that either absorb UV or fl uo-resce (e.g. kaempferols, quercetins, spermidines); indeed PDA detectors have frequently been linked online to HPLC or UHPLC prior to MS in plant metabolomics studies to provide a further dimension to aid in the characterisation of the detected analyte species (HPLC/UHPLC-PDA-MS; Vorst et al., 2005; Moco et al., 2006; De Vos et al., 2007; Hanhineva et al., 2008). However, to acquire the volume of information from an analyte required for full structural elucidation, it is a necessity to employ MS and/or NMR spectroscopy detectors. A MS in simple terms functions to detect the mass-to-charge ratio (m/z) and abundance of the various analytes generated during ionisation of a sample extract or chromatographic fraction. Ionisation is a key step since ions are far more easily manipulated than neutral molecules. Unfortunately diff ering analytes vary in their ionisation effi cien-cies, i.e. the proportion of metabolite in solution converted to ions in the gas phase. Once ionised the mass analyser detects the ion abundance and m/z, which can be related back to the ana-lytes absolute molecular weight. A data system (run on a per-sonal computer) is responsible for the storage of the paired m/z and abundance values as well as their processing and display in a mass spectral format. The three principal components found in all varieties of MS are an ionisation source, a mass analyser and a detector; all three components are maintained under vacuum to optimise the transmission of ions to the analyser and detector (Niessen, 1998; Gross, 2004). The following sections will discuss the ionisation methods, mass analysers and detectors commonly applied in current LC-MS based metabolomics.
Sample introduction and ionisation methods employed in liquid chromatography–mass spectrometry-based metabolomics
Prior to ionisation, the sample must fi rst be introduced to the ionisation source. A probe is commonly employed in both LC- and GC-MS analyses. The sample is introduced either by manual direct infusion (DI) or via HPLC or UHPLC followed by DI, following which the sample is delivered to the probe via a capil-lary; the probe functions to translocate the liquid sample from the capillary to the needle of the ion source. Two ionisation sources are generally employed in LC-MS based metabolomics: electrospray ionisation (ESI) is the most commonly employed (Tolstikov et al., 2003; Jander et al., 2004; von Roepenack-Lahaye et al., 2004; Vorst et al., 2005; Moco et al., 2006; Rischer et al., 2006; De Vos et al., 2007; Hanhineva et al., 2008) and is particularly well suited to the ionisation of a wide range of metabolites including, drug compounds (Chen et al., 2007), amino and organic acids
0 2 4 6 8 10 12 140.00
5.00
10.00
15.00
20.00
25.00
30.00
35.00
Velocity (mm/sec)
HET
P (µ
m)
10 µm5 µm
3 µm
1.7 µm
Figure 3. The relationship between column stationary phase particle size, fl ow velocity and the height equivalent to the theoretical plate (HETP) value as an expression of chromatographic separation effi ciency. The lower the HETP, the greater the effi ciency of chromatographic separation. As linear velocity increases the effi ciency of conventional 3–10 µm stationary phase particles reaches an optimum and decreases. However, sub-2 µm particles reach a greater effi ciency and maintain it under increasing linear velocity.
LC-MS Instrumentation Employed in Plant Metabolomics
Phytochem. Anal. 2010, 21, 33–47 Copyright © 2009 John Wiley & Sons, Ltd. www.interscience.wiley.com/journal/pca
39
(Tolstikov and Fiehn, 2002), sugars and sugar alcohols (Tolstikov et al., 2003; Moco et al., 2006), sterols, steroids, phospholipids and fatty acids (Allwood et al., 2006); however atmospheric pressure chemical ionisation (APCI) is also an appropriate method, espe-cially for the ionisation of non-polar metabolite species such as phospholipids, fatty acids, sterols, steroids, certain esters and essential oils, one classic example in plant studies being the analysis of lipid soluble carotenoids (Dachtler et al., 2001; Schweiggert et al., 2005).
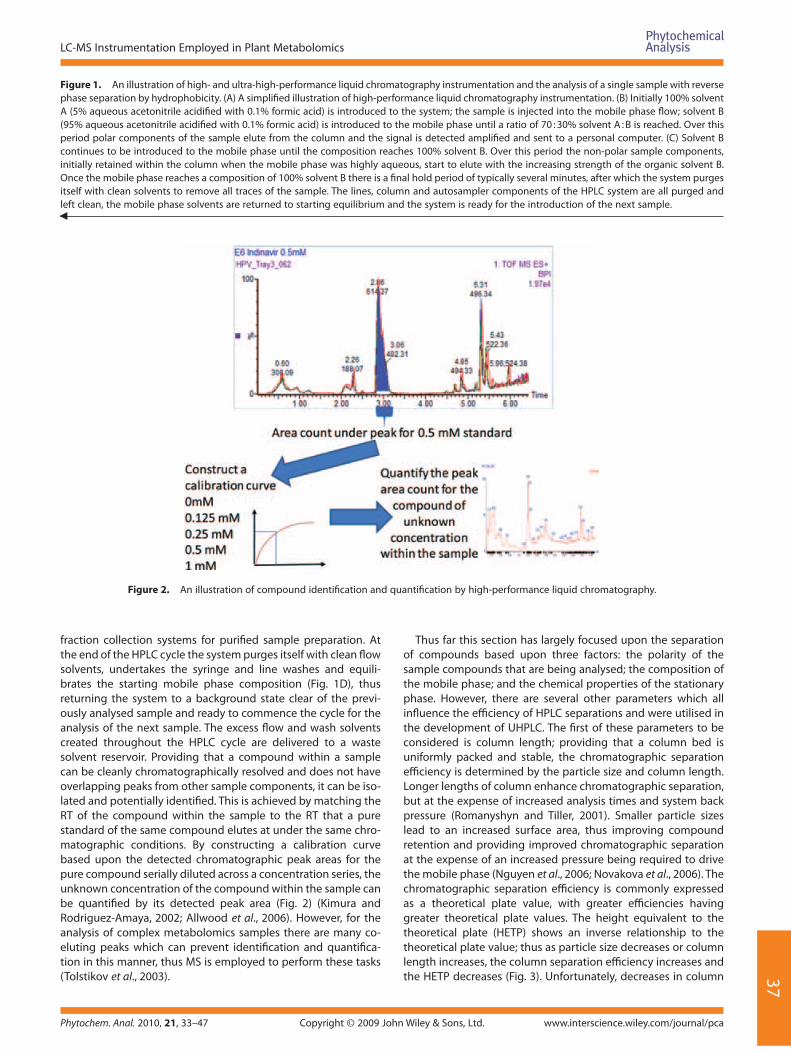
Essentially the hardware requirements for APCI (Fig. 4A) and ESI (Fig. 4B) are very similar; the sample introduction needles are near identical with the inner needle having a central channel for translocation of sample and outer channels for the delivery of nebulisation and desolvation gases. The arrangement of sample and extraction cones is also near identical, the core diff erences relating to the ionisation method each technique employs: in ESI the sample is ionised by application of a high electric charge to the sample needle, whereas in APCI the sample is ionised by application of a high charge to a corona pin after the sample has exited (been sprayed) from the sample needle. APCI is achieved by passing the sample in solution through the fused sample needle. As it emerges from the needle it enters a heated tube at atmospheric pressure where it is nebulised by a fl ow of typically nitrogen gas and vaporised (Fig. 4A). Ionisation of the vaporised sample is achieved by applying a high charge (typically ∼5 kV) to the corona pin located at the exit of the heated tube. The corona discharge around the pin causes the vaporised solvent molecules to ionise and form a reagent gas plasma; in turn the vaporised sample molecules are ionised by proton transfer either forming [M + H]+ or [M − H]− species (Zaikin and Halket, 2006). ESI is also achieved (Fig. 4B) by passing the sample in solution through the capillary to the fused sample needle. The needle has a high charge (typically ∼4 kV) directly applied as the sample emerges (is sprayed) from the needle in to the heated tube. The applica-tion of the high voltage to the needle results in charge transfer within the sample solution, leading to the formation of ions from the sample molecules (Gaskell, 1997). The sample is then
nebulised, again typically with nitrogen gas, prior to vaporisation via solvent evaporation within the heated tube. Once vaporised ions are formed, either by ESI or APCI, they must be extracted from the ionisation source to the mass analyser and detector. In the case of Waters ionisation sources (Fig. 4A and B), they are extracted from the heater tube through the sample cone that is maintained under vacuum to aid the extraction. Once ions have entered the sample cone they are likewise further extracted under a greater vacuum pressure (maintained by turbo pumping) through the extraction cone. Once the ions have entered the extraction cone they are focused into a fi ne stream using a radio frequency (RF) hexapole lens. The ion stream is then channelled to the mass spectrometer which again is maintained under vacuum pressure. Alternative manufacturers such as Thermo-Finnigan employ diff erent hardware arrangements.
ESI can be applied in both positive and negative ionisation polarities, depending on the capillary voltage that is applied (typically ∼+3 kV and ∼−2 kV, respectively). In ESI+ mode, common adducts include protonated [M + H]+, sodiated [M + Na]+, and potasiated [M + K]+. In ESI− mode the most common ions are deprotonated [M − H]−, although when chlorine is present within the sample metabolites, negatively charged chlo-rine adducts are also observed. Many further complex and diverse adduct species can be observed in both ionisation modes. Naturally occurring 13C isotope-containing compounds and double charging of the adduct species (e.g. a Na adduct where the Na is doubly charged) further increase the data com-plexity (Brown et al., 2009), although the use of high-purity sol-vents and formic acid can help to reduce the number of species observed for each analyte. In comparison to alternative ionisa-tion techniques, ESI has several key advantages, including ionisa-tion across a large mass range appropriate for proteome and metabolome analysis, good sensitivity, soft ionisation (i.e. does not ‘over’ fragment target analytes) and high adaptability (Gaskell, 1997). It is largely the mass range that can be covered by ESI that has made it one of the most widespread ionisation techniques in use, since it is applicable to both metabolite and peptide/protein
Figure 4. Sample ionisation by the methods of (A) atmospheric pressure chemical ionisation (APCI) and (B) electrospray ionisation (ESI).

J. W. Allwood and R. Goodacre
www.interscience.wiley.com/journal/pca Copyright © 2009 John Wiley & Sons, Ltd. Phytochem. Anal. 2010, 21, 33–47
40
analysis. However, ESI also has several disadvantages, including adduct formation, quenching, low tolerance towards salts and suppression of the ionisation of one metabolite species due to the presence of a high concentration of a diff erent species (i.e. matrix eff ects), both leading to ionisation suppression (King et al., 2000) and failure to detect certain metabolite classes/species.
The Quadrupole (Q) and Triple Quadrupole (QQQ) mass analysers
Quadrupoles were one of the fi rst varieties of mass analyser employed in metabolomics studies, being applied to both LC-MS (Tolstikov and Fiehn, 2002) and GC-MS (Fiehn et al., 2000). The single quadrupole consists of four parallel metal rods. Each opposing rod pair is connected electrically and an RF voltage is applied between one pair of rods and the other (Fig. 5A). A direct current (DC) voltage is then superimposed on the RF voltage. An identical DC voltage is applied to each of the four rods; the +/− rods are positioned 180° out of phase, and thus a quadrupolar fi eld is created when the DC is applied. This quadrupolar fi eld allows only mass ions within a certain mass range to pass through; this may be limited to the ions present within a single nominal mass unit range, or by continuously varying the DC voltage the quadrupole can scan across a large user specifi ed mass range. The passage of a specifi c mass ion through the quadrupole is dependent on the ratio of RF to DC voltage. Mass ions outside the specifi ed range hit the rods and are discharged. Positive mass ions are attracted to negative rods while the converse is observed for negative mass ions. The quadrupole can thus be regarded as a mass fi lter which functions to allow the passage of only a narrow range of mass ions to the detector at any one time (Niessen, 1998; Gross, 2004).
A latter development in quadrupole-based mass analysers was the triple quadrupole or QQQ, which permitted specialised analy-ses such as product ion monitoring. Here, three quadrupole cells are arranged linearly to one another (Fig. 5B): the fi rst quadru-pole, like the classic single quadrupole analyser, functions to fi lter
specifi ed mass ions or ranges of mass ions; a second non RF quadrupole serves as a collision cell, the collision cell passes a stream of collision gas (e.g. N, Ar, He) through the trapped sample mass ion or ions at a pressure of ∼10−3 Torr and collision energy of ∼30 eV. Collisions between the mass ion and gas result in the generation of fragments, or product ions, from the original pre-cursor ion in a process termed collision-induced decomposition (CID); the third and fi nal quadrupole serves to fi lter and allow the detection of the daughter fragments produced within the colli-sion cell. Therefore the QQQ mass analyser represents a form of MS/MS and is regarded as a tandem-MS in space analyser, which is suited to targeted MS analysis of intact ions and MS/MS struc-tural analysis of a metabolite by product ion monitoring, thus aiding annotation and characterisation greatly (Niessen, 1998; Gross, 2004; Kopka et al., 2004; Catchpole et al., 2005). Product ion monitoring is not the only function mode that can be performed with a QQQ; there are also precursor ion monitoring where a product ion is selected in the second analyser and the precursor masses are scanned in the fi rst analyser (Gross, 2004); neutral loss monitoring where the fi rst analyser scans all mass ions and the second analyser is given an off set, based upon the neutral mass of interest, to identify mass ions that have lost that specifi c neutral moiety (Brügger et al., 1996); and selected reaction moni-toring (SRM) where both mass analysers are set to scan for a specifi c precursor and product mass ion transition pair, which can help to improve sensitivity over conventional product ion monitoring (Kopka et al., 2004).
The time of fl ight, refl ectron time of fl ight and quadrupole-time of fl ight mass analysers
Time-of-fl ight mass spectrometry (TOF/MS) was fi rst devised in the 1940s with high-resolution instruments becoming available in the 1950s (Willey and McLaren, 1955). However, the use of TOF/MS for routine biochemical analysis did not become popular until the 1990s, largely due to the emergence of ionisation technolo-gies such as ESI and matrix assisted laser desorption ionisation
Rods set at the same DC+/- are 180° out of phase
(A)
(B)
From Ion
Source
To Detector
(under vacuum)
Quadrupole 1
Quadrupole 2(collision cell)
Quadrupole 3
Collision Gas(e.g. Ar, He, N2)
+ +
-
-
To Detector(under vacuum)
+++
From Ion Source
+
Figure 5. Instrument schematics to illustrate the quadrupole (A) and the triple quadrupole (QQQ) arrangement (B).
LC-MS Instrumentation Employed in Plant Metabolomics
Phytochem. Anal. 2010, 21, 33–47 Copyright © 2009 John Wiley & Sons, Ltd. www.interscience.wiley.com/journal/pca
41
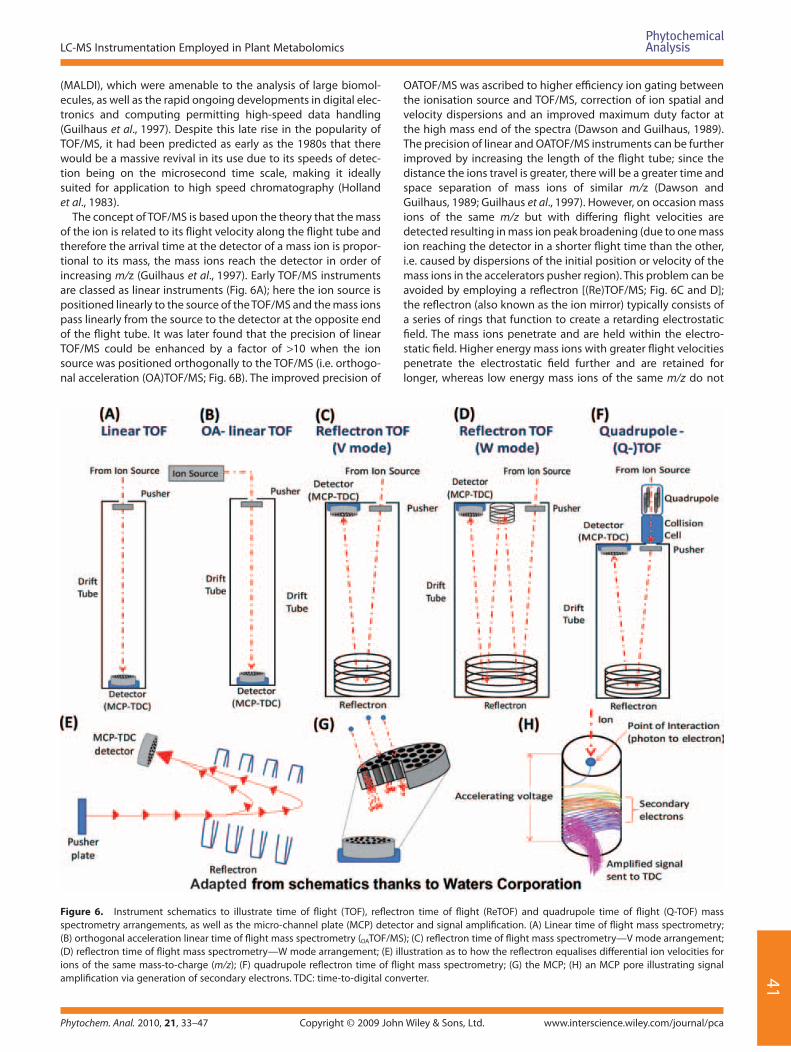
(MALDI), which were amenable to the analysis of large biomol-ecules, as well as the rapid ongoing developments in digital elec-tronics and computing permitting high-speed data handling (Guilhaus et al., 1997). Despite this late rise in the popularity of TOF/MS, it had been predicted as early as the 1980s that there would be a massive revival in its use due to its speeds of detec-tion being on the microsecond time scale, making it ideally suited for application to high speed chromatography (Holland et al., 1983).
The concept of TOF/MS is based upon the theory that the mass of the ion is related to its fl ight velocity along the fl ight tube and therefore the arrival time at the detector of a mass ion is propor-tional to its mass, the mass ions reach the detector in order of increasing m/z (Guilhaus et al., 1997). Early TOF/MS instruments are classed as linear instruments (Fig. 6A); here the ion source is positioned linearly to the source of the TOF/MS and the mass ions pass linearly from the source to the detector at the opposite end of the fl ight tube. It was later found that the precision of linear TOF/MS could be enhanced by a factor of >10 when the ion source was positioned orthogonally to the TOF/MS (i.e. orthogo-nal acceleration (OA)TOF/MS; Fig. 6B). The improved precision of
OATOF/MS was ascribed to higher effi ciency ion gating between the ionisation source and TOF/MS, correction of ion spatial and velocity dispersions and an improved maximum duty factor at the high mass end of the spectra (Dawson and Guilhaus, 1989). The precision of linear and OATOF/MS instruments can be further improved by increasing the length of the fl ight tube; since the distance the ions travel is greater, there will be a greater time and space separation of mass ions of similar m/z (Dawson and Guilhaus, 1989; Guilhaus et al., 1997). However, on occasion mass ions of the same m/z but with diff ering fl ight velocities are detected resulting in mass ion peak broadening (due to one mass ion reaching the detector in a shorter fl ight time than the other, i.e. caused by dispersions of the initial position or velocity of the mass ions in the accelerators pusher region). This problem can be avoided by employing a refl ectron [(Re)TOF/MS; Fig. 6C and D]; the refl ectron (also known as the ion mirror) typically consists of a series of rings that function to create a retarding electrostatic fi eld. The mass ions penetrate and are held within the electro-static fi eld. Higher energy mass ions with greater fl ight velocities penetrate the electrostatic fi eld further and are retained for longer, whereas low energy mass ions of the same m/z do not
Figure 6. Instrument schematics to illustrate time of fl ight (TOF), refl ectron time of fl ight (ReTOF) and quadrupole time of fl ight (Q-TOF) mass spectrometry arrangements, as well as the micro-channel plate (MCP) detector and signal amplifi cation. (A) Linear time of fl ight mass spectrometry; (B) orthogonal acceleration linear time of fl ight mass spectrometry (OATOF/MS); (C) refl ectron time of fl ight mass spectrometry—V mode arrangement; (D) refl ectron time of fl ight mass spectrometry—W mode arrangement; (E) illustration as to how the refl ectron equalises diff erential ion velocities for ions of the same mass-to-charge (m/z); (F) quadrupole refl ectron time of fl ight mass spectrometry; (G) the MCP; (H) an MCP pore illustrating signal amplifi cation via generation of secondary electrons. TDC: time-to-digital converter.
J. W. Allwood and R. Goodacre
www.interscience.wiley.com/journal/pca Copyright © 2009 John Wiley & Sons, Ltd. Phytochem. Anal. 2010, 21, 33–47
42
penetrate so far into the electrostatic fi eld and are retained for shorter time periods. Thus, the arrival time of the low and high energy mass ions of the same m/z at the detector are equalised (Fig. 6E) and peak broadening is prevented which results in greatly enhanced mass spectral resolution (Guilhaus et al., 1997; Gross, 2004). Early TOF/MS instruments were based upon the classic V mode arrangement (Fig. 6C); by positioning a second refl ectron at the opposing end of the TOF fl ight tube, the W mode arrangement (Fig. 6D) was made possible, further enhancing mass resolution not only due to equalising ion velocities through two refl ectrons but also the longer path length that the ions travel between the ionisation source and detector. Current ReTOF/MS instruments are typically capable of operation in both the V and W modes.
TOF/MS provides both good sensitivity and resolution for the profi ling of intact precursor ions generated from metabolites by ESI and perhaps represents the most appropriate MS instrument to apply LC separations to for this objective. ESI is a soft ionisation method resulting in minimal in-source fragmentation (i.e. frag-mentation of precursor ions within the ionisation source, leading to the formation of numerous product ions) especially when low capillary, extraction and sample cone voltages are employed (Gaskell, 1997). To make ESI-TOF/MS applicable to tandem-MS analyses it was combined with the quadrupole mass analyser, thus forming the instrument known as a quadrupole-time of fl ight (Q-TOF/MS; Fig. 6F). The Q-TOF/MS consists of a quadrupole to fi lter the mass ion or mass ion range of interest, linked to a collision cell for CID where the fi ltered precursor ion is frag-mented via a stream of collision gas, further linked to a TOF/MS or ReTOF/MS for the detection of the fragmented product ions (Gross, 2004). The ability to undertake product ion monitoring or SEM with tandem-MS using Q-TOF (Allwood et al., 2006), or QQQ (Catchpole et al., 2005) as previously described is key for the unambiguous identifi cation of metabolites. Ion trap-based instrumentation can also be used to achieve this objective although it be based upon the separation of ions in time rather than space (as for Q-TOF and QQQ analysers). Ion trap instru-ments will be discussed later. Q-TOF and QQQ can be pro-grammed to perform two functions within a single sample analysis, the fi rst function being scanning of intact ions (i.e. MS), and the second function being scanning of product ions gener-ated by CID (i.e. MS/MS) within the collision cell or by applying very high energies to the ESI resulting in in-source fragmentation (Moco et al., 2006; De Vos et al., 2007; Hanhineva et al., 2008). Recent developments in Q-TOF/MS have led to instruments with extremely high levels of resolution and mass accuracy, making them particularly appropriate for combined MS profi ling and MS/MS analysis within a single experimental run. Within certain instruments, the Waters Synapt HDMS being one example, an ion mobility spectrometry (IMS) cell is incorporated between the quadrupole and TOF/MS. IMS separates mass ions based upon shape and size rather than charge, thus mass ions of equal m/z or even isomers which cannot be separated by LC or within the quadrupole can potentially be separated by their drift within the IMS (Kanu et al., 2008).
The micro-channel plate and time-to-digital converter-based detector, and construction of a mass spectrum
After the sample has been ionised within the source and has passed through the mass analyser, it has reached the fi nal element of the mass spectral instrument, the detector. Detectors
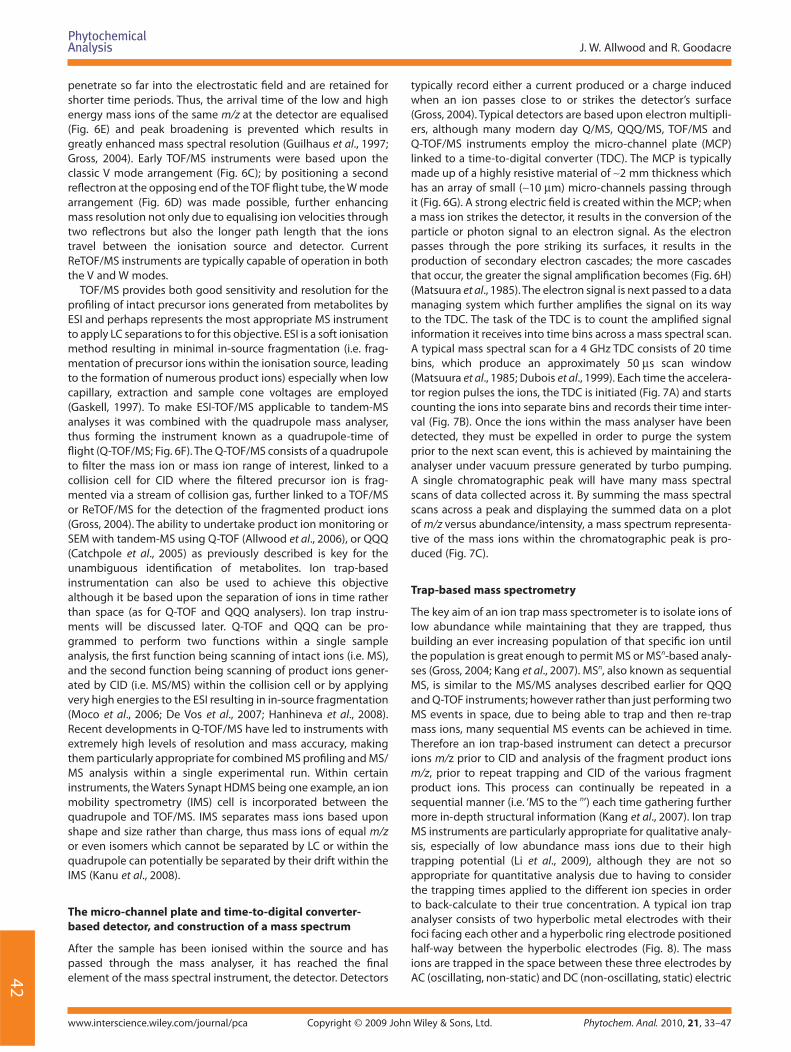
typically record either a current produced or a charge induced when an ion passes close to or strikes the detector’s surface (Gross, 2004). Typical detectors are based upon electron multipli-ers, although many modern day Q/MS, QQQ/MS, TOF/MS and Q-TOF/MS instruments employ the micro-channel plate (MCP) linked to a time-to-digital converter (TDC). The MCP is typically made up of a highly resistive material of ∼2 mm thickness which has an array of small (∼10 µm) micro-channels passing through it (Fig. 6G). A strong electric fi eld is created within the MCP; when a mass ion strikes the detector, it results in the conversion of the particle or photon signal to an electron signal. As the electron passes through the pore striking its surfaces, it results in the production of secondary electron cascades; the more cascades that occur, the greater the signal amplifi cation becomes (Fig. 6H) (Matsuura et al., 1985). The electron signal is next passed to a data managing system which further amplifi es the signal on its way to the TDC. The task of the TDC is to count the amplifi ed signal information it receives into time bins across a mass spectral scan. A typical mass spectral scan for a 4 GHz TDC consists of 20 time bins, which produce an approximately 50 µs scan window (Matsuura et al., 1985; Dubois et al., 1999). Each time the accelera-tor region pulses the ions, the TDC is initiated (Fig. 7A) and starts counting the ions into separate bins and records their time inter-val (Fig. 7B). Once the ions within the mass analyser have been detected, they must be expelled in order to purge the system prior to the next scan event, this is achieved by maintaining the analyser under vacuum pressure generated by turbo pumping. A single chromatographic peak will have many mass spectral scans of data collected across it. By summing the mass spectral scans across a peak and displaying the summed data on a plot of m/z versus abundance/intensity, a mass spectrum representa-tive of the mass ions within the chromatographic peak is pro-duced (Fig. 7C).
Trap-based mass spectrometry
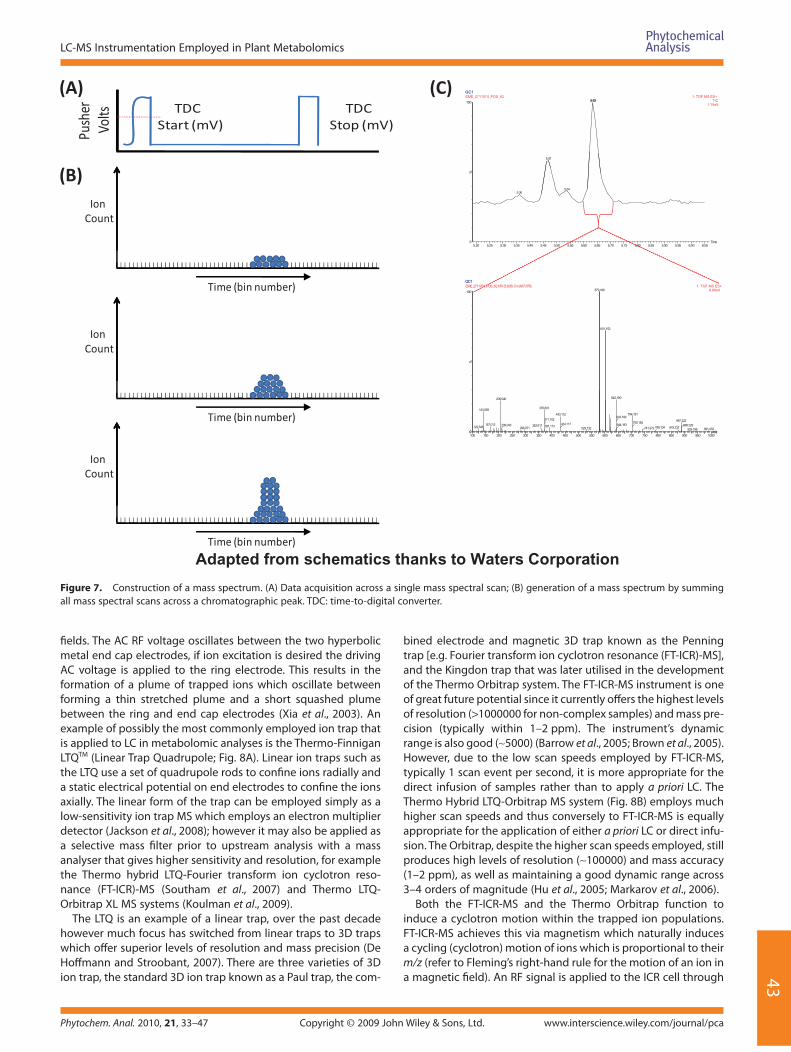
The key aim of an ion trap mass spectrometer is to isolate ions of low abundance while maintaining that they are trapped, thus building an ever increasing population of that specifi c ion until the population is great enough to permit MS or MSn-based analy-ses (Gross, 2004; Kang et al., 2007). MSn, also known as sequential MS, is similar to the MS/MS analyses described earlier for QQQ and Q-TOF instruments; however rather than just performing two MS events in space, due to being able to trap and then re-trap mass ions, many sequential MS events can be achieved in time. Therefore an ion trap-based instrument can detect a precursor ions m/z prior to CID and analysis of the fragment product ions m/z, prior to repeat trapping and CID of the various fragment product ions. This process can continually be repeated in a sequential manner (i.e. ‘MS to the n’) each time gathering further more in-depth structural information (Kang et al., 2007). Ion trap MS instruments are particularly appropriate for qualitative analy-sis, especially of low abundance mass ions due to their high trapping potential (Li et al., 2009), although they are not so appropriate for quantitative analysis due to having to consider the trapping times applied to the diff erent ion species in order to back-calculate to their true concentration. A typical ion trap analyser consists of two hyperbolic metal electrodes with their foci facing each other and a hyperbolic ring electrode positioned half-way between the hyperbolic electrodes (Fig. 8). The mass ions are trapped in the space between these three electrodes by AC (oscillating, non-static) and DC (non-oscillating, static) electric
LC-MS Instrumentation Employed in Plant Metabolomics
Phytochem. Anal. 2010, 21, 33–47 Copyright © 2009 John Wiley & Sons, Ltd. www.interscience.wiley.com/journal/pca
43
fi elds. The AC RF voltage oscillates between the two hyperbolic metal end cap electrodes, if ion excitation is desired the driving AC voltage is applied to the ring electrode. This results in the formation of a plume of trapped ions which oscillate between forming a thin stretched plume and a short squashed plume between the ring and end cap electrodes (Xia et al., 2003). An example of possibly the most commonly employed ion trap that is applied to LC in metabolomic analyses is the Thermo-Finnigan LTQTM (Linear Trap Quadrupole; Fig. 8A). Linear ion traps such as the LTQ use a set of quadrupole rods to confi ne ions radially and a static electrical potential on end electrodes to confi ne the ions axially. The linear form of the trap can be employed simply as a low-sensitivity ion trap MS which employs an electron multiplier detector (Jackson et al., 2008); however it may also be applied as a selective mass fi lter prior to upstream analysis with a mass analyser that gives higher sensitivity and resolution, for example the Thermo hybrid LTQ-Fourier transform ion cyclotron reso-nance (FT-ICR)-MS (Southam et al., 2007) and Thermo LTQ-Orbitrap XL MS systems (Koulman et al., 2009).
The LTQ is an example of a linear trap, over the past decade however much focus has switched from linear traps to 3D traps which off er superior levels of resolution and mass precision (De Hoff mann and Stroobant, 2007). There are three varieties of 3D ion trap, the standard 3D ion trap known as a Paul trap, the com-
bined electrode and magnetic 3D trap known as the Penning trap [e.g. Fourier transform ion cyclotron resonance (FT-ICR)-MS], and the Kingdon trap that was later utilised in the development of the Thermo Orbitrap system. The FT-ICR-MS instrument is one of great future potential since it currently off ers the highest levels of resolution (>1000000 for non-complex samples) and mass pre-cision (typically within 1–2 ppm). The instrument’s dynamic range is also good (∼5000) (Barrow et al., 2005; Brown et al., 2005). However, due to the low scan speeds employed by FT-ICR-MS, typically 1 scan event per second, it is more appropriate for the direct infusion of samples rather than to apply a priori LC. The Thermo Hybrid LTQ-Orbitrap MS system (Fig. 8B) employs much higher scan speeds and thus conversely to FT-ICR-MS is equally appropriate for the application of either a priori LC or direct infu-sion. The Orbitrap, despite the higher scan speeds employed, still produces high levels of resolution (∼100000) and mass accuracy (1–2 ppm), as well as maintaining a good dynamic range across 3–4 orders of magnitude (Hu et al., 2005; Markarov et al., 2006).
Both the FT-ICR-MS and the Thermo Orbitrap function to induce a cyclotron motion within the trapped ion populations. FT-ICR-MS achieves this via magnetism which naturally induces a cycling (cyclotron) motion of ions which is proportional to their m/z (refer to Fleming’s right-hand rule for the motion of an ion in a magnetic fi eld). An RF signal is applied to the ICR cell through
Adapted from schematics thanks to Waters Corporation
Figure 7. Construction of a mass spectrum. (A) Data acquisition across a single mass spectral scan; (B) generation of a mass spectrum by summing all mass spectral scans across a chromatographic peak. TDC: time-to-digital converter.
J. W. Allwood and R. Goodacre
www.interscience.wiley.com/journal/pca Copyright © 2009 John Wiley & Sons, Ltd. Phytochem. Anal. 2010, 21, 33–47
44
two opposing acceleration electrodes, which induces the cyclo-tron of ions into a greater orbit. As the ions orbit they pass two linked detector plate electrodes which record the weak AC image current generated by the passing mass ions (Barrow et al., 2005). The signal is then amplifi ed; this recorded time domain image current is further Fourier transformed, thus producing a mass domain signal that is summed to form a mass spectra. The Orbitrap also induces mass ions into a cyclotron motion; however, this is achieved by trapping ions between an outer electrode plate and an inner electrode spindle as opposed to within a mag-netic fi eld. Here, the ions are injected tangentially into an electric fi eld between the electrodes and trapped because their electro-static attraction to the inner electrode is balanced by centrifugal forces. Therefore, ions of a specifi c m/z (dictated by the strength of electric fi eld applied to the trap) move in rings around and oscillate back and forth along the central spindle. The frequency of these harmonic oscillations is independent of the ion velocity and is inversely proportional to the square root of the m/z, again by employing detection electrodes the time domain image current is detected, amplifi ed and Fourier transformed to produce a mass domain signal and eventual mass spectra (Hu et al., 2005; Markarov et al., 2006). Both FT-ICR-MS and the Thermo Orbitrap detect the mass ions in a non-destructive manner and thus the ion population is maintained within the trap; again to purge the system of mass ions they are expelled under vacuum pressure maintained by turbo pumping. It is likely that applications of LC to Thermo Orbitrap MS will gain pace over the coming years especially for the identifi cation of metabolites via MSn.
Applications of the various mass spectrometry analysers within metabolomics
Each of the various MS-based analysers discussed within this section have diff ering advantages and disadvantages which
make them more applicable to specifi c areas within metabolite profi ling research. For example, certain MS analysers are more suited to quantitative MS profi ling, whereas alternative analysers are more suited to metabolite identifi cation due to possession of MS/MS or MSn capabilities. The ionisation source that is employed eff ectively has the greatest bearing as to the range of metabolite groups detected. ESI is capable of ionising large biomolecules such as peptides and proteins as well as small molecules when compared with APCI. APCI generally has a greater ability to ionise non-polar compounds and so if a study was particularly targeted towards phospholipids and fatty acids (Allwood et al., 2006), plant sterols or oil soluble pigments such as carotenoids (Dachtler et al., 2001; Schweiggert et al., 2005), APCI would be the most appropriate ionisation method. Alternatively, ESI is more suited to the ionisation of more polar compounds, for example, amino acids (Tolstikov and Fiehn, 2002), sugars and sugar alcohols (Tolstikov et al., 2003; Moco et al., 2006), glucosides and fl ava-noids (De Vos et al., 2007; Hanhineva et al., 2008). Certain groups of compounds, such as the organic acids, ionise well with both APCI and ESI (Tolstikov and Fiehn, 2002), although certain spe-cifi c organic acids are only amenable to ionisation via one method or the other, depending upon their polarity. To obtain information on as wide a range of plant metabolites as possible, both ESI and APCI should be employed in both positive and negative ionisation modes; however this can result in a lot of data redundancy due to metabolites which are ionised and detected via both methods under one or both polarities. For general studies of plant metabolism, if only one ionisation source was to be employed, then ESI would be the favoured method, since it off ers overall greater coverage of polar metabolites and yet still permits the ionisation of non-polar species such as sterols and phospholipids.
Once the ionisation source/sources has/have been selected, an appropriate MS analyser must next be considered (Table 1). For
(A)
(B)ESI
Source
Thermo LTQTM
Linear Ion Trap
Differential Pumping
Differen
tial Pu
mp
ing
Differential Pumping
Differential Pumping
Source
MassAnalyser
Detector
ESISource
Heated Capillary
Tube Lens
Skimmer Quadrupole
Octapole
EndcapElectrode
RingElectrode
Conversion Dynode
Electron multiplier
Instrument schematics provided thanks to Thermo-Fisher Scientific
Figure 8. Instrument schematics to illustrate the Thermo-Finnigan linear trap quadrupole (LTQTM) and LTQ hybrid Orbitrap mass spectrometry system.
LC-MS Instrumentation Employed in Plant Metabolomics
Phytochem. Anal. 2010, 21, 33–47 Copyright © 2009 John Wiley & Sons, Ltd. www.interscience.wiley.com/journal/pca
45
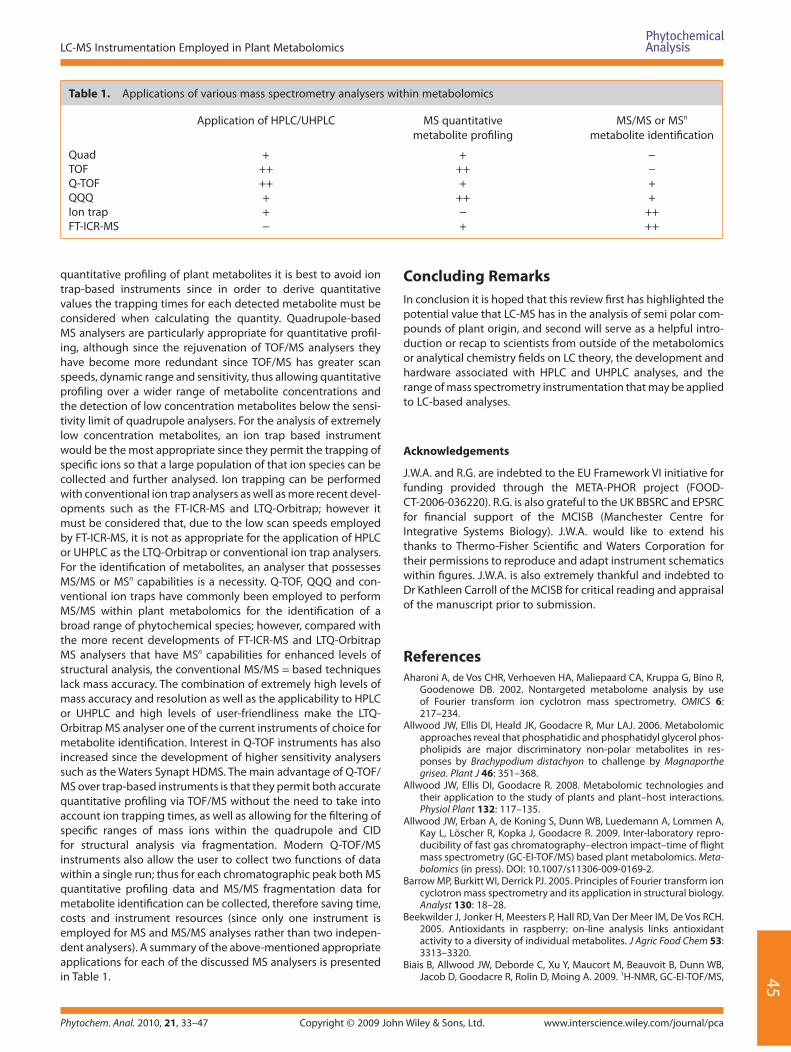
quantitative profi ling of plant metabolites it is best to avoid ion trap-based instruments since in order to derive quantitative values the trapping times for each detected metabolite must be considered when calculating the quantity. Quadrupole-based MS analysers are particularly appropriate for quantitative profi l-ing, although since the rejuvenation of TOF/MS analysers they have become more redundant since TOF/MS has greater scan speeds, dynamic range and sensitivity, thus allowing quantitative profi ling over a wider range of metabolite concentrations and the detection of low concentration metabolites below the sensi-tivity limit of quadrupole analysers. For the analysis of extremely low concentration metabolites, an ion trap based instrument would be the most appropriate since they permit the trapping of specifi c ions so that a large population of that ion species can be collected and further analysed. Ion trapping can be performed with conventional ion trap analysers as well as more recent devel-opments such as the FT-ICR-MS and LTQ-Orbitrap; however it must be considered that, due to the low scan speeds employed by FT-ICR-MS, it is not as appropriate for the application of HPLC or UHPLC as the LTQ-Orbitrap or conventional ion trap analysers. For the identifi cation of metabolites, an analyser that possesses MS/MS or MSn capabilities is a necessity. Q-TOF, QQQ and con-ventional ion traps have commonly been employed to perform MS/MS within plant metabolomics for the identifi cation of a broad range of phytochemical species; however, compared with the more recent developments of FT-ICR-MS and LTQ-Orbitrap MS analysers that have MSn capabilities for enhanced levels of structural analysis, the conventional MS/MS = based techniques lack mass accuracy. The combination of extremely high levels of mass accuracy and resolution as well as the applicability to HPLC or UHPLC and high levels of user-friendliness make the LTQ-Orbitrap MS analyser one of the current instruments of choice for metabolite identifi cation. Interest in Q-TOF instruments has also increased since the development of higher sensitivity analysers such as the Waters Synapt HDMS. The main advantage of Q-TOF/MS over trap-based instruments is that they permit both accurate quantitative profi ling via TOF/MS without the need to take into account ion trapping times, as well as allowing for the fi ltering of specifi c ranges of mass ions within the quadrupole and CID for structural analysis via fragmentation. Modern Q-TOF/MS instruments also allow the user to collect two functions of data within a single run; thus for each chromatographic peak both MS quantitative profi ling data and MS/MS fragmentation data for metabolite identifi cation can be collected, therefore saving time, costs and instrument resources (since only one instrument is employed for MS and MS/MS analyses rather than two indepen-dent analysers). A summary of the above-mentioned appropriate applications for each of the discussed MS analysers is presented in Table 1.
Concluding RemarksIn conclusion it is hoped that this review fi rst has highlighted the potential value that LC-MS has in the analysis of semi polar com-pounds of plant origin, and second will serve as a helpful intro-duction or recap to scientists from outside of the metabolomics or analytical chemistry fi elds on LC theory, the development and hardware associated with HPLC and UHPLC analyses, and the range of mass spectrometry instrumentation that may be applied to LC-based analyses.
Acknowledgements
J.W.A. and R.G. are indebted to the EU Framework VI initiative for funding provided through the META-PHOR project (FOOD-CT-2006-036220). R.G. is also grateful to the UK BBSRC and EPSRC for fi nancial support of the MCISB (Manchester Centre for Integrative Systems Biology). J.W.A. would like to extend his thanks to Thermo-Fisher Scientifi c and Waters Corporation for their permissions to reproduce and adapt instrument schematics within fi gures. J.W.A. is also extremely thankful and indebted to Dr Kathleen Carroll of the MCISB for critical reading and appraisal of the manuscript prior to submission.
ReferencesAharoni A, de Vos CHR, Verhoeven HA, Maliepaard CA, Kruppa G, Bino R,
Goodenowe DB. 2002. Nontargeted metabolome analysis by use of Fourier transform ion cyclotron mass spectrometry. OMICS 6: 217–234.
Allwood JW, Ellis DI, Heald JK, Goodacre R, Mur LAJ. 2006. Metabolomic approaches reveal that phosphatidic and phosphatidyl glycerol phos-pholipids are major discriminatory non-polar metabolites in res-ponses by Brachypodium distachyon to challenge by Magnaporthe grisea. Plant J 46: 351–368.
Allwood JW, Ellis DI, Goodacre R. 2008. Metabolomic technologies and their application to the study of plants and plant–host interactions. Physiol Plant 132: 117–135.
Allwood JW, Erban A, de Koning S, Dunn WB, Luedemann A, Lommen A, Kay L, Löscher R, Kopka J, Goodacre R. 2009. Inter-laboratory repro-ducibility of fast gas chromatography–electron impact–time of fl ight mass spectrometry (GC-EI-TOF/MS) based plant metabolomics. Meta-bolomics (in press). DOI: 10.1007/s11306-009-0169-2.
Barrow MP, Burkitt WI, Derrick PJ. 2005. Principles of Fourier transform ion cyclotron mass spectrometry and its application in structural biology. Analyst 130: 18–28.
Beekwilder J, Jonker H, Meesters P, Hall RD, Van Der Meer IM, De Vos RCH. 2005. Antioxidants in raspberry: on-line analysis links antioxidant activity to a diversity of individual metabolites. J Agric Food Chem 53: 3313–3320.
Biais B, Allwood JW, Deborde C, Xu Y, Maucort M, Beauvoit B, Dunn WB, Jacob D, Goodacre R, Rolin D, Moing A. 2009. 1H-NMR, GC-EI-TOF/MS,
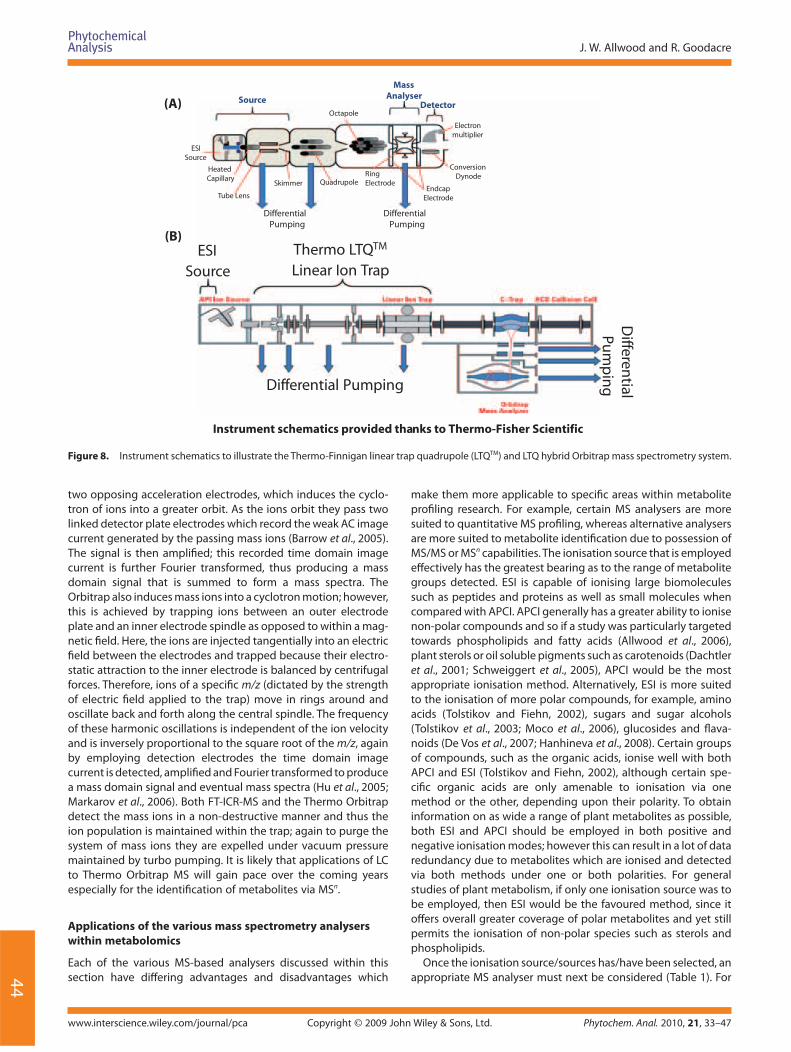
Table 1. Applications of various mass spectrometry analysers within metabolomics
Application of HPLC/UHPLC MS quantitative metabolite profi ling
MS/MS or MSn metabolite identifi cation
Quad + + −TOF ++ ++ −Q-TOF ++ + +QQQ + ++ +Ion trap + − ++FT-ICR-MS − + ++
J. W. Allwood and R. Goodacre
www.interscience.wiley.com/journal/pca Copyright © 2009 John Wiley & Sons, Ltd. Phytochem. Anal. 2010, 21, 33–47
46
and dataset correlation for fruit metabolomics: application to spatial metabolite analysis in melon. Anal Chem 81: 2884–2894.
Brown M, Dunn WB, Dobson P, Patel Y, Winder CL, Francis-McIntyre S, Begley P, Carroll K, Broadhurst D, Tseng A, Swainston N, Spasic I, Goodacre R, Kell DB. 2009. Mass spectrometry tools and metabolite-specifi c databases for molecular identifi cation in metabolomics. Analyst 134: 1322–1332.
Brown SC, Kruppa G, Dasseux J-L. 2005. Metabolomics applications of FT-ICR mass spectrometry. Mass Spectrom Rev 24: 223–231.
Brügger B, Erben G, Sandhoff R, Wieland FT, Lehmann WD. 1997. Quantitative analysis of biological membrane lipids at the low picomole level by nano-electrospray ionization tandem mass spectrometry. Proc Natl Acad Sci USA 94: 2339–2344.
Catchpole GS, Beckman M, Enot DP, Mondhe M, Zywicki B, Taylor J, Hardy N, Smith A, King RD, Kell DB, Fiehn O, Draper J. 2005. Hierarchical metabolomics demonstrates compositional similarity between genetically modifi ed and conventional potato crops. Proc Natl Acad Sci USA 102: 14458–14462.
Chen G, Pramanik BN, Liu Y-H., Mirza UA. 2007. Applications of LC/MS in structure identifi cations of small molecules and proteins in drug discovery. J Mass Spectrom 42: 279–287.
Choi YH, Tapias EC, Kim HK, Lefeber AW, Erkelens C, Verhoeven JT, Brzin J, Zel J, Verpoorte R. 2004. Metabolic discrimination of Catharanthus roseus leaves infected by phytoplasma using 1H-NMR spectroscopy and multivariate data analysis. Plant Physyiol 135: 2398–2410.
Choi YH, Kim HK, Linthorst HJM, Hollander JG, Lefeber AWM, Erkelens C, Nuizllard JM, Verpoorte R. 2006. NMR Metabolomics to revisit the tobacco mosaic virus infection in Nicotiana tabacum leaves. J Nat Prod 69: 742–748.
Cubbon S, Antonio C, Wilson J, Thomas-Oates J. 2009. Metabolomic appli-cations of HILIC-LC-MS. Mass Spectrom Rev (in press). DOI: 10.1002/mas.20252.
Dachtler M, Glaser T, Kohler K, Albert K. 2001. Combined HPLC-MS and HPLC-NMR on-line coupling for the separation and determination of lutein and zeaxanthin stereoisomers in spinach and retina. Anal Chem 73: 667–674.
Dawson JHJ, Guilhaus M. 1989. Orthogonal acceleration time-of-fl ight mass spectrometer. Rapid Commun Mass Spec 3: 155–159.
De Hoff mann E, Stroobant V. 2007. Mass spectrometry: principles and applications, 3rd edn. Wiley: New York.
De Vos CHR, Moco S, Lommen A, Keurentjes JJB, Bino RJ, Hall RD. 2007. Untargeted large-scale plant metabolomics using liquid chromatog-raphy coupled to mass spectrometry. Nat Protoc 2: 778–791.
Dixon RA, Sumner LW. 2003. Legume natural products: Understanding and manipulating complex pathways for human and animal health. Plant Physiol 131: 878–885.
Dixon RA, Gang DR, Charlton AJ, Fiehn O, Kuiper HA, Reynolds TL, Tjeerdema RS, Jeff ery EH, German JB, Ridley WP, Seiber JN. 2006. Applications of metabolomics in agriculture. J Agric Food Chem 54: 8984–8994.
Draper J, Enot DP, Parker D, Beckmann M, Snowdon S, Lin W, Zubair H. 2009. Metabolite signal identifi cation in accurate mass metabolomics data with MZedDB, an interactive m/z annotation tool utilising pre-dicted ionisation behaviour ‘rules’. BMC Bioinformat (in press). DOI: 10.1186/1471-2105-10-227.
Dubois F, Knochenmuss R, Zenobi R, Brunnelle A, Deprun C, Le Beyec Y. 1999. A comparison between ion-to-photon and microchannel plate detectors. Rapid Commun Mass Spectrom 13: 786–791.
Ettre LS, Sakodynskii KI. 1992. M.S. Tswett and the discovery of chromatography I: early works (1899–1903). Chromatographia 35: 223–231.
Fernie AR, Trethewey RN, Krotzky AJ, Willmitzer L. 2004. Metabolite profi l-ing: from molecular diagnostics to systems biology. Nat Rev Mol Cell Biol 5: 763–769.
Fiehn O, Kopka J, Dormann P, Altmann T, Trethewey RN, Willmitzer L. 2000. Metabolite profi ling for plant functional genomics. Nat Biotechnol 18: 1157–1161.
Gaskell SJ. 1997. Electrospray: principles and practice. J Mass Spectrom 32: 677–688.
Gika HG, Theodoridis G, Extance J, Edge AM, Wilson ID. 2008. High tem-perature-ultra performance liquid chromatography–mass spectrom-etry for the metabolomic analysis of Zuker rat urine. J Chromatogr B 871: 279–287.
Goodacre R. 2007. Metabolomics of a superorganism. J Nutr 137: 259S–266S.
Goodacre R, York EV, Heald JK, Scott IM. 2003. Chemometric discrimina-tion of unfractionated plant extracts profi led by fl ow-injection elec-trospray mass spectrometry. Phytochemistry 62: 859–863.
Goodacre R. Vaidyanathan S, Dunn WB, Harrigan GG, Kell DB. 2004. Metabolomics by numbers—acquiring and understanding global metabolite data. Trends Biotechnol 22: 245–252.
Gross JH. 2004. Mass Spectrometry. Springer: Berlin.Guilhaus M, Mlynski V, SelbyD. 1997. Perfect timing: time-of-fl ight mass
spectrometry. Rapid Commun Mass Spectrom 11: 951–962.Hall R. 2006. Plant metabolomics: from holistic hope, to hype, to hot topic.
New Phytol 169: 453–468.Hanhineva K, Rogachev I, Kokko H, Mintz-Oron S, Venger I, Kärenlampi S,
Aharoni A. 2008. Non-targeted analysis of spatial metabolite compo-sition in strawberry (Fragaria × ananassa) fl owers. Phytochemistry 69: 2463–2481.
Hao Z, Xiao B, Weng N. 2008. Impact of column temperature and mobile phase components on selectivity of hydrophilic interaction chroma-tography (HILIC). J Sep Sci 31: 1449–1464.
Hirai MY, Yano M, Goodenowe DB, Kanaya S, Kimura T, Awazuhara M, Arita M, Fujiwara T, Saito K. 2004. Integration of transcriptomics and metab-olomics for understanding of global responses to nutritional stresses in Arabidopsis thaliana. Proc Natl Acad Sci USA 101: 10205–10210.
Holland JF, Enke CG, Allison J, Stults JT, Pinkston JD, Newcome B, Watson JT. 1983. Mass spectrometry on the chromatographic time scale: real-istic expectations. Anal Chem 55: 997A–1012A.
Horváth CS, Nahurn A, Frenz J. 1981. High performance displacement chromatography. J Chromatogr 215: 365–374.
Hu Q, Noll RJ, Li H, Makarov A, HardmanM, Cooks RG. 2005. The Orbitrap: a new mass spectrometer. J Mass Spectrom 40: 430–443.
Jackson AU, Werner SR, Talaty N, Song Y, Campbell K, Cooks RG, Morgan JA. 2008. Targetted metabolomic analysis of Escherichia coli by desorption electrospray ionization and extractive electrospray ioniza-tion mass spectrometry. Anal Biochem 375: 272–281.
Jander G, Norris SR, Joshi V, Fraga M, Rugg A, Yu S, Li L, Last RL. 2004. Application of a high-throughput HPLC-MS/MS assay to Arabidopsis mutant screening; evidence that threonine aldolase plays a role in seed nutritional quality. Plant J 39: 465–475.
Jansen JJ, Allwood JW, Marsden-Edwards E, van der Putten WH, Goodacre R, van Dam NM. 2009. Metabolomic analysis of the interaction between plants and herbivores. Metabolomics 5: 150–161.
Jonsson P, Gullberg J, Nordström A, Kusano M, Kowalczyk M, Sjöström M, Moritz T. 2004. A strategy for identifying diff erences in large series of metabolomic samples analyzed by GC-MS. Anal Chem 76: 1738–1745.
Kang J, Hick LA, Price WE. 2007. A fragmentation study of isofl avones in negative electrospray ionization by MSn ion trap mass spectrometry and triple quadrupole mass spectrometry. Rapid Commun Mass Spectrom 21: 857–868.
Kanu AB, Dwivedi P, Tam M, Matz L, Hill HH. 2008. Ion mobility–mass spectrometry. J Mass Spectrom 43: 1–22.
Ketchum REB, Rithner CD, Qui D, Kim Y-S, Williams RM, Croteau RB. 2003. Taxus metabolomics: methyl jasmonate preferentially induces pro-duction of taxoids oxygenated at C-13 in Taxus × media cell cultures. Phytochemistry 62: 901–909.
Kimura M, Rodriguez-Amaya DB. 2002. A scheme for obtaining standards and HPLC quantifi cation of leafy vegetable carotenoids. Food Chem 78: 389–398.
Kind T, Fiehn O. 2007. Seven golden rules for heuristic fi ltering of mole-cular formulas obtained by accurate mass spectrometry. BMC Bioinformat 8: 105–125.
King R, Bonfi glio R, Fernandez-Metzler, Miller-Stein C, Olah T. 2000. Mechanistic investigation of ionization suppression in electrospray ionization. J Am Soc Mass Spectrom 11: 942–950.
Kopka J, Fernie A, Weckwerth W, Gibbon Y, Stitt,M. 2004. Metabolite pro-fi ling in plant biology: platforms and destinations. Genome Biol 5: A109.1–A109.9.
Koulman A, Woff endin G, Narayana VK, Welchman H, Crone C, Volmer DA. 2009. High-resolution extracted ion chromatography, a new tool for metabolomics and lipidomics using a second-generation orbitrap mass spectrometer. Rapid Commun Mass Spectrom 23: 1411–1418.
Krishnan P, Kruger NJ, Ratcliff e RG. 2005. Metabolite fi ngerprinting and profi ling in plants using NMR. J ExpBot 56: 255–265.
Le Gall G, Colquhoun IJ, Davis AL, Collins GJ Verhoeyen ME. 2003. Metabolite profi ling of tomato (Lycopersicon esculentum) using
LC-MS Instrumentation Employed in Plant Metabolomics
Phytochem. Anal. 2010, 21, 33–47 Copyright © 2009 John Wiley & Sons, Ltd. www.interscience.wiley.com/journal/pca
47
1H-NMR spectroscopy as a tool to detect potential unintended eff ects following a genetic modifi cation. J Agric Food Chem 51: 2447–2456.
Lewis IA, Schommer SC, Hodis B, Robb KA, Tonelli M, Westler WM, Sussman MR, Markley JL. 2007. Fast and accurate method for determining molar concentrations of metabolites in complex solutions from two dimensional 1H–13C NMR spectra. Anal Chem 79: 9385–9390.
Li DP, Xu YF, Xu GM, Gu LK, Li DQ, Shu HR. 2006. Molecular cloning and expression of a gene encoding alcohol acyltransferase (MdAAT2) from apple (cv. Golden Delicious). Phytochemistry 67: 658–667.
Li DP, Shen J, Wu T, Xu YF, Zong X, Li DQ, Shu HR. 2008. Overexpression of the apple alcohol acyltransferase gene alters the profi le of volatile blends in transgenic tobacco leaves. Physiol Plantarum 134: 394–402.
Li X, Jiang G, Luo C, Xu F, Wang Y, Ding L, Ding C-F. 2009. Ion trap mass analyzer: structure and performance. Anal Chem 81: 4840–4846.
Lisec J, Schauer N, Kopka J, Willmitzer L, Fernie AR. 2006. Gas chromatog-raphy mass spectrometry-based metabolite profi ling in plants. Nat Protoc 1: 387–396.
Makarov A, Denisov E, Kholomeev A, Balschun W, Lange O, Strupat K, Horning S. 2006. Performance evaluation of a hybrid linear ion trap/orbitrap mass spectrometer. Anal Chem 78: 2113–2120.
Matsuura S, Umebayashi S, Okuyama C, Oba K. 1985. Characteristics of the newly developed MCP and its assembly. IEEE T Nucl Sci 32: 350–354.
Meyer V. 2004. Practical High-performance Liquid Chromatography, 2nd edn. Wiley: New York.
Moco S, Bino RJ, Vorst O, Verhoeven HA, de Groot J, van Beek TA, Vervoort J, deVos CHR. 2006. A liquid chromatography–mass spectrometry-based metabolome database for tomato. Plant Physiol 141: 1205–1218.
Nguyen DT-T, Guillarme D, Rudaz S, Veuthey J-L. 2006. Fast analysis in liquid chromatography using small particle size and high pressure. J Sep Sci 29: 1836–1848.
Niessen WM. 1998. Advances in instrumentation in liquid chromatogra-phy–mass spectrometry and related liquid-introduction techniques. J Chromatogr A 794: 407–435.
Novokova L, Solichova D, Solich P. 2006. Advantages of ultra performance liquid chromatography over high performance liquid chromatogra-phy. J Sep Sci 29: 2433–2443.
Oksman-Caldentey K-M, Inzé D. 2004. Plant cell factories in the post-genomics era: new ways to produce designer secondary metabolites. Trends Plant Sci 9: 433–440.
Pauli GF, Jaki BU, Lankin DC. 2005. Quantitative 1H-NMR: development and potential of a method for natural products analysis. J Nat Prod 68: 133–149.
Ratcliff e RG, Shachar-Hill Y. 2001. Probing plant metabolism with NMR. A Rev Plant Physiol 52: 499–526.
Riazanskaia S, Blackburn G, Harker M, Taylor D, Thomas CLP. 2008. The analytical utility of thermally desorbed polydimethylsilicone mem-branes for in-vivo sampling of volatile organic compounds in and on human skin. Analyst 133: 1020–1027.
Rischer H, Orešič M, Seppänen-Laakso T, Katajamaa M, Lammertyn F, Ardiles-Diaz W, Van Montagu MCE, Inzé D, Oksman-Caldentey KM, Goossens A. 2006. Gene-to-metabolite networks for terpenoid indole alkaloid biosynthesis in Catharanthus roseus cells. Proc Natl Acad Sci USA 103: 5614–5619.
Romanyshyn LA, Tiller PR. 2001. Ultra-short columns and ballistic gradients: considerations for ultra-fast chromatographic liquid chro-matography–tandem mass spectrometric analysis. J Chromatogr A 928: 41–51.
Sato S, Soga T, Nishioka T, Tomita M. 2004. Simultaneous determination of the main metabolites in rice leaves using capillary electrophoresis mass spectrometry and capillary electrophoresis diode array detec-tion. Plant J 40: 151–163.
Schweiggert U, Kammerer DR, Carle R, Schieber A. 2005. Characterisation of carotenoid esters in red pepper pods (Capsicum annuum L) by high performance liquid chromatography/atmospheric pressure chemical ionisation mass spectrometry. Rapid Commun Mass Spectrom 19: 2617–2628.
Snyder LR, Kirkland JJ, Glajch JL. 1997. Practical HPLC Method Development, 2nd edn. Wiley: New York.
Southam AD, Payne TG, Cooper HJ, Arvanitis TN, Viant MR. 2007. Dynamic range and mass accuracy of wide-scan direct infusion nanoelectro-spray Fourier transform ion cyclotron resonance mass spectrometry-based metabolomics increased by the spectral stitching method. Anal Chem 79: 4595–4602.
Sumner LW, Mendes P, Dixon RA. 2003. Plant metabolomics: large-scale phytochemistry in the functional genomics era. Phytochemistry 62: 817–836.
Suzuki H, Achnine L, Xu R, Matsuda SPT, Dixon RA. 2002. A genomics approach to the early stages of saponin biosynthesis in Medicago truncatula. Plant J 32: 1033–1048.
Tolstikov VV, Fiehn O. 2002. Analysis of highly polar compounds of plant origin: combination of hydrophilic interaction chromatography and electrospray ion trap mass spectrometry. Anal Biochem 301: 298–307.
Tolstikov VV, Lommen A, Nakanishi K, Tanaka N, Fiehn O. 2003. Monolithic silica-based capillary reversed-phase liquid chromatography/electro-spray mass spectrometry for plant metabolomics. Anal Chem 75: 6737–6740.
van der Greef J, Smilde AK. 2006. Symbiosis of chemometrics and metab-olomics: past, present and future. J Chemometr 19: 376–386.
von Roepenack-Lahaye E, Degenkolb T, Zerjeski M, Franz M, Roth U, Wessjohann L, Schmidt J, Scheel D, Clemens S. 2004. Profi ling of arabidopsis secondary metabolites by capillary liquid chromatogra-phy coupled to electrospray ionization quadrupole time-of-fl ight mass spectrometry. Plant Physiol 134: 548–559.
Vorst OF, de Vos, CHR, Lommen A, Staps RV, Visser RGF, Bino RJ Hall RD. 2005. A non-directed approach to the diff erential analysis of multiple LC/MS-derived metabolic profi les. Metabolomics 1: 169–180.
Ward JL, Harris C, Lewis J, Beale MH. 2003. Assessment of 1H-NMR spec-troscopy and multivariate analysis as a technique for metabolite fi n-gerprinting of Arabidopsis thaliana. Phytochemistry 62: 949–957.
Willey WC, McLaren IH. 1955. Time-of-Flight Mass Spectrometer with improved resolution. Rev Sci Intrum 26: 1150–1157.
Xia Y-Q, Miller JD, Bakhtiar R, Franklin RB, Liu DQ. 2003. Use of a quadru-pole linear ion trap mass spectrometer in metabolite identifi cation and bioanalysis. Rapid Commun Mass Spectrom 17: 1137–1145.
Zaikin VG, Halket JM. 2006. Derivatisation in mass spectrometry 8. Soft ionization mass spectrometry of small molecules. Eur J Mass Spectrom 12: 79–115.
Zhang Z-M, Li G-K. 2007. A preliminary study of plant aroma profi le characteristics by a combination sampling method coupled with GC-MS. Microchem J 86: 29–36.