an inventory control system for spare parts at a refinery ... projecten/prognostic... · an...
TRANSCRIPT

An inventory control system for spare parts at a
refinery: An empirical comparison of different re-
order point methods
Eric Porrasa*, Rommert Dekker
b
a Instituto Tecnológico y de Estudios Superiores de Monterrey, Campus Santa Fe, Mexico City, Mexico
b Econometric Institute, Erasmus University Rotterdam, the Netherlands
Abstract
Inventory control of spare parts is essential to many organizations, since excess inventory leads to high
holding costs and stock outs can have a great impact on operations performance. This paper proposes a
methodology for effective spare parts inventory control, motivated by a case study at a large oil
refinery. Different demand modeling techniques and inventory policies are evaluated using real data.
Keywords: Spare parts; inventory control; re-order points; demand classes; service levels
1. Introduction
Effective inventory management of spare parts is essential to many companies, from
capital-intensive manufacturers to service organizations, such as car manufacturers,
chemical plants, telecom companies and airlines. Different from work-in-process
(WIP) and finished product inventories, which are driven by production processes and
customer demands, spare parts are kept in stock to support maintenance operations
and to protect against equipment failures. Although this function is well understood
by maintenance managers, many companies face the challenge of keeping on stock
large inventories of spares with excessive associated holding and obsolescence costs.
Thus, effective cost analysis can be an important tool to evaluate the effects of stock
control decisions related to spare parts. However, the difficulty in assessing good
strategies for the management of spare parts lies in their specific nature, normally
very slow-moving parts with highly stochastic and erratic demands. For example,
typical industrial data sets comprise limited demand history with long streams of zero
demand values and a few large demands (Willemain et al. (2004)). This makes the
estimation of the lead time demand (LTD) distributions very difficult, which is
essential to obtain the control parameters of most inventory policies. Although
different inventory models have been proposed in the literature to tackle this problem
(see next section), there is a lack of empirical testing of theoretical models with data
from real industrial environments.
* Corresponding author: [email protected]
This paper concerns a study on spare parts at a major oil refinery in the
Netherlands, which consisted of two phases. In the first phase a case study was
conducted with the company, where the SAP system used as platform for its
operations was under examination. As a result, some improvement measures were
provided and later implemented by the company. The second phase was focused on
the analysis of the demand data provided by the company. This paper reports on the
findings related to this phase, where the objective was to perform an empirical
comparison of different inventory models.
The aforementioned company keeps stock of a large number of spare parts related
to equipment used in its petrochemical processes. Although these stocks are essential
for the continuity of its operations, management was concerned with the savings
opportunities at the process floor by having better inventory control of its spare parts,
whose value was worth at the moment of the study more than 27 million euros. One
major difficulty of the study was the limited demand history available.
By describing the case, we make general observations about the practical aspects
of inventory control. Moreover, our aim is to compare various policies with real
demand data from the case to see which one is best under what circumstances.
Common methods presented in the literature rather use given statistical demand
distributions to assess the performance of inventory models. Consequently, with our
methodology we can better identify the real limitations of industrial data sets.
The remainder of the paper is organized as follows: the next section presents
briefly related literature. Section 3 includes the case study description. Next the
methodology is explained in Section 4. The computation results are included in
Section 5 and the final conclusions are presented in the last section.
2. Review of related literature
One of the major areas of inventory research over the past decades is the one related
to the management of spare parts inventories. Although theoretical models for slow-
moving items are abundant in inventory literature since 1965, case studies are few (for
a comprehensive overview of recent literature on spare parts management see
Kennedy et al. (2002)).
In the arena of theoretical models, one of the most extensively studied inventory
policies is the so-called (S-1, S) model, a particular case of (s, S) models, with an
underlying Poisson demand distribution (see Feeney and Sherbrooke (1966)).
Although well studied and suitable for slow-moving items, this type of policy requires
continuous review of the inventory system. Moreover, the Poisson distribution
assumes randomness of demand, with interarrival times between unit size demands
following an exponential distribution. This distribution needs no information of
demand other than the average demand, which is the solely parameter of the demand
distribution. When transactions are larger than unit size, authors have proposed the
use of compound-Poisson models (see Williams (1984) and Silver et al. (1971)).
However, these models are difficult to apply in practice because they need an
assumption on the compounding distribution. For example Williams (1984) developed
a method to identify sporadic demand items, where three parameters are needed: one
for the exponential distribution of interarrival times of demands, and two parameters
of an underlying gamma distribution for the demand size.

Most of the empirical studies in spare parts literature are focused on testing
forecasting methods for demand of slow-moving items rather than on implementing
inventory models. This is an important distinction since forecast methods are used to
estimate point forecast of the mean (like the moving average method) while for
evaluating control parameters of inventory models (like the (s,Q) model) one needs an
estimation of the entire LTD distribution. Moreover, inventory models are used to
meet specific customer service levels in the long run, while forecasting models aim to
obtain accurate demand forecasts as determined by the mean average percentage error
(MAPE) or the mean square error (MSE). In this area of research Ghobbar and Friend
(2003) present a comparative study of 13 different forecasting methods for the
management of spare parts in the aviation industry. They use the MAPE measurement
applied to forecast errors to assess the accuracy of the different methods but no
inventory models are included in the study. They confirm the superiority of the
weighted moving average and Croston’s methods over exponential smoothing and
seasonal regression models. Silver et al. (1998) also advise on the use of Croston’s
method for products with intermittent and erratic demand. This method (Croston
(1972)) assumes that the LTD has a normal distribution, and estimates the mean
demand per period by applying exponential smoothing separately to the intervals
between nonzero demands and their sizes.
Willemain et al. (2004) propose the use of a modified bootstrap method to forecast
intermittent demand of service parts, and they implement the method on a large
industrial data set. Croston’s method and exponential smoothing are evaluated as well,
yet like in the previous paper no attempt is made to implement an inventory control
model. They show that the modified bootstrap method produces more accurate
forecasts (based on the MAPE measurement) than the exponential smoothing and the
Croston’s method. We use in the study the bootstrap method proposed by Willemain
and we compare it with the performance of an empirical distribution model. We
assess also the performance of models based on Poisson and normal demand
distributions.
A similar research to the present study is presented in Strijbosch et al. (2000),
where the performance of two different (s, Q) models for spare parts in a production
plant environment is examined. Unlike our method, they test the inventory models
proposed using simulation where demands are generated from an Erlang distribution,
whereas we assess the inventory models using the historical demand data for the items
(around 8,000 items). Also related to our study, Gelders and van Looy (1978)
presented a case study carried out in a large petrochemical plant. They developed
different inventory models to control slow and fast moving items, which were
clustered in classes using ABC analysis together with criticality and value
considerations. As they had limited information on consumption rates for slow
movers, a Poisson underlying distribution was assumed to compare between existing
practices and the models proposed. We use in our study a similar approach, but
different to their study we estimate the LTD distribution using the methods mentioned
above and we test the models with real demand data, rather than using simulation.
Preventive maintenance (PM) is another important managerial issue that has been
addressed in the literature (see Bridgman and Mount-Campbell (1993)). Information
on PM can be used to better control inventories as it takes advantage of planned
demand, by correcting the effect of stochastic failures of equipment. Thus, models can
perform more accurate as they are not perturbed further by PM demands.

3. The case study - system description
The company under study consists of a major petrochemical complex located in the
Netherlands, which includes 60 different plants divided in chemicals manufacturing
and oil refinering. The complex dates from 1930, and many new installations have
been added since then. A large part of it however, stems from the 1960s. The
procurement department offers service to all plants. There is one central warehouse
owned by the company. At the moment of the study (2000), there were in total 130
thousand catalogued materials, of which only 43 thousand were kept on stock at the
site, with a total value of more than 27 million euros. There are 22 additional small
de-central storages on site, containing fast moving materials that can be directly used
if needed. No stock registration is done for these items and they are replenished on a
batch basis. Therefore, we only need to consider a single stock echelon, being the
warehouse as user of spares for equipment and not a producer of parts. In total there
are 180 thousand requests of material per year, both for non-stock and stock materials.
Requests for materials kept on stock are supplied from available stock. If there is
shortage of a material an emergency replenishment order is generated.
Controlling 43 thousand materials represents a difficult task, especially because of
the differences in types and consumption patterns associated with them. It also
requires efficient use of the manpower available and of the information system at
hand. Until 1997 an in-house developed information system for inventory control was
used by the company. In 1997 they moved to the information system SAP R/3, which
is a complete ERP-system, but not specific for inventory control. Almost the whole
demand history before 1997 has been lost in the transfer to SAP. Within SAP, the
company applied the MM (materials management) module for the control of its spare
parts. Since SAP evolved out of MRP systems for the manufacturing and assembly
industry, the MM module is very much based on the MRP planning philosophy (see
Heizer and Bender (2001)). Demand is expressed by actual orders or by forecasts of
demands. Next demand of end products is converted to demand for assemblies,
components and parts. Stock control is performed in SAP on a periodic basis (so-
called periodic review). Items are ordered when the MRP run is made. The SAP user
can set the appropriate time interval, e.g. daily, weekly or monthly. At the company
they run the MRP every week.
The actual stock control within SAP occurs in terms of min-max levels
(equivalently to (s, S) policies), or MRP-type control based on lead times. Minor
functionality is available in SAP to determine the minimum level s and the maximum
level S. Safety stocks can be used to determine the reorder level s, and lot sizing
methods are available to evaluate the difference between s and S. Before the project
90% of the control levels were set manually, and afterwards some 70%. As a result
still many replenishment orders were checked manually before sending them out.
With respect to forecasting, several methods are available in SAP, like exponential
smoothing and moving averages, both with trends and seasonality. It is however the
intermittent nature of demand that makes the application of these methods particularly
difficult to spare parts. For the determination of safety stock levels, the normal loss
model is available which approximates the demand during the lead time with a normal
distribution. This model works with the cycle service level as service level objective.
However, no fill rate service levels can be defined within the MM module. A more
striking aspect of SAP is that within its functionality no continuous review models
can be implemented. Therefore the classical and much advised (S-1, S) model with
Poisson distributed demand over the lead time cannot be applied.

3.1. Data structure
Statistical information for the consumption of spare parts was available for 5 years
(the last year only until August). The demand information was recorded in monthly
periods, so a total of 55 periods of demand information was available for the study.
One important limitation of the demand set was that it did not specify whether
demands were due to failures or preventive maintenance activities.
Different parts used by the company are divided in two main categories: materials
related to a piece of equipment and the ones not related to any particular equipment,
like protecting shoes, helmets, general-purposed electrical equipment and
instrumentation. From the total of 43,000 materials in stock, 14,383 were spare parts,
accounting for 80% of the total stock value. These spare parts are the focus of the
present study. The parts related to equipment are classified according to criticality
codes, which are based on how unavailability affects the safety of the people and
environment, the cost of down time and the quality of the processes. Materials not
related to equipment do not have such a criticality code. Accordingly, three criticality
codes are used: High (H), Medium (M) and Low (L), which are defined as follows:
• High (H): Unavailability of these materials would result in expensive
downtime or cause danger to the safety of the people and the environment.
Risk taken in the process of ordering and stocking cannot be justified.
• Medium (M): Unavailability of these materials would result in significant loss
of production, but does not endanger the safety of the people or the
environment. A calculated risk can be taken in the process of ordering and
stocking.
• Low (L): Unavailability of these materials would not result in serious effects
on the processes or on the safety of the people and the environment.
The previous classification is made on expert judgement and no quantitative
methods are used to date. We would have liked to use these codes as related to
stockout costs, but these were difficult to assess by the management.
A further inspection of the materials with criticality code leads to a more refined
classification: materials that are uniquely installed in a particular piece of equipment
(60% of the materials related to equipment), and materials which are related to more
than one piece of equipment of different criticality codes. That means that there are
spare parts that have combined criticality codes (H/M/L, M/L) depending on whether
they are installed in multiple piece of equipment of different criticality. The company
used these codes to decide on the stock levels of the different parts. Thus, items
identified as highly critical should be on stock since they require high fill rates, low
critical ones destock, and medium critical ones on stock depending on cost-effective
considerations. However, as no models are available in SAP that incorporate
criticality considerations, these levels were set mostly by expert judgement.
3.1.1. Classification of parts
A more refined analysis of the spare parts data revealed that important differences
among them existed not only in terms of criticality codes but also with respect to
demand and price. Therefore, we aimed at grouping them in different classes to see
whether we should apply different stock control methods for different classes.

Below we describe the different classes considered in this study.
Criticality classes
Based on the criticality codes, the following criticality classes were defined for the
spare parts:
Criticality class 1: H
“ 2: H/M/L or H/L
“ 3: M
“ 4: M/L
“ 5: L
“ 6: Not related to any particular piece of equipment
For the current policy used by the company, we expect to observe that the service
levels associated with high critical items are higher than the ones for low critical items
(see discussion in Section 5.4).
Demand classes
The original data set consisted of more than 14,000 spare parts, for which we
observed a high variability in demand patterns. For example some parts had only 0/1
demands while others experienced either few large demands or no realization of
demands during 5 years. For other parts we observed large negative demands due to
returns. Thus, a classification was needed for the spare parts based on consumption
rates. For parts with total positive demand over the five-year period and some demand
values higher than 1, we identified from a histogram two main groups: parts with
relatively high total demand and parts with low total demand. Although the boundary
between these two groups was not clearly identified in the histogram of demand, from
a Pareto analysis we could reasonably establish it in 60 units. We observe that 90% of
the items had a demand below this value, and this contributed 25% of the total
demand. At the same time, items with 0/1 demands also had a total demand of less
than 60. According to this, we established the following demand classes for the parts:
Demand class 1: parts with only 0/1 demands.
“ 2: parts with negative total demand.
“ 3: parts with no realizations of demand (all demands equal to zero).
“ 4: parts with total demand larger than 0 but less than 60, and not only
0/1 demands.
“ 5: parts with total demand higher than 60.
“ 6: parts with -1, 0, 1 demands.
Price classes
For the spare parts in the data set, 5 different price levels were identified in a
histogram. Table 1 shows the different price classes for the spare parts. The parts
recorded in SAP with a price of 0 euros are items not owned by the materials
department (price class 1). We observed prices as low as 0.01 euros for some parts
(price class 2) and the most expensive ones had a price of 20,000 euros (price class 5).
Table 1. Price classes of parts Price class 1 2 3 4 5
Price (p) in euros p = 0 0<p≤13.6 13.6<p≤169 169<p≤2112 p>2112
Spare parts (total = 14383) 10% 19% 33% 29% 8%

Combined classes
Using the criticality, demand and price classes, we include each item in a combined
class defined by three digits. Accordingly, an item in class “xyz” corresponds to an
item with demand class x, criticality class y and price class z. This classification
allows us to optimize the system per class rather than for individual items. That is,
once a service level is defined for the combined class, the parameters for the different
inventory policies are evaluated for each item in the class. Then a simulation tool is
used to evaluate the performance of the selected model of each individual item using
its demand data. Finally total costs are aggregated across all items in the class. In this
way we aim at obtaining an optimization rule for each combined class considered in
the study (see section 4).
3.1.2. Considerations on item classes and anomalous observations
The analysis of spare parts data is performed for all combined classes incorporating
demand classes 1, 4, 5 and 6. Thus, all criticality and price classes which combine
those demand classes are considered for the evaluation of the inventory models,
except price class 1, since items with price zero do not have associated holding costs.
Since for items with total negative demand a zero inventory policy is optimal, we do
not incorporate in the analysis demand class 2 (4% of the parts). Moreover, although
negative demands can be associated with returns due to preventive maintenance
practices (parts that were ordered but not actually installed) or with repaired parts that
were brought back to the system, we did not have specific information in this respect.
As for demand class 3 (2.2% of the parts), since items in this class have no demand
realizations in five years, we leave it out of the analysis. From these considerations we
are left with 11,984 items. Additionally, we observed items with an error in the
criticality specification. These items accounted for 4.1% of the total numbers of parts.
After excluding these items, we were finally left with 11,790 spare parts for the
analysis. We also identified in the data set one particular month for which a large
number of very high demands was recorded. We considered that this was due to an
administrative rebooking in the warehouse and thus we eliminated this month from
the data set in our analysis.
3.1.3. Lead times
The lead times for the spare parts were recorded in days. However the demand data
set for the items was registered in months, without specification of the day within the
month that a particular demand took place. Therefore, for ease of implementation in
the simulation we rounded the lead times off to full months using 30 days per month.
In this way an item with a lead time of 80 days was considered to have a lead time of
3 months. Observe that this conversion is also necessary for the estimation of the
distribution of the lead time demand, since demand forecasts for the items are
produced in months. Although the rounding up of lead times was introduced to better
cope with the demand data, by doing this we take a conservative approach, in which
the service levels achieved by the system in the simulation will be generally lower
than they are in reality. Observe that lead time management is an important issue,
especially for older parts, as suppliers may no longer be able to meet the original
promised times.

3.2. Cost structure
In general, three types of costs are associated with inventories: holding costs, ordering
costs and stockout costs. Holding costs represent the cost of capital tied up in the
spare parts inventory. An annual fixed rate of 25% was used in the study. Ordering
costs represent the cost associated with placing an order for a spare part, which
includes the costs of telephone calls, inspection and handling of the incoming items,
paying the bill and registration of the parts. This cost is independent of the number of
parts included in the order. An ordering cost of 36 euros was used in the study. Since
our objective is to evaluate the optimal balance between service levels and holding
costs, we consider stockout costs in a separate study included in the Appendix.
4. Methodology
We use two approaches for the optimization of the spare parts inventory system under
consideration, namely an ex-ante and an ex-post approach. In the ex-post procedure
the same data set is used for both fitting and testing purposes. Opposite to this, the ex-
ante procedure, once a distribution has been fitted to the data, uses an entirely
different set for testing purposes. In this respect the ex-ante approach is more relevant
from a scientific and practical perspective, since in reality systems face future
“unknown” demands (Silver et al. (1998)). In order to achieve this, we divide the
historical demand data into two sets, namely a fitting period and a testing period. The
fitting period will be used to estimate the lead time demand distribution (LTD) which
is used in turn to determine the inventory policy parameters. The testing period is used
to perform a simulation to evaluate the performances of the inventory policies
selected and compare them with the performance of the current one. We consider two
types of service levels, the cycle service level (CSL) and the fill rate. The reason for
using the ex-post approach is that many industrial data sets are rather short for
forecasting purposes, and this procedure will give the advantage of using the whole
data set to get a “better picture” of the real demand process. The performance of both
approaches will be compared to assess the advantages of each one. We have to note
however that in the data set there are many items with only one or two demand
realizations, and therefore we expect highly variable results.
One of the main issues we address is whether theoretical models can outperform
stock analysts. In practice this is difficult to assess because of lack of information (e.g.
short demand data sets, little information on preventive maintenance practices), as
well as implementation constraints. For instance real lead times of items are normally
in days but in the models one may prefer to use full periods of time for ease of
implementation. Other practical issues like the performance of different methods to
model the demand process are explored as well in this study. In order to achieve this,
below we give the demand modeling methods used and next we describe the
inventory models considered.
4.1. Modeling the lead time demand
In inventory decision making, one needs to determine inventory control parameters,
such as reorder points and safety stocks. In order to do so, we need a specification of
the lead time demand distribution. This is traditionally done by modeling lead time
demand using common probability distributions found in the literature, such as the
normal distribution (Silver et al. (1998)) or the Poisson distribution (see Schultz
(1987)). Other authors propose the use of models based on forecast techniques such as
moving average or exponential smoothing (see Croston (1972) and Silver et al.
(1998)). In order to cope better with real data sets and to give a more realistic picture
of demand, authors have proposed the use of bootstrap techniques (Bookbinder and
Lordahl (1989); Efron and Tibshirani (1993); Willemain et al. (2004). As we are
interested in the performance of theoretical models using real data, we estimate the
LTD distribution using the Willemain’s bootstrap method along with another novel
procedure using empirical data. In this way we estimate the distribution of demand
over the lead time for each model, which is used in turn to evaluate the parameters of
the inventory policies selected. However, different to the methods found in the
literature, our objective is to use directly the real demand values observed to assess
the performance of the policies using the simulation tool. To keep the study tractable,
we do not apply updating for the estimation of the LTD distribution. We also evaluate
the performance of the system using normal and Poisson distribution based models.
Below we describe these methods.
Willemain’s Bootstrap method (W)
We implemented the modified bootstrap method presented in Willemain et al. (2004).
This method, as compared to traditional bootstrap techniques presented in the
literature, has the advantage of capturing better the autocorrelations between demand
realizations, especially when dealing with intermittent demands with a high
proportion of zero values. The method first evaluates the empirical transition
probabilities between states of zero demand and states of positive demand for the
different items. Then using this information, a stream of zero and non-zero demands is
randomly generated for a period of length equal to the lead time. The non-zero values
are filled with demand values sample from the data set. In this way estimates of LTD
for each item are obtained for a large number of realizations (1000 in this study). This
information is finally used to estimate the distribution of LTD. Willemain et al. (2004)
applied this method to nine large industrial data sets of service parts inventories and
compared it with the exponential smoothing method and the Croston’s method. He
concluded that the modified bootstrap method gave the best performance of all three
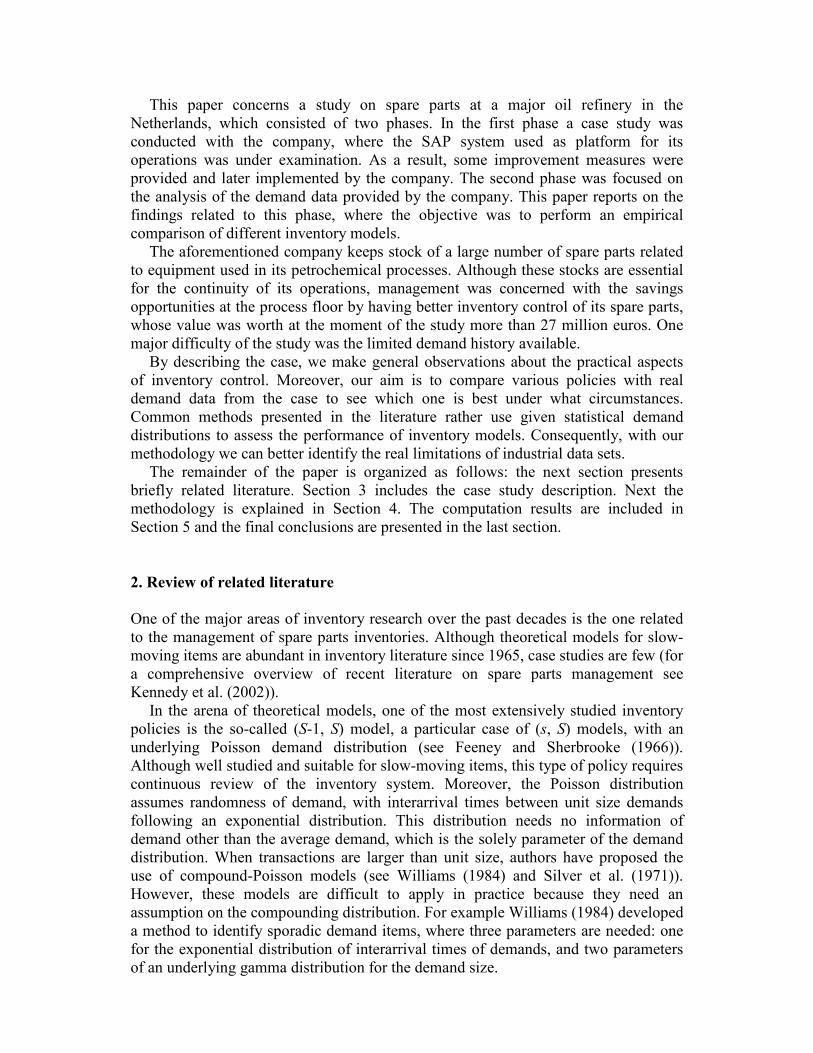
methods. In Fig. 1 we show a plot of an estimation of the LTD distribution using
Willemain’s method for an item corresponding to class 415. The item (labelled #741)
has a lead time of 9 periods and its demand data for the 55 periods is as follows: in
periods 5 and 17 it observed positive demands of unit size each, and in period 9 a
demand of 2. The rest of the periods no demands were observed. Notice that although
only lead time demand values of 1 and 3 were realized in the data set, the method is
able to produce a LTD estimation where many other lead time demand values are
taken into account.
Empirical distribution of lead time demand (E)
We implemented an empirical model to estimate the distribution of LTD. Different to
the traditional bootstrap method, we construct a histogram of demands over the lead
time without sampling. This method is new to the literature as no attempts have been
made to use it for inventory control. Since demands are taken directly from the data
set over fixed periods of time equal to the lead time, this method also captures
autocorrelations and fixed demand intervals due to preventive maintenance, and is far
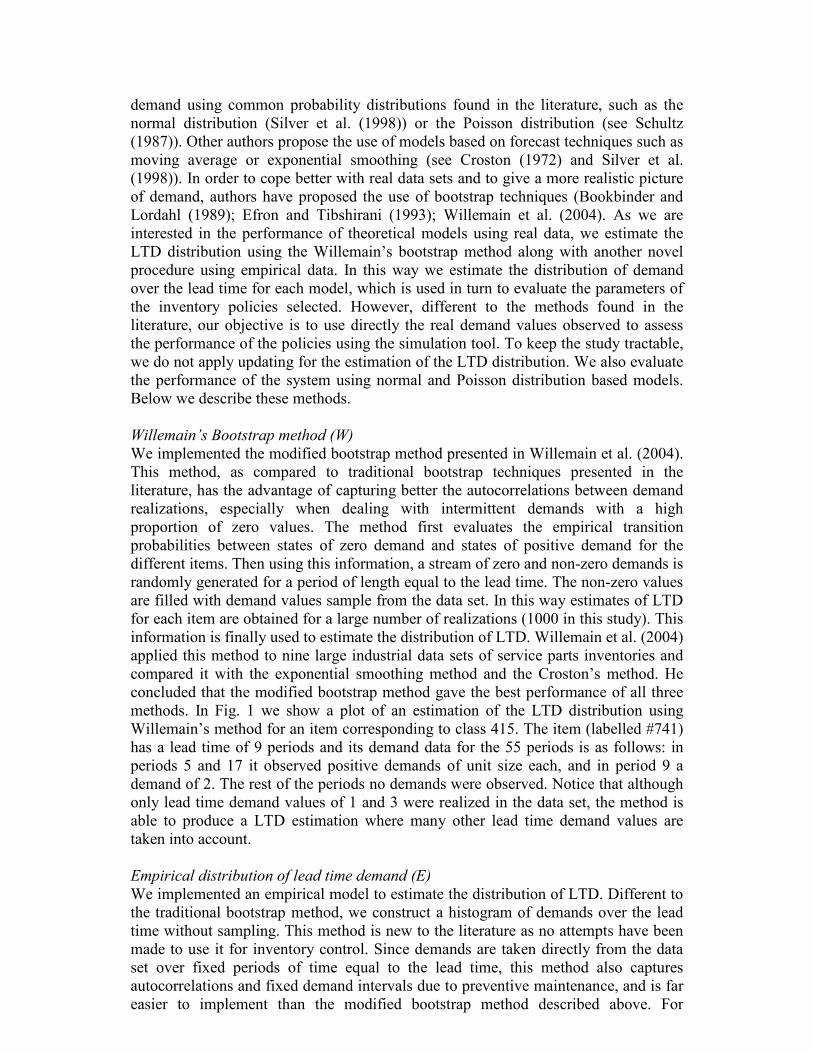
easier to implement than the modified bootstrap method described above. For

example, consider an item with the following stream of demands over 40 periods with
a lead time of 3 periods:
Period 1 2 3 4 5 6 7 8 9 10 11 12 13 14 15 16 17 18 19 20 21 22 23 24 25 26 27 28 29 30 31 32 33 34 35 36 37 38 39 40
Demand 0 0 0 0 2 0 2 0 0 0 0 0 0 0 0 0 0 0 0 2 0 2 0 0 0 0 0 0 1 0 0 0 0 0 0 0 0 1 0 0
Assuming that the above sequence of demand values can occur at any point in time
after a future demand observation, then 4 is a possible realization for a LTD value. Of
course the same is true for 1 and 2. In this case we require that the estimation method
captures these possibilities; that is of having a LTD of 4 with a positive associated
probability, and a LTD of 2 with a higher associated probability. As the empirical
method will construct a cumulative distribution function (cdf) over a lead time of 3
consecutive periods for the whole data set, the LTD values of 2 and 4 will be
estimated with probabilities of 0.21 and 0.053, correspondingly. In Fig. 2 we show a
plot of the LTD distribution (cdf) for this item. This example was constructed for
illustrative purposes.
0 2 4 6 8 100.4
0.5
0.6
0.7
0.8
0.9
1
x
F(x)
Item # 741 Willemain's CDF
Figure 1. Cumulative distribution function using Willemain’s method
Empirical cdf
0%
20%
40%
60%
80%
100%
0 1 2 3 4
Lead time demand
Figure 2. Empirical cumulative distribution of lead time demand
Normal distribution (N)
We implement a normal based model assuming that demand for the parts follows a
normal distribution. To this end, the average (D ) and standard deviation (S.D.) of the
observed period demand is evaluated to estimate the parameters µLTD and σLTD of a
normal LTD distribution, as follows:

LDLTD ⋅=µ
LDSLTD ⋅= ..σ ,
where L is the lead time of an item in full periods of time (days, months, etc.), and
with D and S.D. evaluated using the whole data set of demands, including zero and
negative values. Thus, for integration over a normal LTD distribution we use common
formulas found in the literature (e.g. Silver et al. (1998) or Chopra and Meindl
(2004)).
The normal distribution is not generally advised for modeling the demand of slow
moving items, for which a Poisson distribution is better recommended (Silver et al.
(1998)). Thus, we do not expect the normal based model to give better results than the
others. However, we want to investigate its performance as compared to the other
models considered. To this end, when we evaluate reorder points based on the normal
LTD distribution to meet desired fill rates, the values obtained are rounded up to
integer values, and negative values are set to zero. We require this since for our
system reorder points are defined as positive integer values in accordance with the
discrete demand for parts. In the case of negative values which are set to zero no
compensation for the gain mass is applied in the integration of the normal LTD
distribution. This causes only a minor distortion in our results as we normally look at
high service levels which have associated positive re-order point values. We neither
correct for the gain mass associated with the rounding off of fractional values, as this
has also a minor effect. Accordingly, to evaluate a re-order point s for a given fill rate
level β, we use a similar procedure as the Excel “goal seek” routine (see Chopra and
Meindl (2004)), utilizing the formula:
100)(
1%100 ×
⋅−=
Q
zUNLILTDσβ ,
where UNLI(z) is the unit normal loss integral associated with the unit normal variate
z. Recall that z corresponds to a re-order point s associated with a CSL value (see
Silver et al. (1998)). Thus the product in the denominator of the above formula gives
the expected units short for a given re-order level s. As mentioned in Silver et al.
(1998), the previous formula underestimates the true fill rate if σLTD is large relative to
Q. Therefore, a correction should be made in the numerator substituting the term
σLTD⋅UNLI(z) by σLTD(UNLI (z) – UNLI (z + Q/σLTD)). By using the uncorrected
formula, we obtained conservative values of the fill rates, which did not have a major
impact in the optimization of the system (see results in sections 5.1 and 5.2).
Remark 1. Although in many situations the normality assumption is not satisfied, this
distribution has widely been used in practice. This is due to the simplicity to evaluate
reorder points and other parameters based on the normal distribution.
Poisson distribution (P)
Silver et al. (1998) suggest that the Poisson distribution is suitable to model demand
of slow moving items. We use the Poisson distribution to estimate the LTD
distribution for items in demand class 1. The reason is that demands for these items
are of unit size, and hence the basic assumption of the Poisson distribution is satisfied.

The only parameter of the Poisson distribution, the average rate of demand over the
lead time, is estimated from the demand data for the different items. For other demand
classes, a compound-Poisson based model would be more appropriate, but a number
of specific assumptions need to be satisfied in the compounding in order to expect a
good performance of this model. Since we wanted to develop robust methods that
applies equally well for different industrial data sets, we did not consider the
compound Poisson for demand classes different from 1. The Poisson based model is
compared to the normal, empirical and bootstrap methods for demand class 1.
4.2. Inventory models
We use an (s, nQ) inventory policy for the system, with the reorder point s evaluated
using the LTD distribution according to the modeling methods described above. Thus,
when overshooting of the reorder point s cannot be overcome by the lot size Q, an
alternative lot size equal to nQ is ordered, such that the inventory position is brought
above s, where n is an integer value. This is a common practice in inventory
management (see Silver et al. (1998)). The lot size Q will be evaluated according to
the economic order quantity (EOQ) using average annual demand. We round off the
EOQ calculation according to Axsäter (2000), as follows:
1. Evaluate: m = EOQ
2. Set
+
+≤≠
=
=
otherwisem
EOQ
m
m
EOQandmifm
mif
Q
1
10
01
When we use the Poisson distribution to estimate the LTD, we use Q = 1. This model
is often referred to as (S-1, S) model, with s = S-1. Notice that for demand class 1,
since average demand is generally low, the EOQ calculation is likely to produce also a
value of 1.
For the classes under study the proposed policies are compared to the current (min,
max) policy in terms of the selected service level and total costs. The aim of the
proposed methodology is to optimize the system, that is, to establish which model and
policy perform best under which conditions (see Table 2).
Table 2. Inventory models considered
Model Parameters Demand Classes
Current policy (C) min-max (s, S) 1, 4, 5, 6
Poisson based model (P) (S-1, S) 1
Normal based model (N) (sN, nQ) 1, 4, 5, 6
Empirical based model (E) (sE, nQ) 1, 4, 5, 6
Willemain based model (W) (sW, nQ) 1, 4, 5, 6

4.2.1. Handling of large demands
Consider the situation in which an item with a relatively short lead time observed
“unusual” high demands. For such an item the analysis becomes difficult as the
associated reorder point (say evaluated according to a normal LTD distribution) is
likely to be overshot when using a simulation tool to assess the performance of a
given inventory model. To illustrate this we give in Table 3 the demand data and other
relevant information for item # 1307, which has a lead time of one month. For this
item we consider that the demand value of 450 is an outlier, since this value is larger
than the average of the rest of the positive demands plus 10 times their standard
deviation. So here the aim is to construct a tool that filters out this large demand. To
this end, we implement a demand filter in the following way: all demands larger than
the average plus k standard deviations (evaluated using only positive demands) are
filtered out. For this particular item observe that k = 3 will not produce the desired
result and hence a value k = 2 is a better choice. In a similar way, for items belonging
to demand classes 4 and 5 we found that actually k = 2 was the best selection for the
demand filter. As a result of applying the mentioned filter, 8.7% of the positive
demand values for these two classes were filtered out.
Table 3. Demand data for item # 1307 Demand number of Total
value occurrancens demand
0 47 0
87 1 87
100 4 400
120 1 120
150 1 150
450 1 450
Total 55 1207
Average of demands > 0 150.9
Stand. deviation of demands > 0 122.4
Average of positive demands < 450 108.1
Stand. dev. of positive dem. < 450 20.8
Remark 2. Although for the optimization of the system we use the above filter of
demands, we also assess the effect of having large demands included in the
optimization process. We present some numerical results in the Appendix.
Remark on the implementation of the ex-post and ex-ante approaches
Due to the limitations inherent to the data set used in our simulation study, it may well
be that not enough information is used for fitting purposes. Therefore, items with only
zero or one positive demand during the fitting period are excluded from the analysis.
This consideration is used in both the ex-post and the ex-ante approaches. As for
classes with few items (6 or less), they were excluded from the analysis in both the
ex-ante and the ex-post approach. According to these considerations, of the original
11,790 items, a total of 8,494 were included in the ex-post approach and 4,326 in the
ex-ante approach (see analysis of results in sections 5.1 and 5.2).
Remark on classification of items
We include each item in a class according to the demand pattern and other relevant
information (criticality and price). We do the classification using the whole data set in
both the ex-ante and the ex-post approaches, since we want to assure that an item in a
certain category will not exhibit demand values not corresponding to that category
during the simulation in the testing period.

4.3. Optimization of the system: a decomposition approach
We focus on optimization of the system based on service levels, for which both the
fill rate and the cycle service level are used. The utilization of service levels to set
safety stocks is a preferred method in industry as opposed to cost minimization. The
reason for this is that the latter requires the evaluation of stock out costs which depend
on down time penalties and other factors which are difficult to evaluate in practice.
Considering the size of the system related to the present study (recall that
originally it comprises some 14,000 items), we use a decomposition approach for the
optimization of the system. This type of approach is well known to the literature,
where it is often used for the analysis of complex systems, e.g. for the optimization of
multi-echelon inventory systems (see van der Heijden et al. (1997)). In our case the
basic idea is to optimize the system at group level, defined by the classes described
earlier, rather than doing it at item level. Thus, we evaluate the different inventory
parameters for the items based on a single target service level for all items in the class.
Notice that deviations of the realized service levels with respect to the target values
are expected due to the discrete nature of inventory levels. Thus, the objective of the
method is to find the right level of a target service level that optimizes the classes
under study.
We first introduce the following notation:
j: index for each item j in class p, j = 1,…, Np, where Np is the size of class p.
X: identifier for the model applied in the simulation, where X = current policy
(C), Poisson (P), Normal (N), Empirical (E) or Willemain (W). )(X
jc : number of inventory cycles completed by item j during the testing period
using model X. Note: an inventory cycle is defined between the placing of an
order and its arrival to the system, i.e. the inventory cycle over a lead time
(also referred to as replenishment cycle). )(X
jsoc : number of inventory cycles for item j with stockouts during the testing period
using model X. )(t
jD : total number of units demanded of item j during the testing period.
)(X
jS : total number of units of item j supplied from on hand stock over the testing
period using model X. )(X
pCSL : cycle service level achieved by the system using the model X.
)(X
pβ : fill rate achieved by the system using model X.
βp: target fill rate for class p.
ESj(sj): expected units short for item j for a given reorder point sj, according to the
corresponding LTD distribution.
Now for each combined class p (xyz) proceed as follows:
1. Evaluate the service levels (CSL and fill rate) achieved by the current system over
the testing period according to the ex-post or the ex-ante approaches. These are
the current service levels of class p, which are defined by

∑
∑
=
=−=
p
p
N
j
C
j
N
j
C
j
C
p
c
soc
CSL
1
)(
1
)(
)( 1 ,
∑
∑
=
==
p
p
N
j
t
j
N
j
C
j
C
p
D
S
1
)(
1
)(
)(β .
2. For each item j, estimate the cumulative distribution of LTD over the fitting
period, according to the model selected (see Section 4.1). Use βp =)(C
pβ together
with the LTD distribution to estimate the corresponding parameters of the
inventory policy (i.e. reorder point and lot size), in the following way:
• Calculate Qj, the lot size, according to the EOQ formula and round it off as
explain in Section 4.2. If class p = 1yz (demand class 1) then set Q = 1.
• Chose the smallest sj which satisfies a 100βp % fill rate, i.e.:
100)(
1%100 ×
−≤
j
jj
pQ
sESβ .
3. For each item j, run the simulation over the testing period applying the (s, nQ) or
the (S-1, S) policy as required, using the parameters selected in the previous point.
For each model selected, evaluate for class p the realized fill rate (rβp), and its
total costs (TCp), according to
∑
∑
=
==
p
p
N
j
t
j
N
j
X
j
X
p
D
S
r
1
)(
1
)(
)(β , ∑=
=pN
j
targetj
X
targetp TCTC1
,
)(
, ,
where TCj,target is the total cost of item j for the target service level selected, which
comprises the holding and ordering costs. Compute the total savings achieved by
the selected model with respect to the current system according to:
)(
,
)(
,
)( model
targetp
current
targetp
model
p TCTCsavingsTotal −=
Within the classes we expect deviations of the realized service levels for the
individual items. In order to assess the magnitude of those deviations, we evaluate
the weighted variances of the realized fill rate as follows:
( )∑∑
=
=
−=p
p
N
j
X
p
X
j
X
jN
j
X
j
X
p rc
c
rVar1
2)(2)()(
1
)(
)( 1)( βββ .
An estimation of the standard deviation of the target fill rate is thus given by

)(ˆ )()( X
p
X
p rVar βσ = .
4. For each model selected check whether the realized service levels are better than
the service levels of the current system. If the answer is yes, check if it achieves
lower total costs. This will serve as a guide for optimization.
5. For classes with lower realized service levels or negative savings, construct
exchange service level-cost curves for the different inventory policies, in the
following way: define a set of fixed target values for the fill rate (βp), say from 1%
to 100% in step sizes of 1%. Next evaluate the parameters of the selected
inventory model as in point 2 (except for the current system). For each value of
the target service level obtain the corresponding rβp, TCp,target and total savings.
Finally, identify the value of βp, for which the corresponding realized fill rate
equals or exceeds the current fill rate (within 1% precision), and that achieves
positive savings. In this way we optimize the system among the different classes.
Remark 3. The previous method assumes that the system is optimized using the fill
rate as optimization criterion, which plays the role of control parameter. However, it
is possible to implement the above procedure using the CSL for the evaluation of
reorder points in steps 2 and 5, in the classical way. Even in the case for which the
optimizing criterion is the fill rate, one may decide to apply the CSL as control
parameter due to limitations associated with the evaluation of re-order points, and
optimize the system with respect to the fill rate. In the Appendix we give some results
using this method.
Remark 4. When more than one order is outstanding for an item in the simulation,
that is when 2 or more replenishments cycles overlap, we associate a stockout with the
immediately precedent cycle that has not finished yet, thus causing only that cycle to
be a stockout cycle. This situation is not considered in inventory text books such as
Silver et al. (1998), thus confusion as to how to register stockout cycles may arise. To
illustrate this consider the item #2248 (see Fig. 3.) with lot size of 2 units, lead time of
2 periods and reorder point of 2 units. In period 19 the inventory position reaches the
reorder point, triggering the first replenishment cycle. This cycle ends at the
beginning of period 21 when the system is replenished and causing the net stock to
reach 4 units. This cycle ends up with no stockouts (thus coloured white). The second
cycle starts in period 22 with net stock still positive. Notice that before this cycle
ends, a third cycle starts in period 23, where the net stock drops to -1. This causes the
second cycle to be a stockout cycle (thus coloured grey). Similarly, the demand of 8
units in period 24 causes the third cycle to be a stockout cycle, triggering a fourth
cycle. Here the question arises as to whether the fourth cycle should be counted as
stockout cycle or not. Although these two last cycles overlap we only consider the
former to be a stockout cycle. Notice that actually the fourth cycle ends up with a
positive net stock. In this way and assuming no further demands after period 31, the
item will achieve a CSL of 60%. Notice that if the fourth cycle was considered a
stockout cycle the CSL calculation would give 40%.

Item # 2248
ROP = 2
Q = 2
L = 2 periods
Period 12 13 14 15 16 17 18 19 20 21 22 23 24 25 26 27 28 29 30 31
Demands 0 1 0 0 0 0 0 1 0 0 2 3 8 0 1 0 1 0 0 0
Net stock 4 3 3 3 3 3 3 2 2 4 2 -1 -7 -4 3 3 2 2 4 4
Inventory Position 4 3 3 3 3 3 3 4 4 4 4 4 4 4 3 3 4 4 4 4
1 2 5
Cycles 3
4 ? Figure 3. Example to illustrate the occurrence of stockout cycles
Remark on the implementation of the optimization methodology
In the study we optimized the system based on the fill rate, since this service level is
of more practical importance for spare parts. We investigated however what were the
realized cycle service levels (CSL) achieved by the different classes under the models
considered. We observed that in many cases for a particular target fill rate the
corresponding CSL was way behind the current CSL. Therefore, in order to prevent
such low values of the CSL we imposed an extra condition in Step 5 of the previous
algorithm. Accordingly, for the identification of the optimal target fill rate we checked
that the realized CSL was within 5% of the current CSL as long as the system still
achieved positive savings. For some classes this condition was difficult to satisfy
exactly, and hence the realized CSL was below the 5% value. For the evaluation of
the realized CSL of class p for the different models we use the following formula:
∑
∑
=
=−=
p
p
N
j
X
j
N
j
X
j
X
p
c
soc
rCSL
1
)(
1
)(
)( 1 ,
with corresponding variance given by
( )2)(
2
1)(
)(
)(
1
)(
)( 11
)( X
p
N
jX
j
X
jX
jN
j
X
j
X
p rCSLc
socc
c
rCSLVarp
p
−
−= ∑
∑=
=
.
Accuracy of the LTD modeling methods
Since we are interested in the performance of the modeling methods applied to
inventory policies, a useful measure of the accuracy of the different models can be
provided by the average of the absolute difference between the target and the realized
service levels. As we observed earlier, differences are expected due to the discreteness
of the inventory levels. We call this measure MAD, defined by
∑=
−=pN
i
pi
p
p
CSL rCSLN
MAD1
)( 1α , for a target cycle service level αp, and

∑=
−=pN
i
pi
p
p rN
MAD1
)( 1βββ , for a target fill rate βp.
4.4. The simulation model
We implemented the proposed methodology in MatLab v.7.0. The system was
simulated over the testing period using the different inventory models. Recall that
demands for the items in each class were drawn directly from the data set and used as
input to the simulation. Thus, we were able to evaluate the performance of the
different policies and models in a real inventory environment. This allowed us to
capture the peculiarities of the system under study and to discern under which
conditions which policy performs better.
Since demands cannot occur with a higher frequency of one per month, we
consider that the system is reviewed on a continuous basis, and therefore valid for the
application of the (s, nQ) and (S-1, S) policies.
For the evaluation of inventory cycles and computation of inventory related costs
we use the classical inventory methodology. Thus, the (s, nQ) policy is implemented
in the classical way as explained in Section 4.2.
Considerations on starting stocks
Since the system orders nQ units whenever the inventory position drops below the
reorder point (or Q when it is at the reorder point), the maximum level that the system
can have at any point in time is given by its reorder point s plus Q. Therefore, for
comparison purposes it is fair to consider the starting stock of an item as its reorder
level plus its lot size Q. For the current system, an equivalent choice is to set the
starting stock of an item at its max level, since this can be considered as an order-up-
to level S with S = s + Q. This choice of starting stocks allows us to compare the
performance of the different inventory policies considered. Note that for an infinite
horizon, the CSL is indifferent to the choice of starting stock, whereas the fill rate is
not. However for a fixed data set, the starting stock may also have an effect on the
cycle service level of an item, since for higher starting stocks fewer inventory cycles
will be completed. As we use the same definition of starting stocks for all models, the
total number of inventory cycles will be the same among them, except for the current
system. To see this notice that the number of inventory cycles for an item is
independent of the choice of its reorder point. Since for all models we use the same
demand values and Q is fixed, it follows that cycles will be the same regardless of the
model used.
5. Results from the simulation optimization
After having applied the classification criteria explained in Section 3, and using the
methodology presented in the previous section, we performed an optimization of the
inventory system of spare parts. In order to have a clear picture of the whole process,
we present in Fig. 4 a flow chart diagram of the entire procedure, from cleaning and
classification of demand, price and criticality data for spare parts until the
optimization of the system itself.

Figure 4. Flow chart diagram of the optimization study
In tables 4 and 5 we give a summary of the numerical results obtained from the
simulation optimization for the ex-post and ex-ante approaches, using as optimization
criterion the fill rate (for a complete set of results of the different item classes see
tables 13 and 14 in the Appendix). We include the relevant classes under study, for
which the realized CSL, the realized fill rate and the total savings are reported for
each model. We also include the total cost of the current system with the current
achieved service levels (target CSL and target fill rate). For convenience, we use the
following notation in the optimization results tables:
Notation for optimization results tables
tCSL: target cycle service level, that is, the cycle service level achieved by
the current system (C) using the (min, max) policy.
t fill rate: target fill rate, that is, the fill rate achieved by the current system under
the (min, max) policy.
rCSL: realized cycle service level, that is the cycle service level achieved by
each of the four inventory models under consideration, these are:
Normal (N), Poisson (P), Empirical (E) and Willemain model (W).
r fill rate: realized fill rate, same observations as for rCSL.
Savings
(*) vs. (C): This is the difference between the holding and ordering costs of the
current system with respect to (N), (P), (E) and (W).
Classification of parts based on demand,
criticality and price using whole data set
Data cleaning of spare parts: identification of specification errors
and anomalous observations
Selection of relevant item classes
for the optimization and exclusion of
classes with few items
Selection of optimization
approach
Ex-ante optimization: data set splitted for
fitting and testing
Ex-post optimization: whole data set
for fitting and testing
Filtering of large demands for demand classes 4 and 5
Application of the optimization process using the decomposition approach
method (section 4.3)
Analysis of optimization results
Fitting to find LTD distribution of each item according to demand model
(exclusion of items with not enough demand data for fitting)
Testing inventory model for each item inside the class using simulation with actual
demand as input
START
Setting target service
levels for each item class
Evaluating realized service levels for each item class
as a whole

Table 4. Summary of optimization results for the system under ex-post approach
Tot. Costs* Savings Savings* Savings Savings
tCSL t fill rate (N) vs. (C) rCSL r fill rate (P) vs. (C) rCSL r fill rate (E) vs. (C) rCSL r fill rate (W) vs. (C) rCSL r fill rate
Summary by demand class
Demand class
1 2,226 3,693,400 95.6% 95.6% 774,220 96.2% 96.8% 703,250 96.8% 96.8% 762,330 96.3% 96.9% 751,500 96.0% 96.6%
4 5,185 9,469,700 84.3% 86.1% 408,750 81.1% 90.7% 202,860 80.0% 91.7% 170,000 79.1% 89.7%
5 608 685,920 77.2% 85.7% 31,370 70.0% 90.2% -15,411 37.4% 81.4% -17,797 37.8% 81.7%
6 475 1,676,100 96.5% 96.6% 92,713 96.3% 97.3% 104,950 96.3% 97.3% 61,126 96.7% 97.5%
Summary by criticality class
Criticality class
1 493 1,704,700 88.9% 88.3% 20,428 87.3% 91.8% 3,541 92.9% 92.9% -5,074 76.1% 87.7% 16,583 79.5% 88.7%
2 447 277,250 94.1% 95.3% 37,882 95.0% 97.1% 1,215 99.8% 99.8% 28,617 91.2% 97.5% 21,805 89.8% 96.4%
3 3,190 9,165,100 90.1% 89.8% 853,480 88.4% 92.7% 648,930 97.5% 97.5% 802,150 86.9% 93.5% 743,200 86.6% 92.2%
4 1,395 905,370 92.6% 92.9% 107,170 90.7% 94.9% 20,420 97.2% 97.0% 83,448 90.0% 95.7% 54,293 89.9% 94.2%
5 372 634,320 90.8% 89.8% 61,002 90.4% 93.4% 1,060 96.1% 96.1% 30,051 88.6% 94.0% 54,554 88.0% 92.9%
6 2,597 2,838,300 79.5% 85.4% 227,090 75.3% 90.6% 28,077 95.7% 95.6% 115,530 70.8% 89.9% 74,396 68.8% 88.2%
Summary by price class
Price class
2 2,223 524,350 83.2% 90.0% 179,030 79.4% 97.0% -5,415 97.9% 97.9% 166,870 75.1% 95.7% 171,200 73.7% 95.0%
3 3,266 1,608,000 87.9% 88.5% 245,180 84.7% 91.3% 25,627 98.2% 98.2% 115,240 83.3% 92.7% 73,012 83.3% 91.4%
4 2,487 3,637,300 90.2% 89.4% 200,410 90.1% 90.7% 54,393 95.5% 95.4% 71,791 86.7% 90.4% 43,397 85.6% 88.4%
5 518 9,755,400 90.4% 88.2% 682,440 88.4% 91.5% 628,640 96.0% 96.0% 700,820 83.2% 89.9% 677,220 84.0% 89.3%
Total 8,494 15,525,060 87.5% 89.2% 1,307,055 85.1% 92.6% 703,246 96.8% 96.8% 1,054,723 82.2% 92.7% 964,832 81.5% 91.4%
* All cost and savings figures are in euros.
Item class
# of
items
Current System (C)
Service level Service level
Normal Model (N) Poisson Model (P)
Service level Service level Service level
Empirical Model (E) Willemain Model (W)
Table 5. Summary of optimization results for the system under ex-ante approach
Costs* Savings* Savings Savings Savings
tCSL
t fill
rate (N) vs. (C) rCSL
r fill
rate (P) vs. (C) rCSL
r fill
rate (E) vs. (C) rCSL
r fill
rate (W) vs. (C) rCSL
r fill
rate
Summary by demand class
Demand class
1 800 504,650 95.6% 95.7% 94,010 96.5% 97.2% 63,575 96.3% 96.3% 96,409 96.2% 97.1% 36,831 96.1% 97.2%
4 2,873 1,975,100 84.8% 87.3% 53,384 81.3% 91.5% 10,900 79.1% 91.1% -18,623 79.6% 89.6%
5 475 152,750 76.3% 90.4% 11,873 80.1% 92.9% 16,379 67.2% 90.1% 12,119 72.6% 90.8%
6 178 246,130 98.9% 99.0% -1,816 96.6% 97.6% -2,571 96.6% 97.6% -3,110 96.6% 97.6%
Summary by criticality class
Criticality class
1 132 152,500 86.5% 85.7% -540 80.7% 90.7% -468 87.0% 87.0% -14,322 87.1% 91.5% -9,752 80.3% 88.9%
2 301 81,914 94.8% 96.5% 12,877 97.2% 97.8% 1,496 100.0% 100.0% 14,668 85.1% 96.6% 8,338 94.6% 96.9%
3 1,457 1,701,000 90.0% 90.5% 51,385 85.6% 91.7% 56,230 96.5% 96.5% 63,253 83.1% 91.1% -18,236 82.7% 89.9%
4 818 212,440 93.3% 94.3% 29,042 93.4% 96.1% -4,659 97.7% 97.7% 26,538 92.6% 95.7% 22,704 91.7% 94.8%
5 159 84,877 94.8% 95.2% 6,130 92.5% 95.2% 2,398 98.7% 98.7% 2,132 92.5% 95.6% 2,947 90.8% 94.7%
6 1,459 645,930 76.3% 84.6% 58,558 75.6% 91.4% 8,578 94.0% 94.0% 28,848 71.8% 90.5% 21,215 74.2% 89.9%
Summary by price class
Price class
2 1,372 144,420 81.1% 90.5% 58,581 82.9% 98.3% -1,919 95.2% 95.2% 63,142 77.6% 97.8% 58,886 84.3% 98.3%
3 1,648 377,020 87.5% 88.7% 62,667 83.9% 92.3% 1,126 98.8% 98.8% 38,379 82.6% 92.2% 21,502 80.9% 91.2%
4 1,159 831,190 90.7% 90.0% 19,185 87.4% 88.1% 10,508 94.5% 94.5% 19,131 84.9% 86.6% 8,416 83.0% 84.5%
5 147 1,526,000 90.6% 90.2% 17,017 86.1% 88.3% 53,860 96.3% 96.3% 466 83.4% 87.4% -61,587 82.0% 86.4%
Total 4,326 2,878,665 86.4% 89.7% 157,452 84.6% 93.0% 63,575 96.3% 96.3% 121,118 81.7% 92.3% 27,217 82.6% 91.5%
* All cost and savings figures are in euros
Item
class
# of
items
Current System (C)
Service level Service level
Normal Model (N) Poisson Model (P)
Service level Service level Service level
Empirical Model (E) Willemain Model (W)
5.1. Optimization results for the system as a whole
From the results at the bottom of Table 4 we can see that for the aggregated values
across all classes considered in the system, all the models outperformed the current
system under the ex-post approach, achieving lower total costs and higher fill rates,
with overall CSL within 5%±1% of the current CSL. For the different models under
the ex-post approach, we make the following observations:
The normal model achieved the best overall performance among the models,
achieving the highest total savings, although for demand class 1 the empirical and
Willemain models performed very similar with respect to the normal. For this class
the Poisson model performed the worst of all models. Total savings for the normal
model were of 8.4% over a total current cost of 15.5 million euros for the 5-year
period, and with overall fill rate of 92.6% versus a current fill rate of 89.2%. The
cycle service level achieved by this model was 85.1%, slightly lower than the one of
the current system.
The empirical model outperformed Willemain’s model in terms of total savings
(1.05 vs. 0.96 million euros), both achieving overall fill rates above 90% and similar
overall cycle service levels. To explain the difference in performance of these models,
we found that the Willemain model evaluates slightly higher reorder points to achieve

the same service level as the ones of the empirical model. This because the Willemain
method produces a larger range of different lead time demand values, whereas the
empirical method uses the exact values observed in the data set to construct the LTD
distribution. Therefore, larger deviations are expected in the LTD distribution based
on the Willemain model and expensive individual items are likely to have a higher
effect with respect to holding costs. In this respect, observe that the difference in total
savings between the two models comes from few classes with expensive items (e.g.
classes 135, 435, 635), whereas for other classes both models performed very similar
or the Willemain model performed better (see Table 13 in the Appendix). On the other
hand the normal model uses a continuous distribution of LTD, which is smoother than
the empirical or the Willemain’s one, making it less expensive to match or improve
the target service levels.
As for the ex-ante approach, we have the following conclusions (see bottom of
Table 5 and Table 14 of the Appendix):
As the ex-ante approach uses a reduced data set for fitting purposes, the
optimization of the system became more difficult than when using the ex-post
approach, which could better match or improve the target service levels at lower total
costs. Recall that fewer items are used under this approach since we only consider
items with at least two positive demands during the fitting period. Despite these
limitations, the results obtained from ex-ante approach confirmed the general
conclusions derived under the ex-post approach. First of all observe that the current
system was outperformed by all models although with lower savings.
Second, under this approach again the normal model achieved the best
performance among all models, with total savings of 5.5% with respect to the current
system and overall fill rate of 93% (over a current one of 89.7%).
Next, as in the ex-post approach, the empirical model achieved higher savings than
the Willemain model, both with realized fill rates above 90%. We can see that again
the difference comes from the very same classes as the ones discussed above for the
ex-post approach.
Finally, for demand class 1, the Poisson model performed the worst of all models,
which is the same result found under the ex-post approach.
5.2. Optimization results by demand, criticality and price classes
From the optimization results aggregated by demand, criticality and price classes
presented in tables 4 and 5, we can see the effect of the different methods on
particular classes. As we had more information available for the individual classes
under the ex-post approach, we give the following observations under this approach,
unless otherwise indicated.
All the models outperformed the current system for the different aggregated classes
with positive savings and higher fill rates, except for demand class 5, where the
empirical and the Willemain models had higher total costs and lower fill rates;
criticality class 1, where the empirical model yielded higher total costs; and price
class 2, where the Poisson model achieved also higher total costs. For the latter two,
however, the models achieved the same or higher fill rates with respect to the current
system within 1% precision. In the ex-ante approach there are few more classes where
the models could not outperform the current system (demand class 6, criticality class
3 and price class 5, with varied results for the different models).

From the optimization results by demand classes, we can see that, according to
what one would expect, for all models and for the current system the achieved service
levels (CSLs and fill rates) decreased as demand for the items increased. For low
demand items (demand classes 1 and 6), all models achieved high CSLs and fill rates,
with savings ranging from 6.2% to 20% with respect to the current system. However
for high demand items (demand classes 4 and 5) the normal model achieved much
better results than the other models, with total combined savings of 4.3%, as
compared to the corresponding savings of 1.8% and 1.5% of the empirical and
Willemain models.
From the results aggregated by criticality classes we conclude that for low to
medium criticality all models performed well. However for high critical items the
normal model performed much better than the others. For high critical items under the
ex-ante approach, observe that the current system was outperformed by the models
but at the expense of higher costs. For example the normal model achieved a fill rate
5% higher than the one of the current system but with 0.35% higher costs. (For a more
specific examination of the relation between criticality and service levels see analysis
below).
Finally, from the results by price classes, we can see that the models performed
similarly, except for price classes 2 and 3 where the Poisson model achieved negative
or low total savings.
5.3. A closer look at a class with high differences: explaining the results
We want to give in this section some specific results for one class where we observed
large differences between the models. By doing this we want to explain the
differences in the general results discussed in the previous sections. Accordingly, we
chose class 415 as an illustrative example (see optimization results for this class in
Table 13 of the Appendix). Notice that for this class the normal model was the only
one achieving positive savings. The empirical model yielded lower total costs than the
Willemain model, however it achieved a lower fill rate than the current system.
In Table 6 we present the different steps in the optimization of 4 typical items
inside class 415, with price per item of 20,000 euros. These items are representative of
the 15 most expensive items in this class, with similar lead times and total demands,
where the total number of items was 39. In Table 6 the following additional results are
presented for each item and model, along with the realized CSL, the realized fill rate
and the total costs:
(s, S): the (min, max) parameters of the current system
s: the reorder point corresponding to a target fill rate (t fill rate)
#c: total number of inventory cycles completed by the item
#soc: number of stock out cycles for the given a reorder point
#D: total number of units demanded
#S: total number of units supplied for the given a reorder point.
After running an optimization procedure for these items, we obtained the results
shown at the bottom of Table 6. As we can see from these results, the normal model is
the only one for which a target fill rate can be identified for which the combined
performance of all the items produced an optimized result with respect to the current
system (a target fill rate of 76%). For the empirical model, since we had fewer

available reorder points, this match is more difficult to obtain for a particular target
fill rate. On the other hand, the Willemain model produces a greater range of reorder
points as compared to the normal or the empirical model. However the regions of
target fill rates for the different reorder points does not allow an optimal combination
for a specific optimal target fill rate.
The previous analysis explains the high variability that we observe in the optimized
results for some of the classes presented in tables 4 and 5. Although this is a drawback
of the optimization procedure due to the decomposition approach, it allows a tractable
analysis of large scale systems like the one related to the present study. Since the
method uses the same target parameters for group of items, the stock control is less
cumbersome than in the case of parameters set at an individual level. An alternative
approach is discussed in section 5.8, where we optimize class 415 using an item level
optimization.
5.4. Service level vs. class structure
Although service levels would usually be reflected by different price or criticality
levels, we could not observe for the current system (ex-post results) a consistent
pattern in this respect. In order to have a better picture of this result, we present in Fig.
5 the aggregated current service levels in a two-entry matrix for price and criticality.
We would expect that as price increases for the same criticality level the
corresponding service levels would decrease. On the other hand, for the same price,
we expect that as criticality increases the service level also increases. However we
observe that often expensive items have higher associated service levels than cheap
ones, and low critical items have higher service levels than high critical items. For
some other cases we could observe a more consistent behavior within the line of
expectation, but a general conclusion in this respect is far from obvious. We conclude
that the inconsistencies observed are maybe the result of a wrong judgment on the part
of the stock analyst when deciding on the reorder points for the items. Also the effect
of rounding up the lead times could have an effect, since by doing this we are
generally evaluating worst service levels than the ones experienced by the system in
reality.
91.1%93.3%89.3%93.2%High
90.4%89.6%91.4%94.4%Medium
96.6%91.4%87.8%95.8%Low
Current fill rates
91.7%93.4%92.2%86.6%High
91.8%89.3%89.8%91.4%Medium
96.2%91.7%90.1%95.0%Low
Current CSLs
p>2112169<p<211213.6<p<169p<13.6Criticality
Price in
euros
91.1%93.3%89.3%93.2%High
90.4%89.6%91.4%94.4%Medium
96.6%91.4%87.8%95.8%Low
Current fill rates
91.7%93.4%92.2%86.6%High
91.8%89.3%89.8%91.4%Medium
96.2%91.7%90.1%95.0%Low
Current CSLs
p>2112169<p<211213.6<p<169p<13.6Criticality
Price in
euros
Criticality
increases
Price increases
Figure 5. Double-entry matrices for CSLs and fill rates of the current system

Table 6. Optimization results for some items in class 415 Current system (C)
(s,S) #c #soc #D #S Total costs CSL fill rate t fill rate s #c #soc #D #S Tot. costs rCSL r fill rate t fill rate s #c #soc #D #S Tot. costs rCSL r fill rate t fill rate s #c #soc #D #S Tot. costs rCSL r fill rate
870 (1,2) 2 0 3 3 44,655 100% 100% 1% 0 2 1 3 2 22,155 50% 67% 1% 0 2 1 3 2 22,155 50% 67% 1% 0 2 1 3 2 22,155 50% 67%
(L=1) 86% 1 2 0 3 3 44,655 100% 100% 95% 1 2 0 3 3 44,655 100% 100% 90% 1 2 0 3 3 44,655 100% 100%
99% 2 2 0 3 3 67,572 100% 100% 94% 2 2 0 3 3 67,572 100% 100%
97% 3 2 0 3 3 90,489 100% 100%
99% 4 2 0 3 3 113,410 100% 100%
100% 6 2 0 3 3 159,240 100% 100%
11216 (2,2) 2 0 4 4 44,239 100% 100% 1% 0 2 2 4 2 26,322 0% 50% 1% 0 2 2 4 2 26,322 0% 50% 1% 0 2 2 4 2 26,322 0% 50%
(L=6) 43% 1 2 0 4 4 44,239 100% 100% 53% 2 2 0 4 4 67,155 100% 100% 31% 1 2 0 4 4 44,239 100% 100%
83% 2 2 0 4 4 67,155 100% 100% 52% 2 2 0 4 4 67,155 100% 100%
97% 3 2 0 4 4 90,072 100% 100% 71% 3 2 0 4 4 90,072 100% 100%
100% 5 2 0 4 4 135,910 100% 100% 85% 4 2 0 4 4 112,990 100% 100%
93% 5 2 0 4 4 135,910 100% 100%
97% 6 2 0 4 4 158,820 100% 100%
99% 7 2 0 4 4 181,740 100% 100%
100% 12 2 0 4 4 296,320 100% 100%
11186 (2,2) 2 0 4 4 49,239 100% 100% 1% 0 2 2 4 2 28,822 0% 50% 1% 0 2 2 4 2 28,822 0% 50% 1% 0 2 2 4 2 28,822 0% 50%
(L=3) 62% 1 2 0 4 4 49,239 100% 100% 78% 2 2 0 4 4 72,155 100% 100% 65% 1 2 0 4 4 49,239 100% 100%
95% 2 2 0 4 4 72,155 100% 100% 76% 2 2 0 4 4 72,155 100% 100%
100% 3 2 0 4 4 95,072 100% 100% 87% 3 2 0 4 4 95,072 100% 100%
95% 4 2 0 4 4 117,990 100% 100%
99% 5 2 0 4 4 140,910 100% 100%
100% 7 2 0 4 4 186,740 100% 100%
5982 (2,2) 2 1 4 2 40,072 50% 50% 1% 0 2 1 4 1 23,405 50% 25% 1% 0 2 1 4 1 23,405 50% 25% 1% 0 2 1 4 1 23,405 50% 25%
(L=8) 32% 1 2 1 4 2 40,072 50% 50% 34% 2 2 1 4 3 62,572 50% 75% 14% 1 2 1 4 2 40,072 50% 50%
76% 2 2 1 4 3 62,572 50% 75% 96% 4 2 0 4 4 107,990 100% 100% 40% 2 2 1 4 3 62,572 50% 75%
94% 3 2 0 4 4 85,072 100% 100% 63% 3 2 0 4 4 85,072 100% 100%
99% 4 2 0 4 4 107,990 100% 100% 80% 4 2 0 4 4 107,990 100% 100%
100% 5 2 0 4 4 130,910 100% 100% 91% 5 2 0 4 4 130,910 100% 100%
96% 6 2 0 4 4 153,820 100% 100%
99% 7 2 0 4 4 176,740 100% 100%
100% 10 2 0 4 4 245,490 100% 100%
Opt. results 8 1 15 13 178,205 87.5% 86.7% 76% 8 2 15 13 178,205 75.0% 86.7% 95% 8 1 15 14 246,537 87.5% 93.3% 70% 8 1 15 14 223,621 87.5% 93.3%
Willemain's Model (W)
Item #
Normal Model (N) Empirical Model (E)

25
5.5. Optimization curves: cost vs. service level
In Fig. 6 we show a couple of typical optimization curves for a particular class. The
upper plot corresponds to the exchange curve between target and realized fill rates.
The current policy is represented by a horizontal line. The lower picture shows the
total holding and ordering costs as a function of the realized fill rate for the current
system and for the normal, empirical and Willemain models. Obviously the current
policy is represented by a single point. The plots correspond to class 433 (demand
class 4, medium criticality and 13.6 < price ≤ 169 euros), and the precision of the graphs is 1%.
Figure 6. Optimization curves for class 433.
As we can see from the lower plot, the point associated to the current system lies
above the curves for the three models. Therefore we can achieve higher fill rates with
positive savings for the three models (see numerical results for this class in Table 13
of the Appendix). Notice that the normal curve is less steep than the ones for the
empirical and Willemain models in the optimization region (around a realized fill rate
of 90%), therefore achieving higher savings for this class. This behavior of the normal
model illustrates the better performance of this model over the others for some
relevant classes, which had the overall impact discussed previously. Observe also that
for this class the Willemain curve is above the empirical one, which illustrates the
0 10 20 30 40 50 60 70 80 90 10060
70
80
90
100Class 433: Realized fill rate vs. Target fill rate
target fill rate
Realized fill rate
60 65 70 75 80 85 90 95 1000
2
4
6
8
10x 10
5 Class 433: Total costs vs. Realized fill rate
realized fill rate
Total Costs
Current policy
(E)
(N)
(W)
Current policy
(E) (N)
(W)

26
better performance of the latter with respect to the former. Finally notice that the
normal model needed a higher target fill rate to achieve its optimal realized fill rate
than the other models. From this we can conclude that the empirical and Willemain
models are more accurate in terms of predictability of the service levels. Although in
this case the three models yielded a “good” performance over the current policy, for
other classes the optimization was more difficult, as we showed in Section 5.3.
In Fig. 7 we present the corresponding optimization curves for class 135 (demand
class 1, medium criticality and price > 169 euros). Here we can appreciate the
performance of the Poisson model with respect to the other models. As we can see
from the lower plot the performance curves for the four models are very similar
around the optimization region (realized fill rate of 95%~97%), all of them clearly
outperforming the current policy. From the upper plot we can see again that the
“predictability” of the normal model is the worst of all, achieving higher fill rates for
lower target values than the other models. Notice that for higher fill rates the Poisson
model is the more accurate in this respect. Observe however that in terms of the
optimization performance this does not have a great impact for the normal or the other
models.
Figure 7. Optimization curves for class 135.
0 10 20 30 40 50 60 70 80 90 10090
92
94
96
98
100Class 135: Realized fill rate vs. Target fill rate
target fill rate
realiz
ed fill rate
93 94 95 96 97 98 99 1000
1
2
3
4x 10
6 Class 135: Total Costs vs. Realized fill rate
realized fill rate
Total Costs
Current policy (E)
(P)
(N)
(W)
Current policy
(E)
(N)
(W)
(P)

27
5.6. Accuracy of the models and variability within the classes
As the number of inventory cycles completed by each item inside a given class may
vary greatly, we expect variations inside the classes between the target and the
realized fill rates for the individual items. In order to give an estimation of the
accuracy of the models, in Table 7 we present the average and maximum values of the
fill rate MADs, aggregated for the different demand classes. For the calculation the
current fill rates were used as target values under the ex-post approach. As we can see
from the results, the MAD calculation associated with high demand classes yielded
higher average and maximum values. From the average results we can conclude that
the accuracy of the models varies between 4% and 17% as given by the MADs, which
for the type of system that we are dealing with is acceptable.
Table 7. Average and maximum MADs for target fill rates
Demand class
Average Maximum Average Maximum Average Maximum Average Maximum
1 5.5% 15.2% 5.8% 15.4% 5.5% 15.2% 5.8% 15.2%
4 12.3% 18.2% 13.2% 20.9% 14.0% 23.0%
5 12.9% 24.6% 17.6% 36.3% 15.3% 24.6%
6 4.3% 8.8% 4.4% 8.5% 4.4% 8.5%
Normal Model (N) Poisson Model (P) Empirical Model (E) Willemain Model (W)
Another measure of variability is the one provided by the weighted variances of the
realized service levels, as defined in section 4.3. This measure is more related to the
performance of the system than the MAD calculation, as it assesses the variability of
the realized service levels for a given set of parameters within a class. In Table 8 we
give the values of the variances aggregated for the demand classes for the different
models. As we can see from the results the service level variances associated with
high demand classes are higher than for low demand classes. In general, for the same
demand class the variances of realized CSLs and fill rates are within similar ranges
for the different models. Again taking into account the stochastic nature of the system
under study we consider that these values are within acceptable levels.
Table 8. Variances of realized fill rates and CSLs
Demand
class Average Maximum Average Maximum Average Maximum Average Maximum
Variance of CSLs
1 1.2% 3.8% 0.9% 3.2% 1.2% 3.8% 1.3% 3.8%
4 6.9% 20.2% 9.0% 17.8% 9.9% 20.7% 9.9% 20.7%
5 5.3% 12.8% 9.1% 14.5% 8.0% 11.3%6 1.0% 3.0% 1.0% 2.5% 0.9% 2.5%
Variance of fill rates
1 1.1% 4.2% 0.9% 3.2% 1.0% 4.2% 1.2% 4.2%
4 4.6% 10.5% 2.2% 6.2% 4.6% 9.7%
5 8.8% 35.2% 6.4% 24.3% 4.2% 18.2%
6 0.6% 3.2% 0.6% 3.2% 0.6% 3.2%
Normal Model (N) Poisson Model (P) Empirical Model (E) Willemain Model (W)

28
5.7. Individual items
Although the optimization of the system has so far been performed at class level,
where target service levels are the same for all items inside the class, it is interesting
to look at the difference between the models for individual items. With this idea we
show in Fig. 8 a number of interesting plots for two typical items belonging to classes
534 and 124. These plots are analogous to the ones shown in Figs. 5 and 6 but at an
item level. The data for these items is given in Table 9. As we can see from the plots
the curves of item #1835 are smoother than the ones of item #7559. Since demands
for the latter are of unit size, the steps in realized service levels and associated costs
are bigger for a given target service level. For some classes these discrete “jumps” in
realized service levels for the items made the optimization very difficult, as it was the
case for class 124. As for item #1835 the normal and Willemain models yielded very
smooth curves in spite of the few observed demands. For the class where this item
belongs this proved to be advantageous for these two models with respect to the
empirical model.
Table 9. Data for items depicted in Fig. 8. Item # 1835, Class 534
L = 31 days (1 month)
Price = 236 euros
Demands 10 24 76
Period 12 49 52
Item # 7559, Class 124
L = 44 days (2 months)
Price = 485 euros
Demands 1 1 1 1 1 1 1 1 1 1 1
Period 6 9 12 13 18 26 29 39 47 49 55
5.8. Optimization using a marginal approach (item level optimization)
As we saw in the analysis presented in Section 5.3, the optimization method based on
the decomposition approach may not find an optimal solution for classes where items
have large differences in holding costs. This because we use a single target fill rate for
all items inside the class. As this effect depends on the ratio of most expensive items
to the cheapest ones, we try to minimize it by clustering the items in the price classes
defined for the study. However, as we saw in the optimization results, for some
classes we could not outperform the current policy using the proposed methodology.
In order to overcome this problem, one should optimize the different classes using a
marginal approach. To this end, the optimal re-order point for each item should be
found independently using a measure of the contribution of the item to the overall fill
rate of the class per monetary unit invested. As the procedure considers each item
individually, for large scale systems the associated computation effort may be large
and therefore the implementation of such a method is not feasible. Hence, for these
cases an approach of the type presented in this study may be more suitable.
Accordingly, we present in this section an alternative optimization approach for the
system based on the marginal approach described above, using the fill rate as the
optimization criterion. This procedure is similar to the one presented in Muckstadt
(2005), where a Poisson model is used to optimized the system subject to a budget
constraint. First we introduce the following notation:

(N)
(E)
(W)
Item #1835, Class 534
0 50 1000
50
100Realized fill rate vs. Target fill rate
target fill rate
r fill rate
0 50 1000
50
100
target fill rate
r fill rate
0 50 1000
50
100
target fill rate
r fill rate
20 40 60 80 1000
1
2x 10
4 Tot. Costs vs. r fill rate
r fill rate
Total costs
0 50 1000
2
4x 10
4
r fill rate
Total costs
0 50 1000
1
2
3x 10
4
r fill rate
Total costs
Item #7559, Class 124
(N)
(E)
(W)
(P)
0 50 10090
95
100Realized fill rate vs. Target fill rate
target fill rate
r fill rate
0 50 10090
95
100
target fill rate
r fill rate
0 50 10090
95
100
target fill rate
r fill rate
0 50 10090
95
100
target fill rate
r fill rate
90 95 1000
2000
4000Total Costs vs. Realized fill rate
r fill rate
Total costs
90 95 1000
1000
2000
r fill rate
Total costs
90 95 1000
5000
r fill rate
Total costs
90 95 100500
1000
1500
r fill rate
Total costs
Figure 8. Plots for typical items.

30
jD : average annual demand of item j.
sj( β ) : reorder point of item j associated with a fill rate β.
)( jj sβ : expected fill rate of item j corresponding to a reorder point sj as given
by the LTD distribution (see Step 2 of method in Section 4.3).
s(k) : the k
th set of given reorder points for a group of items, say [s1, s2,…, sn]
( ))( )(k
p sE β : expected fill rate for class p associated with the kth set of reorder points
for the items inside the class, given by:
( )∑
∑
=
=
⋅
=n
j
j
n
j
j
k
jj
k
p
D
Ds
sE
1
1
)(
)(
)(
)(
β
β .
Note: For illustrative purposes, we implemented this method for some of the classes
for which we could not outperform the current policy using the original methodology.
Optimization method using expected marginal contributions to the class fill rate
1. For each class p, say with n items, consider an initial list s(0) of available reorder
points as given by the corresponding LTD distribution of each item, say for β = 0%:
],...,,[)0()0(
2
)0(
1
)0(
nssss = .
2. For each item j evaluate the expected marginal contribution to the fill rate of the
class per incremental euro invested if sj(k) is increased to sj
(k+1), where sj
(k+1) is the next
available reorder point given by the LTD distribution of the item (in the case of the
normal model this is equivalent to increase the reorder point by one unit). That is,
evaluate
)(
))()(()(
)()1(
)()1(
)1(
k
j
k
jj
k
jj
k
jjjk
jssh
ssDs
−
−=∆
+
+
+ββ
,
where hj is the annual unit holding cost of item j.
3. Increase the reorder point of the item with the highest value of )( )1( +∆ k
js , say item l,
to get a new list of reorder points, given by
],...,,...,,[)()1()(
2
)(
1
)1( k
n
k
l
kkk sssss ++ = .
4. Simulate the system with the list of reorder points given by s(k+1)
and evaluate the
realized CSL, the realized fill rate, the total costs and the total savings for the class.
5. Compare with the current policy as in step 4 of the previous optimization method
(Section 4.3). If the realized service levels for the class are below the current ones,

31
repeat steps (2)-(4) until the service levels are within acceptable levels or until the
total costs for the class exceed the current ones.
In Table 10 we present the results for the optimization of classes 165, 415 and 533
using the above method. We also include the results of the optimization using the
decomposition approach of Section 4.3. As we can see from the results, for all three
classes the models yielded better results with respect to the previous optimization
method, except in the case of the empirical model for classes 165 and 415, which
achieved higher total costs than before. Notice that as we are looking at the optimal
individual reorder points, the new method can take better advantage of the LTD
distributions modeled according to the different methods. However, as for the
previous optimization method, some problems may arise as we are limited by the
range of re-order point values associated with the LTD distribution. This effect is
manifested more clearly in the case of the empirical model, as we observed in the
results.
Table 10. Optimization results for selected classes using the marginal approach
Tot. costs Method Savings Savings Savings Savings
CSL fill rate (N) vs. (C) rCSL r fill rate (P) vs. (C) rCSL r fill rate (E) vs. (C) rCSL r fill rate (W) vs. (C) rCSL r fill rate
165 316,280 95.4% 95.4% Marginal 232 95.4% 95.4% 232 95.43% 95.43% -3,706 95.4% 95.4% -808 96.1% 96.1%
Decomposition -59 95.4% 95.4% -59 95.40% 95.40% -59 95.4% 95.4% -2,687 96.1% 96.1%
415 880,410 83.2% 81.3% Marginal 52,222 78.8% 88.8% -9,436 72.1% 82.1% -1,705 62.5% 81.3%
Decomposition 19,234 78.8% 87.9% -7,558 53.8% 77.2% -8,027 69.2% 84.8%
533 101,200 74.1% 75.6% Marginal 17,815 68.2% 75.0% 29,939 58.5% 72.9% 29,805 67.2% 74.4%
Decomposition -2,658 60.4% 78.6% -1,673 44.9% 67.6% -3,697 45.5% 73.6%
Item
Class
Current System (C) Normal Model (N) Poisson Model (P) Empirical Model (E) Willemain Model (W)
Service level Service level Service level Service level Service level
6. Conclusions
In this study we present a methodology for the empirical test of different inventory
models with actual data for spare parts, using two different approaches, namely an ex-
post and an ex-ante approach. Although in practice the ex-ante approach is of more
relevance than the ex-post, as information for spare parts is always limited it is also
more difficult to implement. As a result, for the ex-post approach we showed that the
current stock control practices can be improved by using the theoretical models
considered, however using the ex-ante approach the results were less conclusive.
Consequently, total savings of up to 6.4% in holding costs can be achieved by having
a better inventory control. We have to note however, that using rounded-up values for
the lead times generally hurts the realized service levels. A more refined study would
require the use of more accurate values for the lead times. Of course this would also
require more specific information about the demand data, which is often in practice
difficult to obtain.
According to our study, we can derive the following general conclusions on the
inventory control of spare parts:
• We observed erratic high demands partially caused by preventive
maintenance, which needs to be identified for a better stock control of the
parts.
• Spare parts present low to very low demand values (in some cases no demand
observations were observed during 5 years). With so limited data the
application of theoretical models is troublesome.

32
• Predictability of theoretical models is an important issue, as it measures the
expected service level of a policy with given parameters when confronted with
real data. We observed large differences between target and realized service
levels, with maximal values of up to 40%.
• Inventory control packages as SAP R/3 do not provide the right tools for the
control of spare parts, since they only include the cycle service level (CSL) as
service measure. In this case, a more appropriate measure is provided by the
fill rate.
• A theoretical analysis of the type presented in this thesis may be hampered by
non-stationarity of the demand data, as lead time demand patterns may change
over time.
• The information provided on the demand sizes is an important issue, as they
are often not related to the number of items installed. As a consequence of
this, compound-Poisson models are difficult to use.
• Inventory models can save money and improve service levels, even in the ex-
ante approach.
For the models under study we have the following general conclusions:
• Contrary to expectation, the normal model performed very well in the
optimization, being the one that achieved the best overall performance in both
the ex-post and the ex-ante approaches, achieving total savings of 8.4% (about
1.3 million euros) over the current system. This in spite of the fact that the
demand process for spare parts does not generally follow a normal
distribution. We observed that the normal LTD distribution is less sensitive to
changes in service level values, and thus more conservative reorder points are
advised when using this distribution as compared to Poisson, Willeman or the
empirical LTD distributions.
• The Poisson model performed equally or worse than the others for items with
0-1 demands. We consider that the Poisson assumption may not be correct, as
this model seems to overstock in several cases.
• The empirical model yielded a better overall performance than the Willemain
model, with total savings of 1.05 and 0.96 million euros, correspondingly.
• All models outperformed the current system with savings and service levels
about the same order. This can be seen as a validation of the implementation
of the different models.
• For the different criticality, demand and price classes considered, all the
models performed similarly, with only some particular classes where the
normal model yielded higher savings. In this respect we did not observe a
differentiated effect of the use of the different models applied to the various
kinds of classes.
• All the previous conclusions we corroborated by the ex-ante approach.
Acknowledgements
The authors are thankful to Rutger de Mare and Jeroen Hazeu for their support in the
implementation of the methods used in this paper. The research reported in this paper
has been sponsored by the Transumo research program.

33
Appendix
Optimization with stockout costs included
Stockout costs are more difficult to assess in practice than holding or ordering costs,
as many things may happen in a stockout situation. Yet they are central for initial
stocking decisions. These costs were defined by the HQ of the company as a penalty
(in euros) for not having the part available from stock when needed. Accordingly, a
different penalty was assumed for the items depending on their criticality classes, as
follows:
High critical items: 12,500 euros per part short per day
Medium critical items: 2,500 euros per part short per day
Low critical items: 50 per stock out occasion
The previous figures are set by the management based on expert judgment.
Although these costs may occur in practice, when the system experiences shortages of
critical items a number of actions can be taken in order to avoid high stockout costs,
like emergency orders or the use of parts from a nearby stock site. We want to give in
this section an estimation of the effect of stockout costs in the optimization process.
In Table 11 we present the results corresponding to the optimization of class 533
(high demand items, medium criticality and 13.6 < price ≤ 169 euros), using the normal model, with total costs evaluated with and without stockout costs. Notice that
using stockout costs in the optimization leads us to select high values of the
optimization control parameter since this achieves the highest savings. In this example
the system would be optimized for a target fill rate of 100% (99.99%) that achieves a
realized fill rate of 97.4% and with total savings as indicated in Table 11 (last row of
the table). On the other hand, the optimization procedure without stockout costs
would produce optimized results for a target fill rate of 95%, as indicated in bold
numbers in Table 11. In both cases we outperform the current system; however, the
holding costs associated with the former case are much higher. Of course in this case
we aim to increase the service level as much as possible in order to avoid the high
stockout costs experienced by the current system. The question remains as whether
these high values for stockout costs are realistic, which was the main reason for not
including them in our previous analysis.
Table 11. Optimization results for class 533
Total costs
(without
stockout costs)
Total costs
(with stockout
costs) CSL fill rate
Target fill rates
(optimization
step)
Savings
without
stockout costs
Savings with
stockout
costs rCSL r fill rate
101,200 256,750,000 74.1% 75.6% 90% 15,049 3,165,000 51.9% 70.1%
101,200 256,750,000 74.1% 75.6% 91% 12,830 14,263,000 51.9% 71.3%
101,200 256,750,000 74.1% 75.6% 92% 10,621 25,061,000 53.5% 72.5%
101,200 256,750,000 74.1% 75.6% 93% 7,702 38,333,000 57.2% 73.9%
101,200 256,750,000 74.1% 75.6% 94% 4,846 52,130,000 58.3% 75.3%
101,200 256,750,000 74.1% 75.6% 95% 1,689 67,052,000 59.4% 76.8%
101,200 256,750,000 74.1% 75.6% 96% -2,658 84,522,000 60.4% 78.6%
101,200 256,750,000 74.1% 75.6% 97% -7,395 104,240,000 64.7% 80.7%
101,200 256,750,000 74.1% 75.6% 98% -14,354 127,640,000 67.4% 83.3%
101,200 256,750,000 74.1% 75.6% 99% -25,138 160,920,000 73.8% 87.1%
101,200 256,750,000 74.1% 75.6% 99.99% -84,397 240,590,000 93.0% 97.4%
Current Method (C) Normal Model (N)
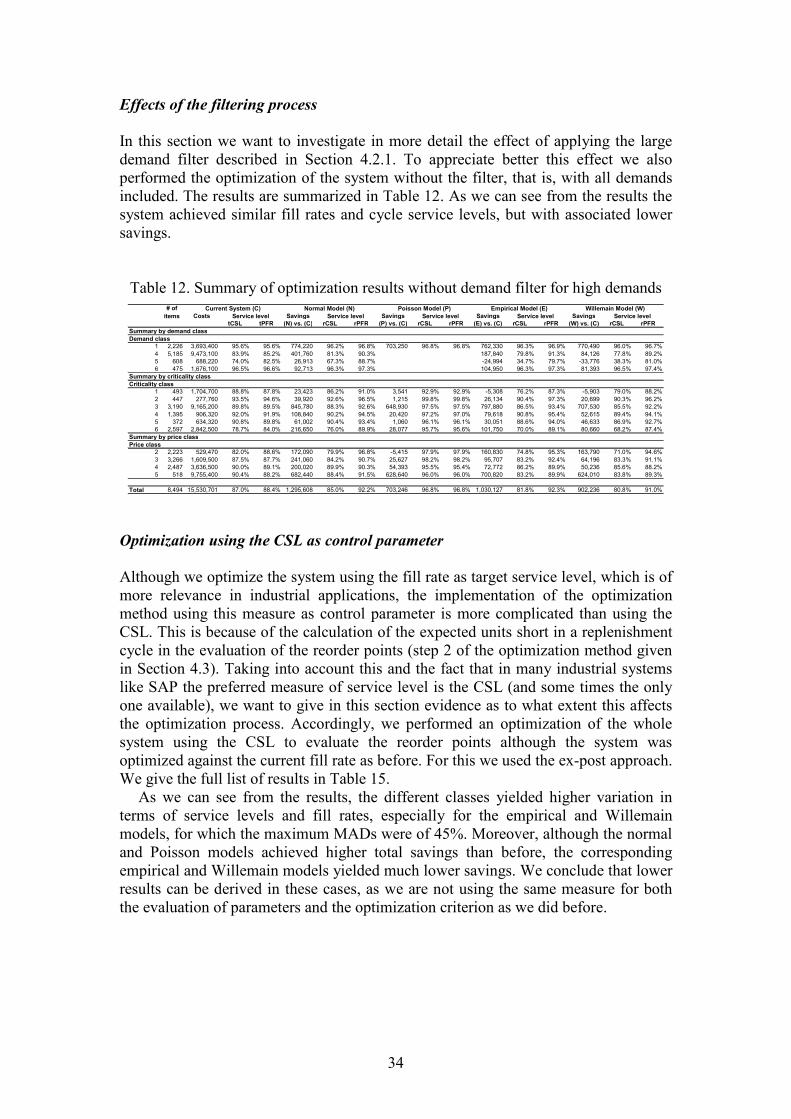
34
Effects of the filtering process
In this section we want to investigate in more detail the effect of applying the large
demand filter described in Section 4.2.1. To appreciate better this effect we also
performed the optimization of the system without the filter, that is, with all demands
included. The results are summarized in Table 12. As we can see from the results the
system achieved similar fill rates and cycle service levels, but with associated lower
savings.
Table 12. Summary of optimization results without demand filter for high demands
Costs Savings Savings Savings Savings
tCSL tPFR (N) vs. (C) rCSL rPFR (P) vs. (C) rCSL rPFR (E) vs. (C) rCSL rPFR (W) vs. (C) rCSL rPFR
Summary by demand class
Demand class
1 2,226 3,693,400 95.6% 95.6% 774,220 96.2% 96.8% 703,250 96.8% 96.8% 762,330 96.3% 96.9% 770,490 96.0% 96.7%
4 5,185 9,473,100 83.9% 85.2% 401,760 81.3% 90.3% 187,840 79.8% 91.3% 84,126 77.8% 89.2%
5 608 688,220 74.0% 82.5% 26,913 67.3% 88.7% -24,994 34.7% 79.7% -33,776 38.3% 81.0%
6 475 1,676,100 96.5% 96.6% 92,713 96.3% 97.3% 104,950 96.3% 97.3% 81,393 96.5% 97.4%
Summary by criticality class
Criticality class
1 493 1,704,700 88.8% 87.8% 23,423 86.2% 91.0% 3,541 92.9% 92.9% -5,308 76.2% 87.3% -5,903 79.0% 88.2%
2 447 277,760 93.5% 94.6% 39,920 92.6% 96.5% 1,215 99.8% 99.8% 26,134 90.4% 97.3% 20,699 90.3% 96.2%
3 3,190 9,165,200 89.8% 89.5% 845,780 88.3% 92.6% 648,930 97.5% 97.5% 797,880 86.5% 93.4% 707,530 85.5% 92.2%
4 1,395 906,320 92.0% 91.9% 108,840 90.2% 94.5% 20,420 97.2% 97.0% 79,618 90.8% 95.4% 52,615 89.4% 94.1%
5 372 634,320 90.8% 89.8% 61,002 90.4% 93.4% 1,060 96.1% 96.1% 30,051 88.6% 94.0% 46,633 86.9% 92.7%
6 2,597 2,842,500 78.7% 84.0% 216,650 76.0% 89.9% 28,077 95.7% 95.6% 101,750 70.0% 89.1% 80,660 68.2% 87.4%
Summary by price class
Price class
2 2,223 529,470 82.0% 88.6% 172,090 79.9% 96.8% -5,415 97.9% 97.9% 160,830 74.8% 95.3% 163,790 71.0% 94.6%
3 3,266 1,609,500 87.5% 87.7% 241,060 84.2% 90.7% 25,627 98.2% 98.2% 95,707 83.2% 92.4% 64,196 83.3% 91.1%
4 2,487 3,636,500 90.0% 89.1% 200,020 89.9% 90.3% 54,393 95.5% 95.4% 72,772 86.2% 89.9% 50,236 85.6% 88.2%
5 518 9,755,400 90.4% 88.2% 682,440 88.4% 91.5% 628,640 96.0% 96.0% 700,820 83.2% 89.9% 624,010 83.8% 89.3%
Total 8,494 15,530,701 87.0% 88.4% 1,295,608 85.0% 92.2% 703,246 96.8% 96.8% 1,030,127 81.8% 92.3% 902,236 80.8% 91.0%
Poisson Model (P) Empirical Model (E) Willemain Model (W)
Service level Service level Service level Service level Service level
# of
items
Current System (C) Normal Model (N)
Optimization using the CSL as control parameter
Although we optimize the system using the fill rate as target service level, which is of
more relevance in industrial applications, the implementation of the optimization
method using this measure as control parameter is more complicated than using the
CSL. This is because of the calculation of the expected units short in a replenishment
cycle in the evaluation of the reorder points (step 2 of the optimization method given
in Section 4.3). Taking into account this and the fact that in many industrial systems
like SAP the preferred measure of service level is the CSL (and some times the only
one available), we want to give in this section evidence as to what extent this affects
the optimization process. Accordingly, we performed an optimization of the whole
system using the CSL to evaluate the reorder points although the system was
optimized against the current fill rate as before. For this we used the ex-post approach.
We give the full list of results in Table 15.
As we can see from the results, the different classes yielded higher variation in
terms of service levels and fill rates, especially for the empirical and Willemain
models, for which the maximum MADs were of 45%. Moreover, although the normal
and Poisson models achieved higher total savings than before, the corresponding
empirical and Willemain models yielded much lower savings. We conclude that lower
results can be derived in these cases, as we are not using the same measure for both
the evaluation of parameters and the optimization criterion as we did before.

35
Table 13. Optimization results for the system using the ex-post approach
Tot. Costs Savings Savings Savings Savings
tCSL t fill rate (N) vs. (C) rCSL r fill rate (P) vs. (C) rCSL r fill rate (E) vs. (C) rCSL r fill rate (W) vs. (C) rCSL r fill rate
113 47 9,194 94.3% 94.4% 1,683 93.6% 96.5% 157 95.8% 95.8% 1,683 93.6% 96.5% 1,683 93.6% 96.5%
114 60 50,336 87.6% 87.8% 2,671 89.3% 90.0% 2,498 89.4% 89.4% 2,671 89.3% 90.0% 2,671 89.3% 90.0%
115 23 278,720 92.0% 92.0% 886 96.0% 96.0% 886 96.0% 96.0% 886 96.0% 96.0% 19,924 94.0% 94.0%
122 17 2,712 100.0% 100.0% 2,101 100.0% 100.0% -122 100.0% 100.0% 2,101 100.0% 100.0% 2,101 100.0% 100.0%
123 43 12,908 100.0% 100.0% 3,045 100.0% 100.0% 2,175 100.0% 100.0% 3,667 100.0% 100.0% 2,711 100.0% 100.0%
124 36 44,260 98.9% 98.9% -313 99.4% 99.4% -838 99.4% 99.4% -313 99.4% 99.4% -551 99.4% 99.4%
132 109 11,882 99.6% 99.7% 9,341 100.0% 100.0% -1,857 97.8% 97.8% 9,341 100.0% 100.0% 9,341 100.0% 100.0%
133 356 93,357 96.6% 96.8% 26,254 96.2% 97.9% 11,838 97.9% 97.9% 29,178 95.9% 97.9% 27,010 96.0% 97.9%
134 461 413,830 94.8% 94.8% 10,447 96.2% 96.3% 5,392 97.3% 97.3% 13,046 96.9% 96.9% 14,412 95.7% 95.8%
135 77 1,821,500 94.1% 94.2% 633,560 95.9% 95.9% 633,560 95.9% 95.9% 613,930 95.9% 95.9% 599,000 95.9% 95.9%
142 66 7,245 100.0% 100.0% 5,307 100.0% 100.0% -2,667 98.5% 98.5% 5,307 100.0% 100.0% 5,307 100.0% 100.0%
143 165 44,549 97.5% 97.8% 13,592 97.5% 98.9% 4,016 99.4% 99.4% 14,796 97.5% 98.9% 13,326 97.5% 98.9%
144 159 141,200 93.6% 92.3% 21,488 93.8% 93.5% 20,364 94.5% 94.0% 21,643 94.0% 93.8% 17,418 93.3% 93.5%
145 9 35,389 96.2% 96.2% -1,294 96.2% 96.2% -1,294 96.2% 96.2% -4,027 100.0% 100.0% -4,228 96.2% 96.2%
152 17 1,622 100.0% 100.0% 1,136 100.0% 100.0% -245 100.0% 100.0% 1,136 100.0% 100.0% 1,136 100.0% 100.0%
153 39 10,519 94.2% 94.8% 4,108 90.9% 96.1% 1,735 96.1% 96.1% 4,108 90.9% 96.1% 4,108 90.9% 96.1%
154 76 69,500 93.1% 93.1% 4,021 94.8% 94.8% 4,021 94.8% 94.8% 4,968 94.4% 94.4% 795 94.0% 94.0%
155 9 77,338 95.5% 95.5% -4,452 100.0% 100.0% -4,452 100.0% 100.0% -4,452 100.0% 100.0% -1,532 95.5% 95.5%
162 49 5,880 100.0% 100.0% 4,442 100.0% 100.0% -524 95.9% 95.9% 4,442 100.0% 100.0% 4,442 100.0% 100.0%
163 157 40,285 98.1% 98.1% 12,549 98.5% 99.2% 5,705 98.8% 98.8% 11,052 98.9% 99.4% 11,659 98.5% 99.2%
164 204 204,900 92.1% 92.0% 23,708 93.4% 93.3% 22,956 93.3% 93.2% 27,226 93.1% 93.0% 23,452 93.2% 93.2%
165 47 316,280 95.4% 95.4% -59 95.4% 95.4% -59 95.4% 95.4% -59 95.4% 95.4% -2,687 96.1% 96.1%
412 49 6,942 84.8% 84.4% 3,018 89.3% 99.0% 3,043 82.1% 98.5% 2,896 85.7% 98.6%
413 120 47,285 88.8% 86.2% -1,028 85.7% 89.7% -201 61.5% 82.6% -1,118 69.4% 84.3%
414 85 173,060 86.5% 85.9% -3,296 80.4% 86.3% -416 70.2% 80.1% -340 70.2% 80.1%
415 39 880,410 83.2% 81.3% 19,234 78.8% 87.9% -7,558 53.8% 77.2% -8,027 69.2% 84.8%
422 112 19,791 95.3% 98.2% 11,836 96.9% 99.7% 12,777 93.8% 99.9% 12,778 90.6% 99.3%
423 129 63,598 94.8% 93.5% 15,038 91.6% 95.9% 12,245 91.0% 97.4% 7,650 91.0% 96.8%
424 60 90,761 92.3% 92.0% 4,808 93.8% 93.0% -636 89.0% 93.2% -2,696 84.5% 88.2%
432 411 61,073 88.6% 89.2% 34,385 84.7% 98.3% 31,649 91.5% 99.6% 30,899 92.0% 99.3%
433 730 366,720 87.9% 87.6% 69,228 83.4% 89.0% 19,864 85.3% 93.8% 9,795 83.7% 90.9%
434 519 1,034,500 87.0% 83.9% 40,986 85.0% 85.2% -7,146 73.8% 83.8% -6,714 74.4% 81.0%
435 119 4,200,600 84.1% 75.9% -80,091 78.7% 83.5% -13,092 65.0% 79.7% -25,708 65.4% 77.3%
442 284 39,537 93.4% 94.8% 24,393 88.9% 99.2% 24,153 88.9% 99.5% 23,351 93.3% 99.6%
443 388 164,630 90.9% 90.2% 35,732 86.5% 91.9% 21,898 87.1% 94.6% 19,096 86.2% 91.5%
444 199 261,640 87.2% 87.6% 12,656 87.4% 89.2% -929 83.2% 88.5% -2,833 79.7% 85.0%
452 28 5,593 90.0% 91.6% 2,870 92.9% 99.6% 3,194 85.7% 97.5% 3,041 92.9% 98.3%
453 76 34,290 86.0% 80.9% 4,197 83.2% 90.1% -2,058 84.2% 93.3% -1,198 81.5% 92.1%
454 80 147,890 86.7% 85.7% 12,366 86.0% 87.8% -3,589 79.7% 88.6% -1,147 77.7% 85.7%
455 14 210,480 93.2% 94.2% 34,719 93.0% 95.7% 24,706 93.0% 95.7% 47,314 93.0% 95.7%
462 590 112,880 68.7% 84.2% 60,467 64.5% 95.9% 55,350 73.9% 98.2% 59,157 66.1% 96.3%
463 798 310,520 76.4% 80.7% 51,941 72.5% 86.3% 23,856 72.0% 87.9% 11,960 72.6% 86.2%
464 314 649,760 83.8% 83.7% 58,369 84.1% 84.8% 7,215 82.8% 86.0% -7,557 79.1% 80.1%
465 41 587,700 82.4% 79.5% -3,078 75.7% 84.6% -1,471 70.6% 82.5% -597 65.4% 77.1%
513 11 83,779 76.4% 88.2% -3,102 71.7% 88.4% -7,057 35.8% 71.4% -1,469 34.0% 74.1%
522 25 15,743 66.3% 90.2% 1,761 92.7% 99.0% 5,519 63.6% 92.1% 5,203 63.6% 91.4%
523 6 8,629 86.4% 54.9% -333 68.0% 59.8% -7,221 28.0% 82.8% -5,964 28.0% 80.7%
532 144 82,834 80.2% 89.7% 14,346 86.5% 97.8% 15,984 78.8% 97.2% 15,239 80.3% 97.5%
533 43 101,200 74.1% 75.6% -2,658 60.4% 78.6% -1,673 44.9% 67.6% -3,697 45.5% 73.6%
534 9 56,697 69.4% 75.0% 6,403 69.0% 76.6% -620 71.4% 77.1% 3,462 66.7% 77.5%
542 35 16,182 86.3% 93.2% 4,249 89.1% 96.2% 4,494 89.1% 98.2% 4,482 82.8% 97.3%
543 9 105,480 75.8% 86.4% -9,147 78.3% 85.8% -12,775 30.4% 76.0% -25,708 34.8% 70.5%
562 287 134,440 77.0% 86.9% -624 58.9% 90.4% -11,618 6.4% 74.2% -8,168 6.4% 73.7%
563 39 80,942 71.4% 70.5% 20,476 67.6% 72.5% -443 37.5% 73.7% -1,176 42.6% 77.0%
613 14 2,161 96.9% 96.9% -73 95.8% 96.9% -73 95.8% 96.9% -73 95.8% 96.9%
614 28 43,355 97.1% 97.2% 747 98.4% 98.6% 2,347 96.8% 97.2% 747 98.4% 98.6%
615 17 129,460 100.0% 100.0% -312 94.3% 95.2% -399 97.1% 97.6% -312 94.3% 95.2%
623 8 3,446 100.0% 100.0% 1,025 100.0% 100.0% 1,203 100.0% 100.0% 1,296 100.0% 100.0%
624 11 15,405 98.0% 98.0% -1,087 97.7% 98.0% -723 95.3% 96.0% -723 95.3% 96.0%
633 52 14,778 98.1% 98.2% -95 98.2% 98.8% 417 98.2% 98.8% 871 99.1% 99.4%
634 91 117,410 95.7% 95.9% 4,430 96.3% 97.0% 2,773 96.3% 97.0% 587 96.3% 97.0%
635 69 788,730 93.2% 93.3% 86,946 92.3% 94.8% 88,500 93.0% 95.2% 68,706 93.0% 95.2%
643 36 9,741 97.8% 98.5% 2,750 100.0% 100.0% 2,780 100.0% 100.0% 2,250 100.0% 100.0%
644 39 47,642 97.7% 97.8% 3,602 98.7% 98.9% 4,792 98.7% 98.9% 4,009 98.7% 98.9%
645 6 32,143 91.7% 92.3% -6,158 100.0% 100.0% 1,316 100.0% 100.0% -2,178 100.0% 100.0%
654 26 34,420 95.3% 95.5% -497 94.7% 95.5% -497 94.7% 95.5% -497 94.7% 95.5%
655 7 42,668 100.0% 100.0% 2,534 100.0% 100.0% 2,534 100.0% 100.0% 2,534 100.0% 100.0%
664 30 40,800 97.5% 97.6% -1,099 96.2% 97.6% -21 96.2% 97.6% -1,099 96.2% 97.6%
665 41 353,910 96.6% 95.9% 0 93.6% 95.9% 0 93.6% 95.9% -14,991 96.2% 97.2%
Total 8,494 15,525,060 87.5% 89.2% 1,307,055 85.1% 92.6% 703,246 96.8% 96.8% 1,054,723 82.2% 92.7% 964,832 81.5% 91.4%
Summary by demand class
Dem. class
1 2,226 3,693,400 95.6% 95.6% 774,220 96.2% 96.8% 703,250 96.8% 96.8% 762,330 96.3% 96.9% 751,500 96.0% 96.6%
4 5,185 9,469,700 84.3% 86.1% 408,750 81.1% 90.7% 202,860 80.0% 91.7% 170,000 79.1% 89.7%
5 608 685,920 77.2% 85.7% 31,370 70.0% 90.2% -15,411 37.4% 81.4% -17,797 37.8% 81.7%
6 475 1,676,100 96.5% 96.6% 92,713 96.3% 97.3% 104,950 96.3% 97.3% 61,126 96.7% 97.5%
Summary by criticality class
Crit. class
1 493 1,704,700 88.9% 88.3% 20,428 87.3% 91.8% 3,541 92.9% 92.9% -5,074 76.1% 87.7% 16,583 79.5% 88.7%
2 447 277,250 94.1% 95.3% 37,882 95.0% 97.1% 1,215 99.8% 99.8% 28,617 91.2% 97.5% 21,805 89.8% 96.4%
3 3,190 9,165,100 90.1% 89.8% 853,480 88.4% 92.7% 648,930 97.5% 97.5% 802,150 86.9% 93.5% 743,200 86.6% 92.2%
4 1,395 905,370 92.6% 92.9% 107,170 90.7% 94.9% 20,420 97.2% 97.0% 83,448 90.0% 95.7% 54,293 89.9% 94.2%
5 372 634,320 90.8% 89.8% 61,002 90.4% 93.4% 1,060 96.1% 96.1% 30,051 88.6% 94.0% 54,554 88.0% 92.9%
6 2,597 2,838,300 79.5% 85.4% 227,090 75.3% 90.6% 28,077 95.7% 95.6% 115,530 70.8% 89.9% 74,396 68.8% 88.2%
Summary by price class
Price class
2 2,223 524,350 83.2% 90.0% 179,030 79.4% 97.0% -5,415 97.9% 97.9% 166,870 75.1% 95.7% 171,200 73.7% 95.0%
3 3,266 1,608,000 87.9% 88.5% 245,180 84.7% 91.3% 25,627 98.2% 98.2% 115,240 83.3% 92.7% 73,012 83.3% 91.4%
4 2,487 3,637,300 90.2% 89.4% 200,410 90.1% 90.7% 54,393 95.5% 95.4% 71,791 86.7% 90.4% 43,397 85.6% 88.4%
5 518 9,755,400 90.4% 88.2% 682,440 88.4% 91.5% 628,640 96.0% 96.0% 700,820 83.2% 89.9% 677,220 84.0% 89.3%
Item
class
# of
items
Current System (C)
Service level Service level
Normal Model (N) Poisson Model (P)
Service level Service level Service level
Empirical Model (E) Willemain Model (W)

36
Table 14. Optimization results for the system using the ex-ante approach
Costs Savings Savings Savings Savings
tCSL t fill rate (N) vs. (C) rCSL r fill rate (P) vs. (C) rCSL r fill rate (E) vs. (C) rCSL r fill rate (W) vs. (C) rCSL r fill rate
113 10 1,148 95.5% 95.5% -7 100.0% 100.0% -49 95.5% 95.5% -7 100.0% 100.0% -56 100.0% 100.0%
114 18 6,686 81.1% 81.6% 513 90.6% 92.1% -419 81.6% 81.6% 513 90.6% 92.1% -555 93.8% 94.7%
115 1 1,030 100.0% 100.0% 0 100.0% 100.0% 0 100.0% 100.0% 0 100.0% 100.0% 0 100.0% 100.0%
122 8 675 100.0% 100.0% 559 100.0% 100.0% -14 100.0% 100.0% 559 100.0% 100.0% 559 100.0% 100.0%
123 26 3,435 100.0% 100.0% 1,938 100.0% 100.0% -44 100.0% 100.0% 1,938 100.0% 100.0% 1,938 100.0% 100.0%
124 20 10,834 98.4% 98.5% 562 100.0% 100.0% 1,555 100.0% 100.0% 1,597 100.0% 100.0% -167 98.0% 98.5%
132 38 1,800 100.0% 100.0% 1,387 100.0% 100.0% -682 97.0% 97.0% 1,387 100.0% 100.0% 1,387 100.0% 100.0%
133 126 17,510 96.7% 96.9% 6,618 95.4% 98.4% 686 98.0% 98.0% 6,826 94.3% 98.0% 6,239 94.3% 98.0%
134 160 64,218 94.0% 94.0% 11,686 94.8% 95.1% 7,638 95.1% 95.1% 10,819 94.8% 95.1% 6,328 95.9% 96.1%
135 20 251,940 93.1% 93.5% 48,588 96.8% 96.8% 48,588 96.8% 96.8% 57,403 96.8% 96.8% -489 93.5% 93.5%
142 29 1,619 100.0% 100.0% 1,161 100.0% 100.0% -1,115 95.9% 95.9% 1,161 100.0% 100.0% 1,161 100.0% 100.0%
143 73 10,227 97.3% 97.7% 4,001 98.0% 99.4% -453 100.0% 100.0% 4,086 98.0% 99.4% 3,594 95.9% 98.8%
144 70 27,042 95.1% 95.2% 4,291 96.3% 96.6% -686 95.9% 95.9% 4,291 96.3% 96.6% 2,496 96.3% 96.6%
145 3 4,573 83.3% 83.3% -2,405 100.0% 100.0% -2,405 100.0% 100.0% -2,405 100.0% 100.0% -1,334 83.3% 83.3%
152 3 141 100.0% 100.0% 83 100.0% 100.0% -20 100.0% 100.0% 83 100.0% 100.0% 83 100.0% 100.0%
153 18 1,993 100.0% 100.0% 852 100.0% 100.0% 0 100.0% 100.0% 852 100.0% 100.0% 852 100.0% 100.0%
154 23 9,840 97.4% 97.4% -667 97.2% 97.4% -448 97.4% 97.4% -352 97.2% 97.4% -1,707 97.2% 97.4%
155 1 4,221 100.0% 100.0% 2,867 100.0% 100.0% 2,867 100.0% 100.0% 2,867 100.0% 100.0% 2,867 100.0% 100.0%
162 15 1,221 100.0% 100.0% 943 100.0% 100.0% -87 85.7% 85.7% 943 100.0% 100.0% 943 100.0% 100.0%
163 39 6,267 97.3% 97.6% 3,090 100.0% 100.0% 985 98.8% 98.8% 3,090 100.0% 100.0% 3,090 100.0% 100.0%
164 85 40,389 91.5% 91.5% 3,142 92.5% 93.2% 2,869 93.2% 93.2% 5,058 91.8% 92.6% 4,791 91.8% 92.6%
165 14 37,848 91.4% 91.4% 4,810 94.3% 94.3% 4,810 94.3% 94.3% -4,299 91.4% 91.4% 4,810 94.3% 94.3%
412 17 1,476 80.8% 84.3% 669 66.7% 98.6% 761 100.0% 100.0% 416 100.0% 100.0%
413 41 8,479 85.9% 84.1% 695 81.4% 91.9% 349 86.0% 93.6% -29 69.8% 89.4%
414 24 19,921 88.4% 86.7% -559 72.7% 78.8% -43 84.1% 81.4% -220 75.0% 73.5%
415 10 104,870 85.7% 74.4% -1,497 78.6% 82.1% -15,647 71.4% 87.2% -9,334 64.3% 82.1%
422 82 6,297 97.0% 99.2% 3,800 100.0% 100.0% 3,954 66.7% 98.7% 4,202 100.0% 100.0%
423 90 20,815 96.0% 96.6% 1,536 97.0% 99.1% 5,053 92.9% 97.8% 459 94.9% 98.0%
424 37 24,348 92.6% 93.9% 2,466 93.5% 96.4% -1,760 90.9% 93.9% -423 87.0% 92.1%
432 231 16,018 90.7% 91.6% 8,233 82.8% 97.7% 8,330 82.8% 97.7% 8,471 89.7% 98.0%
433 363 80,282 89.5% 88.3% 10,956 84.8% 91.6% 3,097 84.6% 93.1% -26 78.6% 90.1%
434 247 243,860 86.5% 83.1% -344 77.4% 78.5% -353 69.7% 75.6% -1,523 68.1% 72.2%
435 49 816,360 87.8% 90.1% -27,678 78.6% 82.1% -18,160 73.8% 78.4% -38,595 71.4% 77.2%
442 198 12,536 93.6% 95.5% 7,838 100.0% 100.0% 8,096 100.0% 100.0% 8,340 100.0% 100.0%
443 246 51,392 92.8% 92.3% 11,714 88.1% 94.4% 8,931 88.5% 94.4% 5,584 88.5% 93.5%
444 124 69,464 89.7% 92.2% -1,919 88.1% 89.9% -740 85.0% 87.1% -627 80.8% 83.7%
452 14 655 92.3% 95.3% 415 100.0% 100.0% 415 100.0% 100.0% 415 100.0% 100.0%
453 40 8,238 91.3% 89.6% 2,235 88.9% 94.8% 841 88.9% 96.4% 858 88.9% 95.3%
454 41 27,507 93.8% 96.0% -553 85.3% 89.4% -1,875 85.3% 89.4% -940 78.7% 86.8%
455 2 9,770 100.0% 100.0% 0 100.0% 100.0% -1,765 100.0% 100.0% 0 100.0% 100.0%
462 343 34,861 64.3% 80.4% 20,357 63.6% 98.8% 19,640 61.4% 98.8% 19,118 68.2% 99.1%
463 460 94,819 75.3% 80.5% 17,881 71.6% 87.9% 3,795 71.4% 88.1% -759 71.6% 87.6%
464 198 195,970 86.9% 84.9% -711 82.8% 81.5% -1,157 79.3% 78.0% -1,627 74.9% 73.3%
465 16 127,180 79.3% 75.0% -2,150 67.9% 71.4% -10,862 64.3% 73.8% -12,382 67.9% 76.2%
513 7 7,632 89.5% 97.1% -443 73.7% 93.6% -337 57.9% 78.7% -63 57.9% 82.9%
522 24 6,481 75.0% 92.2% 965 94.7% 98.4% 2,333 73.7% 95.2% 1,898 78.9% 97.9%
523 5 4,542 88.9% 54.2% 1,493 75.0% 33.4% 1,436 87.5% 35.6% 400 87.5% 37.3%
532 109 19,019 78.8% 89.7% 1,637 84.1% 96.8% 2,970 78.0% 95.5% 1,641 81.7% 96.0%
533 29 28,546 78.5% 92.2% -865 64.1% 87.0% -448 40.6% 74.2% -239 42.2% 76.1%
534 6 19,485 80.0% 79.6% -712 56.3% 56.0% 683 62.5% 62.4% -38 62.5% 49.7%
542 26 5,832 86.8% 90.7% 2,369 80.0% 91.5% 2,386 80.0% 92.3% 1,578 80.0% 93.6%
543 7 9,027 84.4% 96.6% -730 100.0% 100.0% -2,246 40.0% 95.4% -1,670 40.0% 95.4%
562 235 35,786 72.9% 93.5% 8,166 82.7% 96.8% 10,127 69.2% 95.3% 8,676 77.9% 95.9%
563 27 16,405 75.8% 67.8% -9 48.1% 63.1% -525 23.1% 50.9% -64 21.2% 51.2%
614 4 1,258 100.0% 100.0% 89 100.0% 100.0% 89 100.0% 100.0% 89 100.0% 100.0%
623 5 1,055 100.0% 100.0% 290 100.0% 100.0% 290 100.0% 100.0% 203 100.0% 100.0%
624 4 3,432 100.0% 100.0% -732 77.8% 81.8% -732 77.8% 81.8% -732 77.8% 81.8%
633 22 3,387 100.0% 100.0% 740 100.0% 100.0% 674 100.0% 100.0% 609 100.0% 100.0%
634 42 30,132 98.8% 98.9% -343 93.8% 95.5% -310 93.8% 95.5% -287 93.8% 95.5%
635 15 108,440 100.0% 100.0% -8,518 92.3% 96.0% -9,666 92.3% 96.0% -1,713 92.3% 96.0%
643 14 1,819 100.0% 100.0% 681 100.0% 100.0% 681 100.0% 100.0% 583 100.0% 100.0%
644 27 15,882 97.0% 97.1% 2,040 98.0% 98.5% 2,298 98.0% 98.5% 3,000 98.0% 98.5%
645 1 3,025 100.0% 100.0% 0 100.0% 100.0% 0 100.0% 100.0% 0 100.0% 100.0%
654 14 9,630 95.7% 95.8% -252 94.1% 95.8% -85 94.1% 95.8% -632 94.1% 95.8%
655 3 12,883 100.0% 100.0% 1,152 100.0% 100.0% 1,152 100.0% 100.0% 1,152 100.0% 100.0%
664 15 11,295 100.0% 100.0% 1,189 100.0% 100.0% 1,189 100.0% 100.0% 1,189 100.0% 100.0%
665 12 43,899 100.0% 100.0% 1,849 100.0% 100.0% 1,849 100.0% 100.0% -6,570 100.0% 100.0%
Total 4,326 2,878,665 86.4% 89.7% 157,452 84.6% 93.0% 63,575 96.3% 96.3% 121,118 81.7% 92.3% 27,217 82.6% 91.5%
Summary by demand class
Dem. class
1 800 504,650 95.6% 95.7% 94,010 96.5% 97.2% 63,575 96.3% 96.3% 96,409 96.2% 97.1% 36,831 96.1% 97.2%
4 2,873 1,975,100 84.8% 87.3% 53,384 81.3% 91.5% 10,900 79.1% 91.1% -18,623 79.6% 89.6%
5 475 152,750 76.3% 90.4% 11,873 80.1% 92.9% 16,379 67.2% 90.1% 12,119 72.6% 90.8%
6 178 246,130 98.9% 99.0% -1,816 96.6% 97.6% -2,571 96.6% 97.6% -3,110 96.6% 97.6%
Summary by criticality class
Crit. class
1 132 152,500 86.5% 85.7% -540 80.7% 90.7% -468 87.0% 87.0% -14,322 87.1% 91.5% -9,752 80.3% 88.9%
2 301 81,914 94.8% 96.5% 12,877 97.2% 97.8% 1,496 100.0% 100.0% 14,668 85.1% 96.6% 8,338 94.6% 96.9%
3 1,457 1,701,000 90.0% 90.5% 51,385 85.6% 91.7% 56,230 96.5% 96.5% 63,253 83.1% 91.1% -18,236 82.7% 89.9%
4 818 212,440 93.3% 94.3% 29,042 93.4% 96.1% -4,659 97.7% 97.7% 26,538 92.6% 95.7% 22,704 91.7% 94.8%
5 159 84,877 94.8% 95.2% 6,130 92.5% 95.2% 2,398 98.7% 98.7% 2,132 92.5% 95.6% 2,947 90.8% 94.7%
6 1,459 645,930 76.3% 84.6% 58,558 75.6% 91.4% 8,578 94.0% 94.0% 28,848 71.8% 90.5% 21,215 74.2% 89.9%
Summary by price class
Price class
2 1,372 144,420 81.1% 90.5% 58,581 82.9% 98.3% -1,919 95.2% 95.2% 63,142 77.6% 97.8% 58,886 84.3% 98.3%
3 1,648 377,020 87.5% 88.7% 62,667 83.9% 92.3% 1,126 98.8% 98.8% 38,379 82.6% 92.2% 21,502 80.9% 91.2%
4 1,159 831,190 90.7% 90.0% 19,185 87.4% 88.1% 10,508 94.5% 94.5% 19,131 84.9% 86.6% 8,416 83.0% 84.5%
5 147 1,526,000 90.6% 90.2% 17,017 86.1% 88.3% 53,860 96.3% 96.3% 466 83.4% 87.4% -61,587 82.0% 86.4%
Item
class
# of
items
Current System (C)
Service level Service level
Normal Model (N) Poisson Model (P)
Service level Service level Service level
Empirical Model (E) Willemain Model (W)

37
Table 15. Optimization results using CSL for the evaluation of reorder points
Tot. Costs Savings Savings Savings Savings
tCSL t fill rate (N) vs. (C) rCSL r fill rate (P) vs. (C) rCSL r fill rate (E) vs. (C) rCSL r fill rate (W) vs. (C) rCSL r fill rate
113 47 9,194 94.3% 94.4% 1,683 93.6% 96.5% 232 95.8% 95.8% 1,683 93.6% 96.5% 1,683 93.6% 96.5%
114 60 50,336 87.6% 87.8% 2,671 89.3% 90.0% 2,498 89.4% 89.4% 2,671 89.3% 90.0% 2,671 89.3% 90.0%
115 23 278,720 92.0% 92.0% 886 96.0% 96.0% 886 96.0% 96.0% -12,043 92.0% 92.0% 19,924 94.0% 94.0%
122 17 2,712 100.0% 100.0% 2,101 100.0% 100.0% -14 98.6% 98.6% 2,101 100.0% 100.0% 2,101 100.0% 100.0%
123 43 12,908 100.0% 100.0% 5,860 100.0% 100.0% 2,424 100.0% 100.0% 5,809 100.0% 100.0% 5,860 100.0% 100.0%
124 36 44,260 98.9% 98.9% -744 99.4% 99.4% -1,070 99.4% 99.4% -744 99.4% 99.4% -2,450 99.4% 99.4%
132 109 11,882 99.6% 99.7% 9,341 100.0% 100.0% -1,857 97.8% 97.8% 9,341 100.0% 100.0% 9,341 100.0% 100.0%
133 356 93,357 96.6% 96.8% 28,734 97.1% 98.5% 13,417 98.1% 98.1% 29,301 96.4% 98.1% 29,135 96.0% 97.9%
134 461 413,830 94.8% 94.8% 38,016 95.8% 95.8% 36,030 95.9% 95.8% 20,305 96.1% 96.0% 7,523 95.6% 95.6%
135 77 1,821,500 94.1% 94.2% 633,560 95.9% 95.9% 633,560 95.9% 95.9% 588,220 95.4% 95.4% 565,660 95.4% 95.4%
142 66 7,245 100.0% 100.0% 5,307 100.0% 100.0% -2,667 98.5% 98.5% 5,307 100.0% 100.0% 5,307 100.0% 100.0%
143 165 44,549 97.5% 97.8% 15,873 97.8% 99.0% 5,367 99.4% 99.4% 15,938 97.5% 98.9% 15,234 97.5% 98.9%
144 159 141,200 93.6% 92.3% 23,032 93.6% 93.3% 22,951 93.8% 93.3% 17,382 94.5% 93.5% 13,436 93.8% 93.7%
145 9 35,389 96.2% 96.2% -1,294 96.2% 96.2% -1,294 96.2% 96.2% -1,294 96.2% 96.2% -4,228 96.2% 96.2%
152 17 1,622 100.0% 100.0% 1,136 100.0% 100.0% -245 100.0% 100.0% 1,136 100.0% 100.0% 1,136 100.0% 100.0%
153 39 10,519 94.2% 94.8% 4,108 90.9% 96.1% 1,384 97.4% 97.4% 4,108 90.9% 96.1% 4,108 90.9% 96.1%
154 76 69,500 93.1% 93.1% 4,669 94.4% 94.4% 1,734 94.8% 94.8% 3,279 94.4% 94.4% -794 94.0% 94.0%
155 9 77,338 95.5% 95.5% -4,452 100.0% 100.0% -4,452 100.0% 100.0% -1,431 95.5% 95.5% -6,669 95.5% 95.5%
162 49 5,880 100.0% 100.0% 4,442 100.0% 100.0% -524 95.9% 95.9% 4,442 100.0% 100.0% 4,442 100.0% 100.0%
163 157 40,285 98.1% 98.1% 11,599 98.5% 99.2% 6,884 99.4% 99.4% 11,125 98.5% 99.2% 9,535 98.5% 99.2%
164 204 204,900 92.1% 92.0% 24,092 93.4% 93.5% 22,956 93.3% 93.2% 25,633 93.2% 93.0% 16,257 93.2% 93.0%
165 47 316,280 95.4% 95.4% -59 95.4% 95.4% -59 95.4% 95.4% -59 95.4% 95.4% -2,687 96.1% 96.1%
412 49 6,942 84.8% 84.4% 3,256 82.1% 98.4% 2,749 96.4% 99.9% 2,786 85.7% 98.9%
413 120 47,285 88.8% 86.2% 2,361 85.7% 87.2% -29 81.7% 85.8% -1,711 81.7% 86.5%
414 85 173,060 86.5% 85.9% -116 80.4% 85.7% -1,148 76.1% 81.0% -3,078 71.0% 80.6%
415 39 880,410 83.2% 81.3% -1,320 83.7% 79.5% -24,392 56.7% 78.6% -15,091 67.3% 81.7%
422 112 19,791 95.3% 98.2% 12,616 93.8% 99.3% 12,207 96.9% 99.8% 11,960 96.9% 99.6%
423 129 63,598 94.8% 93.5% 16,765 90.7% 95.0% 13,364 91.9% 96.1% 9,207 90.1% 94.5%
424 60 90,761 92.3% 92.0% 5,100 93.8% 93.0% -6,763 92.8% 92.3% -4,283 90.0% 88.7%
432 411 61,073 88.6% 89.2% 34,062 84.7% 98.1% 32,008 86.4% 98.1% 31,816 84.1% 97.7%
433 730 366,720 87.9% 87.6% 73,304 84.3% 88.6% 46,570 86.9% 90.6% 17,438 86.0% 89.3%
434 519 1,034,500 87.0% 83.9% 33,793 88.0% 85.4% -72,393 84.0% 86.2% -716 77.3% 79.7%
435 119 4,200,600 84.1% 75.9% 156,640 82.5% 77.1% -15,798 70.3% 78.6% -175,050 66.6% 76.4%
442 284 39,537 93.4% 94.8% 24,087 90.0% 99.2% 22,146 92.2% 99.6% 21,868 91.1% 99.2%
443 388 164,630 90.9% 90.2% 37,771 86.2% 91.4% 25,445 88.9% 92.8% 11,690 88.5% 92.3%
444 199 261,640 87.2% 87.6% 15,595 88.4% 88.7% 12,149 83.4% 87.2% -17,899 80.5% 84.7%
452 28 5,593 90.0% 91.6% 3,191 85.7% 98.7% 3,323 92.9% 98.1% 3,188 92.9% 98.3%
453 76 34,290 86.0% 80.9% 5,632 82.6% 89.1% -2,838 87.5% 92.3% 229 81.5% 89.9%
454 80 147,890 86.7% 85.7% 20,452 86.7% 86.8% -11,397 87.7% 90.4% -7,669 81.7% 84.8%
455 14 210,480 93.2% 94.2% 34,719 93.0% 95.7% 14,379 93.0% 95.7% 46,598 93.0% 95.7%
462 590 112,880 68.7% 84.2% 61,099 64.5% 95.1% 60,174 70.2% 95.1% 61,188 66.1% 94.2%
463 798 310,520 76.4% 80.7% 67,051 71.6% 84.3% 55,955 73.3% 85.0% 39,930 71.8% 84.6%
464 314 649,760 83.8% 83.7% 75,246 84.9% 84.7% 5,799 86.1% 85.8% -10,437 81.4% 81.1%
465 41 587,700 82.4% 79.5% -8,477 77.9% 80.4% -517 71.3% 77.7% -48,382 69.1% 76.5%
513 11 83,779 76.4% 88.2% 4,088 77.4% 87.6% 1,980 79.2% 87.8% 1,628 81.1% 89.2%
522 25 15,743 66.3% 90.2% 5,058 78.2% 91.2% 4,436 81.8% 94.8% 4,317 80.0% 93.9%
523 6 8,629 86.4% 54.9% -93 68.0% 58.9% -11,190 100.0% 100.0% -11,943 100.0% 100.0%
532 144 82,834 80.2% 89.7% 27,918 77.7% 92.5% 28,156 78.5% 92.3% 27,157 79.9% 92.8%
533 43 101,200 74.1% 75.6% -1,498 69.5% 80.1% -21,328 84.5% 85.5% -8,670 76.5% 80.1%
534 9 56,697 69.4% 75.0% 7,323 69.0% 76.3% -13,351 88.1% 88.6% 3,676 78.6% 77.5%
542 35 16,182 86.3% 93.2% 3,128 96.9% 98.2% 4,638 84.4% 94.8% 4,750 87.5% 95.5%
543 9 105,480 75.8% 86.4% 761 91.3% 85.8% -26,280 95.7% 97.4% -1,741 95.7% 90.8%
562 287 134,440 77.0% 86.9% 17,054 73.8% 89.8% -36,155 78.5% 94.7% 5,151 75.9% 91.4%
563 39 80,942 71.4% 70.5% 24,480 71.0% 71.7% 20,900 83.5% 73.2% 18,809 84.7% 73.6%
613 14 2,161 96.9% 96.9% 22 100.0% 100.0% 22 100.0% 100.0% 22 100.0% 100.0%
614 28 43,355 97.1% 97.2% -2,536 96.8% 97.2% -548 96.8% 97.2% 747 98.4% 98.6%
615 17 129,460 100.0% 100.0% -3,518 97.1% 97.6% -312 94.3% 95.2% -312 94.3% 95.2%
623 8 3,446 100.0% 100.0% 1,622 100.0% 100.0% 1,622 100.0% 100.0% 1,622 100.0% 100.0%
624 11 15,405 98.0% 98.0% -2,747 97.7% 98.0% -723 95.3% 96.0% -723 95.3% 96.0%
633 52 14,778 98.1% 98.2% 1,719 99.1% 99.4% -109 100.0% 100.0% 900 100.0% 100.0%
634 91 117,410 95.7% 95.9% 2,018 96.6% 97.2% 393 96.6% 97.2% 4,236 96.6% 97.2%
635 69 788,730 93.2% 93.3% 88,500 93.0% 95.2% 55,137 93.0% 95.2% 65,668 93.0% 95.2%
643 36 9,741 97.8% 98.5% 2,207 100.0% 100.0% 1,976 100.0% 100.0% 1,003 100.0% 100.0%
644 39 47,642 97.7% 97.8% 2,592 98.7% 98.9% 1,842 98.7% 98.9% 1,903 98.7% 98.9%
645 6 32,143 91.7% 92.3% -2,540 100.0% 100.0% 1,316 100.0% 100.0% 1,316 100.0% 100.0%
654 26 34,420 95.3% 95.5% -497 94.7% 95.5% -497 94.7% 95.5% -497 94.7% 95.5%
655 7 42,668 100.0% 100.0% 2,534 100.0% 100.0% 2,534 100.0% 100.0% 2,534 100.0% 100.0%
664 30 40,800 97.5% 97.6% 2,616 96.2% 97.6% -21 96.2% 97.6% -796 96.2% 97.6%
665 41 353,910 96.6% 95.9% -2,396 93.6% 96.6% -7,852 93.6% 95.9% -3,442 92.3% 95.2%
Total 8,494 15,525,060 87.5% 89.2% 1,661,202 85.8% 92.0% 738,141 96.6% 96.5% 909,788 86.6% 92.6% 787,423 84.9% 91.4%
Summary by demand class
Dem. class
1 2,226 3,693,400 95.6% 95.6% 810,560 96.3% 96.8% 738,140 96.6% 96.5% 732,220 96.2% 96.7% 696,520 96.0% 96.6%
4 5,185 9,469,700 84.3% 86.1% 672,830 81.5% 89.8% 170,990 82.4% 90.4% -26,412 79.7% 88.7%
5 608 685,920 77.2% 85.7% 88,218 75.9% 88.5% -48,193 80.3% 92.0% 43,134 79.0% 90.0%
6 475 1,676,100 96.5% 96.6% 89,597 96.7% 97.6% 54,779 96.6% 97.5% 74,181 96.6% 97.5%
Summary by criticality class
Crit. class
1 493 1,704,700 88.9% 88.3% 7,476 87.2% 90.4% 3,616 92.9% 92.9% -29,368 84.5% 89.1% 9,269 83.7% 89.5%
2 447 277,250 94.1% 95.3% 45,539 93.2% 96.3% 1,340 99.5% 99.5% 20,120 94.7% 97.3% 15,668 93.7% 96.3%
3 3,190 9,165,100 90.1% 89.8% 1,133,400 89.0% 92.2% 681,150 96.9% 96.9% 686,460 89.0% 92.9% 578,120 87.1% 91.3%
4 1,395 905,370 92.6% 92.9% 126,520 91.3% 94.7% 24,358 96.9% 96.7% 80,565 91.6% 95.0% 52,640 90.8% 94.4%
5 372 634,320 90.8% 89.8% 71,491 89.8% 92.8% -1,579 96.5% 96.5% 12,596 91.4% 94.1% 42,164 88.8% 92.3%
6 2,597 2,838,300 79.5% 85.4% 276,750 76.8% 89.6% 29,256 95.9% 95.8% 139,420 79.4% 90.5% 89,569 77.1% 89.2%
Summary by price class
Price class
2 2,223 524,350 83.2% 90.0% 213,800 80.4% 96.2% -5,307 97.8% 97.8% 156,010 83.6% 96.9% 196,510 81.5% 96.2%
3 3,266 1,608,000 87.9% 88.5% 304,050 85.0% 90.6% 29,707 98.5% 98.5% 174,030 86.7% 91.6% 143,970 85.7% 90.9%
4 2,487 3,637,300 90.2% 89.4% 250,570 90.9% 90.6% 85,099 94.7% 94.6% -18,132 89.8% 90.7% 1,106 87.0% 88.2%
5 518 9,755,400 90.4% 88.2% 892,780 90.0% 89.3% 628,640 96.0% 96.0% 597,890 84.2% 88.9% 445,840 84.0% 88.6%
Service level Service level
Empirical Model (E) Willemain Model (W)
Service level
Normal Model (N) Poisson Model (P)
Service level
Item
Class
# of
items
Current System (C)
Service level

38
References
Bookbinder, J.H. and Lordahl, A.E., 1989. Estimation of inventory re-order levels using the bootstrap
statistical procedure, IIE Transactions 21 302−312.
Bridgman, M.S. and Mount-Campbell, C.A., 1993. Determining the number of spares in an
inventory/repair system which supports equipment with scheduled usage, International Journal of
Production Economics 30-31 501−518.
Chang, P-L, Chou, Y-C, Huang, M-G, 2004. A (r,r,Q) inventory model for spare parts involving
equipment criticality, International Journal of Production Economics, Article in Press.
Croston, J.D., 1972. Forecasting and stock control for intermittent demands, Operational Research
Quarterly 23 289−303.
Dekker, R., Kleijn, M.J., de Rooij, P.J., 1998. A spare parts stocking policy based on equipment
criticality, International Journal of Production Economics 56-57 69−77.
Efron, B. and Tibshirani, R.J., 1993. An introduction to the bootstrap, Chapman and Hall, NY.
Feeney, G.J. and Sherbrooke, C.C., 1966. The (s-1,s) inventory policy under compound Poisson
demand, Management Science 12 391−411.
Gelders, L.F. and van Looy, P.M., 1978. An inventory policy for slow and fast movers in a
petrochemical plant: a case study, Journal of the Operational Research Society 29(9) 867−874.
Ghobbar, A.A. and Friend, C.H., 2003. Evaluation of forecasting methods for intermittent parts
demand in the field of aviation: a predictive model, Computers and Operations Research 30
2097−2114.
van der Heijden, M.C., Diks, E.B. and de Kok, A.G., 1997. Allocation policies in general multi-echelon
distribution systems with (R,S) order-up-to policies, International Journal of Production Economics 38
225−244.
Heizer, J.and Bender, B., 2001. Operations Management, Prentice-Hall, 6th edition, NJ.
Kalymon, B., 1970. A decomposition algorithm for arborescence inventory systems, Operations
Research 20 860−873.
Kennedy, W.J., Patterson, J.W. and Fredendall, L.D., 2002. An overview of recent literature on spare
parts inventories, International Journal of Production Economics 76 201−215.
W.L. Maxwell and J.A. Muckstadt. 1983. Establishing consistent and realistic reorder intervals in
production-distribution systems. Technical report No. 561, School of Operations Research and
Industrial Engineering, Cornell University, Ithaca, NY.
Muckstadt, J., 2005. Analysis and algorithms for service parts supply chains, Springer Series in
Operations Research and Financial Engineering.
Schultz, C.R., 1987. Forecasting and inventory control for sporadic demand under periodic review,
Journal of the Operational Research Society 37 303−308.
Silver, E.A., 1981. Establishing reorder points in the (S,c,s) coordinated control system under
compound Poisson demand, International Journal of Production Research 19(6) 743−750.
Silver, E.A., Chung-Mei Ho and Deemer, R.L., 1971. Cost minimising inventory control of items
having a special type of erratic demand pattern, INFOR 9 198−219.

39
Silver, E.A., Pyke, D.F., and Peterson, R., 1998. Inventory Management and Production Planning and
Scheduling, John Wiley & Sons, 3rd edition, NY.
Strijbosch, L.W.G., Heuts, R.M.J. and van der Schoot, E.H.M., 2000. A combined forecast−inventory
control procedure for spare parts, Journal of the Operational Research Society 51 1184−1192.
Willemain, T.R., Smart, C.N. and Schwarz, H.F., 2004. A new approach to forecasting intermittent
demand for service parts inventories, International Journal of Forecasting 20 375−387.
Williams, T.M., 1984. Stock control with sporadic and slow-moving demand, Journal of the
Operational Research Society 35(10) 939−948.