an investigation and bench marking of vehicle hvac cabin...
TRANSCRIPT
08HX-10
An Investigation and Bench Marking of Vehicle HVAC Cabin Noise
Satya Prasad Mavuri, Simon Watkins, Xu Wang
RMIT University, Melbourne, Australia
Simon St. Hill, David Weymouth Air International, Melbourne, Australia
Copyright © 2008 SAE International
ABSTRACT
Noise and vibration have an important influence on a customer’s perception of vehicle quality and cabin interior noise levels are a key criteria. The interior sound levels of automobiles have significantly reduced over the years, with reductions in power train, tyre and external wind noise. One of the highest in-cabin noise levels now arises from heating, ventilating and air conditioning systems, generated by the air-rush noise at various HVAC settings. Thus quieter climate control systems are desired by car manufacturers.
A systematic benchmarking study was performed to investigate the in-cabin acoustic noise of vehicles. A large number of passenger cars including compact, mid-size, full-size, and a truck were selected. Tests were conducted on relatively new production vehicles at idle (vehicle stationary) conditions eliminating engine and external noise sources. A binaural head system was used in front passenger seat to measure noise levels. The methodology used and the experimental results were presented in this paper. Psycho-acoustic parameters were analyzed. It was discovered that the design of HVAC system is more important than the vehicle structure itself.
INTRODUCTION
Driver and passenger comfort is a major factor for consumers purchasing a vehicle. The comfort of the occupants extends also to the noise that they are subjected to, including HVAC noise. Responsible for the heating, cooling, circulating, purifying and dehumidifying the air in the cabin, the HVAC unit has a large impact on the well-being of the occupants of the vehicle, since it can be a dominant sound source in the cabin. New model vehicles are well insulated from sounds from the outside, but the noise from the interior of the cabin also needs to be addressed. While the HVAC is designed to
provide temperature respite, the sounds emitted from the system have been recognized as a source of irritation. It should be noted that the physiological and psychological differences between individuals means that the annoyance of a sound cannot be easily quantified for a given person. But some noise analysis does permit an objective means of comparing annoying sounds under different conditions. This investigation endeavors to provide benchmarking for the noise created from HVAC units in idling and on-road vehicles. Such a standard is yet to exist and it is hoped that it can become a valuable tool for Industry to use. The previous investigations showed that the largest noise magnitude was generated with an HVAC unit set to the full face and full cold settings [1]. Structural vibration of the system did not contribute to the major frequency spectrum components of the cabin noise, thus the HVAC noise was air borne predominant [2]. Passive noise reduction techniques are applied to reduce the HVAC system noise levels by various researchers [3] and in-house quality departments of vehicle manufacturers. But there appears to be no independent measurements and correlation of sound levels across vehicles ranges. In addition,
• There is a lack of standard in how the noise from in cabin HVAC system should be measured.
• Most car HVAC system components do not show noise level as one of the specs. There is a large shortage of noise data.
• The limited noise data that are available are made by different labs, using different equipment and methods. Such data are difficult to compare.
• Most manufacturers’ list "absolute noise" level measured in sound-proof and (sometimes) anechoic environments. Such data are not realistic and difficult to use in real life.
• The high number of component manufacturers and models makes it difficult to compare products across brands.
Hence, the purpose of this study is to introduce a comparative/relative measurement of in-cabin noise levels of various car HVAC systems across multiple brands and
models. Engine-off, idling vehicle conditions are considered as well as some on-road measures during tests with the HVAC system running in different operating modes.
HVAC SYSTEMS
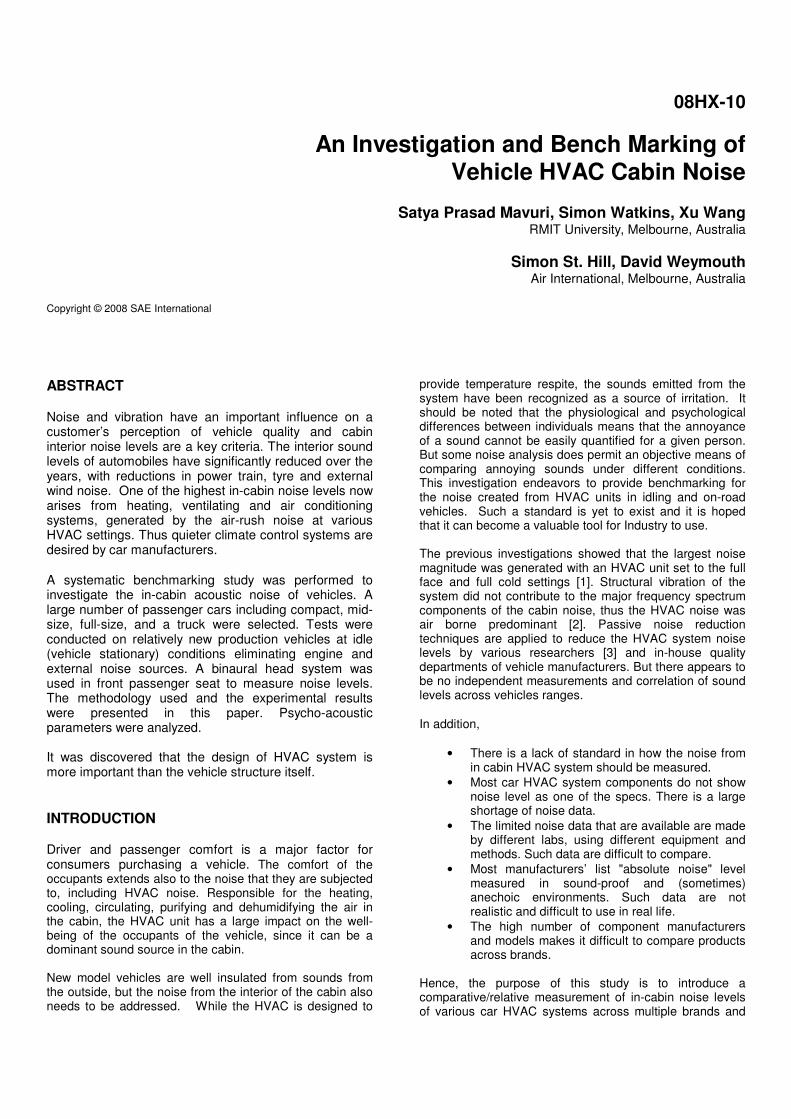
The functions of the HVAC include both heating and air conditioning through the processes of convection and conduction with water and liquid refrigerant. With full temperature control, occupants of the car are provided with a choice of recirculated and outside air. The HVAC finally delivers conditioned air into the cabin through a variable air distribution system.
Figure 1: Typical vehicle HVAC system components [4]
A typical HVAC unit consists of the following sub-systems:
• Dash-mounted air handling components: to provide air source selection, air movement, heating, cooling and selects between distribution systems.
• Air distribution system: distributes air to upper level outlets for air-conditioning or ventilation, lower level outlets for heater, windshield and side windows for defogging and defrost.
• Refrigeration circuit: transfers heat from incoming air stream, rejects heat to ambient air stream.
• Electrical system: supplies electrical power and control of blower motor and various modes and settings.
• Operator controls: selection of operator modes By previous research work, it was concluded that the fan is the main source for the noise [4]. Secondary causes are external sounds such as the fluid flow through the coils, duct and the outlet grills.
TEST VEHICLES & TESTING PARAMETERS
Vehicles types tested included small, economy, compact, intermediate, standard, full-size, premium, luxury, full-size 4WD and full-size passenger vans. Relatively new vehicles with low on kilometers were used for testing purpose. The settings of the HVAC system dictate the path of the air flow through the unit and hence have an impact on direction of propagating sound waves. As the noise levels are more in the recirculation mode, all readings in available settings
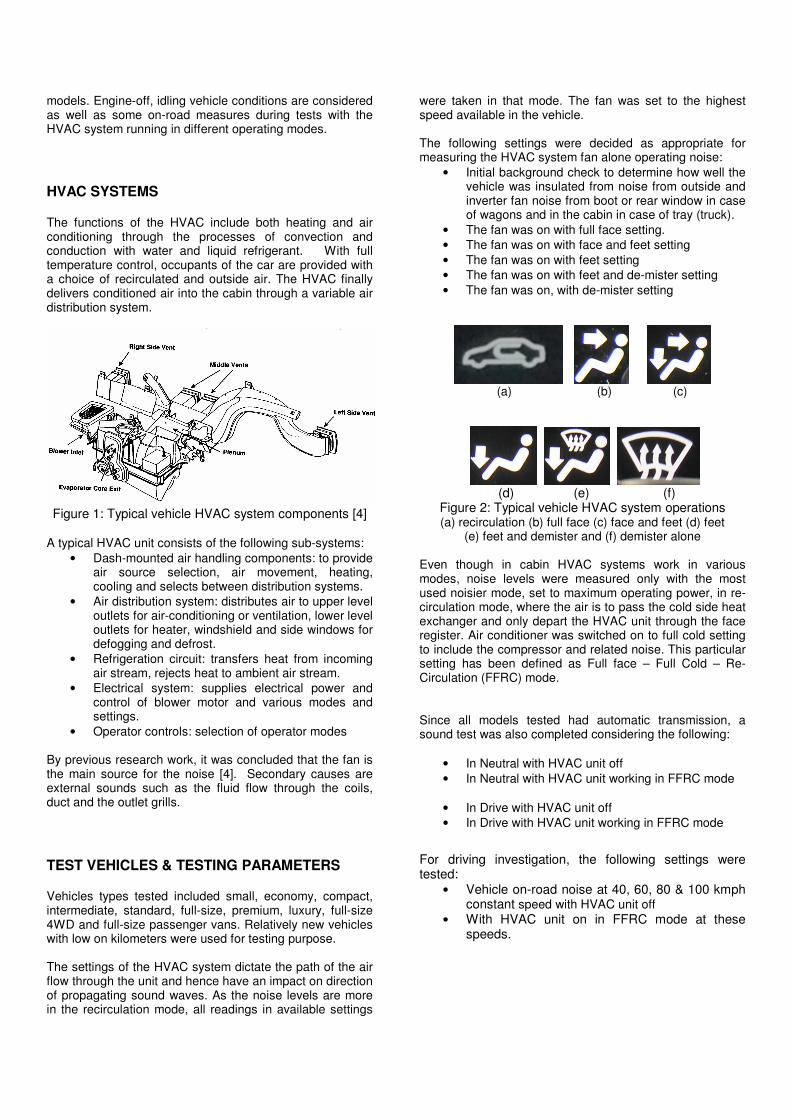
were taken in that mode. The fan was set to the highest speed available in the vehicle. The following settings were decided as appropriate for measuring the HVAC system fan alone operating noise:
• Initial background check to determine how well the vehicle was insulated from noise from outside and inverter fan noise from boot or rear window in case of wagons and in the cabin in case of tray (truck).
• The fan was on with full face setting.
• The fan was on with face and feet setting
• The fan was on with feet setting
• The fan was on with feet and de-mister setting
• The fan was on, with de-mister setting
(a) (b) (c)
(d) (e) (f)
Figure 2: Typical vehicle HVAC system operations (a) recirculation (b) full face (c) face and feet (d) feet
(e) feet and demister and (f) demister alone Even though in cabin HVAC systems work in various modes, noise levels were measured only with the most used noisier mode, set to maximum operating power, in re-circulation mode, where the air is to pass the cold side heat exchanger and only depart the HVAC unit through the face register. Air conditioner was switched on to full cold setting to include the compressor and related noise. This particular setting has been defined as Full face – Full Cold – Re-Circulation (FFRC) mode. Since all models tested had automatic transmission, a sound test was also completed considering the following:
• In Neutral with HVAC unit off
• In Neutral with HVAC unit working in FFRC mode
• In Drive with HVAC unit off
• In Drive with HVAC unit working in FFRC mode
For driving investigation, the following settings were tested:
• Vehicle on-road noise at 40, 60, 80 & 100 kmph constant speed with HVAC unit off
• With HVAC unit on in FFRC mode at these speeds.
INSTRUMENTATION
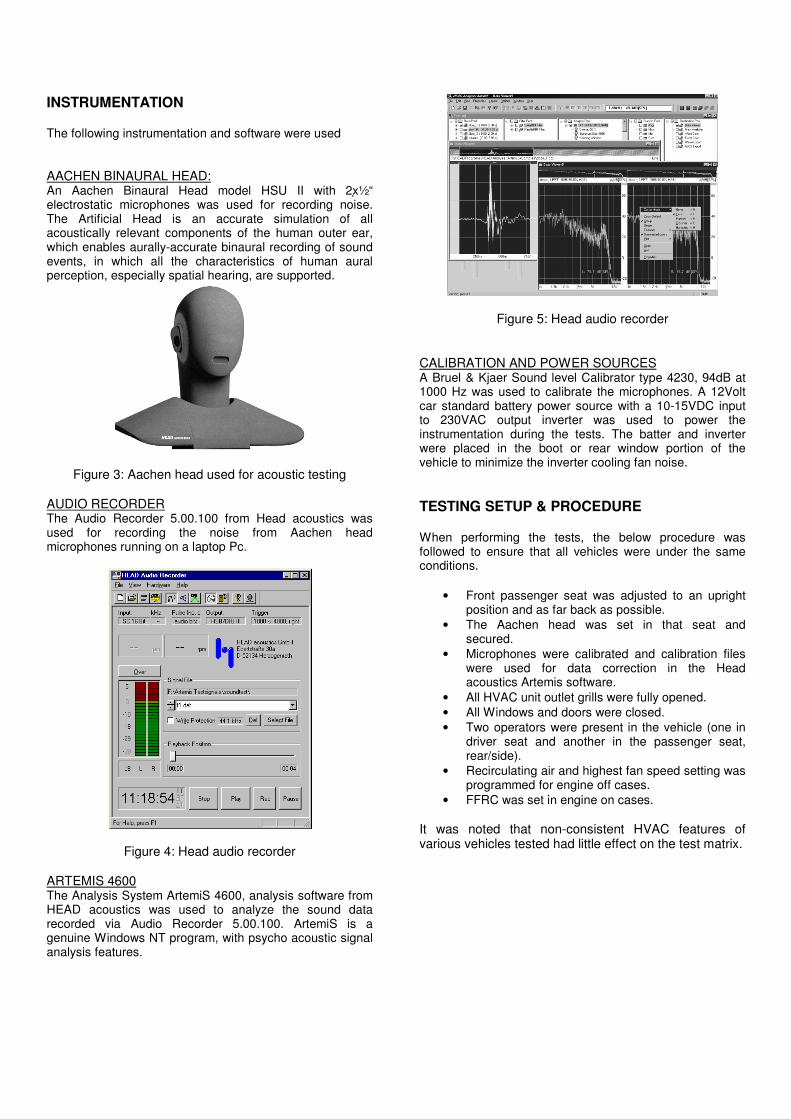
The following instrumentation and software were used AACHEN BINAURAL HEAD: An Aachen Binaural Head model HSU II with 2x½“ electrostatic microphones was used for recording noise. The Artificial Head is an accurate simulation of all acoustically relevant components of the human outer ear, which enables aurally-accurate binaural recording of sound events, in which all the characteristics of human aural perception, especially spatial hearing, are supported.
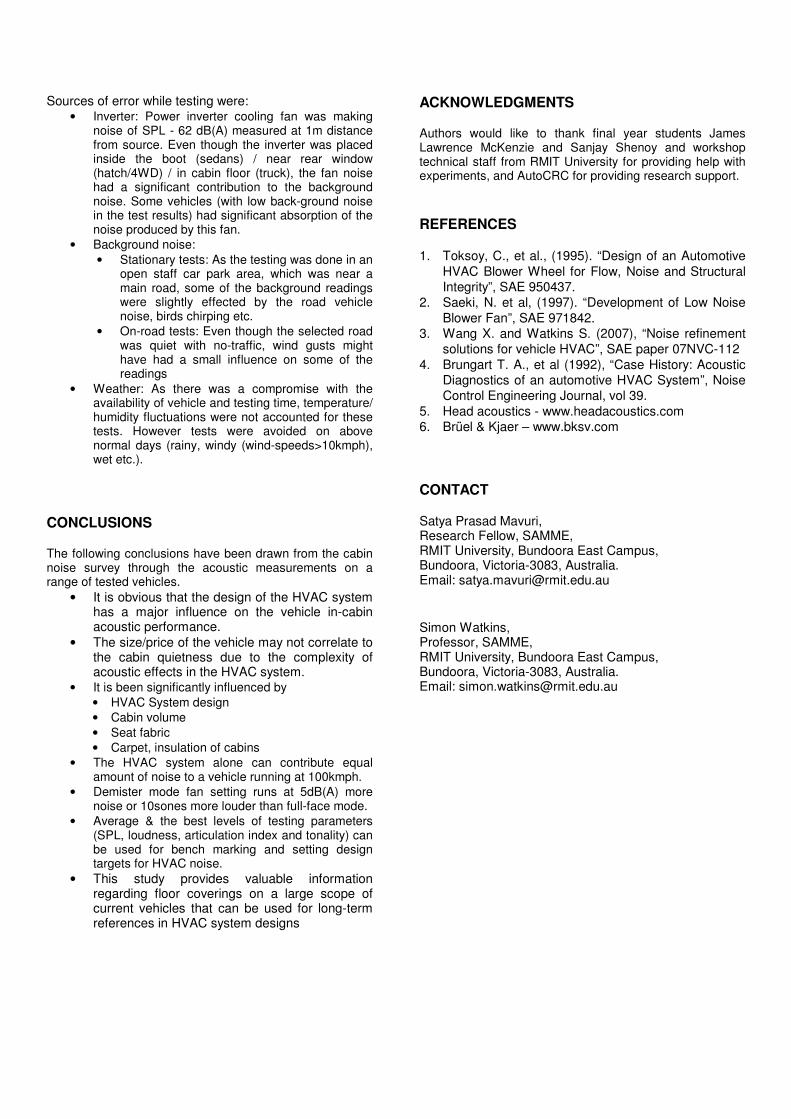
Figure 3: Aachen head used for acoustic testing AUDIO RECORDER The Audio Recorder 5.00.100 from Head acoustics was used for recording the noise from Aachen head microphones running on a laptop Pc.
Figure 4: Head audio recorder ARTEMIS 4600 The Analysis System ArtemiS 4600, analysis software from HEAD acoustics was used to analyze the sound data recorded via Audio Recorder 5.00.100. ArtemiS is a genuine Windows NT program, with psycho acoustic signal analysis features.
Figure 5: Head audio recorder CALIBRATION AND POWER SOURCES A Bruel & Kjaer Sound level Calibrator type 4230, 94dB at 1000 Hz was used to calibrate the microphones. A 12Volt car standard battery power source with a 10-15VDC input to 230VAC output inverter was used to power the instrumentation during the tests. The batter and inverter were placed in the boot or rear window portion of the vehicle to minimize the inverter cooling fan noise.
TESTING SETUP & PROCEDURE
When performing the tests, the below procedure was followed to ensure that all vehicles were under the same conditions.
• Front passenger seat was adjusted to an upright position and as far back as possible.
• The Aachen head was set in that seat and secured.
• Microphones were calibrated and calibration files were used for data correction in the Head acoustics Artemis software.
• All HVAC unit outlet grills were fully opened.
• All Windows and doors were closed.
• Two operators were present in the vehicle (one in driver seat and another in the passenger seat, rear/side).
• Recirculating air and highest fan speed setting was programmed for engine off cases.
• FFRC was set in engine on cases.
It was noted that non-consistent HVAC features of various vehicles tested had little effect on the test matrix.

Figure 6: Aachen Head in passenger seat
Figure 7: On-road test track
All stationary tests were completed in quiet location and on-road tests on a quiet road shown in figure 7. The test track was sheltered from atmospheric wind and tests only took place of when the wind was below 10kmph. The following were considered with on-road tests.
• Speed: On-road test speeds were maintained stable within ±2% of target speed during data recording, speed being read out from the dashboard instrument speedometer.
• Lowest Gear-ratio selection: The noise readings were taken after the vehicles had reached to available final (highest available) gear ratio for all targeted speeds.
TEST RESULTS AND DISCUSSION
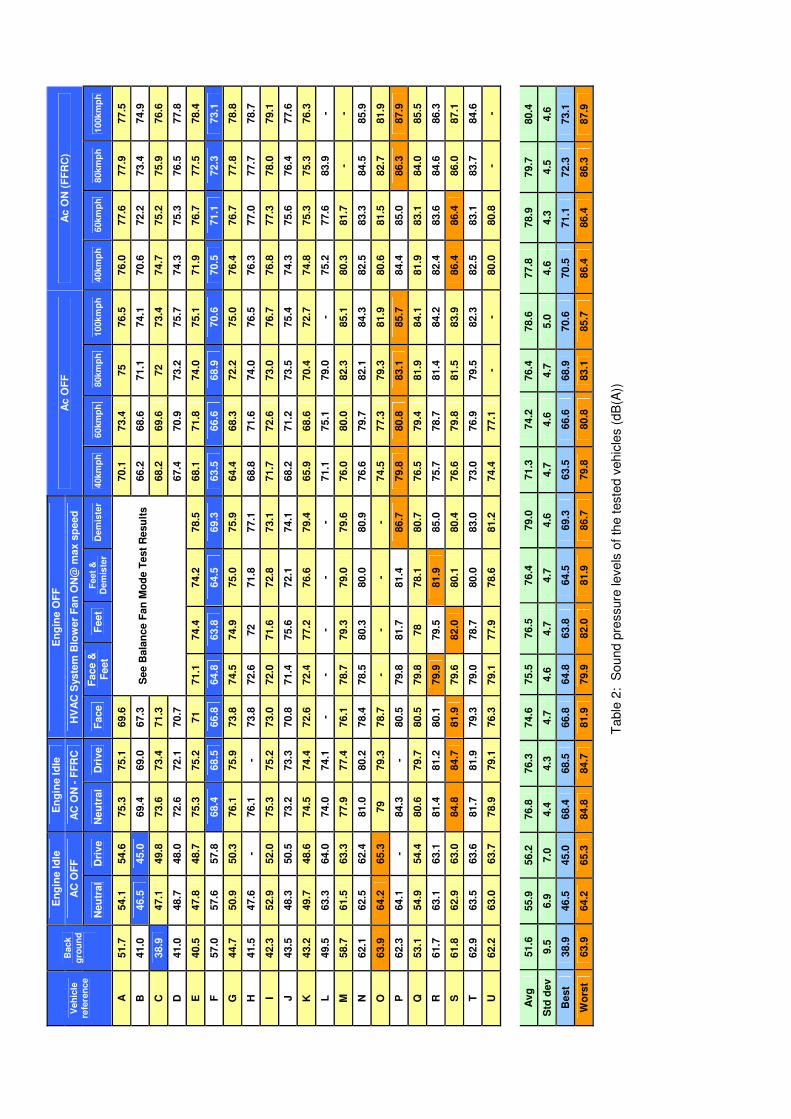
In order to evaluate the highest noise levels inside the cabin, the noisier of the two microphones (left & right ears) were considered. Psycho-acoustic parameters such as Articulation Index (AI), Loudness, Sharpness, Roughness, Fluctuation Strength and Tonality have been applied to evaluate sound quality. Sound pressure levels (SPL), along with acoustic quality analysis were performed. List of vehicles tested and test results were given in the Appendix. HVAC system noise results were found scattered over a wide range. The following generalized points have been observed from the noise survey through these acoustic results.
• Results were found to be repeatable within 2% of the tested parameters.
• HVAC fan in “Full-face” mode typically added an additional 25dB(A) to the background noise and most of this noise was within 2500Hz range. This system is influencing AI by 50%.
• “Demister” mode in stationary tests is found to be the worst case, which is almost having an equivalent effect as HVAC system running in FFRC mode driving on-road at 100kmph.
• “FFRC” mode at 100kmph speed is added an additional 2dB(A) and most of this noise reduced AI further 50%.
• Relatively new and old cars of similar make were tested and age, carpet condition and kilometres covered raised the “Full-face” fan noise by about 5% (Table 6, Test vehicles A, B, C).
• Leather seat interiors have a major influence on the noise absorption levels inside the vehicle cabin. It was observed that “Full-face” fan noise had gone up by 12% for a relatively similar vehicles tested with normal and leather seats (Table 6, vehicle D).
• From Table 2, sound pressure level measured defines vehicles F, B to be the quietest while vehicles P, Q, S, T to be the noisiest of the tested vehicles.
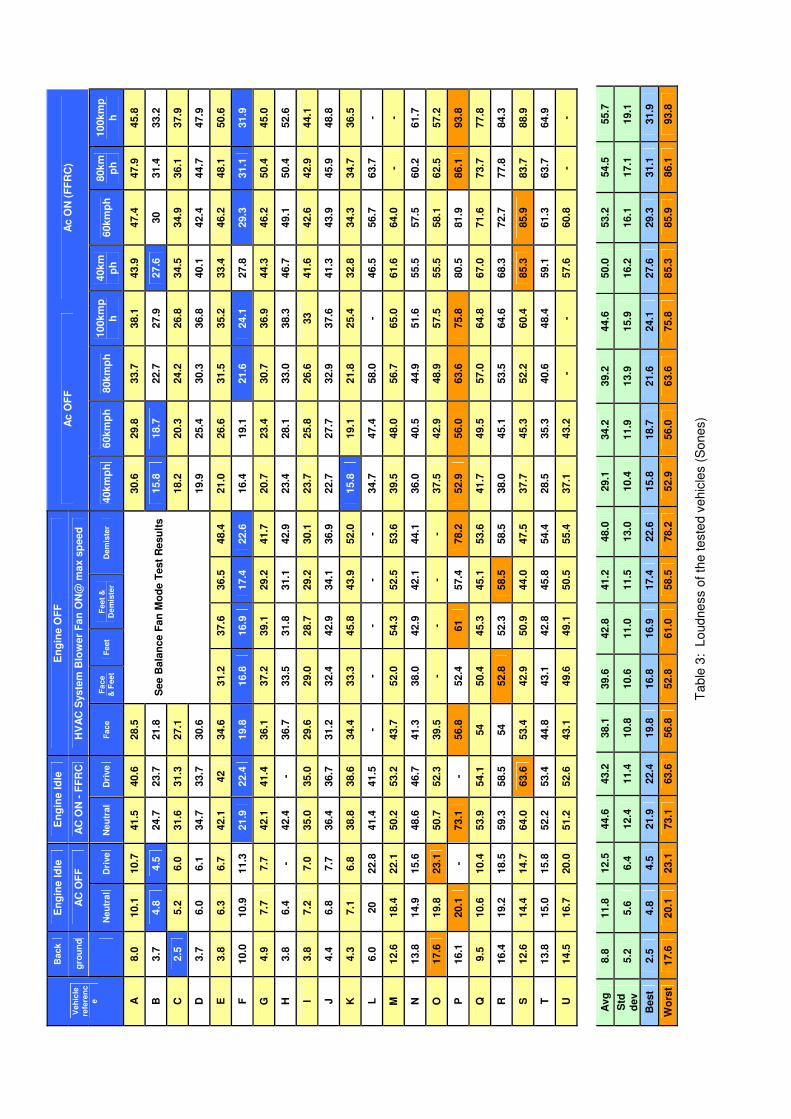
• From Table 3, loudness level measured defines vehicles F, B to be the quietest while vehicles P, Q, R to be the noisiest of the tested vehicles.
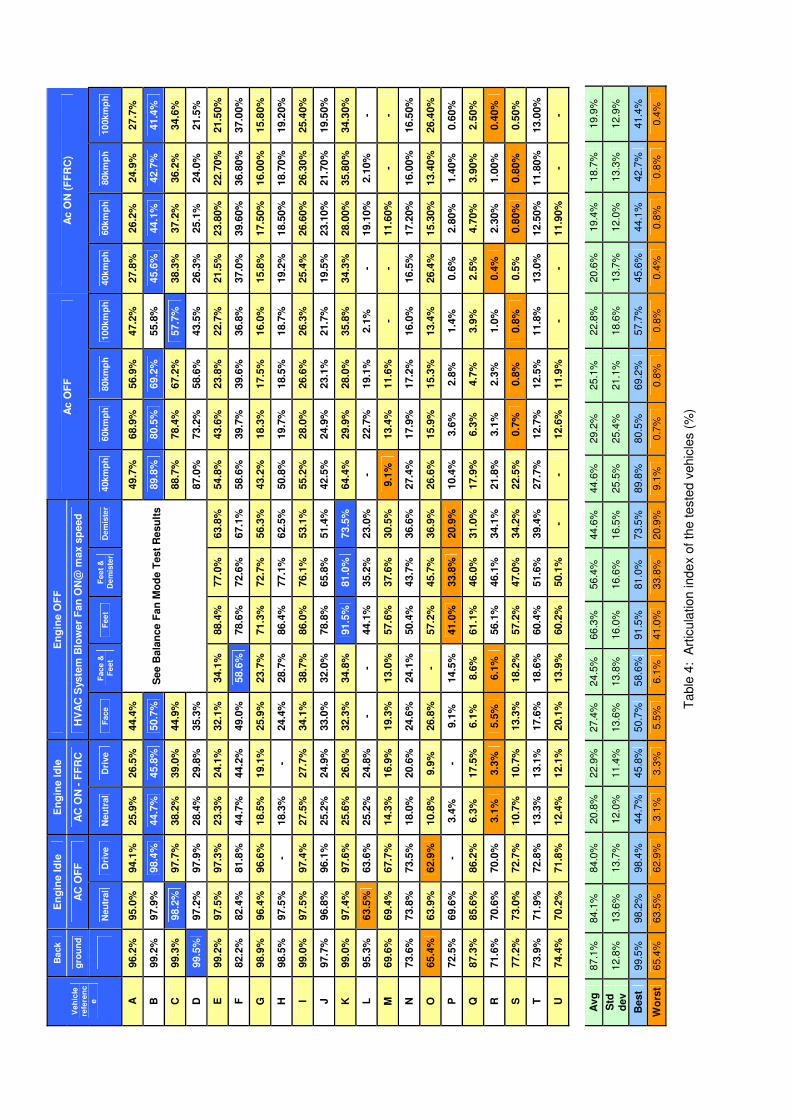
• From Table 4, articulation index measured defines vehicles B, F to be with frequencies having the least disturbance to the audible frequencies while vehicles P, Q, R to be with the most disturbing frequencies falling in audible frequency range.
• Table 5, the tonality scattering (the ratio of frequency to the highest frequency), measures indirectly the annoyance factor. It is advisable to have as low as possible to reduce the annoyance of the noise produced.
• Figure 8 shows FFT plot of fan alone noise in FFRC mode and the general band width of the noise levels produced by various vehicles.
Sources of error while testing were: • Inverter: Power inverter cooling fan was making
noise of SPL - 62 dB(A) measured at 1m distance from source. Even though the inverter was placed inside the boot (sedans) / near rear window (hatch/4WD) / in cabin floor (truck), the fan noise had a significant contribution to the background noise. Some vehicles (with low back-ground noise in the test results) had significant absorption of the noise produced by this fan.
• Background noise:
• Stationary tests: As the testing was done in an open staff car park area, which was near a main road, some of the background readings were slightly effected by the road vehicle noise, birds chirping etc.
• On-road tests: Even though the selected road was quiet with no-traffic, wind gusts might have had a small influence on some of the readings
• Weather: As there was a compromise with the availability of vehicle and testing time, temperature/ humidity fluctuations were not accounted for these tests. However tests were avoided on above normal days (rainy, windy (wind-speeds>10kmph), wet etc.).
CONCLUSIONS
The following conclusions have been drawn from the cabin noise survey through the acoustic measurements on a range of tested vehicles.
• It is obvious that the design of the HVAC system has a major influence on the vehicle in-cabin acoustic performance.
• The size/price of the vehicle may not correlate to the cabin quietness due to the complexity of acoustic effects in the HVAC system.
• It is been significantly influenced by
• HVAC System design
• Cabin volume
• Seat fabric
• Carpet, insulation of cabins
• The HVAC system alone can contribute equal amount of noise to a vehicle running at 100kmph.
• Demister mode fan setting runs at 5dB(A) more noise or 10sones more louder than full-face mode.
• Average & the best levels of testing parameters (SPL, loudness, articulation index and tonality) can be used for bench marking and setting design targets for HVAC noise.
• This study provides valuable information regarding floor coverings on a large scope of current vehicles that can be used for long-term references in HVAC system designs
ACKNOWLEDGMENTS
Authors would like to thank final year students James Lawrence McKenzie and Sanjay Shenoy and workshop technical staff from RMIT University for providing help with experiments, and AutoCRC for providing research support.
REFERENCES
1. Toksoy, C., et al., (1995). “Design of an Automotive
HVAC Blower Wheel for Flow, Noise and Structural
Integrity”, SAE 950437.
2. Saeki, N. et al, (1997). “Development of Low Noise
Blower Fan”, SAE 971842.
3. Wang X. and Watkins S. (2007), “Noise refinement
solutions for vehicle HVAC”, SAE paper 07NVC-112
4. Brungart T. A., et al (1992), “Case History: Acoustic
Diagnostics of an automotive HVAC System”, Noise
Control Engineering Journal, vol 39.
5. Head acoustics - www.headacoustics.com
6. Brüel & Kjaer – www.bksv.com
CONTACT
Satya Prasad Mavuri, Research Fellow, SAMME, RMIT University, Bundoora East Campus, Bundoora, Victoria-3083, Australia. Email: [email protected]
Simon Watkins, Professor, SAMME, RMIT University, Bundoora East Campus, Bundoora, Victoria-3083, Australia. Email: [email protected]

APPENDIX
Vehicle
Reference Year Body Type Transmission Tare Kms
A 2005 Sedan Automatic 1500 30,200
B 2007 Wagon Automatic 1400 3,967
C 2006 Sedan Automatic 1686 47,071
D 2006 Hatch Automatic 1101 11,626
E 2006 Sedan Automatic 1568 43,159
F 2006 Van Automatic 1890 16,275
G 2005 4WD Automatic 2100 52,720
H 2007 Sedan Manual 1200 312
I 2005 Hatch Automatic 1308 37,900
J 2006 Sedan Automatic 1200 11,774
K 2007 4WD Automatic 2000 3,943
L 2005 2Ton Tray Manual 3080 8,672
M 1988 Wagon Automatic 1400 207,562
N 2006 Sedan Automatic 1084 16,143
O 2007 Sedan Automatic 1500 8,861
P 2003 Hatchback Manual 1154 48,106
Q 2007 Sedan Automatic 1100 585
R 2006 Sedan Automatic 1600 500
S 2007 Sedan Automatic 1622 14,490
T 2005 Sedan Automatic 1600 45,585
U 2006 Sedan Automatic 1415 12,400
Table 1: List of tested vehicles
En
gin
e I
dle
E
ng
ine I
dle
E
ng
ine O
FF
AC
OF
F
AC
ON
- F
FR
C
HV
AC
Syste
m B
low
er
Fan
ON
@ m
ax s
peed
A
c O
FF
A
c O
N (
FF
RC
) V
eh
icle
re
fere
nce
Back
gro
un
d
N
eu
tral
Dri
ve
Neu
tral
Dri
ve
Face
Face &
F
eet
Feet
Fee
t &
D
em
iste
r D
em
iste
r 40km
ph
60
km
ph
80km
ph
100km
ph
40km
ph
60km
ph
8
0km
ph
100k
mp
h
A
51.7
54.1
54.6
75.3
75.1
69.6
70.1
73.4
75
76.5
76.0
77.6
77.9
77.5
B
41.0
46.5
45.0
69.4
69.0
67.3
66.2
68.6
71.1
74.1
70.6
72.2
73.4
74.9
C
38.9
47.1
49.8
73.6
73.4
71.3
68.2
69.6
72
73.4
74.7
75.2
75.9
76.6
D
41.0
48.7
48.0
72.6
72.1
70.7
S
ee B
ala
nce F
an
Mo
de T
est
Resu
lts
67.4
70.9
73.2
75.7
74.3
75.3
76.5
77.8
E
40.5
47.8
48.7
75.3
75.2
71
71.1
74.4
74.2
78.5
68.1
71.8
74.0
75.1
71.9
76.7
77.5
78.4
F
57.0
57.6
57.8
68.4
68.5
66.8
64.8
63.8
64.5
69.3
63.5
66.6
68.9
70.6
70.5
71.1
72.3
73.1
G
44.7
50.9
50.3
76.1
75.9
73.8
74.5
74.9
75.0
75.9
64.4
68.3
72.2
75.0
76.4
76.7
77.8
78.8
H
41.5
47.6
-
76.1
-
73.8
72.6
72
71.8
77.1
68.8
71.6
74.0
76.5
76.3
77.0
77.7
78.7
I 42.3
52.9
52.0
75.3
75.2
73.0
72.0
71.6
72.8
73.1
71.7
72.6
73.0
76.7
76.8
77.3
78.0
79.1
J
43.5
48.3
50.5
73.2
73.3
70.8
71.4
75.6
72.1
74.1
68.2
71.2
73.5
75.4
74.3
75.6
76.4
77.6
K
43.2
49.7
48.6
74.5
74.4
72.6
72.4
77.2
76.6
79.4
65.9
68.6
70.4
72.7
74.8
75.3
75.3
76.3
L
49.5
63.3
64.0
74.0
74.1
-
- -
- -
71.1
75.1
79.0
-
75.2
77.6
83.9
-
M
58.7
61.5
63.3
77.9
77.4
76.1
78.7
79.3
79.0
79.6
76.0
80.0
82.3
85.1
80.3
81.7
-
-
N
62.1
62.5
62.4
81.0
80.2
78.4
78.5
80.3
80.0
80.9
76.6
79.7
82.1
84.3
82.5
83.3
84.5
85.9
O
63.9
64.2
65.3
79
79.3
78.7
-
- -
- 74.5
77.3
79.3
81.9
80.6
81.5
82.7
81.9
P
62.3
64.1
-
84.3
-
80.5
79.8
81.7
81.4
86.7
79.8
80.8
83.1
85.7
84.4
85.0
86.3
87.9
Q
53.1
54.9
54.4
80.6
79.7
80.5
79.8
78
78.1
80.7
76.5
79.4
81.9
84.1
81.9
83.1
84.0
85.5
R
61.7
63.1
63.1
81.4
81.2
80.1
79.9
79.5
81.9
85.0
75.7
78.7
81.4
84.2
82.4
83.6
84.6
86.3
S
61.8
62.9
63.0
84.8
84.7
81.9
79.6
82.0
80.1
80.4
76.6
79.8
81.5
83.9
86.4
86.4
86.0
87.1
T
62.9
63.5
63.6
81.7
81.9
79.3
79.0
78.7
80.0
83.0
73.0
76.9
79.5
82.3
82.5
83.1
83.7
84.6
U
62.2
63.0
63.7
78.9
79.1
76.3
79.1
77.9
78.6
81.2
74.4
77.1
-
- 80.0
80.8
-
-
Avg
51.6
55.9
56.2
76.8
76.3
74.6
75.5
76.5
76.4
79.0
71.3
74.2
76.4
78.6
77.8
78.9
79.7
80.4
Std
dev
9.5
6.9
7.0
4.4
4.3
4.7
4.6
4.7
4.7
4.6
4.7
4.6
4.7
5.0
4.6
4.3
4.5
4.6
Best
38.9
46.5
45.0
68.4
68.5
66.8
64.8
63.8
64.5
69.3
63.5
66.6
68.9
70.6
70.5
71.1
72.3
73.1
Wo
rst
63.9
64.2
65.3
84.8
84.7
81.9
79.9
82.0
81.9
86.7
79.8
80.8
83.1
85.7
86.4
86.4
86.3
87.9
T
able
2:
So
un
d p
ressure
le
ve
ls o
f th
e t
este
d v
eh
icle
s (
dB
(A))
Back
En
gin
e I
dle
E
ng
ine I
dle
E
ng
ine O
FF
gro
un
d
AC
OF
F
AC
ON
- F
FR
C
HV
AC
Syste
m B
low
er
Fan
ON
@ m
ax s
peed
A
c O
FF
A
c O
N (
FF
RC
) V
eh
icle
re
fere
nc
e
N
eu
tral
Dri
ve
Ne
utr
al
Dri
ve
Fac
e
Fa
ce
& F
eet
Feet
Feet
&
De
mis
ter
Dem
iste
r 40k
mp
h
60km
ph
80km
ph
100km
ph
40km
ph
60km
ph
80km
ph
100km
ph
A
8.0
10.1
10.7
41.5
40.6
28.5
30.6
29.8
33.7
38.1
43.9
47.4
47.9
45.8
B
3.7
4.8
4.5
24.7
23.7
21.8
15.8
18.7
22.7
27.9
27.6
30
31.4
33.2
C
2.5
5.2
6.0
31.6
31.3
27.1
18.2
20.3
24.2
26.8
34.5
34.9
36.1
37.9
D
3.7
6.0
6.1
34.7
33.7
30.6
S
ee B
ala
nce F
an
Mo
de T
est
Resu
lts
19.9
25.4
30.3
36.8
40.1
42.4
44.7
47.9
E
3.8
6.3
6.7
42.1
42
34.6
31.2
37.6
36.5
48.4
21.0
26.6
31.5
35.2
33.4
46.2
48.1
50.6
F
10.0
10.9
11.3
21.9
22.4
19.8
16.8
16.9
17.4
22.6
16.4
19.1
21.6
24.1
27.8
29.3
31.1
31.9
G
4.9
7.7
7.7
42.1
41.4
36.1
37.2
39.1
29.2
41.7
20.7
23.4
30.7
36.9
44.3
46.2
50.4
45.0
H
3.8
6.4
-
42.4
-
36.7
33.5
31.8
31.1
42.9
23.4
28.1
33.0
38.3
46.7
49.1
50.4
52.6
I 3.8
7.2
7.0
35.0
35.0
29.6
29.0
28.7
29.2
30.1
23.7
25.8
26.6
33
41.6
42.6
42.9
44.1
J
4.4
6.8
7.7
36.4
36.7
31.2
32.4
42.9
34.1
36.9
22.7
27.7
32.9
37.6
41.3
43.9
45.9
48.8
K
4.3
7.1
6.8
38.8
38.6
34.4
33.3
45.8
43.9
52.0
15.8
19.1
21.8
25.4
32.8
34.3
34.7
36.5
L
6.0
20
22.8
41.4
41.5
-
- -
- -
34.7
47.4
58.0
-
46.5
56.7
63.7
-
M
12.6
18.4
22.1
50.2
53.2
43.7
52.0
54.3
52.5
53.6
39.5
48.0
56.7
65.0
61.6
64.0
-
-
N
13.8
14.9
15.6
48.6
46.7
41.3
38.0
42.9
42.1
44.1
36.0
40.5
44.9
51.6
55.5
57.5
60.2
61.7
O
17.6
19.8
23.1
50.7
52.3
39.5
-
- -
- 37.5
42.9
48.9
57.5
55.5
58.1
62.5
57.2
P
16.1
20.1
-
73.1
-
56.8
52.4
61
57.4
78.2
52.9
56.0
63.6
75.8
80.5
81.9
86.1
93.8
Q
9.5
10.6
10.4
53.9
54.1
54
50.4
45.3
45.1
53.6
41.7
49.5
57.0
64.8
67.0
71.6
73.7
77.8
R
16.4
19.2
18.5
59.3
58.5
54
52.8
52.3
58.5
58.5
38.0
45.1
53.5
64.6
68.3
72.7
77.8
84.3
S
12.6
14.4
14.7
64.0
63.6
53.4
42.9
50.9
44.0
47.5
37.7
45.3
52.2
60.4
85.3
85.9
83.7
88.9
T
13.8
15.0
15.8
52.2
53.4
44.8
43.1
42.8
45.8
54.4
28.5
35.3
40.6
48.4
59.1
61.3
63.7
64.9
U
14.5
16.7
20.0
51.2
52.6
43.1
49.6
49.1
50.5
55.4
37.1
43.2
-
- 57.6
60.8
-
-
Avg
8.8
11.8
12.5
44.6
43.2
38.1
39.6
42.8
41.2
48.0
29.1
34.2
39.2
44.6
50.0
53.2
54.5
55.7
Std
d
ev
5.2
5.6
6.4
12.4
11.4
10.8
10.6
11.0
11.5
13.0
10.4
11.9
13.9
15.9
16.2
16.1
17.1
19.1
Best
2.5
4.8
4.5
21.9
22.4
19.8
16.8
16.9
17.4
22.6
15.8
18.7
21.6
24.1
27.6
29.3
31.1
31.9
Wo
rst
17.6
20.1
23.1
73.1
63.6
56.8
52.8
61.0
58.5
78.2
52.9
56.0
63.6
75.8
85.3
85.9
86.1
93.8
T
ab
le 3
: L
oud
ne
ss o
f th
e t
este
d v
eh
icle
s (
So
ne
s)
Ba
ck
En
gin
e I
dle
E
ng
ine I
dle
E
ng
ine O
FF
gro
un
d
AC
OF
F
AC
ON
- F
FR
C
HV
AC
Syste
m B
low
er
Fan
ON
@ m
ax s
peed
A
c O
FF
A
c O
N (
FF
RC
) V
eh
icle
re
fere
nc
e
N
eu
tral
Dri
ve
N
eu
tral
Dri
ve
Face
F
ac
e &
Fe
et
Fee
t F
eet
&
De
mis
ter
Dem
iste
r 40km
ph
60km
ph
80
km
ph
100km
ph
40k
mp
h
60km
ph
80km
ph
10
0km
ph
A
96.2
%
95.0
%
94.1
%
25.9
%
26.5
%
44.4
%
49.7
%
68.9
%
56.9
%
47.2
%
27.8
%
26.2
%
24.9
%
27.7
%
B
99.2
%
97.9
%
98.4
%
44.7
%
45.8
%
50.7
%
89.8
%
80.5
%
69.2
%
55.8
%
45.6
%
44.1
%
42.7
%
41.4
%
C
99.3
%
98.2
%
97.7
%
38.2
%
39.0
%
44.9
%
88.7
%
78.4
%
67.2
%
57.7
%
38.3
%
37.2
%
36.2
%
34.6
%
D
99.5
%
97.2
%
97.9
%
28.4
%
29.8
%
35.3
%
S
ee B
ala
nce F
an
Mo
de T
est
Resu
lts
87.0
%
73.2
%
58.6
%
43.5
%
26.3
%
25.1
%
24.0
%
21.5
%
E
99.2
%
97.5
%
97.3
%
23.3
%
24.1
%
32.1
%
34.1
%
88.4
%
77.0
%
63.8
%
54.8
%
43.6
%
23.8
%
22.7
%
21.5
%
23.8
0%
22.7
0%
21.5
0%
F
82.2
%
82.4
%
81.8
%
44.7
%
44.2
%
49.0
%
58.6
%
78.6
%
72.6
%
67.1
%
58.6
%
39.7
%
39.6
%
36.8
%
37.0
%
39.6
0%
36.8
0%
37.0
0%
G
98.9
%
96.4
%
96.6
%
18.5
%
19.1
%
25.9
%
23.7
%
71.3
%
72.7
%
56.3
%
43.2
%
18.3
%
17.5
%
16.0
%
15.8
%
17.5
0%
16.0
0%
15.8
0%
H
98.5
%
97.5
%
- 18.3
%
- 24.4
%
28.7
%
86.4
%
77.1
%
62.5
%
50.8
%
19.7
%
18.5
%
18.7
%
19.2
%
18.5
0%
18.7
0%
19.2
0%
I 99.0
%
97.5
%
97.4
%
27.5
%
27.7
%
34.1
%
38.7
%
86.0
%
76.1
%
53.1
%
55.2
%
28.0
%
26.6
%
26.3
%
25.4
%
26.6
0%
26.3
0%
25.4
0%
J
97.7
%
96.8
%
96.1
%
25.2
%
24.9
%
33.0
%
32.0
%
78.8
%
65.8
%
51.4
%
42.5
%
24.9
%
23.1
%
21.7
%
19.5
%
23.1
0%
21.7
0%
19.5
0%
K
99.0
%
97.4
%
97.6
%
25.6
%
26.0
%
32.3
%
34.8
%
91.5
%
81.0
%
73.5
%
64.4
%
29.9
%
28.0
%
35.8
%
34.3
%
28.0
0%
35.8
0%
34.3
0%
L
95.3
%
63.5
%
63.6
%
25.2
%
24.8
%
- -
44.1
%
35.2
%
23.0
%
- 22.7
%
19.1
%
2.1
%
- 19.1
0%
2.1
0%
-
M
69.6
%
69.4
%
67.7
%
14.3
%
16.9
%
19.3
%
13.0
%
57.6
%
37.6
%
30.5
%
9.1
%
13.4
%
11.6
%
- -
11.6
0%
-
-
N
73.6
%
73.8
%
73.5
%
18.0
%
20.6
%
24.6
%
24.1
%
50.4
%
43.7
%
36.6
%
27.4
%
17.9
%
17.2
%
16.0
%
16.5
%
17.2
0%
16.0
0%
16.5
0%
O
65.4
%
63.9
%
62.9
%
10.8
%
9.9
%
26.8
%
- 57.2
%
45.7
%
36.9
%
26.6
%
15.9
%
15.3
%
13.4
%
26.4
%
15.3
0%
13.4
0%
26.4
0%
P
72.5
%
69.6
%
- 3.4
%
- 9.1
%
14.5
%
41.0
%
33.8
%
20.9
%
10.4
%
3.6
%
2.8
%
1.4
%
0.6
%
2.8
0%
1.4
0%
0.6
0%
Q
87.3
%
85.6
%
86.2
%
6.3
%
17.5
%
6.1
%
8.6
%
61.1
%
46.0
%
31.0
%
17.9
%
6.3
%
4.7
%
3.9
%
2.5
%
4.7
0%
3.9
0%
2.5
0%
R
71.6
%
70.6
%
70.0
%
3.1
%
3.3
%
5.5
%
6.1
%
56.1
%
46.1
%
34.1
%
21.8
%
3.1
%
2.3
%
1.0
%
0.4
%
2.3
0%
1.0
0%
0.4
0%
S
77.2
%
73.0
%
72.7
%
10.7
%
10.7
%
13.3
%
18.2
%
57.2
%
47.0
%
34.2
%
22.5
%
0.7
%
0.8
%
0.8
%
0.5
%
0.8
0%
0.8
0%
0.5
0%
T
73.9
%
71.9
%
72.8
%
13.3
%
13.1
%
17.6
%
18.6
%
60.4
%
51.6
%
39.4
%
27.7
%
12.7
%
12.5
%
11.8
%
13.0
%
12.5
0%
11.8
0%
13.0
0%
U
74.4
%
70.2
%
71.8
%
12.4
%
12.1
%
20.1
%
13.9
%
60.2
%
50.1
%
- -
12.6
%
11.9
%
- -
11.9
0%
-
-
Avg
87.1
%
84.1
%
84.0
%
20.8
%
22.9
%
27.4
%
24.5
%
66.3
%
56.4
%
44.6
%
44.6
%
29.2
%
25.1
%
22.8
%
20.6
%
19.4
%
18.7
%
19.9
%
Std
d
ev
12.8
%
13.6
%
13.7
%
12.0
%
11.4
%
13.6
%
13.8
%
16.0
%
16.6
%
16.5
%
25.5
%
25.4
%
21.1
%
18.6
%
13.7
%
12.0
%
13.3
%
12.9
%
Best
99.5
%
98.2
%
98.4
%
44.7
%
45.8
%
50.7
%
58.6
%
91.5
%
81.0
%
73.5
%
89.8
%
80.5
%
69.2
%
57.7
%
45.6
%
44.1
%
42.7
%
41.4
%
Wo
rst
65.4
%
63.5
%
62.9
%
3.1
%
3.3
%
5.5
%
6.1
%
41.0
%
33.8
%
20.9
%
9.1
%
0.7
%
0.8
%
0.8
%
0.4
%
0.8
%
0.8
%
0.4
%
T
ab
le 4
: A
rtic
ula
tio
n ind
ex o
f th
e te
ste
d v
eh
icle
s (
%)

Back
En
gin
e I
dle
E
ng
ine I
dle
E
ng
ine O
FF
gro
un
d
AC
OF
F
AC
ON
- F
FR
C
HV
AC
Syste
m B
low
er
Fan
ON
@ m
ax s
peed
A
c O
FF
A
c O
N (
FF
RC
) V
eh
icle
re
fere
nc
e
N
eu
tral
Dri
ve
Neu
tral
Dri
ve
Face
Face &
F
eet
Feet
Feet
&
Dem
iste
r D
em
iste
r 40km
ph
60km
ph
80km
ph
100k
mp
h
40km
ph
60km
ph
80k
mp
h
10
0km
ph
A
0.4
55
0.1
77
0.1
5
0.0
406
0.0
407
0.0
284
0.1
06
0.0
313
0.0
209
0.0
281
0.0
294
0.0
302
0.0
228
0.0
217
B
0.0
07
0.0
205
0.0
155
0.0
155
0.0
213
0.0
184
0.0
242
0.0
212
0.0
137
0.0
191
0.0
187
0.0
219
0.0
173
0.0
166
C
0.0
045
0.0
163
0.0
383
0.0
23
0.0
231
0.0
328
0.0
455
0.0
22
0.0
196
0.0
186
0.0
261
0.0
179
0.0
175
0.0
172
D
0.0
544
0.0
274
0.0
208
0.0
277
0.0
258
0.0
274
S
ee B
ala
nce F
an
Mo
de T
est
Resu
lts
0.0
331
0.0
382
0.0
3
0.0
33
0.0
277
0.0
304
0.0
249
0.0
258
E
0.0
519
0.0
199
0.0
1
0.0
315
0.0
358
0.0
299
0.0
323
0.0
29
0.0
284
0.0
247
0.0
247
0.0
305
0.0
393
0.0
379
0.0
299
0.0
245
0.0
309
0.0
313
F
0.2
95
0.2
02
0.1
73
0.0
242
0.0
216
0.0
248
0.0
425
0.0
295
0.0
323
0.0
252
0.0
74
0.0
329
0.0
299
0.0
184
0.0
164
0.0
168
0.0
22
0.0
721
G
0.0
262
0.0
527
0.0
223
0.0
526
0.0
355
0.0
342
0.0
319
0.0
285
0.0
284
0.0
247
0.0
253
0.0
193
0.0
214
0.0
228
0.0
241
0.0
237
0.0
218
0.0
229
H
0.0
253
0.0
061
- 0.0
207
- 0.0
274
0.0
28
0.0
263
0.0
273
0.0
286
0.0
325
0.0
225
0.0
212
0.0
332
0.0
211
0.0
199
0.0
228
0.0
297
I 0.0
444
0.0
237
0.0
283
0.0
444
0.0
48
0.0
3
0.0
417
0.0
37
0.0
43
0.0
338
0.8
12
0.5
41
0.0
242
0.0
26
0.0
576
0.0
398
0.0
269
0.0
233
J
0.0
156
0.0
284
0.0
992
0.0
452
0.0
409
0.0
411
0.0
423
0.0
315
0.0
252
0.0
222
0.0
256
0.0
305
0.0
25
0.0
212
0.0
345
0.0
317
0.0
238
0.0
264
K
0.0
444
0.0
642
0.0
313
0.0
281
0.0
327
0.0
332
0.0
348
0.0
403
0.0
34
0.0
336
0.0
182
0.0
169
0.0
206
0.0
222
0.0
192
0.0
2
0.0
153
0.0
174
L
0.0
249
0.0
209
0.0
125
0.0
161
0.0
184
- -
- -
- 0.0
203
0.0
333
0.0
43
- 0.0
167
0.0
276
0.0
22
-
M
0.1
39
0.1
52
0.0
772
0.0
417
0.0
196
0.0
293
0.0
83
0.0
753
0.0
799
0.0
667
0.0
135
0.0
154
0.0
2
0.0
135
0.0
167
0.0
16
- -
N
0.5
1
0.3
22
0.2
39
0.0
175
0.0
174
0.0
163
0.0
246
0.0
272
0.0
28
0.0
259
0.0
73
0.0
333
0.0
232
0.0
266
0.0
177
0.0
192
0.0
142
0.0
155
O
0.6
33
0.4
0.2
76
0.0
299
0.0
279
0.0
24
- -
- -
0.0
594
0.0
371
0.0
276
0.0
17
0.0
295
0.0
31
0.0
255
0.0
198
P
0.5
78
0.0
301
- 0.0
246
- 0.0
273
0.0
324
0.0
38
0.0
322
0.0
375
0.0
425
0.0
405
0.0
33
0.0
273
0.0
208
0.0
218
0.0
285
0.0
248
Q
0.0
365
0.0
886
0.0
585
0.0
247
0.0
186
0.0
221
0.0
208
0.0
217
0.0
249
0.0
216
0.0
181
0.0
216
0.0
196
0.0
193
0.0
153
0.0
208
0.0
175
0.0
24
R
0.5
99
0.3
8
0.3
57
0.0
292
0.0
311
0.0
226
0.0
306
0.0
327
0.0
277
0.0
262
0.0
642
0.0
481
0.0
257
0.0
358
0.0
296
0.0
357
0.0
185
0.0
26
S
0.4
82
0.2
43
0.2
42
0.0
131
0.0
152
0.0
15
0.0
184
0.0
282
0.0
181
0.0
192
0.0
885
0.0
453
0.0
395
0.0
304
0.0
204
0.0
212
0.0
208
0.0
22
T
0.5
01
0.3
46
0.3
7
0.0
219
0.0
162
0.0
18
0.0
283
0.0
233
0.0
23
0.0
201
0.0
667
0.0
334
0.0
163
0.0
145
0.0
176
0.0
193
0.0
17
0.0
155
U
0.6
86
0.4
17
0.3
18
0.0
233
0.0
206
0.0
37
0.0
364
0.0
429
0.0
324
0.0
209
0.0
534
0.0
296
- -
0.0
258
0.0
221
- -
Avg
0.2
482
0.1
447
0.1
336
0.0
284
0.0
269
0.0
270
0.0
352
0.0
341
0.0
323
0.0
287
0.0
819
0.0
545
0.0
257
0.0
245
0.0
245
0.0
244
0.0
21
6
0.0
251
Std
dev
0.2
588
0.1
476
0.1
279
0.0
108
0.0
097
0.0
070
0.0
151
0.0
129
0.0
143
0.0
118
0.1
693
0.1
118
0.0
080
0.0
072
0.0
094
0.0
065
0.0
04
6
0.0
126
Best
0.0
045
0.0
061
0.0
100
0.0
131
0.0
152
0.0
150
0.0
184
0.0
217
0.0
181
0.0
192
0.0
135
0.0
154
0.0
137
0.0
135
0.0
153
0.0
160
0.0
14
2
0.0
155
Wo
rst
0.6
860
0.4
170
0.3
700
0.0
526
0.0
480
0.0
411
0.0
830
0.0
753
0.0
799
0.0
667
0.8
120
0.5
410
0.0
430
0.0
379
0.0
576
0.0
398
0.0
30
9
0.0
721
T
ab
le 5
: T
on
alit
y o
f th
e te
ste
d v
eh
icle
s (
Tu)

So
un
d P
ressu
re L
eve
l (d
B(A
))
Back
En
gin
e O
FF
– H
VA
C S
yste
m B
low
er
Fan
ON
@ m
ax
sp
eed
V
eh
icle
re
fere
nce
gro
un
d
Face
Face &
F
eet
Feet
Feet
&
Dem
iste
r D
em
iste
r
A
(old
mo
del)
41.7
73.1
72.3
73.8
72.7
75.0
B
(leath
er
seats
) 63.0
75.6
74.5
76.3
73.5
76.1
C
(old
mo
del)
42.2
74.3
75.8
77.3
78.1
83.9
D
(old
mo
del)
42.3
72.7
72.6
74.3
74.3
74.7
Lo
ud
ne
ss (
So
nes)
Back
En
gin
e O
FF
– H
VA
C S
yste
m B
low
er
Fan
ON
@
ma
x s
peed
V
eh
icle
re
fere
nce
gro
un
d
Face
Face
& F
eet
Feet
Feet
&
Dem
iste
r D
em
iste
r
A
(old
mo
del)
3.7
33.9
31.0
34.5
30.9
34.9
B
(leath
er
seats
) 16.6
42.5
38.0
39.9
33.8
42.2
C
(old
mo
del)
4.3
39.5
43.9
48.2
48.3
69.1
D
(old
mo
del)
4.1
34.4
34
37.4
37.2
38.8
Art
icu
lation
In
dex (
%)
Back
En
gin
e O
FF
– H
VA
C S
yste
m B
low
er
Fan
ON
@ m
ax
sp
eed
V
eh
icle
re
fere
nce
gro
un
d
Face
Face &
F
eet
Feet
Feet
&
Dem
iste
r D
em
iste
r
A
(old
mo
del)
98.5
%
24.2
%
27.8
%
23.0
%
27.9
%
20.6
%
B
(leath
er
seats
) 69.1
%
16.4
%
22.2
%
21.8
%
34.0
%
19.0
%
C
(old
mo
del)
98.9
%
24.8
%
24.7
24.7
%
15.1
%
1.4
%
D
(old
mo
del)
98.8
%
29.1
%
32.0
%
30.0
%
29.8
%
29.4
%
To
na
lity
(Tu
)
Back
En
gin
e O
FF
– H
VA
C S
yste
m B
low
er
Fan
ON
@ m
ax
sp
eed
V
eh
icle
re
fere
nce
gro
un
d
Face
Face &
F
eet
Feet
Feet
&
Dem
iste
r D
em
iste
r
A
(old
mo
del)
0.0
029
0.0
242
0.0
336
0.0
329
0.0
356
0.0
299
B
(leath
er
seats
) 0.5
63
0.0
263
0.0
305
0.0
282
0.0
414
0.0
311
C
(old
mo
del)
0.0
12
0.0
382
0.0
547
0.0
712
0.0
435
0.0
342
D
(old
mo
del)
0.0
103
0.0
277
0.0
332
0.0
366
0.0
366
0.0
37
T
ab
le 6
: B
ala
nce
Fan
Mod
e T
est R
esu
lts

Veh
icle
FF
RC
Fa
n N
ois
e
0
10
20
30
40
50
60
70
0
500
1000
1500
2000
2500
3000
3500
4000
4500
5000
5500
6000
6500
7000
7500
8000
8500
9000
9500
10000
Fre
qu
en
cy (
Hz)
SPL (dB(A))
SP
RQ
TO
NM
EG
HC
AI
DU
JK
BF
F
igure
8:
Fu
ll-fa
ce
-re
cir
cula
tion
mod
e –
Fa
n n
ois
e a
lon
e f
or
va
rio
us v
eh
icle
s t
este
d