an investigation and review of employment practices in the
TRANSCRIPT

Employment Practices
An investigation and review of EMPLOYMENT PRACTICES IN the public and private sectors
in region four, GUYANA
ETHNIC RELATIONS COMMISSION Peter Rose & Anira Streets Queenstown, Georgetown
SUBMITTED BY: Pamela Rodney 41 Aubrey Barker Street South Ruimveldt Gardens Georgetown, Guyana
March 2007

ii
Employment Practices - Region Four, Guyana Executive Summary This study sought to investigate and review employment practices in the public and private sectors
in Region Four, Guyana. The research was also conducted to determine whether over the five year
period, August 2001-August 2006, there has been equitable distribution of employment to the
different ethnic groups in Guyana.
In order to fulfil the purpose of this research, the following questions were posed:
- What ratio of the various ethnic groups, comprise the current staff within the
various employment sectors in Region Four?
- What proportion of staff by ethnic groups, have been recruited and exited the various
sectors in Region Four, over the period August 2001-August 2006?
- What policies exist within the participating organizations and the extent to which policies
are utilized?
- What activities, processes and procedures were carried out in the procurement and
termination of staff in the public and private sectors in Region Four, Guyana?
The data analysed in this study was derived from the results of surveys carried out in fourteen
organizations in Region Four, Guyana. The organizations constituted the public and private
sectors and the trade union. Current staff lists, employment records of incoming and outgoing
staff and reasons for employees exit were examined for the period August 2001 to August 2006.

iii
Data from the Ministry of labour, Industrial Department was also examined. Questionnaire
surveys were done of one human resource personnel practitioner representing each participating
organization.
Stratified random sampling and surveys of employees were conducted in the various
organizations. Sampling was based on sector, ethnicity and gender. Of the organizations that
consented to participate in the research, approximately 71% of the human resource personnel
practitioners returned their questionnaires, while 74% of employees did likewise.
Research data revealed that Africans predominate all the sectors, public, private and trade
union in region four, consistent with the regional population distribution statistics.
Analysis of staff levels was carried out, based on a four-tier structure. The data suggests
that, in the public sector a higher proportion of East Indians occupies positions at the Senior,
Middle and First levels than Africans, the majority of whom occupy Ancillary positions.
The data also suggests that Amerindians occupy positions at the Senior, Middle and First
levels, but not at the Ancillary level. The Mixed race seems to be in a position similar to Africans.
Fifty percent of them occupy Ancillary level positions while approximately 17% occupy positions
in each of the upper levels (Senior, Middle and First). On the other hand, the “Other” group
occupy positions at two levels only, (Senior and First) 50% at each level.
In the private sector, higher proportions of Africans occupy the highest categories of
positions. Senior, Middle and First, compared to the East Indians, where the finding indicates the
reverse. In this sector, the proportions for Africans are 11%, 12% and 24% in comparison to 7%,
7.9% and 22.8% for the East Indians at the three highest levels. The proportions in respect of

iv
Ancillary staff, is 62% for East Indians and only 53% for Africans. Amerindians in the private
sector, were in a position similar to that of the “Other” group in the public sector, in which they
seem to occupy only two positions, the first level with a lower proportion of 37.5%, and the
majority (62.5%) occupied positions at the Ancillary level.
More of the Mixed race occupies positions at the Middle level (34%) than at the other
levels in the private sector. Equal proportions of them (the Mixed Race) occupy positions at the
senior (23%) and first levels (23%), than at the Ancillary (20%) level. The Other group occupies
the same two positions in the private sector as they did in the public sector. The majority (67%)
being at the Senior level and the remaining 33% at the First level.
In the Trade Union organisations, the majority of East Indians occupy First level positions,
followed by Senior and Ancillary on an equal basis of 17% each. For the Africans, a substantial
proportion, occupies First and Senior level positions. The smallest proportion of Africans occupies
the Ancillary positions in trade union organizations. Notably, Amerindians and the”Other” group
seem to occupy the Senior level positions (100%). Equal proportions (25%) of the Mixed Race
occupy positions at each level.
With respect to Employee Intake over the period August 2001 to August 2006, research
data signifies a change in the recruitment pattern among the two dominant ethnic groups within
the society. Traditionally and up until 1992 Africans accounted for the group with the majority
occupying regular positions. However, the data suggests a change in this trend in the public and
private sectors and Trade Union organisations in Region Four.

v
The data shows that East Indians account for the overall highest proportion of persons who
were recruited in the sectors in Region Four between August 2001 and August 2006. A total of
665 East Indians were recruited accounting for approximately 50% of those recruited in the
Region compared to 621 or 47% Africans.
With respect to individual sectors, a larger proportion of Africans (approximately 22%)
were recruited in the Public Sector, compared to East Indians, (approximately 17%). The East
Indians however comprise a larger proportion of employees recruited to the private sector (74%)
compared to persons of African decent (68.6%). The East Indians also account for a slightly
higher proportion recruited to Trade Union organisations when compared to Africans.
With respect to the smaller ethnic groups, the intake among the Amerindians in the Public
Sector and Trade Union organisations has been zero percent (0%). All Amerindians recruited in
that period in organisations in Region Four, seems to be in private sector. Eight (8) persons,
accounting for .6% of the total number of persons recruited to the participating organisations were
Amerindians. The majority of the Mixed Race and Other were similarly recruited in the Private
Sector.
The majority of employees that exited organizations seem to be of African descent. The
data showed that 87% Africans exited the private sector compared to 83% East Indians. Persons
from neither of the other races seemed to have exited, either in the public sector or in Trade Union
organisations in Region Four during the period August 2001 to August 2006. However, 1
Portuguese, 1 Chinese and 21 persons from the Mixed Group also exited private sector
organisations in the Region.

vi
The most substantial proportion of persons who exited their employ in the private sector
during the period August 2001 to August 2006 had their services terminated.
Dismissal/termination was also the single most common complaint that engaged the Ministry of
Labour Industrial department, during the said period. The Ministry received 1,812 such
complaints over the five year period, while 49% of private sector employees had their services
terminated in the same period.
The characteristics of the participant human resource personnel practitioners confirmed a
strong African presence in regulatory jobs. It indicated a high proportion of females in the human
resource/personnel sections of the public and private sectors, though not necessarily in trade union
organizations in Region Four.
The research data showed that the majority of organizations in the public and private
sectors and trade union in Region Four, have policies to address recruitment, promotion,
appraisals, transfers and termination of services. However, policies to address non-discrimination
and Equal Employment Opportunity seem to be lacking in a large proportion of organizations.
The majority of organizations did not “Very Often” follow the policies of recruitment,
promotion, appraisals, transfers and termination to guide their organizations’ recruitment and
promotional practices.
Employers have differing positions on the notion that some employers have a tendency of
hiring people of their own race first, even though a substantial proportion of them strongly agree.
The majority of the public sector employers “strongly agree”.

vii
An overall majority of the human resources personnel practitioners strongly agree that
employers should attempt to employ all racial groups.
The majority of human resource personnel practitioners never assigned positions to
persons based on social characteristics of age, religion, sex nor ethnicity. Only 33% in the public
sector assign positions based on age and sex.
At least half (50%) of the human resource personnel practitioners use special criteria for
placing applicants. The trade union representative also attested to this as well as 67% of the
practitioners in the private sector.
None of the participating organizations in the public and private sectors or trade union
organizations seems to utilized social characteristics of marital status, ethnicity nor religion as a
requirement for employment. However 20% use gender/sex as a requirement, accounting for 33%
public sector and 17% private sector organizations. An overall forty percent also use age,
representing 67% public sector and 33% private sector.
Research data further suggests that Human resource personnel practitioners in the public
and private sector and trade union organizations have never received complaints from employees,
of denial of favourable career move due to age, race, religion, marital status or disability.
The majority of the organizations in the private sector in region four do have procedures
for addressing reports of disciplinary matters, grievances, absence due to sickness, pregnancy
benefits and exit notices. However, the majority (83%) of them do not have procedures for
addressing discrimination.

viii
The majority of organizations in the public sector have procedures for addressing reports
of disciplinary matters and absence due to sickness or other reasons, (67% each) but the majority
of them on the other hand are without procedures for addressing grievances, pregnancy benefits,
and exit notices. Only 33% have such procedures while 33% in each case did not state whether or
not their organizations had such procedures. On the other hand, no organization in the public
sector has procedures for addressing reports of discrimination. Thirty-three percent (1) human
resource personnel practitioner did not state whether his/her organization had procedures for
dealing with discrimination.
The representative of the trade union organization (100%) stated that their organizations
had procedures for addressing each of the reports, namely, discrimination, disciplinary matters,
grievances, absence due to sickness, pregnancy benefits and exit notices.
None of the human resource personnel practitioners in any of the sectors (100%) in Region
four seemed to have ever received complaints from employees that they were discriminated on
grounds of pay, marital/parental status, age, bullying, sex/gender, disability, religion,
race/ethnicity, sexual orientation, national origin or any other areas of discrimination.
The majority of the participating organizations in the public and private sectors and trade
union in region four have human resource departments in their organizations. Thirty percent did
not have, accounting for 33% in the public sector and 33% in the private sector.
In terms of the recruitment process, five most frequently utilized steps in the recruitment
process, are as follows.

ix
Public Sector
Step 1: Write the respective section or officer to seek permission to fill the vacancy.
Step 2: Advertise internally/send out internal circulars. Do public advertisement.
Step 3: Shortlist for interview; send the applications to the respective section or Officer.
Step 4: Conduct interviews; issue internal circulars.
Step 5: Select the most suitable candidate; wait for the respective sector/Officer to send
the suitable candidate.
Private Sector
Step 1: Advertise internally or promote internally in keeping with the agreed
succession plan of the organization, or inform the respective Officer, seeking
permission to fill the vacancy or conduct job analysis.
Step 2: Transfer someone to fill the vacancy or peruse previous applications; advertise
externally or internally.
Step 3: Advertise externally, check with training institutions or advertise internally.
Step 4: External advertisement is done or Interviews are conducted.
Step 5: Recruit or do “single source selection”.
It appears that the recruitment process varies from organization to organization and from
sector to sector. In analysis of the first five steps representatives of the human resource
management and personnel departments stated that they would follow in recruiting new staff,
seem to verify this fact.
Frequently utilized recruitment methods grouped by choice of respondents in the sectors. Public Sector Internal Advertisement, walk-ins and Recommendation Media Advertisement Media Advertisement, Resumes and Recommendation

x
Private Sector
Media Advertisement and Resumes
Media Advertisement, Internal Advertisement and Resumes
Internal Advertisement, Media Advertisement and Resumes
Internal Advertisement, Walk-ins, Word of mouth and Referrals
Resumes, Media Advertisement, and Recommendations
Trade Union
Internal Advertisement
The two most common procedures utilized in selecting recruits are interviews and panel
interviews (40%) each. The other method used is interviews and aptitude tests (20%).
At least half (50%) of the organizations in the participating sectors encourage speculative
job enquiries; a substantial proportion (40%) never does while 10% always does.
The majority of organizations in the participating sectors use assessment forms in their
recruitment process. This represents the trade union organization (100%), private sector
organizations (83%) and public sector organizations (67%).
The majority of the participating organizations in region four shortlist applicants in the
recruitment process. Half (50%) of the participating organizations (50%) use panel interviews as a
shortlisting procedure, 20% use application forms and 10 percent oral/written tests.
An overall majority (70%) of the public, private and trade union organizations in Region
four use job descriptions in their recruitment process.

xi
Human resource personnel practitioners issue job descriptions, mainly before the interview
(30%) and at the selection/appointment/promotion stage (30%). Twenty percent issue at the
interview and the other 20% at other times.
Half (50%) of the participating organizations “Sometimes” carry out test for knowledge,
skills and abilities important for job performance. Thirty percent of them conduct such tests
“always” and 20% never does.
Half (50%) of the organizations that participated in this study “always” require some
educational background not directly related to one’s job. Thirty percent of them never have this
requirement, though 20% sometimes require such educational background.
Organizations utilize certain criteria to determine final selection I a case where there are
two equally qualified applicants for a position. They are as follows:
Private sector: Knowing the organization16.6 % Experience, fitness and personality16.6 % The situation was never faced. 16.6 % Appointments done by respective department. 16.6 % Not stated. 33.3 % Public sector Age, other competing personal activities, adaptability, availability to work beyond the normal call of duty.33.3 % Seniority, qualification (management level), suitability 33.3 % Not stated. 33.3 %

xii
Trade union Apply seniority and test. - 100% Organizations consider the following factors in carrying out employee appraisals: Private Sector: 50 % 16.6 % 16.6% 16.6 % Public Sector 67.0% 33 % Trade Union
Performance, conduct, ability, aptitude and attitude. Experience, fitness and personality Performance No appraisals done within organization Age, other competing personal activities, adaptability, availability to work beyond the normal call of duty. Seniority, qualification (management level), suitability Performance – 100%
Organizations have advanced the following reasons for employees Exit: Public sector Compulsory retirement and resignation or transfer - 33.3 % End of employment contract - 33.3 % Not stated - 33.3 % Private Sector Dismissal as a consequence of disciplinary action, compulsory retirement and retirement or resignation on medical grounds - 16.6 % Retirement or resignation on medical grounds - 16.6 %

xiii
Compulsory and voluntary retirement - 16.6 % Dismissal as a consequence of disciplinary action and compulsory retirement - 16.6 % Other –namely: migration, job change and disability - 33.3 % voluntary retirement. 100% Trade Union Voluntary retirement - 100%
Employees’ ages ranged from below 20 to approximately 54 years old. The trade union
employees were the youngest while the employees in the private sector were the oldest. The majority
of the employees were of the single marital status (53%). The majority of the employees were
Christian.
The most common recruitment methods through which employees were recruited were
“Recommendation (20%) followed by “Resume (17%) and “walk-ins” (17%).
Employees in the participating organizations in Region Four stated that the most common
basis of employees’ selection was academic qualification (42%) more than any other. This accounted
for the opinion of 62% in the public sector, 34% in the private sector and 20% trade union workers.
The majority (84%) of the employees in the participating sectors believed that neither age, sex
nor other social characteristics were requirements for their jobs. This accounted for all the respondents
(100%) in the trade union, 86% in the private sector and 76% in the public sector.
All (100%) respondents in the private sector felt they were overlooked for scholarship and
transfer, while a large majority of them felt they were overlooked for promotion (83%) and training

xiv
(60%). The employees in the trade union organizations felt they were not overlooked for any of those
benefits.
Employees in the participating organizations, who felt they were overlooked, advanced a
number of reasons for their experiences. The most commonly occurring reason was” interpersonal
relations” (26%). Eighty percent of them were private sector employees and the other 20% public
sector.
Of those who felt they were overlooked for benefits, 25% of them felt it resulted in lack of
initiative and 17% were seeking employment.
The majority, (78%) of the employees in the public and private sectors and trade union
organizations had received job descriptions in their recruitment process. Most of them either at their
interviews or at the selection, appointment or promotion stage.
A substantial proportion of employees in the public and private sectors and trade union
organizations underwent tests of skills and abilities important for their jobs, the majority of them were
trade union workers (60%) followed by private sector and public sector employees on an equal basis.
The most common type of tests of skills and abilities important for the employees’ jobs, were
practical (60%). Only 5% of them were tested both practically and verbally.
A small proportion (9%) of employees in the public and private sector organizations in Region
four stated that they were also tested for skills and abilities not required for their jobs. Of those
tested, 21% of them were public sector workers and 5% were private sector workers.
Of those employees in Region Four who were tested for skills and abilities not required for

xv
their jobs, 44.4% of them received practical tests, 33.3% verbal and the other 22.2% were tested both
practically and verbally.
The majority (84%) of employees in the participating sectors were not informed about the anti-
discrimination act; however a larger proportion (21%) of employees in the public sector were
informed about the act than those in the private sector (11%).
Research data suggests that twelve percent of the employees in the public and private sectors in
region four were aware of discriminatory practices.
Race/ethnicity was the most common type of discriminatory practices (83%) followed by
bullying (27%), affecting employees in the public and private sectors and trade union organizations in
region four.
The data suggests that three percent of persons employed in organizations in Region four were
aware of persons who had left because of discrimination.
A substantial proportion (47%) of employees in the public and private sectors and trade union
organizations in region four had received formal orientation, accounting for the majority (62%) of
those in the public sector and substantial proportions (41%) and (40%) respectively in the private
sector and trade union organizations.
The majority (81%) of those who received orientation received it within 1-3 months. The single
most common occurring orientation period (26%) was two days. The single most common
programme of activities was job-related (36%).

xvi
There seemed to be little concerted effort within the public and private sectors and trade union
in region four to provide equitable distribution of employment to the different ethnic groups in
Guyana, over the period August 2001 to August 2006.

xvii
TABLE OF CONTENTS
Contents Page Executive Summary i Table of Contents xvi List of Tables xix List of Figures xxiii List of Appendices xxiv Acknowledgements xxv 1 Introduction 1 1.1 Background 1 1.2 Purpose & research questions 1 13 Definition of terms and concepts 3 1.4 Limitations 3 1.5 Summary 6 2 Literature review 6 2.1 Introduction 6 2.2 Background 7 2.3 Employment practices – global perspectives 17 2.4 Employment practices – Regional Studies 21 2.5 National Constitutional Acts/laws 30 2.6 The Role of Human Resource Management: The recruitment process 32 2.7 Steps to avoid non-discrimination in employment practices 42 2.8 Employment practices in the public and private sectors &Unions, Reg. 4 47 2.9 Conceptual framework 54 2.10 Chapter Summary 57 3 Research Methodology 57 3.1 Introduction 57 3.2 Research design 58 3.3 Research setting 59 3.4 Sampling procedure 59 3.5 Pre-test and pilot studies 61 3.6 Ethical considerations 62 3.7 Validity and reliability 62

xviii
3.8 Data collection 63 3.9 Editing and coding 65 3.10 Data analysis 65 3.11 Presentation of Data 66 4 Findings and discussion of the study 66 4.1 Introduction 66 Section I 67 4.2 Description of the human resource capacity of entities 67 4.2.1 Introduction of Section 67 4.2.2 Current Staff by ethnicity and seniority in the participating entities
from the public and private sectors as well as trade unions 68 4.2.3 Employee intake by ethnicity over the period August 2001 to August 2006 77 4.2.4 Employee exit by ethnicity over the period August 2001 to August 2006 81 4.4.5 Reason for Employee Exit by Ethnicity 84 4.2.6 Characteristics of the participating human resource personnel practitioners 86 4.2.7 Summary of Section 89 Section II 89 4.3 Employers report of the activities, processes and procedures carried
out in the procurement and termination of staff in their organizations 89 4.3.1 Introduction of Section 89 4.3.2 Existing employment policies and the extent to which they are utilized 90 Section III 129 4.14 Examination of the socio-demographic characteristics of the employees
who participated in the study 129
Section IV 135 4.15 Analysis of employees’ experiences and views with respect to recruit-
ment and termination processes and procedures in their organizations 135

xix
5 Conclusions and Recommendations 175 5.1 Conclusions 175 5.2 Recommendations 178 5.3 Chapter Summary 181

xx
List of Tables
2.1 Method of Recruitment 3
4.1 A Current Staff of Participating sectors by Ethnicity & Seniority – Public Sector 69
4.1 B Current Staff of Participating sectors by Ethnicity & Seniority – Private Sector 70
4.1C Current Staff of Participating sectors by Ethnicity & Seniority – Trade Union 72
4.1 D Current Staff of Participating sectors by Ethnicity & Seniority – Overall Results 73
4.2 Employee Intake for the Period August 2001-August 2006 79
4.3 Employee Exit for the Period August 2001-August 2006 81
A 4.1 Existence of Policies Addressing Recruitment 210
A 4.2 Existence of Policies to Address Equal Employment Opportunity 211
A 4.3 Existence of Policies Addressing Non-discrimination 212
A 4.4 Existence of Policies Addressing promotion 213
A 4.5 Existence of Transfer Policies 214
A 4.6 Existence of Policies to Carry out Appraisals 214
A 4.7 Policies Addressing Termination 215
A 4.8 Extent to which Policies are followed as a Guide to Organization’s Recruitment
And promotional Practices 191
A 4.9 Complaints of Denial of Favourable Career move Due to Age, Race, Religion,
Marital Status and Disability – Sectors 192
A 4.10 Existence of procedures for Addressing Various Reports – Private Sector 218
A 4.10 (i) Existence of procedures for Addressing Various Reports – Public Sector 219
A 4.10 (ii) Existence of procedures for Addressing Various Reports – Trade Union 220
A 4.11 Employers’ Position on the Notion that Some Employers Have a Tendency of
Hiring People of Their Own Race 221
A 4.12 Employers’ Position on the Notion That Employers Should Attempt To Employ All
Racial Groups 222

xxi
A 4.13 Use of Special Criteria for Placing Applicants 223
A 4.14 Marital Status As A Requirement for Employment 224
A 4.15 Gender/Sex As A Requirement for Employment 225
A 4.16 Ethnicity As A Requirement for Employment 226
A 4.17 Religion As A Requirement For Employment 227
A 4.18 Age As A Requirement For Employment 227
A 4.19 Assignment of Posts to persons Based on Characteristics of Age, Religion, Sex,
Ethnicity 228
A 4.20 Types of Complaints In Public And Private Sector Organizations For the Period
August 2001-August 2006 229
A 4.21 Procedure used in Selecting Recruits 230
A 4.22 Encouragement of Speculative Job Enquiries 231
A 4.23 Organization’s Use of Assessment Forms 232
A 4.24 Shortlisting of Applicants in the Recruitment Process 233
A 4.25 Use of Job Descriptions in the Recruitment Process 234
A 4.26 Stage At Which Job Description Is Issued 235
A 4.27 Testing For Knowledge, Skills And Abilities Important for Job Performance 236
A 4.28 Organization’s Requirement For Educational Background Not Directly Related
To One’s Job 237
A 4.29 Information About Anti-Discrimination Act 238
A 4.30 Employees’ Awareness of Discriminatory Practices 238
A 4.31 Type of Discriminatory Practices 239
A 4.32 Awareness of Persons leaving Because of Discrimination 240
A 4.33 Existence of procedures (Directives) For Handling Various Reports 240
A 4.34(i) Existence of Procedures for handling Various Types of Reports -
Public Sector 241

xxii
A 4.34 (ii) Existence of Procedures for Handling Various Types of Reports -
Private Sector 241
A 4.34 (iii) Existence of Procedures for handling Various Types of Reports - 242
Trade Union
A 4.34 (iv) Existence of procedures for Handling Various Types of Reports –
Overall Results 242
A 4.35 Requirements for One’s Job – Age, Sex, marital Status, Ethnic Group,
Religion, Etc 243
A 4.36 Employees Opinion on the Basis of Employee Selection 244
A 4.37 Relations Between the Various Races 245
A4.38 Employees Socializing With Each Other 246
A 4.39 Level of Frequency With Which Staff Socialize 246
A 4.41 Possible Reasons for Staff Being overlooked 247
A 4.42 Effects of Being Overlooked 248
A 4.43 Employees Opinions of Organization’s Employment Practices of Recruiting
And Selection, Promotional Decisions and Cross Training 249
A 4.44 Employees Opinion of Whether their Organization’s Employment
Practices are Fair 250
A 4.45 Employment Practices Stimulate Employees to Remain 250
A 4.46 Whether Employees are Happy with Progress So Far 251
A 4.47 Employees Feeling About their Present Situation 251
A 4.48 Whether Employees Are Happy About Present Treatment 251
A4.49 Opportunity For Transfer 252
A 4.53 Employees Recruitment Experience 253
A 4.54 Receipt of Job Description 254
A 4.55 Stage At Which Job Description Was Received 254
A 4.56 Tests of Skills And Abilities Important for The job 255

xxiii
A 4.57 Tests of Skills And Abilities Not Required For the Job 256
A 4.58 Type of Tests For Skills & Abilities Important For The Job 257
A 4.59 Type of Tests For Skills & Abilities Not Required For the Job 258
A4.61 Employees Receipt of Formal orientation 258
A 4.62 Time of Orientation in Relation to Date of Employment 259

xxiv
List of Figures
2.1 Map of Guyana 7
2.2 The Hiring Procedure 34
2.3 Framework for Procurement 51
4.1 Most Common Reasons Identified for Employees Exit 76
4.2 Characters of Human Resource Personnel Practitioners 78
B 4.3 Type of Discrimination 236
B 4.4 Reason for Unhappiness with Treatment 236
B 4. Reason For Unhappiness with Progress 237
B 4. 5 (a) Duration of Employee Orientation 237
B 4.5 (b) Duration of Employee Orientation – Overall Results 238
B 4.6 Employee Orientation Activities 239

xxv
Appendices 182
1. Employer Questionnaire 182
2. Employee Questionnaire 196
3. Form - Employment Record 207
4. Grievance/Complaint Form 208
5. Appendix A – Tables 209
6. Appendix B – Figures 260

xxvi
Acknowledgements
I wish to acknowledge the cooperation of the various managers and heads of organizations, who have
given consent for their organizations and agencies to participate in this investigation and review of
employment practices in the public and private sectors in Region Four, Guyana. I thank the
respondents, both the Human Resource Management representatives and the employees, for taking
time out of their busy schedules to complete the questionnaires. My heartfelt thanks are extended to
my research assistants for their hard work and to the test experts for their contributions, especially for
reviewing the research instruments. I also thank the statistical analyst for his input in the project.

1
Introduction
1.1 Background The Ethnic Relations Commission (ERC) is a constitutional body which has evolved out
of the Government of Guyana’s recognition for the need to build social cohesion in the
country as a component of its programme of good governance. The ERC is established
to serve all Guyanese and persons living or working in Guyana. It has a number of
functions which relate to the provision and promotion of all forms of equity among the
various ethnic groups within the society.
The ERC was desirous of learning about employment practices in Guyana as it
seeks to foster equality of opportunity among the ethnic groups within the society. The
Commission envisaged that the results of the research would contribute to
determination of the extent to which equitable employment practices as these relate to
ethnic distribution exist, in Guyana.
1.2 Purpose & Research Questions
Purpose: This study sought to investigate and review employment practices in the Public and
private sectors in Region Four, Guyana. The research was also done to determine

2
whether over the five (5) year period, (August 2001-August 2006), there has been
equitable distribution of employment to the different ethnic groups in Guyana.
Research Questions: In order to fulfil the purpose of this research, the following questions were posed:
o What ratio of the various ethnic groups comprise the current staff within the
various employment sectors in Region Four, Guyana?
o What proportion of staff by ethnic groups have been recruited and exited in
the various sectors in Region Four, over the period August 2001-August
2006?
o What policies exist within the participating organizations and the extent to
which they are utilized to guide their recruitment and termination
procedures?
o What activities, processes and procedures were carried out in the
procurement and
termination of staff, in the public and private sectors in Region Four,
Guyana?

3
1.3 Definition of Terms & Concepts Employment practices:
Employment practices are the accepted policies and rules that define the acceptable
boundaries within an organization. They are the processes and procedures of human
resource management.
Recruitment:
Recruitment is the process of attracting a pool of appropriately qualified applicants to
fill positions within an organization.
The selection process:
The selection process is the shortlisting of applicants from the pool with the relevant
qualifications for the position(s).
Employees exit or culmination of tenure:
Employees exit or culmination of tenure constitutes a process which ends the
employment cycle and can be initiated by either of the contractual parties, employer or
employee.
1.4 Limitations
All researches have limiting factors and this is no exception. Major difficulties in this
research on employment practices in Guyana, are the paucity of time and financial

4
resources. Gaining access to organizations and perusing their records/information has
also proved challenging.
The study was completed in five months, extending the initial duration by two
months. A large amount of data has been collected in this research. However, the time
limit of the project has deemed it impossible to analyse all the information gathered and
affected in-depth analysis of some aspects of the research. An extended contract would
facilitate additional analyses that may be useful in addressing holistically, some of the
issues that prompted this research.
Some organizations that had given permission for the investigation were very
slow at making available the required documents, while some that had offered to
retrieve the required information from their employment records, were slow at
completing them. In some cases, it was necessary to discontinue pursuit of information
and or responses of whether or not some organizations would participate. Until the
writing of this report, at least one organization had not responded, despite continuous
calls and visits to the office.
Due to the general reluctance and delays of some organizations and agencies,
the content of the questionnaires was somewhat limited, though extensive. The initial
plan was to examine the human resource policy documents of the various organizations
before finalizing the research instruments. As a result of the above mentioned difficulty,
it was necessary to finalize the research instruments before all the information was

5
gathered, otherwise the study would have been much more delayed. It was intended
that the survey instruments in this study would have been administered using face-to-
face interviews. However, due to the delay in obtaining permission to conduct the study
in organizations, respondents were asked to complete questionnaires, except in cases
where persons were unable to read.
Where possible, however, questionnaires were completed simultaneously in a
central area, namely board-rooms, or library, in the presence of the researcher and
Assistant or Assistants, who provided explanations and or answered queries at the
respondents’ request. Where this arrangement was not possible, questionnaires were
completed at the respondents’ own convenience and then collected through their human
resource personnel practitioners or supervisors.
There was a small budget available to conduct this research. With a large
enough budget, it would have been possible to hire and train additional personnel to
assist in carrying out some of the research tasks required in this project. Apart from
technical inputs, the tasks in this research were carried out by the Researcher with the
assistance of one fulltime-short term Research Assistant and one part-time short-term
Assistant.
Another difficulty worth mentioning is the lack of updated records in some
organizations. This difficulty resulted in additional delays where in many cases,
sampling had to be done several times, either because some persons who were

6
purported to be employed in some organizations had exited or were transferred and the
records did not reflect these changes.
Although distributing questionnaires to be completed had its disadvantages, it
would have been more difficult trying to interview each person. Some organizations
had various locations or branches where staff was placed. Other employees worked
shift systems and in some instances could be contacted at nights only. In this regard, it
helped a great deal in cases where Supervisors offered to collect the questionnaires and
distributed them to persons who were selected in the sample. Supervisors also offered
to collect the questionnaires from employees when they were completed.
1.5 Chapter Summary
This chapter provided an introduction to the study. The background, purpose, research
questions, definition of terms and concepts were discussed. Limitations encountered in
carrying out this study, were also described in this chapter.
2 LITERATURE REVIEW
2.1 Introduction This section reviews the literature relevant to the study of employment practices. The
review provides an overview of the research setting and a short historical background of

7
the sectors involved in the study. It presents summaries of the employment practices in
the Public and Private sectors and Trade Union in Guyana as per their organization
policy guidelines. Human resource management and employment practices,
internationally, regionally and nationally, are described. The review provides a
discussion of steps to avoid and examples of best practices. The section also provides
the conceptual framework for this research which emerges from the literature.
2.2 Background
Guyana known as the land of many waters because of its network of rivers, has an area
of approximately 83,000 square miles (215 square kilometres). The country comprises a
population of 751, 223, according to the 2002 census, with males accounting for 0.1%
more than females. Amerindians, the original inhabitants of Guyana at the 2002 census
accounted for 9.2 % of the country’s population. The Africans were 30.2 %; East
Indians 43.4% and the Mixed race, 16.7 %, while the other races, Chinese and
Europeans accounted for < 1 %.
The population distribution by administrative regions in 1991 shows Region
Four, (Demerara-Mahaica), the focus of this study, as the region with the single largest
proportion of the population, 41.3% (310,255). Consequently, the majority of both the
large public and private sector organizations and Guyana’s major commercial and
administrative services are situated in Region Four. See Figure 2.1, below, showing

8
map depicting regions. A greater majority of East Indians live outside the city (rural
areas), Africans predominate urban areas. The Amerindians on the other hand, generally
occupy the interior areas of the country.
Figure 2.1 Map of Guyana

9
The distribution of the population by religious affiliation according to UNDP 2000
shows that persons continue to gravitate to the Christian Faith, (57.8%) in comparison
to 28.8% Hindus and 7.3% Muslims. This indicates that large numbers of East Indians
are also members of Christianity, since the East Indian population is approximately
13% higher than the African population which accounts for the second highest
proportion of the population. The religious population however also includes Bahai
(0.1%), Rastafarians (0.5%) with other religious groupings accounting for 1.3%, while
4.3% of the population reported to be not affiliated to any religious grouping.
2.2.1 The Economically Active Population:
The 2002 Population and housing census indicates that the working population at the
time of census was 49.5%, while a significant proportion (28.2%) performed home
duties. Approximately 5% of the population were seeking employment, 1.2% wanted
work, while 0.1% had work; presumably they were no longer employed. It should be
noted that the age of the economically active in Guyana is 15 years old. The distribution
of the employment structure shows a decreasing public sector and an increasing private
sector. In 1980 the public sector comprised 69% of the population when compared to
49% in 1992. In 1980 the size of the private sector was 31%, but increased to 51% by
1992, UNDP (1996). The report also posits that the Private Sector, up to (1992) offered
more jobs 51% in comparison to the Public Sector (49%).

10
Employment practices are the accepted policies and rules that define the
acceptable boundaries within an organization. They refer to the processes and
procedures of Human Resource Management, including recruitment, selection of
personnel to positions, management of their performances, and the provision of rewards
for their contribution and appropriate development opportunities or training. The
employees exit or culmination of tenure is also an important aspect of the process.
Human Resource Management is the administration of these practices.
The Human Development Report (HDR) of 1996 reported unacceptably high
unemployment rates, particularly in the 15-19 age-group. It was as high as 37%, while
being 20% for the 20-24 age-group. It showed lower levels of employment among
women than men. Eighteen percent of women were unemployed when compared to
men. The report also showed skewed results of ethnic distribution in unemployment.
While, overall unemployment rate was 12% in 1992, it was close to 14% for African
Guyanese but below 12% for the East Indians.
Further, HDR data reveals that the East Indians in Guyana comprise a lower
population of workers in regularly salaried employment (56%) compared to Africans
(67%). In terms of occupational structure the ratio of East Indians to Africans is
approximately 3.5:1 in agriculture and 1.5:1 in commerce. The situation was however,
reversed in the government, where the ratio of Africans to East Indians was
approximately 2.8:1.

11
2.2.2 Overview of the Public Sector
The Guyana Public Service Commission was established in British Guyana in 1953 in
an attempt to guarantee political neutrality to the public service, which was previously
administered under the traditional-colonial system. The Chief Secretary had the
constitutional responsibility for all staff matters, which were discharged through the
establishment Department.
A conference held in London in 1966 took the decision for the Public Service
Commission to become an executive body. This did not come into force until
Independence May 26, 1966. At this point, the personnel section of the establishment
Department was converted to the Public Service Commission’s Secretariat. The
Financial Sector became the head of the Establishment Section, which later became
known as the Establishment Division of the Finance Ministry. This section along with
the Public Service Commission controlled the administration of Personnel and relevant
matters, including matters regarding conditions of service and management, including
the relevant financial matters and all administrative arrangements regarding personnel,
(PSM Website).
Burgess and Henn (1966) had recommended the separation of the Ministry of
Finance and the Establishment Division. They proposed the expansion of the personnel

12
management to a full ministry with its own Permanent Secretary. This resulted in the
birth of the Public Service Ministry, comprising a Personnel Division, Training
Division, Management Services Division and a Division of Common Service with
adequate power and authority to achieve its objectives. These included improving the
organization of work modernizing facilities, supplying procedures and doing all in its
capacity to improve and strengthen the public service among other things.
The Public Service Reform Programme in 1991 led to the re-naming of the
Public Service Ministry which was merged into the Office of the President, creating a
new name, The Public Service Management. This reform programme also resulted in
the reduction of the number of Ministries from 18 to 11.
There has been a further attempt to improve the Public Service. In this regard
the Public Management Modernization Project (PMMP) was launched in December
2005, with one of its major objectives:
“To strengthen the management capacity of the Public Service Ministry (PSM) in order to enhance its competence to regulate and manage the public service system….” (Ibid.).
The Project has three components as follows:
Public Service Management Strengthening
Improving Accountability and Efficiency of Service-autonomous agencies and
statutory Bodies.
Coordinating the State Reform Process.

13
Component (1), Public Service Management Strengthening, which is of major
importance to this program, has been divided into six (6) sub-components as follows:
Improve the capacity of the PSM: The activities to be undertaken are:
- Articulation of a Human Relations strategy
- Development of new and more relevant organization structures
- Development of prototype structures for personnel offices with a view
to converting them in Human Resource offices
- Redesigning jobs with the new structures and preparation of
appropriate job description
- Work force planning.
Review of Public Service Rules and Regulations, to effect the following:
- Improve normative consistency, management flexibility, efficiency,
effectiveness and transparency of the human resource function
- Enhancement of Human Relations Management Information System
- The provision of area networking communication between Ministry of Finance
and other ministries, regions and constitutional agencies
- Strengthening of Personnel Office (PO) to enhance the management capacity of
the Personnel in the traditional public service
- Training of Permanent Secretaries and Heads of Departments

14
- Implementing a Performance Appraisal system for Permanent Secretaries and
Heads of Departments.
The Inter-American Development Bank (IADB) is the funding agency for the
project and one of the major indicators to measure the success of the project is
“Government Effectiveness” using Kaufmann Index, which is used to measure
governance in countries, PMMP News (2006).
2.2.3 Overview Of The Private Sector The concepts of private sector and private enterprise are age-old phenomena in
Guyanese society. The private enterprise was present during slavery where slaves were
given permission to do farming on small plots of land. The produce from their farming
was used to feed their families while the excess was exchanged or sold at central points
and later at markets. After slavery, many ex-slaves went into small scale agriculture
and haggling among other economic activities. The immigrants also were engaged in
private enterprise. For example the Portuguese gained their economic independence by
becoming small retailers, while the East Indians gained theirs by engaging in rice
farming, Augier, etal. (1965).
The global recession in the 1970’s resulted in economic decline throughout the
developing world, including Guyana. According to Thomas (1988), this unexpected
recession caused a doubling of inflation rates and quadrupling of the consumer price
index, resulting in large-scale unemployment and retrenchments in the public sector.

15
These, among other negative effects, such as the existence of sharp foreign exchange
deficits and government’s controls on business, have seen the evolution of a substantial
black market for all types of commodities. Persons individually and collectively became
involved in all forms of private businesses, in order to create a means of survival and to
maintain their families. Several organizations were established to support the growing
number of private enterprises. These included the Consultative Association of
Guyanese Industry, (CAGI) in 1962 and Private Sector Commission in 1992.
The Consultative Association of Guyanese Industry Limited (CAGI), an
employers association, was established in 1962. The objectives of this association
include direction of leadership, provision of factual information on the changing trends
of management and industrial relations, developing an enabling environment to enhance
the consultative process among social partners and provide professional consultancy
services on labour and employment These were done with the overall objective of
facilitating healthy relationships, promoting greater efficiency within the workplace and
enhancing employers’ human resource management skills, CAGI (2005).
The Private Sector Commission is a formal institution representing private
businesses. The Private Sector Commission was formed in 1992 as a not-for-profit
organization. This is an advocacy body that focuses on issues of national importance
and whose function is to unite the Guyanese Private Sector, enhance the business
environment and Guyana’s economic development as a whole. It promotes, preserves

16
and encourages the principles of private enterprise and production through individual
and collective endeavours. It assists in planning, coordinating and monitoring various
resources within the private sector, (PSC Files, Internet; PSC Annual report, 2005).
2.2.4 Overview of the Trade Union The mass protests and work stoppages of 1903, 1904 and 1905 led to the emergence of
the first formal Trade Union Movement in Guyana. Hubert Nathaniel Critchlow at the
age of 21 became the leader of this spontaneous movement, which he later organized.
Workers went on strike in 1914 for improved wages, which was eventually granted.
This success was encouraging and Critchlow presented another petition for an
eight-hour per day work. Critchlow was subsequently dismissed and denied work. It
was during these activities that Critchlow announced the formation of the British
Guyana Labour Union (BGLU), which attracted a large membership. The Union
organized workers in all sectors and dealt with ‘bread and butter’ issues. The activities
of the union went beyond the work places and addressed high cost of living and rentals,
among other issues.
Union organization was however stifled during slavery, for slavery was upheld
by force and slaves likewise had to use force to advance their rights, Tennessee (n.d.) in
CARISFORM, Vol.3. Today there are many labour unions in Guyana representing the
rights of workers in both the private and public sectors, on many employment and other

17
issues. Four workers Unions have participated in one way or other in this research on
employment practices in the public and private sectors in Region Four, Guyana.
2.3 Employment Practices - Global Perspectives
The literature on international employment standards and practices indicate a consensus
on equality of employment opportunities or non-discrimination in human resource
management policies. It promotes fairness in policies, procedures and processes of
recruitment, selection and rewards of personnel, among other things.
Article 23 of the Universal Declaration of Human Rights (UDHR), promulgates
non-discriminatory rights in employment and conditions of work for every individual.
It states:
Article 23: 1. Everyone has the right to work, to free choice of employment,
to just and favourable conditions of work and to protection against unemployment. Everyone, without any discrimination, has the right to equal pay for equal work.
2. Everyone who works has the right to just and favourable remuneration ensuring for himself and his family an existence worthy of human dignity, and supplemented, if necessary, by other means of social protection
3. Everyone has the right to form and to join Trade Unions for the protection of his interests.
UNESCO,UNHCHR 2001(261).

18
In this regard, the present study has included a human rights aspect, whereby it
sought to investigate whether there were any discriminatory policies or practices
evident in the sectors and whether the element of Trade union representation existed in
the various sectors.
Various international human rights declarations, conventions and articles have
been formulated to discourage any form of discrimination against individuals in society,
including discrimination in employment opportunities and practices.
Beginning in 1948, the Universal Declaration of Human Rights (UDHR) above
was adopted and proclaimed by the United Nations General Assembly on December 10.
This was done “…in recognition … (that)…the inherent dignity and… the equal and
inalienable rights of all members of… (humanity) is the foundation of (the necessary)
freedom, justice and peace in the world.” (Ibid.).
Based on these principles of equality and dignity which constitute the freedoms
set out in the Universal Declaration and in order to promote and encourage respect for
these fundamental rights and freedoms, regardless of sex, race, religion, or language,
the general Assembly in 1963 agreed to ten (10) principles in the form of Articles.
These articles in summary address the following:
- the condemnation of racial and other discrimination, treating them as violation and denial of freedoms proclaimed in the UDHR.

19
- prohibition of any individual, group or state from advocating/lending support to any form of discrimination; but rather to undertake concrete measures to protect individuals against this.
- prevention of racial or other forms of discrimination in the fields of
employment, housing, etc., but rather promoting equality of access to these.
- Revision of public policies/laws regulations, etc, which are likely to perpetuate racial discrimination or segregation, or affect persons right to participate in elections and government, through universal and equal suffrage.
- Provision of equal justice and security
- Elimination of racial discrimination and prejudice and promotion of friendship
and tolerance among nations through teaching, information and education.
- Condemnation of theories or ideas of superiority of race, group colour, etc, acts of incitement, violence, treating them as offences punishable under law, and that
- All concerned leaders of the UN take energetic action to abolish and recommend
measures to eliminate all forms of discrimination and to observe the provisions of the UDHR, UNESCO, UNHCHR (2001).
Further, in 1965, all member states of the United Nations of which Guyana is
party, adopted and opened for signature and ratification the “International Convention
on the Elimination of All Forms of Racial Discrimination”. In this convention, member
states have agreed to undertake both separate and joint action to encourage and promote
observance and respect for the human rights and fundamental freedoms for all,
including the “… right to work, free choice of employment, just and favourable
conditions of work… equal pay for equal work (etc)…” regardless of race, sex, religion,
language or origin (Ibid, 297-299).

20
Although there may be no specific provision made in the constitutions of some
countries, for non-discrimination in employment, there is application of the provision
that deals with protection from discrimination, be it race, origin, political opinions,
colour, creed or otherwise. This is evident in Section 24 of the Constitution of Jamaica;
Part 1:4 of the Constitution of Trinidad and Tobago; Article 23 of the Constitution of
Barbados and in Article 149 of the Constitution of Guyana.
Some countries and organizations have furthered non-discrimination in
employment practices by adopting Employment Equity Policies. Such a policy,
according to the Canadian Equity Policy Commission, promotes full equity and fairness
in employment and the use of merit and potential as the basis for hiring and promoting
employees.
Similarly, the Cooperative Bank of the United Kingdom in its equal
opportunities policy statement indicates that the Bank promotes equal opportunity for
all its employees, regardless of colour, race, nationality, sex, gender and other
distinguishing features of individuals. The bank tries to ensure an appropriate
discrimination-free environment for all. Its purpose is to foster respect and dignity in
the workplace, (Internet).

21
2.4 Employment Practices – Regional studies
The human resource management process of recruitment and hiring, etc is neither new,
nor does it lack documentation, even though studies on employment practices in the
public and private sectors in the Caribbean have not been widely done. There seems to
be no evidence of any that has been done in Guyana. A similar study was however
carried out in the Public and Private Sectors of Trinidad and Tobago.
On the other hand, the Inter-American Development Bank had commissioned a
study of Civil Service systems and reforms in the Caribbean. This was carried out as
part of its program of regional policy dialogue, on civil service reform in Latin America
and the Caribbean and Guyana participated. This study did not include the private
sector. Similar studies to the present were however done in other parts of the world,
such as in Canada and in the United Kingdom.
Various aspects of the human resource management process have been
presented in many books and articles, for example by Flippo (1997), Mondy & Noe, III
(1990), Mathis & Jackson (1982), Scarpello & Ledvinka (1988), Rees (2000), Texas
A&M University (2004), among others.
The centre for ethnic studies at the University of the West Indies conducted a
study on employment practices in the Public and Private Sectors in Trinidad and
Tobago. The study was divided into two parts, Public Sector and Private Sector. It did
not include the trade union, which is included in the present study.

22
2.4.1 Public Sector
The main objectives of the investigation into the practices in the Public sector in
Trinidad and Tobago sought to determine the ethnic composition of the public service,
to account for the different mobility rates within the service; persons’ perceptions of
the recruitment processes and to make recommendations.
This present study in Region Four, drawing from the study in Trinidad and
Tobago also sought to determine ethnic composition, people’s perceptions of the
recruitment processes, though it did not attempt to account for the rates of mobility but
circumstances of mobility. This study also makes recommendations, but it included
labour unions, not only in examining their role as representatives of workers, the study
also sought to enquire into the unions’ employment practices as example-setting
organizations.
The study in Trinidad focused on one of the critical human resources institutions
in the Public Sector of Trinidad, namely, the Public Service Commission. It also
investigated various local government agencies.
The present study although it focused on the Public Service and Police Service
Commissions as a single unit, it also attempted to investigate individual ministries of
government and other constitutional bodies as part of the public sector. This was done
because initial information received, indicated that ministries recruited certain levels of

23
staff and maintained their own record, and as such it was advisable to approach
individual ministries, including the Public Service Ministry.
The study in Trinidad and Tobago utilized stratified random sampling which
was done across regions and types of companies. The present study also utilized
stratified random sampling, but this was done across gender and ethnicity in both public
and private sector organizations, including ministries, constitutional bodies, private
sector organizations, companies, para-statal bodies and labour unions.
The major findings of the study conducted in Trinidad and Tobago, included the
following:
- Indians were heavily under-represented in the higher positions of the Public Sector, especially in the central public services
- Indians were more adequately represented in areas where technical criteria and merit prevailed, such as in the Judicial and professional sectors.
- There was evidence of ethnic controversy of appointment at the level of Nursing Assistants and in the Police Service.
- Many alleged cases of racial discrimination appeared to be the result of cliques, patronage and family networks.
- Certain sections of the public services were seen to be of one ethnic group or other.
- In some companies race was identified as an influential factor of staff promotions
Among the recommendations offered were:
- That authorities use objective devices in assigning weights to merit, criteria, seniority and staff reports on appointments and promotions.
- ensure a measure of racial balance on all interview panels.

24
- integrate the Human Resource Management function at the national level, but establish a section at each Ministry with “exclusive responsibility” for carrying out the human resources function.
- consider the principle of ethnic balance in appointments to the Public Service Commission.
- the inclusion of race and gender in records of agencies can be used to facilitate monitoring the general development of the public sector with respect to ethnicity.
- separate the chairmanship of the Police and Public Service Commissions. UWI, (1993).
2.4.2 Private Sector The second part of the study on employment practices in Trinidad and Tobago focused
on the Private Sector. The investigation attempted to determine, whether in hiring
employees for their businesses, employers displayed any discriminatory biases towards
candidates, such as gender or ethnic background. Employees within the specific
companies were also interviewed as a means of verifying the information that their
managers had provided. Separate questionnaires were utilized for employers and for
employees.
Similar to the investigation in the public sector, the survey method of enquiry
was utilized in collecting the data. The sample was stratified along the lines of
administrative area location, characteristic feature, industrial sector, sub-sector ad size
of firm. It is to be noted that although there was an adequate sampling frame suitable
for research at the Central Statistics Office of Trinidad and Tobago, the diversity of the
structure and functions of the majority of the firms in addition to their smallness in size,

25
deemed them unsuitable for the types of research that was conducted. This did not
however negatively affect the sample size, because in designing the sampling frame,
they had included additional firms to accommodate any reduction in the frame.
The results of the survey in the private sector seem to indicate that dispositions,
structural features and certain sentiments in operation tend to result in “…selective
choices from among employees which may be considered discriminatory on the basis of
definite personal attributes.” (UWI, 1993:339). Senior officials were asked questions
relating to racial groupings in their businesses in an attempt to influence greater detail
with respect to the different ethnic groups. These questions addressed on the job
competence, effectiveness, leadership qualities and organizational loyalty. Managers
were also asked to respond to queries of employees’ reliability, honesty, punctuality,
show of respect and high esteem.
A summary of the major findings in relation to the above questions indicated
that the Indo-Trinidadians repeatedly received higher ratings than their Afro-
Trinidadian counterparts in many cases, from managers of both Afro-Trinidadian and
Indo-Trinidadian backgrounds. Indo-Trinidadian managers consistently gave Africans
very low rankings, particularly in terms of productivity, competence and punctuality. In
this regard, less than five percent of the Indian managers selected employees of African
origin in preference to persons of other backgrounds. Except for good team spirit,

26
where approximately 13 percent of Indo-Trinidadian managers rated them, Afro-
Trinidadians received a maximum of no more than nine percent in every case.
In comparison, it is noteworthy that a significantly high proportion of Afro-
Trinidadian managers chose employees of Indian origin over Africans in respect of
reliability (29.9%), dedication (33.3%), punctuality (33.6%), harder working (37.0%),
attributes of profitability (37.8%) and productivity (38.6%). Employees of Indian
dissent were regarded as almost equal with Africans, in respect of attributes of high
achievement, team spirit and dedication to work. Afro-Trinidadian managers however
rated them lower than their African counterparts in respect of interpersonal
relationships, honesty and competence.
The managers in other ethnic groupings, namely mixed ancestry and whites have
scored Trinidadian workers of Indian origin more highly than their counterparts of
African descent in the areas of high achievement, hard work, reliability, punctuality,
loyalty, dedication, productivity, profitability and work attitude and dedication.
The study seems to suggest that these findings which emanated from managers’
preferences may be an indication of the manner of stereotyping of ethnic groupings,
resulting in the likelihood of the possible occurrence of discriminatory employment
practices in the Trinidadian and Tobagonian societies, UWI (1993).
In 1970, the Trinidad and Tobago Commission of Enquiry conducted an enquiry
into racial and colour discrimination in the Private Sector. The Commission commenced

27
its enquiry by inviting the general public, including organizations to submit memoranda
on any matter considered relevant to the enquiry. It utilized all the local press, radio
and television. It received seven memoranda, all of which related to discriminatory
practices in relation to employment and race.
Relative to the complaints received, the commission conducted a survey of
banks, finance houses and insurance companies. A fact-finding questionnaire seeking
the organizations’ recruitment, promotion and loan policies, preceded an introductory
letter stating the terms of reference and seeking the cooperation of the organizations
concerned.
The questionnaire addressed concerns relating to the complaints received,
including the number of nationals employed in comparison to expatriates; conditions of
service to expatriates and salary structure; factors and order of importance of factors,
considered in recruitment, promotion and provision of loans; description of procedures
adopted for recruitment, promotion and promotion of loans; and whether such
procedures were decided upon locally.
The results of this investigation included the following:
- that the factors most highly considered in recruitment of high level personnel were educational qualifications, experience, special aptitude and personality
- For middle level personnel, such as clerks secretaries and cashiers,
the factors were educational qualifications, special aptitude, experience and personality

28
- The bottom level, such as non-clerical, messengers, cleaners, were
educational qualifications, character, personality and experience.
Other less important factors considered, were present or previous performance, career
aspirations, whether the person was already a member of staff or the industry,
adaptability and neatness. All respondents indicated that neither race nor class was
considered a factor for employment.
The present study of employment practices in Region Four, Guyana utilized
similar methods to those used in both the first (public sector) and second (private sector)
parts of the study in Trinidad and Tobago in that both studies utilized survey method
and stratified random sampling. In both studies also, separate questionnaires were
administered to employers and to employees.
As stated earlier, the inter-American Development Bank conducted a study of
the Civil Service in Latin America and the Caribbean, in which Guyana, along with the
Bahamas, Barbados, and Jamaica, participated. The study focused on public policy
management and transparency in the Civil Service, the situation and future challenges.
The issues dealt with included Central government employment as a proportion of the
total labour force and total population. The results showed that Guyana among six other
Caribbean/Latin American countries recorded the lowest percentage, (3.4%) of the
labour force being employed in the central government, as compared to Suriname with
the highest proportion (44.7%) followed by (20.1%) in Trinidad and Tobago and

29
Barbados, (18.6%). While in all the countries for which information was provided,
women accounted for the highest proportion in the public service generally, Guyana
represented the country with the highest proportion, (61%) of women, with Barbados
ranking second with 56% and the Bahamas 55%.
Focusing on Guyana, the study showed that Guyana relies on labour laws that
regulate aspects of personnel administration while other countries used a “single based
legal system” or an “all-inclusive system for personnel in a single jurisdiction”, Draper
(2001:16).
In respect of decision to hire, work assignments, promotions and evaluation,
Guyana reported that this was done by the head of the Institution or Agency. It also
reported that the country utilized relatively informal procedures in its employee
selection process, including such objective criteria as examinations and consideration
between the post and the individual. Guyana, like other countries reported that there
were no restrictions on minorities having access to the public service. The results
showed that there is a probationary period of six months to a year and employees
become permanent automatically at the end of that period.
It was also found that the regulations in most countries allowed for dismissal
based on negative evaluation, corruption and failure to perform duties, which are
however seldom applied and the process takes a long time.

30
In terms of promotion decisions, seniority is generally regarded as an important
factor. In Guyana, performance is considered marginally, while it is significant in
Barbados. On the other hand promotion generally does not reflect improved pay for
employees.
Horizontal occupational mobility in Trinidad and Guyana tends to be within the
same sector, while in Barbados and the Bahamas, there is mobility across the entire civil
service, (Ibid, p.19). The study results indicate that generally mechanisms for
accountability in spending for training is lacking in most of the countries.
The research indicated that working hours are generally uniform, being 7 to 8
hours per day and that most salary systems reflect the principle of equal pay for equal
work and that salary scales in the public sector tends to be relatively comparable to that
of the lower levels of the private sector salaries. However, this is not the case with the
middle and senior management levels, (Ibid.).
2.5 National Constitutional Acts and laws regarding
employment practices In keeping with the doctrine of human rights in general, Guyana has enacted
fundamental rights and freedoms in its constitution, as seen in Articles 138 to 153. In
particular, the right to non-discrimination is clearly illuminated in Article 149.

31
The notion of this non-discrimination provides for equality in employment, a
right which is considered a very fundamental and crucial one. The article states:
149(1) Subject to the provision of this article:
(a) No law shall make any provision that is discriminatory either of itself or in its effect; and
(b) No person shall be treated in a discriminatory manner by any person acting by virtue of any written law or in the performance of the functions of any public office or any public authority.
‘Discriminatory’ in Article 149 is described as:
Affording different treatment to different persons attributable wholly or mainly to their or their parents’ or guardians’ respective description
by race, place of origin, political opinion, colour, creed, age, disability, marital status, sex, gender, language, birth, social class, pregnancy, religion, (Guyana Constitution).
Guyana has also passed the Equal Rights Act, 1990, No: 19 of 1990 which has
strengthened the situation in the area of employment in tandem with other legislation
against discrimination. This act made provision for the enforcement of the principles
enshrined in Article 29 of the Constitution which deals with gender equality.
Guyana subsequently took a very integral approach with respect to its enactment of the
“Prevention of Discrimination” Act, No. 26 of 1997. This Act prohibits discrimination
in any area of occupation or employment, in both public and private sectors, on the
grounds of race, sex, colour, religion or ethnic origin, social origin, indigenous
population, political opinion, national extraction, disability, marital status, family
responsibilities, pregnancy and age.

32
Section 3 of the Act deals specifically with discrimination regarding recruitment
and selection or employment of persons for the purpose of training. This act has
substantially provided for a wider range of instances under which a person can be
protected against discrimination and as such is no longer dependent merely and solely
upon the provision stated in Article 149 of the Constitution.
With this enforcement of Act No: 26 of 1977, it follows that equal employment
opportunities or non-discrimination in employment could be more easily achieved
resulting in furthering the promotion of fundamental rights and freedoms.
2.6 The role of Human Resource Management and the
Recruitment process
2.6.1 Human Resource Management:
The structure of human Resource Management can vary from formal to informal
processes and practices. Formally structured human Resource management policies,
according to Loughlin (1999) have proven to be more valid than the informally
structured policies. Nevertheless, most organizations, according to Burton (1998b.),
Powell (1988), Werneck (1994), Woody and Weiss (1994) in Loughlin (1999), employ
the unstructured informal interviews. Organizations find it difficult to assess their
practices and outcomes when they lack formal policies.

33
It is argued however that the formality of human resource management practice
is not necessarily an indication that they are based on merit and are biased-free.
Loughlin points to a substantial body of work such as Hyman (1996), and Burton
(1998) that challenges merit and objectivity in decision-making as relatively easy. It is
argued that informal recruitment and selection policies, Thomas et al. (1994) in
Loughlin (1999), minimize recruitment cost and assist in the selection of the best
candidates.
2.6.2 The recruitment process – an overview Generally, the literature on recruitment and hiring or the recruitment process indicates
that the process should emanate out of a planning process which should include
forecasting, Scarpello & Ledvinka, (1988), Thomas (1985), Fisher (1990). When the
position becomes vacant and the organization grants permission to fill that post, the next
step should be, to carefully examine and enumerate the skills and abilities required for
that position, including the precise qualifications of the candidates. The next step
involves planning the recruitment strategy, which should be fair and non discriminatory.
Flippo (1997) is careful to warn that “… (h)iring through selection is negative…” since
it eliminates applicants.
According to Flippo, there are generally two sources of recruitment of
employees, internal and external. Both sources have their advantages and
disadvantages. Some organizations use different channels for different occupational

34
groups. Most organizations however, rely on formal advertising, since public
announcement is a requirement for compliance with equal employment opportunity
laws and procedures. Advertising, according to Thomas (1985) is one of the least
expensive means of attracting a large, diverse group of potential applicants.
While internal recruiting has the advantage of known ability, is motivational to
current employees, requires reduced training and fosters less expensive recruitment
cost, Fisher (1999), it also has the disadvantages of failure to attract sufficient supply of
qualified individuals above the entry level. Filling one vacancy internally creates a
second. If that vacancy is also filled internally, then it creates a ripple effect. This can
result in the organization loosing flexibility and becoming inbred. Meeting affirmative
action goals are usually only accomplished by aggressive external recruitment (ibid.).
The advantages of external recruiting include encouraging new ideas and
viewpoints and achieving the goals of affirmative action. Where there is need for a
severe shake-up or turnaround, an outsider with no commitment to current employees
may be more objective. A disadvantage of recruiting externally is the cost, as the
external market is much larger and more difficult to reach. External recruiting also
brings with it, the risk of not hiring the person who is able to maintain the high potential
displayed during the recruitment process. In addition, current employees could be
discouraged if there is too much external recruitment, as this may reduce the chances of
current employees being promoted to higher positions in the organization, (Ibid.).

35
External recruiting can be grouped into two classes, formal and informal. The
formal methods use advertisements, employment agencies, executive search firms and
campus recruiting. The informal methods include re-hiring former employees, hiring
from unsolicited applicants, called “walk-ins” or “gate-hires” and referrals from friends
or relatives, (i.e. “word of mouth recruiting). The informal methods tap a narrower
labour market then the formal method of recruiting, which searches the labour market
more widely for prospective employees, with no previous connection to the
organization. According to Fisher (Ibid), informal methods are most common in hiring
blue-collar personnel and clerical staff.
Table 2.1 below, shows the most common types of formal and informal methods
used in companies used in the United States of America to recruit for five types of
positions.
Table 2.1
Methods Used for Recruitment - USA
TYPE OF JOB
Method Office/ Clerical
Plant/ Service
Sales Professional/ Technical
Management
Employee referral 92% 94% 74% 68% 65%
Walk-in 87% 92% 46% 46% 40%
Newspaper Advertising 68% 88% 75% 89% 82%
Source: Personnel Management BNA Policy and Practice Series, P. 201:115. Copyright 1979 by the Bureau of National Affairs, Inc., in Fisher (1999).

36
The table shows that the most common methods used were Employee referral,
walk-in, and newspaper advertising. Employee referral was used most often to recruit
plant/ Service staff, (94%) as compared to (92%) for Office/Clerical staff and (74%)
sales staff. With respect to Walk-in, this method was utilized mostly to recruit
plant/Service workers, (92%) and Office/Clerical staff, (87%). The table shows that
advertising, on the other hand, was used most regularly to recruit
Professional/Technical staff, (89%), Plant/Service workers, (88%) and Management
Staff, (82%), (Ibid.).
Other sources utilized for recruiting, include employment agencies,
recommendations of present employees, schools and colleges, labour unions, casual
applicants, nepotism, leasing, Flippo (1997); Private, For-profit Agencies, Executive
Search Firms, Campus Recruiting, Affirmative Action Recruiting according to Fisher
(1999). Employee Referral Programs and other educational institutions according to
Ledvinka and Scarpello (1988) are also sources through which personnel are recruited.
In the hiring procedure, there are a variety of methods which can be used to
gather significant information about the applicant. This information can be compared
with the job specification, to assist in the decision of hiring. There is no standard
procedure that all organizations use. One popular method according to Flippo (1997)
includes eight steps, See Figure 2, below. This procedure below, according to Flippo,

37
will vary based on the size of the organization or agency, type of position to be filled
and the philosophy of the Human Resource/Personnel Management.
Figure 2.2. Hiring Procedure
----------------------------------------------------------------------------------------------------------
--
� Initial or preliminary interview
� Application blank or blanks
� Check of references
� Psychological tests
� Employment interview
� Approval by supervisor
� Physical examination
� Induction or orientation
Source: Adapted from Flippo, (1997:139).
2.6.3 Initial or Preliminary Interview
This interview is usually short and intended to eliminate those who are obviously
unqualified for the position. It may be a stand-up interview at a desk or counter. The
questions the applicant is asked at this point are often related to his/her reason for
applying for the particular job, salary requirements, his/her last grade completed at
school and the names of jobs held previously. If the applicant seems to have a chance of
qualifying for the existing vacancy, he or she is given an application blank to complete.

38
Application Blank
Application blanks deal with basic information that are considered important. With the
institution of the United States Civil Rights Act of 1964, which prohibits discrimination
in employment on the basis of race, nationality, creed and colour, certain questions that
would reveal this type of information, as well as sex, had to be eliminated from the
Application blank. However, asking the name of an applicant would often give an
indication of the person’s sex. Some organizations, (Flippo, 1997) substitute the
preliminary interview by using an additional short form to determine whether the
applicant is eligible to proceed to completing the longer form.
A general principle of the hiring procedure according to Flippo “… is to assign
to each step, information objectives that can best be obtained by the methods of that
particular step. The more factual information should be obtained by means of an
application blank.” (p. 143). Recruitment officers should refrain from asking questions
that may be embarrassing, or which can be easily misinterpreted. On the other hand,
officers should avoid repeating questions in the interview that have been already dealt
with on the form. It is felt that the interview, should be used to deal with the more
difficult and intangible information.
Some organizations try to increase the value of the application forms by
studying certain information on the form and on-the job success. Weights are assigned
to variables such as age, marital and family structure, and number of jobs, among

39
others, to determine stability with the objective of decreasing labour turnover. It is
advisable however, that no organization should select an employee based only on one or
two important facts. It is wise to select an applicant who fulfils the conditions that have
yielded significant results in the past.
2.6.4 References/Recommendations
Properly checked references can prove of great value in the hiring process. Three types
of references prove valuable in hiring procedures (ibid). they are as follows: the school
reference, character reference and the job reference. It is felt that a check on the work
experience is most valuable. The school reference is most applicable in cases where the
applicants have just completed their school or college education. It would be a good
way of verifying the level of education of the applicant. The character reference could
be of less value, since the applicant chooses the person who writes this reference and it
is usually easy to predict the nature of the information which it contains.
2.6.5 Psychological tests
Psychological tests in the hiring procedure are not common as they are very complex.
One study shows that there is a direct relationship between organizations that do testing
in their recruitment process and the size of the organizations. The smaller companies

40
focus on interviews, (Ibid.). It is most of the larger organizations that can afford more
detailed and accurate procedures, such as psychological tests, in their hiring procedures.
2.6.6 Employment Interviewing
The employment interview is very common. The employment interview is generally
done to gather significant information about the applicant. It usually gathers highly
important information about the candidate. Some organizations derive their information
from what is called “leaderless group discussion”. The procedure involves a discussion
among applicants, who are asked to discuss a particular topic without the presence of a
leader. The group is observed by human resource personnel, who look for specific
activities such as lead taking, influence, summarizing and clarifying capabilities,
mediation and effective speaking.
2.6.7 Supervisor’s Approval
Provided the applicant has successfully completed the previous steps, the opinion of the
staff hiring personnel at this point, is that he/she should be hired. However, it is the
requirement of the line and staff relationships, that the supervisor of the section where
the vacancy exists have an input. As such, a third interview is conducted involving the
supervisor who would be held accountable for the candidate’s performance once hired

41
and who is better acquainted with the type of personnel and work environment, in the
department.
2.6.8 Physical examination
A physical examination is usually conducted towards the end of the hiring procedure.
This examination has three basic objectives:
1. It serves to ascertain the applicant’s physical capabilities
2. “…to protect the company against unwarranted claims under workmen’s
compensation laws, or against lawsuits for damages.” (Ibid.).
3. “…To prevent communicable diseases from entering the organization.” (Ibid.)
2.6.9 Orientation /Induction
The physical examination culminates the selection process. Provided the applicant
successfully passes this examination, which is the last step at which a candidate can be
rejected, the employee is hired. The orientation begins immediately after the hiring is
confirmed. This orientation or induction involves introducing the new employee to the
organization. It constitutes a degree of integration and agreement between the
organizational and individual objectives. The new employee is introduced to the
culture, policies, philosophies and customs of the organization. The personnel

42
department would explain the nature of the organization and its products and or
services. The history and operation of the company is also explained.
The employee is provided with information about particular employee services
such as safety, health and welfare plans and pensions, among other things. The
employee is also shown around the department and its work areas. He or she is
informed of the various locations for the locker rooms, cafeteria, time clock, working
hours, rest time and manner of dress and dress code. The complete induction period
provides for a follow-up interview, a few weeks after the employee assumes his/her
position, at which time the employee can have any areas of dissatisfaction cleared up
and would assist in raising the employee’s level of satisfaction.
2.7 Steps to avoid non-discrimination in employment;
developing best practices
Every employer has the responsibility to ensure that their employment practices are
non-discriminatory. The literature on human resource management and employment
practices promote a wide range of policies that could be put in place to minimize, if not
avoid discrimination in employment practices, including the processes and procedures
followed, with respect to race, ethnicity and other distinctions.
Reitz and Weiner (n.d.) of the University of Toronto, in an article on
“Employment Equity: Policies, Programs and Practices for Aboriginal Peoples and

43
Visible Minorities”, posits that good practices do not stop at compliance with
legislation, but they must go beyond that realm. In this regard, they proposed a number
of good practices for employers as follows:
� clear commitment to the goals of employment equity; � accountability of human resources staff for employment equity results � communication, including education, training and awareness; � supportive organizational climate; and � steps to bring about employment equity objectives, including some or all of:
o methods of outreach for past established recruitment networks;
o methods for organizational self-study to identify barriers;
o use of goals and timetables for attaining equity, and monitoring results;
o accountability for selection and promotion decisions;
o use of foreign-credential assessment services;
o mentoring foreign-trained professionals; and
o recognition for exemplary implementation of equity policy, (Ibid.).
The promotion of Equal Employment Opportunity (EEO) is central to the
avoidance of non-discrimination in employment. Equal employment opportunity is
provided when all conditions of employment and management decisions are based on
good, consistent and fair human resources policies and procedures. It allows all
workers to have an equal chance to seek, to obtain employment and to attain eligibility
for promotion in their jobs. EEO requires that employees are treated on the basis of

44
their individual talents and capabilities and has the objective of eliminating all forms of
discrimination in recruitment, selection, training and conditions of employment.
Equal employment, according to (Gray, 2004) does not however assume that
each individual possesses the same abilities or that everyone will attain the same level.
It requires that every person is provided a fair chance to use their talents and abilities
without being blocked by factors irrelevant to their capacity.
Affirmative Action also helps. Affirmative Action is a program which is
designed to redress imbalances of minorities and women in the labour force. In this
program, special attempts are made to recruit, hire and advance these groups when they
are under-represented in the workforce.
A study of best practices of private sector employers in the United States was
carried out by a task Force. This task force was headed by Commissioner Reginald E.
Jones of the Equal Employment Opportunity Commission, the enforcement agency with
responsibility for compliance with statutory mandates.
Having developed certain criteria for what a best practice is and does, the Task
Force sought information from companies that went beyond just compliance with the
Equal Employment Opportunity laws that the commission enforced, but those that were
detailed and those that were presented with data to support their effectiveness. They
felt that though all best practices may not be successfully, universally replicable, if

45
tailored to the specific requirement and appropriately implemented, they are reasonably
likely to promote equal employment opportunity.
The task force divided the study of employment practices, policies and
programmes into seven major groupings, namely, recruitment and hiring, promotion
and career advancement; terms and conditions; termination and downsizing, alternative
dispute resolution, management commitment, accountability and other.
Generally, those companies that were most successful in their equal employment
opportunity programs felt that it was economically sound to attract ideas and talent from
all the various sections of the population. They posited that inclusive hiring and
promotion practices bring into the establishment, segments that may be capable of
providing “competitive advantage” in the increasingly globalized economy. The task
force opined that any systematic exclusion of these segments, can deny such resources
to the organization and hence, the opportunity of its future success. The companies felt
that the pursuit of equal employment opportunity and diversity, are as intrinsic as the
business concept of the maximization of profits, or the increase in market shares, which
should be regarded as a whole way of life, vitally important in all the activities of the
organization, rather than just a program(s).
Further, leading companies that were respondents in the study, adopted what the
Task force refers to as “SPLINDID” approach, which is an acronym for addressing a
number of actions that conscientious employers can adopt in addressing diversity and

46
equal employment opportunity issues. These actions are: STUDY, PLAN, LEAD,
ENCOURAGE, NOTICE, DISCUSSION, INCLUSION and DEDICATION. The
foregoing is an explanation of the concepts:
STUDY-- Since one cannot solve problems that one doesn’t know exists, know the law, the standards that define one’s obligations, and the various barriers to Equal Employment Opportunity (EEO) and diversity. Assistance can be obtained from professional consultants, associations or groups, etc. PLAN -- Know one’s own circumstances (workforce and demographics – locally, nationally, and globally). Define one’s problem(s); propose solutions, and develop strategies for achieving them. LEAD -- Senior, middle, and lower management must champion the cause of diversity as a business imperative, and provide leadership for successful attainment of the vision of a diverse workforce at all levels of management. ENCOURAGE -- Companies should encourage the attainment of diversity by all managers, supervisors, and employees and structure their business practices and reward systems, to reinforce those corporate objectives. Link pay and performance not only for technical competencies, but also for how employees interact, support and respect each other. NOTICE -- Take notice of the impact of your practices, after monitoring and assessing company progress. Self-analysis is a key part of this process. Ensure that a corrective strategy does not cause or result in unfairness. DISCUSSION -- Communicate and reinforce the message that diversity is a business asset and a key element of business success in a national and global market. INCLUSION -- Bring everyone into this process, Help them understand that EEO initiatives are good for the company and, thus, good for everyone in the company. Include them in the analysis, planning and implementation processes. DEDICATION -- Stay persistent in your quest. Long term gains from these practices may cost in the short term. Invest in the needed human and capital resources.

47
The Industrial Society recommends a number of policies and procedures for the
promotion of good employee relations. These include:
� Health And Safety Policies
� Equal Employment Policy
� Redundancy Policy
� Retirement Policy
� Extended Leave Policy
� Procedures Include:
- Disciplinary Procedure
- Grievance Procedure
- Notifying Absence Due To Sickness Or Other Cases
- Pregnancy procedures receipt of maternity rights.
2.8 Summary of Employment practices in the Public and
Private Sectors and Trade Unions in Region Four,
Guyana
2.8.1 Public Sector
There is a commission established under the constitution which empowers the President
to select by various means (e.g. after consultations with the leader of the Minority,

48
Professional Associations within the particular entity). This commission has monitoring
role over the subject entity and exercises judicial authority over employees in the area
of hiring and firing, and is an arbiter of disputes that may arise from time to time. The
members of the commission are appointed for specific periods and remain there except
they default.
This is a quasi-judicial sector, a constitutional sector where the structure, the
employment, recruitment, promotional and exiting practices are fixed by statute.
The structure comprises generally six (6) members where the President of the
Republic after consultations with a number of functionaries selects such members.
Among these functionaries are:
The minority leader
The subject ministry
Association representing workers within that Ministry
The Prime Minister in particular cases
2.8.2 Recruitment
This is a selection process done by the President under a prescribed formula expressed
in the Guyana Constitution. There are no promotional opportunities except where a
position becomes vacant. In this case, the person in the next step below in the ladder,

49
moves into an acting position until that position is filled. There is no automatic
supersession.
2.8.3 Exiting:
There is the issue of conflict of interest; a member in this superintendent group cannot
be employed in the organization being superintended. Absence at meetings without
approval or justifiable cause and improper conduct/ conduct unbecoming, are all issues
that lead to the members being relieved of their duties.
2.8.4 Private Sector
2.8.4.1 General Procedures. The purpose is to employ suitable persons, and consistent with management / labour
agreements, to establish control over the employed. Employment policies are
administered by the personnel Division.
2.8.4.1.1 The procedures are: 2.8.4.1.2 Advertisements Internal: Memos are posted up at strategic positions in offices explaining all the
specifics of the job vacancies.
External: Advertisements are placed in the public domain explaining also the specifics
of the job vacancy with relevant closing dates.

50
2.8.4.2 The Selection Process Internal: Personnel Division interviews these candidates and determines movements,
either upward or lateral.
External: Applicants are screened and short listed. Short listed candidates are subjected
to an interviewing panel assembled by / and including the Personnel Division.
Successful candidates are to undergo a process of initiation from the Personnel Division
e.g. rights, responsibilities and benefits; and then inducted into the specific
section/department where the new appointee is placed.
Selection follows a road map, a bureaucratic model which guides employees
regardless of race, colour, religion or social status. It is a meritocracy which lays down
opportunities for transfer, advancement and promotion with little discretion.
The sector guards cautiously these situations where relatives of one or more
families occupy positions within a section or department which has the potential for
creating conflicts at the workplace. Measures are put in place including prompt
reporting, transfers, or otherwise alternative postings in a non-discriminatory manner.
The categorization of workers is a feature of the sector. These categories include
permanent, probationers, temporary, apprentice, casual, part-time, new-hire, re-hire, re-
instatements and are treated within the sector’s employment policies.

51
2.8.4.3 Employment:
The system is transparent. The procedures are written and allows for no deviation.
There are different categories of employment. Generally these factors prevail:
Employment is open to all, once entry requirements age is satisfied; the
advertisement sets out the general conditions
Temporary or seasonal
Contract
Probationer with permanent status
Secondment
The specific conditions include: apprenticeship
Cadetship - internal and external
Testing prior to employment
2.8.4.4 Recruitment:
Recruitment follows a regime of prescribed formula which includes the following:
Advertisement – public
Written application
Entry examination where the specific position requires
Evaluation
Interview
Probationary period
Evaluation
Appointment where successful, or dismissal, or extension of probationary
period, or varying the length of the probationary period for appointment, if the
specific case warrants it

52
Medical examinations in all cases
2.8.4.5 Promotions
Promotions are effected by prescribed formula which involves a process. After the
probationary period of employment, which is prescribed within each organization and
which can vary depending upon how the candidate performance (for there is
discretionary authority vested in management to effect this exception). The
probationary period can be extended depending on the evaluation of the specific case.
Promotion is subject to appraisal by administration. In the case of a position
that has become vacant for whatever reason, it is automatic that the next senior person is
promoted to act in that vacant position. There is a succession policy in place so that
there is no crisis when a position becomes vacant. It is also common that there may not
be skills within the organization to fill certain vacancies. In such cases, provision is
made within the rules for recruitment from external sources
2.8.4.6 Exiting
Exiting is effected in a number of ways which include the following:
Dismissal Compulsory or voluntary retirement Retirement on medical grounds Retirement or otherwise suffer termination of employment if rules are established, or otherwise abolished. Resignation Unfit for appointment, having failed the probationary period

53
2.8.5 Labour Unions
The membership and workers choose representatives and hold biennial delegates’
conferences. At these biennial conferences, plans are made to run the organizations for
the next two years.
Elections are held to select a number of positions as follows: President, Treasurer and
Secretary, which are generally paid, full-time positions, but a number of others are part
time. All positions are elected by delegates.
2.8.5.1 Recruitment
Recruitment takes place in the form of elections at biennial conferences/congresses and
persons are recruited from within the organizations. There may be exceptions to the
rule. Organizations may recruit specialist persons for specific tasks for short periods.
2.8.5.2 Promotional Opportunities
Promotional opportunities are determined by the constitutions of this sector. These are
not bureaucratic organizations that allow for movement from bottom upward. Hence,
promotions are based on default either by death or resignations, etc.

54
2.8.5.3 Exiting
Exiting the system is effected in the following manner:
Death
Resignation
Dismissal due to absence from a number of consecutive meetings without
approval or justifiable reasons
Conduct unbecoming, dishonesty or acts prejudicial to the organization.
2.9 Conceptual Framework
The conceptual framework emerged from the literature review, specifically adopted
from Flippo (1997), in his principles of personnel management. Flippo describes
recruitment as “…the process of searching for prospective employees and stimulating
them to apply for jobs in the organization”, (p.133). Flippo regards this process as an
objective or ‘positive’. He negates the process of hiring by selection, arguing that it
aims to eliminate applicants and leaves only the best for selection into the organization.
Flippo advances a framework for procurement. See Figure 2.3, below:

55
Figure 2.3 Framework for Procurement Recruitment Program Sales forecast Job analysis ↓ ↓ ↓ Applicant Work-load analysis Job description ↓ ↓ Employee requisition Job specification
Screening Devices
→→ Application blanks →→→ The The →→ Reference checks →→→→ Organization Individual →→Interviews→→→→→→→→ →→Interviews→→→→→→→→ →→Tests---------- →→Physical examinations— Induction: Adopted from Flippo 1997 – illustration of Framework
In this framework according to Flippo (1997), three requirements need to be satisfied.
Firstly, authority to hire, similar to what obtains in the public sector in Guyana, Public
Service Commission Rules and also in the Private Sector. This authority to hire,
according to Flippo, comes through the employment requisition that is derived from the
work-load and work force analyses. Secondly, a job specification should be put in
place, developed as a result of the analyses. The final requirement is the job applicants

56
from whom the new entrant can be selected. A well-planned recruitment programme is
needed to attract these applicants.
A series of methods are employed in the hiring procedure, in order to obtain the
pertinent information about the prospective employee. When the information is
gathered, it is compared against the job specification. If the person is suitable to this
point, the process continues. Other processes include the filling of application blanks,
reference checks, interviews and tests. If the candidate successfully completes through
this stage, the final determining process is a physical examination. Success at this stage
means that the candidate should be offered the job. Immediately upon acceptance of the
position, the induction or orientation should commence. This stage is important to
allow for smooth transition into the workplace.
In keeping with this framework, a number of research questions have been
formulated and suitable instruments designed to collect the relevant data relating to
concepts forwarded in Flippo’s framework. These instruments included forms to collect
information on staff employment record, such as date of entry, date of exit and position
held within the organization. A complaints record form was designed to collect data on
employment grievances/complaints from labour unions and other complaints’
organizations. Separate Employer and employee questionnaires were designed to gather
information from the employers and employees on the employment practices of the
organizations and agencies. In line with Flippo’s framework, questions on recruitment,

57
promotion and employees exit were included in the questionnaires. The instruments
also included questions relating to equal employment opportunity in the selected
organizations. The Review of Literature, pages 30-37, above, provides a detailed
description of the varied stages in the procurement process as advocated in Flippo’s
framework.
2.10 Chapter Summary
The foregoing chapter presented a review of the literature relevant to employment
practices. The review provided the background literature for analyzing the major
questions in the study. The conceptual framework which emerged from the literature
has been adopted particularly from Edwin B. Flippo, Principles of Personnel
Management.
3 Research methodology
3.1 Introduction
According to (Taylor & Bogdan, 1998), the purpose, research questions, assumptions
and hypotheses determine the type of methodology or procedure followed in conducting
research. This section outlines the procedures employed to address the problems central
to this study and to solicit the required information to facilitate the relevant descriptions
of employment practices in Guyana. It comprises the following sections: Research

58
design, research setting, sampling procedure, pre-testing and pilot study, ethical
considerations and awareness of cultural norms, validity and reliability, data collection
methods, editing, coding and data analysis.
3.2 Research Design
The research design is the structure of circumstances or conditions under which the
required data is collected, recorded and analyzed, (Giddens, 1995) to fulfil the
objectives of the research.
Triangulation, the use of both qualitative and quantitative methods has been
employed in order to capture quantitative and qualitative data. It was used as an attempt
to produce more empirically reliable data, (Giddens, 1995) than would be available if a
single method was utilized.
Questionnaires were completed by employers and employees in the public and
private sectors and by representatives of trade unions and commissions. Secondary
data in the form of documents were examined. These included employment records,
human resource policies, organization structures, International Labour Organization
(ILO) documents, International Human Rights Articles and Articles of Guyana’s
constitutions, and constitutions from other countries.

59
3.3 Research setting
The study was conducted in Region Four, the most highly populated of the ten regions
of Guyana, the location of the main commercial and administrative services; primarily
in Georgetown, the main port, and its environs.
3.4 Sampling procedure
Sampling, the selection of a representative proportion (Fink, 1995) was carried out in 14
organizations and agencies. These were entities that agreed to participate in the study.
Various organizations representing the public sector, private sector and trade union
were approached based on the categories of sectors in which they operated.
Participating organizations and agencies were however confirmed into their categories
based on the responses of the human resources and personnel practitioners within the
specific organizations. The participating entities included service, production and
representative organizations in the region.

60
A total of one hundred employees participated in the study and ten human resource
personnel practitioners, one representing each organization.
Stratified random sampling was employed to select employees. Sampling in
organizations was conducted based on Gender/sex, ethnicity and date of employment.
Generally, a 10% sample was selected in each organization from among employees
whose date of entry ranged over a 5-year period, specifically August 2001 to August
2006. Some amount of over-sampling was necessary, particularly in small
organizations and among ethnic groups other than the two major groups within the
society. This was done in order to ensure their inclusion. In organizations where there
was only one Amerindian for example, that person was included in the sample. In one
extremely large organization, however, under-sampling was necessary, due to the
paucity of time and other constraints, such as accessibility to employees. A 5%
sampling was carried out in this organization.
Persons in some organizations did not return their questionnaires. This
contributed to the relatively small number of participants in the study.

61
3.5 Pre-test and pilot study
Pre-test:
Two test experts reviewed the research instruments utilized in the study before they
were pre-tested. Two persons from the targeted population reviewed the instruments,
reading them in the researcher’s presence. The researcher made observations about the
respondents’ demeanours, particularly their facial expressions and body language. At
the end, the researcher explored the reasons for the change in demeanour, particularly
their facial expressions and body language. These respondents were questioned about
whether they understood the questions and if they were clear and relevant. Based on
their responses and the suggestions as well as queries made by the test experts, the
research tools were refined and improved.
Pilot Study:
A pilot study was carried out prior to the substantial research in two small
organizations. This was used as a testing ground for the techniques, procedures and
research instruments, to verify, among other things, that they would work satisfactorily
and produce worthy results.

62
3.6 Ethical considerations & awareness of cultural norms
Approval was sought from each employer in writing. Employers spoke with employees.
The researcher sought further verbal consent from employees, where necessary as in
some cases employers collected questionnaires and distributed them to persons whose
names were drawn in the sample. Confidentiality was assured and rights were respected.
The researcher assured employers that no information specific to their organizations
would be divulged. They were told that the results of the study would not reflect
individual organizations by names, but that all analyses would be grouped according to
sectors. Neither employers (management) nor employees (staff) were asked to provide
names. Codes were used to identify organizations. Some employers nevertheless
inserted their names of their organizations or endorsed the questionnaire with a
company stamp. All identifying marks on questionnaires were deleted before they were
passed on to the data entry clerks who entered the information into the database.
Politeness, patience and courteous approaches were used to achieve maximum results.
3.7 Validity & Reliability

63
If the findings of this research are to influence the ERC’s mandate and benefit Guyana
as a whole, the issues of validity and reliability in this research are paramount and must
be regarded as important.
Reliability or uniformity of measurement assumes that the research must be
repeatable. To this end, I have taken care to conform to (Burns, 2000) theory of
providing a detailed methodology, which outlines all the steps that were followed in
conducting this research.
Validity which complements reliability is concerned with, among other things,
the extent to which the objectives are reflected in the measurements (Anderson, 1995)
to achieve truthfulness of responses, accuracy of records and authenticity of artefacts
used to obtain results. In order to establish validity, this study, in line with (Burns,
2000), matches the causes of circumstances surrounding humans. In addition the use of
qualitative and quantitative techniques (triangulation) helped to strengthen internal
validity and to obtain richer data, Marcus and Ducklin (1995) and consequently, richer
findings.
3.8 Data collection
The structure of the Commissions and organizations were examined for their
composition. The Human Resource Policies of the Public Service and Police Service
Commissions and public and private sector organizations and trade unions were

64
examined for their content. Organizations were requested to provide details of their
organization structures with details of gender/sex and ethnicity. The organizations
listed, receiving complaints, such as Ministry of Labour Industrial Division and trade
unions were asked to provide information regarding complaints they received in relation
to employment opportunities and practices over the 5-year period (August 2001 to
August 2006), See Appendix 3, Grievance/Complaints Form.
Employment records over the 5-year period (August 2001-August 2006) were
examined where possible. Some organizations extracted the information required to
forms which were provided to them, (see Appendix 3 for the form “employment
record”). The activities, processes and procedures followed in the recruitment and
termination of workers’ services were examined. Preliminary discussions were held
with human resource representatives in the various organizations. Surveys were
conducted with Human Resources/Personnel practitioners and among a sample of other
categories of staff in the selected organizations.
The information gathered from the Human Resource Policies highlighted the
existing activities, processes and procedures followed with respect to recruitment,
award of employment contracts and termination of services. Employment records
provided information on the number of persons employed/recruited in the various
organizations over the period August 2001-August 2006. Grievance records provided

65
information on total grievances in the research period. The information received via
employment records was used to transfer totals from individual employment records.
Representatives of Human Resource Departments provided information that
assisted in indicating whether or not existing human resource policies were followed in
the employment practices of the organizations. It was intended to illustrate whether or
not persons were employed on the basis of merit and experience or whether preferential
treatment was exercised in employing personnel.
Information received from other categories of staff revealed their personal
experiences within their organizations/institutions in terms of employment practices.
Other documents examined included Historical sources, International Human
Rights Acts and Model laws regarding employment, National Constitutional Acts and
laws. Information from these documents formed part of a Review of Literature and was
used for the purpose of analysis.
3.9 Editing & Coding
All completed questionnaires were edited, by checking for obvious errors, illegible
entries, comprehensibility, consistency and uniformity. All qualitative and combination
responses were grouped and coded.

66
3.10 Data Analysis
Data Analysis was done using the EPI INFO statistical package. Data was entered into
this programme and preliminary analyses were done. Preliminary analyses included the
production of tables and figures from which the results were derived.
3.11 Presentation of the Data
Findings and discussion are presented in Chapter 4, using percentages, tables, and
figures. Percentages were used to describe the findings of the study. Tables depicting
totals and percentages were created to describe the characteristics of the sample
population, socio-demographic characteristics of the respondents and other findings
generally.

67
4 Findings and Discussion
4.1 Introduction
This chapter presents the major findings and relevant discussion of the research on
employment practices in fourteen organizations or entities in the public and private
sectors in Region Four, Guyana. The first section provides a description of the human
resource capacity of the participating entities as follows:
o Current staff by ethnicity and seniority in the participating entities from the
public and private sectors as well as trade unions
o Employee intake by ethnicity over the period August 2001 to August 2006
o Employee exit by ethnicity over the period August 2001 – August 2006
o Reasons for employee exit over the period August 2001 – August 2006
o Common reasons identified for employee exit over the period August 2001 –
August 2006 in the opinion of the human resource personnel practitioners
o Characteristics of the participating human resource personnel practitioners.
The second section presents the employers’ report of existing policies and the
extent to which they are utilized. It also focuses on the activities, processes and
procedures carried out in the procurement and termination of staff in their
organizations.
The third section examines the socio-demographic characteristics of the employees who
participated in the study. The fourth section analyzes the employees’ experiences and

68
views with respect to recruitment and termination processes and procedures in their
organizations.
Section I:
4.2 Description of the Human Resource Capacity of the
Participating Entities
4.2.1 Introduction of Section
This section provides a discussion of the human resource capacity of the participating
entities. It describes the ethnicity and seniority of current staff. It analyses
employees’ intake, exit and reasons for employees exit in the research period, in
addition to providing an analysis of the characteristics of the human resource
practitioners who participated in the study.
4.2.2 Current Staff By Ethnicity And Seniority In The
Participating Entities In The Public And Private Sectors As
Well As The Trade Union
Based on information received from participating organizations, the following levels of
staff by ethnicity and seniority were derived, as shown in tables 4.1 A to 4.1 D. Table
4.1 A shows the current staff by ethnicity and seniority in the Public Sector. Table 4.1

69
B shows similar information for the private sector, while 4.1C gives a similar
description for the trade union. Table 4.1 D provides the totals for all sectors by
ethnicity and seniority.
The participating public sector organizations comprise a total of 238 current
employees. Table 4.1 A shows that among the East Indians in the public sector, 32%
were in senior positions and 17.5% were in ancillary positions. Among the Africans,
47% were in ancillary positions while 14% were in middle level positions.
Amerindians were 33.3% at each level.
Current Staff of Participating Entities by Ethnicity and Seniority
Table 4.1 A
Levels Public Sector
East Indian African Amerindian Mixed Race Other
Nr % Nr % Nr % Nr % Nr % Senior 31 32.0% 24 18% 1 33.3% 1 16.6% 1 50% Middle 22 22.7% 18 14% 1 33.3% 1 16.6% 0 0% First 27 27.8% 27 21% 1 33.3% 1 16.6% 1 50% Ancillary 17 17.5% 61 47% 0 0.0% 3 50.0% 0 0% Totals 97 100% 130 100% 3 100% 6 100% 2 100%

70
level, except among the ancillary staff where there was zero percent. A substantial
proportion of 50% of the mixed race was in the Ancillary group while 16.6% was
represented in each of the other groups. Among the “Other” races, 50% were at the
Senior level while the other 50% were at the First level.
Table 4.1 B Current Staff By Ethnicity And Seniority
Levels Private Sector
East Indian African AmerindianMixed Race Other
Nr % Nr % Nr % Nr % Nr %
Senior 22 7.0% 60 11% 0 0% 8 23% 2 67% Middle 25 7.9% 68 12% 0 0% 12 34% 0 0% First 72 22.8% 133 24% 3 37.5% 8 23% 1 33% Ancillary 197 62.3% 296 53% 5 62.5% 7 20% 0 0% Totals 316 100% 557 100% 8 100% 35 100% 3 100%
Current employees in the participating private sector organizations, total 919.
Table 4.1B above, representing the private sector, shows that among the East Indians,
62% were Ancillary staff, while 7% Senior. Among the Africans, 53% were Ancillary
staff and 11% Senior. The data showed that among the Amerindians in this sector,

71
62.5% of them were Ancillary staff while the other 37.5% were First level. The data
indicated that there was no Amerindian at the Senior or Middle levels of the
participating Private Sector organizations.
Information for the Mixed Group showed 34% at the Middle level and
23% each at the Senior and First levels, while 20% were at the Ancillary level. For the
“Other” group, 67% were at the Senior level and the other 33% at the First level.
Research data shows the current staff in the participating trade union organizations total
81. See Table 4.1C below. The table shows that within the Trade Union Organization,
Africans accounted for 47% of the respondents. East Indians accounted for 43%, Mixed
for 5%, the “Other” group for 4% and the Amerindians, for one percent.
Research data in respect of levels within the Trade Union organizations indicate
that 54% of the East Indians were First-level staff; 17% each at the Senior and Ancillary
levels, while approximately 11% were at the Middle level. Among the Africans, 39%
were at the first level; 32%
at the Senior level, 24% at Middle with 5% at the Ancillary level. For the Amerindian
and Other, all (100%) each, were at the Senior levels. In the Mixed Group, 25% was at
each of the levels.

72
Table 4.1 C Current Staff By Ethnicity And Seniority In The Participating Sectors
Levels Trade Union
East Indian African AmerindianMixed Race Other
Nr % Nr % Nr % Nr % Nr %
Senior 6 17.1% 12 32% 1 100% 1 25% 3 100% Middle 4 11.4% 9 24% 0 0% 1 25% 0 0% First 19 54.3% 15 39% 0 0% 1 25% 0 0% Ancillary 6 17.1% 2 5% 0 0% 1 25% 0 0% Totals 35 100% 38 100% 1 100% 4 100% 3 100%
Table 4.1D below, shows that an overall total of 1,238 persons were employed
in the various sectors, in the period August 2001-August 2006. This total comprises 595
(48%) Ancillary staff, 309 (25%) First level, 161(13.1%) Middle level and 173 (14.1%),
at the Senior level.
Of the individual ethnic groups, it s to be noted that among the East Indians,
49.1% were Ancillary staff while 13.2% were Senior Staff and 11.4% Middle level.
Among the Africans, 50% were Ancillary, 24% First level and 13% were at each of the
other two levels, Senior and Middle. Approximately 17% of the Amerindians were at

73
the Senior level and 42% at the Ancillary level. A total of 33% Amerindians were also
at the First level and 8.3% at the Middle level.
The mixed race totals show that approximately 31% were at the Middle level,
24% were Ancillary, while 22.2% each were First and Senior levels respectively. With
respect to the “Other” group, 71% were Senior, 29% First level and 0% Middle and
Ancillary.
Table 4.1 D
Current Levels Of Staff By Ethnicity & Seniority
Levels All Sectors
East Indian African AmerindianMixed Race Other
TOTALS
Nr % Nr % Nr % Nr % Nr %
Senior 59 13.2% 96 13% 2 17% 10 22.2% 6 71% 173 Middle 51 11.4% 95 13% 1 8% 14 31.1% 0 0% 161 First 118 26.3% 175 24% 4 33% 10 22.2% 2 29% 309 Ancillary 220 49.1% 359 50% 5 42% 11 24.4% 0 0% 595 Totals 448 36% 725 59% 12 1% 45 4% 8 1% 1,238
The research data seems to indicate that Africans predominate the public and
private sectors as well as the Trade Union organizations in Region Four. It appears that
Africans account for the majority of current staff in the participating organizations.

74
This is however not surprising, since it is common knowledge that similar to the
Amerindians, who generally live in the Interior locations, the majority of both of the
major ethnic groups, East Indians and Africans in Guyana live in rural and countryside
areas. However, Africans predominate the urban areas, in particular Region Four.
Further, data emerging from the Guyana Human Development Report of 1996
reveals that East Indians in Guyana comprise a lower proportion of workers in regularly
salaried employment. East Indians were (56%) compared to Africans (67%) in this area
of work. This may be one reason for Africans predominating in the various sectors
studied.
With respect to occupational structure, the ratio of East Indians to Africans is
3.5:1 in Agriculture and 1.5 in Commerce. The situation was however reversed in
the government structure, where the ratio of Africans to East Indians was 2.8:1. The
present findings are therefore congruent with Guyana Human Development data when
the current research indicates that within the public sector in Region Four, the Africans
predominate.
The data shows that the current employees in the public sector comprises
approximately 25% more Africans than East Indians. See table 4.1A. The data also
shows that the Amerindians, Mixed Race and the “Other’ group comprise a very small
proportion of the current staff in the region. They account for 1.3%, 2.5% and .8%
respectively, in the public sector. It appears that the private sector also comprises the

75
majority of Africans, approximately 61% compared to 34% East Indians. There is an
indication however that the Mixed race shares a larger proportion of this sector
compared to that of the public sector, accounting for approximately 4% of the private
sector compared to 2.5% in the public sector. The Amerindian seems to hold a slightly
lower proportion in the private sector (.9%) than in the public (1.3%).
With respect to the overall results in terms of the groups and levels of
seniority, the data suggests (Table 4.1 D) that a higher proportion, (71%) of the Other
Group holds senior levels of occupation than could be found among the other races.
The data also shows that a higher proportion of the “Mixed” race (22.2%), holds senior
level positions in the participating sectors in Region four, when compared to the
proportions of Amerindians, (17%), and even the East Indians (13.2%) and Africans,
(13%).
Although the overall data seems to suggest that the participating sectors
Comprise more Africans than East Indians, the data indicates that the East Indians
comprise a larger proportion (13.2%) senior level staff than there were among the
Africans, (13%), reflecting a two percent difference. The data indicates also that in the
public sector, the East Indians accounted for a larger proportions of Senior, Middle and
First level staff than were accounted for among the Africans. The proportions are 32%,
22.7% and 27.8% respectively for the East Indians compared to 18%, 14% and 21%

76
respectively among the Africans, accounting for a difference of 14%, 8.7% and 6.7% at
the various levels in favour of the East Indian population.
This result seems to establish one of the differences between Guyana and
Trinidad and Tobago with respect to the racial distribution within the public sector,
according to the Centre for Ethnic Studies, UWI (1993) research on employment
practices in the public and private sectors. That study found that East Indians in
Trinidad were heavily under-represented in the higher positions in the public sector in
that country. The present research in Region Four seems to indicate the reverse for
Guyana, since it shows that the East Indians account for higher proportions of the
Senior level positions in the Guyana Public Service. Among the two races however,
Africans dominate in the Ancillary positions.
Further analysis confirms the results for current staff in the research period. In
terms of the ratio with respect to Race/Ethnic groups in the public sector, the data
indicates that the ratio of East Indians to Africans is 1:1.3. The ratio of East Indians to
Amerindians is 1:0.03. To the Mixed race it is 1:0.1 and the East Indian to the “Other”
group is 1:0.05. The ratio of Africans to Amerindians is 1:0.02; African to Mixed is
1:0.07 and Africans to the “Other” is 1:0.05. The data shows that there is a similar
proportionate difference between the East Indians and “Other” and the Africans and
“Other”.

77
With respect to the two major groups, this research suggests that there may be a
reduction of Africans in regular employment and an increase in East Indians over the
period August 2001-August 2006 in Region Four. A comparison of the figures reported
in 1996 and the findings in the present study indicates this. The 1996 Human
Development Report shows that the ratio of Africans to East Indians in regular
employment was 2.8:1. for the public sector, while the present results show a ratio of
1.3:1, indicating 1.5% reduction in respect of Africans and a similar increase among the
East Indians. The result across the sectors shows a ratio of 1.7:1 Africans to East
Indians in regular employment, showing a reduction of 1.1 in the system.
4.2.3 Employee Intake Over The Period August 2001-August 2006
Table 4.2 below, illustrates the employee intake by ethnicity for the period August 2001
to August 2006 in the participating organizations in the public and private sectors in
Region Four. A total of 1,321 persons were recruited to the participating organizations
over the period in question. This accounts for 71% in the private sector, 19 % in the
public sector and 10% in trade union organizations. It is to be noted that 50.3% of those
recruited were East Indians, 47% Africans, .6% Amerindians, 1.7% Mixed Race and
.4% Other.
Among the East Indians recruited, in the period, 73.7% were recruited to the
private sector, 16.5% to the public sector and 9.8% to Trade Union Organisations. The

78
majority (68.6 %) of the Africans were also recruited to the private sector and (all)
100% of the Amerindians were recruited to the private sector. This was also the case for
the other two groups, “Mixed” and “Other”, where approximately 64% and 60%
respectively were recruited to the private sector.
The data in respect of the sectors, shows that in the private sector and the Trade
Union, the majority, (52%) and 56.8% respectively, recruited, were East Indians,
followed by Africans (45.3% and 46.9%) respectively. In the public sector, however,
the majority, (53.5%), were of African descent. Five persons (22.7%) of Mixed origin
and 2 (40%) of the “Other” group were also recruited, but no Amerindian was recruited
in this sector in the research period.

79
Table 4.2 Employee Intake By Ethnicity For Period August 2001 To August 2006
Sectors
East Indian African Amerindian Mixed Race Other
TOTALS
Nr % Nr % Nr % Nr % Nr % Nr %
Public sector 110 16.5% 135 21.7% 0 0% 5 22.7% 2 40% 252 19% Private sector 490 73.7% 426 68.6% 8 100% 14 63.6% 3 60% 941 71% Trade union 65 9.8% 60 9.7% 0 0% 3 13.6% 0 0% 128 10% Total 665 100% 621 100% 8 100% 22 100% 5 100% 1,321 100%
This finding of an East Indian majority intake in Region Four, is seen despite the
indication that Africans comprise the majority of the population in the region and
reportedly, according to the Guyana (HDR, 1996), held most of the regularly paid
government jobs. It would be interesting to learn whether there has been a change in the
population characteristics in Region Four over the period, or whether it is that more
persons are travelling from outside the region to work in Region Four. Alternatively, it
may be a change in the thought processes of the ethnic groups in the society. Further
research needs to be done to examine the reason for this apparent shift.

80
It is to be noted that while the overall data seems to indicate that the level of
employee intake in the private sector in respect of the East Indians tends to surpass that
of the Africans, (73.7% compared to 68.6% respectively), the result shows the reverse
in the public sector. In the public sector, the proportion of employee intake among
Africans in this region still surpasses that of the East Indians. It is interesting to note
also that a larger proportion of “Other” racial group has entered the system, both in the
private sector (60%) and in the public sector (40%) than any other group. However,
there seems to be no person of the “Other” group or Amerindian, recruited to Trade
Union Organizations in the research period.
Further analysis of employee intake for the five year period in terms of ratio
shows the following results: East Indians to Africans is 1:093. For the Amerindians it
showed 1:0.01, to the Mixed Race it was 1:0.03 and to the “Other” race, the ratio was
1:0.01. With respect to the Africans the ratio to the Amerindians was 1:0.01; to the
Mixed Race it was 1:0.04 and to the “Other” race the ratio was 1:0.01. It is notable that
similar to the data on current staff, there is also a similarity of the proportionate
difference between the East Indians and “Other” group as it is for the Africans and
“Other”. They are both 1:0.01 in respect of staff intake in the research period.

81
4.2.4 Employee Exit by Ethnicity over the period August 2001 to August
2006
Information received from the employment records of participating organizations gives
an indication of the employee exit by ethnicity over the period August 2001 to August
2006, in public and private sectors and Trade Union Organizations in Region Four,
Guyana. Table 4.3 below, showing cross-tabulation of sectors by ethnic groups for the
period, provides the details. The data indicates that an overall total of 779 employees
have exited the participating organizations in the research period. This number
comprises 101 (13%) public sector employees, 669 (86%) private sector and 9 (1%)
trade union employees.
Table 4.3
Employee Exit by Ethnicity over the period August 2001- August 2006
Sectors
East Indian African Portuguese Mixed Race Chinese Total
# % # % # % # % # % # %
Public 37 14 64 13 0 0 0 0 0 0 101 13
Private 222 83 418 87 1 100 21 100 7 100 669 86
Trade Union
8 3 1 0.2 0 0 0 0 0 0 9 1.2
Total 267 100% 483 100% 1 100% 21 100% 7 100% 779 100%

82
In terms of ethnic groups, the data shows that a total of 267 (34.3%) were East
Indians; 483 (62%) Africans; 21 (3%) Mixed Group; 7(1%) Chinese and 1 (.1%)
Portuguese. It appears that no Amerindian has left his or her employ within the
participating sectors in Region Four over the five-year period.
Further, the data seems to confirm the predominance of the African group within
Region Four and within the private sector in the region. The data also introduces two
new ethnic groupings that were not directly accounted for with respect to employee
intake. These are the Portuguese and the Chinese. This exit information shows that one
Portuguese employee and 7 Chinese exited organizations in Region Four, over the five-
year period. It may be that these persons were employed before August 2001.
Alternatively they may have been previously listed among the Mixed race and Other
grouping. The intake data showed Amerindians, Mixed and Other being employed over
the period, while the Exit data shows Portuguese, Chinese and Mixed leaving, in
addition to the two major ethnic groups, East Indians and Africans. It should be noted
that the Portuguese and Chinese who have left were private sector employees. This
may be an indication that those persons were either overseas volunteers or consultants
attached to para-statal and private sector organizations within the region.
Further analysis seems to indicate that employee intake in the Region among the
sectors was higher than its exit numbers. Intake was 1,321, compared to an Exit of 779,
accounting for a higher intake than exit by approximately 59%. On the other hand, it

83
gives indication that a substantial proportion (41%) of persons also left their employ
over the period. An interesting finding in this regard is that there seems to be a high
level of staff turn-over in the participating organizations in Region Four. This data
shows that participating sectors have been able to retain only 542 or 41% of the staff
recruited (1,321) in the period August 2001-August 2006. This finding is consistent
with information received directly from human resources practitioners prior to the
survey. The high staff turnover has been provided as one of the reasons sampling in
some organizations had to be redone several times. The researcher selected employees
for the sample based on information that was available in organizations’ employment
records. However, in several instances, when the list of persons to be interviewed or to
complete questionnaires, were presented to practitioners, many names had to be struck
off the list. This was necessary because those persons had already exited the
organization, although there was no indication in the records. This occurred repeatedly
in some organizations. It may be interesting to understand and analyze the reasons for
this seemingly high staff turnover in some organizations. Perhaps a special investigation
that looks not only at the official reasons for exit, which are presented in employment
records, but at the overall circumstances that may have led to the employees’ eventual
exit. An investigation of this nature may be quite interesting and revealing.

84
4.2.5 Reasons For Employee Exit By Ethnicity Over The Period August
2001 - August 2006
Human resource personnel practitioners were asked to state the most common reasons
for employees’ exit from their organizations in the various sectors. Figure 4.1 below,
highlights the results. It appears that within the private sector, the most common
reasons for employees exit were migration, job exchange and disability (33.3%).
In the public sector it appears that the common reasons were “compulsory
retirement and resignation” or “transfer” and “end of employment contract”. These
accounted for equal proportions of 50% among those who responded.
Figure 4.1
Most common Reasons Identified for Employees’ Exit Private Sector
Dismissal as a consequence of disciplinary action, compulsory retirement and retirement or resignation on medical grounds
16.6 %
Retirement or resignation on medical grounds.
16.6 %
Compulsory and voluntary retirement.
16.6 %
Dismissal as a consequence of disciplinary action and compulsory retirement
16.6 %
Other –namely: migration, job change and disability
33.3 %

85
Public Sector
Compulsory retirement and resignation or transfer.
33.3 %
End of employment contract.
33.3 %
Not stated.
33.3 %
Trade Union
voluntary retirement
100%
With respect to the Trade Union organization, it appears that persons generally
retired, voluntarily. In general, it seems that apart from the other reasons advanced for
employees exit, retirement was common in all the participating organizations. At least
56% of the personnel representatives mentioned “retirement” as a reason for staff exit.
Approximately 33% of the respondents stated “Compulsory Retirement”. This
indicates that employees had attained their retirement age before leaving their jobs. On
the other hand, while one respondent did not state the common reason employees left,
one person stated employees had left at the end of his/her contract and 22% stated that
persons had “disciplinary action” brought against them. One can assume that since
persons left due to disciplinary action, it is possible that these organizations have
procedures to deal with matters of discipline.

86
4.2.6 Characteristics of Participating Human Resource Personnel
Practitioners
A total of ten employers/human resource personnel practitioners responded in the study
of employment practices in the public and private sectors in Region Four. Four persons
did not return their completed questionnaires.
The sample statistics indicate that among the employers, three persons (30 %)
represented the public sector, six (60 %) represented the private sector and one
employer among the trade union organizations accounted for 10 % of the total sample
of respondents in this category.
The characteristics of the human resource personnel practitioners in the present study
are described in Figure 4.2, below:
Figure 4.2
Characteristics Of Human Resource Personnel Practitioners
----------------------------------------------------------------------------------------------------------
Public Sector
Coordinator – African – Male
Principal Personnel Officer – African - Female
Principal Personnel Officer – African - Female
Private Sector
Assistant Administration Manager – African - Female

87
Human Resource Manager – African - Male
Director – East Indian – Male
Accounting Officer – East Indian – Female
Human Resource Officer – African – Female
Human Resource Officer – African – Male
Trade Union
General Secretary – East Indian – Male
----------------------------------------------------------------------------------------------------------
Heads of participating organizations have identified the human resource and
personnel representatives in this study. The characteristics of these representatives
seem to confirm the general population pattern of Region Four and the 1996 Human
Development Report, indicating a strong African presence in regulatory jobs, discussed
earlier.
The data also seems to indicate a high proportion of females in the public sector.
This result seems to coincide with the finding of the study of the Inter-American
Development Bank, which was conducted among Latin America and Caribbean
countries. The research focused on public policy management and transparency in the
civil service. The results showed that in Guyana, like some of the other Caribbean
countries, women accounted for the highest proportion (61%) of public service
employees. In the present study, the research data shows that women accounts for a

88
higher proportion (67%) in the public sector, while the Ministry of Labour in 1992
estimated that women in the public sector accounted for 60% of the workforce.
Within the private sector, at this human resource practitioners’ personnel level,
while the data indicates equal (50%) proportions of males and females, Africans
predominate with 67% when compared to 33% East Indians. The general data, (Table
4.1D, above) indicates a similar pattern. It shows that Africans predominate and
account for higher proportions in the Middle and First level positions across the sectors.
The lone senior level respondent for the Trade Union Organisation was East Indian
male, representing 100% in that sector.
4.2.7 Summary of Section
The foregoing section provided a description of the human resource capacity of the
participating sectors in Region Four. It analysed current staff levels by ethnicity,
employee intake and exit and reasons for exit in addition to the characteristics of the
human resource personnel practitioners who participated in the research.

89
Section II
4.3 Employers’ report of existing policies and the extent to
which they are utilized; activities, processes and
procedures carried out in the procurement and
termination of staff in organizations
4.3.1 Introduction of Section
This section provides the results and discussion of the employers’ report of existing
policies and the extent of their use. It reviews the existence of procedures for addressing
various reports and employees’ complaints of various types of discrimination and denial
due to social characteristics. It also provides discussion on levels of levels of
complaints from public ad private sector organizations, in the research period which the
Ministry of Labour Industrial Department addressed.
Further, the section also analysed employers’ views about hiring different racial
groups, recruitment practices, processes and procedures within the sectors.

90
4.3.2 Existing Employment Policies and the Extent to which they are
utilized
4.3.2.1 Existence of Policies Addressing Recruitment
Table A 4.1 Appendix A shows the employers’ responses to the question of whether
organizations comprised policies to address recruitment. The table shows that an
overall majority, (80%) of the respondents answered in the affirmative. These
comprised a larger proportion (83%) of employers in the private sector whose
organizations had such policies, when compared to their counterparts in the public
sector (67%). The representative of the Trade Union also answered in the affirmative.
4.3.2.2 Existence of Policies to Address Equal Employment Opportunity
With respect to existence of policies to address equal employment opportunities, the
data Table A 4.2 Appendix A illustrates the responses. The table shows that, in addition
to the trade union representative stating that his organization had policies to address
equal employment opportunity, at least half (50%) of respondents in the private sector
also stated likewise. Only 33% in the public sector however, stated that such policies
existed within their organizations.

91
4.3.2.3 Existence of Policies to Address Non-Discrimination
Table A 4.3, Appendix A, shows the employers responses regarding the existence of
policies to address non-discrimination. The data indicates that the majority (67%) of the
respondents in the public sector and half (50%) of those in the private sector stated that
their organizations had policies to address non-discrimination. The representative of the
trade union organization also stated that his organization had policies addressing non
discrimination. These responses accounted for an overall of 60% whose organizations
had these policies.
4.3.2.4 Existence of Policies Addressing Promotion
For promotion policies, a total of 90% overall, answered in the affirmative of having
policies to address promotions. See Table A 4.4 Appendix A. The Table indicated that
all (100%) of the public Sector organizations and Trade Union stated “YES” while 83%
Private Sector organizations also stated that their organizations had policies to address
staff promotion.
4.3.2.5 Existence of Transfer Policies
Respondents were asked to state whether their organizations comprised transfer
policies. See Table A 4.5, Appendix A. The data illustrates that 70% of the respondents
stated “YES” while the other 30% stated “NO”. Those who responded in the

92
affirmative accounted for 100% Trade Union and 67% each in Public and Private Sector
organizations.
4.3.2.6 Existence of Policies to Carry Out Appraisal
Human Resources Personnel Practitioners responded to the existence of appraisals
policies within their organizations Table A 4.6, Appendix A provides the results. The
majority (80%) of the respondents stated that staff appraisal policies existed. These
accounted for 83% in the Private Sector; 67% in the Public Sector and 100% Trade
Union.
4.3.2.7 Existence of Policies to Address Termination
Human Resources Personnel Practitioners were also asked to state whether their
organizations had policies for addressing termination of staff. Table A 4.7, Appendix A
gives the results. The table shows that an overall total of 70% of the respondents stated
“YES”; 30% stated “NO”. In the Public and Private Sectors, 67% in each case stated
that their organizations did have termination policies.
The research data seems to suggest that generally, the organizations in the public
and private sectors in Region Four (33%-83%) and the Trade Union organization
(100%), consisted of policies which address equal employment opportunities, non-

93
discrimination, recruitment, promotion, transfer, appraisals and termination of
employees.
In respect of the individual sectors, the policy which seems to be least in place
among the public sector organizations (67%) is the “Equal Employment Opportunity”
Policy. In the private sector it appears that a substantial proportion of the organizations
are without policies addressing both “equal employment opportunity” and “non-
discrimination” (50%) in each case. The majority of trade union organizations in
Region Four may have these policies. The data indicates that they have all (100%) of
the policies discussed. It appears that a higher proportion, (67%) of public sector
organizations have policies to address non-discrimination than organizations in the
private sector (50%).
4.4 The Extent To Which Policies Are Followed As A Guide
To Organisation’s Recruitment And Promotional
Decisions
Respondents who stated their organizations had policies that addressed certain practices
including “equal employment opportunity”; “appraisals” and “transfer” among others
were asked to state the extent to which their organisations followed these policies in
guiding their recruitment, transfer, promotional and other practices. Table A 4.8,

94
Appendix A illustrates the responses. The data shows that a cross section (40%) stated
“Very Often” and 20% each for “Often” and “seldom”. A total of 10% did not state,
while the question was “not applicable” to the other 10% of respondents.
It appears that these policies were not used “Very often” in the majority of
organizations, thought they were utilized “very often” in a substantial proportion (40%)
of them. It seams nevertheless, that the majority (60%) of them also use these policies
“Often”. There were also those organizations (20%) which “Seldom” utilised these
policies to guide their practices.
While it may be true that in cases where the data shows “Not Stated” it may
mean a simple omission in the completion of questionnaires. Such non-responses may
have other reasons. It could be an indication that some respondents elected not to state
the extent to which their organizations utilized these policies because of some specific
reason or complex situation. It may be due to the level of uncertainty about the practices
of the organization, or, because of some felt need to withhold certain information which
may be regarded as sensitive or confidential in some person’s opinions. Whatever the
reason, it may be possible to verify in a future study of a longer duration, in which
greater in-depth face to face individual and focus group discussions could be held.
Hopefully, also, organizations having heard of, and/ or participated in this particular
study, would develop a better appreciation of the need for their involvement in studies

95
of this nature and be more receptive and cooperative, if required to participate in a
similar research.
The apparent result of the existence of some amount of non-discrimination
policies in public and private sector organizations in Region Four is consistent with
Article 23 of the Universal Declaration of Human Rights, (UDHR) which promulgates
non-discriminatory rights in employment and conditions of work for all.
The ten principles of human rights to which the General Assembly agreed in
1963 condemns all forms of discrimination, be they race, sex, religion or language. It
addresses discrimination in employment among other rights, and fosters the revision of
public policies, laws, regulations, etc, which are likely to perpetuate racial
discrimination or segregation. It is expected that, all leaders who are members of the
United Nations, would take all necessary action to abolish and to recommend measures
to eliminate discrimination, in all its forms, (UNESCO, UNHCHR, 2001), Review of
Literature.
In furtherance of non-discrimination in employment, some organizations and
countries adopted employment equity policies, policies promoting full equity and
fairness in employment. In so doing organizations undertake to use merit and potential
as the basis for recruiting and promoting employees.
Guyana has also enacted fundamental rights and freedoms in its Constitution in
articles 138 to 153 of the Constitution. The right to non-discrimination is clearly

96
illuminated in Article 149. The notion of non-discrimination provides for equality in
employment, a crucial and fundamental right of all human beings. The Equal Rights Act
of 1990, No. 19, also strengthens the equal employment opportunity situation. See
Review of Literature above on, “National Constitutional Acts and laws regarding
employment practices”. Further, the “Prevention of Discrimination” Act, No. 26 of
1997, prohibits discrimination in employment in both the public and private sectors on
grounds of race, sex, colour, religion, ethnic origin, social origin, indigenous
population, national extraction, disability, marital status, family responsibilities, age and
pregnancy. It is important in this regard that all sectors of the economy uphold these
acts and laws in their employment practices of recruitment, selection and promotional
practices within their organizations.
4.5 Complaints Of Denial Of Favourable Career Move Due To
Age, Race, Religion, Marital Status And Disability.
Human Resource/Personnel practitioners were asked to state whether they had received
complaints from employees within their organisations about experiences of denial of a
favourable career due to social characteristics of age, race, religion, marital status or
disability. Table A 4.9, Appendix A shows the responses by sector.
It appears that employers in the public and private sectors and trade union
organizations in Region Four have never received complaints from their employees of

97
being discriminated against on grounds of pay, marital/parental status, age, bullying,
sex/Gender, disability, religion, race/ethnicity, sexual orientation or national origin. In
response to a question of whether they had received such complaints, representatives of
all (100%) the participating organizations stated “None”. The return rate of employer
questionnaire was just over 71%. Perhaps if the rate of return of questionnaires had
acquired its maximum (100%), the data might have yielded different results.
4.6 Assigning positions based on characteristics of
age, religion, sex or ethnicity
Respondents were asked to state whether they assigned positions to persons of a certain
age, religion, sex or ethnicity. They were asked if they did, to state the level of
regularity with which this was done. See Table A 4.19 Appendix A, which highlights
the results.
One respondent, representing 10% of the total number of human resource
personnel practitioners stated that age was used “always”. This person represented the
Public Sector. One practitioner also stated that sex was used “sometimes” or” at times”
also within the Public Sector. All the respondents in each of the sectors stated “Never”
for religion.
The data therefore suggests that there is no indication that employers in the
participating entities in Region Four generally assigned positions to persons of certain
98
age groups, of certain religious persuasions, sex or ethnic backgrounds. The data shows
that only 20% of the respondents had ever used social characteristics to assign positions
to persons; and in both instances they were public sector employees. With respect to
age, it is one of the regulations of the Guyana Public Service not to employ persons
below 15 years old, which is the minimum working age in Guyana. It may be based on
this fact that the human resource personnel practitioners had made the statement that
age was utilised to assign positions to persons. With respect to sex/gender also being
used as criteria to assign positions, it may be necessary to undertake further research to
determine the facts surrounding this position.
This finding that social characteristics is generally not a requirement for
employment is in keeping with inter-racial and colour discrimination Acts. The results
of an enquiry in Trinidad and Tobago in the private sector, showed that all (100%) of
the respondents in that study indicated that neither race nor class was considered a
factor for employment, UWI, 1993, in review of literature, above.
4.7 Existence of procedures for addressing various reports
Human Resource Personnel representatives were required to state whether there existed
within their organisations, procedures for addressing reports of discrimination,
disciplinary matters, grievances, absence due to sickness or other reasons, pregnancy

99
and exIt notices. Data in Table A 4.10, Appendix A illustrates the responses received
from the Private Sector.
The data shows that the majority of the participating organisations within this
sector (83%) in each instance, except for the areas of discrimination and disciplinary
matters, seemed to have procedures to address the various reports. However, it appears
that procedures to address discrimination, in particular, is lacking while procedures for
handling disciplinary matters, seemed less lacking, as the majority of organisations
(67%) in the private sector seems to comprise these procedures. For discrimination
however, only 17% of organizations seem to have such procedures. This result seems to
suggest that a large proportion of private sector organisations within Region Four
operate without procedures to address reports of discrimination. Only approximately
one third of the organisations in this sector seem to have procedures for addressing
disciplinary matters and 17% each are without procedures for handling grievances,
pregnancy benefits and exit notices as well as absence due to sickness or other reasons.
Table A 4.10 (i), Appendix A shows the responses of the human resources
practitioners in the Public Sector in relation to the existence of procedures for
addressing reports of discrimination, disciplinary matters, grievances, absence due to
sickness or other reasons, pregnancy benefits and exit notices.
Those responses indicate that (67%) have procedures for addressing disciplinary
matters and absence due to sickness or other reasons. Thirty three percent indicated that

100
their organizations had procedures for addressing grievances, pregnancy benefits and
exit notices while 0% stated “YES” for discrimination, indicating that there is no
organization within the public sector in Region Four that has procedures for addressing
reports of discrimination.
Table A 4.10 (i), also shows that 0% stated “NO” for disciplinary matters and
absence due to sickness or other reasons indicating that they all had procedures to
address disciplinary matters and absence due to sickness or other reasons. However,
some practitioners did not state whether or not their organizations had procedures in
place to address these reports. Thirty percent of the respondents in each case did not
state. Table A 4.10 (ii), Appendix A which provides similar data in respect of the Trade
Union, shows 100% stating “YES” for each type of report. This indicates a high level
of existence of these procedures in trade union organizations.
The data suggests that generally the organizations in the public and private
sectors and Trade Union in Region Four have some procedures or directives for dealing
with reports of discipline, grievances, absence due to sickness or other causes,
pregnancy – to ensure benefits are received and Exit notices, However, many of the
participating organizations lack adequate procedures to address discrimination. The
research data seems to indicate that there is a higher proportion of organizations in the
private sector than in the public sector in which these procedures exist.

101
Trade Union Organizations on the other hand, seem to be the pace-setters with
respect to existence of procedures for addressing these various reports under discussion.
The data indicates 100% compliance in these areas. This particular result seems to
suggest that the organizations and agencies in this particular Region are moving in the
right direction.
It appears that they have in place some of the relevant policies and procedures,
which, according to the Industrial Society are desirable within organizations, for the
promotion of good employee relations. The major policies and procedures that this
society promotes include disciplinary, grievance procedures, leave policies, exit
policies. However, equal opportunity policy, which along with non-decimation policies
are also very important and seems to be somewhat lacking in the sectors in Region
Four. For example, the results of this study suggests that only 17% of the private sector
organizations in Region Four have policies to address non-discrimination while there
seems to be no public sector organization in Region Four with such a policy.
The representative of one organization stated that policies existed in that
particular organization which he/she represented, but that these policies were un-
written. However, the Industrial Society recommends that policies should not only be
written, but also be communicated to all employees.

102
4.8 Employers position of the notion that some employers have
a tendency of hiring people of their own race before
considering other races
Employers were required to state their position on the notion that some employers have
a tendency of hiring people from their own race first. It appears that employers have
differing views on this. Research data shows that ½ (50%) of the respondents “strongly
disagreed with that notion. Approximately 10% of them were undecided, but 20%
agreed while another 20% disagreed. Table A 4. 11 Appendix A, shows the details.
Trade union organizations seemed to have disagreed completely, (100%) that
employers have a tendency of first hiring people of their own race before considering
others. The majority (67%) of the organizations in the public sector seem to disagree
strongly, even though a substantial proportion of them (33%) seem to be in agreement
with the view. None of them seemed to be undecided about the matter. Unlike the other
sectors, within the private sector, there seem to be different levels of disagreement on
the matter, as there were equal proportions (33%) each among those who stated
“Disagree” and “Strongly disagree”. In that sector also, there were some who agreed
(17%) and also some who were “Undecided” on the notion. It would be interesting
however, to discover whether there is a relationship between organizations whose
representatives have admitted to their organizations being without policies to deal with
discrimination and those who later admitted or agreed that some employers had a

103
tendency of giving preference to their own race before considering employing other
races or vice versa.
4.9 Employers position on the notion that employers should
attempt to employ all racial groups
Employers/human resource personnel practitioners were asked to state their position on
the notion that employers should attempt to employ all racial groups. As seen in Table
A 4.12, Appendix A an overall majority (60%) of respondents stated “strongly agree”,
20% of them were “undecided”, while for the “Other” group, it was 20%, of whom 10%
“agreed” while the other 10% disagreed.
There seem to be therefore a general consensus across the sectors among employers
that they should attempt to hire all racial groups provided they are suitably qualified.
The data indicates that the majority of the employers were of that view. Sixty percent of
them stated that they strongly agreed.
It is interesting to learn though, that some human resource personnel
practitioners in the public sector may be of the view that employers should not attempt
to employ all racial groups, if suitably qualified. Approximately one-third of the
respondents in the public sector had this view. They stated that they did not agree. On
the other hand, the private sector seems to display some amount of indecision on the
matter. As much as 33% of the practitioners in the private sector stated they were

104
undecided. It may be that these respondents had some reservations about employing all
racial groups even if they were suitable qualified. However, further investigation would
be required to determine the reason those public sector employers were of that view.
4.10 Use of special criteria for placing applicants
Employers were asked whether they used special criteria for placing applicants. A
substantial proportion (50%) of them stated that they did. Forty percent stated that they
did not, comprising the majority (67%) of those in the Private Sector and the Trade
Union representative (100%). Table A 4. 13, Appendix A illustrates. It appears that no
public sector organization used special criteria for placing applicants. The majority of
the respondents in that sector stated that they did not use special criteria. However,
33% did not respond.
The data seems to suggest therefore that an overall substantial proportion of
human resources practitioners in the participating sectors in Region Four used special
criteria for employing persons. As much as half of the entire sample of employers who
participated in this research attested to this. However, while it seemed that there was a
high level of certainty that this is done in the trade union organizations, (100%) and
among the majority (67%) of private sector organizations, the data seems to indicate
that the majority of organizations in the public sector does not use special criteria for
placing applicants. Nevertheless, a substantial proportion (33%) of them did not state.

105
As indicated earlier, the fact that persons who have been elected to represent an
organization on this level withhold a view may signify a need for more in-dept
examination of the issue in respect of that organisation.
4.11 Social Characteristics such as marital status, gender,
ethnicity, religion, age, as a requirement for employment
Human Resource Personnel practitioners responded to the question of whether certain
social characteristics were used as a requirement for employing persons in their
organizations. Tables A 4.14 to Table A 4.18, Appendix A highlight the responses.
It appears that using social characteristics as a requirement for employment was
not practiced widely in public sector organizations. Neither marital status, ethnicity, nor
religion was identified as characteristics used for employment. No human resource
practitioner responded affirmatively. However, Gender/Sex and Age seemed to be used
in the Public sector as requirements for employment. Thirty three percent of the public
sector representatives stated that gender was a requirement, while the majority (67%)
stated that Age was a requirement. for employment.
Similarly, it appears that within the private sector, neither marital status,
ethnicity nor religion was used as a requirement for employment; but gender and age
were used as requirements. In trade union organizations, however none of these
characteristics was used. The overall results indicate that the majority of the

106
respondents in the participating sectors do not use social characteristics such as age,
sex, gender, etc as requirement for employment. Only 20% of the respondents use
Sex/Gender, the other 80% do not. With respect to age, though the majority (60%) of
the organizations do not use it, a substantial proportion (40%) used it as a requirement
for employment.
4.12 Complaints from public and private sector organizations
for the period August 2001 to August 2006 – Ministry of
Labour
The Industrial department of the Ministry of Labour has received and dealt with a wide
range of complaints which emanated from public and private sector organizations over
the period August 2001-August 2006. Table A 4. 20, Appendix A gives the details. The
complaints were as follows:
- Dismissal or Termination - Wages and Salaries - Holiday with Pay - Overtime - Severance Pay - Others – including
o failure of notice o illegal deduction o discrimination o refunds o conditions of employment and
107
o suspension
The most common type of complaint appears to be “Dismissal or Termination”.
A total of 1,812 (34%) complaints were made of wrongful dismissal or termination of
staff; followed by a range of pay-related matters, such as Wages and Salaries, 1,508
(28.6%). The table indicates that the majority of complaints, 1,615 (31%), were made
in the period 2004-2005 and the least 718 (14%) between 2003 and 2004.
Minimal information was received regarding employee complaints from trade
union organizations. The information received was based on the years 2002-2006. The
complaints comprised matters of dismissal, pay dispute, violation of workers
agreement, injury/sickness and removal. Of these matters, dismissal (31.3%) was only
second to pay dispute, which was 43.8% for the period. Injury/sickness comprised 13%
of the complaints while violation of workers agreement and removal accounted for
6.3% in each instance.
4.13 Recruitment Practices - reports from Management/Human
Resource Personnel Practitioners Perspective
4.13.1 The recruitment process:
The representatives of the human resource management and personnel departments
were asked to state the first five steps they would follow to recruit new staff. The
responses according to sectors were as follows:

108
Public Sector - Two of the three respondents in the public sector responded to this
question.
Step 1:
All (100%) who responded in this sector stated that they write the respective section or
officer to seek permission to fill the vacancy.
Step 2:
Fifty percent of the representatives stated that they advertise internally/send out internal
circulars. The other 50% stated that they advertise publicly/externally.
Step 3:
While 50% of the employers stated they shortlist for interviews at this stage, the other
50% stated they send the applications received to the respective section or Officer.
Step 4:
Half (50%) of those who responded stated that they conduct interviews at this stage.
The other 50% issue internal circulars.
Step 5:
While 50% of the practitioners stated that they select the most suitable candidate at this
stage. The other 50% stated that they wait for the respective sector/Officer to send the
suitable candidate.
Private Sector
Step 1
The majority (67%) of the employers in private sector organizations stated that in this
step, (step 1) they advertise internally or promote internally in keeping with the agreed

109
succession plan of the organizations. A total of 16.6% of them stated that they inform
the respective Officer, seeking permission to fill the vacancy. The other 16.6% stated
that they conduct job analysis.
Step 2:
Thirty three percent of the respondents stated that in this step, they would “transfer”
someone to fill the vacancy. Another 33% stated that they “peruse previous
applications”, while 17% stated that they advertise externally, and the other 17% stated
that they advertise internally.
Step 3:
Approximately 17% of those in the private sector provided only two steps. However, of
those who responded, a total of 60% “advertise externally” at this stage, while 20%
stated that they check with training institutions and the other 20% “advertise internally”.
Step 4:
Sixty seven percent of the respondents in the private sector stated that at this point
“external advertisement” is done. The other 33% stated that “Interviews” are
conducted.
Step 5:
Fifty percent of the respondents stated that in this step they recruit, while the other 50%
stated that they do “single source selection.
Trade Union
No response was provided from the Trade Union for this question.

110
It appears that the recruitment process varies from organization to organization
and from sector to sector. The responses of the representatives of the human resource
management and personnel gave this indication.
It appears that the procedure of seeking permission or authority to hire is widely
used in the public sector, since generally, all public sector organizations are governed
by common rules and regulations. The Public Service Commission rules stipulate that
the Secretary of the Commission is informed in writing of any vacancies to be filled,
(Public Service Commission Rules (1988:26) – Rule 23(1) in review of literature. This
activity also confirms to Flippo (1997) framework – which describes the “authority to
hire” as the first step of three requirements to be satisfied in the procurement process.
Conducting job analysis which is another procedure identified in the first step of
the procurement process seems to be much less widely utilized, as only approximately
17 % of the respondents in the private sector seemed to use this. This analysis,
according to Flippo (1997), is the activity through which the employment recognition
and authority to hire is derived. It appears that the private sector most often utilized
perusal or perusal of previous applications and transfers. Although respondents in the
public sector in Region Four have not mentioned transfers as a second step in the
procurement process, the Public Service Commission Rule No. 24 indicates the use of
this method as a second step after informing and seeking consent of the Secretary of the
Commission to fill the vacancy. It should be noted however, that in the previous rule,

111
No. 23, mention was made of the Secretary from time to time, advertising positions in
various forms of media.
Flippo (1997), in the conceptual framework, discussed the need for three
requirements to be satisfied. Firstly, “the authority to hire”. Secondly, the development
of a job specification and finally, “attracting the job applicants”, from among whom the
new employee would be selected. In order to attract these applicants, Flippo proposes a
well-planned recruitment program, which should of course involve advertising and
short listing for interview. Respondents in both the public and private sectors identified
advertising in the third step of the recruitment process.
4.13.2 Frequently Utilized Recruitment Methods Grouped
By Choice Of Respondents
Employers were required to identify from a list, by ranking in order of frequency, the
recruitment methods that their organizations utilized.
Figure 4.3, below shows the most frequently utilized combinations of methods
identified according to sectors. Te data indicates tat three combinations of 33% each
are utilized in the public sector. In the Private Sector, five combinations are used. A
combination of internal advertisement, walk-in, word-of-mouth and referrals (33.3%)
comprise the most frequently utilized combination in the private sector. The other four

112
combinations account for 16.6% for each combination. The Trade Union seem to
utilize “Internal Advertisement”, only.
Public Sector
Figure 4.3
Frequently Utilized Recruitment Methods
Internal Advertisement, Walk-ins, Recommendation Media Advertisement, Interviews, Internal Advertisement Media Advertisement, Resumes, Recommendations
33.3% 33.3% 33.3%
Private Sector
Media Advertisement, Resumes
Media Advertisement, Internal Advertisement,
Resumes
Internal Advertisement, Media Ad, Resumes
Internal Advertisement, Walk-ins, Word of
16.6% 16.6% 16.6%

113
Trade Union
Internal Advertisement
100%
4.13.3 Frequency of Use of Individual Recruitment Methods
Figure 4.4
Frequency Used Individual Recruitment Methods
mouth, Referrals
Resumes, Media Advertisement,
Recommendations
33.3%
16.6%
Most frequently Frequently Not so frequently
Internal Advertisement 5 - 50% Media Advertisement 4 - 40% Resume 1 - 10%
Walk-ins 3 - 33.3% Interviews 1 - 11.1% Interviews 2-22% Media Advertisement2-22.2%
Recommendation 3 - 33.3% Internal Advertisement 1 - 11.1% Resumes 3-33.3% Word of Mouth Referrals 2 – 22.2%

114
It appears that advertisement was used most frequently than any of the other
recruitment methods within the public and private sectors in Region Four. See Figure
4.3 and 4.4, above.. However, some forms of advertisement were used more often than
others. For example, the data seems to suggest that a substantial proportion (at least
50%) of the public and private sector organizations utilize internal advertisement “most
frequently” in their recruitment process.
The other method that was used with similar level of frequency seems to be
“Media Advertisement”. This method has been identified in 40% of the participating
organizations. The other ten percent of organizations reportedly used “resumes”.
This result seems to substantiate the position advanced in the previous section,
“first five steps”, which indicated that advertisement was a widely utilized method of
recruitment, particularly in the Private sector. Approximately 75% of the organisations
utilised this method. Advertisement was reportedly used as a first step in the
recruitment process. For Flippo (1997), there are two main sources of recruiting
employees.
These sources are internal and external and the majority of organizations utilize
formal advertisements in order to comply with Equal Employment Opportunity laws,
which stipulate that vacancies must be publicized. Thomas (1985) posits that
advertising is one of the least expensive methods of attracting a large diverse group of

115
prospective employers. It should be noted however, that both internal and external
recruitment have their advantages and disadvantages.
Advantages of internal recruiting include, known ability, motivation to current
employees, reduced training and less expensive recruitment costs. Disadvantages
include failure to attract adequate supply of qualified individuals above the entry level.
It has the capacity to create other vacancies, resulting in the creation of a ripple effect
that can decrease the flexibility of the organization.
Advantages of external recruitment on the other hand, include inculcating new
viewpoints and ideas and achieving goals of affirmative action. A disadvantage of
external recruitment is the cost, since the external market is larger and not as easily
reached as the internal applicants among other things, expanded in literature review,
above.
4.13.4 Encouragement of Speculative Job Enquiries
Human resource personnel practitioners in the various sectors were asked to state
whether their organizations encouraged speculative job enquiries. Table A 4.22,
Appendix A shows the responses. The table shows that 50% “sometimes” encouraged
speculative job enquiries; 10% did so “always”. This represents 17% of Private Sector
organizations.

116
It appears that a substantial proportion of the organizations in the public and
private sectors in Region Four, at some time or other encouraged speculative job
enquiries. The research data seems to indicate that at least half, (50%) of the
organizations in general, encouraged such enquiries. However, a substantial proportion
(40%) never encouraged speculative enquiries, although a small proportion (10%)
seems to always encourage such enquiries.
The fact that some organizations encouraged speculative enquiries, may be the
reason for some amount of the hiring done through “Walk-ins”, “resumes” and “word of
mouth referrals” discussed above. However, due to the nature of some
businesses/companies where lots of ancillary staff is required, speculative enquiries
may be a welcome addition in the recruitment process.
It would be interesting to learn whether the categories of positions filled
utilizing certain methods are consistent with methods utilized in other countries. For
instance, the Bureau of National Affairs in Fisher (1999), as seen in the Review of
Literature, discussed a number of methods generally utilized when recruiting for
specific types of jobs in the USA. That source shows that “employee referral” (94%),
walk-ins 92% and newspaper advertisements (88%) were mainly used to hire Plant
Service workers, followed by clerical/office personnel to a lesser extent. However,
newspaper advertisements (82%) more than “referrals” (65%) and “walk-ins” (40%)
were also used to hire Management staff.

117
The Cooperative Bank of the United Kingdom, as part of its recruitment policy,
which includes a commitment to the provision of equality of opportunity, discourages
speculative enquiries. In its policy, the Bank attempts to ensure that all applicants are
treated consistently and fairly. In so doing, it utilizes advertisements, using publications
that are relevant to the level and nature of the job; UK Cooperative Bank1 .
4.13.5 Organization’s Use of Interview Assessment Forms
Human resource personnel representatives were asked to state whether or not they
utilised Interview Assessment Forms. Table A 4.23, Appendix A gives a breakdown of
the responses.
The data seems to suggest that Interview Assessment forms are widely utilized
in organizations in the participating sectors in Region Four. An overall majority of
(80%) of the management representatives in this study attested to this. This proportion
accounts for the majority in each of the sectors. It appears that a greater proportion
(83%) of organizations within the private sector uses these forms in their recruitment
process, than organizations in the public sector (67%). The assessment form, according
to the Industrial Society, London, obliges the interviewers to record on the spot
impressions in a standard format which enables a comparison to be made between
1 Internet

118
applicants. These forms should be kept for at least a six month period in case an
applicant was to make a claim of discrimination on the grounds of race or sex.2
4.13.6 Shortlisting of Applicants in the Recruitment Process
It appears that shortlisting of applicants is a common feature in the recruitment process
among organizations in region four. Table A 4.24, Appendix A describes the employers
responses of whether or not they shortlist applicants in the recruitment process. Ninety
percent of the respondents stated “YES” 10% stated “NO” Trade Union responded
“NO” (100%).
It appears that the majority of organizations in both the private and public
sectors do shortlisting in the recruitment process. It was found that both sectors equally
(100%) shortlist applicants. It appears however, that trade union organizations in
Region Four do not shortlist applicants.
According to the Industrial Society, shortlisting is an essential component of the
recruitment process, since it is not practicable to interview all prospective recruits. The
person specification and job description should be used along with the job application to
determine the strong contenders and those who are not eligible for consideration. It is
advisable in this process to clearly outline the criterion for shortlisting, in order to avoid
any basis for claims of discrimination at this stage.
2 Industrial Society 1989.

119
It appears that the major shortlisting procedure utilized in the sectors was panel
interviews (50%). It seems that quite a few organizations also used application forms
(20%). Apparently, more organizations within the private sector (67%) utilized panel
interviews than those in the public sector, (33%). According to Flippo (1997),
preliminary interviews become necessary, particularly in a non-selective recruitment
program. The objective of these interviews is to eliminate candidates who are obviously
unqualified for the vacant post.
4.13.7 Issuing of Job Description in the Recruitment Process
On whether organizations issue job descriptions, an overall 70% of respondents
answered in the affirmative. Sixty seven percent each in the Public and Private Sectors
and 100% representing the Trade Union – all stated “YES”. See table A 4:25, Appendix
A for further details of these results.
The research data indicates that the majority of organizations within the
participating sectors issue job descriptions to applicants. Equal majorities (67%) each
in the public and private sectors utilize this tool, while it appears that it is most widely
used (100%) in trade union organizations.

120
4.13.8 Stage At Which The Job Description Is Issued
Following responses of whether job descriptions were utilized, human resources
practitioners were required to state the stage at which job descriptions are issued. Table
A4.26, Appendix A, shows the responses. The public sector seem to be the sector in
which most of the organizations (67%) issue job descriptions before candidates are
interviewed. Only 17% of the organizations within the private sector issue job
descriptions before interviews take place. Approximately 33% of the organizations
within the private sector issue job descriptions at the selection or appointment stage.
This stage seems to be utilized fully in the Trade Union organizations. They issue job
descriptions only at the selection/or appointment stage.
It would be interesting to understand the rationale behind the stage at which
these organizations issue job descriptions, if any. However, job descriptions can be used
in a variety of ways. They can be utilized for job evaluation, training, career planning,
among other uses. Perhaps, some organizations distribute job descriptions to candidates
based on the particular emphasis in view. It is useful to bear in mind that job
descriptions need to be changed from time to time and as such, should be checked at
regular intervals especially when a vacancy is filled, to ensure that there are no
variations.3
3 Industrial Society 1989.

121
4.13.9 Testing for Knowledge, Skills and Abilities Important for Job
Performance
Human resources personnel practitioners were asked to state whether their organizations
carried out tests for knowledge, skills and abilities important for job performance. Table
A 4:27, Appendix A describes employers’ responses about whether their organizations
carry out such tests. An overall proportion of 50% stated “Sometimes” This accounted
for 67% in the private sector and 33% in the public sector Thirty percent also stated
“Always”, accounting for 33.3% in the public sector and approximately 17% in the
private sector, in addition to the trade union representative who also stated “Always”.
The remaining 20% of the sample stated “Never”, comprising a substantial proportion,
(33%) in the public sector and approximately 17% in the private sector.
The research data seems to indicate that the Trade Union organization is keen to
“always” test for knowledge, skills and abilities important for job performance, as a part
of its recruitment process. It appears that the majority of organizations within the
private sector however, do so only “sometimes”. With respect to public sector
organizations, equal proportions of approximately one-third of them test for knowledge,
skills and abilities, some “Always” others “Sometimes” and some “Never”. According
to the Industrial Society, (Ibid.) the tests that are mostly done are those that assess job
performance or used to determined intelligence, special aptitudes or personality.

122
It is therefore not strange that results of the present study seems to indicate that a
substantial proportion (30%) of the human resource representatives “always” conducted
tests for skills and abilities related to the applicant’s job. However, another 50% of the
organizations reportedly do carry out such tests, but only sometimes or at times. This
indicates that there is some inconsistency or lack of conformity in both the public and
private sectors with respect to their recruitment processes.
4.13.10 Organization’s Requirement for Educational Background not
directly related to One’s Job
Management representatives/human resource personnel practitioners of the various
organizations in region four were asked to respond to the question of whether their
organizations required educational background not directly job related. The data in
Table A4.28, Appendix A highlights the responses.
It appears that just as some organizations have requirements for educational
background that are job-related, a substantial proportion of the organizations within the
participating sectors in Region Four, also required applicants to have some educational
background not directly related to the position for which the applicant applies. The
research data indicated that a substantial proportion of the organizations in this study
had such a requirement. Half (50%) of them, “Always” and some of them (30%)
“Sometimes”. However 30% of them “Never” have such requirements. It may be also

123
that most, if not all (100%) Trade Union organisations do make this request as the
representative indicated.
The 50% of respondents who stated that their organizations always required
educational background not directly related to the job comprised the majority (67%) of
the public sector organizations. No practitioner in the public sector stated that he/she
sometimes had that requirement. However, the other 33% of public sector
representatives stated that their organization never had such requirement. With respect
to the private sector, 33% of them equally stated that they “Always”, “Never” and
“Sometimes” had that requirement. There is an indication here of a higher level of
inconsistency among the private sector on this matter than could be seen within the
public sector.
There could be arguments for and against the requirement of non-job related
educational background. Arising out of such requirement, could be the argument of a
bias against a particular applicant or a particular level of applicants. On the other hand,
this requirement could be seen as an asset to the organization and to the community of
workers. For example a requirement for a secretary to have a First Aid Qualification or
a Supervisor to have a Counselling Qualification could be an asset. This would mean
that in the case of a medical emergency that Secretary with First-Aid qualification may
be able to assist. With respect to the Supervisor with the Counselling qualification, her
skill in the particular area may prove useful, particularly in this era of HIV and AIDS. A

124
staff member may be in need of some emergency counselling and that person would be
able to render the required assistance.
4.13.11 Criteria to Determine Final Selection in a Case of Two equally
qualified applicants
With respect to the criteria to be used to make a final selection of applicant in a case
were there are two equally qualified persons for a position, human resources
practitioners provided responses. See Figure B 4.1 Appendix B. It appears that
organizations within each sector would use different criteria to determine the final
selection.
The criteria in the private sector would include the applicant’s knowledge of the
organization; experience, fitness and personality, (16.6% each); Other respondents in
this sector either, never experienced the situation, (16.6%); or were not involved with
appointments (16.6%). The other 33.6% did not state.
In the public Sector, the following would be considered: Age, other competing
personal activities, adaptability and availability to work beyond the normal call of duty
(33.3%); Seniority, qualification (in the case of the management level applicant) and
suitability, (33.3%); while the other 33.3% did not state. The representative for the
trade union organization, on the other hand, identified seniority and results of a test as
the determining factors.

125
4.13.12 Circumstances under Which Transfers Take Place in the
Organization
Human resources personnel practitioners were required to state under what
circumstances transfers in their organizations take place. They (the respondents) were
provided with a number of possible factors, namely: staff mobility; poor interpersonal
relationships; poor job performance; to accommodate staff with special needs; cross
training; to fill vacancies and cross experience. They were also given the opportunity to
state other factors not mentioned.
A cross-tabulation showing the circumstances under which transfers take place
in various organizations according to sectors, provided the results. The table showed
that the most common overall circumstance for transfers was “to fill vacancies” (30%).
The majority (67%) of those who provided this response, represented the private sector
and the other 33% public sector. An overall 20% of respondents stated “Other”. Of
them, 50% represented the public sector and the other 50% private sector. The other
overall 10% stated ”Staff mobility” as the circumstance for transfer, representing 50%
each in the private sector and public sector. The question was not applicable to the trade
union representative, as that organization was numbered among an overall 40% of
organizations that do not have transfer policies.
Of the overall 20% of organizations that give other reasons, 50% of them
represented the public sector and the other 50% the private sector. The 50% in the

126
private sector stated “Staff mobility, to fill vacancies, cross experience and suitability”,
while the other 50% respondents in the public sector, stated a combination of “Staff
mobility, cross training, to fill vacancies and cross experience”. No organization within
the public or private sector in region four seem to use “Poor Interpersonal-relationship,
accommodation of staff with special needs nor poor job performance as factors for staff
transfers.
4.13.13 Human Resource Personnel Practitioners Report of Staff
Orientation
Human resource personnel practitioners were asked to state whether their organizations
had staff orientation policies. The majority (60%) of the practitioners responded in the
affirmative. These comprised a substantial proportion (50%) of private sector
organizations, the majority (67%) of the organizations in the public sector and the trade
union organization, (100%). An overall 30% of organizations in the sample did not
conduct staff orientation. The other 10% within the private sector did not state. Those
who stated that their organizations did not have recruitment policies, accounted for 33%
each in the public and private sectors.
4.13.13.1 Stage At Which Orientation Takes Place
It appears that it is a common practice for staff orientation to take place in the first
quarter of the employee’s tenure.

127
Forty percent of the practitioners stated that orientation within their
organizations take place between 1-3 months and the other 20% between 3-6 months of
recruitment. Of those who stated between 1-3 months, comprised 67% of them were
public sector, 17 % private sector and the other, trade union representative (100%).
Those who stated 3-6 months accounted for 33% of the private sector respondents. No
Organization in the public sector or trade union seemed to conduct their orientation
programs between 3-6 months of the employees’ recruitment period. The question was
not applicable to 40% of the respondents.
4.13.13.2 Duration of Orientation Period
Duration of the orientation period was as follows
Private Sector: 2 days, 2 weeks and depending on the schedule of the program.
Public Sector: 1 day, 1 week
Trade Union: dependent on the employee’s application and the type of job
With respect to the components of the Orientation programme, it appears that
the focus varies according to organization and to sector. Orientation in the private sector
comprises the following activities:
o Briefing on the mission and vision of the organization, meeting officials
of the organization; Discussion on the expectation of the employer,
welfare benefits, employment policies, practices, compensation package,

128
industrial relations; security awareness, health and safety factors in the
work environment, the organization’s major products and services and
discussions with retired employees (pensioners).
o Briefing about the organization’s policies and programmes in place
o Meeting with personnel and presentation of directors about the
functional areas of responsibility
The programme in the public sector entails:
o Briefing on employees terms of reference and deliverables.
o Training, small meeting sessions and chat room sessions
Trade Union organization:
o Discussions on discipline, safety, honesty and discussion of openness to
suggestions.
4.13.14 Participating Human Resource Practitioners Comments
Personnel practitioners were encouraged to make further comments on employment
practices within their organizations. The majority (80%) of the respondents were not
willing to make comments. Only 2 (20%) of the respondents were willing. One
representing the public sector and the other, the private sector.
Comments were as follows:
Private Sector: Opportunities exist within organization for the process to
develop greater objectivity.

129
Public Sector: It would be necessary to have an incentive scheme based on
performance.
4.13.15 Summary of Section
This section provided the results and discussion of the employers’ report on the policies
existing within the participating entities and the extent to which they are utilised. It also
described the procedures, activities and processes carried out in the recruitment and
termination of staff in the various sectors.
SECTION III
4.14 Socio-Demographic Characteristics of the Employees Who
Participated In the Study
4.14.1 Introduction of Section
This section describes the socio-demographic characteristics of the employees who
participated in this research. It analyses the ages, marital statuses, religion and
gender/sex of the employees.
4.14.2 Age
Employees’ ages ranged from below 20 to approximately 54 years old. Table 4.5
(below) shows the major demographic data of the employees in the various sectors,
Public, Private and the Trade Union in Region Four. The majority (69%) of the

130
respondents were within the economically active age group, representing approximately
66% of employees in the Public Sector, 71% in the Private Sector and 60% of those
employed in Trade Union organisation.
The average age of the total sample of respondents in this study was 34 years
old, with an overall modal interval of ten years between the groups. The average age of
employees in the public sector was 32 years old, while for those in the private sector, it
was 35 years old, and the trade union, 30 years old. This indicates that the employees in
the Trade Union accounted for the youngest among employees in region four. On the
other hand, employees in the private sector were on average, the oldest among the
employees in the Region.
The indication of a low proportion of employees in the under-20 age group
(11%) could be an indication of the high unemployment rates in the 15-19 age group of
37% as reported in the 1996 Human Development Report, discussed in review of
literature, above. That report suggests that the unemployment rate is lower for the older
age-group. It was 20% for the 20-24 age group, hence the high proportion of
employees in this study within the higher age range, (20-34 years old). Alternatively,
the reason for the lower representation of persons in the under 20 age group may be
that youths are generally remaining in school and possibly going off to institutions of
higher learning before venturing out into the working environment.

131
4.14.3 Marital status
The marital statuses describing the employees were common law, divorced, married,
single and widowed. Table 4.5, below illustrates the marital statuses of the employees
who participated in the study. Thirty-two percent were legally married. However, the
majority (53%) seemed to be among the unmarried (single), representing 59% of the
public sector employees, 49% in the private sector and 80% Trade Union employees.
This high proportion of un-married employees in the trade union may be related to the
earlier finding which indicated that the employees in trade union organizations
accounted for the youngest among the employees in the participating sectors.

132
Table 4.5
Socio demographic Characteristics of the Sample of Employees by Sectors
4.14.4 Religion
Employees in the public and private sectors in Region Four, Guyana, appear to be God-
fearing and religious oriented, probably subscribing to the major religious tenets within
the society. Table 4.5 gives an indication of the employees’ religious backgrounds. The
Christian, Hindu and Muslim seem to be their most common religions. The results show
VARIABLE Public Sector Private
Sector Union TOTAL
Freq. % Freq. % Freq. % Freq. %
Age < 20 5 17.2% 5 7.6% 1 20.0% 11 11 20-34 14 48.3% 30 45.5% 3 60.0% 47 47 35-44 5 17.2% 17 25.8% 0 0.0% 22 22 45-54 4 13.8% 12 18.2% 1 20.0% 17 17 >54 1 3.4% 2 3% 0 0.0% 3 3
Martial Status
Common Law 2 6.9% 8 12.1% 0 0.0% 10 10
Divorced 1 3.4% 3 4.5% 0 0.0% 4 4 Married 8 27.6% 23 34.8% 1 20.0% 32 32 Single 17 58.6% 32 48.5% 4 80.0% 53 53 Widowed 1 3.4% 0 0.0% 0 0.0% 1 1
Religion Christian 19 65.5% 39 59.1% 3 60.0% 61 61 Hindu 5 17.2% 21 31.8% 1 20.0% 27 27 Muslim 2 6.9% 6 9.1% 1 20.0% 9 9 Other 3 10.3% 0 0.0% 0 0.0% 3 3
Gender/Sex Female 16 55.2% 32 48.5% 2 40.0% 50 50 Male 13 44.8% 34 51.5% 3 60.0% 50 50

133
that among the employees, Christians predominated, accounting for approximately 61%
of the respondents. The Hindu seems to be the second largest group among the
employees. They accounted for 27%, while the Muslims were 9 %. This result seems to
be consistent with the pattern of religious involvement in the Guyanese society as
recorded in the UNDP (2000) report, Review of Literature, above.
The report shows that the majority of Guyanese (approximately 58%) are
associated with the Christian faith, while approximately 29% are Hindus and 7.3%
Muslims. The results when further analysed by sectors show that Christians also seem
to account for the majority of the employees in each of the sectors as well as in the
Trade Union organizations. The proportions are approximately 66% in the public sector,
fifty nine percent in the private sector and 60% among the trade union organizations.
Notably, the data seems to indicate that there is a higher proportion of Muslims as part
of the Trade Union organizations, (20%) when compared to those (9.1%) in the private
and in the public sectors (6.9%). At least 4% of the respondents identify with “Other”
religious groups. These “Other” groups may include the Bahais and Rastafarians which
are also a part of the Guyanese society.

134
4.14.5 Gender/Sex
The overall gender distribution among the sectors seems to indicate equal proportion of
males and females. The sample constitutes 50 % males and 50% females, representing
55.2% females in the public sector, 48.5% in the private sector and 40% among trade
union workers. The male percentages show 44.8% in the public sector, 51.5% in the
private sector and 60% among union workers. The equal total proportions of male and
female are somewhat similar to the population distribution by sex in the Guyanese
society, which indicates a mere .1 % in favour of males.
The socio-demographic characteristics also indicate a higher proportion of
involvement in the Private Sector than in the Public Sector, 66% compared to 29%. This
result confirms the findings of the Human Development Report of 1996, which shows a
decreasing public sector employment structure of 49% in comparison to 51% in the
private sector in 1992, discussed in the Literature Review, above. This may however be
due to the fact that the private sector organizations showed a higher rate of response to
the present study than did organizations in the other sectors.
4.14.4 Summary of Section
The foregoing section described the socio-demographic characteristics of the employees
who participated in this research. It described the employees’ ages, marital statuses,
religious backgrounds, and their gender/sex.

135
SECTION IV
4.15 Employees Experiences and Views with Respect to
Recruitment and Termination Policies, processes and
procedures in their Organizations
4.15.1 Introduction of Section
The present section provides a discussion of the employees’ experiences and views in
relation to employment policies, procedures and practices within the organizations of
their employ.
4.15.2 Employees and Discrimination Regarding Information, Awareness
and Type
Employees in the participating sectors were required to respond to a number of
questions in relation to discrimination. Employees were asked to state whether:
o their employers had informed them about the Anti-Discrimination Act
o they were aware of discriminatory practices within their organizations;
if they were aware to state the type
o they were aware of persons leaving because of discrimination and

136
o If yes, what type of discrimination have those persons suffered?
Tables A 4.29, A 4.30, A 4.31, A 4.32 Appendix A and Figure B 4.2 Appendix B,
describe the employees’ responses, respectively. With respect to information about the
Anti-discrimination Act, the majority (84%) of all the employees were un-informed
about the Act. The data seems to suggest that none of the employees representing the
two trade union organizations was informed about this Act. It is important to note
however that a larger proportion (21%) of the employees in public Sector organizations
seemed to be informed about the Act than were their counterparts (11%) in the private
sector.
A small overall proportion of 12% of employees within the public and private
sectors seemed to be aware of discriminatory practices within their organizations. A
larger proportion (16%) in the private sector than in the public sector (3%), were aware
of discriminatory practices.
Regarding the type of discriminatory practices, it appears that a small proportion
(12%) of respondents were also able to identify different types of discriminatory
practices about which they were aware. The most common of the practices identified
was race/ethnicity (50%) of all the practices, preceding “Bullying” (27%). Those who
identified race/ethnicity within their organizations were largely employees of the private
sector, five persons (83%). The other respondent (17%) was public sector. All three of
the persons who identified bullying within their organizations were also private sector.

137
A total of 3 persons, representing 5% of the employees in the private sector
stated that they were aware of persons leaving because of discrimination. No employee
in the public sector or in the trade union organizations stated that they were aware of
persons leaving because of discrimination. However one employee in the public sector
and 5 persons in the private sector did not state whether or not they were aware of
discriminatory practices within their organizations.
With respect to type of discrimination that resulted in persons leaving their
employ, two persons advanced types. One person stated it was race and the other stated
that a junior staff had left because he felt he was discriminated against. The other
employee did not provide the type of discrimination, which caused the employee to
leave.
Further analysis with respect to findings emanating from the employers/human
resource practitioners and employees, seems to yield conflicting results regarding the
existence of discrimination and discriminatory practices. The information from the
human resource practitioners/employers, regarding employees complaints of various
types of discrimination, as seen in Section II above, have been compared with
information received from employees in the present section. These results focused on
employees’ awareness of discrimination and discriminatory practices in their individual
organizations. The human resource practitioners’ results seem to give a strong
indication that employees have never complained of being discriminated against on

138
grounds of race/ethnicity, sex/gender, nor bullying, among others. On the other hand, it
seems clear although apparently not widespread, that employees experienced some level
of discrimination and were aware of some amount of discriminatory practices within
their sectors.
Human Resource practitioners may argue that if employees have experienced
any of the discriminatory practices in question, they have not complained about it and
as such, management is unaware. However, there could be contrasting arguments that if
persons encounter such experiences and have elected not to voice their complaints or
concerns to anyone in management, then there could be a serious problem, at the least,
communication, within those organizations, If not, other problems such as lack of
freedom of speech, relationship problems, or lack of clear policies and procedures to
address various types of grievances could have influenced employees’ decisions not to
speak out on such matters.
Earlier analyses indicated the existence of various types of policies within
organizations. However, it was clear that two important policies, namely “Equal
Employment Opportunity” and Non-discrimination were lacking, particularly in
organizations in the public and private sectors. As pointed out earlier, there seemed to
be no evidence that the majority of organizations had those policies in place. In cases
where policies and procedures might exist, implementation may be lacking or the

139
manner in which matters are handled can act as a deterrent to persons’ willingness to
make reports.
4.15.3 Existence of Anti-discrimination policies with respect to
recruitment and other practices
Employees were asked to state whether they were aware of the existence of anti-
discrimination policies with respect to recruitment and other practices within their
organizations. See Table A 4.33 Appendix A which illustrates the employees’ results.
The data shows that within the public sector, the most common response was
“Don’t know” (62%). Approximately 17% of the employees in this sector stated that
there were such policies within their organizations and a similar proportion stated there
were not. Within the private sector, the most commonly occurring response was also
“Don’t know”. Thirty nine percent of the employees in this sector stated that they did
not know, while 32% stated that there were no such policies in their organizations.
Twenty four percent however stated that these policies existed in their organizations.
On the other hand, it appears that a larger proportion (40%) of trade union organizations
than organizations in the public and private sectors had policies for handling reports,
although a substantial proportion also did not state whether or not such policies existed.
While 20% of the respondents in trade union organizations stated that they did
not know whether such policies existed, no employee from that sector stated that there

140
was none. In general, only 23% of employees stated definitely that policies existed
within their organizations in relation to recruitment and other practices. A slightly
higher proportion (26%) stated that there were not and a much more substantial
proportion (45%) did not know of any policies.
In summary, it appears that the existence of anti-discrimination policies with
respect to recruitment and other practices is not widespread among the organizations in
the public and private sectors and trade union organizations in Region Four. If they do
exist, employees are un-informed about their existence.
4.15.4 Existence of various types of procedures within
organizations
Employees were asked to state whether there were procedures (directives) for dealing
with reports of discrimination, discipline, grievance, absence due to sickness or other
reasons, pregnancy and exit notices. Tables A 4.34 (i)-(iv) Appendix A highlight the
employees’ responses.
It appears that within the private sector, there is a larger proportion of
organizations with procedures for dealing with discipline (94%) , absence due to
sickness and other reasons (75%) and pregnancy benefits (75%) , than there are
procedures for handling Grievance and exit notices (56% each) and to a lesser extent

141
discrimination (44%). It is to be noted also that within this sector an equally substantial
proportion (44%) did not know whether there was any directive for handling
discrimination or exit notices. Twelve percent of the respondents also stated that there
was no such procedure, compared to 6% who stated that there was no pregnancy
benefit. No employee claimed that there were no directives for dealing with discipline,
absence nor exit notices.
In the public sector, it appears that there is a larger proportion of organizations
with procedures for handling reports of discipline (80%), grievance (80%) and absence
due to sickness or other reasons (80%) than there are for the other types of reports.
There seems to be also more organizations with directives for handling discrimination
(60%) and exit notice (60%) than there are for dealing with pregnancy benefits. It is to
be noted also that there might be a larger proportion of organizations within the public
sector with procedures for handling discrimination (60%) than there exists within the
private sector, (44%).
Further analysis shows that generally, a larger proportion of employees in the
public sector did not know whether procedures for handling reports of discipline and
pregnancy benefits than organizations in the private sector. However, no employee in
the public sector stated that there was no procedure for handling discrimination,
discipline, grievance, absence nor exit notice. The only complaint which some
organizations may definitely lack procedures seem to be that of pregnancy benefits.

142
Twenty percent of employees in this sector stated that there was no procedure for
handling this type of report.
The private sector on the other hand, accounted for a larger proportion of
employees who were unaware of procedures within their organizations to address
discrimination, grievances, absence due to sickness or other reasons and exit notices
that there were in the public sector.
The research data seems to suggest that there is a high level of commonality
among trade union organizations in region four. Although it was only 40% of
employees among the trade union organizations who stated that they knew of existing
directives, all (100%) of them reported that directives existed for handling each of the
reports, namely, discrimination, discipline, grievance, absence due to sickness or other
reasons, pregnancy benefits and exit notices.
It is to be noted that the data relating to the entire region in relation to
procedures for handling reports, indicates that the majority of organizations within the
public and private sectors and trade union organizations do have procedures for
handling discipline and absence due to sickness or other reasons, more than any other
directive.
Further analysis indicates some amount of inconsistency between the reports of
the human resource practitioners and that of the employees in the public and private
sectors. This is particularly obvious in respect of the existence of procedures to deal

143
with discrimination, specifically in the public sector, where the majority (67%) of the
human resource practitioners stated that there was no procedure at all for handling
discrimination, except for the seemingly uncertainty about the (33%) of them who did
not state. However, the majority (60%) of employees in the same sector stated that such
directives existed.
Similarly in the private sector, though to a smaller extent, a substantial
proportion (44%) of employees stated that there were procedures for handling
discrimination while only 17% of human resource representatives stated that there were
such directives. However, the reports concur for the other types of directives, as both
employers and employees confirm that the majority of organizations have procedures
for dealing with them.
In the public sector there seem to be other areas of inconsistency. Regarding
reports for dealing with grievances, pregnancy benefits and exit notices, again a higher
proportion of the public sector employees, attest to the existence of procedures for
handling related matters when a much smaller proportion of employers attested to their
existence. Where the employees 80%, 40% and 60% respectively stated that procedures
exist, the employers 33% in each instance reported their existence.

144
4.15.5 Requirements of social characteristics of age, sex, marital
status, ethnic group, religion, etc for one’s Job
Employees were asked to state whether social characteristics such as age, sex, marital
status, ethnic group or religion were required for their job. Table A 4.35, Appendix A
shows the employees responses. The data seems to indicate that generally, social
characteristics, above, are not required for employment in the public and private sectors
and trade union organizations in Region Four. An overall proportion of 84% of the
employees stated that none of those characteristics was required. A total of two persons
(7%) and 5 persons (8%) in the public and private sectors respectively, stated “age” and
another 2 persons (7%) and 1 person (2%) respectively, stated “sex”. The trade Union
employees (100%) were among those who stated that “none” of the social
characteristics mentioned was required for employment. A total of 6 persons (6%)
stated other requirements. Three of them worked in the public sector and the other three
in the private sector.
Of those who stated “Other” in the public sector, 2 of them stated a combination
of “age and experience” and the other stated “Qualifications” Of those who stated
“other” in the private sector, two persons stated “Qualifications” and one stated
“Experience” This is an indication that some amount of consistency exists in the value
of qualification as an important factor in job requirements and selection among the
sectors and trade union organizations in Region Four.

145
4.15.6 Employees Opinions on the basis of employee selection
Employees were asked to state whether factors of age, family referrals, gender,
academic qualifications, referral by friends or team spiritedness was the basis of
employees’ selection in their organizations. See Table A 4.36, Appendix A for the
employee’s opinions. The most commonly occurring factor identified was “Academic
Qualification” (42%). This accounted for the responses of 34.8% of private sector
employees, 62% public sector and 20% in respect of trade union employees. Only one
person identified age and another gender as the basis for selection, in their opinions.
The data seems to suggest therefore, that academic qualification is the major
basis of employee selection in the participating sectors in Region Four. This finding is
congruent with the results of an enquiry into racial and colour discrimination in the
private sector in Trinidad and Tobago which the Commission of enquiry conducted in
1970, discussed in review of literature, above. The findings of that enquiry revealed
that the most highly considered method in recruiting staff at three levels, namely, high
level, middle level and the bottom level, was educational qualifications. However, other
factors were also taken into consideration, such as experience, special aptitude and
personality for the high and middle levels. For the bottom level, however, factors of
character and personality were added to academic qualifications which were seen as the
most important.

146
4.15.7 Relations between the various races
Employees were asked to state their opinions about the relations between the various
races in their places of employment. The cross-tabulation table, A4.37, Appendix A
depicts the results. The table shows that 54% of the total number of employees stated
“very good”. Two persons stated “Poor”. Those who stated that relations were very
good comprised 59% public sector employees, 48% private sector workers and 5 or all
of the trade union employees. The two respondents, who stated that relations between
the various races were poor, worked in the private sector.
4.15.8 Employees Socializing With Each Other
Employees were asked to state whether the employees in their departments socialized
with each other. Those who responded in the affirmative were asked about the level of
frequency with which they socialized. Tables A 4.38 and A4.39, Appendix A display
the employees’ responses. A large majority of 94% of the employees stated “Yes”
while, 2% stated “No” and the other 4% did not state. The table also shows that all five
of the trade Union employees stated “Yes” (100%). The majority of the public sector
employees also stated “yes” as well as 92% of private sector employees. In terms of the
level of frequency with which staff socializes, 37% stated “Often” and 2% stated
“seldom”. Within sectors, 41% in the public sector stated “often”, 40% Trade Union

147
workers gave the same response, and 35% in the private sector stated likewise. Only 3%
of public sector workers comprised those who stated that workers socialized very often.
Further analysis seems to suggest that relations between the races in the participating
sectors were very good and that staff socialized often. This may be an indication
therefore, that racial tensions among staff in the public and private sector and trade
union organisations are either minimal or perhaps non-existent.
4.15.9 Staff Being Overlooked For Certain Benefits
Employees were asked to state whether they were overlooked for certain benefits. A
cross-tabulation table shows the benefits for which staff were overlooked. It appears
that although the majority of the employees in the participating sectors in Region Four
do not seem to be overlooked for certain benefits, some employees in the sectors in the
region are overlooked.
An overall proportion of 24% stated they were overlooked for one or other
benefits. The most common benefit identified was “training” (41.6%), followed by
promotion (25%) and transfer, (20%). Of those overlooked for training, 60% were
Private sector and the other 40% were public sector workers. None of the trade union
employees seemed to be overlooked for any of the above benefits. They were among
the 52% of employees who were not overlooked for any benefits. It is to be noted that a
total of 19 (19%) of the employees did not state whether or not they were overlooked.

148
It would be interesting to learn whether such a high proportion of employees
would have refused to state whether or not they were overlooked for any of these
benefits, if it were possible to utilize another research method or if there was another
method of reaching some respondents besides directly through their human resource
managers/practitioners.
As stated in the limitations, it was necessary in many instances to pass the
research instruments to respondents either through their supervisors or human resource
managers and to retrieve them through the same media. Perhaps, some employees
knowing that the questionnaires were being passed through their superiors, might have
been careful about the answers they provided to certain questions. It is only a repeat of
a similar study, utilizing different methods, can determine whether different results
would be yielded to the same questions.
4.15.10 Possible Reasons for being overlooked
Employees who felt they were overlooked for certain benefits, were required to state the
reasons they felt they were. Table A 4.41, Appendix A highlights the reasons employees
identified for being overlooked. The most commonly occurring reason was
“interpersonal relations”. Five persons (26%) identified interpersonal relations. Of those
who stated they were overlooked due to interpersonal relations, 80% of them were
private sector employees and the other 20% were public sector. No employee felt he or

149
she was overlooked because of religion. However, 2 persons, one private sector and one
public sector, felt they were overlooked because of their gender. In addition, 7% felt
that although they were overlooked, they were not overlooked for any of the reasons
posed, but did not specify those reasons.
It is to be noted that the reasons employees felt they were overlooked, subscribe
to factors of discrimination. These are factors which international bodies such as the
United Nations, the International Labour Organization and the Guyana Constitution
criticises. In this regard, various Acts and standards have been developed to prevent and
protect humanity against discrimination in all spheres of life, including protection in
employment. See Review of Literature above, on discrimination and national and
international practices and employment equity.
4.15.11 Effects of Being Overlooked
Employees who were overlooked identified a number of ways in which they were
affected. See Table A 4.42, Appendix A for the list of effects. The most commonly
occurring effect was “lack of initiative”, (25%) followed by “seeking other
employment” (`17%). Those whose sense of initiative was affected were private sector
employees, while those who were seeking employment as a result of being overlooked,
were both public sector (50%) and private sector (50%). These effects can definitely
have negative impact upon organizations.

150
When staff looses initiative in relation to their work, the progress of the
organization is affected negatively. In every position within an organization, staff is
required from time to time, to make on-the-spot decisions in the interest of the
organization’s progress. It may be a decision to be taken in the absence of a supervisor,
whether it is to issue a particular correspondence or to make a response to a matter that
requires urgent attention and which a person is capable of dealing with in the absence of
a senior or junior officer. Using one’s initiative or failing to do so when necessary, will
impact upon an organization either positively or negatively, depending upon the
particular circumstance. Similarly, when employees have to resort to seeking other
employment because they felt they were overlooked in some respect, it certainly affects
the organization.
Recruiting new employees is usually a large financial cost and can also be
regarded as a social cost. Not only that it could be a loss to the organization, but it can
affect the organization’s status when other organizations become aware of the particular
reason(s) that contribute to employees’ exit in that organization. This result gives an
indication of the usefulness of the present study on employment practices. Although the
sample has unavoidably been constrained due to some of the challenges along the way,
the issues emanating are to be noted and addressed.

151
4.16 Employees Opinions of their Organizations’ Employment Practices
of Recruiting/selection, Promotional decisions and Cross Training
4.16.1 Recruiting and Selection Respondents were requested to rate their organizations’ employment practices with
respect to recruiting and selection practices, promotional decisions and cross training.
Table A 4. 43 Appendix A highlights the employees’ responses.
With respect to recruiting and selection practices, the data seems to suggest that
the private sector employees are of the opinion that these practices are generally good.
The majority (51%) were of this view. A substantial proportion (34%) in the public
sector also felt that these practices were good. Those who felt that the recruiting and
selecting practices were excellent comprised a substantial proportion of employees in
the public sector (31%) and a lower proportion (19%) in the private sector. It is to be
noted that no employee in the public sector felt that his or her organization’s recruiting
and selection practices were poor, nor very poor. However 4% of the private sector
respondents felt they were poor while 2% felt they were very poor.
With respect to trade union employees, each of them seem to have a different
view. They rated their organizations’ recruiting and selection practices differently. One
each stated that these practices were “Excellent”, “Fair”, “Good” and “Very Poor”. The
other respondent was “Undecided” about a rating in this regard.

152
4.16.2 Promotional Decisions
With respect to their organizations’ promotional decisions, employees provided their
opinions in Table A 4. 43, Appendix A. In both public and private sectors, it generally
appears that the employees feel good about these decisions. Similar to employees’
views about the recruiting and selection practices, the most commonly occurring
response was “Good” in both public and private sectors. Thirty five percent and 30%
respectively stated that they were good, followed by those who stated that they were fair
21% and 18% respectively in the two sectors, public and private.
The data seems to indicate similar results for the trade union as indicated in their
previous responses on recruiting and selection practices. Twenty percent respondents
each stated that their organizations’ promotional practices were “Excellent”, “Fair”,
“Good” and “Very Poor”. The other respondent was “Undecided” about a rating.
4.16.3 Cross Training Practices
Employees were also asked to rate their organizations’ employment practices with
respect to cross training. Table A 4. 43 Appendix A gives the employees responses.
The table shows that both public and private sector employees rate their organizations
highly. In the public sector, the most common responses were “Good” 27%,
“Excellent” 21% and Fair 17%. No employee in this sector opined that their
organizations’ practices of cross training were either poor or very poor.

153
In the private sector, the most common responses were “Good” (26%) and
“Fair” (26%). However, 21% of the respondents were also undecided about a rating of
their organizations’ cross training practices. No trade union employee thought that their
organizations cross training practices were poor. Respondents had equally varying
views. Twenty percent in each instance felt that their organizations’ practices regarding
cross training were either excellent, fair, good, or very poor. Twenty percent of them
were also undecided about an opinion.
4.17 Employees opinion of whether their organizations employment
practices were fair
Respondents were asked to state whether or not they felt the employment practices in
their organizations were fair. Table A 4.44, Appendix A provides the responses. The
data seems to indicate that an overwhelming majority of the employees in the private
and public sectors and trade union organizations are of the opinion that the employment
practices within their organizations are fair. In the public sector 83% of the employees
stated that their organizations’ employment practices were fair, Only 3% felt they were
not, although 14% of them did not state their opinion on the matter.
Within the private, 77% of the organizations felt their organizations’ practices
were fair, 9% felt they were not, while the other 14 % did not provide an opinion. Sixty
percent of the employees in trade union organizations also felt that the employment

154
practices of their organizations were fair. However, 20% of them stated that they did
not think the employment practices of the organizations in which they worked were fair.
The other 14% did not give an opinion. In all, the majority (78%) of the respondents
felt that the employment practices of their organizations were fair, 14% did not state,
while 8% stated they did not think so.
4.18 Employment Practices Stimulate Employees To Remain
Employees were asked to state whether the employment practices in their organizations
stimulated them to stay on in the organizations. Table A 4.45 Appendix A shows the
results. It appears that the majority of employees in both the public and private sectors
and trade union organizations are stimulated to remain in their organizations. Those
who responded affirmatively comprised 55.1% of the public sector respondents, 67%
private sector and 40% from the Trade Union.
Across the sectors, the majority, (62%) of the respondents stated that the
employment practices in their organizations stimulated them to remain with their
organizations. Only 12% indicated that the employment practices of their organizations
did not stimulate them to remain. However, a substantial proportion of employees,
within the public sector (41.4%) and the trade union (40%) organizations did not state
whether or not they were stimulated to stay on with their organizations.

155
Employees were also asked to state the reason (s) they were not stimulated to
remain. Figure B 4.3 Appendix B shows responses forwarded. The majority (80%) of
those who were not stimulated to remain in their organizations, did not state the reasons
for their reluctance. Only 20% in private sector organizations provided reasons. Ten
percent of them stated that they were highly qualified and yet offered entry positions
and the other 10% stated that seniors took advantage of their positions.
4.19 Happiness With Progress So Far
A cross-tabulation was constructed to show the employees responses to the question of
whether or not they were happy with their progress so far. See Table A 4.46, Appendix
A. The data indicates that the majority of the respondents in both public and private
sectors seemed to be happy with their progress. Seventy five percent of the respondents
across the sectors stated they were happy with their progress. These represented 79%
public sector employees and a similar proportion in the private sector. However, the
majority (60%) of the trade union employees were not happy with their progress. Only
40% of them stated that they were happy with their progress so far. An overall 15% of
employees across the sectors did not state whether or not they were happy with
progress. An overall 10% of employees were unhappy with their progress, accounting
for 11% private sector workers and 60% trade union workers. No public sector worker
in Region Four seemed to be unhappy with his/her progress.

156
Of those who were unhappy with their progress, in the private sector, 14%
stated they were unhappy because they were stuck in lower level positions or denied
promotion. The other 86% did not offer reasons for their unhappiness. For those in the
trade union who were unhappy, 33% stated that development could be much faster with
more guidance and support from senior females in their organizations. The other 67%
did not forward reasons for their unhappiness.
4.20 Employees Feeling About Their Present Situation
Employees responded to a query in relation to their feelings about their present
situation. Table A 4.47 Appendix A shows the employees’ responses to the question.
The employees’ responses were “Good”, “Not good” and “Very good”. The data shows
that substantial proportions (45%) of employees in both the public and private sectors
felt “Good” about their current situation, while the majority (80%) of the employees in
the trade union organizations also felt good. The other 20% of trade union employees
felt very good. Similarly, substantial proportions in both public and private sectors also
stated that they felt very good about their current situation. These represented 45% in
the public sector and 35% in the private sector. Only 7% of public sector employees
did not state, accounting for an overall 2% of employees who did not state. The general
indication therefore, is that the employees are comfortable with their present situation.

157
4.21 Employees Happy About Their Present Treatment
Employees were asked to state whether or not they were happy about their present
treatment. Table A 4.48, Appendix A states their responses. The data indicates that the
majority of employees in both public and private sectors as well as the trade union
organizations seem to be happy about their present treatment. It appears that a larger
proportion (86%) of the employees in the private sector were happy with their treatment
than those in the public Sector (79%) and in trade union organizations (60%). Four
percent of the employees in the public sector did not state whether or not they were
happy about their treatment.
4.22 Reason for Unhappiness With Treatment
Respondents advanced reasons for their unhappiness with their treatment. See Figure B
4.4 Appendix B. The respondents in the Public Sector stated that conditions were not
good. The respondents in the private sector stated that they were unhappy because of
management’s failure to issue timely employment contracts, lack of grievance
procedures, not given opportunity for training and that working conditions were not
good. Respondents in the trade union stated that they were not receiving enough
support to develop relations within the organization.

158
4.23 Opportunity for Transfer and circumstances of transfer
Employees in the private and public sectors and trade union organizations in region four
were asked to state whether or not they were transferred. Table A 4.49, Appendix A
illustrates their responses. It appears that the majority (68%) of the employees in the
sectors were not transferred. Twenty five percent of them however were transferred.
The other 7% did not state whether they were transferred. Those who stated “yes”
comprised a larger proportion of employees in the private sector (29%) than those in the
public sector (17%) and trade union organizations (20%).
The reasons for employees’ transfer varied from cross experience to cross
training, to fill vacancies, poor relationships, special needs and even to facilitate staff
mobility. The most common reason for transfer across the sectors appears to be “to fill
vacancies”. In this regard, the majority (53%) of the private sector employees who were
transferred provided this reason. Only 20% each of employees in the public sector and
in trade union organizations were also transferred to fill vacancies.
With respect to the public sector, a substantial proportion (40%) was transferred
to facilitate cross experience and another 40% to facilitate special needs of employees.
No employee in the public sector was transferred because of cross training, due to poor
relationships, nor to facilitate staff mobility. However, equal proportions of 11% of
employees in the private sector were transferred to facilitate cross experience, because

159
of poor relationships, to facilitate special needs and to facilitate staff mobility. Only 5%
of employees were transferred to facilitate cross training and they were private sector
employees.
4.24 Criteria For Staff Promotion
Respondents were asked to state the criteria for staff promotion in their organizations.
They were asked to state whether seniority was a criteria, additional training,
performance, ability, aptitude, attitude or other criterion.
It appears that within the public sector, three criterion are mostly used, namely
additional training, (28%) performance (24%) and seniority ( 21%). These are followed
by ability (14%) and attitude (14%). In the private sector, the most common criterion
identified were performance (36%), additional training (21%) and seniority (15%).
These are followed by attitude (9%) and ability (8%).
In terms of the trade union, only 60% of its representatives responded to the
query. Of them, the majority (67%) stated “other”. They identified combinations of
criteria. Approximately 33% stated performance and attitude, while the other 33%
stated that all the various criterion mentioned are usually taken into consideration.. The
other respondent identified additional training as the criteria for staff promotion in their
organization.

160
In general, performance (31%) followed by additional training, (23%) and
seniority (16%), seem to be the most common criteria utilised for staff promotion
among the sectors and trade union organizations in region four, Guyana.
4.25 Rating Organizations’ Records With Respect To Selection
for Training
Respondents rated their organizations with respect to selection for training. The results
seem to indicate that the majority of employees in both the public and private sectors in
Region Four, feel good about their organizations’ practices in relation to selection for
training.
In the public sector the majority (approximately 76%) rated their organizations
favourably. Specifically, 34.5% of them stated that practices with respect to selection
for training were good, 24% stated they were excellent while 17.2% s stated fair. The
other 24% stated that they were either poor (6.9%) or were undecided (6.9%). No
employee in the public sector thought that the selection practices in their organizations
were very poor. However, 3 persons (10.3%) among them did not state.
In the private sector, a smaller majority (approximately 55%) than those in the
public sector also favourably rated their organizations’ practices with respect to
selection for training. Approximately 44% of them however rated this practice within

161
their organizations as not so favourable or were undecided (17.9%). Twelve percent of
them did not state.
Among the trade union organizations there were equally differing views.
Twenty percent each stated that these practices were excellent, fair and good. However
20% also stated very poor while 20% were un-decided. In general, a substantial
proportion in the private sector (43.5%) and among the trade union organizations (40%)
did not respond out-rightly positively.
4.26 Rating Organizations’ Records With Respect To
Termination Of Services
Respondents were asked to state how they felt about the organizations in which they
worked, with respect to termination of services. They were required to state whether
they were “Excellent”, “Fair”, “Good”, “Poor” “Very poor” or whether they were
“Undecided”. See Table A 4.63, Appendix A which illustrates the employees’
opinions. It appears that the majority of the employees within the public and private
sectors and the trade union organizations in region four, are of the opinion that their
organizations’ practices with respect to termination of services were at least fair. The
majority (62%) of the respondents in the public sector and trade union employees (60%)
provided favourable responses.

162
At least half, (50%) of the respondents in the private sector also provided
favourable responses. The table shows that the most common response within the
private sector was “Undecided”. Thirty percent of the employees in that sector were
undecided about a particular rating of their organizations’ termination policies.
However 27% of them felt the services were fair; 20% felt they were “good”. Others
thought they were either excellent (3%), poor (8%), or very poor (3%).
The single most common response in the public sector was “Good”. Twenty
eight percent of the employees in the sector felt their organizations’ termination of
services were good. However 21% were undecided about a rating, while 17% equally
thought they were excellent and fair. No employee in the public sector thought that
his/her organization’s termination of services were very poor, though 3% thought they
were poor. Twenty percent trade union employees equally thought that their
organizations’ termination of services were excellent, good or very poor. Twenty
percent were also undecided. No trade union employee thought that his or her
organization’s policy regarding termination of services was poor.
4.27 Employees Recruitment Experience
Employees were recruited through a variety of methods as shown in Table A 4.53,
Appendix A The most commonly occurring method was Recommendation, 8 (20%),
followed by Walk-ins,17 (17%) and Resumes 17 (17%). The data seems to suggest that

163
a larger proportion (60%) of the employees in the private sector were recruited through
recommendation than those in the public sector (40%). No trade union employee was
recruited through this method.
The most common method utilized in the trade union organizations, seemed to
be “walk-ins”, which was also utilized both in the public and private sectors. Of those
employees who were recruited by just walking into the organizations seeking
employment and were hired, the majority of them, (approximately 65%) were employed
by private sector organizations. This result seems to substantiate the use of this method
in the participating organizations in Region Four.
It was seen earlier that the human resource practitioners identified “walk-ins” as
a recruitment method used in a substantial proportion of the organizations. It was one
of the most frequently occurring among a number of methods in both the public and
private sectors and within the trade union organizations. As pointed out in the previous
section, it was seen that “walk-ins” as a recruitment method was consistent with the
methods used in other countries, including the United States of America to hire staff,
particularly at the plant/service level, but to a lesser extent, to hire personnel at other
levels.

164
4.27.1 Employees Receipt of Job Descriptions
Employees were asked to state whether they received job descriptions as part their
recruitment process. Table A 4.54, Appendix A, highlights the proportions for those
who received job descriptions in relation to their work. The table shows that 78%
received job descriptions, accounting for 76%, 79% and 80% of those in the public
sector, private sector and trade union organizations, respectively.
It seems therefore, that it is common among the participating organizations in
Region Four to distribute job descriptions to their candidates. Responses from the
human resource practitioners who have participated in this study have provided similar
results. These results have indicated that the issuing of job descriptions to candidates is
widespread in the participating organizations in region four.
4.27.2 Stage at Which Job Description was Received
Employees who received job descriptions were asked to state at what stage they were
received. Table A 4.55, Appendix A presents the responses. Forty four percent of the
employees received job descriptions at the selection, appointment or promotion stage,
while 35% of them received descriptions at the interview stage. Only about 15% of the
respondents received their job descriptions before interview. Of those who received at
the selection stage, 76% were private sector while 21% were public sector and the other
three percent trade union employees. For those who received job descriptions at

165
interviews, the majority, (67%) were private sector employees. Twenty six percent of
them were public sector and the other 7% were trade union. Only two employees in the
private sector received job descriptions at the selection stage.
Further analysis seems to indicate some amount of inconsistency between the
reports of the human resource practitioners in the public and private sectors and the
employees within those sectors in terms of the stage at which job descriptions were
issued. However, there is also some level of inconsistency in this regard among the
reports of the trade union management representative and the five trade union
employees (representing two trade union organisations) who participated in the
research. While the human resource practitioners stated the two most common stages at
which job descriptions were issued, were before interview, (30%) and at selection,
appointment or promotion (30%), the employees provided slightly different
information, indicating that they have received job descriptions at the selection,
appointment or promotion (44%) stage and at interviews (35%).
Equal proportions (33% each) of human resource practitioners within the private
sector, reported that job descriptions were distributed at the selection, appointment or
promotion stage and at “other” stages, while the majority (67%) of employees in that
same sector reported that they had received job descriptions at their interviews.
Similarly, in the public sector, there seems to be also some level of inconsistency where
the majority (67%) of human resource practitioners have stated that job descriptions

166
were issued before the interview, while at least half (50%) of the employees in that
same sector stated that they have received job descriptions at “other” times. Only 42%
stated that they received their job descriptions before their interviews.
There must however be some explanation for the seemingly substantial level of
inconsistency among reports from the two levels, employers and employees. It may be
that within some of these organizations persons have failed to consistently carry out the
instructions of the human resource practitioners, or some of the practitioners themselves
for one reason or other, were unable to maintain the level of consistency they have
agreed to or have set themselves.
4.27.3 Tests Of Skills And Abilities Important For One’s Job
Employees were asked to state whether in the recruitment process they were tested for
skills and abilities important for their job performance. Table A 4.56, Appendix A
depicts the numbers of persons who had undergone job tests. The table shows that 46%
stated that they were tested. Four percent of them did not state. Those tested,
accounted for 45% each in the public and private sectors alike. Three of the 5
participants representing two trade union organizations also stated that they were tested.

167
4.27.4 Type Of Tests For Skills And Abilities Important For
One’s Job
Of the 46% of participants that were tested, 21% of them received practical tests, while
20% received verbal tests. Five of them were tested both practically and verbally. See.
Table A 4.57, Appendix A. The three trade union employees, who were tested, received
practical tests. Comparatively, a larger proportion of public sector employees were
tested practically than were private sector workers. Those who underwent verbal tests
comprised equal proportions (21% each) of employees in both the public and private
sectors. The five respondents, who were tested both verbally and practically, were
private sector employees.
In summary, it appears that testing was not carried out in the majority of
organizations in the public and private sectors. However it seems to be a common
practice in respect of the trade union organizations, 3 of 5 respondents had such tests.
Earlier analysis in respect of responses from human resource practitioners, confirms the
prevalence of the use of these tests among trade union organizations They reportedly
carried out such a tests “Always”. Apparently the private sector only did “sometimes”.
While in the public sector, equal proportions of one third of the organizations tested
their candidates “Always”, “sometimes” and “Never”.

168
4.27.5 Tests Of Skills And Abilities Not Required For One’s Job And Type
Of Tests
Employees, like the human resource practitioners, were also requested to make
statements about tests of skills and abilities not required for one’s job. Employees were
asked whether they were required to undergo any such tests before they were selected
for their jobs. If they had, they were then asked to state the type of tests they were
required to undergo. Table A 4.58, Appendix A highlights the employees’ responses.
An overall 9 % of employees were tested for skills and abilities not required for their
jobs. These accounted for 21% public sector workers and 5% private sector workers.
Apparently Trade Union employees were not required to undergo tests not directly
related to their jobs.
4.27.6 Type Of Tests For Skills & Abilities Not Required
For One’s Job
Of those tested for skills and abilities not required for their jobs, 44.4% were tested
practically, 33.3% and 22.2% respectively were tested verbally and “verbally and
practically”. Table A 4.59 Appendix A illustrates the employees’ responses. The table
shows that in the public sector 10% were tested practically and 10% verbally; while in
the private sector two percent were tested practically and 3 percent, both practically and
verbally.

169
Further analysis of the number of employees tested for knowledge, skills and
abilities required for job performance against those tested for skills and abilities not
required for one’s job, suggests, that it is not usual for persons to undergo the latter
tests. As discussed in the previous section, regarding the human resource practitioners’
reports of recruitment practices and procedures, most of the tests to which candidates
were subjected, were designed mostly to assess job performance, or to determine
intelligence, special aptitudes or personality. Nevertheless, organizations conducting
tests of any kind would have their reasons for so doing. It would be important that such
organizations inform the candidates about any tests they are required to undergo and the
reasons for such tests.
4.27.7 Medical Certificate/Recommendation as criteria for Job
A cross-tabulation of the sectors by medical certificate and recommendation as criteria
for employment reveals the employees’ responses to the question of whether they were
required to provide medical certificates as criteria for their present job. See table A 4.60
Appendix A for details of the responses.
It appears that a larger proportion of the employees in the public and private
sectors are required to provide recommendations as criteria for their jobs than are they
required to provide medical certificates. The table shows that an overall 36% of
employees were required to provide recommendations when a lower proportion (25%)

170
provided medical certificates. An overall 29% of employees were not required to
provide either of the two, (medical certificate or recommendation).
The research data indicates that a larger proportion (29%) of employees in the
private sector were required to provide medical certificates than were employees in the
public sector. Only 21% of public sector workers provided medical certificates. On the
other hand, a larger proportion (41%) of the employees in the public sector, were
required to provide recommendations than were their counterparts in the private sector.
Only 36% of them provided recommendations.
Employees who were required to provide neither medical certificates nor
recommendations, comprised a larger proportion, (40%) of public sector employees and
23% of private sector workers. With respect to the trade union employees, it appears
that they were not required to provide either of the two documents. The majority, (60%)
of them stated that they were not required to provide either medical certificate or
recommendations. The other 40% of them did not state whether they had to provide
any of the two.

171
4.27.8 Employees receipt of formal orientation; Time in Relation
to Date of Employment; Duration of Employee Orientation
and Orientation Activities
4.27.8.1 Receipt of Formal Orientation
Employees were asked to state whether or not they received formal orientation. If, they
did, they indicated the time of orientation in relation to their date of employment, its
duration and the activities involved. The employees’ responses are indicated in Tables
A4.61, 4.62 Appendix A and Figures B 4.5 (a) and (b) and B 4.6 Appendix B
respectively.
Table A 4.61 Appendix A shows that an overall total of 47% of the employees
had formal orientation. Forty five percent of them stated “No” Those who stated “Yes”,
accounted for 62% in the public sector, 41% in the Private sector and 40% Trade Union.
Approximately 52% in the private sector stated no, 40% Trade Union and 31% Public
sector likewise, did not have formal orientation.
4.27.8.2 Time of Orientation in relation to Date of Employment
Table A 4.62 Appendix A provides the employees responses on the time of orientation
in relation to their date of employment. It is to be noted that of those who received
orientation, 81% received it within 1-3 months; 13% within 4-6 months and 6% at other

172
times. Fifty two percent, 32% and 40% respectively in the public sector, private sector
and trade union, received their orientation within 1-3 months of their date of
employment.
4.27.8.3 Duration of Orientation
The duration of orientation ranged between a few hours and 9 months. Figure B 4.5 (a)
provides a full description of the employees’ orientation period. Some common
occurring periods were as follows: 2 days – 26%, 1 day - 11% and 5 days – 4%. In the
Private Sector, 37% had orientation programs lasting 2days, while 15% experienced 1
day long orientation programs. In the Public sector, 33% experienced 1 – day
orientation while 11% had 2-days long programs. In the Trade Union, 50% experienced
1- day orientation while the other 50% had 3 weeks orientation.
4.27.8.4 Orientation Activities
With respect to orientation activities, Figure B 4.6 Appendix B gives the details.
Approximately 33% in the private sector had familiarization with work or work related
training activities; another 33% received important information about the organization,
including mission, vision, services, practices, including health and safety practices,
rules, etc. In the public sector, 39% were exposed to introduction to work related
activities; another 33% met staff and were exposed to the functions and objectives of

173
the organization. The employees in the Trade Union were given job-related training
(50%) while the orientation program of the other 50% involved meeting staff and
familiarization with objectives of the organization.
4.28 Equitable distribution of employment
In order to achieve equitable distribution of employment, it is necessary to provide the
requisite conditions capable of promoting such distribution. These conditions would
require the institution, implementation and monitoring of relevant policies within
organizations. There must be equal employment opportunity policies and other non-
discrimination policies relating to recruitment, selection and other employment
practices.
As seen in the literature review, above regarding steps to avoid non-
discrimination, equal employment opportunity is provided in a system with good,
consistent and fair human resources policies and procedures. Earlier finding, above,
illustrated the lack of policies and procedures in a substantial proportion of
organizations and entities in Region Four, to guide and address both equal employment
opportunity and discrimination.
Notwithstanding the various inconsistencies in the reports received from
respondents at both management and staff levels in the participating sectors, the results
of this study indicate the existence of various practices equivalent to forms of

174
discrimination within the sector. Respondents attested to the existence of various
practices. Many of these practices, when analysed in the context of equal employment
opportunity and non-discrimination, are equivalent to forms of discrimination within
their organizations.
Analysis of these varied reports, suggests that there has been little concerted
effort within organizations and entities in the participating sectors in region four, to
provide equitable distribution of employment to the different ethnic groups in Guyana,
over the period August 2001 to August 2006.
4.29 Employees’ Comments
Employees were encouraged to make further comments on employment practices within
their organizations. A total of four persons, representing four percent of the sample
made comments as follows:
Private Sector
- Managers are fair; they cooperate with workers for improvement.
- Organization offer employment to qualified persons and pay them compensatory
salaries for their sustenance
- The work is hard.

175
Trade Union
- Remuneration and vacation allowances are good; Organization is presently
working on
pension scheme for staff; workers pay contributions to the National Insurance
Scheme and taxes
4.30 Chapter Summary
This chapter presented the research findings and discussions. It highlighted the results
of the research questions posed, including the current staff levels and ethnicity,
employee intake and exit over the research period, August 2001-August 2006. It
provided a discussion of the socio-demographic characteristics of the respondents. It
also examined organization policies and investigated employment practices procedures
and processes of organizations and entities in public and private sector organizations
and trade unions. The chapter also examined the conditions for equitable distribution of
employment.
5. Conclusions and Recommendations
5.1 Conclusions
The following conclusions could be drawn from the findings of the study including the
research questions and observations.

176
There seem to be a change in the occupational structure in terms of ethnic
patterns in Region Four, Guyana. Traditionally, more Africans occupied regularly paid
jobs than did their East Indian counterparts, as indicated in the 1996 Human
Development Report. This was particularly the case in the public sector. The 1996
report shows that Africans occupied 11% more regularly paid positions than did East
Indians. However, the present research suggests a decrease in that gap in Region Four
by 6.4%. This indicates that East Indians now hold only 4.6% less regularly salaried
jobs in Region Four, than their African counterparts.
It is notable however, that although Africans still occupy a larger proportion of
public sector jobs in Region Four, the majority of their East Indian counterparts occupy
the highest positions within the sector, being the Senior, Middle and First Level
positions. Eighty three percent of East Indians occupy these positions compared to 53%
of Africans in the sector. A substantial proportion of Africans occupy the Ancillary
positions. They hold 47% at the Ancillary level, compared to the East Indians who hold
only 17% of jobs at this level, being 30% less than Africans.
Africans hold the majority of positions in the Private Sector in Region Four.
Larger proportions of Africans also hold the highest level positions in this sector. They
occupy larger proportions of the Senior, Middle and First levels compared to their East
Indian Counterparts, while the reverse is true for the East Indians in this sector. The

177
majority (62%) of the East Indians hold Ancillary positions compared to Africans who
hold 10% less positions at the Ancillary level.
It appears that the ability of the public sector to attract employees continues to
decrease rapidly while the private sector continues to increase its capacity.
Some organizations in Region Four may be slow to adapt and implement new
employment policies and practices and probably to keep abreast with developments that
are beneficial for their existence. The majority of organizations do have in place
traditional policies specifically those relating to recruitment, promotion, appraisals
transfers and termination. However, many lack policies to address non-discrimination
and Equal Employment Opportunity
Organizations also have traditional-type procedures, particularly, those for
addressing reports of disciplinary matters, grievances, absence due to sickness and
other reasons, pregnancy benefits and exit notices. However the organizations in this
region, lack procedures for addressing complaints of discrimination.
It appears that generally employees in the participating organizations have
cordial relationships and would generally socialize. They are also generally
appreciative of the employment practices within their organizations. There seem
however to exist some discrimination, though perhaps not widespread. Race/ethnicity,
as recognized by employees, seems to be more prevalent. It appears that discriminatory

178
practices exist to a larger extent in the private sector, than in the public, and seemingly
non-existent in trade union organizations.
The study indicates that there may be a substantial level of unemployment
among the under-20 youths, or perhaps more youths are going off to higher institutions
of learning before entering the field of work.
Various levels of inconsistencies have been noted, both within organizations and
sectors regarding various practices, indicating a lack of dissemination of information
within organizations and networking among organizations and sectors.
There might be a lack of awareness of the importance of research or a phobia
among some organizations in Region Four, which if addressed would be highly
beneficial to all employment sectors within the region.
5.2 Recommendations Based on the major issues identified in the study of employment practices in region
four, the following recommendations are forwarded.
An active employment monitoring commission should be established to monitor
employment policies and practices within organizations, in both public and
private sectors, not excluding the Trade Unions. This commission should
develop a proactive equity plan for all employment sectors. This commission

179
should work closely with the Ethnic Relations Commission to address all claims
of ethnic and gender discrimination in the workplace.
The employment monitoring commission should consist of suitably qualified
staff including equity officers to conduct on going education programmes for
employers and employees on good employment practices and Human Rights
Education.
All employers and employees should be made aware of all existing national
Anti-discrimination Acts and Laws within the country.
Organizations introduce a substantial and well structured staff orientation
programme which comprises, not only staff introductions and task related
activities, but also strong focused discussions on employment practices and
policies of non-discrimination and equal employment opportunity.
All organizations across the sectors adopt Affirmative Action Policies.
Organizations make a special attempt to ensure that interview panels comprise a
measure of racial balance.
Records in all organizations should include data on gender/sex and
race/ethnicity in relation to appointments, promotions and other awards.
All organizations and agencies across the sectors, with the help of Equal
employment Commission take immediate steps to draw up clearly written equal
opportunity programmes relating to recruitment, training and promotion.

180
Firms should include such equal opportunity statements in their recruitment
literature.
All managers should undertake to meet equal opportunity objectives.
Internal systems should be established to periodically monitor and review the
implementation of equal employment policies and practices within
organizations, in order to identify and take necessary remedial steps to address
any inconsistencies.
There needs to be extensive national debate on those aspects of the society
which support and encourage divisions on the basis of characteristics such as
gender, race, disability, etc. of which mention has been made in this study.
These must be carried out in a constructive manner aimed at helping to promote
a better understanding of how they have come about and what supports their
continued existence.
Organizations should carry out regular updating of their employment records
and with the help of the Equal Employment Commission, employers conduct
periodical data collection and analyses regarding their employment practices.
These analyses should form part of an annual report that is disseminated within
the public and private sectors and among trade unions.

181
Develop a culture of research within the society so that employers and
employees countrywide, at all levels would understand the importance of
research and why it is necessary to cooperate with researchers.

210
Appendix 4 A
Table A 4.1
Existence Of Policies Addressing Recruitment
SECTOR
RESPONSES
YES NO
TOTAL
Freq. % Freq. % Freq. % Public 2 67 1 33 3 30
Private 5 83 1 17 6 60
Trade Union
1 100 0 0 1 10
Total 8 80 2 20 10 100

211
Table A 4.2 Existence Of Policies To Address Equal Employment Opportunity
Category of Sector
Responses
Yes No Total
Freq. % of Total Freq.
% of Total Freq. %
Public sector 1 33% 2 67% 3 30% Private sector 3 50% 3 50% 6 60% Trade union 1 100% 0 0% 1 10% Total 5 50% 5 50% 10 100%

212
Table A 4.3
Existence Of Policies Addressing Non-Discrimination
SECTOR
YES
NO
TOTAL
Freq. % Freq. % Freq. % Public 2 67 1 33 3 30
Private e 3 50 3 50 6 60
Trade Union
1 100 0 0 1 10
Total 6 60 4 40 10 100

213
Table A 4.4
Existence Of Policies Addressing Promotion
SECTOR
RESPONSES
YES NO
TOTAL
Freq. % Freq. % Freq. % Public 3 100 0 0 3 30
Private 5 83 1 17 6 60
Trade Union
1 100 0 0 1 10
Total 9 90 1 10 10 100

214
Table A 4. 5 Existence Of Transfer Policies
Category of Sectors
Responses
Yes No Total
Freq. % of Total Freq.
% of Total Freq. %
Public sector 2 67% 1 33% 3 30% Private sector 4 67% 2 33% 6 60% Trade union 1 100% 0 0% 1 10% Total 7 70% 3 30% 10 100% Table A 4.6 Existence Of Policies To Carry Out Appraisals
Category of Sector
Responses
Yes No Total
Freq. % of Total Freq.
% of Total Freq. %
Public sector 2 67% 1 33% 3 30% Private sector 5 83% 1 17% 6 60% Trade union 1 100% 0 0% 1 10% Total 8 80% 2 20% 10 100%

215
Table A 4.7
Policies Addressing Termination
Category of Sector
Responses
Yes No Total
Freq. % of Total Freq.
% of Total Freq. %
Public sector 2 67% 1 33% 3 30% Private sector 4 67% 2 33% 6 60% Trade union 1 100% 0 0% 1 10% Total 7 70% 3 30% 10 100%

216
Table A 4.8 Extent To Which Policies Are Followed As A Guide To Organisation's Recruitment And Promotional Practices
Category of Sectors
Responses
Often Very Often Seldom Not
Applicable Not Stated Tota
Freq. % of Total Freq.
% of Total Freq.
% of Total Freq.
% of Total Freq.
% of Total Freq.
Public sector 0 0% 1 33% 1 33% 0 0% 1 33% 3 Private sector 2 33% 2 33% 1 17% 1 17% 0 0% 6 Trade union 0 0% 1 100% 0 0% 0 0% 0 0% 1 Total 2 20% 4 40% 2 20% 1 10% 1 10% 10 1

217
Table A 4.9 Complaints Of Denial Of Favorable Career Move Due To Age, Race Religion, Marital Status And Disability -- By Sectors
Characteristics Private Sector
Yes No Sector Total Freq. % Freq. %
Age 0 0% 6 100% 6 Race 0 0% 6 100% 6 Religion 0 0% 6 100% 6 Marital status 0 0% 6 100% 6 Disability 0 0% 6 100% 6
Public Sector Age 0 0% 3 100% 3 Race 0 0% 3 100% 3 Religion 0 0% 3 100% 3 Marital status 0 0% 3 100% 3 Disability 0 0% 3 100% 3
Trade Union Age 0 0% 1 100% 1 Race 0 0% 1 100% 1 Religion 0 0% 1 100% 1 Marital status 0 0% 1 100% 1 Disability 0 0% 1 100% 1

218
Table A 4.10 Existence Of Procedures For Addressing Various Reports -- Private Sector
Type of Report
Private Sector Yes No Not Stated
Sector Total Freq. % Freq. % Freq. %
Discrimination 1 17% 5 83% 0 0% 6 Disciplinary matters 4 67% 2 33% 0 0% 6 Grievances 5 83% 1 17% 0 0% 6 Absence due to sickness 5 83% 1 17% 0 0% 6 Pregnancy benefits 5 83% 1 17% 0 0% 6 Exit notices 5 83% 1 17% 0 0% 6

219
Table A4.10 (i) Existence Of Procedures For Addressing Various Reports -- Public Sector
Type of Report
Public Sector Yes No Not Stated
Sector TotalFreq. % Freq. % Freq. % Discrimination 0 0% 2 67% 1 33% 3 Disciplinary matters 2 67% 0 0% 1 33% 3 Grievances 1 33% 1 33% 1 33% 3 Absence due to sickness/or other 2 67% 0 0% 1 33% 3 reason Pregnancy benefits 1 33% 1 33% 1 33% 3 Exit notices 1 33% 1 33% 1 33% 3

220
Table A 4.10 (ii) Existence Of Procedures For Addressing Various Reports -- Trade Union
Type of Report
Trade Union Yes No Not Stated
Sector Total Freq. % Freq. % Freq. %
Discrimination 1 100% 0 0% 0 0% 1 Disciplinary matters 1 100% 0 0% 0 0% 1 Grievances 1 100% 0 0% 0 0% 1 Absence due to sickness 1 100% 0 0% 0 0% 1 Pregnancy benefits 1 100% 0 0% 0 0% 1 Exit notices 1 100% 0 0% 0 0% 1

221
Table A4.11 Employers' Position On Notion That Some Employers Have A Tendency Of Hiring People Of Their Own Race
Category of Sector
Responses
Agree Disagree Strongly Disagree Undecided Total
Freq.
% of Total Freq.
% of Total Freq.
% of Total Freq.
% of Total Freq. %
Public sector 1 33% 0 0% 2 67% 0 0% 3 30% Private sector 1 17% 2 33% 2 33% 1 17% 6 60% Trade union 0 0% 0 0% 1 100% 0 0% 1 10% Total 2 20% 2 20% 5 50% 1 10% 10 100%

222
Table A 4.12 Employers' Position On The Notion That Employers Should Attempt To Employ All Racial Groups
Sectors Agree Disagree Str Agree Undecided Total
Freq % Freq % Freq % Freq % Freq % Public Sector 0 0 1 33 2 67 0 0 3 30 Private Sector 1 17 0 0 3 50 2 33 6 60 Union 0 0 0 0 1 100 0 0 1 10 Totals 1 10 1 10 6 60 2 20 10 100

223
Table A 4.13 Use Of Special Criteria For Placing Applicants
Category of Sectors Responses
Yes No Not Stated Total
Freq. % of Total Freq.
% of Total Freq.
% of Total Freq. %
Public sector 0 0% 2 67% 1 33% 3 30% Private sector 4 67% 2 33% 0 0% 6 60% Trade union 1 100% 0 0% 0 0% 1 10% Total 5 50% 4 40% 1 10% 10 100%

224
Table A4.14 Marital Status As A Requirement For Employment
Category of Sector
Responses
Yes No Not stated Total
Freq. % of Total Freq.
% of Total Freq.
% of Total Freq. %
Public sector 0 0% 3 100% 0 0% 3 30% Private sector 0 0% 6 100% 0 0% 6 60% Trade union 0 0% 1 100% 0 0% 1 10% Total 0 0% 10 100% 0 0% 10 100%

225
Table A 4.15 Gender / Sex As A Requirement For Employment
Category of Sector
Responses
Yes No Total
Freq.
% of Total Freq.
% of Total Freq. %
Public sector 1 33% 2 67% 3 30% Private sector 1 17% 5 83% 6 60% Trade union 0 0% 1 100% 1 10% Total 2 20% 8 80% 10 100%

226
Table A 4.16 Ethnicity As A Requirement For Employment
Category of Sector
Responses
Yes No Total
Freq.
% of Total Freq.
% of Total Freq. %
Public sector 0 0% 3 100% 3 30% Private sector 0 0% 6 100% 6 60% Trade union 0 0% 1 100% 1 10% Total 0 0% 10 100% 10 100%

227
Table A 4.17 Religion As A Requirement For Employment
Category of Sector
Responses
Yes No Total
Freq.
% of Total Freq.
% of Total Freq. %
Public sector 0 0% 3 100% 3 30% Private sector 0 0% 6 100% 6 60% Trade union 0 0% 1 100% 1 10% Total 0 0% 10 100% 10 100%
Table A 4.18 Age As A Requirement For Employment
Category of Sector
Responses
Yes No Total
Freq. % of Total Freq.
% of Total Freq. %
Public sector 2 67% 1 33% 3 30% Private sector 2 33% 4 67% 6 60% Trade union 0 0% 1 100% 1 10% Total 4 40% 6 60% 10 100%

228
Table A 4.19 Assignment Of Post To Persons Based On Characteristics Of Age, Religion, Sex, Ethnicity
Characteristics Private sector Public sector Trade union Total
Freq. % Freq. % Freq. % Freq. % Age always 0 0% 1 33% 0 0% 1 10% at times 0 0% 0 0% 0 0% 0 0% never 6 100% 2 67% 1 100% 9 90% 10 100% Religion always 0 0% 0 0% 0 0% 0 0% at times 0 0% 0 0% 0 0% 0 0% never 6 100% 3 100% 1 100% 10 100% 10 100% Sex always 0 0% 0 0% 0 0% 0 0% at times 0 0% 1 33% 0 0% 1 10% never 6 100% 2 67% 1 100% 9 90% 10 100% Ethnicity always 0 0% 0 0% 0 0% 0 0% at times 0 0% 0 0% 0 0% 0 0% never 6 100% 3 100% 1 100% 10 100% 10 100%

229
Table A 4.20 Types Of Complaints In Public And Private Sector Organisations For The Period August 2001 To August 2006
TYPES OF COMPLAINTS
YEARS 2001-
02 2003-
03 2003-
04 2004-
05 2005-2006 TOTAL
Dismissal or Termination
357 385
242 539
289
1812
Wages & Salaries 294 334 217 435 228
1508 Holiday with pay 146 173 132 331 194 976 Overtime 43 60 50 96 45 294 Severance Pay 61 67 53 105 53 339 Others 53 81 24 0 0 158 Failure of Notice 0 0 37 29 66 Illegal Deduction 0 0 0 10 8 18 Discrimination 0 0 0 4 0 4 Refunds 0 0 0 20 4 24 Conditions of Employment
0 0
0 26
20
46
Suspension 0 0 0 12 9 21

230
Table A 4.21 Procedure Used In Selecting Recruits
Sectors
Responses
Interviews Panel Interviews Interview and Aptitude Test Total
Freq. % of Total Freq.
% of Total Freq.
% of Total Freq. %
Public sector 3 100% 0 0% 0 0% 3 30% Private sector 1 17% 3 50% 2 33% 6 60% Trade union 0 0% 1 100% 0 0% 1 10% Total 4 40% 4 40% 2 20% 10 100%

231
Table A 4.22 Encouragement Of Speculative Job Enquires
Category of Sectors
Responses
Always Never Sometimes Total
Freq. % of Total Freq.
% of Total Freq.
% of Total Freq. %
Public sector 0 0% 1 33% 2 67% 3 30% Private sector 1 17% 3 50% 2 33% 6 60% Trade union 0 0% 0 0% 1 100% 1 10% Total 1 10% 4 40% 5 50% 10 100%

232
Table A 4. 23 Organisation's Use Of Assessment Forms
Category of Sectors
Responses
Yes No Total
Freq.
% of Total Freq.
% of Total Freq. %
Public sector 2 67% 1 33% 3 30% Private sector 5 83% 1 17% 6 60% Trade union 1 100% 0 0% 1 10% Total 8 80% 2 20% 10 100%

233
Table A 4.24 Shortlisting Of Applicants In Recruitment Process Category of Sectors Responses Yes No Total
Freq. % of Total Freq.
% of Total Freq. %
Public sector 3 100% 0 0% 3 30% Private sector 6 100% 0 0% 6 60% Trade union 0 0% 1 100% 1 10% Total 9 90% 1 10% 10 100%

234
Table A 4.25 Use Of Job Descriptions In Recruitment Process
Category of Sectors
Responses
Yes No Total
Freq.
% of Total Freq.
% of Total Freq. %
Public sector 2 67% 1 33% 3 30% Private sector 4 67% 2 33% 6 60% Trade union 1 100% 0 0% 1 10% Total 7 70% 3 30% 10 100%

235
Table A 4.26 Stage At Which Job Description Is Issued
Sectors Responses
Before
Interview At Interview At Selection/ Appointment Other Total
Freq.
% of Total Freq.
% of Total Freq.
% of Total Freq.
% of Total Freq. %
Public sector 2 67% 1 33% 0 0% 0 0% 3 30% Private sector 1 17% 1 17% 2 33% 2 33% 6 60% Trade union 0 0% 0 0% 1 100% 0 0% 1 10% Total 3 30% 2 20% 3 30% 2 20% 10 100%

236
Table A 4.27 Testing For Knowledge, Skills And Abilities Important For Job Performance
Category of Sectors
Responses
Always Never Sometimes Total
Freq. % of Total Freq.
% of Total Freq.
% of Total Freq. %
Public sector 1 33% 1 33% 1 33% 3
30%
Private sector 1 17% 1 17% 4 67% 6
60%
Trade union 1 100 0 0% 0 0% 1
10%
Total 3 30% 2 20% 5 50% 10
100
%

237
Table A4.34 (II) Existence of Procedures for handling Various Types of Reports
Public Sector
Types of Reports YES
NO
Don't Know
Fr. % Fr. % Fr. % Discrimination 3 60% 0 0% 2 40% Discipline 4 80% 0 0% 1 20% Grievances 4 80% 0 0% 1 20% Absence/sickness 4 80% 0 0% 1 20% Pregnancy 2 40% 1 20% 2 40% Exit Notices 3 60% 0 0% 2 40%

238
Table A 4.34 (iii)
Existence of Procedures for handling Various types of Reports
Trade Union
Types of Reports
YES NO
.
Fr. % Fr. % Discrimination 2 100% 0% 0% Discipline 2 100% 0% 0% Grievances 2 100% 0% 0% Absence/Sickness 2 100% 0% 0% Pregnancy 2 100% 0% 0% Exit Notices 2 100% 0% 0%
Table A 4.34 (iv) Existence of Procedures for handling Various Types of Reports
Overall Totals Types of Reports
YES NO
Don't Know
Fr. % Fr. % Fr. % Discrimination 12 52% 2 9% 9 39% Discipline 21 91% 0 0% 2 9% Grievances 15 65% 2 9% 6 26% Absence/Sickness 18 78% 0 0% 5 22% Pregnancy 16 70% 2 9% 5 22% Exit Notices 14 61% 0 0% 9 39%

239
Table A 4. 35
Requirements For The Job – Age, sex, marital status, ethnic group, religion, etc.
Category of Sector
Responses
Age Sex None Other Total
Freq.% of Total Freq.
% of Total Freq.
% of Total Freq.
% of Total Freq. %
Public sector 2 7% 2 7% 22 76% 3 10% 29 29% Private sector 5 8% 1 2% 57 86% 3 5% 66 66% Trade union 0 0% 0 0% 5 100% 0 0% 5 5% Total 7 7% 3 3% 84 84% 6 6% 100 100%
Note: "Other", above Freq.
Public sector: Age and experience 2 - 67%
Qualifications 1 - 33%
Private sector: Experience 1 - 33%
Qualifications 2 - 67%
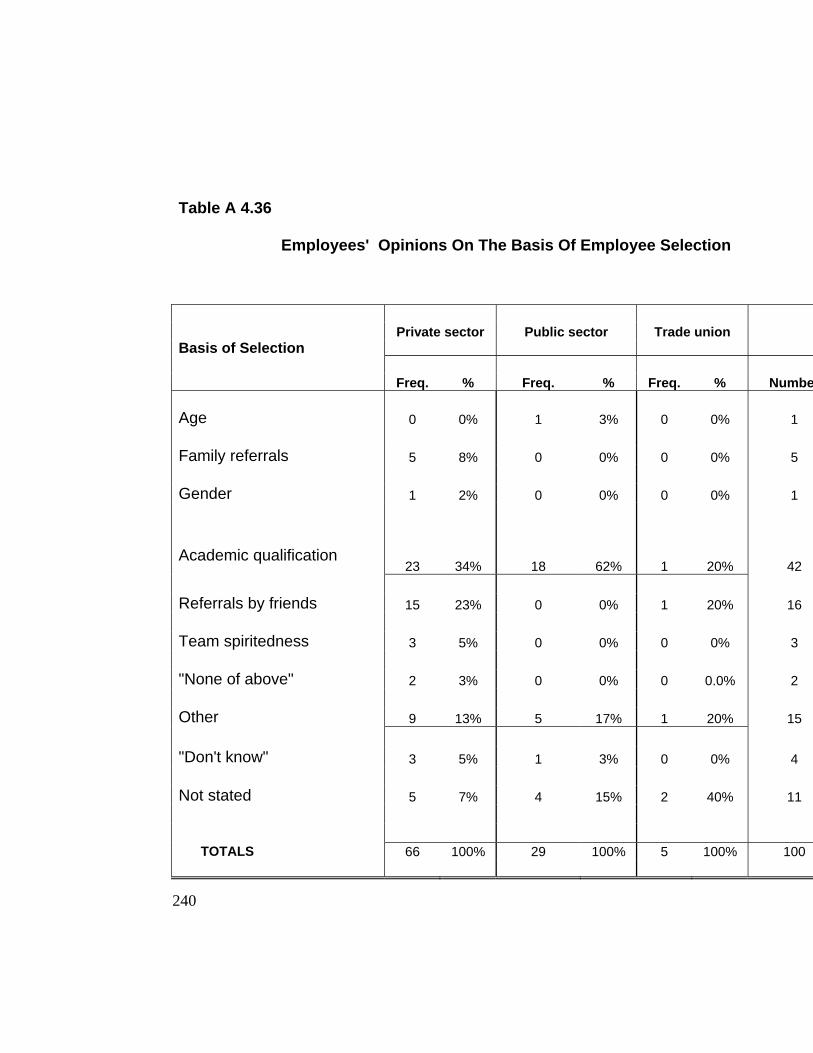
240
Table A 4.36
Employees' Opinions On The Basis Of Employee Selection
Basis of Selection Private sector Public sector Trade union
Freq. % Freq. % Freq. % Numbe Age 0 0% 1 3% 0 0% 1 Family referrals 5 8% 0 0% 0 0% 5 Gender 1 2% 0 0% 0 0% 1
Academic qualification 23 34% 18 62% 1 20% 42
Referrals by friends 15 23% 0 0% 1 20% 16 Team spiritedness 3 5% 0 0% 0 0% 3 "None of above" 2 3% 0 0% 0 0.0% 2 Other 9 13% 5 17% 1 20% 15 "Don't know" 3 5% 1 3% 0 0% 4 Not stated 5 7% 4 15% 2 40% 11 TOTALS 66 100% 29 100% 5 100% 100

241
TABLE A4.38 Employees Socializing with each other
SECTORS YES NO NOT STATED TOTAL
Fr. % Fr. % Fr. % Public 28 97% 0 0% 1 3% 29 Private 61 92% 2 3% 3 5% 66 Trade Union 5 100% 0 0% 0 0% 5
TOTAL 94 94% 2 2% 4 4% 100 Table A 4. 39 Level of Frequency with which Staff socialize
SECTOR Often
Seldom
Very Often
When Needed
Not Stated Total
Fr. % Fr. % Fr. % Fr. % Fr. % Public 12 41% 0 0% 8 28% 7 24% 2 7% 29 Private 23 35% 2 3% 23 35% 14 21% 4 6% 66 Trade Union 2 40% 0 0% 2 40% 1 20% 0 0% 5
TOTAL 37 37% 2 2% 33 33% 22 22% 6 6% 100

242
Table A 4.41
Possible Reasons For Staff Being Overlooked
Private sector Public sector Trade union Total Reasons
Freq. % of Total Freq.
% of Total Freq.
% of Total Freq. %
Gender 1 50% 1 50% 0 0% 2 2% Interpersonal relations 4 80% 1 20% 0 0% 5 5% Seniority 1 50% 1 50% 0 0% 2 2% Union recommendation 2 100% 0 0% 0 0% 2 2% Social background 0 0% 2 100% 0 0% 2 2% Religion 0 0% 0 0% 0 0% 0 0% None of above 7 100% 0 0% 0 0% 7 7% Other 4 100% 0 0% 0 0% 4 4% Not applicable 47 61% 24 32% 5 7% 76 76% Totals 66 66% 29 29% 5 5% 100 100%

243
Table A 4.42 Effects Of Being Overlooked
Private sector Public sector Trade union Total Effects
Freq.
% of Total Freq.
% of Total Freq.
% of Total Freq. %
Loss of commitment 0 0% 1 100% 0 0% 1 1% Lack of initiative 6 100% 0 0% 0 0% 6 6% Poor performance 1 100% 0 0% 0 0% 1 1% Alienation 2 67% 1 33% 0 0% 3 3% Absenteeism 0 0% 1 100% 0 0% 1 1% Other employment 2 50% 2 50% 0 0% 4 4% Not stated 8 100% 0 0% 0 0% 8 8% Not applicable 47 66% 24 34% 5 3% 76 76% Totals 66 66% 29 29% 5 5% 100 100%

244
Table A 4.43 Employees opinions of Organization's Employment Practices of recruiting and Selection, Promotional decisions and Cross Training
Sectors Public Sector
Private Sector
Trade Union
Total Response
Recruiting/Selection Fr. % Fr. % Fr. % Fr. % Excellent 9 31% 13 19% 1 20% 23 23 Fair 7 24% 8 12% 1 20% 16 16 Good 10 34% 34 51% 1 20% 45 45 Poor 0 0% 3 4% 0 0% 3 3 Undecided 1 3% 5 9% 1 20% 7 7 Very Poor 0 0% 1 2% 1 20% 2 2 Not Stated 2 8% 2 3% 0 0% 4 4 Total 29 100% 66 100% 5 100% 100 100
Promotional Decision Excellent 5 17% 8 12% 1 20% 14 14 Fair 6 21% 12 18% 1 20% 19 19 Good 10 35% 20 30% 1 20% 31 31 Poor 1 3% 7 11% 0 0% 8 8 Undecided 2 7% 12 18% 1 20% 15 15 Very Poor 1 4% 3 5% 1 20% 5 5 Not Stated 4 13% 4 6% 0 0% 8 8 Total 29 100% 66 100% 5 100% 100 100
Cross Training Excellent 6 21% 4 6% 1 20% 11 11 Fair 5 17% 17 26% 1 20% 23 23 Good 8 27% 17 26% 1 20% 26 26 Poor 0 0% 4 6% 0 0% 4 4 Undecided 6 21% 14 21% 1 20% 21 21 Very Poor 0 0% 2 3% 1 20% 3 3 Not Stated 4 14% 8 12% 0 0% 12 12 Total 29 100% 66 100% 5 100% 100 100

245
Table A 4.44 Employees Opinion of whether their organization's Employment Practices are Fair
SECTOR YES NO NOT STATED TOTALS
Fr. % Fr. % Fr. % Public 24 83% 1 3% 4 14% 29 Private 51 77% 6 9% 9 14% 66
Trade Union 3 60% 1 20% 1 20% 5
TOTAL 78 78% 8 8% 14 14% 100% Table A 4.45 Employment Practices Stimulate Employees to remain SECTORS YES NO NOT STATED TOTAL Fr. % Fr. % Fr. % Public 16 55.1% 1 3.4% 12 41.4% 29 Private 44 67% 10 15% 12 18% 66 Trade Union 2 40% 1 20% 2 40% 5
TOTALS 62 62% 12 12% 26 26% 100

246
Table A 4.46 Whether Employees are happy with progress so far
SECTORS YES NO NOT
STATED TOTALS Fr. % Fr. % Fr. % Public 23 79% 0 0% 6 21% 29 Private 50 76% 7 11% 9 14% 66 Trade Union 2 40% 3 60% 0 0% 5
TOTALS 75 75% 10 10% 15 15% 100
Table A 4.47 Employees Feeling about their Present situation
SECTORS Good Not Good Very Good
Not Stated Totals
Fr. % Fr. % Fr. % Fr. % Public 13 45% 1 3% 13 45% 2 7% 29 Private 30 45% 13 20% 23 35% 0 0% 66 Trade Union 4 80% 0 0% 1 20% 0 0% 5
TOTALS 47 47% 14 14% 37 37% 2 2% 100 Table A 4.48 Whether Employees are happy about Present Treatment
SECTORS YES NO NOT STATED TOTALS
Fr. % Fr. % Fr. % Public 23 79% 2 7% 4 14% 29 Private 57 86% 9 14% 0 0% 66 Trade Union 2 60% 3 40% 0 0% 5
TOTALS 82 82% 14 14% 4 14% 100

247
Table A 4. 49 Opportunity For transfer SECTORS YES NO NOT STATED TOTALS Fr. % Fr. % Fr. % Public 5 17% 22 76% 2 7% 29 Private 19 29% 42 64% 5 8% 66 Trade Union 1 20% 4 80% 0 0% 5
TOTALS 25 25% 68 68% 7 7% 100

248
Table A 4.53 Employees Recruitment Experience
Public Sector Private Sector Trade Union Total Methods
Freq.
% of Total Freq.
% of Total Freq.
% of Total Freq. %
Media advertisement 9 60% 6 40% 0 0% 15 15% Internal advertisement 3 43% 4 57% 0 0% 7 7% Promotion 0 0% 10 100% 0 0% 10 10% Recommendation 8 40% 12 60% 0 0% 20 20% Referrals 2 50% 1 25% 1 25% 4 4% Resume 0 0% 17 100% 0 0% 17 17% Selection 1 16.7% 4 66.6% 1 16.7% 6 6% Walk-ins 3 17.6% 11 64.8% 3 17.6% 17 17% Other 0 0% 1 100% 0 0% 1 1% Not stated 3 100% 0 0% 0 0% 3 3% Totals 29 29% 66 66% 5 5% 100 100%

249
Table A 4.54 Receipt Of Job Description
Sectors Responses
Yes No Not Stated Total
Freq. % of Total Freq.
% of Total Freq.
% of Total Freq. %
Public sector 22 76% 6 21% 1 3% 29 29% Private sector 52 79% 14 21% 0 0% 66 66% Trade union 4 80% 1 20% 0 0% 5 5% Total 78 78% 21 21% 1 1% 100 100%
Table A4. 55
Stage At Which Job Description Was Received Sector At
Interview At
Selection Before
Interview Other Not
Stated Total % of
Total
Fr. % Fr. % Fr. % Fr.
% Fr.
% Fr.
Private 18 34.6 26 50 6 11.5 1 1.9 1 1.9 52 79 Public 7 32 7 32 5 22 1 5 2 9 22 76
Trade Union
2 50 1 25 1 25 0 0 0 0 4 80
Total 27 34 34 44 12 15 2 3 3 4 78

250
Table A 4.56
Tests Of Skills And Abilities Important For The Job
Category of Sector
Responses
Yes No Not Stated Total
Freq. % of Total Freq.
% of Total Freq.
% of Total Freq. %
Public sector 13 45% 15 52% 1 3% 29 29% Private sector 30 45% 33 50% 3 5% 66 66% Trade union 3 60% 2 40% 0 0% 5 5% Total 46 46% 50 50% 4 4% 100 100%

251
Table A4.57
Tests Of Skills And Abilities Not Required For The Job
Category of Sector
Responses Yes No Not Stated Total
Freq. % of Total Freq.
% of Total Freq.
% of Total Freq. %
Public sector 6 21% 21 72% 2 7% 29 29% Private sector 3 5% 49 74% 14 21% 66 66% Trade union 0 0% 4 80% 1 20% 5 5% Total 9 9% 74 74% 17 17% 100 100%

252
Table A 4.58 Type Of Tests For Skills & Abilities Important For The Job
Category of Sector
Responses
Practically Verbally Practically &
Verbally Not
Applicable Total
Freq. % of Total Freq.
% of Total Freq.
% of Total Freq.
% of Total Freq. %
Public sector 7 24% 6 21% 0 0% 16 55% 29 29% Private sector 11 17% 14 21% 5 8% 36 55% 66 66% Trade union 3 60% 0 0% 0 0% 2 40% 5 5% Total 21 21% 20 20% 5 5% 54 54% 100 100%

253
Table A 4.59 Type Of Tests For Skills & Abilities Not Required For The Job
Category of Sector
Responses
Practically Verbally Practically & Verbally
Not Applicable Total
Freq. % of Total Freq.
% of Total Freq.
% of Total Freq.
% of Total Freq. %
Public sector 3 10% 3 10% 0 0% 23 79% 29 29% Private sector 1 2% 0 0% 2 3% 63 95% 66 66% Trade union 0 0% 0 0% 0 0% 5 100% 5 5% Total 4 4% 3 3% 2 2% 91 91% 100 100%
TABLE A 4. 61 Employees Receipt of Formal Orientation
SECTORS YES NO NOT STATED TOTAL
Fr. % Fr. % Fr. % Private 27 40.9% 34 51.5% 5 7.6% 66 Public 18 62% 9 31% 2 7% 29 Union 2 40% 2 40% 1 5% 5 TOTAL 47 47% 45 45% 8 8% 100

254
TABLE A 4. 62
Time of Orientation in relation to Date of Employment
SECTORS 1-3 Months
4-6 Months Other Not Applicable TOTAL
Fr. % Fr. % Fr. % Fr. % Public 15 52% 1 3% 2 7% 11 38% 29 Private 21 32% 5 7.5% 1 1.5% 39 59% 66 Union 2 40% 0 0% 0 0% 3 60% 5
TOTAL 38 38% 6 6% 3 3% 53 53% 100

255
APPENDIX B Figure B 4.3 - Type of Discrimination Sector
Response
Public
Not Stated - 1 (33.3%) Not applicable
Private
Race 1 (33.3%) Junior staff left because he felt he was being discriminated against - 1 (33.3%)
Trade Union
Not Stated Not Applicable
Figure B 4.4 Reasons for Unhappiness with Treatment Sector
Response
Public
Not Stated 1 (100%)
Private
Highly qualified and yet offered entry position - 1 (10%) Seniors take advantage of their position - 1 (10%) Not stated - 8 (80%)
Trade Union
Not Stated – 2 (100%)

256
Figure B 4. Reason for Unhappiness With Progress Sector
Response
Public
Not Stated
Private
Stick to lower position/denied promotion
Trade Union
Not Stated – 2 (67%) Development can be much faster with more guidance and support from senior females – 1 33%
Figure B 4.5 (a) - Duration of Employee Orientation Private Sector
Public Sector
Trade Union
Fr. % Fr. % Fr. % 1 Day 4 13% Few Hours 1 1 Week 1 50% 2 Days 10 35% 1 Day 6 34% 3 Weeks 1 50% 5 Days 2 8% 2 Days 2 12% 2Weeks 3 12% 3 Days 1 6% 6 Weeks 1 4% 4 Days 1 6% 2 Mths 1 4% 5 Days 2 12% 3 Mths 3 12% 1 Week 2 12% 6 Mths 2 8% 15 Days 1 6% 9 Mths 1 4% 3 Mths 1 6% 1-3 Mths 1 6%

257
TOTAL 27 100 18 100 2 100% Figure B 4.5 (b) - Overall Results Duration of Employee Orientation Fr. % Few Hours 1 2% 1 Day 10 22% 2 Days 12 25% 3 days 1 2% 4 Days 1 2% 5 days 4 10% 1 week 3 6% 2 Weeks 3 6% 3 Weeks 1 2% 15 Days 1 2% 6 Weeks 1 2% 2 Months 1 2% 3 Months 4 8% 1-3 Months 1 2% 6 Months 2 4% 9 Months 1 3% Total 47 100%

258
Figure B 4.6 - Orientation Activities Private Sector
Fr.
%
All the necessary basics 1
3
Acquaintances/interaction with other staff members, meeting with key individuals
5
19
Familiarization with work/work related Training activities
9
33
Important information about organization and its operation services/practices including health & safety, rules etc.
9
33
Management training, gender issues, If security etc.
1
3
Not stated 2 9 TOTAL 27 100% Public Sector
Training, gender issues, If training security 1 6% Meeting staff and exposure to Function/objectives of the organization
6 33%
Introduction to work activities 7 38% Further discussion about self in relation to the job 1 6%
Not stated 3 17%
TOTAL 18 100% Trade Union
Job related training 1 50%
Meeting staff – familiarization with objectives of The organization
1 50%

259
TOTAL 2 100%
Bibliography
Anderson, G. (1995). Fundamentals of Educational Research. Hants, UK: Falmer Press,
Hampshire, UK. Bristol, USA.
Augier, F.R., S.C. Gordon, D.G. Hall, & M. Reckord (1965). The Making of the West
Indies, London, Longmans, Green and Co. Ltd. London.
Barnett, V. (1997). Sample Survey – Principles and Methods. Arnold Publishers,
London.
Burns, Robert, B. (2000). Introduction to Research Methods. London: Sage, 4th edn.
London
Casssell, Catherine, Sara Nadin, Melanie Gray and Chriss Clegg (2002). Exploring
human resource management practices in small and medium sized enterprises.
UK: University of Sheffield. www.emeraldinsight.com.researchregisters.
Centre for Ethnic Studies. (1993). Employment Practices in the Public and Private
Sectors in Trinidad and Tobago. Trinidad. University of the West Indies.
City Clerk. City of Toronto Employment Equity Policy. (2000). Toronto, Canada.
Council of City of Toronto.
Draper, Gordon, M. (2001). Public Management and Transparency. Civil Service. The
Civil Service in Latin America and the Caribbean – Situation and Future Challenges:
The Caribbean Perspective. Inter-American Development Bank

260
Fink, A. (1995). The Survey Kit 6 – How to Sample in Surveys. California. Sage
Publications, Inc.
Flippo, Edwin, B. (1997). Principles of personnel Management. Second Edn. New
York. Mc Graw-Hill Book Company.
Giddens, A. (1995). Sociology. Oxford, UK: Polity Press and Blackwell Publishers Ltd.
Government of Guyana Website. Untitled Document – Extracted from GOG. Public
Service Reform.
Gray, D. (2004). Equal Employment Opportunity. James Cook University, Internet.
Industrial society. Seventh Edn. (1989). Notes for Managers – Guide to Employment
Practices. London: Industrial Society Press.
Loughlin, Sue. (1999). Barriers to Women’s Career Progression: A Review of
Literature. New Zealand. www.ssc.govt.nz
Marcus, M. and A. Ducklin (1988) Success in Sociology. London: John Murray. John
Murray Publishers Ltd., London.
Marshall, G. (1996). Oxford Concise Dictionary of Sociology. Oxford.University Press.
Mathis, Robert L. & John H. Jackson. (1982). Personnel – Contemporary Perspectives
and Applications, (Third Edn.). West Publishing Company, Minnesota, USA.
Mondy, R. Wayne, and Robert M. Noe, III, etal (1990) Human Resource Management
Allyn & Bacon, USA
Rees, Ruth (2000). International Electronic Journal for Leadership in Learning. Vol.
4:12 London: www.acs.ucalgary.ca/~iejll
Reitz,Geffrey, G. and Nan Weiner. (n.d.). Employment Equity: Policies, Programs and
Practices for Aboriginal Peoples and Visible Minorities. Internet.
www.hrsdc.gc.ca

261
Scarpello, V.G. & James Ledvinka (1988). Personnel/Human Resource Management –
Environments and Functions. PWS-Kent Publishing Company.
Storey, John (Ed). (1989). New Perspectives on Human Resource Management,
London: Routledge.
Taylor, S.J. and R. Bogdan (1998). Introduction to Qualitative Research Methods A
Guidebook and Resource. 3rd edn. New York. John Wiley & Sons, Inc.
Tennassee, Paul, Nehru. (n.d.) Emergence of the Caribbean Labour Movement.
Caribbean Institute for Social Formation (CARISFORM) Caribbean Labour
Series. No:3.
The Cooperative Bank – UK (n.d.). Recruitment Policy. Internet.
www.cooperativebank.co.uk.
The Private Sector Commission of Guyana, Ltd. (2005). Annual Report. Georgetown
Guyana.
The Republic of Guyana. (2002). Guyana Population and Housing Census, 2002.
Guyana: Bureau of Statistics.
Thomas, C.Y. (1988). The Poor and the Powerless – Economic Policy and Change in
the Caribbean. London, Latin America Bureau (Research and Action) Ltd.
Kochan, Thomas, A and Baroccin Thomas A. (1985). Human Resouce Management
and Industrial Relations – Text – Readings and Cases. Little Brown & Company,
Canada.USA.
Tourism & Hospitality Association of Guyana, (2005). Explore Guyana, Georgetown,
Guyana.
UNDP (1996). Guyana Human Development Report. Government of Guyana &
UNDP, Georgetown, Guyana.

262
UNESCO; UDHR. (2001). United to Combat Racism. France. UNESCO.

263

APPENDICES Appendix 1
ETHNIC RELATIONS COMMISSION
EMPLOYER QUESTIONNAIRE
An Investigation and review of employment practices in the public and private sectors situate in Region Four, Guyana.
The investigation and review of employment practices in the public and private sectors in Region 4, Guyana is being carried out in order to influence the Ethnic Relations Commission mandate and consequently guide the Government of Guyana in fulfilling its recognized need, to build social cohesion in the country as a component of its program of good governance. Your participation as a stakeholder in this exercise is likely to result in the government’s achievement of its goal and in creating a better Guyana for all its peoples.
1.
What is your Job title?...............................................................................................................
2. What is the name of your organization?....................................................................................
3. Which of the following best describes your organization? 1. Public Sector 2. Private Sector 3. Para-statal
4.
PRACTICES:
Which 3 from among the recruitment methods listed below are used by your Organization?
(Rank 1,2,3 In order of frequency used e.g. 1-most frequently used, etc)

1. Media advertisement 6. Word of mouth/referrals
2. Recommendations 7. Resumes
3. Internal advertisement 8. Selection from specific
institutions/program.
4. Family members/friends 9. Other (specify)……………………
5. Walk-ins 5
Does your Organization issue job descriptions when recruiting prospective workers?
1. Yes 2. No
6
If Yes, at what stage? 1. Before the Interview 2. At the Interview 3. At selection/Appointment 4 Other (specify)……………….…………………………………………………………………………………
7
Does your Organization/ make reference to any of the following as a requirement for the job available?
a) Age 1. Yes 2. No b) Sex (male/female) 1. Yes 2. No c) Ethnic group 1. Yes 2. No d) Religion 1. Yes 2. No e) Marital status 1. Yes 2. No

8
Does your Organization have a Human Resource Department?
1. Yes 2. No
9
If yes, what are the major functions of a) the department? ……………………………………………………………………………………………… ……………………………………………………………………………………………….. (b) If yes, which officers constitute the structure of the Human Resource Department? ………………………………………………………………………………………………….. ………………………………………………………………………………………………….
10
Does your organization have a policy that addresses the following? 1. Equal Employment Opportunity 2. Non-discrimination 3. Recruitment 4. Promotion 5. Transfers 6. Appraisals 7. Termination of Services
11
To what extent is this policy followed as a guide to the Organization in its recruitment, promotion, transfer and termination practices? 1. Very often 2. Often 3. Seldom 4. Not at all 5. Don’t know

12
Is there any officer in the firm with the authority to hire outside the stated Human Resource policy?
1. Yes 2. No
13
If yes, specify …………………………………………………………………………………… ………………………………………………………………………………………………………
14
Are applicants short-listed (i.e. identify suitable applicants) as a practice in recruiting staff? 1. Yes 2. No if no, skip to question 19
15
How is this done? 1. Fill Application form 2. Panel interview 3. Oral/written test 4. Other (specify) ………………………………………………………………
16
Which of the following procedures does your Organization employ in selecting recruits? 1. Interviews 3. Interview & aptitude test
2. Panel interview 4. Other (specify) …………………………………

17
If interviews, are there any special criteria (e.g. Medical certificate, recommendation from last employer) that your organization applies in placing applicants after interviews? 1. Yes 2. No If no, state reason…………………………………………………. If yes, specify……………………………………………………………………………….
18
Does your organization encourage speculative enquiries about employment opportunities? 1. Sometimes 2. Always 3. Never
19
In your recruitment process, do you require applicants to have some educational background that is not directly related to the performance of the job? 1. Sometimes 2. Always 3. Never
20.
Are applicants tested for knowledge, skills or abilities that are important for job performance? 1. Sometimes 2. Always 3. Never
21
Does your Organization use an interview assessment form? 1. Yes 2. No
22
Do you assign certain positions to persons: a) Of certain age groups?

1. Sometimes 2. Always 3. Never b) Of certain religious persuasions? 1, Sometimes 2. Always 3. Never c) Of certain sex (male/female) 1, Sometimes 2. Always 3. Never d) Of certain ethnicity/race 1. Sometimes 2. Always 3. Never
23
Are members of your staff unionized? 1. Yes 2. No 3. Do not know
24
If yes, how many of your staff members are unionized? ………………………….
25
Is any of your management staff currently members of a Trade Union? 1. Yes 2. No 3. Don’t know
26.
If yes, how many? .......................................
27
a) Does your Organization have a transfer policy?(change from one department or Ministry to another department or Ministry at the same grade) 1. Yes 2. No If no skip to question 28.

b) Under what circumstances does transfer in your Organization take place?
1. Staff mobility 2. Poor interpersonal relationships 3. Poor job performance 4. To accommodate staff with special needs 5. Cross training 6. To fill vacancies 7. Cross experience 8. Other (specify)
……………………………………………………………
28
a) Which of the following factors are taken most seriously into account when making promotion decisions within your Organization [note to interviewer: Please rank according to importance using the following codes: 1: VERY IMPORTANT; 2: IMPORTANT; 3: MINOR – FACTOR]
1. Seniority 2. Additional training (e.g., Candidate earning degree, diploma etc.) 3. Performance appraisal 4. Ability 5. Aptitude 6. Attitude 7. Other (specify)
………………………………………………………………………………..
b) Would you take Union recommendations into account when making job promotion decisions? 1. Yes 2. No

29
What is the highest position an employee can be promoted to in your organization? ……………………………………………………………………………………………………
30
Have any of your employees ever complained of being denied a favorable career move (transfer, promotion, nomination for training) on the basis of any of the following? a) Yes No Yes No
1. Age …. ….. 4. Religion ….. ….. 2. Gender ….. ….. 5. Marital status ….. ….. 3. Race ….. ….. 6. Disability ….. ….. Yes, go to (c)
b) If yes, which are the most common complaints?
1. Age 4. Religion 2. Gender 5. Marital status 3. Race 6. Disability
c) If yes, at which of the following occupational levels?
1. Senior officials and managers 2. Middle Level (Admin/Personal
Assistants, Secretaries, etc 3. First Level (Clerks, Typists
Office Assistants, Drivers, etc
4. Ancillary (Cleaners/Maids, Handymen/Gardeners, Farm hands

d) If disability, what type(s)? 1. Visually impaired (blind) 3. Deformity/loss of limbs 2. Hearing impaired (deaf) 4. Other (specify) ………………………………
31
Have any of your employees complained of being discriminated on an any of the following grounds? 1. Pay 2. Marital/Parental 3. Age 4. Bullying 5. Sex/Gender 6. Disability 7. Religion 8. Race/Ethnicity 9. Sexual orientation 10. National Origin 11. None 12. Other (specify)………………………..
32
In a situation where there are two equally qualified persons with comparable job related experience, what criteria would determine final selection for employment in your organization?
1. ……………………………………………………………….……………………………
2. …………………………………….………………………….…………………………..
3. ……………………………………………………………….……………………………
4. ……………………………………………………………..……………………………..
5..…………………………………………………..………………………………………..

33
Does your organization have a procedure (or directives) for handling reports of: a) Discrimination? 1. Yes 2. No b) Disciplinary matters? 1. Yes 2. No c) Grievances? 1. Yes 2. No d) Absence due to sickness or other causes? 1. Yes 2. No e) Pregnancy - to ensure benefits are received? 1. Yes 2. No f) Exit Notice 1. Yes 2. No
34
Of the ethnic groups within your Organization, which group would you say, if any, most displays the following qualities?
Quality African E. Indian Amerindian Mixed Other No Pref. 1. 2. 3. 4. 5. 6.
a) Commands greater respect ….. …….. …….. …… ….. …… b) Held in high esteem ….. …….. …….. …… ….. ……
c) Higher achievers ….. …….. …….. …… ….. …… d) More productive workers ….. …….. …….. …… ….. …… e) Displays more honesty ….. …….. …….. …… ….. …… f) More dedicated ….. …….. …….. …… ….. … … g) Better work attitude ….. …….. …….. …… ….. ……
35
What is your position on the notion that an employer should always attempt to employ all
racial groups once suitably qualified. Do you: 1. Agree 2. Strongly agree 3. Disagree 4. Strongly disagree 5. Undecided

36
What is your position on the belief that some employers may have a tendency to employ people of their own race before considering employing other Races? Do you: 1. Agree 2. Strongly agree 3. Disagree 4. Strongly disagree 5. Undecided
37
Of the ethnic groups within your Organization, which group would you say, if any, most displays the following qualities?
Quality African E. Indian Amerindian Mixed Other No Pref. 1. 2. 3. 4. 5. 6.
a) Productivity ….. …….. …….. …… ….. …… b) Profitability ….. …….. …….. …… ….. …… c) Team spirit ….. …….. …….. …… ….. …… d) Interpersonal relations ….. …….. …….. …… ….. …… e) Competence in the job ….. …….. …….. …… ….. …… f) Loyalty to the org. ….. …….. …….. …… ….. …… g) Overall effectiveness ….. …….. …….. …… ….. …… h) Leadership ….. …….. …….. …… ….. ……
38 How would you rate team work as a factor in your Organization’s success? 1. Important 2. Very important 3. Negligible 4. Undecided
39 What benefits/incentives do employees receive from the organization, financial and otherwise? 1. Gratuity 2. Leave 3. Leave & Leave Grant/Passage 4. Private Health Insurance 5. Trophies/Medals, etc. 6. Training Opportunities 7. Long Term Disability Benefits 8. Pension Scheme 9. Uniform/Clothing Allowance 10. Other, please state…………………………………………………………………………………………………

40
What factors are considered in carrying out employee appraisals within the organization?
1. Performance 4. Race 7. Aptitude 2. Conduct 5. Religion 8. Attitude 3. Age 6. Ability 9. Other, (please specify) ………………………………………………..
41
In your own experience within this organization, what are some of the most common reasons for employees exit from the organization? 1. Dismissal as a consequence of disciplinary action 2. Compulsory retirement 3. Voluntary retirement 4. Retirement or resignation on medical grounds 5. Retirement or removal in the interest of the public 6. Redundancy 7. Other, (please state) …………………………………………………………………………………….
42
As an employer of this organization, when you are of the opinion that you need additional staff, what are the first five steps you take?
1. ……………………………………………………………………………………………… 2. ……………………………………………………………………………………………… 3. ………………………………………………………………………………………………. 4. ………………………………………………………………………………………………. 5. ………………………………………………………………………………………………..

43
What are some of the rules and regulations within the organization with respect to employment, staff relations, behavioral practices, etc that have not been covered in this interview? …………………………………………………………………………………………………………… …………………………………………………………………………………………………………… …………………………………………………………………………………………………………… ……………………………………………………………………………………………………………
44
Would you like to make any further comments on employment practices within your organization? 1. No. 2. Yes
45
If Yes, please state your comments: …………………………………………………………………………………………………………… ………………………………………………………………………………………………………… ………………………………………………………………………………………………………

46
Does your organization have a staff orientation policy? 1. No 2. Yes If yes, how long does your orientation period last? Please state in days, weeks, or months……………………………………………………………………………………….. What does the orientation program entail? Please state………………………………. ……………………………………………………………………………………………………….. ……………………………………………………………………………………………………….. ……………………………………………………………………………………………………….. At what stage does staff orientation take place? Please state
1. Within 1 – 3 months 2. Within 4 – 6 months 3. Other, please state……………….

ETHNIC RELATIONS COMMISSION
EMPLOYEE QUESTIONNAIRE An Investigation and review of employment practices in the public and private sectors, situate in Region # 4, Guyana.
The investigation and review of employment practices in the public and private sectors in Region 4, Guyana is being carried out in order to influence the Ethnic Relations Commission mandate and consequently guide the Government of Guyana in fulfilling its recognized need, to build social cohesion in the country as a component of its program of good governance. Your participation as a stakeholder in this exercise is likely to result in the government’s achievement of its goal and in creating a better Guyana for all its peoples.
1.
Sex 1. Female 2. Male
2. Marital Status: 1. Single 2. Married 3. Divorced/Separated 4. Widowed 5. Common Law
3. Religion:
1. Hindu 2. Muslim 3. Christian 4. Other
4.
Age Group: 1. Under 20 2. 20-34 3. 35-44 4. 45-54 5. 55 and over
5. Length of time employed with Organization …………………

Current position……………………………………………….
6.
How were you recruited to your present job?
1. Applied in response to media advertisement 2. Recommendation 3. Internal Advertisement 4. Promotion 5. Walk-ins 6. Word of mouth/referrals 7. Resumes 8. Selection from specific institutions/program 9. Other, (specify) …………………………………………………………………………..
7.
Did you receive a job description for this position? 1. No 2. Yes
8.
If yes, at what stage?
1. Before interview 2. At Interview 3. At selection/appointment/promotion 4. Other, (specify)…………………………………………………………
9.
Was any of the following a requirement for this job? 1. Age 2. Sex (male/female) 3. Marital Status 4. Ethnic Group 5. Religion 6. None of the above
10.
Which Officer(s) were involved in hiring you for this job? Please select from the following list:

1. Personnel Officer 2. Administrative Manager 3. Personal Assistant 4. Human Resources Manager 5. Secretary 6. Administrative Assistant 7. Other, please state ……………………………………………………….
11.
Have you ever been overlooked for any of the following?
1. Job promotion 2. Training 3. Scholarships 4. Transfers 5. None
12.
If yes, list possible reasons(s):
1. Gender 2. Interpersonal relations 3. Race 4. Seniority 5. Union Recommendation 6. Political Affiliation 7. Social Background 8. Religion 9. Marital Status 10. Combination of above
(Specify)………………………………………………
11. Other, (specify)…………………………………………
13
How has this affected your attitude to your organization?
1. Loss of commitment to the firm 2. Lack of initiative in the job 3. Poor job performance 4. Feeling of alienation 5. Frequent absenteeism from work 6. Seeking other employment

7. Other (specify) ………………………………………………..
14.
Is any of the following used as criteria for staff promotion in this organization?
1. Seniority 2. Additional training (e.g. Candidate earning Diploma, Degree,
etc 3. Performance 4. Ability 5. Aptitude 6. Attitude
7. Other (specify) ……………………………
15.
Are you a member of a workers Union?
1. Yes 2. No
If no, why? …………………………………………………………………….
……………………………………………………………………………………
16.
Are persons from Management also members of the Union?
1. Yes 2. No
If yes, How many? Please state approximate number …………………
17.
Have you ever been transferred? (changed from one department/Ministry
to another department/Ministry)
1. Yes 2. No – Skip to Q 18
If yes, under what circumstances were you transferred
1. Staff mobility 2. Poor interpersonal relationships 3. Poor job performance 4. To accommodate staff with special needs 5. Cross training
6. To fill vacancy 7. Cross experience

8. Other (specify)
………………………………………………………………….
18
Were you required to provide any of the following as criteria for the job?
1. Medical certificate 2. Recommendation from last employer
3. Other, specify ……………………………………………………
19.
Before you were selected to work in this organization, were you tested for any
skills and abilities important for the job?
1. Yes 2. No
If yes, how? 1. Verbally 2. Practically
20.
Before you were selected to work in this organization, were you tested for any
skills and abilities not required for the job?
1. Yes 2. No
If yes, how?
1. Verbally 2. Practically

21. How would you rate your Organization’s overall record with respect to:
(a) Recruiting/selection practices: 1. Very Poor 2. Poor 3. Fair 4. Good
5. Excellent 6. Undecided
.
(b) Promotional decisions: Very Poor 2. Poor 3. Fair 4. Good 5.
Excellent 6. Undecided
.
© Transfer for Cross Training: Very Poor 2. Poor 3. Fair 4. Good 5.
Excellent 6. Undecided
(d) Selection for Training: Very Poor 2. Poor 3. Fair 4. Good 5.
Excellent 6. Undecided
(e) Termination of Services: Very Poor 2. Poor 3. Fair 4. Good 5.
Excellent 6. Undecided
22.
Do employees in your department socialize with each other/ 1. No, skip to question 25 2. Yes
23.
If yes, specify frequency
1. Often 2. Very often

3. Seldom 4. Poor
24.
What are the relations like betweens the various races in this organization? 1. Very good 2. Good 3. Fair 4. Poor
25.
How do you feel about your present situation? 1. Very Good 2. Good 3. Not good at all
26.
Are you happy with
(a) The treatment you are receiving? 1. Yes 2. No If no, please specify……………………………………….
(b) Your progress so far? If no, please specify ………………………………………………………
27.
Does your employer have an anti-discrimination policy with respect to recruitment and other practices in the organization? 1. Yes 2. No 3. Don’t know
5. Before interview

6. At Interview 7. At selection/appointment/promotion 8. Other, (specify)…………………………………………………………
28.
If, yes are there procedures (or directives) for handling reports of a) Discrimination 1. Yes 2. No 3. Don’t know b) Discipline 1. Yes 2. No 3. Don’t know c) Grievances 1. Yes 2. No 3. Don’t know d) Absence due to sickness or other causes 1. Yes 2. No 3. Don’t know e) Pregnancy – to ensure
benefits are received 1. Yes 2. No 3. Don’t know f) Exit Notice 1. Yes 2. No 3. Don’t know
29.
Are you aware of any discriminatory practices in the organization/
1. No 2. Yes If yes, please identify from list below:
1. Pay 2. Marital & Parental 3. Age 4. Bullying 5. Sex/Gender
6. Disability 7. Religious Relations 8. Race/ethnicity 9. Sexual Orientation 10. National Origin Other, (specify)
30.
Did your employer inform you about the Anti-discrimination Act? 1. Yes 2. No
31.
11. Are you aware of anyone previously employed in this organization who left
because he/she felt discriminated against/or was accused of discriminating against a staff member?
Yes (specify) …………………………………………………. No……………………………………………………………..
32. Would you recommend a friend or family member to work for your

organization?
1. Yes 2. No
33..
If yes, why?…………………………………………………………………………
……………………………………………………………………………………..
34.
If no, why?…………………………………………………………………………..
………………………………………………………………………………………..
35.
Would you say that generally, the employment practices of this organization
are: a) Fair 1. Yes 2. No

If yes, why?……………………………………………………………………
………………………………………………………………………………….
If no, why?...............................................................................................
…………………………………………………………………………………..
b) Stimulate you to stay on?
1. Yes 2. No
If yes, why?
…………………………………………………………………………………
……………………………………………………………………………………
36
In your opinion, are the workers employed by your organization selected on the
basis of:
1. Referrals by friends employed in the Organization 2. Displaying team spiritedness 3. Referral by family members 4. Academic qualifications 5. gender 6. Age/experience 7. Specific race 8. Other, please state…………………………………………………………
…………………………………………………………………………………….

37.
Would you like to make any further comments on employment practices within
your organization?
1. No
2. Yes
38.
If yes, please comment
………………………………………………………………………………….
…………………………………………………………………………………..
…………………………………………………………………………………..
39.
Did you receive any form of orientation as an employee in this organization?
1. No 2. Yes
If yes, when were you oriented?
1. Within 1-3 months
2. Within 4-6 months
3. Other, please state……………………………………….
What did your orientation entail? Please state………………………….
……………………………………………………………………………………..
How long did your orientation last? Please state:
………………………………….days
…………………………………weeks
………………………………..months


FORM – EMPLOYMENT RECORD ORGANIZATION CODE………….
No NAME/NO: OF EMPLOYEE
D.O.E. SEX ETHNIC GROUP
DATE OF EXIT
POSITION
REASON FOR EXIT
1. 2 3 4 5 6 7 8 9 10 11 12 13
14 15 16 17 18 19

GRIEVANCE/COMPLAINT FORM
ORGANIZATION CODE………
Name/
Employee No:
Type of Grievance
Year of Grievance
Sex
Race
Outcome