an investigation into the mechanisms, consequences …discovery.ucl.ac.uk/17442/1/17442.pdf ·...
TRANSCRIPT

1
An Investigation Into The Mechanisms, Consequences and Moderators
of Intradialytic Hypotension in Paediatric Haemodialysis
By
Daljit Kaur Hothi
MBBS MRCPCH
Thesis submitted to University College London
for the degree of
Doctor of Medicine (Research)
Institute of Child Health &
Great Ormond Street Hospital for Children
June 2009

2
I, Daljit K Hothi confirm that the work presented in this thesis is my own.
Where information has been derived from other sources, I confirm that this
has been indicated in the thesis.
Daljit K Hothi

3
I would like to dedicate this to my husband Saj
and my mum Pal.
Thank you for both for all your love and unconditional support.

4
Acknowledgements
I would like to thank Christopher McIntyre, Lesley Rees and Jan Marek for not walking
away when I approached you all with this project and agreeing to support this
endeavour. A special thanks to Chris for his endless enthusiasm and drive, Lesley for
helping me maintain focus and perspective and Jan for all things cardiology.
A special thanks also to Denis Geary for his unflagging encouragement and mentorship.
I would like to thank the Dialysis Units at Great Ormond Street Hospital, London and
The Hospital for Sick Children, Toronto as this work would not have been possible
without your support. I am also very grateful to the families who participated in this
project.
Thank you also to the paediatric echocardiography department at Great Ormond Street
Hospital for training me and your relentless support thereafter.
Finally I am indebted to Kids Kidney Research UK for the funding they provided to
support this work.
5
Publications arising from this work
� Blood Volume Monitoring in Pediatric Hemodialysis
DK Hothi, E Harvey, C Goia, D Geary
Pediatric Nephrology 2008; 23:813-820
� Evaluating Methods For Improving Ultrafiltration in Pediatric Hemodialysis
DK Hothi, E Harvey, C Goia, D Geary
Pediatric Nephrology 2008; 23: 631-638
� Pediatric Hemodialysis Prescription, Efficacy, and Outcome
DK Hothi; D Geary
Chapter 57, Pages 867-893
Comprehensive Pediatric Nephrology
Editors: DF Geary; F Schaefer
Mosby Elsevier, Philadelphia
� Pediatric Myocardial Stunning Underscores The Cardiac Toxicity Of
Conventional Hemodialysis Treatments
DK Hothi, L Rees, J Marek, J Burton, CW McIntyre
Clin J Am Soc Nephrol. 2009 Apr;4(4):790-7
� The Value Of Sequential Dialysis, Mannitol And Midodrine In Children Prone
To Dialysis Failure
DK Hothi, E Harvey, C Goia, D Geary
Pediatric Nephrology. 2009 Aug;24(8):1587-91

6
Contributions made to this thesis
Dr Daljit K Hothi designed the studies, recruited the subjects and conducted the trials.
Blood samples were drawn by the dialysis unit staff and then sent by Dr Hothi to the
laboratories affiliated to the hospitals at Great Ormond Street, London or Hospital for
Sick Children, Toronto.
Echocardiograms for the analysis of regional wall motion abnormalities were reviewed
by Dr James Burton for suitability but all the analyses were conducted by Dr Hothi.
Echocardiograms analysed with two-dimensional speckle tracking for peak longitudinal,
radial and circumferential strain were reviewed by Dr Marek for suitability and analysed
by Dr Hothi. Echocardiograms for normal age matched controls were taken by the
echocardiography technicians at Great Ormond Street Hospital and then all the images
were analysed by Dr Hothi.

7
Abstract
The relationship between hypertension and cardiovascular morbidity has long been
recognised. However evidence is mounting implicating hypotension and not
hypertension as the predominant risk factor for mortality. I demonstrated a 20-30%
prevalence of intradialytic symptoms and hypotension in children during conventional,
4 hour haemodialysis (HD) sessions. The declining blood pressure (BP) was originally
believed to be caused by ultrafiltration (UF) and priming of the HD circuit due to loss of
fluid from the intravascular space. However data, largely in adults, challenged this
hypothesis leading to a new consensus that intradialytic hypotension has a multifactorial
aetiology. The uraemic milieu triggers a series of events that alters the cardiovascular
compensatory responses to haemodynamic stresses, however the extent to which these
physiological responses are impaired and their consequences are unknown and poorly
understood.
At first I corroborated adult findings that a poor correlation existed between relative
blood volume changes and intradialytic hypotension in children, supporting the theory
that fluid removal alone was not responsible for cardiovascular decompensation during
HD and this assumption was a gross oversimplification of the underlying problem.
Using a traditional method (endocardial wall motion) and a novel method (Speckle
tracking 2-dimensional strain) I then measured the regional left ventricular (LV)
function in children (aged 2 to 17 years) at the start of dialysis and again during peak
stress at the end of HD. I found rising cardiac troponin I levels in 25% of the cohort and
reduced regional LV function in all the children examined. The level of dysfunction
significantly correlated with actual BP, the degree of intradialytic BP fall and UF
volumes. What remains unclear however is whether the fall in BP was the cause or
effect of the ischaemic cardiac injury. Finally I investigated dialysis methods for
abrogating intradialytic morbidy in children treated with four hour HD sessions. A step
sodium profile from 148mmol/l to 138mmol/l, prophylactic mannitol and sequential
dialysis were successful, to variable degrees in attenuating intradialytic symptoms or
hypotensive episodes. Intradialytic midodrine was exclusively used in one patient
resistant to all other forms of therapy and was found to be the most efficacious in
supporting the BP and preventing hypotension.

8
Table of Contents
Title Page 1
Statement of Declaration 2
Acknowledgements 4
Publications arising from this work 5
Contributions to the thesis 6
Abstract 7
Table of Contents 8-10
List of Figures 11-12
List of Tables 13
Chapter 1 Intradialytic Hypotension: Introduction
1.1 Epidemiology 16-17
1.2 Definition 18
1.3 Pathophysiology 18-22
1.4 Risk Factors
1.4.1 Dialysis related 22-24
1.4.2 Uraemic cardiovascular disease 24-26
1.5 Paediatric Haemodialysis 27-28
1.6 Cardiovascular Response to Haemodynamic Stress 28-30
1.7 Relative Blood Volume Monitoring and Ultrafiltration 31-34
1.8 Myocardial Architecture and Function
1.8.1 Myocardial contraction 35-37
1.8.2 Coronary circulation 37-39
1.8.3 Echocardiography 39-41
1.9 Myocardial Stunning
1.9.1 Definition 41
1.9.2 Evidence for haemodialysis induced myocardial
stunning 41-46
1.9.3 Consequences of myocardial stunning 46-49
1.10 Strategies For Improving Intradialytic Morbidity
1.10.1 Sodium profiling 49-51
1.11.2 UF profiling 52-53

9
1.11.3 Biofeedback 53-54
1.11.4 Sequential dialysis 54
1.11.5 Intradialytic mannitol 54-56
1.11.6 Cooling 56-58
1.11.7 Quotidian haemodialysis 58
Chapter 2 Hypotheses 60-61
Chapter 3 Haemodynamic Response To Paediatric Haemodialysis
3.1 Hypotheses 63
3.2 Introduction 63-64
3.3 Subjects & Methods
3.3.1 Non-invasive continuous haemodynamic monitoring 64-67
3.3.2 Non-invasive blood volume monitoring 67-73
3.4 Results 74-82
3.5 Discussion 83-87
3.6 Study limitations 88-90
3.7 Conclusion 90
Chapter 4 Myocardial Consequences of Haemodialysis
4.1 Hypotheses 92
4.2 Introduction 92-94
4.3 Method
4.3.1 Patients 94-96
4.3.2 Dialysis Prescription 96-97
4.3.3 Regional wall motion assessment 97-100
4.3.4 Speckle tracking two-dimensional strain assessment 100-103
4.4 Results
4.4.1 Regional wall motion assessment 104-112
4.4.2 Speckle tracking two-dimensional strain assessment 113-122
4.5 Discussion 122-128
4.6 Study limitations 128-129
4.7 Conclusion 129-130

10
Chapter 5 Moderators of Intradialytic Morbidity
5.1 Hypotheses 132
5.2 Introduction 132
5.3 Subjects & Methods
5.3.1 Prevalent chronic HD patients 133-140
5.3.1 Children prone to dialysis failure 141-144
5.4 Results
5.4.1 Prevalent chronic HD patients 144-147
5.4.2 Children prone to dialysis failure 148-150
5.5 Discussion 150-155
5.6 Study limitations 155-157
5.7 Conclusion 157
Chapter 6 Thesis Summation 159-162
Chapter 7 Future work 164-166
List of Abbreviations 167-168
References 169-183
Appendices: Publications that have arisen from this work
A: Blood Volume Monitoring in Pediatric Hemodialysis
B: Evaluating Methods For Improving Ultrafiltration in Pediatric Hemodialysis
C: Pediatric Myocardial Stunning Underscores The Cardiac Toxicity Of
Conventional Hemodialysis Treatments
D: The Value Of Sequential Dialysis, Mannitol And Midodrine In Children Prone
To Dialysis Failure.

11
List of Figures
Figure 1.1: Systolic blood pressure (SBP) post dialysis and cardio/cerebrovascular
mortality in haemodialysis patients 17
Figure 1.2: All cause cardiovascular mortality for men and women in the
general population and those on haemodialysis 24
Figure 1.3: Schematic diagram of a haemodialysis circuit 27
Figure 1.4: Examples of relative blood volume curves taken during haemodialysis 33
Figure 1.5: MRI reconstruction of ventricular muscle fibre orientation 35
Figure 1.6: Diagram illustrating the direction of local myocardial fibre arrangement
and resultant deformation 36
Figure 1.7: Coronary circulation 37
Figure 1.8: Left ventricle Segmentation 40
Figure 1.9: Assignment of the 17 myocardial segments to the territories of the left
anterior descending (LAD), right coronary artery (RCA) and the left
circumflex coronary artery (LCX). 40
Figure 1.10: Analysis of regional left ventricular wall motion (RWMA) in one
representative patient during conventional haemodialysis 43
Figure 1.11 Stunned myocardial segments exhibit significantly greater reduction in
myocardial blood flow (MBF) 43
Figure 1.12: Relative change from baseline of the cardiac output (C) and myocardial
blood flow (D) during haemodialysis 45
Figure 1.13: Repeated episodes of transient myocardial ischaemia lead to
maladaptive intracellular changes 47
Figure 1.14: Change in segmental shortening fraction (SF) in haemodialysis
patients followed for 12 months 48
Figure 1.15: Change in ejection fraction (EF) at rest and during HD in patients
with a fixed reduction in segmental function greater than 60% 49
Figure 3.1: Non-invasive continuous haemodynamic monitoring with the finometer 65
Figure 3.2: Modelling flow from measurements of arterial pressure 66
Figure 3.3: UF profiles 71
Figure 3.4: Intradialytic haemodynamic response for Patient 1 74
Figure 3.5: Intradialytic haemodynamic response for Patient 2 75

12
Figure 3.6: Intradialytic haemodynamic response for Patient 3 76
Figure 3.7: Graphical representation of the combined group trend 77
Figure 3.8: Graph of absolute final RBV reduction and intradialytic BP change 78
Figure 3.9: Individual RBV curves with group trends for treatments with and
without complications change 79
Figure 3.10: Empirical ROC for absolute RBV change at the end of the
first hour of HD 81
Figure 3.11: Empirical ROC for absolute RBV change at the end of the
first hour of HD based on the binormal assumption 82
Figure 4.1: Assessment of regional wall motion activity by Echo CMS 98
Figure 4.2: LV segmentation in the long axis (left) and short axis (right) for the
purpose of regional strain measurements 101
Figure 4.3: Two-Dimensional Strain Imaging 102
Figure 4.4: Changes in global and segmental LV function during HD 104
Figure 4.5: Segmental RRWM and hyperkinesis during HD 105
Figure 4.6: Differences in mean segmental percentage SF in those developing
RRWM 106
Figure 4.7: Mean segmental percentage SF in those developing RRWM 106
Figure 4.8: Mean Segmental Percentage Shortening Fraction Relative to Time
On HD 107
Figure 4.9: Serial regional wall motion assessment from Patient 7 during HD 108
Figure 4.10: Serial regional wall motion assessment from Patient 9 during HD 108
Figure 4.11: Figure 4.11: Graph of intradialytic blood pressure change
and LV mean segmental shortening fraction 109
Figure 4.12: Graph illustrating the relationship between Systolic BP change and
UF volume 110
Figure 4.13: Longitudinal time strain curves for patient 7. The top panel is
pre-dialysis and the lower panel post dialysis 118
Figure 4.14: Longitudinal time strain curves for patient 9. The top panel is
pre-dialysis and the lower panel post dialysis 119
Figure 5.1: UF profiles 136
Figure 6.1: Postulated mechanisms behind the evolution of myocardial stunning
and the relationship with intradialytic blood pressure 161

13
List of Tables
Table 1.1: Anatomical blood supply to regions of the heart 38
Table 3.1: Baseline characteristics of patients and their dialytic treatments 69
Table 3.2: Logistic regression of complication free treatments in multivariate
analysis 78
Table 3.3: Differences in average absolute RBV measurements for treatments with
and without complications at intradialytic time intercept 1 hour 80
Table 3.4: Proposed RBV diagnostic tests and the empirical Area Under Curve
(AUC) analysis of their ROC curves 81
Table 3.5: The predictive value of our ROC derived RBV thresholds testing for
treatment complications 82
Table 4.1: Patient Demographics 95
Table 4.2: Biochemical and Haematological Profile 111
Table 4.3: Cardiac Troponin I levels pre and post HD 112
Table 4.4: LV segmental longitudinal strain 115
Table 4.5: LV segmental circumferential strain 116
Table 4.6: LV segmental radial strain 117
Table 4.7: Factors associated with peak longitudinal strain reduction during HD 120
Table 4.8: Factors associated with peak circumferential strain reduction
during HD 120
Table 4.9: Factors associated with peak radial strain reduction during HD 121
Table 4.10: Predictors of intradialytic systolic BP 121
Table 4.11: Predictors of intradialytic systolic BP fall 122
Table 5.1: Baseline characteristics of patients and their dialytic treatments 134
Table 5.2: Children prone to dialysis failure: patient demographics 142
Table 5.3: Comparison of the Percentage Dry Weight Removed 147
Table 5.4: Odds ratios of defined outcomes against each dialytic intervention 147
Table 5.5: Prevalence rates of intradialytic morbidity and achieving the desired
UF goal with intradialytic mannitol and sequential dialysis 148
Table 5.6: Impact of mannitol and sequential dialysis on intradialytic symptoms
and hypotension 149
Table 5.7: Chi-squared analysis of interventions mannitol and sequential
dialysis and outcomes 149

14

15
Chapter One
Introduction: Intradialytic Hypotension

16
1.1 Epidemiology
During haemodialysis (HD) the objective is to remove all the sodium and water that
accumulates in the inter-dialytic period within the few hours of treatment time. The
major barrier to achieving this goal is the development of haemodynamic instability,
manifesting as hypovolaemia related symptoms or intradialytic hypotension. In adults
this occurs on average in 20-30% treatments1 with a resultant risk of under dialysis from
recurrent treatment interruptions and patients remaining volume overloaded. There is a
clear correlation between high blood pressure (BP) and the risk of stroke. Several
observational studies in patients with essential hypertension also describe a “J” shaped
curve between diastolic blood pressure (BP) and mortality2. The same trend has been
described in dialysis patients, with a suggestion that hypertension is associated with
morbidity but mortality is associated with hypotension3. In adults, patients with pre-
dialysis systolic BP less than 110 mmHg have a fourfold increase in the relative risk of
cardiac-related death versus those with a systolic BP between 140 to 149 mmHg. Post
dialysis, patients with systolic BP less than 110 mm Hg had a 2.8-fold increase in
relative risk for a cardiac-related death compared with patients with systolic BP 140 to
149 mmHg4 (see Figure 1.1). The difficulty in dialysis patients is establishing accurate
surrogates of interdialytic BP load. Most commonly BP targets are based solely on pre-
and/or post-dialysis systolic BP measurements, however Agarwal et al have shown a
steady rise in systolic and diastolic BP during the interdialytic period that reaches a
plateau 48 hours after dialysis5. Furthermore both pre- and post-dialysis BP
measurements were found to be inferior to home BP recordings in predicting left
ventricular hypertrophy and mortality6. One could therefore postulate that the negative
association between low BP and adverse outcomes only reflects the use of a poor

17
SBP < 110 mm Hg v 140 -149mmHg,
RR = 2.62,P < 0.01
SBP < 110 mm Hg v 140 -149mmHg,
RR = 2.62,P < 0.01
SBP < 110 mm Hg v 140 -149mmHg,
RR = 2.62,P < 0.01
surrogate marker of afterload or may represent a cohort of patients with cardiac
dysfunction or impaired cardiovascular reserve during times of stress.
Figure 1.1: Systolic blood pressure (SBP) post dialysis and cardio/cerebrovascular mortality in
haemodialysis patients 4
Frequent intradialytic hypotensive episodes have also been implicated in accelerating
decline in residual renal function and precipitaing serious vascular complications such
as cerebral, cardiac and mesenteric ischaemia. The problem is confounded in children as
the ultrafiltration (UF) goal is often higher from liquid nutritional supplements or poor
adherence to fluid restrictions. In addition younger or developmentally delayed children
may not be able to verbalize the evolution of new symptoms and therefore there can be
very little warning of decompensation. This places a greater reliance on monitors and
basic cardiovascular measurements during their treatments.
Systolic BP mmHg
SBP 110-119 v 140-149mmHg, RR= 1.48 (p<0.01)
SBP < 110 mm Hg v 140 -149mmHg,
RR = 2.62 (p< 0.01)
SBP >180 v 140-149mmHg,
RR= 1.06 (p<0.05)

18
1.2 Definition
There is no recognised definition of intradiaytic hypotension in children. Very loosely
the term refers to a drop in BP during dialysis and has been defined by KDOQI as a
decrease in systolic blood pressure by ≥20 mm Hg or a decrease in MAP by 10 mm Hg
associated with symptoms7. The former is such a non-specific, subjective definition and
unsuitable in the research arena. The latter in our opinion is not always relevant in the
paediatric environment. In children the evolution of symptoms can be for a number of
reasons but if a hypertensive patient had a 25mmHg fall in systolic BP that restores their
BP to within the normal range, despite being a clinically a favourable outcome this will
still be categorised as an episode of intradialytic hypotension and thus a negative
dialytic outcome. Therefore at the onset of this work I elected to develop a clinically
valid, objective and reproducible definition relevant to paediatrics.
The first task force on blood pressure control in children is the only group to report age
and gender adjusted 5th percentile systolic blood pressure measurements from the
general population8. For the purpose of this study, I defined intradialytic hypotension as
any BP measurement below the 5th percentile systolic blood pressure measurements as
this is equivalent to a BP below that expected within the normal population. Any
deviation from this is clearly stated in the text.
1.3 Pathophysiology
During dialysis mobilization of fluid from the interstitial to the intravascular space,
venoconstriction of capacitance vessels, increased vascular tone and active increases in
heart rate and contractility preserve circulatory adequacy. As a result even with a UF
19
volume equal to the entire plasma volume the measured blood volume only changes by
10-20%. An impaired compensatory response causes hypotension in the face of total
body water expansion.
Most of the plasma volume resides in the veins, with a marked difference in the venous
capacitance between organs. During UF the ability to mobilize blood from the
splanchnic venous pool is vital for preserving the central blood volume. Venous tone is
affected by vasoactive hormones, sympathetic nervous system and upstream filling
pressures. The De-Jager Krogh phenomenon refers to the transmission of upstream
arterial pressure through the capillaries to the veins causing venous distension and
altered venous capacitance. During arteriolar constriction the distending pressure to the
vein is reduced and blood is extruded centrally towards the heart to maintain cardiac
refilling. Conversely factors that cause arterial dilatation, such as antihypertensives
increase venous capacitance, reduce cardiac filling pressures and through transmission
of increased hydrostatic pressure to the capillary bed inhibit vascular refilling.
Vasoconstriction is mediated by an increase in sympathetic activity. In dialysis patients
this response can be inadequate owing to an increased production of vasodilators or
impaired sympathetic response to hypovolaemia. Adenosine is an endogenous
vasodilator that is released by vascular myocytes and endothelial cells. It is
hypothesized that during a sudden, non-gradual intradialytic hypotension episode,
ischaemia prevails resulting in increased consumption of adenosine triphosphate (ATP)
and generation of adenosine9. This is thought to augment splanchnic blood pooling
through an inhibitory effect on norepinephrine release thus causing regional
vasodilatation, result in arteriolar vasodilatation and depress myocardial contractility. In
20
fact, pretreating hypotensive prone patients with caffeine, an adenosine receptor
antagonist, was shown to lower the number of hypotensive episodes in adults10.
Additional mediators of tone include nitric oxide and asymmetrical dimethyl arginine
(ADMA). During dialysis elevated levels of cytokines such as interleukin 6 and tissue
necrosis factor alpha stimulate synthesis of inducible nitric oxide synthetase within
vascular smooth muscle cells and thus an increased production of nitric oxide, a potent
vasodilator. However the increase in nitric oxide concentration is delayed by hours after
the initial exposure to the cytokines and is also accompanied by the continued removal
of competitive inhibitors of nitric oxide synthetase such as ADMA11 during HD. Such
enhancement of endothelial function hours into dialysis is though to contribute to the
evolution of late onset intradialytic hypotension.
The sympathetic nervous system is the principle control mechanism of arteriolar tone
and therefore of central blood pressure and patients with end stage renal disease (ESRD)
show increased basal level of peripheral sympathetic activity10, 12. In hypotensive prone
patients a paradoxical decrease in sympathetic activity is seen at the time of a
hypotensive episode12 and this results in a rapid decline in the peripheral vascular
resistance and increased vascular bed capacitance. Problems with sympathetic end-
organ responsiveness and the efferent parasympathetic baroreceptor pathway have also
been reported but the underlying mechanism remains unexplained. Some believe this
may be a heightened manifestation of the Bezold-Jarisch reflex, a cardiodepressor reflex
resulting in a sudden loss of sympathetic tone causing abrupt severe hypotension
accompanied by bradycardia. It is postulated that conditions associated with reduced
cardiac refilling pressures such as left ventricular hypertrophy, diastolic dysfunction or

21
structural heart defects stimulate cardiac stretch receptors and thus maladaptively trigger
a variant of the Bezold-Jarisch resulting in hypotension.
The remaining key player and interconnecting component is plasma refilling. This refers
to the movement of fluid from the extravascular to the vascular compartment under the
influences of hydraulic, osmotic and oncotic pressure gradients across the capillary bed.
If UF rates exceed refilling rates the intravascular volume will fall. There is evidence of
increased capillary permeability in the presence of uraemia that encourages movement
of water between the interstitium and intravascular compartments13. Arterial
vasoconstriction decreases hydrostatic pressures on the capillary bed, facilitating
vascular refilling. The oncotic pressure which is effectively the plasma protein
concentration promotes refilling; and plasma sodium and glucose mobilizes fluid from
the intracellular space as a result of increased plasma tonicity14. Plasma haematocrit
level has a positive influence on refilling rates, however during dialysis plasma
haematocrit levels change as early as 15mins secondary to change in posture,
haemodilution caused by redistribution of water from the extra- to the intravascular
space and redistribution of blood from the microcirculation to the central circulation, the
Fahraeus effect15. Finally refilling is facilitated by greater tissue hydration and occurs at
a faster rate when the interstitial space is overloaded.
There are also a number of additional factors that may influence the central blood
pressure during dialysis. Firstly the volume of blood that is required to support the
extracorporeal circuit can be a significant proportion of the effective circulating volume
in the younger patients. Blood and dialyser membrane reactions can result in a
significant inflammatory response and early decompensation, with some evidence

22
suggesting cellulosic membranes to be greater offenders in activating complement and a
number of cytokine systems than synthetic membranes. The choice of anticoagulant can
also influence intradialytic BP with reports of hypotension with regional citrate and
prostanoid anticoagulation compared with heparin and low molecular weight heparins.
In essence we know that hypovolaemia is the trigger for intradialytic hypotension but
the pathophysiology is complex and the current explanation is incomplete. The uraemic
milieu impairs compensatory responses to reduced blood volume with ineffective
venoconstriction, inadequate cardiac refilling, reduced plasma refilling and activation of
the sympaticoinhibitory Bezold–Jarish reflex leading to sudden hypotension. The
literature is dominated by research in adults and the degree to which this can be
extrapolated to paediatrics is unknown. We have anecdotal evidence that children on
conventional HD regimens develop intradialytic hypotension but lack published data on
the prevalence, pathophysiology and consequences of intradialytic hypotension that is
specific to paediatrics
1.4 Risk Factors
1.4.1 Dialysis Related
The dialysate composition can influence cardiovascular stability during HD. Dialysate
sodium generates a crystalloid osmotic pressure and promotes fluid shift between the
different body compartments. Dialysate sodium activity is approximately equal to 97%
of the measured sodium concentration, but varies with changes in dialysate temperature,
pH and the presence of additional ions. In the absence of UF, we can approximate the
concentration of dialysate sodium to achieve isotonic dialysis by correcting the blood
23
sodium measured by direct ionometry for a Donnan factor of 0.967. Hyponatric dialysis
causes osmotic fluid shift from the extracellular to intracellular compartment, dialysis
disequilibrium disorder and intradialytic hypotension. Hypernatric dialysis transfers
sodium to the patient, causing interstitial oedema, interdialytic thirst and increased
interdialytic weight gain but may also achieve short-term dialysis gains by improving
cardiovascular stability.
Hypocalcaemia depresses myocardial contractility and reduced vascular reactivity16 and
thus increases the risk of intradialytic hypotension. Conversely owing to fear of
inducing extra-skeletal calcium deposition, the new K/DOQI guidelines suggest
maintaining plasma calcium levels in the low normal range. Using a dialysate calcium
concentration of 1.25mmol/l permits higher vitamin D and calcium based phosphate
binders in the management of hyperparathyroidism. In a proportion of patients this can
lead to hypocalcaemia17. Low magnesium dialysate baths will encourage the movement
of plasma magnesium molecules across the dialysis membranes. Low plasma
magnesium levels can result in cramping and arrhythmias and higher magnesium baths
may help to improve cardiovascular stability and intradialytic symptoms. Acetate was
originally used as the buffer in dialysate as it was cheap, offered equimolar conversion
to bicarbonate and is bacteriostatic. However high plasma acetate levels result in
vasodilatation, depressed left ventricular function and thus place individuals at risk of
intradialytic hypotension and hypoxaemia particularly in the first hour of dialysis18.
Switching to bicarbonate buffers improves cardiovascular stability.
During fluid removal from the vascular compartment venoconstriction of the splanchnic
and possibly the splenic19 vascular beds, mobilizes blood, forcing it centrally towards

24
the heart to maintain cardiac refilling. If food is consumed during dialysis, blood is
diverted to the splanchnic circulation and patients are susceptible to intradialytic
hypotension.
1.4.2 Uraemic Cardiovascular Disease
The cardiovascular mortality rate of children and young adults on dialysis is extremely
high, at 1000 times greater than age-matched controls20 and greater than adult dialysis
patients.
Figure 1.2: All cause cardiovascular mortality for men and women in the general population and
those on haemodialysis 20
The pathophysiology of uraemic cardiac disease is not fully defined but patients with
ESRD are exposed to a number of traditional and non-traditional cardiovascular risk
factors. Cardiovascular morbidity and mortality was originally thought to be a problem
exclusive to adult dialysis patients however opinions are changing. Children in ESRD
share the full gamut of uraemia related cardiovascular abnormalities as adults but

25
distinct differences exist that may be important in the context of considering
cardiovascular stability during HD.
Children do not share the high prevalence of traditional Framingham risk factors as
adults and neither have they developed significant classical, atheromatous, coronary and
peripheral artery disease. What is unclear however is whether the absence of
macroscopic, atheromatous vasculopathy translates to improved dialysis morbidity over
adults. Theoretically with less advanced cardiovascular disease children should be able
to tolerate larger UF goals without decompensation and tolerate a more aggressive
approach towards UF without running the risk of adverse ischaemic injury. However
there is clear evidence of significant cardiovascular disease in children on dialysis.
Mechanical or haemodynamic overload21, 22 and altered humoral responses23, 24 are
precursors for cardiac remodeling and the development of left ventricular hypertrophy
(LVH). Echocardiogram studies have demonstrated significantly worse diastolic
dysfunction in children on HD and peritoneal dialysis (PD)25-27 compared with those
with mild-to-moderate chronic kidney disease (CKD) or post transplant27, 28 but the
systolic function is preserved. The presence of vascular disease is demonstrated by
reports of reduced vascular compliance29, 30 and recent studies describing transformation
of paediatric vascular smooth muscle cells into osteoblast-like cells with subsequent
calcification of coronary valves, carotid and coronary arteries and increased vessel
intima-media thickness31-33. These vascular abnormalities are accepted markers of
asymptomatic atherosclerosis and predictors of future symptomatic CVD in adults with
CKD34, 35 and although no such data exists in paediatrics it raises a strong suspicion for
a maladaptive cardiovascular system in children.

26
Over and beyond the presence of uraemia, there is a now a growing body of evidence
incriminating HD as an independent contributor to endothelial dysfunction. HD is pro-
inflammatory presumably due to an immune mediated response to non-biocompatible
membranes, blood contact with non-sterile dialysate solution and/or "back-leaking" of
dialysate across the membrane. However the mechanisms by which CRP production is
stimulated still eludes us. More frequent dialysis therapies are associated with improved
CRP levels and other markers of inflammation36, 37 but in contrast during conventional
HD elevated C-reactive protein (CRP) levels correlate with dialysis vintage38. Not only
is CRP a valid marker of cardiovascular impairment and atherosclerosis in ESRD but is
itself thought to pathogenic. It is produced specifically by coronary artery smooth
muscle cells and directly contributes to vascular inflammation and atherosclerosis39..
Finally HD is also associated with changes in blood volume, blood viscosity and
laminar shear stress. This is an environment conducive to disordered endothelial cell
dynamics and function and ischaemic injury.
Cardiovascular disease in paediatric dialysis patients is driven by a variety of factors
different to those in the general population: peripheral vascular changes, calcification,
inflammation and possibly the dialysis procedure itself. However it is difficult to
distinguish what is cause or effect in the evolution of intradialytic hypotension and what
part, if any, repetitive HD induced ischaemic injury plays in the pathogenic process in
children.

27
1.5 Paediatric Haemodialysis
Technically paediatric HD refers to the dialysis of children from birth to 18 years of
age. The basic principles of dialysis are universal but the dialysis prescription has to be
tailor-made for each child and is often adjusted according to the patient’s body surface
area. A conventional paediatric HD schedule consists of four hour treatments, 3 times
per week or three hour treatments, four times per week. Vascular access is achieved
either through a tunneled, indwelling catheter such as a permcath or an arteriovenous
fistula. During infant dialysis if the volume of the extracorporeal circuit volume is
greater than 10% of the estimated total blood volume (TBV) a circuit prime with 5%
albumin or blood is recommended.
Figure 1.3: Schematic diagram of a haemodialysis circuit

28
With increasing blood flow, more solute is delivered to the dialyzer, resulting in higher
dialyser clearance but this clearance advantage starts leveling off at blood flows of 250-
300mls/min and therefore where possible a blood flow rate as close to 300mls/min is
used. In children however the effective blood flow rate is largely determined by the
vascular access and adjusted to achieve a 4-6mls/kg/min urea clearance, approximating
a Kt/V of > 1.2 40, or in infants a minimum of 20mls/min to avoid the risk of clotting the
circuit. The problem with small, high resistance double-lumen central venous catheters
or occasionally single lumen catheters is an increased risk of high recirculation rates
with inadequate dialysis on conventional dialysis regimens. This can be improved by
changing the dialysis time by increasing the frequency or duration of treatment.
As a general rule to maximise effective dialyser clearance the ratio between dialysis
fluid and blood flow should be at least 1.5 to 2 and in children typically dialysis flow
rates of 300-500mls/min are employed, even in infants with low blood flow rates. The
dialysate temperature is most commonly set at a constant temperature of 37˚C.
Bicarbonate is now routinely used as the acid buffer and intravenous heparin
anticoagulates the extracorporeal circuit. With a desired objective of achieving long-
term solute balance the dialysate sodium, magnesium, calcium and potassium
composition can be adjusted in accordance with the patient’s plasma levels.
1.6 Cardiovascular Response to Haemodynamic Stress
During HD both UF and plasma solute clearance induces fluid exchange that ultimately
results in intravascular fluid depletion. This haemodynamic stress triggers a

29
characteristic compensatory response which owing to differences in physiological
maturity is age dependent but is ultimately aimed at restoring circulation adequacy.
In general the cardiac output is predominantly determined by the heart’s loading
conditions. Preload is defined as the ventricular wall tension at the end of diastole and is
largely derived from the circulating blood volume and venous capacitance. The velocity
and power of contraction in single fibres is directly related to fibre length at the
beginning of contraction (The Frank-Starling law). As the preload increases the stroke
volume (SV) increases but there is a limit of preload reserve. Conversely, as is the case
during HD, as the preload decreases the SV decreases. Afterload is the sum of forces
opposing ventricular ejection and the most important component is total peripheral
resistance (TPR) or systemic vascular resistance. SV decreases as afterload increases
but by increasing the contractility of the heart some gain in SV can be achieved. Heart
rate (HR) increases cardiac output but by reducing the time spent in diastole rapid rates
can decrease SV by limiting ventricular filling and reducing coronary arteries perfusion.
As SV increases the myocardial demand for oxygen rises and coronary blood flow must
rise to compensate. Finally in a response to reduced cardiac output, vascular tone is
increased in attempt to preserve the central blood pressure and maintain vital organ
perfusion.
Ventricular compliance is also an important component of cardiac output. Ventricular
filling occurs in two stages, the rapid early filling which is associated with ventricular
relaxation and then the slower later filling that is augmented by atrial contraction. As
ventricular compliance decreases the end-diastolic volume for a given end-diastolic
pressure falls and is in these circumstances the slow phase dominates. An increase in

30
heart rate will accelerate the rate of relaxation and may precipitate a fall in cardiac
output. Similarly ischaemia compromises the rate and extent of relaxation.
Neonates at the time of birth have reduced inotropic and preload reserve and thus their
dominant response to a haemodynamic challenge is tachycardia. The sympathetic
innervation of the neonatal heart is less well developed than the parasympathetic and
thus they have a propensity for reflex bradycardia. Compared with older children any
fall in HR is accompanied by an attenuated vasoconstriction response and
disproportionately larger decreases in cardiac output. Therefore as afterload increases
cardiac output falls but in the reverse as the afterload falls there is a less impressive gain
in output. In infancy and childhood the myocardium adapts progressively and develops
an increased reserve to B adrenergic stimulation.
Stressors such as HD cause intravascular fluid depletion. As the effective circulating
volume falls, the preload, SV and cardiac output would fall. In an attempt to maintain
the central BP one would expect a local hormonal, metabolic and sympathetic stimulus
increases vascular tone and total peripheral resistance. In the presence of arteriolar
constriction the distending pressure to the vein is reduced and blood is extruded
centrally towards the heart to maintain cardiac refilling.
Uraemia is associated with a maladaptive cardiovascular response but what is unknown
in paediatrics is the extent to which the processes described above are abnormal.
31
1.7 Blood Volume Monitoring and Ultrafiltration
On-line non-invasive blood volume monitors (NIVM) make it feasible to indirectly
measure blood volume, both real-time and continuously throughout dialysis. They are
based on the principle of mass conservation: the concentration of measured blood
constituents (haemoglobin/haematocrit/plasma protein) confined to the vascular space,
change in proportion to changes in the vascular volume. It is also assumed that the total
concentration of blood constituent in the circulation is constant with uniform mixing
throughout the vascular space. NIVMs differ by the intrinsic sensing techniques that are
used for monitoring.
Optical: measures the optical absorbance of monochromatic light, via an optoprobe in
the arterial line. The optical density of whole blood is really a measure of red blood cell
(RBC) concentration - the haematocrit, rather than the haemoglobin content. Scattering
of light from the surface of RBC yields a non-linear relationship between the measured
optical density and hematocrit. The Crit-line (In-Line Diagnostics, Riverdale, Utah), a
stand alone device, is however designed to correct for this while the Hemoscan (Hospal-
Dasco, Medolla, Italy) which forms part of the dialysis machine, adjusts for variations
in oxygen saturation.
Blood density: blood density is dependent on the total protein concentration (plasma
protein concentration + mean cellular haemoglobin concentration). The Blood Volume
Monitor (BVM, Fresenius AG, Bad Homburg, Germany) measures the velocity of
sound through blood, by means of a cell inserted in the pre-pump segment of the arterial
line, adjusted for temperature, a factor known to impact on both sound velocity and
blood density.

32
Electrical conductance: conductivity of blood depends on hematocrit, temperature,
plasma electrolytes and non-electrolyte concentrations. The difference of high and low
frequency conductivity has been found to be a measure of hematocrit. The
extracorporeal plasmatic impedance meter (IPEC, Laboratoire Eugedia, Chambly,
France) translates changes in conductivity into relative changes in the plasma volume.
All three devices report results as a percentage relative change of the blood volume
(RBV), and in some, these are displayed graphically. Each device is fitted with
computer software that converts measured changes to percentage RBV based on an
internal calibration reference points. These may differ between machines and therefore
an absolute RBV value on one device may not read the same on another. Schneditz et al
demonstrated a 2% difference in relative blood volume changes (BVM 2% less
reduction in blood volume compared to Crit-line), which developed approximately 1 hr
into dialysis, and persisted thereafter 41.
NIVM measures the change in blood volume as fluid is being removed during UF and
thereby provides additional insight into vascular refilling ability. Theoretically, this
could guide UF rates based on observed RBV changes as demonstrated by the four
relative blood volume (RBV) curves shown in Figure 1.4.

33
-15
-10
-5
0
Time on Dialysis
Rel
ativ
e bl
ood
volu
me
(%)
Pt 1
Pt 2
Pt 3
Pt 4
Figure 1.4: Examples of relative blood volume curves taken during haemodialysis
� Patient 1 has a flat line throughout dialysis and hence plasma refilling rate is
able to fully compensate UF rates. In fact one could assume the patient has an
excess of fluid in the interstitial space as refilling rates remain high throughout
dialysis. It is thus probable that the patient will tolerate higher UF rates.
� Patient 2 has a constant RBV curve during a first part of dialysis followed by a
linear decrease. This would indicate compensated UF up to the point that the
curve is flat but thereafter the plasma refilling rate is not able fully compensate
UF rate and thus the RBV falls.
� Patient 3 shows a linear decrease of RBV from the onset of dialysis with a
constant declining slope. In this patient the UF rate is always exceeding the
plasma refilling rate and therefore if the UF rate was to be increased there is a
risk of precipitating decompensation.

34
� Patient 4 shows a linear decrease of RBV with a variable declining slope. In this
patient fluid removal is too rapid at the onset as demonstrated by the steep
decline in RBV and the risk of symptoms secondary to hypovolaemia is high.
The UF rate needs to be revised to reduce intradialytic morbibity.
Steuer et al achieved a 2-fold reduction in intradialytic symptoms using NIVM in six
hypotension prone adults, without changing the UF volume or treatment times42.
Additional benefits that have been reported in adults are an increase in the UF potential,
lowering of the dry weight, improved patient well-being and reduced hospitalization
due to fluid overload. Access to information on blood volume status would be
particularly helpful in the paediatric HD setting as the prevalence of intra- and
interdialytic morbidity can be higher when children do not often verbalize early warning
symptoms and for differentiating between symptoms caused by aetiologies other than
hypovolaemia. Responding directly to RBV changes with RBV driven algorithms have
shown decreased UF associated symptoms and antihypertensive medication burden,
with the greatest impact on children weighing less than 35 kg43-45. Michael et al defined
a safe UF rate based RBV change of < 8 % per hour in the first 90 mins and then < 4 %
thereafter, with no more than a 12 % net RBV change per dialysis session44 but there is
no data on the predictability of RBV levels of impending intradialytic symptoms or
hypotension in paediatrics. Adult literature has been more comprehensive and results
have been conflicting. Kim initially showed46 that if RBV fell below a given threshold,
arterial hypotension appeared. Subsequently, larger observational studies demonstrated
that critical maximal RBV reduction had no predictive power but found that irregularity
of the RBV curve and switching from an exponential to a linear decrease were the most
powerful predictors of intradialytic hypotension47, 48.
35
1.8 Myocardial Architecture and Function
1.8.1 Myocardial Contraction
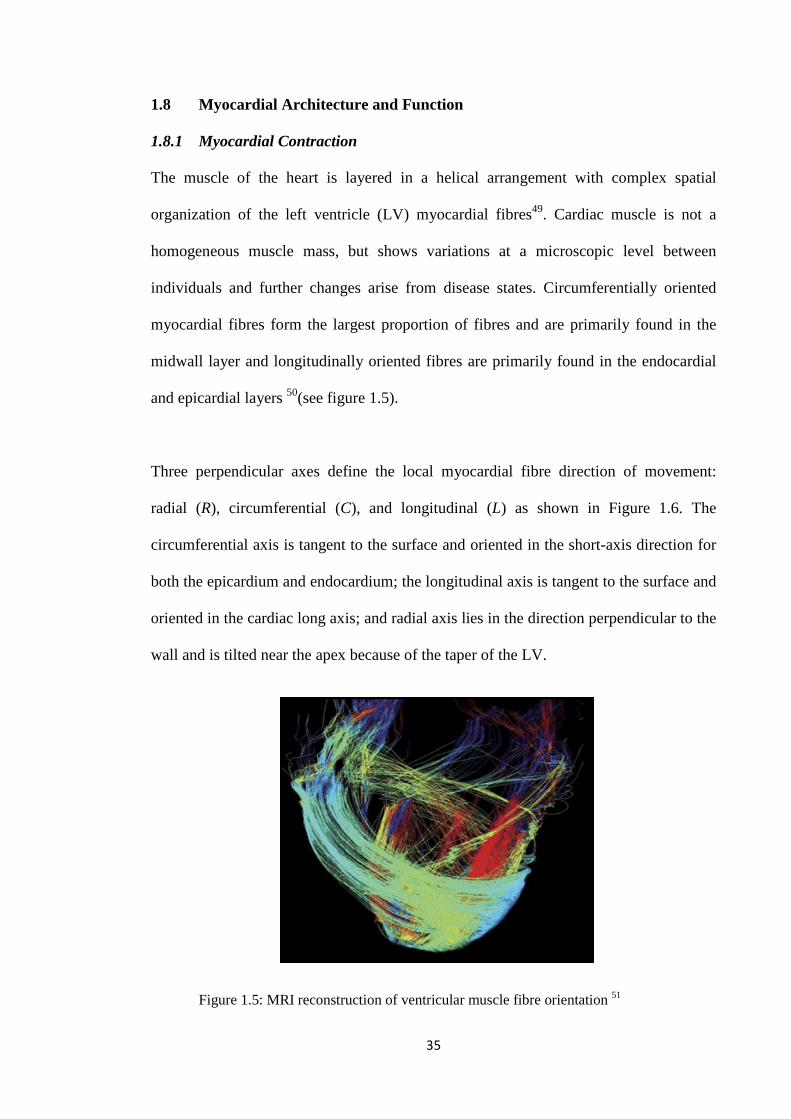
The muscle of the heart is layered in a helical arrangement with complex spatial
organization of the left ventricle (LV) myocardial fibres49. Cardiac muscle is not a
homogeneous muscle mass, but shows variations at a microscopic level between
individuals and further changes arise from disease states. Circumferentially oriented
myocardial fibres form the largest proportion of fibres and are primarily found in the
midwall layer and longitudinally oriented fibres are primarily found in the endocardial
and epicardial layers 50(see figure 1.5).
Three perpendicular axes define the local myocardial fibre direction of movement:
radial (R), circumferential (C), and longitudinal (L) as shown in Figure 1.6. The
circumferential axis is tangent to the surface and oriented in the short-axis direction for
both the epicardium and endocardium; the longitudinal axis is tangent to the surface and
oriented in the cardiac long axis; and radial axis lies in the direction perpendicular to the
wall and is tilted near the apex because of the taper of the LV.
Figure 1.5: MRI reconstruction of ventricular muscle fibre orientation 51

36
Figure 1.6: Diagram illustrating the direction of local myocardial fibre arrangement and
resultant deformation 52
Myocardial contraction is a complex three-dimensional motion. At the macroscopic
level a combination of wall (radial) thickening, circumferential shortening, and
longitudinal shortening occurs. Consequently ejection is combined effect of the inward
pressure generated from concentric forces when these muscle layers start to tense and
longitudinal shortening. The LV apex rotates counter clockwise (as viewed from the
apex) and the base rotates clockwise creating a torsional deformation from oppositely
wound epicardial and endocardial myocardial fibres. Internal cardiac fibres moved to
the outside and those on the outside move to the inside. The reverse happens in diastole.
The resultant effect is a twisting motion, like a wet cloth being wrung out with the apex
fixed while the base of the heart ‘screws down’ onto the apex. Changes in the
intracavity volume occur as a result of the inward motion and deformation
(circumferentially and longitudinally) of the endocardium. Both the circumferential and
longitudinal shortenings contribute to the magnitude of the ejection fraction 53 but in
normal individuals midwall circumferential fibre shortening appear to be the most
important component.

37
During systolic ventricular contraction the subendocardial coronary vessels, namely the
vessels that enter the myocardium, are compressed due to the high intraventricular
pressures. However, the epicardial coronary vessels, the vessels that run along the outer
surface of the heart, remain patent. Because of this, blood flow in the subendocardium
stops. As a result most myocardial perfusion occurs during heart relaxation (diastole)
when the subendocardial coronary vessels are patent and under low pressure.
1.8.2 Coronary circulation
The major vessels of the coronary circulation are the left main coronary that divides into
left anterior descending and left circumflex branches, and the right main coronary
artery. Both of these arteries originate from the root of the aorta, immediately behind the
aortic valve leaflets,left coronary artery originates from the left aortic sinus, while the
right coronary artery originates from the right aortic sinus.
Figure 1.7: Coronary circulation

38
The coronary arteries sub-divide to form three compartments. Firstly the proximal
compartment which constitutes the large epicardial coronary arteries. These lie on the
surface of the heart, large capacitance function and offer very little resistance to
coronary blood flow but are responsive to flow mediated dilatation. Their anatomical
blood supply to regions of the heart is shown in Table 1.1; nonetheless the exact
anatomy can vary considerably between individuals, especially in the apical cap.
Table 1.1: Anatomical blood supply to regions of the heart
Anatomic Region of Heart
Coronary Artery (most likely associated)
Inferior Infero-septal
Right coronary
Anterior Antero-septal
Left anterior descending
Infero-lateral Antero-lateral
Left circumflex
The coronary arteries then divide into pre-arterioles. These vessels maintain the pressure
within a narrow range when coronary flow or intravascular pressure varies. They are
essentially the principle site of autoregulation. The vessels then finally divide into
intramural arterioles with diameters less than 100µm serve to ensure that myocardial
blood supply adequately meets the metabolic demand of the heart. Their role is the
metabolic regulation of coronary blood flow and these dilate in response to various
metabolic stimuli.
The objective of the combined autoregulatory mechanisms within the coronary
circulation is to match blood flow with myocardial oxygen consumption and this is done

39
principally by coordinating vascular tone and resistance. There is a degree of reserve
within the system, the coronary flow reserve and this refers to the magnitude of the
increase in coronary flow that can be achieved in going from basal coronary perfusion
to maximal coronary dilatation.
1.8.3 Echocardiography
Two dimensional (2D) echocardiography use ultrasonic waves directed perpendicularly
to the heart to provide real-time imaging of the heart. This also provides the means to
assess cardiac function non-invasively. Global LV systolic function is usually assessed
by the resting LV ejection fraction (LVEF), expressed as the ratio of the stroke volume
divided by the end-diastolic volume.
Stroke volume (SV) = LV end-diastolic volume - LV end-systolic volume
LVEF (%) = (SV / LV end-diastolic volume) x 100
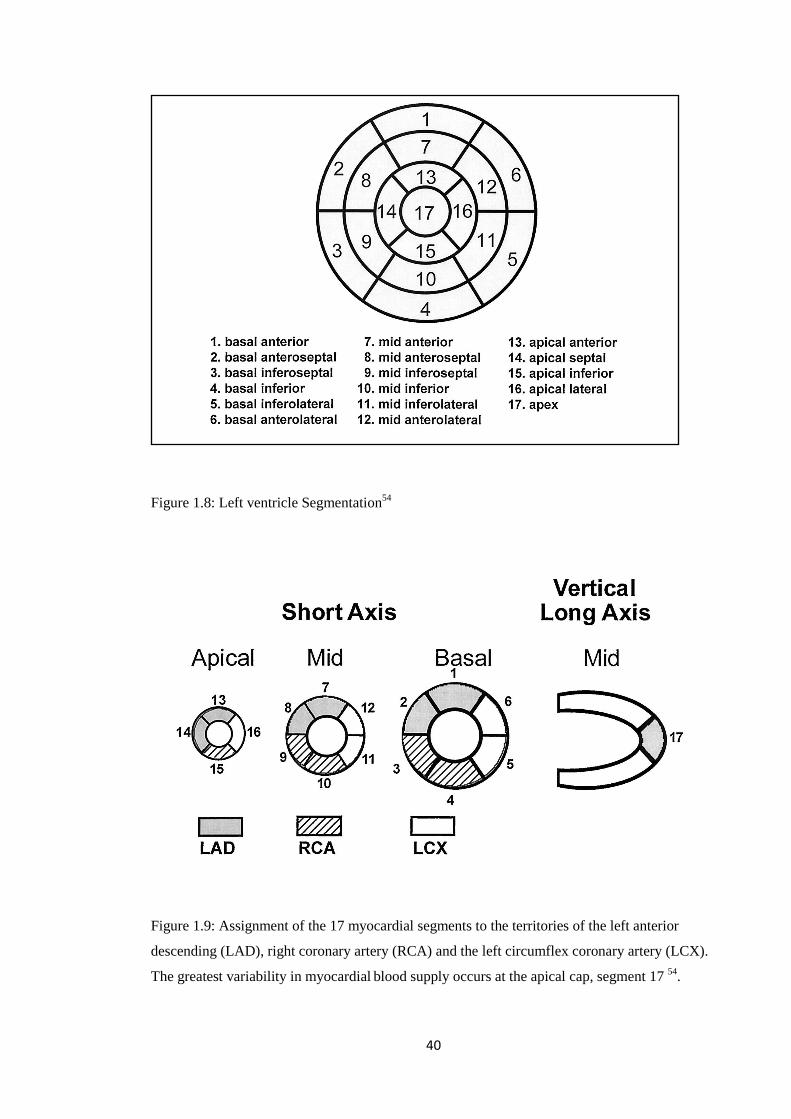
In order to assess regional LV systolic function the heart has to be divided into
segments. A standardised 17 segment model recommended by The American Heart
Association (AHA)54, names segments according to their location relative to the long
axis of the ventricle and 360° circumferential locations on the short-axis views as shown
in Figure 1.8. In spite of the probable variability in the coronary artery blood supply to
myocardial segments, a consensus has been reached on assigning the 17 myocardial
segments to the territories of the left anterior descending (LAD), right coronary artery
(RCA), and the left circumflex coronary artery (LCX) (see Figure 1.9) with a note of
caution that the greatest variability in myocardial blood supply occurs at the apical cap,
segment 17.
40
Figure 1.8: Left ventricle Segmentation54
Figure 1.9: Assignment of the 17 myocardial segments to the territories of the left anterior
descending (LAD), right coronary artery (RCA) and the left circumflex coronary artery (LCX).
The greatest variability in myocardial blood supply occurs at the apical cap, segment 17 54.

41
Regional myocardial contractile function can be assessed by measuring myocardial wall
motion measurements (displacement and velocity) or wall deformation (strain). The
term "strain" refers to the fractional or percentage change from the original, unstressed,
dimension or the change in length corrected for the original length. In common terms,
deformation of a heart fibre is akin to stretching of the heart fibre. Myocardial strain is
dimensionless and usually shown as a percentage. Through the assessment of segmental
myocardial strain the contraction/relaxation pattern of the LV can be followed in 3
planes; longitudinal, circumferential, and radial. In comparison routine
echocardiographic assessment of regional wall motion activity will only provide
information on longitudinal axis function.
1.9 Myocardial Stunning
1.9.1 Definition
� Myocardial stunning is defined as transient, post-ischaemic, left ventricular
dysfunction with normal or near- normal myocardial perfusion 55
� Episodes of transient myocardial ischaemia can be followed by reversible left
ventricular (LV) dysfunction, namely reduced or absent contraction in global or
discrete parts of the LV
1.9.2 Evidence for haemodialysis induced myocardial stunning
In order to establish whether HD induces myocardial stunning three criteria needed to
fulfilled, intradialytic i) myocardial ischaemic injury, ii) reduced myocardial blood flow
and iii) segmental or global LV dysfunction. I present the evidence for all three of these
criteria in adult HD patients.
42
Short intermittent HD treatments cause significant hypovolaemia and intradialytic
hypotension (IDH)56, 57. Acute rise of cardiac troponin-T (cTnT) levels following
dialysis has been speculated to indicate subclinical myocardial cell injury58, 59. This
parallels several studies demonstrating silent ST segment depression during dialysis at
rates that vary between 15 and 40%60. In addition to cTNT, brain natriuretic peptide
(BNP) is gaining increasing recognition as a marker of acute myocardial cell damage.
There is evidence that a combination of elevated BNP, in combination with elevated
markers of inflammation such as interleukin 6 (IL-6), predicts stunned myocardium,
whereas elevated BNP with normal IL-6 levels correlate with non-viable, infarcted
myocardium61. In addition, elevated BNP levels predict mortality in dialysis patients62.
Elevated biomarkers of myocardial damage have also been demonstrated in children
with chronic kidney disease63.
Although there was initial debate as to whether these biochemical and
electrocardiographic abnormalities reflect silent ischaemia or changes in electrolyte
concentrations, subsequent studies measuring myocardial blood flow strengthen the
case for ischaemia. Using single photon emission computed tomograghy dialysis
induced perfusion defects have been demonstrated64. In a small cohort of patients with
and without large vessel epicardial coronary disease, regional myocardial blood flow
fell. The segments demonstrating, transient, intradialtyic LV dysfunction also exhibited
the greatest reduction in regional myocardial blood flow. The duration of LV
dysfunction extended beyond the period of reduced perfusion and was thus more in
keeping with myocardial stunning than stress cardiomyopathy (see Figure 1.10 and
1.11).

43
Figure 1.10: HD is associated with both reduced global and segmental myocardial blood flow
(MBF) 65
Figure 1.11 Stunned myocardial segments exhibit significantly greater reduction in myocardial
blood flow (MBF) 65

44
One method of examining regional LV function is through echocardiographic
assessment for the development of new LV regional wall motion abnormalities
(RWMA). New RWMAs are indicative of ischaemia and their onset precedes symptoms
and electrocardiographic changes. These principles form the basis and rationale for
dobutamine stress echocardiography66. In 75% of prevalent adult HD patients new
RWMAs have been demonstrated, starting 2 hours into dialysis, peaking at the time of
maximum stress at the end of dialysis, with 30% persisting 30 minutes postdialysis. A
direct correlation is seen between both the number and intensity of stunning within
segments and intradialytic BP changes and UF volume67. A study of sequential positron
emission tomography (PET) scans of adult during their HD treatment reported a 13%
reduction in global myocardial blood flow 30 minutes into HD, a period of minimal UF.
This was accompanied by a 5% fall in cardiac output but no change in systolic and
diastolic BP or heart rate was observed. By 220 minutes the global myocardial blood
flow had fallen on average by 26% with a corresponding 21% drop in cardiac output, a
significant tachycardic response but again a non-significant fall in systolic and diastolic
BP. The regions of the heart that demonstrated the greatest segmental decline in
myocardial blood flow developed new LV RWMA by the end of dialysis (see Figure
1.12)68.

45
Figure 1.12: Relative change from baseline of the cardiac output (C) and myocardial blood flow
(D) during haemodialysis68
This study illustrates a pronounced fall in myocardial blood flow that occurs early
during the dialysis session, unrelated to hypovolaemia and is therefore more likely to be
due to a sequence of events that follow connection to the extracorporeal circuit. In
patients commencing continuous renal replacement therapy, blood dialyser membrane
incompatibility triggers a bradykinin response with resultant early onset hypotension69.
A similar inflammatory reaction is possible in the conventional HD patients however
this alone does not explain the predominance of myocardial haemodynamic changes but
raises suspicion about the integrity of myocardial microcirculation. This study also
demonstrated that the reversible regional left ventricular dysfunction lasted beyond the
period of reduced perfusion. This is essence completes the clinical evidence for HD
induced myocardial stunning in adults.

46
Consequences of myocardial stunning
The concept of myocardial stunning was first introduced in patients with ischaemic
heart disease. Repeated episodes of ischaemia and stunning may lead to cumulative,
more severe and prolonged stunning70 eventually progressing to the phenomenon of
‘myocardial functional hibernation’, that is non-infarcted, scar free myocardium with
fixed systolic dysfunction ranging from hypokinesia (depressed contraction), akinesia
(no contraction) or dyskinesia (paradoxical contraction)71. The extent and severity of
LV dysfunction can vary considerably and untreated is predictive of morbidity. If a
discrete region of the LV is involved the impact on ejection fraction can be minimal,
however with more global involvement heart failure is inevitable.
Myocardial hibernation is thought to represent a functional adaptation to chronic
hypoperfusion with cardiac myocytes almost adopting an embryonic phenotype72. There
is conflicting evidence on whether myocardial blood flow to hibernating myocardium is
normal72, 73 or reduced74 but what is clear is that the coronary flow reserve is severely
reduced75. Importantly the chronic LV dysfunction that is typical in hibernating
myocardium can be reversed with restoration of regional myocardial blood flow76. If
this fails to occur the hibernating myocardium is highly vulnerable to increases in
demand or reductions in oxygen supply and subsequent stresses are cumulative. The
knock on effect is a prolonged period to recovery following revascularisation or
eventual apoptosis or necrosis and non-viable myocardium (see Figure 1.13).

47
Figure 1.13: R
epeated episodes of transient myocardial ischaem
ia lead to maladaptive intracellular changes

48
In adults the physiological strain and haemodynamic stress during conventional HD is
sufficient to cause transient myocardial ischaemia with resultant left ventricular (LV)
dysfunction. Conventional HD regimens comprise of 3 to 4 dialysis treatments per
week, every week of the year, therefore the potential for repetitive ischaemic
myocardial insults is both significant and high. Burton et al have undertaken serial
echocardiographic assessments of global and regional LV performance in prevalent HD
patients, twelve months apart. They found a significant reduction in segmental
shortening fraction SF in those segments that had developed RWMAs at baseline
(Figure 1.14) with 32% developing a fixed reduction in segmental function.
Figure 1.14: Change in segmental shortening fraction (SF) in haemodialysis patients
followed for 12 months67
Furthermore patients segments with fixed systolic reduction of >60% showed a
significant decline in ejection fraction over 12 months both at rest and at peak stress
during HD. There was no significant reduction in LVEF in patients who did not develop
fixed reductions in segmental function (Figure 1.15)67.

49
Figure 1.15: Change in ejection fraction (EF) at rest and during HD in patients with a fixed
reduction in segmental function greater than 60% 67
Records from the US Renal Data System have shown that HD is an independent risk
factor for the development of both de novo and recurrent heart failure with a two-year
mortality after a diagnosis of congestive heart failure as high as 51% 77. The aetiology
of uraemic heart failure is elusive but evidence implicating HD induced myocardial
stunning story is emerging. However what remains uncertain is whether children on HD
are also vulnerable.
1.10 Strategies for improving intradialytic morbidity
1.10.1 Sodium profiling
Following a sodium load, the mechanisms responsible for preserving plasma tonicity
will maintain plasma sodium within narrow limits by changing the plasma volume.
During HD, dialysate sodium generates a crystalloid osmotic pressure and thus
influences fluid shift between the different body compartments, but it also permeates the
dialysis membrane and thus has the potential for becoming a sodium load.

50
One of the primary objectives of HD is restoration of sodium and fluid balance.
Sodium is predominantly cleared by convection with the excess water. Pure UF has
approximately the same sodium activity as plasma with no net change in patient’s
plasma sodium concentration. Diffusive sodium transport is proportional to the
difference in sodium concentration between blood and dialysate compartments.
Dialysate sodium activity is approximately equal to 97% of the measured sodium
concentration. Similarly the proportion of plasma sodium ions that are bound to protein
and other anions, are unavailable for exchange. We can measure the free ionized plasma
water sodium concentration in the blood by using direct ionometry. Plasma sodium
activity is further limited by the Donnan effect, whereby negatively charged proteins
(mainly albumin) produce a small electrical potential difference across the membrane
(negative on the plasma side) that prevents movement of the positively charged sodium
ions. Concentration differences between interstitial and plasma also stem from the
Donnan effect. In the absence of UF, we can approximate the concentration of dialysate
sodium to achieve isotonic dialysis by correcting the blood sodium measured by direct
ionometry for a Donnan factor of 0.967.
Hyponatric dialysis causes osmotic fluid shift from the extracellular to intracellular
compartment, dialysis disequilibrium disorder and intradialytic hypotension.
Hypernatric dialysis transfers sodium to the patient, causing interstitial oedema,
interdialytic thirst, increased interdialytic weight gain and the worsening hypertension.
A therapeutic advantage can be gained by manipulating the dialysate sodium
concentration throughout dialysis. This is referred to sodium profiling, and typically
utilizes a sodium concentration that falls in a step, linear or exponential fashion. The
higher dialysate sodium at the start allows a diffusive sodium influx to counterbalance

51
the rapid decline in plasma osmolarity due to clearance of urea and other small
molecular weight solutes. Low dialysate sodium at the end aids diffusive clearance of
the sodium load and minimizes hypertonicity. Compared with a constant dialysate
sodium bath modelling has been shown to increase stability of intradialytic blood
volume, and reduce both intradialytic cramps and interdialytic fatigue in adults and
children78. Outcomes have been better with the linear and step profiles compared with
exponential. Step profiles are most effective at attenuating post-dialytic hypotension and
early intradialytic hypotension and linear profiles best reduced cramps and late
intradialytic hypotension. Sodium profiling is also indicated in the prevention of
dialysis dysequilibrium with patients reporting a preference to it. However one of the
major drawbacks of sodium profiling is the risk of a positive sodium balance by the end
of each HD session.
The challenge therefore with sodium profiling is finding the concentration gradient that
offers the benefits of cardiovascular stability without exposing the patient to a small but
repeated sodium load. A net sodium gain of 1mmol/l will result in a 1.3% expansion of
the extracellular space. Based on concerns of inducing hypervolaemia the emphasis is
shifting to neutral sodium balance profiles. Protocols of isonatriaemic dialysate are
similar with time averaged dialysate sodium 2-3mEq/l lower (Donnan effect) than the
predialysis sodium79. Results indicate benefits comparable to sodium profiling with a
significant decrease in the interdialytic weight gain and thirst score80.
Currently the decision to manipulate dialysate sodium relies heavily on conflicting adult
literature and there is no comparison of its benefit over other commonly used strategies
such as UF profiling in children.

52
1.10.2 UF profiling
Modifying the UF rate throughout dialysis to allow adequate vascular refilling has the
potential to increase the UF potential. This is the rationale behind UF profiles. The
plasma refilling capacity increases proportionately with interstitial volume expansion.
Decreasing stepwise or linear profiles start with high UF rates at the time of maximal
tissue hydration, progressively reducing the rate in line with decreasing interstitial
hydration in the hope of maintaining the crucial balance between fluid removal and
vascular refilling. Intermittent profiles aim to provide periods of active mobilization of
interstitial fluid into the vascular space when UF rates are low, thereby making it
amenable to removal during periods of high UF rates. Donauer et al reported lower
symptomatic hypotension with the decreasing profiles, but the intermittent profile was
associated with an increased incidence of symptomatic hypotension and post-dialysis
fatigue81. The incidence of intradialytic hypotension was highest with UF rates greater
than 1.5 times the average. Ronco et al observed hypotension at a rate of 6.7/100
treatments when the UF rate was 0.3 ml/min/kg increasing to 15.8 at an UF rate of 0.4
ml/min/kg, 25.6 at a rate of 0.5 ml/min/kg, and 67.4 at a rate of 0.6 ml/min/kg82.
Combining UF profiles with sodium profiles can induce plasma hypertonicity. The
utilisation of a high UF rate with higher dialysate sodium conditions maximises plasma
refilling and in adults has been shown to be superior to either sodium or UF profiles
alone in attenuating intradialytic symptoms and cardiovascular instability. Ebel et al
compared 3 regimens; i) constant dialysate sodium of 138mmol/l, ii) UF profile of 40%
of the total UF goal in the first hour, 30% in the second hour, 30% in the subsequent
90mins and then none in the last 30mins, iii) combined UF profile with a sodium profile
with a dialysate sodium 10% higher than the pre-dialysis plasma sodium, decreased in 5

53
steps to 138 in the last hour. Both the stand alone UF and sodium profiles showed
evidence of intracellular fluid shift and intravascular hypovolaemia. The combined
profiles showed higher refilling rates and net removal of fluid from the interstitium and
reduced renin, aldosterone, epinephrine and norepinephrine levels83, perhaps reflecting
less marked hypovolaemia and improved vascular stability. Paediatric data on the use of
UF profiles in isolation or in combination with sodium profiles is non-existent and thus
efficacy large extrapolated from adult data.
1.10.3 Biofeedback
The kidneys’ unique ability to maintain homeostasis is achieved by continuously
adjusting purification in response to transfer of information through a complex system
of sensing and feedback mechanisms. Until now we have been unable to simulate this
because traditional HD prescriptions are based on information from previous
observations. Recently introduced biofeedback systems adjust the treatment prescription
based on real-time repeated observations from an on-line monitoring system using a
negative feedback system designed to return the deviating factor to a pre-set nominal
value.
Blood volume controlled feedback systems respond to RBV changes84. At the start of
therapy the treatment duration, UF goal, and a target for a maximum decline in BV is
set. The feedback programme will then adjust the UF rate and (when using the
Hemocontrol module) dialysate conductivity to maintain RBV along this pre-set target
thus improving RBV preservation with a more physiological reduction in the RBV
profile85, 86. Initial results report a reduced incidence of intra-dialytic hypotensive
episodes and attenuation of post dialysis symptoms87 with a partial response in

54
hypotension prone patients84, 88. Again data in paediatrics is non-existent, nevertheless
RBV driven UF algorithms have been used in children with success with reports of
reduce antihypertensive medication burden and UF associated symptoms89.
1.10.4 Sequential dialysis
Owing to anecdotal experience iso-osmotic fluid removal during sequential dialysis
techniques (pure UF followed by dialysis) is often used to achieve higher UF rates
without inducing hemodynamic instability but what remains unclear is how this
improvement in cardiovascular stability is achieved and the extent of the benefit.
Isolated UF can be performed by placing the HD machine in bypass or on the UF mode.
As the patient is no longer being warmed by the dialysate their core temperature drops.
Traditional thinking believed this to be problematic as patients developed symptoms
related to cold. In light of emerging evidence the reverse is now believed to be true.
Cooling over the extracorporeal circuit counteracts the heat generated during dialysis
and thus prevents an increase in core temperature, peripheral vasodilatation and
hypotension. Others have postulated that the improved hemodynamic stability is
secondary to decreased sodium clearance90, 91. Based on personal experiences there is no
doubt that sequential dialysis can be useful in meeting UF targets during paediatric HD
but quantitative, comparative data has never been reported.
1.10.5 Intradialytic mannitol
Dialysis discomfort and dysequilibrium due to cellular osmotic distress occurs as a
result of changes in osmolarity inducing water shifts from the extracellular to the
intracellular compartment across the highly permeable blood brain membrane. It was
first described in 1962 and manifests during or immediately after HD as a self limiting

55
entity but recovery can take several days. Symptoms typically include nausea, vomiting,
headache, blurred vision, hypertension, seizures and coma but others such as muscular
cramps, anorexia, restlessness and dizziness have been reported.
The exact pathophysiology of DDS remains unclear and two mechanisms have been
proposed. The first, the reverse urea effect, believes that urea clearance from plasma
occurs more rapidly than brain tissue. This results in a transient osmotic gradient and
net movement of water from plasma to brain causing cerebral oedema and occasionally
due to loss of extracellular water, hypotension. The second theory relates to
intracerebral acidosis and emerged from evidence pertaining to a paradoxical acidaemia
of CSF and cerebral cortical grey matter in patients and animals treated with rapid HD.
This is accompanied by increased brain osmole activity due to displacement of sodium
and potassium ions and enhanced organic acid production. The increased intracellular
osmolarity induces fluid shifts with subsequent cytotoxic oedema. Both mechanisms
allude to rapid changes in brain volume. This in turn is thought to damage the blood
brain barrier and disrupt cerebral autoregulation. Patients identified as high risk of
developing DDS are new patients, those with a high pre-dialysis urea or high UF goal,
children and patients with co-morbidites such as pre-existing neurological disease,
hyponatraemia, malignant hypertension and hypoglycaemia.
Treatment options are both preventative and therapeutic. The dialysis prescription can
be adjusted to reduce the rate of plasma urea clearance by downgrading the surface area
of the dialyser; decreasing the blood flow rate; minimized intradialytic fluid shifts with
sodium profiles or higher dialysate sodium concentrations and if the patient is grossly
fluid overloaded to treat using sequential HD with a initial period of UF alone followed

56
by conventional dialysis. In paediatrics mannitol is used almost exclusively as a
preventative and therapeutic agent. It is osmotically active solute, and can therefore
artificially increase plasma osmolarity at the time of rapid urea clearance.
Therapeutically it rapidly lowers intracranial hypertension within minutes of
administration, with a maximal effect at 20-40mins. Mannitol accumulates in renal
failure (half-life: 36hrs) and therefore a maximal intradialytic dose of 1g/kg is
recommended.
One of the greatest challenges relating to DDS resides in the fact that the diagnosis is
essentially one of exclusion, the main differential diagnosis being intravascular fluid
depletion. In practice DDS is only treated when symptoms are typical and/or severe and
therefore the true incidence in children is unknown. Similar to sequential dialysis the
value of intradialytic mannitol in children has never been quantified, especially within
the context of modifying the UF potential.
1.10.6 Cooling
By modifying skin blood flow we can control heat exchange between the body and the
environment. This is mediated by two sympathetic nervous systems, an adrenergic
vasoconstrictor and a less well understood sympathetic vasodilator. During times of
increased body core temperature, tonic sympathetic vasoconstriction is relaxed and
active vasodilatation is initiated92 and with heat stress the skin blood flow rate can
increase from a baseline of 200-500mls/min (5-10% of the total body cardiac output) to
8l/min (approximately 60% of cardiac output)93, 94.

57
Traditionally dialysate temperatures have been set around 37°C based on presumed
physiological normal values and to compensate for losses of heat in the extracorporeal
circuit. Both of these assumptions have in fact been found to be untrue. In a study of
HD patients 62.5% of 128 HD adult patients had pre-dialysis body temp below 36.5,
with marked inter- and intra-individual differences95. There is growing evidence in both
in adults and children of a net gain and not loss of heat during dialysis speculated to
have a multifactorial aetiology. Firstly transfer of heat to patients from the warmer
dialysate. As a result of a higher resting energy expenditure in HD patients compared to
the normal population, especially in those with residual renal function96. Thermogenesis
as direct consequence of the inflammatory response invoked when blood comes in
contact with bioincompatible dialysis membranes. Finally UF activates increased
sympathetic vasoconstriction, reducing skin blood flow and therefore heat exchange,
demonstrated by a direct correlation between UF volume and net heat gain97. If the
accumulation of heat causes an increase in the body core temperature, UF induced
vasoconstriction is overridden by active vasodilatation. Blood is redistributed to the
skin98, the peripheral vascular resistance falls, causing decreased cardiac refilling and
hypotension99. Fine and Penner95 showed that dialysis patients with subnormal body
temperature (below 36°C) dialyzed against a 37°C dialysate had a 15.9% incidence of
symptomatic hypotensive episodes, which fell to 3.4% with 35°C dialysate. Selby et al
reported an improvement in the degree and severity of HD induced myocardial stunning
in patients treated with cooled dialysate100. This hemodynamic advantage of “cool” HD
comes at a price with symptoms related to feeling cold and a theoretical risk of
adversely affecting urea clearance as a result of compartmental dysequilibrium. The
application of ‘cooling’ can complex using a feedback control circuit or simple through
the manipulation of the dialysate temperature based on the patient’s pre-dialysis

58
temperature. In adults cooling has been associated with improved cardiovascular
stability and reduced HD induced LV dysfunction100.
1.10.7 Quotidian haemodialysis
Conversion to frequent HD has been shown to reduce intra- and interdialytic
hemodynamic instability. This may simply be the result of gentler and more gradual
fluid. However, there is growing evidence indicating an improvement in a number of
uraemic cardiovascular co-morbidities in association with superior toxin clearance.
Quotidian dialysis improves EPO responsiveness and dialysis related inflammation37;
hypertension and LVH101, 102; conduit artery stiffness and total peripheral resistance;
endothelium-dependent vasodilatation102; and baroreflex regulation of heart rate103.
Almost exclusively the reported literature features adult studies and paediatric data is
almost exclusively gained from case series reports. In spite of this the collective
experience has been positive with improved UF potential and dialysis quality and a
reduction in intradialytic symptoms. One feature that is relevant in light of the work of
this MD is that children converting to frequent, 8-10 hour dialysis treatments develop
chronic asymptomatic pre- and post-dialysis hypotension104. Again owing to a paucity
of data we do not know whether this has serious implications in the short-term or in the
future.

59
Chapter Two
Hypotheses

60
Nature of the Studies
Cardiovascular disease is prevalent and the most common cause of mortality in children
with ESRD. Intradialytic hypotension is prevalent and in adults is a known risk factor
for death. This raises a very valid question, are the two linked? The evidence for the
cardiovascular burden of HD is growing stronger and with it the urgency for change in
the way we dialyse our patients. The difficulty in paediatrics is the paucity of data to
direct us. Studies examining the cardiovascular response to dialysis have been in adults
and extrapolated to children. There is anecdotal evidence of haemodialysis induced
haemodynamic disturbance and decompensation in children but the risk has not been
quantified. Young adults have a constellation of ischaemia predisposing factors
including increased intima media thickness and pulse wave velocity, coronary artery
and valvular calcification, endothelial dysfunction and early atherosclerosis. It is
therefore plausible that children may also display a similar pathophysiology of dialysis
induced cardiac injury as adults.
Objectives
The objectives of this thesis are as follows:
� To determine the prevalence of intradialytic hypotension during conventional
paediatric HD treatments.
� To investigate the haemodynamic response to HD in children
� To ascertain whether changes in intravascular volume are predictive of
intradialytic hypotension during paediatric HD
� To investigate global and segmental myocardial function during conventional
paediatric HD treatments

61
� To determine the efficacy of sodium and UF profiles, sequential dialysis and
intradialytic mannitol in attenuating intradialytic symptoms and hypotension.
Original Hypotheses
� The aetiology of intradialytic hypotension in children is due to variations in the
compensatory haemodynamic response to intravascular volume changes during
dialysis. The aetiology is multifactorial and not exclusively due to UF induced
hypovolaemia.
� Children with ESRD have developed significant cardiovascular disease that
predisposes them to ischaemic injury. Conventional HD constitutes a significant
haemodynamic stress and as such is a procedure associated with a high
metabolic demand. In the presence of repeated episodes of intradialytic
hypotension the resultant demand supply mismatch causes ischaemic myocardial
injury and LV dysfunction.
� Through a better understanding of the mechanism involved in intradialytic
hypotension the dialysis prescription can be modified to improve cardiovascular
stability and intradialytic morbidity.

62
Chapter Three
Haemodynamic Response to Paediatric Haemodialysis

63
3.1 Hypotheses
� UF is associated with intravascular fluid depletion.
� Intravascular hypovolaemia induces a compensatory cardiovascular response to
maintain and support adequate circulation for vital organs. During paediatric HD
the dominant response varies between patients.
� Decompensation is prevented by mounting a tachycardia response, increasing
cardiac contractility and stroke volume (SV) while the total peripheral resistance
(TPR) rises to sustain central BP.
� Intradialytic hypotension occurs when theses compensatory mechanisms fail
combined with changes in intravascular volume.
� Temporal changes in relative blood volume (RBV) are not able to predict the
development of intradialytic symptoms and hypotension in children but
thresholds can help to discriminate between successful treatments and in those in
which an adverse event occurs.
3.2 Introduction
Adults with ESRD have an altered and abnormal hemodynamic stress response12, 105, 106
and we assume the same to be true in children. In spite of this, with a desired objective
of maintaining euvolemia we attempt to remove large volumes of fluid during
conventional 4 hour HD treatments. In paediatrics, UF volumes of up to 6% of the dry
weight are prescribed and achieved but at the expense of inducing intradialytic
symptoms and hypotension. The aetiology of intradiayltic hypotension is complex and
thought to be caused in part by an impaired cardiovascular compensatory response to
fluid removal, although the precise mechanisms are still not entirely understood. Plasma

64
refilling is thought to be an important mediator and an imbalance between UF and
plasma refilling rates will eventually lead to hypovolaemia.
The introduction of non-invasive blood volume monitors (NIVM) has now made it
possible to measure the relative changes in the blood volume real-time and repeatedly
during individual dialysis treatments. In addition it has been suggested that RBV
parameters may predict the occurrence of adverse intradialytic events. In adults a
critical level of RBV reduction46, gradient of the RBV curve or switching from an
exponential to a linear RBV reduction have demonstrated predictive ability for the
occurrence of intradialytic hypotension46, 48. In children RBV literature is dominated by
studies reporting on the merits of RBV algorithms in guiding UF43, 89 but the predictive
and discriminating ability of RBV parameters have not been investigated.
3.3 Subjects & Methods
3.3.1 Non-invasive continuous haemodynamic monitoring
Technique
The finometer (Finapres Medical Systems, Arnhem, The Netherlands) is a tool designed
for measuring BP and haemodynamic variables non-invasively, using continuous pulse-
wave analysis at the digital artery (Figure 3.1). Finger arterial pressure is measured
using the finger-clamp method whereby changes in digital arterial diameter are detected
by infrared photoplethysmograph107 and opposed by an ultra-fast pressure servo
controller that changes pressure in an inflatable air bladder, both mounted in a finger
cuff. This generates an arterial waveform on a beat-to-beat basis form which is then

65
used to reconstruct a central aortic flow waveform108 and calculate a number of
haemodynamic variables on a continuous basis (see Figure 3.2).
Figure 3.1: Non-invasive continuous haemodynamic monitoring with the finometer
Using a nonlinear, self-adaptive, three-element Windkessel model of aortic input
impedance an algorithm computes the aortic flow waveform from an arterial blood
pressure pulsation. Zo is characteristic impedance of the proximal aorta; Cw
'Windkessel' the compliance of the arterial system; and Rp, total systemic peripheral
resistance. The input is P(t), the arterial pressure waveform and output Q(t) blood flow
as a function of time.

66
Figure 3.2: Modelling flow from measurements of arterial pressure.
Left panel: input- the non-invasive pressure for one heartbeat.
Middle panel: three-element model of aortic input impedance that is used to compute flow from
pressure Right panel: output- aortic flow as a function of time
An arm cuff is wrapped around the same arm as the finger cuff to undertake a “Return-
to-flow” calibration109. When arm cuff pressure is supra-systolic, no pulsations can be
sensed in the finger. The first slight pulsation signals return to flow and is sensed in the
finger and detected by the software. The finger cuff pressure is read at that instant and
calibrated against brachial readings. The Finometer has been validated against invasive
haemodynamic measurements in both children and adults110-114 and shown to be
accurate, reliable and reproducible.
Patients & Method
I prospectively selected all chronic HD patients treated at Great Ormond Street Hospital
for Children, excluding those with overt cardiac disease. Ethics approval for this study
was granted by the local research ethics board and informed consent was obtained from
patients or their guardians.

67
The children aged from 11 to 17 years, had been dialysis dependent for 4-130 months.
The net UF volume ranged from 5 to 61mls/kg. Using the finometer I measured the
heart rate (HR), blood pressure (BP), stroke volume (SV), cardiac output (CO) and
peripheral resistance (TPR) for the duration of the dialysis session. All the data was
downloaded to a PC based analysis program to calculate average results over 5 minute
time intervals.
Dialysis Prescription
All patients were dialysed using Gambro AK 95® or Gambro AK100® dialysis
monitors. Patients received HD for 4 hours, 3 times per week. All dialysis membranes
were high flux polysulfone or triacetate cellulose membranes, sized to match each
patient’s body surface area. For all treatments, dialysate contained sodium 140 mmol/l,
potassium 2mmol/l, calcium 1.75mmol/l, magnesium 0.5mmol/l, bicarbonate 34mmol/l
with a small quantity of acetate in the acidic component to stabilise the dialysate. The
dialysate solute concentrations were not formally analysed and verified but assumed to
be correct based on the from the manufacturers labels. The dialysate temperatures were
set at constant value of 37.0°C. Dialysate flow rates were maintained at 500mls/min and
the blood pump speed varied between 80mls/min to 400mls/min depending on the
patients’ size.
3.3.2 Non-invasive blood volume monitor
Patients
I included all children who had undergone at least one month of HD within the dialysis
unit at the Hospital for Sick Children, Toronto, excluding those receiving total
parenteral nutrition or blood products (albumin, fresh frozen plasma, blood, platelets)

68
during their treatment and those who were acutely unwell. Patients were subdivided into
2 groups for the presence or absence of ‘polyuria’, which was defined as a daily urine
output >1.5mls/kg/hr. Ethics approval for this study was granted by the local research
ethics board and informed consent was obtained from patients or their guardians.
Baseline characteristics of the patients and dialytic treatments are listed in Table 3.1.
The underlying renal disease was focal segmental glomerulosclerosis (FSGS)[1 patient],
autosomal recessive polycystic kidney disease (ARPKD)[1 patient], renal dysplasia [4
patients], chronic allograft nephropathy and BK virus nephropathy secondary following
a cardiac transplant[1 patient], membranous glomerulonephritis [1 patient], anti-
neutrophil cytoplasmic antibodies (ANCA) negative glomerulonephritis [1 patient],
unknown underlying aetiology [2 patients]. Of the 11 patients 5 were polyuric, one
patient with panhypopituitarism was prone to hypotensive episodes, 1 patient had a
chronic history of intradialytic cramping and 1 patient had been treated with a second
heart transplant and had evidence of significant right ventricular dilatation on a peak
dobutamine stress test but normal LV function at rest. 3 patients had LVH and 5 were
hypertensive.

69
Table 3.1: Baseline characteristics of patients and their dialytic treatments
Sex (M/F) 6/5
Age (years) 12.8 [7 to 17]
Dry weight (kg) 40.2 [18.5 to 69.4]
Urine output (yes/no) 7/4
Urine output (mls/kg/hr) 1.61 [0.2 to 2.9]
Pre-dialysis plasma hemoglobin (g/l) 94.8 [114 to 84]
Pre-dialysis plasma albumin (g/l) 35.8 [26.5 to 44]
Pre-dialysis plasma ionized calcium (mmol/l) 1.24 [1.09 to 1.55]
Mean gross UF (mls/session)
UF range in non-polyuric patients
UF range in polyuric patients
1475 [500 to 3500]
[1123 to 3500]
[408 to 1600]
Blood flow rate (mls/min) 120-350
Dialysate flow rate (mls/min) 200-650
Kt/V 1.71[1.36 to 2.14]
Mean Systolic BP at the start of dialysis (mmHg) 113 [84 to 170]
Mean Diastolic BP at the start of dialysis (mmHg) 68.1 [49 to 95]
Mean Heart rate at the start of dialysis (beats/min) 100 [64 to 133]
Dialysis Prescription
All patients were dialysed using the Fresenius 2008K® or 2008H® for 3hrs, 4 times per
week or for 4hrs, 3 times per week. In addition if patients arrived for their treatment
grossly fluid overloaded and remained at least 1kg above their estimated dry weight (or
0.5kg in a hypotensive prone patient) at the end of dialysis, they returned the following
day for an additional 2 hr treatment. All dialysis membranes were high flux, triacetate
cellulose or polysulfone membranes. Dialysis flow rates varied between 200 to
650mls/min and blood flow rates were calculated to provide a urea clearance of 3 to
5mls/kg/min. All patients received unfractionated heparin as standard anticoagulation.
A bolus dose of 15-20u/kg was administered at the start of dialysis followed by a

70
continuous infusion of 15-20u/kg/hr, stopping the heparin infusion over the last 30
minutes of dialysis. The rate of infusion was adjusted to maintain the activated clotting
time (ACT) at 20-50% above baseline, with a maximum ACT of 220 seconds. If
patients were considered to be at a high risk of bleeding no heparin was given. Patients
were dialysed against 35mmol/l bicarbonate and 1.25mmol/l calcium dialysate solutions
with a small quantity of acetate in the acidic component to stabilise the dialysate. The
dialysis water quality was tested monthly and met national standards. The dialysate
temperatures were set at constant value of 37.5˚C. Patients were permitted to consume
one meal during their treatments.
All patients were dialysed with either step or linear, decreasing sodium profiles, starting
with a sodium concentration of 148mmol/l that dropped to a final concentration of 138
or 135mmol/l. This was combined with UF profiles (see Figure 3.3):
- constant UF rate profile [UF profile 0]
- decreasing step wise decline profile [UF profile 3]
- decreasing linear decline profile [UF profile 2]
- high UF rates interspersed between low rates [UF profile 6]
The maximum UF rate for any profile did not exceed 1.5 times the average rate. The
dialysis prescription was adjusted monthly to achieve a urea reduction rate between 65
to 80% and an estimated Kt/V between 1.2 and 1.6115.

71
UF Profile 3
0
30
60
90
120
150
UF profile 2
0
30
60
90
120
150
UF profile 6
0
30
60
90
120
150
Figure 3.3: UF profiles
Study Protocol
During a mid-week or end of the week dialysis session RBV changes were measured
using the Blood Volume Monitor® (BVM, Fresenius AG, Bad Homburg, Germany).
Data was recorded hourly throughout treatment, at the time of an ‘adverse event’ prior
to any nursing intervention and upon recovery. Concurrently, the patient’s heart rate and
BP, and gross UF volume were recorded. A single BP reading was taken in a sitting
position using an automated Dinamapp machine with a cuff adjusted for size. An
‘adverse event’ was defined as an intradialytic event that resulted in a nursing
intervention (saline bolus, stopping UF, placing the patient in the Trendelenburg
position, arrest call). Treatment failure was defined as the occurrence of an intradialytic
adverse event and/or the development of hypotension defined as the first Task Force 5th
percentile systolic BP measurements8. An exception was made for a hypotension prone
patient with panhypopituitarism patient in whom the cut-off systolic BP was set at
75mmHg. Finally the dry weight was assessed monthly from a clinical assessment of
the patient’s volume status combined with a review of post-dialysis weights at which
the patient displayed no symptoms indicative of underhydration. If any degree of
uncertainty remained the size of the cardiac silhouette and on a posterior-anterior view,
post dialysis chest X-Ray.

72
Statistical analyses
All values of continuous variables were presented as mean ± standard error. A paired t
test was used to determine whether there were significant differences between
continuous variables at the 95th confidence interval (CI), corrected for multiple
comparisons using Bonferroni. In order to assess the ability of RBV changes to
discriminate between successful and failed treatments receiver operating characteristics
(ROC) curves were constructed:
� actual RBV measurement at the end of the first hour and treatment failure in the
first or second hour of dialysis
� actual RBV measurement at the end of the second hour and treatment failure in
the second or third hour of dialysis
� hourly RBV difference during the second hour and treatment failure in the
second or third hour of dialysis. For example if the RBV was 90% at the start
and 80% at the end of the second hour, the hourly RBV difference would be
10%.
� actual RBV measurement at the end of the third and treatment failure in the third
or fourth hour of dialysis
� hourly difference in RBV during the third hour and treatment failure in the third
or fourth hour of dialysis
� actual RBV measurement at the end of the fourth hour and treatment failure in
the fourth hour of dialysis
� hourly difference in RBV during the fourth hour and treatment failure in the
fourth hour of dialysis
� final RBV measurement at the end of dialysis and treatment failure

73
In the evaluation of actual RBV measurements, the ROCs were constructed taking low
values to be ‘positive’ for treatment failure. For example, using a test threshold of 88%,
the test is positive for a RBV of 88% or below and negative if the RBV is greater than
88%. In the analyses of hourly differences in RBV as the discriminator, high values
were taken to be ‘positive’ for treatment failure. For example, with a test threshold of
10%, the test is positive if the hourly difference in RBV is greater or equal to 10% and
negative if the hourly difference is less than 10%. Polyuric patients were excluded from
the ROC analyses.
A repeated measures ANOVA was used to determine whether the rate of RBV change
over time or the shape of the RBV curve differed between successful and failed
treatments, testing for polyuria as a confounder. Measured RBV data from 60 minutes
to the end of dialysis was entered into the analysis. Finally a logistic regression analysis,
again with polyuria as a confounder, was conducted to test the relationship between
treatment outcome (successful or failed treatment) and the predictors: i) final RBV
measurement at the end of treatment; ii) difference in systolic BP from the start to the
end of treatment; iii) difference in diastolic BP from the start to the end of treatment;
and iv) difference between final and initial heart rate. For all four analyses ‘end of
treatment’ was defined as the time of completing the prescribed dialysis treatment or the
time at which an adverse intradialytic event occurred.
All statistical tests were performed using the SAS statistical package (SAS 9.1, North
Carolina, USA). All statistical tests were two tailed with a p-value less than or equal to
0.05 taken to indicate significance. The internal correlation of observations from the
same patients was taken into account by completing repeated measures analyses for all.

74
3.4 Results
From the 11 patients, 74 RBV curves were recorded of which 15 records were from
polyuric patients. I have no information on the number of dialysis treatments and thus
the number of RBV curves that were generated by each patient as I was blinded to the
selection of patients for RBV analyses. Intradialytic hypotension occurred in 34%
(26/74) of treatments, associated with RBV changes of up to 30%. Intradialytic
symptoms occurred in 41% (30/74) of the treatments, 14% (10/74) were stopped
prematurely and only 53% (39/74) of UF targets could match the volume of the
intradialytic weight gain.
The hemodynamic response during HD differed between patients and is best
demonstrated using specific examples.
0
40
80
120
systolic BPHR SV
Time on dialysis (mins) 0 60 120 180 2400
1
2
3
4
COTPR
Time on dialysis (mins)
Figure 3.4: Intradialytic haemodynamic response for Patient 1
Patient 1 mounted a tachycardic response from the second hour of dialysis. She
demonstrated a slow gradual decline in her SV and CO during the first 3 hours of
dialysis with a sudden fall in both in the last hour of dialysis, associated with a drop in
her BP. Her BP essentially mimicked the TPR and as her TPR became unstable in the

75
3rd and 4th hour her BP followed suit. Within the group this was a common feature. The
systolic BP appeared to be most influenced by the TPR and thus if the rise in vascular
resistance was inadequate, a declining BP followed.
0
50
100
150
systolic BPHR SV
Time on dialysis (mins) 0 60 120 180 2400
1
2
3
4
5
COTPR
Time on dialysis (mins)
Figure 3.5: Intradialytic haemodynamic response for Patient 2
Patient 2 was haemodynamically stable for the first 2 hours of dialysis and then
suddenly dropped his CO. This was preceded by a short-lived tachycardic response and
followed by a fall in SV. The BP remained relatively stable up to this point and in fact
increased at the same time as the patient became tachycardic. As the heart rate fell so
did the SV and BP. The BP then stabilized as the TPR increased. Within the group the
drop in CO was greatest featured in patients that failed to mount an adequate
tachycardic response.

76
0
50
100
150
200
systolic BPHR SV
Time on dialysis (mins) 0 60 120 1801
2
3
4
5
COTPR
Time on dialysis (mins)
Figure 3.6: Intradialytic haemodynamic response for Patient 3
Patient 3 was a 13 year old with FSGS, oliguria, significant proteinuria and relative
hypoalbuminaemia. She demonstrated a rising CO and SV during the 2nd hr of dialysis
presumably due to refilling from the interstitial space. In spite of this, a delayed
response in TPR resulted in a falling BP. The BP recovered as the TPR increased, in
parallel with a rising CO. Please note in Patient 3 we were only able to capture data for
the first 3 hours of dialysis as she did not tolerate the finometer.
The limited number of paediatric specific finger cuffs placed an age restriction of 11
years old, under which it was not possible to successfully collect data. Previous studies
on neonates have reported success on using larger finger cuffs over the patients’ wrists,
however this method was also unsuccessful. The other major concern with the finometer
was the fact that it was not tolerated by the children for long periods of time and it was
only after a lot of cajoling and repeated efforts in some patients that I was able to
complete the study.

77
The combined group trend, as illustrated below, showed a falling CO and SV and rising
HR with time on dialysis. As the systolic BP fell in the latter half of dialysis the TPR
increased. As a general rule hypotension was the result of a falling cardiac output (CO)
combined with an insufficient rise in total peripheral resistance (TPR).
0
50
100
150
0
1
2
3
4
5
6
Heart Rate(beats/min)
SystolicBP (mmHg)
Cardiac Output(l/min)
Stroke volume(mls)
Total PeripheralResistance(arbituary units)
60 120 180 2400
Time on dialysis (mins)
Figure 3.7: Graphical representation of the combined group trend
RBV as a Predictor of Outcome
Regression analysis demonstrated a significant association between change in systolic
BP during a HD session and final RBV measurement (p=0.05), excluding data from
polyuric patients (see Figure 3.8).
The presence of polyuria as a confounder had a highly significant effect on the final
RBV reduction (p<0.0001), such that polyuric patients had higher final RBV
measurements at the end of dialysis in both successful and failed treatments.

78
Graph of Absolute Final RBV Reduction and Intradialytic Systolic BP Reduction
-20
0
20
40
60
80
40 60 80 100
Absolute RBV (%)Intr
adia
lytic
Sys
tolic
BP
red
uctio
n (m
mH
g)
Figure 3.8: Graph of absolute final RBV reduction and intradialytic BP change
Multivariate logistic regression was used to test potential predictors of treatment failure
(Table 3.2). The only variable significantly related to treatment failure was the
difference in heart rate and the presence of polyuria as a confounder was not statistically
significant. For each beat per minute increase in heart rate during dialysis there was a
5% increased risk of treatment failure (p=0.05).
Table 3.2: Logistic regression of complication free treatments in multivariate analysis
Group p value Odds ratio
95% Confidence Interval
Final RBV measurement at the end of dialysis (for each 1% increase)
0.27 0.95 0.88 – 1.04
Difference in systolic BP from the start to the end of dialysis (for each mmHg decrease)
0.11 0.97 0.926 – 1.01
Difference in diastolic BP from the start to the end of dialysis (for each mmHg decrease)
0.47 1.02 0.97 – 1.07
Difference between final and initial heart rate (for each beat/min increase)
0.05 0.95 0.92 – 0.99
R2= 0.57

79
The repeated measures ANOVA found no statistically significant difference in the rates
of change of the RBV from 1 hour to the end of treatment between successful and failed
treatments (Figure 3.9).
IInntteerrcceepptt 11 hhrr
TTiimmee oonn DDiiaallyyssiiss (hrs)
00 22 11 33
RRBBVV
110000 9900 8800 7700
SSuucccceessssffuull ttrreeaattmmeennttss -- -- -- -- -- -- -- -- FFaaiilleedd ttrreeaattmmeennttss
Figure 3.9: Individual RBV curves with group trends for treatments with and without
complications
The cumulative data in the fourth hour was small and disproportionate, there was one
treatment failure and 7 seven successful ones. To account for this bias we analyzed the
data up to the end of the third hour and the fourth hour, but as the results were the same
we have only reported on the analysis to the end of the third hour. The average RBV
measurements were higher in the successful treatments but the shape of the RBV curve
and the rate of RBV change from 1 hour to end of the third hour was not statistically
significant if including all treatments (p= 0.50) and or after excluding treatments from
polyuric patients (p= 0.75). There was a significant difference in the average RBV
measurement at the point of entry into the ANOVA analysis, namely the time intercept
1 hour (see Figure 3.8). This translates to a statistically significant difference in the
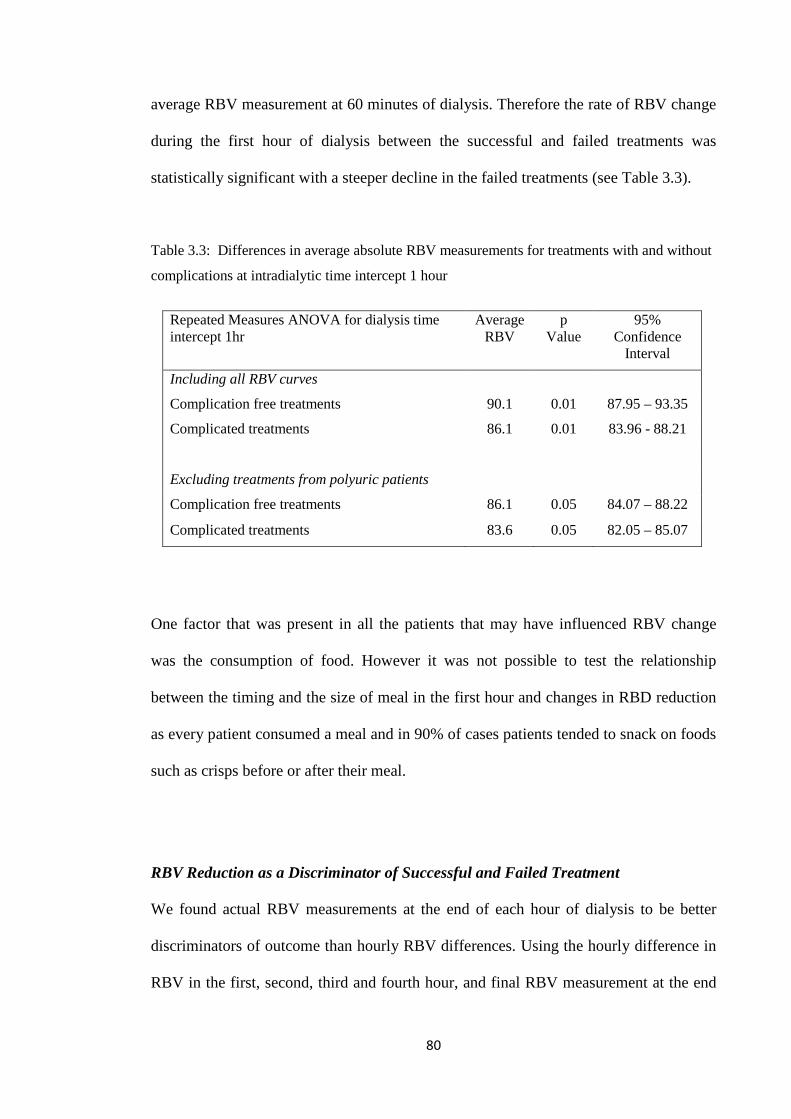
80
average RBV measurement at 60 minutes of dialysis. Therefore the rate of RBV change
during the first hour of dialysis between the successful and failed treatments was
statistically significant with a steeper decline in the failed treatments (see Table 3.3).
Table 3.3: Differences in average absolute RBV measurements for treatments with and without
complications at intradialytic time intercept 1 hour
Repeated Measures ANOVA for dialysis time intercept 1hr
Average RBV
p Value
95% Confidence
Interval
Including all RBV curves
Complication free treatments 90.1 0.01 87.95 – 93.35
Complicated treatments 86.1 0.01 83.96 - 88.21
Excluding treatments from polyuric patients
Complication free treatments 86.1 0.05 84.07 – 88.22
Complicated treatments 83.6 0.05 82.05 – 85.07
One factor that was present in all the patients that may have influenced RBV change
was the consumption of food. However it was not possible to test the relationship
between the timing and the size of meal in the first hour and changes in RBD reduction
as every patient consumed a meal and in 90% of cases patients tended to snack on foods
such as crisps before or after their meal.
RBV Reduction as a Discriminator of Successful and Failed Treatment
We found actual RBV measurements at the end of each hour of dialysis to be better
discriminators of outcome than hourly RBV differences. Using the hourly difference in
RBV in the first, second, third and fourth hour, and final RBV measurement at the end

81
of treatment, the 95% CI for the ROC area under the curve (AUC) contained 0.5 (Table
3.4). Thus these tests are redundant as their application would only provide a 50:50
odds ratio of discriminating between outcomes and were thus excluded from any further
analyses. ROC curves were only constructed for actual RBV measurements at the end
of the first, second and third hours of dialysis. The ROC curves for the first hour can be
seen in Figures 3.10 and 3.11
Table 3.4: Proposed RBV diagnostic tests and the empirical Area Under Curve (AUC)
analysis of their ROC curves
Diagnostic Test AUC 95% Confidence interval of AUC
Absolute RBV measurement at the end of the first hour 0.82 0.68 – 0.90
Absolute RBV measurement at the end of the second hour 0.79 0.62 – 0.89
Absolute RBV measurement at the end of the third hour 0.72 0.50 – 0.86
Absolute RBV measurement at the end of the fourth hour 0.50 0.20 – 0.71
Final absolute RBV measurement at the end of dialysis 0.50 0.34 – 0.63
0.00
0.25
0.50
0.75
1.00
0.00 0.25 0.50 0.75 1.00
ROC Curve of C2
1-Specificity
Sen
sitiv
ity
Figure 3.10: Empirical ROC for absolute RBV change at the end of the first hour of HD

82
0.00
0.25
0.50
0.75
1.00
0.00 0.25 0.50 0.75 1.00
1-Specificity
Sen
sitiv
ity
Figure 3.11: ROC curve of the absolute RBV change at the end of the first hour of HD based on
the binormal assumption.
The best cut point on these ROC curves represented a RBV cut-off threshold of 88% at
the end of the first hour, 84% at the end of the second hour and 82% at the end of the
third hour. The predictive value of these thresholds for determining treatment failure is
shown in Table 3.5.
Table 3.5: The predictive value of our ROC derived RBV thresholds testing for
treatment complications
RBV Threshold Sensitivity Specificity PPV NPV
88% at the end of the 1st hour of dialysis 63% 89% 86% 69%
84% at the end of the 2nd hour of dialysis 58% 94% 96% 52%
82% at the end of the 3rd hour of dialysis 78% 80% 91% 57%
Test ‘Positive’ if less than or equal to RBV threshold
Test ‘Negative’ if greater than RBV threshold
PPV- positive predictive value, NPV- negative predictive value

83
3.5 Discussion
The haemodynamic response during a 4 hour conventional HD treatment was different
and individual to each child. Similarly there was an intra-patient and inter-patient
variation in RBV profiles confounded by differences between patients with and without
significant residual renal function. The gradient of the RBV curve in the first hour and
changes in intradialytic heart rate were the strongest predictors for the occurrence of
intradialytic adverse events.
The intradialytic blood volume is dependent on several distinct factors, the volume of
the extracellular space, the dynamic balance between UF and vascular refilling during
dialysis, vascular tone and the ability to mount an adequate cardiovascular response at
times of decompensation. During the course of the dialysis session any one of these
factors could predominate and therefore also be primarily responsible for precipitating
hypotension. This would also explain the range of critical RBV thresholds that resulted
in intradialytic morbidity or the variations in the nature of the compensatory response
within patients. The analyses of the polyuric patients highlighted the relevance of an
additional factor, the hydration status of a child. One can hypothesise that patients with
a high urine output have minimal intradialytic volume expansion and their presenting
weight is almost identical to their euvolaemic target weight. Therefore minor changes in
the blood volume could result in hypovolaemia at higher RBV thresholds. At the other
extreme, in fluid overloaded patients a poor correlation exists between changes in body
weight and plasma volume with an inverse relationship between pre-dialysis BP and
intradialytic changes in the plasma volume116. Theoretically therefore, chronically fluid
overloaded patients or those with an over-estimation of their dry weight should be able
to achieve higher UF volumes without compromising their circulation.

84
The cardiovascular system demonstrates a high degree of intrinsic autoregulation
dependent on neural, hormonal and local metabolic control all of which are sensitive
and affected by disease. Uraemia alters the physiological mechanisms involved in
maintaining arteriolar tone and cardiac output. Tachycardia is an early and universal
response to all causes of intravascular compromise105 and this remains true during
paediatric HD. The tachycardic response was important both in predicting intradialytic
morbidity and supporting the cardiac output. This would suggest that in the presence of
uraemia the chronotropic response dominated over the ionotropic response. In fact
recent adult data concurs with this notion. HD induces segmental myocardial
dysfunction and even in the presence of the significant haemodynamic stress imposed
by UF the ejection fraction does not rise117. These findings raise the possibility that HD
negatively affects myocardial contractility not only in adults but perhaps in children too.
Analogous to newborns, patients with ESRD have increased basal level peripheral
sympathetic nervous system activity118. In newborns this is associated with a relative
resistance to the effects of catecholamines and thus increases in heart rate achieve little
gain in cardiac output, and if excessive may even drop the cardiac output. If we apply
the same physiology to uraemic children one can explain how the tachycardic response
is useful in predicting adverse events during dialysis but on its own is unable to prevent
hypotension from occurring. In reality this is all postulation as I have no evidence to
support whether this is the pathogenesis for the limited compensatory response in
children on dialysis, nevertheless I present data that is clearly indicative of a change in
cardiovascular phenotype in uraemic patients.

85
Children with ESRD show evidence of endothelial dysfunction, reduced vessel
compliance24 and vascular calcification119. Above this baseline risk the very act of
dialysis is thought to initiate further endothelial dysfunction. Adult HD patients have
elevated levels of endothelial cells and endothelial microparticles120, reduced
endothelial progenitor cell function121 with preservation of smooth muscle progenitor
cells122. This translates to a vascular environment conducive to injury but without the
capacity to repair, with triggers that are almost certainly multi-directional. Dialysis is
recognised as a pro-inflammatory procedure but the mechanisms continue to elude us.
UF with RBV reductions as high as 30% as demonstrated in this study alter blood
viscosity and shear stress and this can adversely influence endothelial cell survival and
quiescence. Severe reductions in afterload during dialysis can induce ischaemic
endothelial cell apoptosis with continued and repeated depletion of the body’s pool of
endothelial progenitor cells. The resultant endothelial dysfunction represents a
molecular state of activation and a switch from a quiescent phenotype towards to one
that is procoagulant, pro-inflammatory and vasoconstrictive. This is clearly counter-
productive and in all likelihood responsible for the maladaptive regulation of vascular
tone and the increased predisposition to hypotension. During paediatric HD this may be
especially important as peripheral vascular resistance was in this cohort one of the
strongest influences on systolic BP.
Similar to findings in adults, the absolute RBV reduction was unable to predict
intradialytic hypotension. Dasselar et al found a significant difference in RBV change
measurements by different NIVMs (the Crit-Line, Hemoscan, and BVM) and those
obtained from laboratory-derived haemoglobin changes123. This raises a suspicion of an
inherent flaw within all NIVMs that produces inaccuracies. RBV is based on the

86
principle of mass conservation and an assumption that the total amount of blood
constituent in the circulation is constant, with uniform mixing of red blood cells and
plasma throughout the circulation or that the relative distribution of blood constituents
over different vascular beds does not change during dialysis. We now know this
assumption to be incorrect. Whole blood haematocrit is lower than arterial or venous
haematocrit due to the dynamic reduction in microvascular haematocrit in capillaries
and venules (Fahraeus effect)15. The difference is expressed as a F-cell ratio and
approximates 0.91 in the normal population124. During HD, owing to the redistribution
of the blood from the microcirculation to the central circulation the F-cell ratio increases
and thus the observed RBV change in theory underestimates the whole body blood
volume change125. In fact Agarwal et al tested the diagnostic ability of the RBV slope in
detecting volume excess and volume depletion. They found that the area under the ROC
curve was 0.71 to predict volume excess and 0.55 to predict volume depletion126 and
hence RBV curves were superior in discriminating between volume excess than volume
depletion. Therefore the RBV curve lacks potential in predicting the critical point in
intravascular volume reduction and the onset of decompensation and this may in part be
explained by the delay in detecting real changes.
This study may not have been able to identify a universal absolute RBV threshold that
predicts intradialytic morbidity but I was able to determine and validate RBV thresholds
that discriminated between treatments with and without adverse events. Jain et al have
proposed similar RBV driven UF algorithms and in contrast to my cut-off RBV
thresholds of 88% at the end of the first hour, 84% at the end of the second hour and
82% at the end of the third hour, they defined safe UF with a RBV reduction less than
8% per hour in the first 90 minutes and less than 4 % thereafter43. The reality is that

87
both may in fact be valid and the discrepancy relates to differences in the dialysis
prescription and choice of NIVM. The Blood Volume Monitor® measures the
difference in blood density and is dependent on the total protein concentration and the
Crit-line®, the device used by Jain measures the red blood cell concentration through
assessment of the optical density of whole blood. There is no doubt that the accuracy of
readings between the two devices is similar however the RBV measurements are not
directly interchangeable. Schneditz et al demonstrated a 2% difference in relative blood
volume changes (BVM 2% less reduction in blood volume compared to Crit-line) that
developed approximately 1 hr into dialysis, and persisted thereafter41. The dialysis
prescription is also relevant to this discussion. Jain studied patients dialysed against a
fixed dialysate sodium concentration of 140mEq/l and provided no details on UF rates.
In contrast the objective of this study was to validate RBV thresholds over a range of
dialysis sodium and UF prescriptions thus making it more broadly applicable clinically.
The theoretical problem with this approach is that we know that dialysate sodium and
UF rates influence dialysis quality and risk of intradialytic symptoms and hypotension78,
127. In an attempt to address this possible bias I tested the possibility of an independent
effect of the dialysis prescription on the frequency of adverse events. By entering my
data into a repeated measures Generalized Estimating Equations model I analysed the
odds of adverse events between the UF profiles and two sodium profiles and found no
statistically significant differences between the groups. Thus I present RBV thresholds
that have the potential to guide safe UF but would recommend against prescriptive
application of these thresholds as adjustments may be required with local differences in
dialysis conditions.

88
3.6 Study limitations
First and foremost my study was performed in a small and heterogenous population.
However as this was the formal first assessment of this kind in children my initial aim
was not to be over restrictive on the recruitment process. In the world of paediatric HD
where single centre patient numbers rarely exceed 20, maintaining such a broad
inclusion criteria was necessary in order to achieve an adequate and appropriate cohort
size. Clearly in the converse it also has the potential to introduce bias.
Treatments were not standardized for patient factors such as postural changes during
dialysis and food intake which are known to influence the accuracy of NIVM and
cardiovascular dynamics. Similarly sodium and UF profiles, and the use of short
intervals of isolated UF are all dialysis factors with the potential to influence
cardiovascular stability during dialysis. The results should therefore be interpreted
within the limitations of its design.
The numbers were further depleted in the finometer study owing to the restrictions
imposed by the size limitations of the finger cuffs. The smallest finger cuff size was
only suitable for children 11 years or over and hence we were unable to get any data on
6 patients. Previous studies on neonates have reported success on using larger finger
cuffs over the patient’s wrist, but in my hands this method failed to produce an adequate
trace and was therefore abandoned. The other major concern with the finometer was the
fact that it was not tolerated by the children for long periods of time. The cuff had to be
wrapped tightly around the finger for the finger-clamp method to be effective and the
longer the cuff remained in place the greater the likelihood of adverse symptoms.
Children complained of the finger becoming numb, white and cold to touch. The wrist

89
strap that housed all the sensors and adaptors was also relatively heavy and cumbersome
and this prompted several verbal complaints. The design of the finometer was such that
it was reported to be able to cope with movements in the arm without having a hegative
impact on the trace. However this did not match my own experience. Typically a child
on dialysis would eat lunch, watch TV, play games or was encouraged to do their
homework. In the children studies the resultant movement from these activities
frequently resulted in sensor failure and repeated interruptions in the trace.
Clearly a child’s cooperation is paramount to attaining finometer data and on reflection
I feel that the method used in this study will require change during subsequent studies.
The objective in dialysis studies is to measure changes in haemodynamic variables with
time on dialysis. In theory this can also be achieved by attempting finometer traces for
15-30minute intervals per hour of dialysis. If the first time aliquot starts prior to the
patient being connected, baseline information will be captured while the final 30
minutes will capture the period at the end of dialysis and hence the time of peak stress
in addition to the recovery period during washback and disconnection from the dialysis
circuit. I am also hoping that by allowing the children respite time, free from the
finometer, compliance and co-operation may improve.
The other major limitation of this study was the fact that the two arms of the study were
conducted in different patients. The Hospital for Sick Children, Toronto had already
invested in NIVMs and hence this study was possible there. In contrast Great Ormond
Street Hospital had access to the finometer but not NIVMs. This preliminary data has
been very useful in determining group trends and directing future studies but there is no
doubt that to accurately assess trends in individual patients simultaneous data from both

90
the finometer and RBV monitoring is required. This would also be more in keeping with
the future direction of HD treatments, that of individualised treatments.
3.7 Conclusion
In conclusion the hemodynamic response to conventional HD treatments and UF is
different and individual to each child. The evolution of tachycardia and the gradient of
decline of the RBV curve during the first hour of treatment can be useful in predicting
the occurrence of intradialytic adverse events. The blood volume profiles from patients
with significant residual urine output were different from oligo-anuric patients.
Cut-off RBV thresholds of 88% at the end of the first hour, 84% at the end of the
second hour and 82% at the end of the third hour were the best discriminators of
outcome with a high specificity and PPV for treatment failure but limited sensitivity and
NPV. Knowledge of patient specific adaptive responses may allow us to target
interventions in supporting circulation during subsequent dialysis sessions.

91
Chapter Four
Myocardial Consequences of Haemodialysis

92
4.1 Hypotheses
� Uraemic children have a predisposition for demand ischaemia
� The extracorporeal blood volume necessary for priming the HD circuit
combined with the intravascular fluid depletion during UF amounts to a
significant haemodynamic stress.
� The resultant effect is HD induced cardiac perfusion defects and regional
myocardial dysfunction
� Speckle tracking two-dimensional strain is more sensitive in detecting ischaemic
myocardial dysfunction than assessment of regional wall motion activity.
4.2 Introduction
Cardiovascular mortality is grossly elevated in HD patients. CKD have a 30 fold
increase in mortality than age-matched controls and an even higher risk of up to 800
fold for dialysis and young adults20. This excess of cardiovascular death is only partly
explained by an increase in traditional risk factors, and several mechanisms of cardiac
damage specific to the uraemic milieu have been identified. It is also becoming
increasingly apparent that HD in itself confers a risk but the pathophysiological
mechanisms remain elusive. In adults there is evidence from isotopic65,
electrocardiographic60, 128, biochemical58, 59 and echocardiographic100, 117 studies
implicating HD as a source of recurrent subclinical myocardial cell injury, even in the
absence of pre-existing large vessel epicardial coronary artery disease (CAD). Single
photon emission computed tomography (PET) adult data has demonstrated acute
reductions in global and segmental myocardial blood flow during HD, with matched
reversible reductions in segmental contractile function65, consistent with the definition

93
of myocardial stunning55. The number of stunned segments and the intensity of stunning
within segments correlate with intradialytic BP changes and UF volume129. In the model
of CAD, repeated stunning leads to myocardial hibernation with resultant heart failure71.
Within dialysis patients transient myocardial ischemia precipitates cardiac
arrhythmias130 and progresses to fixed regional systolic dysfunction and reduced global
systolic function 67.
Uraemic children and young adults have a similar constellation of ischaemia
predisposing factors to adults, including increased intima media thickness and pulse
wave velocity, vascular calcification, early atherosclerosis and endothelial dysfunction
24, 119, but without significant atheromatous CAD. In the previous study I have
demonstrated that the incidence of HD induced haemodynamic disturbance is
comparable to adults, with a 20-30% incidence of intradialytic hypotension associated
with a relative blood volume reduction of 20-25%. It is therefore plausible that children
may also display a similar pathophysiology of dialysis induced cardiac injury as a result
of characteristic uraemic cardiovascular abnormalities.
Regional wall motion assessment (RWMA) is primarily an assessment in the
longitudinal axis and uses the inward motion of endocardial borders as the sole marker
of abnormal contraction. In contrast 2D speckle tracking provides a multi-axis
assessment of LV function employing functional components that are not visible to the
naked eye. Speckle tracking strain is also both translation and angle independent with
lower inter and intra-operator variability compared with RWMA131 in adults. This
makes it a very promising novel technique for detecting regional LV dysfunction,

94
especially within this context. Uraemic children have no evidence of epicardial coronary
artery disease and thus the extent of ischaemic injury may be mild and findings subtle.
4.3 Method
4.3.1 Patients
All patients at Great Ormond Street Hospital that had been on HD for at least one month
were considered for inclusion within the study. I excluded those patients with congenital
heart disease, a concurrent respiratory illness or if it was not possible to obtain
echocardiographic images of sufficient quality to allow meaningful analysis owing to
poor windows for visualizing the heart. Ethics approval for this study was granted by
the local research ethics board and informed consent was obtained from patients or their
guardians.

95
Table 4.1: Patient Demographics
n/a: not available
AV fistula: arteriovenous fistula
LV: left ventricle
* Patients recruited for the Regional wall motion Study § Patients recruited for the 2D strain Study
Patient Age
(yrs)
Time on HD
(mths)
Cause of ESRD AV
fistula
LV septum
[Z-score]
LV Posterior
wall
[Z-score]
* § 1 5 4 Renal dysplasia yes 1.3 1.7
* § 2 17 89 Cystinosis yes 1.6 0.3
* § 3 15 43 Focal segmental
glomerulosclerosis yes 0.1 1.4
* § 4 15 4 Renal dysplasia yes 0.3 0.2
* § 5 15 32 Focal segmental
glomerulosclerosis yes 2.6 1.9
* § 6 13 4 Renal dysplasia no 5.9 6.3
* § 7 11 35 Renal dysplasia yes 0.5 -0.6
* § 8 13 15 Focal segmental
glomerulosclerosis no 0.6 -1.1
* § 9 2 7 Glomerulocystic disease no 1.5 1.7
* 10 17 12 Reflux nephropathy yes 1.9 1.7
* 11 7 62 Autosomal recessive
polycystic kidney disease yes 1.0 0.3
* § 12 14 6 Cystic dysplasia yes 2.6 1.2
§ 13 13 2 Focal segmental
glomerulosclerosis no 0.4 03
§ 14 2 2 Nephronophthisis no 1.2 1.3 § 15 1 2 Oxalosis no 0.7 0.8
§ 16 8 24 Congenital nephrotic
syndrome no n/a n/a
§ 17 15 2 Renal dysplasia no 1.4 1.6

96
Of the 17 patients 9 had AV fistulae as their dialysis vascular access and in the
remainder central tunnelled venous catheters were used. 5 patients had previous failed
transplants and 2 patients had three months of peritoneal dialysis prior to HD. Residual
urine output varied amongst the study group, 7 patients were anuric, 5 patients passed
less than 1ml/kg/hr of urine and 5 patients passed between 1-2 mls/kg/hr. At their
baseline examinations only one patient had LV hypertrophy and three patients had
borderline hypertrophy (see Table 4.1
4.3.2 Dialysis Prescription
All patients were dialysed using Gambro 200S® dialysis monitors. Patients received
HD for 4 hours, 3 times per week. All dialysis membranes were high flux polysulfone
or triacetate cellulose membranes using sizes that at minimum were equivalent to each
patient’s body surface area. For all treatments the dialysate contained sodium140
mmol/l, potassium 2mmol/l, calcium 1.75mmol/l, magnesium 0.5mmol/l, bicarbonate
34mmol/l with a small quantity of acetate in the acidic component to stabilise the
dialysate. The dialysate temperature was set at a constant value of 37.0˚C. Dialysate
flow rates were maintained at 500mls/min and blood pump speeds varied between
80mls/min to 400mls/min depending on the patients’ size. The dialysis prescription was
adjusted monthly to achieve a urea reduction ratio greater than 65% and Kt/V urea
greater than 1.2 (calculated from Daugiradas single pool kinetics)115. All patients
received unfractionated heparin as required. Patients were permitted to consume one
meal during their treatment. For each session, net fluid removal was set on an individual
basis and adjusted to restore the patient to their ideal dry weight (clinically determined)
by the end of the dialysis session. UF took place in parallel with dialysis using constant

97
UF rates unless patients had higher than normal UF requirements. In these
circumstances patients received 30 minutes of isolated UF at the beginning and/or the
end of the HD session.
4.3.3 Regional wall motion assessment
Technique
Using 2-dimensional (2D) echocardiography standard apical 2-chamber and 4-chamber
views are taken to visualise the LV endocardial border in 2 planes at 90 degrees to each
other. These images are then copied onto CDs in DICOM format for off-line analysis
using a personal computer based digitising programme (Echo-CMS, MEDIS, Leiden,
The Netherlands)132. Three consecutive heartbeats were analysed for each time point
(extrasystolic beats were excluded). Endocardial borders (excluding papillary muscles)
were traced semi-automatically for each videoframe of the 3-beat sequence, and any
anomalies corrected manually. Maximal displacement of the endocardial border from a
centre point was then measured over each of 100 chords around the LV wall, corrected
for end-diastolic LV circumference (see Figure 4.1) and expressed as percentage
shortening fraction (SF). Each apical view was divided into 5 segments and SF for the
chords in each segment was averaged so 10 regions of the LV were assessed at each
time point. Any segmental endocardial border that was not clearly visible was excluded
from analysis. Segmental reduced regional wall motion (RRWM) was defined as a
decline in SF of >20% from baseline and degrees of hyperkinesis 20% and 50% were
defined as those segments that demonstrated a increase in SF of >20% and >50%
respectively. I calculated the mean SF for all ten segments (SF[Overall]), for those
segments that developed new RRWM (SF[RRWA]) and those segments that did not

98
develop RRWM (SF[Non-RRWM]). Ejection fraction (EF) was calculated from the apical
four chamber and 2 chamber view by the Simpson’s rule. The LV posterior and septal
wall thickness was measured from parasternal long axis M-mode images, and
represented as Z-scores after adjusting for age and body surface area.
Figure 4.1: Assessment of regional wall motion activity by Echo CMS.
On the left panel highlighted in blue is an example of a semi-automatic tracing of the
endocardial border. On the right panel each red line represents a measurement of the regional
endocardial border movement.
Study Protocol
For each monitored dialysis treatment, serial echocardiography was performed at the
start of dialysis (baseline), 2 hours into the dialysis session, the end of the dialysis
session and at recovery 15mins after dialysis, once a saline wash-back had been given
and the patients had been disconnected from the machine. Ideally I would have
preferred a longer period post dialysis prior to re-assess the cardiac function, but owing
to travel times and other social reasons patients refused. Blood samples were collected
before and after each session in lithium heparin and EDTA tubes, and biochemical

99
analysis performed on a multichannel autoanalyser for routine electrochemical, full
blood count and high sensitivity C-reactive protein (hsCRP). Cardiac troponin-I (cTnI)
analysis was preformed using a chemiluminescent assay on a Beckman Access
Immunoassay analyser. Pre dialysis blood tests were drawn immediately after insertion
of access needles or catheter connection, and post levels were taken from the arterial
line after reducing the blood pump speed to 50ml/min. During each dialysis session the
net UF volume and intradialytic symptoms with corresponding heart rate and BP
measurements were recorded. For each patient echocardiography data was collected
during two separate dialysis sessions, separated by no more than four weeks. The
primary endpoint of HD induced myocardial stunning was determined from the degree
of change in LV segmental SF, and the number of segments involved. The secondary
endpoint was to assess whether a relationship existed between reduced segmental LV
function and intradialytic BP and UF volume.
Statistical analyses
The data comprised of 2 data sets of 12 from the same patients. Therefore in order to
determine the prevalence of myocardial stunning only one data set was used, selected at
random, by tossing a coin. To test the association between dialysis and patient related
factors and the severity of stunning I was able to combine the data sets by incorporating
a repeated measures analysis into the analysis.
The results were expressed as mean ± SD if parametric or the median and interquartile
range (IQR) if non-parametric. Echocardiographic and haemodynamic data were
analysed using one-way analysis of variance (ANOVA), with a design for repeated
measures. Depending on Gaussian distribution, all other data were analysed using either

100
the paired or unpaired t tests or the Mann-Whitney or Wilcoxon matched pair tests. To
test for the association between both the mean %SF[RRWM] and SF[non-RRWM] at 240
minutes against dialysis related factors (UF volume-mls/kg dry weight, intradialytic
BP) and patients related factors (dialysis vintage, age) I used univariate regression
analysis adjusting for repeated measures. I did not attempt multivariate logistic
regression analysis due to the relatively small sample size. In all analyses, an alpha error
at p<0.05 was judged to be significant.
4.3.4 Speckle tracking two-dimensional strain assessment
Technique
The speckle tracking strain software analyzes motion by tracking ‘speckles’ from frame
to frame in 2D echocardiogram images. Speckles are natural acoustic markers of 20-40
pixels that are equally distributed throughout the myocardium. By following the
movement of each speckle throughout a single cardiac cycle a temporal assessment of
myocardial muscle deformation is achieved (see Figure 4.2).
Standard grayscale 2D images were acquired in the 4-chamber apical views and
parasternal short-axis views at the level of the papillary muscles (the level of mid wall
contraction) using frame rates of 50 frames per second minimum. The apical images
were required to assess peak longitudinal strain and the parasternal images for radial
and circumferential strain. The images were stored digitally in raw format for analysis
later. From an end-systolic single frame a region of interest was traced on the
endocardial border by a point-and-click approach. The 2D strain algorithm then
automatically evaluates the tracking quality at each myocardial region over time and
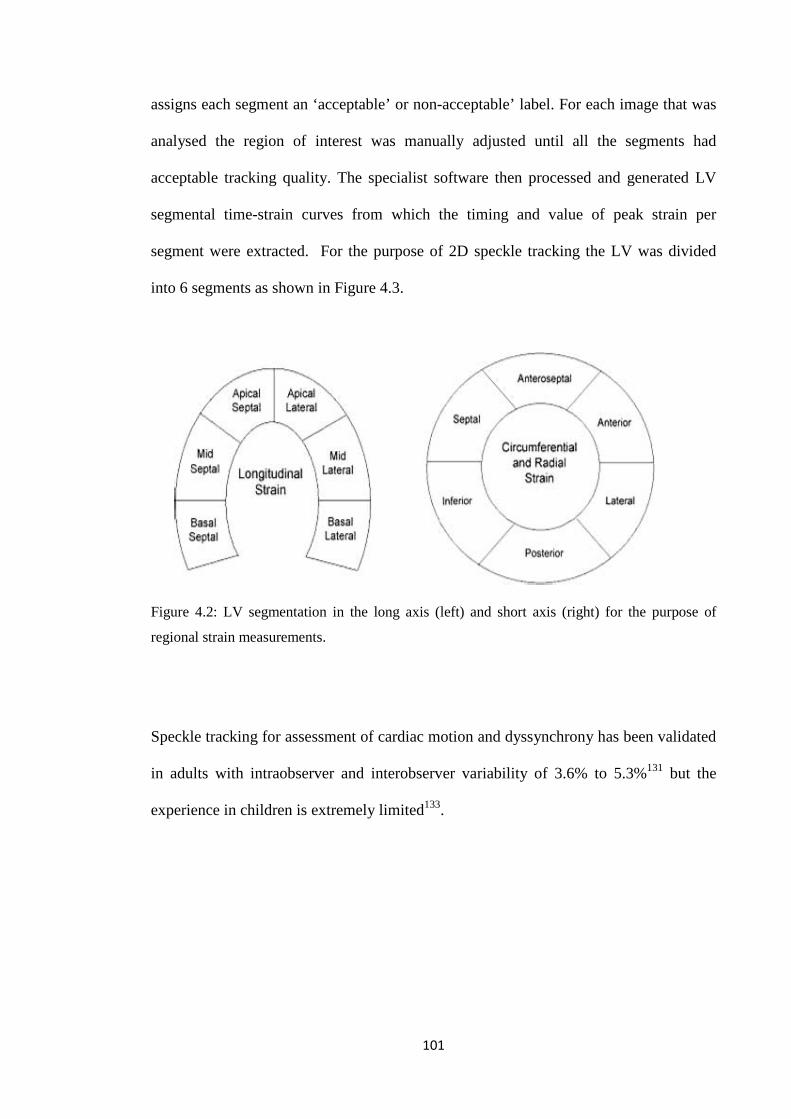
101
assigns each segment an ‘acceptable’ or non-acceptable’ label. For each image that was
analysed the region of interest was manually adjusted until all the segments had
acceptable tracking quality. The specialist software then processed and generated LV
segmental time-strain curves from which the timing and value of peak strain per
segment were extracted. For the purpose of 2D speckle tracking the LV was divided
into 6 segments as shown in Figure 4.3.
Figure 4.2: LV segmentation in the long axis (left) and short axis (right) for the purpose of
regional strain measurements.
Speckle tracking for assessment of cardiac motion and dyssynchrony has been validated
in adults with intraobserver and interobserver variability of 3.6% to 5.3%131 but the
experience in children is extremely limited133.

102
Figure 4.3: Two-Dimensional Strain Imaging.
In the left panels the strain images are represented. The arrows highlights the type of deformation
assessed in each view: radial thickening (A), circumferential shortening (B), and longitudinal shortening
(C). The right panel demonstrate the segmental time-strain curves for a synchronous left ventricle AVC
refers to aortic valve closure and represents the end of systole. [Adapted from Delgado134].

103
Study Protocol
For each monitored dialysis treatment, echocardiography was performed at the start of
dialysis (baseline) and again at the end of the dialysis session, the time of peak stress.
During each dialysis session intradialytic symptoms with corresponding heart rate and
BP measurements were recorded in addition to the net UF volume at the end of each
treatment. The images were then analysed with specialist 2D speckle tracking software
to generate segmental longitudinal, radial and circumferential time strain curves. For
each time point the peak segmental strain was recorded. To test for dyssynchrony two
parameters were used, i) the maximal time delay between peak strain of 2 segments and
ii) asynchrony index, which was derived by calculating the standard deviation of time to
peak strain over the 6 segments.
Finally speckle tracking 2D strain assessments were performed on age matched controls
at rest using longitudinal and parasternal (papillary muscle level) 2D echocardiographic
grayscale images.
Statistical analyses
Echocardiographic and haemodynamic data differences within patients at the start and
end of HD were analysed using ANOVA, with a design for repeated measures. Pearsons
correlation analyses were performed to assess the relation between intradialytic strain
reduction and dialysis related factors (UF volume-mls/kg dry weight, intradialytic BP)
and patients related factors (dialysis vintage, age). Univariate linear regression analyses
were used to determine predictors of intradialytic BP change. In all analyses, an alpha
error at p<0.05 was judged to be significant.
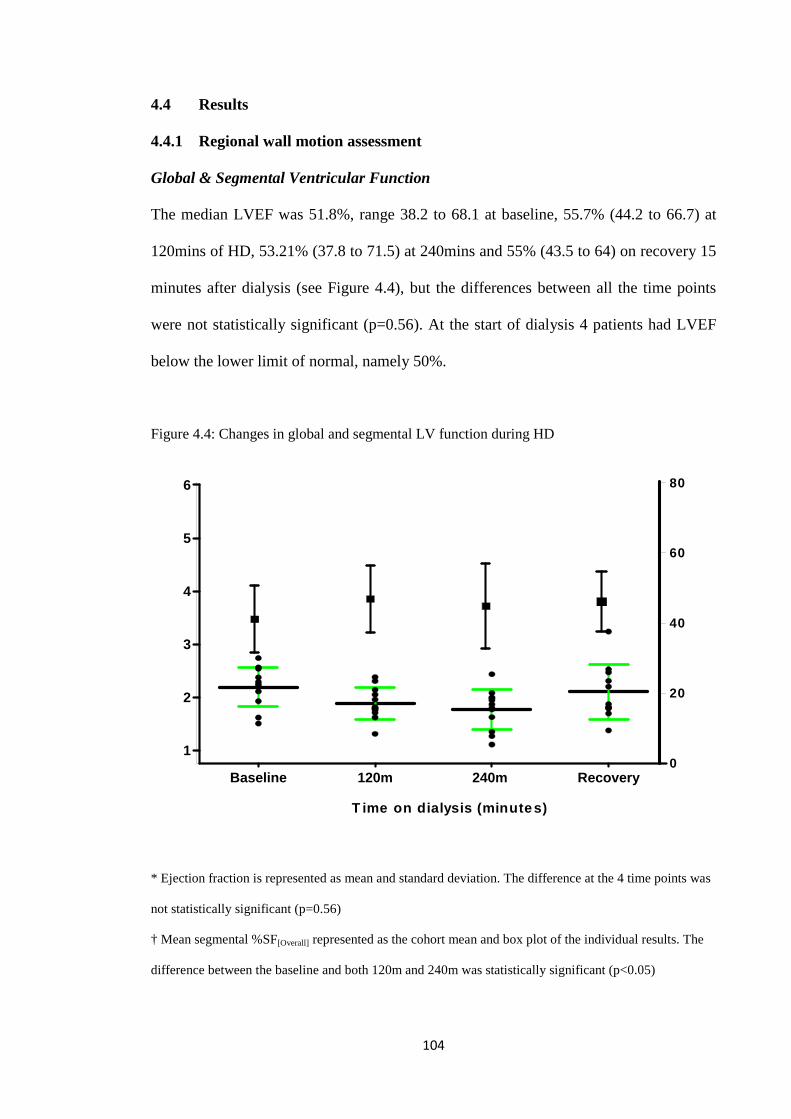
104
4.4 Results
4.4.1 Regional wall motion assessment
Global & Segmental Ventricular Function
The median LVEF was 51.8%, range 38.2 to 68.1 at baseline, 55.7% (44.2 to 66.7) at
120mins of HD, 53.21% (37.8 to 71.5) at 240mins and 55% (43.5 to 64) on recovery 15
minutes after dialysis (see Figure 4.4), but the differences between all the time points
were not statistically significant (p=0.56). At the start of dialysis 4 patients had LVEF
below the lower limit of normal, namely 50%.
Figure 4.4: Changes in global and segmental LV function during HD
* Ejection fraction is represented as mean and standard deviation. The difference at the 4 time points was
not statistically significant (p=0.56)
† Mean segmental %SF[Overall] represented as the cohort mean and box plot of the individual results. The
difference between the baseline and both 120m and 240m was statistically significant (p<0.05)
0
20
40
60
80
Baseline 120m 240m Recovery
1
2
3
4
5
6
T ime on dialysis (minutes)

105
All 12 patients developed segments with RRWM in 1-5 segments (see Figure 4.5), with
co-existing 20% hyperkinesis in 1-4 non stunned segments in 11/12 patients from
120mins that persisted into recovery. In addition 9/12 patients exhibited 50%
hyperkinesis in as many as 3 segments. Again this was evident at 120mins and persisted
into recovery (see Figure 4.5), Of the 35/120 segments that stunned mid-cavity
segments dominated followed by basal and then apical segments.
Figure 4.5: Segmental RRWM and hyperkinesis during HD
120m 240m Recovery0
2
4
6
8
10
Time on Dialysis
Nu
mb
er o
f se
gm
ents
invo
lved
0
2
4
6
8
1020% Hyperkinesis
0
2
4
6
8
10
50% Hyperkinesis
120m 240m Recovery0
2
4
6
8
10
Time on Dialysis
Nu
mb
er o
f se
gm
ents
invo
lved
0
2
4
6
8
1020% Hyperkinesis
0
2
4
6
8
10
50% Hyperkinesis
The resultant effect on segmental shortening fraction was a fall of the mean segmental
%SF[Overall] from 2.2 ± 0.4 (mean ± standard deviation) at baseline to 1.9 ± 0.3 by
120mins, 1.8 ± 0.4 at 240mins with an increase to 2.1 ± 0.5 post dialysis (see Figure
4.6). The difference was statistically significant when comparing baseline segmental
%SF[Overall] to that at 120mins and 240mins (p<0.05) but did not reach significance on
comparing %SF[Overall] at 120mins, 240mins (p=0.34) and at recovery. There was a

106
statistically significant fall in the mean segmental %SF[RRWM] from 2.7 ± 1.1 at baseline,
1.9 ± 0.7 at 120mins, 1.4 ± 0.6 at 240mins, and 2.2 ± 0.7 at recovery (p<0.05) (see
Figure 4.7).
Figure 4.6: Differences in mean segmental percentage SF in those developing RRWM
P<0.05 P=0.17
P=0.38
P<0.05
Baseline 120 mins 240 mins Recovery0
1
2
3
4
5
6
P<0.05 P=0.17
P=0.38
P<0.05
Baseline 120 mins 240 mins Recovery0
1
2
3
4
5
6
Baseline 120 mins 240 mins Recovery0
1
2
3
4
5
6
Figure 4.7: Mean segmental percentage SF in those developing RRWM
0 120 240 15m post0
1
2
3
4
5
Time on dialysis (minutes)
Mea
n se
gmen
tal S
F(%
)

107
10/12 patients showed evidence of resolution of RRWM on recovery, as early as
15mins after completing dialysis (see Figure 4.8). The mean segmental %SF[nonRRWM]
increased from baseline to 240mins, 2.0 ± 0.6 to 2.3 ± 0.6 but did not reach statistical
significance (p=0.07) (see Figure 4.8). The mean segmental %SF in the segments that
developed RRWM was higher at baseline compared with those that did not (2.35 ± 0.52
versus 1.98 ±0.63) (see Figure 4.8).
Figure 4.8: Mean Segmental Percentage Shortening Fraction Relative to Time On HD
• Significant difference between %SF[Overall] {baseline v 120m}
• and {baseline v 240m} (p<0.05)
† Significant difference between %SF[RRWM] {baseline v 120m}, {baseline v 240m}, {120m v 240m} and
{240m v recovery} (p<0.05)
‡ In the remaining groups the difference was not statistically significant
Baseline 120m 240m Recovery0
1
2
3
4
%SF[non-RRWM]
%SF[RRWM]
%SF[Overall]
Time on dialysis (minutes)

108
This pattern of dialysis induced segmental RRWM is consistent with the definition of
myocardial stunning. Pictorial representation of serial regional wall motion assessment
from 2 patients illustrates the transient regional myocardial dysfunction that is seen
during a HD treatment (see Figures 4.9 and 4.10).
Figure 4.9: Serial regional wall motion assessment from Patient 7 during HD
Figure 4.10: Serial regional wall motion assessment from Patient 9 during HD
Baseline End of dialysis Recovery -
15 mins post HD
RRRRWWMM RRRRWWMM
HHyyppeerrkkiinneessiiss
RReessoolluuttiioonn
RRRRWWMM
Recovery-15
mins post HD End of dialysis Baseline
RRRRWWMM
RReessoolluuttiioonn
HHyyppeerrkkiinneessiiss
RRRRWWMM

109
Factors Associated With The Development Of Myocardial Stunning
The median intradialytic systolic BP fall for the group was 25 mmHg (range 6-
90mmHg) and the lowest intradialytic systolic dialysis BP ranged from 58 to
110mmHg. A strong correlation was seen between intradialytic systolic BP change and
mean segmental %SF[RRWM] (r = 0.56, p<0.05) as shown on figure 4.11. Similarly on
univariate linear regression analysis there was a significant association between
intradialytic systolic BP changes and mean segmental %SF[RRWM] (p<0.05), but not
against lowest intradialytic systolic BP (p=0.68).
.51
1.5
22.
5st
unne
d
-50 0 50 100dbpFall in systolic BP
Segmental %SF
r= r= --0.320.32
P= 0.14P= 0.14
.51
1.5
22.
5st
unne
d
-50 0 50 100dbpFall in systolic BP
Segmental %SF
r= r= --0.320.32
P= 0.14P= 0.14
Figure 4.11: Graph of intradialytic blood pressure change and LV mean segmental shortening
fraction
The median UF volume for the group was 29.4mls/kg (range 2-94mls/kg), and in one
patient no UF was attempted. There was no significant association between UF volume
and the number of segments that developed RRWM, or the mean segmental %SF[RRWM].
Likewise on univariate linear regression analysis there was no association between UF
volumes and mean segmental %SF[RRWM] (p=0.6). When considering both intradialytic

110
BP change and UF against the mean segmental %SF[RRWM] the relationship between
intradialytic BP change and the mean segmental %SF[RRWM] disappeared (p=0.24). In
this patient group UF volume correlated with change in BP during HD (r=0.56, p<0.05)
as shown in Figure 4.12. Similarly on univariate linear regression there was a significant
association between systolic BP change and UF volume (p<0.05, r2 0.32).
0
20
40
60
80
100
-40 -20 0 20 40 60 80 100
Systolic BP change (mmHg)
UF
vo
lum
e (m
ls/k
g)
Figure 4.12: Graph illustrating the relationship between Systolic BP change and UF volume
I found no significant relationship between the number or intensity of RRWM as
measured by the mean %SF[RRWM] against patient age, dialysis vintage, pre-dialysis
plasma urea levels, anaemia, LV mass, hsCRP or cTnI and the presence of a
arteriovenous fistula. I could not test for the relationship between the absolute or change
in heart rate during dialysis and RRWM as it was impossible to separate the tachycardic
response that evolved as part of the haemodynamic response to HD and that as a direct
result of the children, especially the infants, getting upset and crying during their echo
assessments.

111
Hematological &Biochemical Profile& Markers of Cardiac Injury
The biochemical and hematological profile was typical of HD patients, showing a
prevalence of anaemia (n= 5), hyperparathyroidism (n=7), hyperphosphataemia (n= 5)
and acidosis (n=4). Routine laboratory values and dialysis adequacy are summarised in
Table 4.2. Values for hsCRP exceeded 1µg/l in 6 patients post-dialysis and 3µg/l in one
patient post-dialysis. In 8/12 patients the post-dialysis cardiac troponin I (cTnI) levels
remained the same as pre-dialysis levels of <0.04µg/l. In the remaining 4 patients the
cTnI levels increased post dialysis to up to 0.07µg/l (see Table 4.3).
Table 4.2: Biochemical and Haematological Profile
Mean ± Standard Deviation Range
Pre-dialysis Urea (mmol/l) 22.5 ± 4.2 15.2 to 28.2
Post-dialysis Urea (mmol/l) 4.5 ± 1.5 1.5 to 6.9
KT/V urea 2.0 ± 0.5 0.5 to 3.1
URR (%) 80 ± 6 72 to 91
Haemoglobin (g/dl) 11.5 ± 1.4 9.1 to 13.1
Potassium (mmol/l) 5.3 ± 0.7 3.7 to 6.4
Phosphate (mmol/l) 1.5 ± 0.6 0.6 to 2.9
Albumin (g/l) 38.3 ± 2.5 34 to 41
PTH (pmol/l) 22.4 ± 22.9 0.3 to 89
Ionised Calcium (mmol/l) 1.2 ± 0.1 1.09 to 1.44
Bicarbonate (mmol/l) 23.9 ± 2.4 20 to 27
hs CRP (µg/l 1.9 ± 1.5 0.4 to 5.5
URR: urea reduction rate
PTH: parathyroid hormone
hsCRP: highly sensitive C-reactive protein

112
Table 4.3: Cardiac Troponin I levels pre and post dialysis
Patient Baseline cTNI (µg/l) Post dialysis cTNI (µg/l)
1 <0.04 0.04
2 0.05 0.07
3 <0.04 0.04
4 <0.04 <0.04
5 <0.04 <0.04
6 <0.04 <0.04
7 <0.04 <0.04
8 <0.04 0.04
9 <0.04 <0.04
10 Not available Not available
11 <0.04 <0.04
12 <0.04 <0.04
cTNI: Cardiac Troponin I

113
4.4.2
Speckle tracking two-dimensional strain assessment
For each patient speckle tracking 2D strain echo images were acquired during a single
HD. However during the data analysis and thus assessment of peak strain and
asynchrony three cardiac cycles were analysed per patient at each time point.
Peak Segmental Strain
Compared with age matched controls the peak segmental longitudinal strain was lower
in uraemic patients at the start of dialysis. The difference was statistically significant in
the baso-septal, mid-septal, mid-lateral and baso-lateral segments. During dialysis the
peak longitudinal strain fell and the difference was statistically significant in all the
segments (see Table 4.4).
There was no segmental difference in peak circumferential strain between the controls
and uraemic patients pre-dialysis. During dialysis the peak circumferential strain fell
and the difference was statistically significant in the lateral and posterior segments. The
exception was the antero-septal segments in which the peak circumferential strain was
significantly higher (see Table 4.5).
Segmental peak radial strain was lower in uraemic children pre-dialysis compared with
age matched controls. The difference was statistically significant in the anterior,
posterior, inferior and lateral segments. During dialysis the peak radial strain increased
in all the segments but the difference only achieved statistical significance in the
posterior segments (see Table 4.6).

114
Inter-segmental Synchronicity
The asynchrony index or standard deviation of time to peak strain over the 6 segments
was significantly higher pre-dialysis compared with the controls and higher still post
dialysis in all 3 axes. Similarly the maximum inter-segmental time difference to peak
strain progressively increased from the age matched controls to uraemic patients pre-
dialysis and higher still in the post dialysis patients. The difference was statistically
significant in the longitudinal, circumferential and radial axes (see Table 4.4 to 4.6).
Figures 4.13 and 4.14 represent longitudinal time strain curves for patients 7 and 9, the
same patients whose regional wall motion assessments were shown in Figures 4.9 and
4.10 earlier in this chapter. The longitudinal strain curves demonstrate a reduction in
peak longitudinal strain post dialysis and variations in the time to peak strain between
the 6 segments.

115
Table 4.4: LV segmental longitudinal strain
Pre-dialysis
Mean
[95% CI]
Post-dialysis
Mean
[95% CI] §
Control
Mean
[95% CI] *
Peak basal-septal strain -17.93
[-18.75 to -17.11]
-16.10
[-17.30 to -14.89] § p<0.05
-20.10
[-21.29 to -18.92]
* p<0.05
Peak mid-septal strain -19.01
[-19.73 to -18.30]
-17.35
[-18.22 to -16.47] § p<0.05
-21.40
[-22.27 to -20.53]
* p<0.05
Peak apical-septal strain
-21.20
[-22.32 to -20.07]
-16.69
[-18.13 to -15.24] § p<0.05
-21.42
[-22.79 to -20.06]
* p=0.73
Peak apical-lateral strain
-17.24
[-18.72 to -15.77]
-14.08
[-15.58 to -12.59] § p<0.05
-17.33
[-19.12 to -15.54]
* p=0.16
Peak mid-lateral strain -15.02
[-16.22 to -13.81]
-12.45
[-13.83 to -11.07] § p<0.05
-17.75
[-19.11 to -16.38]
* p<0.05
Peak basal-lateral strain -17.60
[-19.11 to -16.10]
-15.00
[-16.40 to -13.60] § p<0.05
-21.41
[-23.1 to -19.73]
* p<0.05
Time of peak segmental strain [Inter-segmental time SD]
45.60
[41.43 to 49.77]
51.85
[44.53 to 59.16] § p<0.05
34.95
[29.45 to 40.46]
* p<0.05
Time of peak segmental strain [Inter-segmental time difference]
108.02 msecs
[96.47 to 119.56]
129.22 msecs
[107.51 to 150.94]
§ p<0.05
81.07 msecs
[65.83 to 96.30]
* p<0.05
§ Difference between pre- and post-dialysis patients
* Difference between pre-dialysis patients and controls

116
Table 4.5: LV segmental circumferential strain
Pre-dialysis
Mean
[95% CI]
Post-dialysis
Mean
[95% CI] §
Control
Mean
[95% CI] *
Peak antero-septal strain
-25.75
[-28.55 to -22.95]
-27.93
[-30.64 to -25.23] § p<0.05
-24.75
[-27.78 to -21.71]
* p=0.63
Peak anterior strain -22.00
[-24.30 to -19.70]
-20.75
[-22.94 to -18.58] § p=0.20
-20.50
[-22.84 to -18.16]
* p=0.24
Peak lateral strain -17.54
[-19.99 to -15.10]
-12.24
[-13.88 to -10.59] § p<0.05
-17.35
[-19.99 to -14.70]
* p=0.37
Peak posterior strain -12.92
[-15.62 to -10.22]
-12.63
[-15.47 to -9.78] § p<0.05
-14.23
[-16.77 to -11.69]
* p=0.27
Peak inferior strain -16.99
[-19.04 to -14.95]
-16.75
[-18.67 to -14.82] § p=0.21
-17.79
[-20.66 to -14.92]
* p=0.64
Peak septal strain -23.45
[-25.22 to -21.67]
-23.15
[-25.39 to -20.91] § p=0.31
-22.65
[--26.72 to -18.59]
* p=0.71
Time of peak segmental strain [Inter-segmental time SD]
63.02
[50.64 to 75.39]
55.95
[47.90 to 64.00] § p<0.05
35.34
[28.10 to 42.58]
* p<0.05
Time of peak segmental strain [Inter-segmental time difference]
164.27 msecs
[125.49 to 203.06]
138.12 msecs
[117.49 to 158.75]
§ p<0.05
84.41 msecs
[64.82 to 103.99]
* p<0.05
§ Difference between pre- and post-dialysis patients
* Difference between pre-dialysis patients and controls

117
Table 4.6: LV segmental radial strain
Pre-dialysis
Mean
[95% CI]
Post-dialysis
Mean
[95% CI] §
Control
Mean
[95% CI] *
Peak antero-septal strain 36.16
[30.36 to 41.96]
47.81
[35.99 to 59.62] § p=0.13
43.44
[36.27 to 50.62]
* p=0.11
Peak anterior strain 41.13
[34.32 to 47.93]
45.11
[39.12 to 51.10] § p= 0..88
54.57
[47.21 to 61.93]
* p<0.05
Peak lateral strain 46.50
[37.82 to 55.18]
46.93
[40.58 to 53.28] § p=0.07
62.20
[55.29 to 69.11]
* p<0.05
Peak posterior strain 45.25
[36.64 to 53.86]
47.17
[40.24 to 54.10] §p<0.05
63.15
[55.83 to 70.47]
* p<0.05
Peak inferior strain 40.78
[34.39 to 47.12]
44.56
[37.74 to 51.37] § p= 0.2
55.59
[47.01 to 64.16]
* p<0.05
Peak septal strain 36.04
[30.46 to 41.63]
41.57
[35.33 to 47.82] § p=0.08
43.37
[35.41 to 51.33]
* p=0.12
Time of peak segmental strain [Inter-segmental time SD]
34.94
[25.79 to 44.09]
35.09
[25.14 to 45.04] § p=0.05
22.07
[15.27 to 28.86]
* p<0.05
Time of peak segmental strain [Inter-segmental time difference]
81.59 msecs
[58.72 to 104.46]
79.07 msecs
[53.75 to 104.39] § p<0.05
48.43 msecs
[32.22 to 64.64]
* p<0.05
§ Difference between pre- and post-dialysis patients
* Difference between pre-dialysis patients and controls

118
Figure 4.13: Longitudinal time strain curves for patient 7. The top panel is pre-dialysis and the
lower panel post dialysis.

119
Figure 4.14: Longitudinal time strain curves for patient 9. The top panel is pre-dialysis and the
lower panel post dialysis.

120
Factors Associated with Strain Reduction
Intradialytic peak longitudinal strain reduction was significantly associated with systolic
BP, change in systolic BP during dialysis and the UF volume (see Table 4.7). During
HD neither peak circumferential nor peak radial strain reductions were found to be
significantly associated with intradialytic BP, UF volumes or dialysis vintage (see
Tables 4.8 and 4.9).
Table 4.7: Factors associated with peak longitudinal strain reduction during HD
Pearson’s Correlation
R2 p-value Logistical Regression Coefficient
p-value
Absolute systolic BP -0.26 0.07 p<0.05 0.22 0.41
Intradialytic systolic BP change 0.317 0.10 p<0.05 -0.18 0.54
UF (mls/kg) 0.30 0.09 p<0.05 0.09 0.76
Months on HD 0.05 0.002 p=0.71 0.13 0.80
Table 4.8: Factors associated with peak circumferential strain reduction during HD
Pearson’s Correlation
R2 p-value Logistical Regression Coefficient
p-value
Absolute systolic BP 0.20 0.04 p=0.18 0.04 0.9
Intradialytic systolic BP change -0.03 0.001 p=0.87 -0.09 0.71
UF (mls/kg) 0.14 0.02 p=0.34 0.04 0.9
Months on HD -0.26 0.07 p=0.09 -0.88 0.13

121
Table 4.9: Factors associated with peak radial strain reduction during HD
Pearson’s Correlation
R2 p-value Logistical Regression Coefficient
p-value
Absolute systolic BP 0.07 0.005 p=0.73 0.03 0.89
Intradialytic systolic BP change -0.15 0.02 p=0.44 0.18 0.28
UF (mls/kg) -0.22 0.05 p=0.91 0.05 0.81
Months on HD -0.08 0.006 p=0.70 0.16 0.72
Predictors of Intradialytic Systolic BP
Within the cohort of 15 patients the UF volume ranged from 3mls/kg/hr to 86mls/kg/hr.
The lowest documented intradialytic systolic BP ranged from 58mmHg to 140mmHg.
On univariate linear regression analyses percentage strain reduction was not predictive
of intradialytic BP (see Table 4.10).
Table 4.10: Predictors of intradialytic systolic BP
Correlation Coefficient
Significance
% Reduction in peak longitudinal strain during HD 0.42 p=0.19
% Reduction in peak circumferential strain during HD 0.19 p= 0.52
% Reduction in peak radial strain during HD 0.03 p=0.91
The intradialytic systolic BP reduction ranged from 6mmHg to 90mmHg. On univariate
linear regression analyses both the percentage reduction in longitudinal strain and radial
strain were significantly predictive of intradialytic systolic BP fall (see Table 4.11).
Percentage reduction in longitudinal strain showed a positive correlation but radial
strain showed a negative correlation, namely a greater fall in BP is seen in patients
where peak radial strain shows little change during dialysis.

122
Table 4.11: Predictors of intradialytic systolic BP fall
Correlation Coefficient
Significance
% Reduction in peak longitudinal strain during HD 0.66 p<0.05
% Reduction in peak circumferential strain during HD -0.32 p=0.19
% Rise in peak radial strain during HD -0.70 P<0.05
4.5 Discussion
The prevalence of myocardial stunning in patients with CAD is high, cumulative and
associated with an attendant risk of increased CV events and mortality. The same
phenomenon has now been demonstrated in prevalent adult dialysis patients117 and ‘low
risk’ non-diabetic, non-cardiac adult HD patients68 but until now there has been no
evaluation of the risk in children. Compared with age matched controls I have
demonstrated altered baseline myocardial function in uraemic children aged between 1
to 17 years. During conventional 4 hour HD the myocardial function deteriorates further
with biochemical evidence of ischaemic injury. The effect is global across all segments
as opposed to a segmental distribution specific to an isolated coronary artery. The
adverse impact on myocardial fibres within the LV wall is however specific with a
predisposition to LV longitudinal shortening. The degree of myocardial dysfunction is
associated with intradialytic blood pressure change and UF volumes. Nonetheless owing
to an early compensatory hyperkinetic response in regions of the LV, preservation of
circumferential shortening and increased radial thickening, the global LVEF did not fall,
but arguably neither did it rise as one would expect following a significant
hemodynamic challenge.

123
Left ventricular contraction relies on the co-ordinated shortening action of myocardial
fibres in multiple directions: longitudinal shortening, radial thickening and
circumferential shortening combined with torsion of the heart. The alignment of heart
fibres and resultant patterns of regional strain is heterogeneous. The coronary blood
supply to segments of the heart also shows significant variation. In this study regional
wall motion assessment (RWMA) demonstrated significant dialysis induced regional
myocardial dysfunction with preponderance for basal and apical segments. The strain
analyses showed a reduction in peak strain but the difference was only significant in the
longitudinal axis and all the segments were involved. With this discrepancy in
segmental involvement there is an implication that 2D strain may be more sensitive
measure than wall motion of mild segmental LV dysfunction. RWMA assessment is
primarily an assessment in the longitudinal axis and uses the inward motion of
endocardial borders as the sole marker of abnormal contraction. However the visual
estimation of wall motion can be very subjective and does not take into account wall
thickening, twisting or transmyocardial heterogeneity. In contrast 2D speckle tracking
provides a multi-axis assessment of LV function employing functional components that
are not visible to the naked eye. The motion of myocardial tissue is measured indirectly
by the motion pattern of speckles tracking along the direction of the wall, not along the
ultrasound beam. This makes it both translation and angle independent with lower inter
and intra-operator variability compared with RWMA131. Furthermore in a direct
comparison of the two, assessments of wall motion cannot differentiate between active
and passive movement of a myocardial segment whereas deformation has the ability to
discriminate. In the heart this is particularly important as ventricular wall motion is
position dependent. As the apical parts of the ventricle pull down the ventricular base,
the wall motion increases from apex to base and thus some of the measured wall motion

124
effect in the base is the combined effect of contraction and also apical tethering. Thus
even completely passive segments can show motion but not deformation. 2D speckle
tracking is a novel method for assessing regional myocardial function with minimal
experience in children. In adults however myocardial strain quantification has been
validated against tagged cardiac magnetic resonance imaging135 and has been shown to
be accurate and it is fast becoming the tool of choice in evaluating patients prior to
cardiac resynchronisation, differentiating between hibernating myocardium and
infracted myocardium. My limited experience in children was very positive and
parallels these reports in adults.
Longitudinally directed fibres are mainly located in the subepicardium and
subendocardium regions of the LV. They only form a small proportion of the total
ventricular myocardial mass but play a major role in the maintenance of normal ejection
fraction. I found a selective reduction in longitudinal strain during HD. In simple terms
this can be explained away by the heterogeneity of the heart architecture, however the
apparent vulnerability of longitudinal shortening is not too dissimilar to other disease
states and therefore unlikely to be either a coincidence or a normal variation. A degree
of long-axis systolic dysfunction has been frequently reported in conjunction with
diastolic dysfunction136. Regional reduction in the extent and velocity of long axis
shortening has been shown to be a sensitive and specific finding after myocardial
infarction137, 138. In hypertensive patients LV long axis function abnormalities have been
found to present even before the onset of hypertension, but circumferential fractional
shortening remain unchanged137. Both hypertension and diastolic dysfunction are
features common to children on dialysis22, 27, 139 and their presence may in part be
125
responsible for the findings or they share a common pathogenic pathway for
longitudinal axis dysfunction dominance.
One feature that distinguishes children from adults is the absence of significant
epicardial atheromatous CAD. They do however share a high prevalence of risk factors
for adult-type cardiovascular disease that have been associated with a reduced coronary
flow reserve and thus a propensity to demand ischaemia140. Of these, hypertension,
anaemia, hyperparathyroidism and hyperphosphataemia were significantly prevalent in
these patients. Children can also display a constellation of altered functional and
morphological cardiovascular features that predisposes them to ischaemic insults. LVH
for example progresses to maladaptive cardiac remodeling characterized by decreased
capillary density, subendothelial perfusion141 and decreased coronary contractile
reserve142. Overt LVH was present in one patient and borderline hypertrophy in another
3 patients. 5/17 of the patients were common to a study conducted by Shroff et al.119
reporting findings of diminished arterial wall compliance and coronary and carotid
artery calcification. Such vascular abnormalities are accepted markers of asymptomatic
arteriosclerosis and mortality143 and perhaps indicative of coronary microcirculation
abnormalities. Evidence for inappropriately raised sympathetic nerve activity in dialysis
patients118 raises the possibility of an alternative explanation for the regional LV
dysfunction, namely takotsubo or ’stress’ cardiomyopathy144. However Dasselaar et al
demonstrated a fall in regional and global myocardial blood flow, 30 minutes into a HD
session, in the absence of UF that preceded regional LV dysfunction68. This is the
inverse of the causal sequence of takotsubo or ‘stress’ cardiomyopathy. In addition the
children showed no evidence of apical ballooning, a feature typical of classical
takotsubo cardiomyopathy. Nevertheless the effects of raised sympathetic nerve activity
126
may be relevant by mediating microvasculature derangement and vasospasm. I found no
significant association between biochemical and cardiac risk factors and the severity of
myocardial stunning. This is most likely due to the fact cardio-renal performance is
influenced by a number of humoral and genetic factors145 that act collectively to exert
an effect but in isolation, particularly in paediatrics, are too small to be detectable from
our sample size.
The major determinant of intradialytic BP is cardiac output and end diastolic volume 146
but clearly regional LV function is important as evidenced by reports of reduced
haemodynamic stability in patients developing myocardial stunning despite below
average UF volumes129. Shoji et al found BP reduction during dialysis and not
hypertension in adult HD patients as a factor that influenced survival negatively147. I
found the UF volume and both the reduction and absolute intradialytic systolic BP to be
related to dialysis induced longitudinal axis LV dysfunction, but only reduction in
systolic BP was significantly associated with abnormalities in regional wall motion.
These differences are most likely related to technique differences. 2D speckle tracking
is slowly gaining credence over RWMA with improved accuracy and reproducibility
qualities. It also has the ability to detect subtle and milder abnormalities in regional LV
dysfunction, particularly those secondary to ischaemia, and thus even weak correlations
became more apparent. Peak segmental strain was not predictive of absolute systolic BP
but percentage changes in LV longitudinal shortening and radial thickening were both
found to be predictive of intradialytic blood pressure changes. The implication is that
actual BP is not as important as the failure to maintain BP in initiating and propagating
myocardial stunning during dialysis. Children appear to be different to adults, with a
more direct relationship between BP and UF volumes. In addition, as a consequence of
127
residual renal function, some exist closer to their dry weight and are thus very sensitive
to fluid shifts during dialysis. Combined with a poorly compliant left ventricle27 and
peripheral conduit vessels32, 33, abnormal vascular tone, UF mediates a reduction in
cardiac output and BP. In the face of an attenuated coronary reserve, ischemia prevails
when the hemodynamic demand of HD is not met by an adequate increase in
myocardial blood flow.
There is considerable evidence alluding to the value of both CRP 39 and baseline cardiac
troponin as markers of cardiovascular disease and mortality in ESRD. An acute rise in
cardiac troponin levels in HD patients is also indicative of sub-clinical myocardial
ischaemic injury 58, 59, 63. I found elevated levels of high sensitivity CRP in half of the
dialysis patients that were tested and a rise in cardiac Troponin I (cTnI) levels in 25%.
Elevated plasma cardiac troponins levels are usually only seen 6-12 hours after the
acute injury. However in this study post-dialysis plasma samples were taken 15minutes
after the end of the HD session and this may explain my failure to demonstrate a rise in
cardiac troponin I levels in more of the patients. In the patients that did demonstrate a
rise in plasma cardiac enzmyes levels it is conceivable that the cardiac insult occurred
early in the 4hour HD session and thus levels were detectable post-dialysis. An earlier,
alternative marker of cardiac injury is mechanical synchronisation of LV contraction.
Dssynchronous left ventricular long axis function is common in patients with chronic
stable coronary artery disease136. In fact the presence and localisation of asynchrony
correlates closely with reversible abnormalities on thallium myocardial perfusion
scanning138 and precedes ECG changes or symptoms and changes in myocardial systolic
amplitude of motion. Asynchrony is believed to a sensitive and earlier marker of
ischaemia148. I observed an exaggerated dssynchrony index in longitudinal,

128
circumferential shortening and radial thickening at the end of HD. This may reflect
ischaemic injury that was detected earlier than more traditional biochemical markers of
cardiac injury. Within this context it has the potential for becoming very useful in the
clinical environment in identifying ‘at risk’ patients.
4.6 Study Limitations
This was a preliminary study looking at regional LV dysfunction in children on HD and
the sample size was small. Nevertheless the study was adequately powered for the
primary outcome. RWMA and analysis was repeated twice in the same patient and the
results showed concordance in the localization of abnormalities but the number of
segments involved differed. This may indicate poor reproducibility or conversely is the
consequence of differences in intra-patient UF volumes and intradialytic hemodynamic
parameters between treatments. 2D speckle tracking analyses of the same patients were
again consistent with findings from RWMA but the prevalence of segmental myocardial
dysfunction was higher. This is likely to be due to the fact that 2D speckle tracking
screened LV function in 3 axes and the assessment incorporated an additional
parameter, dyssynchrony index, and was thus a more sensitive test.
I have already alluded to the limitations of RWMA. However looking specifically
within the context of children, 2D speckle analyses are also at risk of inaccuracy.
Normally, the resting heart rate is influenced by the age of the child and the younger the
child the higher their resting heart rate. During dialysis patients become tachycardic.
The optimal frame rate for speckle tracking seems to be 50–70 frames per second,
however in the face of tachycardia this could result in under sampling. In an attempt to
manage this problem I tried to use higher frame rates but this resulted in a reduction of

129
spatial resolution and in some patients this had to be abandoned as a result of less than
optimal speckle tracking. In essence neither assessment is perfect but the gold standard
for assessing functional change, magnetic resonance imaging, is technically impossible
in patients while they are receiving HD. Of the two assessments speckle tracking shows
more promise in detecting regional LV function, however prior to recommending it for
general application 2D speckle tracking use must be validated in children.
In this study I have made two assumptions. Firstly, having extrapolated from adult data,
I have implied that HD in children is also associated with reduced myocardial blood
flow. I have also assumed based both on negative findings or the absence of reports in
the literature that none of the children in the cohort had significant epicardial CAD.
Both of these questions could have been answered by subjecting the children to
angiography or perfusion imaging but I elected not to do this due to the practical
implications and severe reluctance from both the patients and dialysis nurses. Of the
two, perfusion imaging may be considered to be less invasive, however adult data
suggests that myocardial scintigraphy is imperfect in detecting CAD in patients with
ESRD [De Lima JJ,03] and indeed doubts about applicability in patients with more
severe CKD has led to renal disease currently not being categorised in the most recent
‘Appropriateness Criteria for Stress Echocardiography’ recommendations149.
4.7 Conclusion
I have shown for the first time that paediatric patients receiving conventional HD suffer
from dialysis induced myocardial stunning. As in adults, this reflects the degree of HD
induced haemodynamic instability. This data, in combination with previous adult

130
studies suggest that even in the absence of conventional epicardial coronary artery
disease the characteristic cardiovascular phenotype in uraemic HD patients is severe
enough to limit the microvasculature response to haemodynamic stress and predisposes
to significant demand myocardial ischemia.
Myocardial stunning is progressive with raised attendant mortality. In any serious
attempt to modify the cardiovascular burden in dialysis patients we will require an
accurate method for detecting ischaemic myocardial injury. In my limited experience
the novel method of 2D speckle tracking was superior to the traditional method of
regional wall motion assessment as it is able to offer a more comprehensive assessment
of LV function combined with the possibility of detecting ischaemic myocardial injury
in its early stages.

131
Chapter Five
Moderators of Intradialytic Morbidity

132
5.1 Hypotheses
� Manipulating the HD prescription can improve intradialytic morbidity during
paediatric dialysis
� The use of sodium and UF profiles improves cardiovascular stability
� The prescribing of intradialytic mannitol reduces the frequency and severity of
intradialytic symptoms
� The application of sequential dialysis during the course of the dialysis treatment
improves the UF potential
5.2 Introduction
The development of intradialytic symptoms and hypotension can result in premature
discontinuation of treatment and delivery of sub-optimal dialysis with an attendant
adverse impact on health150. Broadly speaking dialysis failure (in the absence of clotting
the extracorporeal circuit) has two aetiologies, dialysis dysequilibrium and UF mediated
cardiovascular decompensation. The challenge is that during an acute episode
symptoms can be non-discriminatory and their pathophysiological mechanisms obscure.
Thus developing strategies to prevent or manage dialysis failure is both difficult and
may have variable results. The recognised measures for improving haemodynamic
stability during HD, such as avoiding food during dialysis151 and treating intradialytic
hypocalcaemia16 are of limited value. Experience with newer methods such as sodium
and UF profiles78 and intradialytic mannitol are inconsistent and limited in paediatrics.

133
5.3 Subjects and Methods
5.3.1 Prevalent chronic HD patients
I developed a standardized practice for prescribing chronic HD at the Hospital for Sick
Children, Toronto. After 8 months the data from these dialysis treatments was collected
and analysed. I included all children on HD for a minimum of one month, excluding
those patients receiving nocturnal HD and those that were acutely unwell and/or in the
paediatric intensive care unit. Ethics approval for this study was granted by the local
research ethics board and informed consent was obtained from patients or their
guardians.
Patients
Baseline characteristics of the patients and dialytic treatments are listed in Table 5.1. A
total of 11 patients were studied, 5 female and 6 male. The underlying renal disease was
focal segmental glomerulosclerosis (1 patient), autosomal recessive polycystic kidney
disease (1 patient), renal dysplasia (4 patients), chronic drug toxicity and BK virus
nephropathy secondary to cardiac transplant (1 patient), membranous
glomerulonephritis (1 patient), ANCA negative glomerulonephritis (1 patient),
unknown (2 patients). 5/11 patients were polyuric (daily urine output >1.5mls/kg/hr);
one had panhypopituitarism; one had a chronic history of intradialytic cramping; one
had been treated with a second heart transplant and had evidence of significant right
ventricular dilatation on a peak dobutamine stress test but normal right and left
ventricular function at rest. The resting heart rate was no different between the cardiac
transplant patients and the remaining patients. Throughout the observation period 6
patients were normotensive without medication, 2 patients were on one antihypertensive

134
and 3 patients were on two antihypertensives. 3/11 patients had evidence of ventricular
or septal hypertrophy.
Table 5.1: Baseline characteristics of patients and their dialytic treatments
Sex (M/F) 5/5
Age (years) 12.8 ± 2.93
Dry weight (kg) 40.2 ± 15.6
Urine output (yes/no) 5/5
Urine output (mls/kg/hr) 1.61 ± 0.81
Pre-dialysis plasma haemoglobin (g/l) 94.8 ± 11.9
Pre-dialysis plasma albumin (g/l) 35.8 ± 4.63
Pre-dialysis plasma ionised calcium (mmol/l) 1.24 ± 0.16
Mean gross UF (mls/session) 1475 ± 937
Mean gross UF (%body weight /session) 4.77 ± 2.09
Blood flow rate (mls/min) 120-350
Dialysate flow rate (mls/min) 200-650
Kt/V 1.71 ± 0.27
Mean Systolic BP at the start of dialysis (mmHg) 113 ± 20.5
Mean Diastolic BP at the start of dialysis (mmHg) 68.1 ± 12.3
Mean Heart rate at the start of dialysis (beats/min) 100 ± 19.2
The Standardised HD Prescription
All patients were dialysed using the Fresenius 2008K® or 2008H®. Patients received
HD for 3hrs, 4 times per week or for 4hrs, 3 times per week. All dialysis membranes
were high flux, triacetate cellulose or polysulfone membranes. Dialysis flow rates
varied between 200 to 650mls/min but were kept constant by a dialysate to blood flow
ratio of 2 to 2.5. Blood flow rates were calculated to provide an estimated urea
clearance of 4mls/kg/min. The dialysis prescription was adjusted monthly to achieve a

135
urea reduction ratio between 65 to 80% and Kt/V urea between 1.2 and 1.6 (calculated
from Daugiradas single pool kinetics)115. All patients received heparin as standard
anticoagulation or no heparin if they were at a risk of bleeding. Patients were dialysed
against 35mmol/l bicarbonate, 1.25mmol/l calcium, with a small quantity of acetate in
the acidic component to stabilise the dialysate. The dialysate temperatures were set at
constant value of 37.5˚C. Patients were permitted to consume one meal during the first
hour of their treatment. Mannitol was given if the pre-dialysis plasma urea
concentration was greater than 35mmol/l or if the patient experienced symptoms
suggestive of dialysis dysequilibrium (severe headaches or altered levels of
consciousness) on at least two separate occasions during previous dialysis treatments.
For these patients 1g/kg mannitol was administered intravenously during the first hour
of the first weekly dialysis session or 0.5g/kg during two dialysis sessions per week.
UF Profiles
The prescribed UF rate was determined from the interdialytic weight gain plus the
volume of fluid given during the dialysis treatment including priming fluid, blood
products and nutrition. Pre-programmed Fresenius 2008K UF profile patterns outlined
in Figure 5.1 were used (when the Fresenius 2008H machine was used the UF profiles
were adjusted to match those on the 2008K model). As shown profile 3 was a
decreasing step pattern, profile 6 an alternating high/low UF rate and profile 2 a
decreasing linear pattern. The maximum UF rate in any programme did not exceed 1.5
times the average rate.

136
UF profile 3 UF profile 6 UF profile 2
0
30
60
90
120
150
0
30
60
90
120
150
0
30
60
90
120
150
Figure 5.1: UF profiles
Dialysate Sodium Ramping
All standard treatments were prescribed a universal dialysate sodium gradient of
148mmol/l at the start of dialysis, ending with a concentration of 138mmol/l. During the
linear sodium profile the dialysate sodium was decreased at a linear but constant rate to
the final concentration. During the step profile the starting dialysate sodium was
continued until the last 30 minutes of dialysis and then dropped in one step to the final
concentration.
Study Protocol
A step wise approach to sodium and UF profiling was introduced for all the patients.
Step 1: linear sodium profile + UF profile 3 for one week, followed by one week of step
sodium profile + UF profile 3. The patient was then continued on the regimen with the
least intradialytic symptoms, unless 2 treatment failures occurred, as defined below. In
the event of two treatment failures the patient moved to Step 2, namely: linear sodium
profile + UF profile 6 for one week, followed by one week of step sodium profile + UF
profile 6. The patient again continued on the regimen with the least intradialytic
symptoms, unless a further 2 treatment failures occurred. The patient then moved to
137
Step 3: linear sodium profile + UF profile 2 for one week, followed by one week of step
sodium profile + UF profile 2. This was continued on the regimen with the least
intradialytic symptoms, unless 2 treatment failures occurred. Finally Step 4: linear
sodium profile + UF profile 0 (constant UF rate) for 1 week, followed by one week of
step sodium profile + UF 0. This was continued on the regimen with the least intra-
dialytic symptoms, unless 2 treatment failures occurred. At this point the patient exited
form the study protocol.

138
2 Treatment Failures
SSTTEEPP 11
wwwwwwww LLiinneeaarr ssooddiiuumm pprrooffiillee ++ UUFF pprrooffiillee 33 ffoorr oonnee wweeeekk
wwwwwwww SStteepp ssooddiiuumm pprrooffiillee ++ UUFF pprrooffiillee 33 ffoorr oonnee wweeeekk
SSTTEEPP 22
wwwwwwww LLiinneeaarr ssooddiiuumm pprrooffiillee ++ UUFF pprrooffiillee 66 ffoorr oonnee wweeeekk
wwwwwwww SStteepp ssooddiiuumm pprrooffiillee ++ UUFF pprrooffiillee 66 ffoorr oonnee wweeeekk
SSTTEEPP 33
wwwwwwww LLiinneeaarr ssooddiiuumm pprrooffiillee ++ UUFF pprrooffiillee 22 ffoorr oonnee wweeeekk
wwwwwwww SStteepp ssooddiiuumm pprrooffiillee ++ UUFF pprrooffiillee 22 ffoorr oonnee wweeeekk
SSTTEEPP 44
wwwwwwww LLiinneeaarr ssooddiiuumm pprrooffiillee ++ UUFF pprrooffiillee 00 ffoorr oonnee wweeeekk
wwwwwwww SStteepp ssooddiiuumm pprrooffiillee ++ UUFF pprrooffiillee 00 ffoorr oonnee wweeeekk
2 Treatment Failures
2 Treatment Failures
SSttuuddyy PPrroottooccooll

139
Treatment failure was defined as, i) premature discontinuation of the dialysis session,
ii) intradialytic hypotension requiring a fluid bolus and iii) failure to achieve the dry
weight only if the UF goal was less than or equal to 5% of the dry weight.
During each dialysis treatment the patient’s heart rate, gross UF volume and BP was
recorded hourly, at the time of an adverse event prior to any nursing intervention, and
after recovering from it. A single BP reading was taken with an automated Dinamapp
machine and a cuff adjusted for size. The first Task Force 5th percentile systolic blood
pressure measurements, adjusted for age and sex8 were used to define intradialytic
hypotension except in a single patient with co-existing panhypopituitarism in whom the
cut-off systolic blood pressure was set at 75mmHg. In the event of a hypotensive
episode UF was stopped and if the BP failed to recover after 15 minutes or the patient
began to clinically deteriorate, a bolus of normal saline was administered.
In addition the following information was recorded during each treatment: i) description
of intradialytic symptoms, ii) nature of any dialysis nurse intervention, iii) changes to
the UF rate, and iv) administration of mannitol, blood products, or fluid boluses. At the
end of the dialysis treatment the patient’s weight and final UF volume was recorded.
The dry weight was assessed monthly by a clinical assessment combined with a review
of post-dialysis weights at which the patient displayed no symptoms indicative of
under-hydration at the end of their treatment.
Outcome Measures
The outcome measures were categorized into 4 distinct groups:
OUTCOME 1 - occurrence of intradialytic symptoms and/or temporary suspension UF

140
OUTCOME 2 - administration of saline bolus and/or episode of hypotension
OUTCOME 3 - success in achieving the desired dry weight
OUTCOME 4 - UF volume expressed as a percentage of the dry weight calculated from
the gross UF volume as the denominator
The primary endpoints were a comparison of sodium ramping and UF profiles 2,3 and 6
against the defined outcome measures and to determine the effects of intradialytic
mannitol on these outcomes. The secondary endpoint was determining the volume of
UF that was achievable by our standardized dialysis prescription. Polyuric patients were
excluded from the analyses for OUTCOMES 3 and 4.
Statistical Analyses
All values of continuous variables were presented as mean ± standard error or 95%
confidence interval. A paired t test was used to determine whether there were significant
differences between continuous variables at the 95th confidence interval. The incidence
of observed events was expressed as a percentage, dividing the number of sessions
during which an event occurred over the total number of sessions. For a more robust
statistical comparison of the impact of the different treatments on outcome, a repeated
measures Generalized Estimating Equations model was fitted to the data to account for
the internal correlation structure of the data as a result of having repeated measures per
subject. Treatment comparisons of linear versus step, 4 different sodium profiles, UF
profile 0 versus 2, 3 and 6 and mannitol versus no mannitol were analysed and
expressed as an odds ratio. A repeated measures ANOVA model was fitted to the
percent dry weight data, our only continuous outcome. All statistical tests were two
tailed with a p-value less than or equal to 0.05 taken to indicate significance.

141
5.3.2 Children prone to dialysis failure
Patients
During the previous study any child that had premature discontinuation of their dialysis
treatment at minimum once weekly, on 3 separate occasions per treatment month, was
selected. Of the 11 children, 6 were identified as being prone to severe intradialytic
symptoms or hypotension and recruited for this study. The patient demographics are
shown in Table 5.2. Ethics approval for this study was granted by the local research
ethics board and informed consent was obtained from patients or their guardians.
Dialysis Prescriptions
All patients were dialysed against the standardised HD prescription for 3 hours 4
times/week or 4 hours 3 times/week using high flux membranes with dialysis flow rates
between 200 to 650mls/min and blood flow rates adjusted to provide an estimated urea
clearance of 4mls/kg/min. All patients were dialysed against 35mmol/l bicarbonate with
a small quantity of acetate in the acidic component to stabilise the dialysate, 1.25mmol/l
calcium solution and decreasing sodium profiles of 145-148mmol/l at the onset falling
to 135-138mmol/l in a step-wise manner. The dialysate temperature was set at 37.5˚C
and treatments were programmed using a constant UF (UF profile 0).
All 6 patients underwent a trial of prophylactic mannitol and sequential dialysis.
Mannitol was given if the pre-dialysis plasma urea concentration was greater than
35mmol/l or if the patient experienced symptoms suggestive of dialysis dysequilibrium
(severe headaches or altered levels of consciousness) on at least two separate occasions
during previous dialysis treatments. For these patients 1g/kg mannitol was administered
intravenously during the first hour of the first weekly dialysis session or 0.5g/kg during
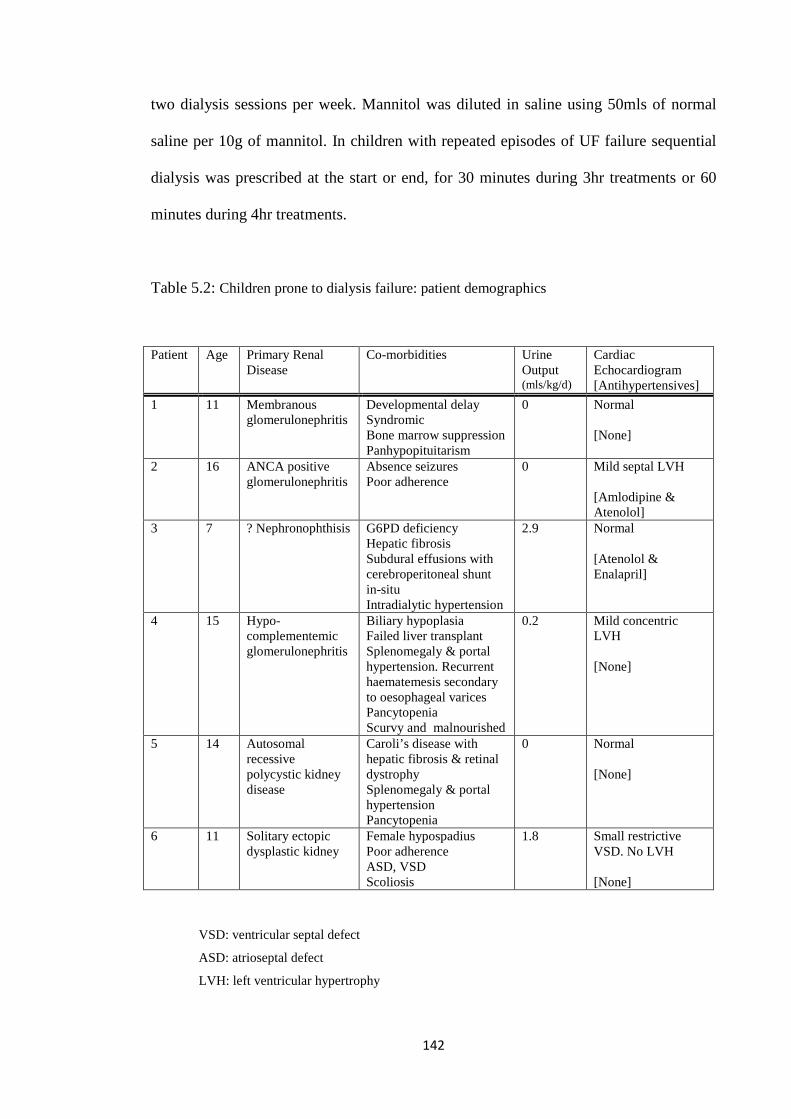
142
two dialysis sessions per week. Mannitol was diluted in saline using 50mls of normal
saline per 10g of mannitol. In children with repeated episodes of UF failure sequential
dialysis was prescribed at the start or end, for 30 minutes during 3hr treatments or 60
minutes during 4hr treatments.
Table 5.2: Children prone to dialysis failure: patient demographics
VSD: ventricular septal defect
ASD: atrioseptal defect
LVH: left ventricular hypertrophy
Patient Age Primary Renal Disease
Co-morbidities Urine Output (mls/kg/d)
Cardiac Echocardiogram [Antihypertensives]
1 11 Membranous glomerulonephritis
Developmental delay Syndromic Bone marrow suppression Panhypopituitarism
0 Normal [None]
2 16 ANCA positive glomerulonephritis
Absence seizures Poor adherence
0 Mild septal LVH [Amlodipine & Atenolol]
3 7 ? Nephronophthisis G6PD deficiency Hepatic fibrosis Subdural effusions with cerebroperitoneal shunt in-situ Intradialytic hypertension
2.9 Normal [Atenolol & Enalapril]
4 15 Hypo-complementemic glomerulonephritis
Biliary hypoplasia Failed liver transplant Splenomegaly & portal hypertension. Recurrent haematemesis secondary to oesophageal varices Pancytopenia Scurvy and malnourished
0.2 Mild concentric LVH [None]
5 14 Autosomal recessive polycystic kidney disease
Caroli’s disease with hepatic fibrosis & retinal dystrophy Splenomegaly & portal hypertension Pancytopenia
0 Normal [None]
6 11 Solitary ectopic dysplastic kidney
Female hypospadius Poor adherence ASD, VSD Scoliosis
1.8 Small restrictive VSD. No LVH [None]

143
Study Protocol
During dialysis the patient’s heart rate and BP was recorded hourly throughout
treatment, at the time of symptoms and upon recovery. The first Task Force 5th
percentile systolic BP measurements8 defined intradialytic hypotension except in Patient
1 whose cut-off systolic BP was set at 75mmHg. In the event of a hypotensive episode
UF was stopped and if the BP failed to recover after 15 minutes or the patient began to
clinically deteriorate, a bolus of normal saline was administered. At the end of the
dialysis treatment the patient’s weight and final gross UF volume was recorded. The dry
weight was assessed monthly and qualified from a clinical assessment combined with a
review of the post-dialysis weight and the onset of symptoms indicative of under-
hydration following dialysis.
Outcome Measures
The outcome measures were categorized into 3 groups:
OUTCOME 1 - intradialytic symptoms (abdominal pain, cramps, headaches, loss of
consciousness or change in behaviour)
OUTCOME 2 - hypotension or premature discontinuation of dialysis, due to persistence
of hypotension/ symptoms in spite of a single fluid bolus
OUTCOME 3 - percentage dry weight removed (calculated as gross UF volume divided
by the estimated dry weight).
Statistical Analyses
All values of continuous variables were presented as mean ± standard error. A paired t
test was used to determine whether there were significant differences between
continuous variables at the 95th confidence interval. For a statistical comparison of the

144
impact of the different treatments on outcome, a repeated measures Generalized
Estimating Equations model was fitted to the data to account for the internal correlation
structure of the data as a result of having repeated measures per subject. A repeated
measures ANOVA model was fitted to the percent dry weight data, our only continuous
outcome. All statistical tests were two tailed with a p-value less than or equal to 0.05
taken to indicate significance.
5.4 Results
5.4.1 Prevalent chronic HD patients
A total of 506 dialysis treatments were reviewed with 162/506 (32%) from polyuric
patients. A linear sodium profile of 148mmol/l to 138mmol/l was used in 219/506
(43%) treatments and a step profile in 287/506 (57%). UF profile 2 was used in 103/506
(20%) treatments, UF profile 3 in 137/506 (27%) treatments, UF profile 6 in 19/506
(4%) treatments and no UF profile in 287/506 (57%) treatments. Mannitol was
prescribed in 48/502 (9%) treatments.
The prevalence of intradialytic symptoms (OUTCOME 1) was 26%. Intradialytic
hypotension or administration of a fluid bolus (OUTCOME 2) occurred in 19%. The
desired dry weight was achieved in 124/344 (36%) treatments from non-polyuric
patients. Using our standardized dialysis prescription combining sodium and UF
profiling and intra-dialytic mannitol we achieved UF goals ranging from 3.2% to 9.7%
of the dry weight (OUTCOME 4). Analysed individually the mean UF volume for all
the interventions were greater than the current recommendations of 5% from the

145
European Haemodialysis Guidelines152 with mannitol achieving the highest mean UF
volume (see Table 5.3).
The overall treatment failure rate was 33% (167/506 treatments). Treatment failure due
to premature discontinuation of the dialysis session occurred in 20/506 treatments and
of these 5 were due to hypotension episodes and 15 due to intradialytic symptoms.
Failure due to the development of intradialytic hypotension requiring a saline bolus
occurred in 37/506 treatments. Finally 115/506 treatments failed to achieve the desired
dry weight, despite a target UF goal less than 5%. The treatment protocol resulted in
significant morbidity in one patient who had a history of panhypopituitarism, bone
marrow failure and was prone to hypotensive episodes. He became unconscious during
4 dialysis treatments. This was associated with marked hypotension and bradycardia
and was thought to be secondary to a Bezold-Jarisch reflex. Owing to the severity of his
symptoms he was excluded from the protocol prematurely but his data was included and
analysed up to and including the 4th episode. One patient developed intradialytic
symptoms and interdialytic fatigue with UF profile 6 on two consecutive dialysis
sessions and refused further treatments with UF profile 6.
Linear Versus Step Sodium Ramping
There was no significant difference between linear and step sodium ramping and the
onset of intradialytic symptoms. Compared with the step profile the linear profile
increased the odds of hypotensive episodes or premature discontinuation of treatment by
27% (see Table 5.4). The likelihood of achieving the dry weight was no different
between the step and linear sodium profiles and the mean UF volume for both was
virtually identical at 5.4% of estimated dry weight (see Table 5.3).

146
UF Profiles
The UF profiles were no better than a constant UF rate (UF profile 0) in preventing
intradialytic symptoms, hypotensive episodes or premature discontinuation of dialysis
(see Table 5.4). UF profile 2 was the least effective in achieving the desired dry weight,
reducing the odds by 40% when compared to a constant UF rate, reducing the odds by
60% compared with profile 3 and reducing the odds by 36% when compared against UF
profile 6. The latter was not statistically different and neither were the remaining UF
profile comparisons. Profile 3 increased the odds of achieving the dry weight by 50%
compared with a constant rate and UF profile 6 was virtually identical to a constant UF
rate (see Table 5.4). The mean UF was however higher with all 3 profiles compared to
UF profile 0, but only the difference between profile 2 and 0 were statistically
significant (Table 5.3). Therefore all 3 UF profiles had mean UF volumes greater than
5% of the dry weight but none of them significantly increased the odds of achieving the
dry weight.
Mannitol
Compared to dialysis treatments without mannitol, the administration of mannitol
reduced the odds of intradialytic symptoms by 64% (p<0.05) but did not improve the
odds of preventing intradialytic hypotension or achievement of the desired dry weight
(see Table 5.4). The mean UF volume was statistically greater with mannitol compared
to those without, with a mean of 6.2% of the dry weight (see Table 5.3).

147
Table 5.3: Comparison of the Percentage Dry Weight Removed
A : the difference between UF profile 0 and profile 2 was significant (p<0.05)
* : the difference between mannitol versus no mannitol was significant (p<0.05)
[For the remainder the differences were not statistically significant]
Table 5.4: Odds ratios of defined outcomes against each dialytic intervention
Outcome 1: Odds of intradialytic symptoms
Outcome 2: Odds of hypotensive episode and /or administration of saline bolus
Outcome 3: Odds of successfully achieving the desired dry weight
All patients excluding those with polyuria
Mean [95% CI]
Linear sodium 5.41 [4.97 – 5.86]
Step sodium 5.37 [4.96 – 5.78]
UF profile 0 5.03 [4.68 - 5.38] A
UF profile 2 5.99 [5.49 – 6.49]
UF profile 3 5.61 [4.98 – 6.25]
UF profile 6 6.11 [5.26 – 6.96]
Mannitol 6.18 [5.39 – 6.9] *
OVERALL 5.39 [5.07 – 5.71]
OUTCOME 1 OUTCOME 2 OUTCOME 3
Linear v Step sodium 1.61 (p=0.10) 1.27 (p=0.05) 1.25 (p=0.54)
UF profile 2 v 0 1.58 (p=0.16) 0.77 (p=0.28) 0.60 (p<0.05)
UF profile 3 v 0 1.66 (p=0.28) 0.91 (p=0.81) 1.46 (p=0.24)
UF profile 6 v 0 1.47 (p=0.6) 1.50 (p=0.21) 0.95 (p=0.82)
UF profile 2 v 3 0.95 (p=0.87) 0.85 (p=0.78) 0.41 (p<0.05)
UF profile 2 v 6 1.08 (p=0.9) 0.51 (p=0.23) 0.64 (p=0.07)
UF profile 3 v 6 1.13 (p=0.74) 0.61 (p=0.11) 1.54 (p=0.14)
Mannitol v no mannitol 0.36 (p<0.05) 1.06 (p=0.89) 1.15 (p=0.82)

148
5.4.2 Children prone to dialysis failure
Of 399 dialysis treatments intradialytic mannitol was given in 57 (17%) and sequential
dialysis in 44 (11%). Intradialytic mannitol significantly increased mean treatment UF
volume (see Table 5.5), 86% of the treatments achieved UF volumes greater than
average for that individual patient and one third achieved their dry weight. Mannitol
halved the odds of intradialytic symptoms and hypotension/premature discontinuation
of dialysis (see Table 5.6). Sequential dialysis also halved the odds of intradialytic
symptoms (see Table 5.6). Intradialytic hypotension developed in 50% of the treatments
but dialysis was only prematurely discontinued in 2% of treatments and 2 out of 3
treatments achieved UF volumes greater than the average for an individual patient (see
Table 5.5).
Table 5.5: Prevalence rates of intradialytic morbidity and achieving the desired UF goal with
intradialytic mannitol and sequential dialysis
Intervention Symptoms
Hypotension
Premature discontinuation
of treatment
Dry Weight Achieved
UF as Percentage Dry Weight
Mean [95% CI]
Mannitol 6/57(11%) 3/57 (5%) 3/57 (5%) * 9/29(31%) 5.55
[5.04 – 6.06]
Sequential 1/44 (2%) 23/44 (53%) 1/44 (2%) 18/44 (41%) 10/21(48%)
4.23 [3.66 – 4.80]
† Average UF volume for each patient was calculated from the total number of dialysis session over a 6 month period.
* excluding polyuric patients

149
Table 5.6: Impact of mannitol and sequential dialysis on intradialytic symptoms and
hypotension
Outcome 1: Odds of intradialytic symptoms
Outcome 2: Odds of premature dialysis discontinuation and/or administration of saline bolus
and/or episode of hypotension
Table 5.7: Chi-squared analysis of interventions mannitol and sequential dialysis and outcomes
Degrees of freedom: 1
p value is the probability of the null hypothesis being true
Outcome 1: Odds of intradialytic symptoms
Outcome 2: Odds of premature dialysis discontinuation and/or administration of saline bolus
and/or episode of hypotension
In patient 1 the odds of intradialytic hypotension was 23 times greater than the group
risk. His pre-dialysis systolic BP ranged between 85-105mmHg and his interdialytic
weight gain frequently exceeded 5% his dry weight. The patient’s predisposition for
hypotension was often during the second hour of dialysis and was often associated with
bradycardia. Sequential dialysis reduced intradialytic symptoms but not hypotension.
Twice weekly mannitol reduced the odds of symptoms and hypotensive episodes but the
OUTCOME 1 OUTCOME 2
Mannitol v no mannitol 0.44 (p<0.05) 0.56 (p<0.05)
Sequential v no sequential 0.47 (p<0.05) 2.45 (p<0.05)
OUTCOME 1 OUTCOME 2
Mannitol 2.64
(p=0.10) 0.35
(p=0.18)
Sequential 1.16
(p=0.20) 1.61
(p=0.28)

150
UF potential was unchanged. As an isolated case I then elected to trial intradialytic
midodrine. In the event of a declining BP 2.5mg of oral midodrine was given. If the BP
failed to improve within 30 minutes or fell below 75mmHg a further 2.5mg dose was
given. A cut-off of 7.5mg total dose was applied per 3 hour treatment and no midodrine
was given in the final 30 minutes irrespective of BP. On using intradialytic midodrine
no intradialytic symptoms were observed and the mean treatment UF volume increased
from 3.74% to 3.96%, achieving higher than average UF volumes in 95% of the
treatments and the desired dry weight in one third of the treatments (see Table 5.6).
During 18 of 20 observed dialysis sessions a 2.5mg oral dose of midodrine produced a
10-15mmHg increase in the systolic BP within 30 minutes of administration and no
adverse effects were reported in the intradialytic or interdialytic period.
5.5 Discussion
The uraemic milieu impairs compensatory responses to haemodynamic stress with
ineffective venoconstriction, inadequate cardiac refilling, reduced plasma refilling and
activation of the sympaticoinhibitory Bezold–Jarisch reflex leading to sudden
hypotension153. In paediatrics more often than not we are faced with the additional
challenge of large UF goals. During standard 4 hour HD sessions this combination can
result in decompensation and morbidity. I have shown both in prevalent dialysis patients
and in high risk children that are prone to hypotension that manipulation of
conventional HD prescriptions can improve the dialysis experience.
Children may not understand or appreciate the long-term implications of chronic
hypervolaemia and are often non-adherent to their fluid restrictions. The excess fluid

151
accumulates both in the intravascular and extravascular compartments, but only the
former is amenable to UF during dialysis. During their treatments they often do not
voice the onset of symptoms until they are severe or associated with hypotension.
Children have compliant high capacitance vessels and hypovolaemia may occur
suddenly with little warning. This reduces the opportunity to change the UF rates before
the intravascular volume becomes compromised. As a result, cautious UF goals of 5%
of the dry weight have been recommended152. In paediatrics, Jain et al were the first to
challenge this recommendation by introducing the concept of adjusting UF rates
according to changes in RBV43. They reported reduced dialysis associated morbidity
providing the UF volumes did not result in a blood volume change greater than 8% in
the first hour and 12% over the dialysis session. In comparison I have demonstrated that
through the use of dialysis regimens combining sodium ramping, UF profiles and
intravenous mannitol, UF volumes of up to 9% of the dry weight can be achieved.
The intravascular compartment is continuously changing during dialysis as fluid is
removed by UF but refilled from the interstitial compartment. The total circulating
blood volume during a dialysis treatment is therefore greater than that of a
normovolaemic individual with a significant inter-patient and intra-patient variation in
the pattern of RBV change151. Therefore any dialytic measure that promotes vascular
refilling or improve cardiovascular stability should in theory help to restore
normovolaemia and increase the UF potential in dialysis patients. Sodium profiling
provides a diffusive sodium influx at the start of dialysis to counterbalance the rapid
decline in plasma osmolarity from clearance of uraemic solutes, ending with a low
dialysate sodium concentration to encourage diffusive clearance of the sodium load.
Compared with a constant dialysate sodium concentration, ramps have been associated
with increased stability of the intradialytic blood volume and reduced intradialytic
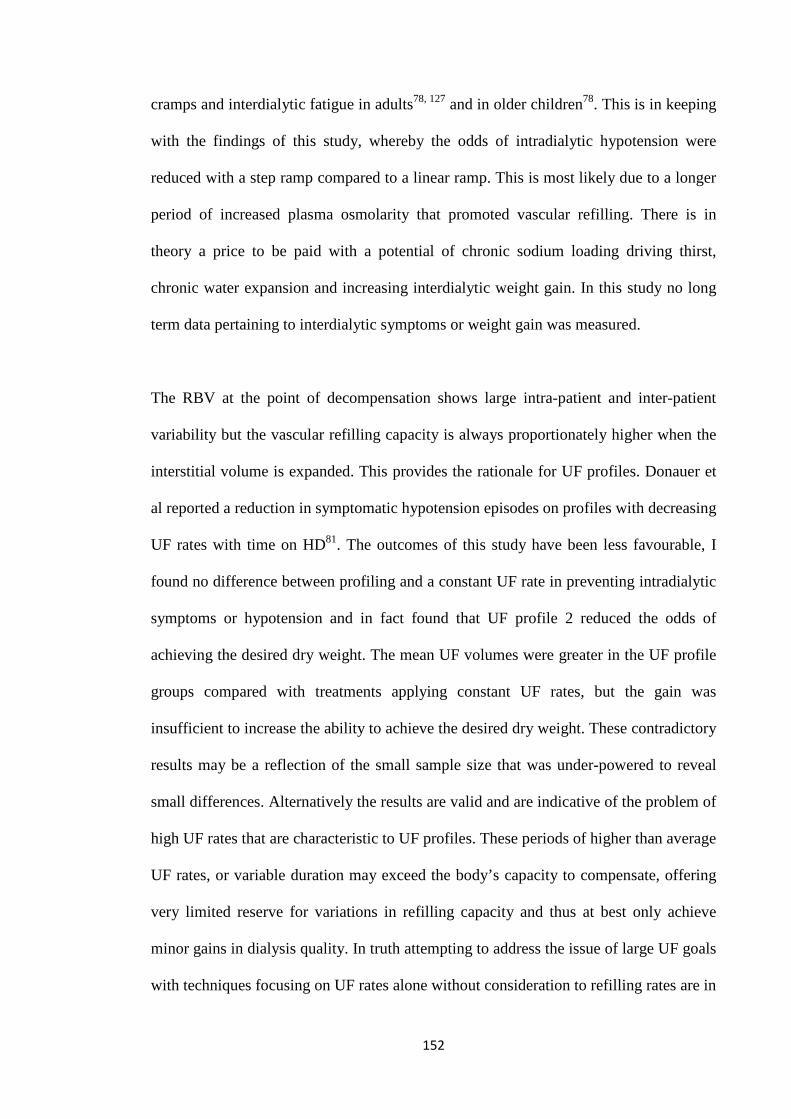
152
cramps and interdialytic fatigue in adults78, 127 and in older children78. This is in keeping
with the findings of this study, whereby the odds of intradialytic hypotension were
reduced with a step ramp compared to a linear ramp. This is most likely due to a longer
period of increased plasma osmolarity that promoted vascular refilling. There is in
theory a price to be paid with a potential of chronic sodium loading driving thirst,
chronic water expansion and increasing interdialytic weight gain. In this study no long
term data pertaining to interdialytic symptoms or weight gain was measured.
The RBV at the point of decompensation shows large intra-patient and inter-patient
variability but the vascular refilling capacity is always proportionately higher when the
interstitial volume is expanded. This provides the rationale for UF profiles. Donauer et
al reported a reduction in symptomatic hypotension episodes on profiles with decreasing
UF rates with time on HD81. The outcomes of this study have been less favourable, I
found no difference between profiling and a constant UF rate in preventing intradialytic
symptoms or hypotension and in fact found that UF profile 2 reduced the odds of
achieving the desired dry weight. The mean UF volumes were greater in the UF profile
groups compared with treatments applying constant UF rates, but the gain was
insufficient to increase the ability to achieve the desired dry weight. These contradictory
results may be a reflection of the small sample size that was under-powered to reveal
small differences. Alternatively the results are valid and are indicative of the problem of
high UF rates that are characteristic to UF profiles. These periods of higher than average
UF rates, or variable duration may exceed the body’s capacity to compensate, offering
very limited reserve for variations in refilling capacity and thus at best only achieve
minor gains in dialysis quality. In truth attempting to address the issue of large UF goals
with techniques focusing on UF rates alone without consideration to refilling rates are in

153
reality destined to fail. In comparison automated RBV biofeedback techniques or more
simply, RBV driven algorithms89 that adjust UF rates according to RBV changes are
successful in achieving equivalent or higher UF volumes with reduced cardiovascular
instability.
Mannitol is a drug traditionally used in the management of dialysis disequilibrium as it
can artificially increase plasma osmolarity. In prevalent dialysis patients, treatments
prescribed mannitol achieved the highest mean UF volumes coupled with a significant
reduction in the odds of symptoms, hypotensive episodes and the premature
discontinuation of dialysis. Such positive outcomes were mirrored in the patients prone
to hypotension. Mannitol requires dilution in saline prior to administration. Every 10g
of mannitol is diluted in 100mls of normal saline and thus concurrently delivers
15mmol of sodium to the intravascular compartment during the infusion. Therefore one
could simply attribute its benefits to the fluid bolus that is inadvertently given and the
increased gross UF volumes could be the result of filtering this fluid load. The counter-
argument to this is that the benefits of mannitol exceed that of a saline bolus. Mannitol
also differs in the fact that it is an osmotically active solute that unlike sodium does not
leak into the interstitium and thus provides a more sustained oncotic effect. On a note of
caution this osmotic effect could theoretically be counter-productive as it runs a risk of
inducing thirst in the interdialytic period with resultant escalating hypervolaemia. An
alternative explanation to mannitol’s success is that it successfully treated milder
degrees of disequilibrium, thus allowing treatments to proceed to completion. The true
incidence of dysequilibrium is unknown but children, by virtue of their age, are deemed
high risk. One patient also had an additional risk from co-existing neurological disease.
It is also conceivable that within this context, the benefits of mannitol may have been
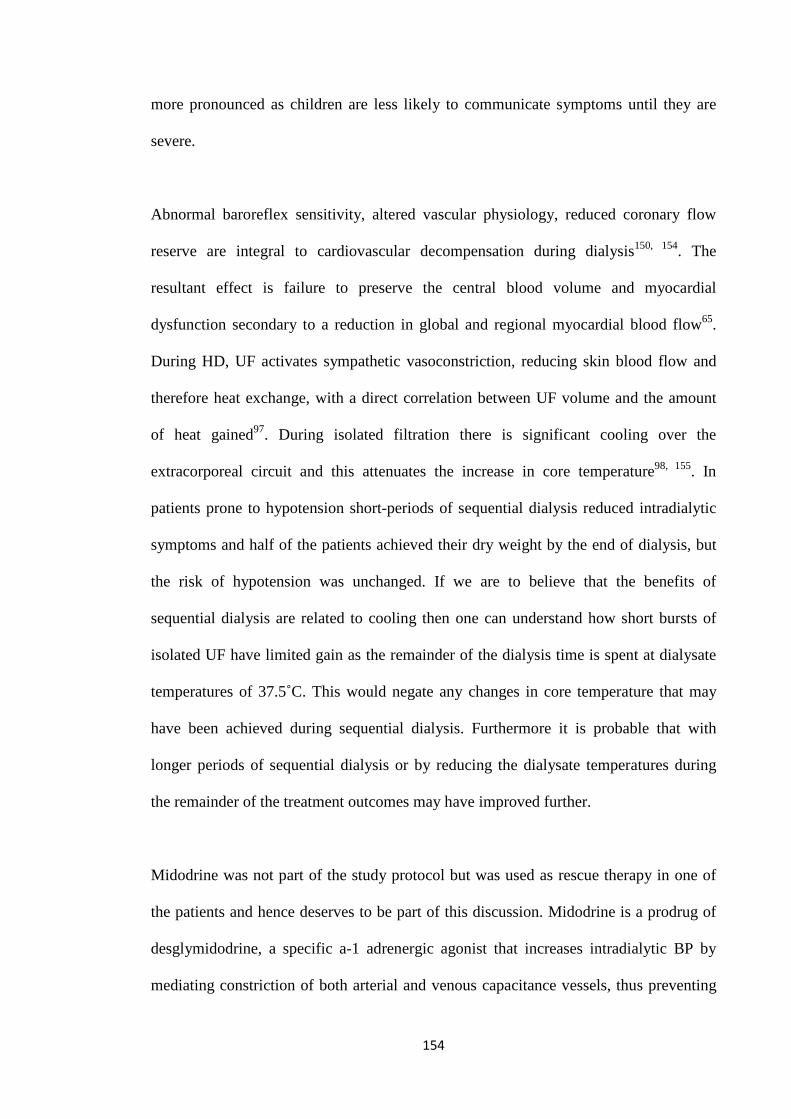
154
more pronounced as children are less likely to communicate symptoms until they are
severe.
Abnormal baroreflex sensitivity, altered vascular physiology, reduced coronary flow
reserve are integral to cardiovascular decompensation during dialysis150, 154. The
resultant effect is failure to preserve the central blood volume and myocardial
dysfunction secondary to a reduction in global and regional myocardial blood flow65.
During HD, UF activates sympathetic vasoconstriction, reducing skin blood flow and
therefore heat exchange, with a direct correlation between UF volume and the amount
of heat gained97. During isolated filtration there is significant cooling over the
extracorporeal circuit and this attenuates the increase in core temperature98, 155. In
patients prone to hypotension short-periods of sequential dialysis reduced intradialytic
symptoms and half of the patients achieved their dry weight by the end of dialysis, but
the risk of hypotension was unchanged. If we are to believe that the benefits of
sequential dialysis are related to cooling then one can understand how short bursts of
isolated UF have limited gain as the remainder of the dialysis time is spent at dialysate
temperatures of 37.5˚C. This would negate any changes in core temperature that may
have been achieved during sequential dialysis. Furthermore it is probable that with
longer periods of sequential dialysis or by reducing the dialysate temperatures during
the remainder of the treatment outcomes may have improved further.
Midodrine was not part of the study protocol but was used as rescue therapy in one of
the patients and hence deserves to be part of this discussion. Midodrine is a prodrug of
desglymidodrine, a specific a-1 adrenergic agonist that increases intradialytic BP by
mediating constriction of both arterial and venous capacitance vessels, thus preventing

155
venous pooling while supporting central BP. Oral administration in our patient
achieved peak levels within 1hr and I saw no evidence of prolonged hypertension
beyond the period of dialysis in spite of pharmacokinetic data indicating a half-life of
3hrs. Minor adverse reactions such as scalp paraesthesia, heartburn, flushing, headache,
weakness and neck soreness have been described156 but no such adverse effects were
witnessed. Adult nephrologists have the greatest experience with midodrine and report
variable success but our results mirror those of Blowey et al reporting a benefit in an 18
year old157. This single experience in a very difficult patient was very encouraging and
certainly places midodrine in a position of priority for future research.
5.6 Study Limitations
The patient cohort was a small, heterogeneous group. In addition by virtue of the study
protocol the exposure to the different interventions also varied between patients
reducing intervention specific numbers further. Therefore my findings may be a
reflection of the fact that the study was underpowered for small differences between the
interventions and the results may have been different in a larger cohort. In a bid not to
restrict numbers further all prevalent dialysis patients were recruited, including those
with congenital heart defects. We know that the structural and physiological properties
of the cardiovascular system are susceptible to change with disease. All of the cardiac
patients were found to be susceptible to intradialytic symptoms and hypotension and
hence they may have introduced a bias in the study of prevalent dialysis patients. Their
inclusion within the second study with other high risk patients was probably more
appropriate and encouragingly the results were no different. In paediatric HD, the
prevalent dialysis patients tend to be children unsuitable for peritoneal dialysis, with

156
several co-morbidities, therefore even from the very onset of this study a selection bias
was introduced. This also raises an important question on whether the baseline risk for
cardiovascular compromise in prevalent HD patients differs from stable uncomplicated
uraemic children.
Within the study protocol it was impossible to control the UF prescription per dialysis
treatment as this would have compromised patient well being. However there is a clear
relationship between UF volumes and the risk of intradialytic morbidity. The problem is
confounded further by the fact that tolerance to UF varies between patients and between
treatments as illustrated in Chapter 3. Therefore even if statistical adjustments of the
analyses for UF volumes were attempted this bias could not have been eliminated in this
study.
This is a preliminary study and being conscious of time and the relatively quick
turnover of patients within paediatric dialysis units I did not elect to introduce
interventions separately. For example sodium ramping was part of the standard
prescription in the study of patients prone to hypotension and was used in combination
with the UF profiles in the prevalent dialysis patients study. As a consequence it is hard
to know whether the results achieved were exclusively attributable to the intervention in
question or due to the synergistic effect of all the interventions that were present per
dialysis treatment.
Finally on a number of occasions in the discussion I have raised concerns of the long
term effects of some of these interventions such as sodium profiling and intradialytic
mannitol and the theoretical risk of chronic volume expansion. Follow up within this

157
study was short and data primarily concentrated on the intradialytic period and not the
interdialytic period. In the battle against UF failure, preventative measures that limit salt
and water intake are equally important, if not more important than intradialytic
strategies aimed at treating salt and water excess. The lack of data on the long-term
consequences of these interventions is a shortcoming of this study and is certainly an
area thus needs to be explored in future studies.
5.7 Conclusion
During standard 4 hour HD regimens the evidence for the cardiovascular burden of HD
is growing stronger and with it the urgency for change in the way we dialyse our
patients. Improving dialysis failure is essential for patient well-being and will only be
achieved following a better understanding of the underlying mechanism. Through a
multidirectional approach, utilising strategies that improved plasma refilling and
supported the central blood volume I have demonstrated an attenuated risk of
intradialytic morbidity in both prevalent dialysis patients and children that are prone to
hypotension. In our most resistant case oral midodrine was the only viable rescue
option, nonetheless experience with midodrine in paediatrics is still very limited and its
efficacy needs to validated in larger, randomised trials prior to recommending it for
general use.

158
Chapter Six
Thesis Summation
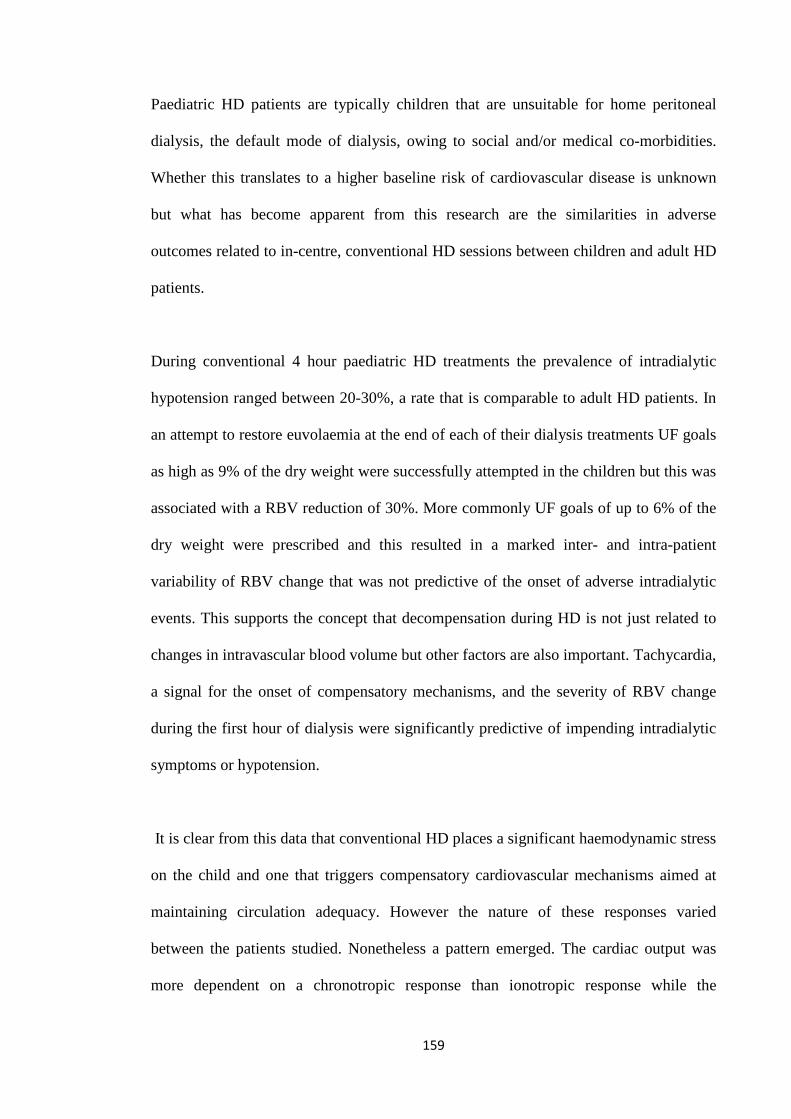
159
Paediatric HD patients are typically children that are unsuitable for home peritoneal
dialysis, the default mode of dialysis, owing to social and/or medical co-morbidities.
Whether this translates to a higher baseline risk of cardiovascular disease is unknown
but what has become apparent from this research are the similarities in adverse
outcomes related to in-centre, conventional HD sessions between children and adult HD
patients.
During conventional 4 hour paediatric HD treatments the prevalence of intradialytic
hypotension ranged between 20-30%, a rate that is comparable to adult HD patients. In
an attempt to restore euvolaemia at the end of each of their dialysis treatments UF goals
as high as 9% of the dry weight were successfully attempted in the children but this was
associated with a RBV reduction of 30%. More commonly UF goals of up to 6% of the
dry weight were prescribed and this resulted in a marked inter- and intra-patient
variability of RBV change that was not predictive of the onset of adverse intradialytic
events. This supports the concept that decompensation during HD is not just related to
changes in intravascular blood volume but other factors are also important. Tachycardia,
a signal for the onset of compensatory mechanisms, and the severity of RBV change
during the first hour of dialysis were significantly predictive of impending intradialytic
symptoms or hypotension.
It is clear from this data that conventional HD places a significant haemodynamic stress
on the child and one that triggers compensatory cardiovascular mechanisms aimed at
maintaining circulation adequacy. However the nature of these responses varied
between the patients studied. Nonetheless a pattern emerged. The cardiac output was
more dependent on a chronotropic response than ionotropic response while the
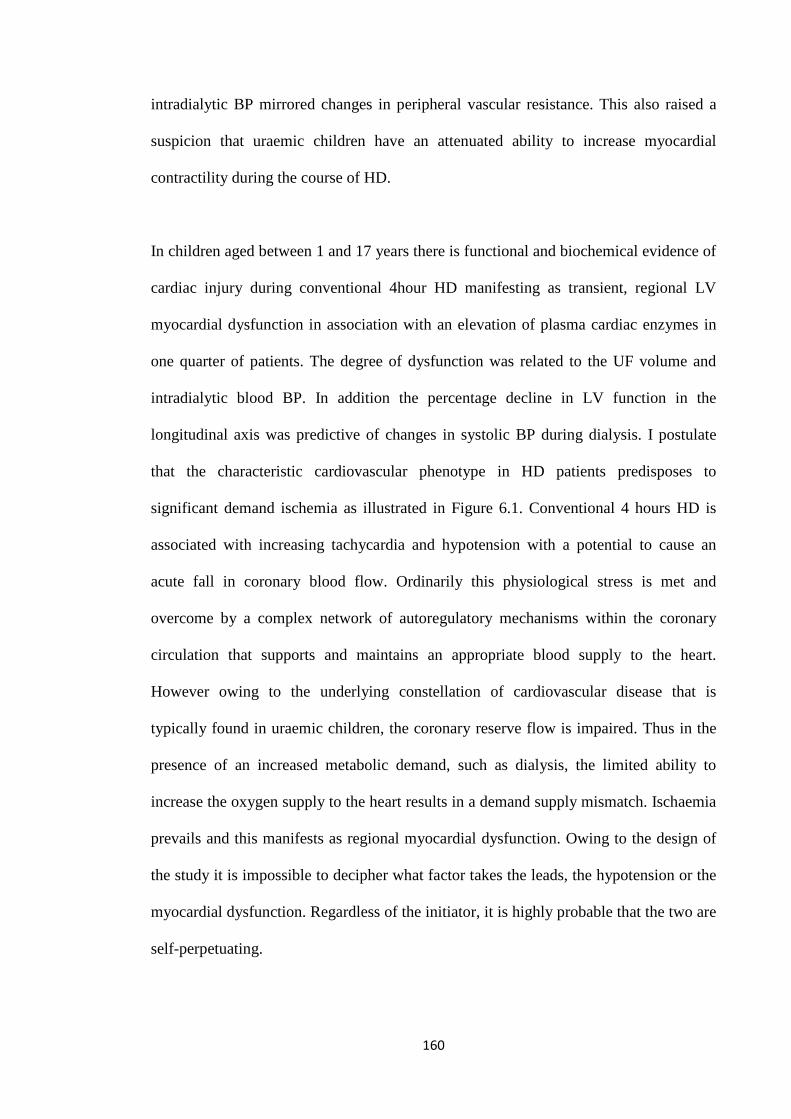
160
intradialytic BP mirrored changes in peripheral vascular resistance. This also raised a
suspicion that uraemic children have an attenuated ability to increase myocardial
contractility during the course of HD.
In children aged between 1 and 17 years there is functional and biochemical evidence of
cardiac injury during conventional 4hour HD manifesting as transient, regional LV
myocardial dysfunction in association with an elevation of plasma cardiac enzymes in
one quarter of patients. The degree of dysfunction was related to the UF volume and
intradialytic blood BP. In addition the percentage decline in LV function in the
longitudinal axis was predictive of changes in systolic BP during dialysis. I postulate
that the characteristic cardiovascular phenotype in HD patients predisposes to
significant demand ischemia as illustrated in Figure 6.1. Conventional 4 hours HD is
associated with increasing tachycardia and hypotension with a potential to cause an
acute fall in coronary blood flow. Ordinarily this physiological stress is met and
overcome by a complex network of autoregulatory mechanisms within the coronary
circulation that supports and maintains an appropriate blood supply to the heart.
However owing to the underlying constellation of cardiovascular disease that is
typically found in uraemic children, the coronary reserve flow is impaired. Thus in the
presence of an increased metabolic demand, such as dialysis, the limited ability to
increase the oxygen supply to the heart results in a demand supply mismatch. Ischaemia
prevails and this manifests as regional myocardial dysfunction. Owing to the design of
the study it is impossible to decipher what factor takes the leads, the hypotension or the
myocardial dysfunction. Regardless of the initiator, it is highly probable that the two are
self-perpetuating.
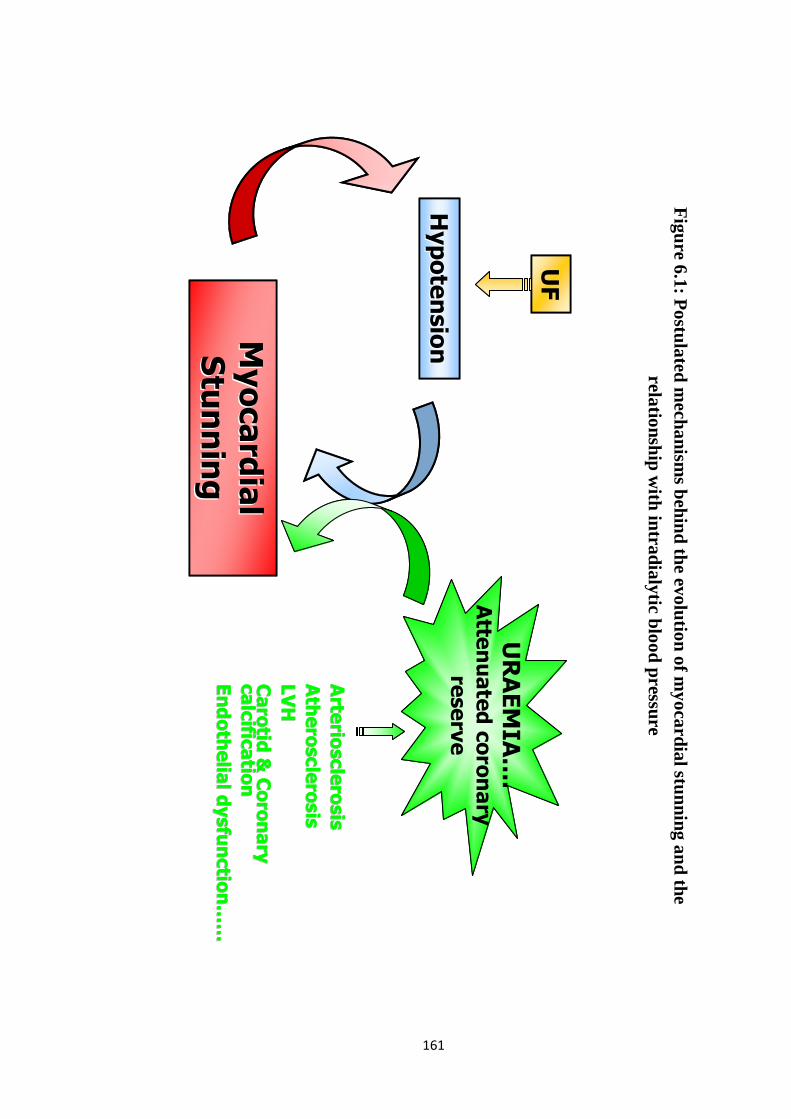
161
UF
Hypotension
HypotensionMyocardial
Myocardial
Stunning
Stunning
URAEMIA….
Atte
nuated coronary
reserve
Arte
riosclerosis
Arte
riosclerosis
Atherosclerosis
Atherosclerosis
LVH
LVH
Carotid
& Coronary
Carotid
& Coronary
calcific
atio
ncalcific
atio
n
Endothelial dysfunctio
nEndothelial dysfunctio
n……
……
Figure 6.1: P
ostulated mechanism
s behind the evolution of myocardial stunning and the
relationship with intradialytic blood pressure

162
The technique of speckle tracking 2D strain was superior to assessments of regional
wall motion activity in detecting acute abnormalities in regional myocardial function.
2D speckle tracking was both angle and translation independent and was therefore less
influenced by intra-observer variability between images, improving its accuracy. It also
provided two parameters of assessments, the peak strain and inter-segmental
synchronicity index. The latter is particularly sensitive in detecting ischeamic cardiac
injury and therefore in this setting has the potential for becoming a screening tool,
looking for early evidence of dialysis induced cardiac injury and with it a window of
opportunity to intervene before the myocardial injury becomes severe.
The evidence for the cardiovascular burden of HD is growing stronger and with it the
urgency for change in the way we dialyse our patients. Armed with greater details of the
altered physiological responses during dialysis, a more directed approach to managing
intradialytic morbidity is conceivable. During paediatric HD, patients are largely able to
mount a tachycardic response but support is required to increase peripheral vascular
resistance, expand the central blood volume and augment myocardial contractility.
Sodium profiles and intradialytic mannitol encourage plasma refilling, sequential
dialysis prevents blood from being diverted away from the central blood volume and
midodrine increases vascular resistance. All four interventions were shown to be
effective in moderating intradialytic symptoms and hypotension, midodrine and
sequential dialysis exclusively in high risk, hypotension prone patients.

163
Chapter Seven
Future Work
164
All the research that has been reported in this thesis is based on studies of a small
cohort of HD patients from a single centre. First and foremost the results require
validation from larger scale, long-term studies. The haemodynamic study (Chapter
3) would benefit from a larger population base as this will allow the patients to be
divided into relevant groups based on urine output, underlying renal disease and
baseline risk of decompensation. These are factors that are likely to influence the
compensatory response during dialysis and any information gained will provide
additional insight into any variations that exist and help direct focused strategies to
improve HD related morbidity.
The study examining the myocardial effects of dialysis (Chapter 4) was limited to
the acute effects on the heart from single dialysis sessions. However both adult
dialysis data and the model of coronary artery disease allude to the progressive
nature of myocardial stunning. This strengthens the case for gaining long-term
follow up data in children. In addition data following them longitudinally once they
change renal replacement therapy, such as transplantation will provide invaluable
information on the degree of reversibility of dialysis induced myocardial injury and
the risk of myocardial injury between the different forms of renal replacement
therapies.
The dialysis intervention study (chapter 5) measured the efficacy of various dialysis
interventions in modifying intradialytic symptoms and prevalence of hypotension.
One battle that is in the forefront of all nephrologists is that of salt and water
balance. However in order to win, strategies have to be directed towards the
interdialytic period as well as the intradialytic period that was exclusively examined

165
here. Interventions such as sodium profiles and intradialytic mannitol increase the
osmotic load during dialysis and this may have a knock on effect on chronic fluid
and BP management. Long-term follow up is required to ascertain the impact of
these dialysis interventions on the immediate and late interdialytic period both in
terms of patient symptoms and volume status. Furthermore this work could also be
extended laterally by examining differences in RBV and dialysis induced
myocardial dysfunction between the different interventions. Finally following on
from the example set here and the success of midodrine in treating a very resistant
case of intradialytic hypotension, its role in paediatric HD needs to be explored
further. I would propose a randomised, cross-over trial of children prone to
hypotension, supported by finometer, RBV change and regional myocardial function
data.
This thesis has introduced the concept of myocardial stunning in uraemic children
and now additional work is necessary to understand the extent of the problem within
the paediatric nephrology population base. The non-invasive technique of 2D
speckle tracking lends itself well to these investigations.
� I would like to start by investigating whether the chronicity of renal failure is
important in medicating myocardial dysfunction. I plan to examine this by
studying patients with acute renal failure on continuous renal replacement
therapy.
� At present it is difficult to know whether ‘uraemia’ or the haemodynamic stress
related to dialysis is the dominant factor in dialysis induced myocardial
dysfunction. Peritoneal dialysis (PD) is a gentler form of dialysis that is
generally not associated with a large haemodynamic burden. An investigation of

166
children on PD would provide further insight on the relationship between
uraemia and myocardial stunning.
� At Great Ormond Street Hospital for Children, we have initiated plans to
develop a paediatric home HD programme. Frequent HD has been shown to be
superior to conventional HD both in fluid management, BP control, intradialytic
haemodynamic stability and dialysis quality, but the mechanisms remain elusive.
I would like to use this opportunity to explore the potential role of myocardial
stunning in the reported cardiovascular advantages linked to this patient cohort.
� Sequential dialysis utilizes the principle of cooling to improve cardiovascular
stability during paediatric HD but is adversely association with sodium loading.
Applied independently within conventional HD prescriptions, cooling of the
dialysate has cardiovascular benefits but the duration and intensity of cooling is
limited by the onset of symptoms related to feeling cold. I propose a
randomised, cross-over study to determine the optimal paediatric dialysate
temperature for abrogation of intradialytic morbidity without inducing adverse
symptoms. This study could potentially provide a widely applicable and cost-
effective intervention for reducing the cardiovascular burden that children carry
into adulthood.

167
List of Abbreviations
2D two-dimensional
AHA The American Heart Association
ANCA anti-neutrophil cytoplasmic antibodies
ANOVA one-way analysis of variance
ARPKD autosomal recessive polycystic kidney disease
BNP brain natriuretic peptide
BP blood pressure
CRP C-reactive protein
cTnI cardiac troponin-I
cTnT cardiac troponin-T
CO cardiac output
CAD coronary artery disease
CKD chronic kidney disease
CI confidence interval
EF ejection fraction
ESRD end stage renal disease
FSGS focal segmental glomerulosclerosis
hsCRP high sensitivity C-reactive protein
HD haemodialysis
HR heart rate
IL-6 interleukin 6
LV left ventricle
LVH left ventricular hypertrophy

168
MBF myocardial blood flow
NIVM non-invasive blood volume monitors
PD peritoneal dialysis
PET photon emission computed tomography
ROC receiver operating characteristics curve
RBC red blood cell
RBV relative blood volume
RWMA regional wall motion abnormalities
SV stroke volume
TPR total peripheral resistance
UF ultrafiltration
169
References
1. Henrich WL. Hemodynamic instability during hemodialysis. Kidney Int 1986; 30(4):605-612.
2. Port S, Garfinkel A, Boyle N. There is a non-linear relationship between mortality and blood pressure. Eur Heart J 2000; 21(20):1635-1638.
3. Foley RN, Parfrey PS, Harnett JD, Kent GM, Murray DC, Barre PE. Impact of hypertension on cardiomyopathy, morbidity and mortality in end-stage renal disease. Kidney Int 1996; 49(5):1379-1385.
4. Zager PG, Nikolic J, Brown RH et al. "U" curve association of blood pressure and mortality in hemodialysis patients. Medical Directors of Dialysis Clinic, Inc. Kidney Int 1998; 54(2):561-569.
5. Agarwal R, Light RP. Chronobiology of Arterial Hypertension in Hemodialysis Patients: Implications for Home Blood Pressure Monitoring. Am J Kidney Dis 2009.
6. Alborzi P, Patel N, Agarwal R. Home blood pressures are of greater prognostic value than hemodialysis unit recordings. Clin J Am Soc Nephrol 2007; 2(6):1228-1234.
7. National Kidney Foundation. KDOQI Clinical Practice Guidelines for Cardiovascular Disease in Dialysis Patients. 2005. Ref Type: Report
8. Blumenthal S, Epps RP, Heavenrich R et al. Report of the task force on blood pressure control in children. Pediatrics 1977; 59(5 2 suppl):I-820.
9. Woolliscroft JO, Fox IH. Increased body fluid purine levels during hypotensive events. Evidence for ATP degradation. Am J Medicine 1986; 81(3):472-478.
10. Shinzato T, Miwa M, Nakai S et al. Role of adenosine in dialysis-induced hypotension. J Am Soc Nephrol 1994; 4(12):1987-1994.
11. Lau T, Owen W, Yu YM et al. Arginine, citrulline, and nitric oxide metabolism in end-stage renal disease patients. J Clin Invest 2000; 105(9):1217-1225.

170
12. Converse RL, Jr., Jacobsen TN, Jost CM et al. Paradoxical withdrawal of reflex vasoconstriction as a cause of hemodialysis-induced hypotension. J Clin Invest 1992; 90(5):1657-1665.
13. Iimura O, Tabei K, Nagashima H, Asano Y. A study on regulating factors of plasma refilling during hemodialysis. Nephron 1996; 74(1):19-25.
14. Ligtenberg G, Barnas MG, Koomans HA. Intradialytic hypotension: new insights into the mechanism of vasovagal syncope. Nephrol Dial Transplant 1998; 13(11):2745-2747.
15. Goldsmith HL, Cokelet GR, Gaehtgens P. Robin Fahraeus: evolution of his concepts in cardiovascular physiology. Am J Physiol 1989; 257(3 Pt 2):H1005-H1015.
16. Fellner SK, Lang RM, Neumann A, Spencer KT, Bushinsky DA, Borow KM. Physiological mechanisms for calcium-induced changes in systemic arterial pressure in stable dialysis patients. Hypertension 1989; 13(3):213-218.
17. Fernandez E, Borras M, Pais B, Montoliu J. Low-calcium dialysate stimulates parathormone secretion and its long-term use worsens secondary hyperparathyroidism. J Am Soc Nephrol 1995; 6(1):132-135.
18. Dolan MJ, Whipp BJ, Davidson WD, Weitzman RE, Wasserman K. Hypopnea associated with acetate hemodialysis: carbon dioxide-flow-dependent ventilation. N Engl J Med 1981; 305(2):72-75.
19. Jakob SM, Ruokonen E, Vuolteenaho O, Lampainen E, Takala J. Splanchnic perfusion during hemodialysis: evidence for marginal tissue perfusion. Crit Care Med 2001; 29(7):1393-1398.
20. Foley RN, Parfrey PS, Sarnak MJ. Clinical epidemiology of cardiovascular disease in chronic renal disease. Am J Kidney Dis 1998; 32(5 Suppl 3):S112-S119.
21. Mitsnefes MM. Cardiovascular morbidity and mortality in children with chronic kidney disease in North America: lessons from the USRDS and NAPRTCS databases. Perit Dial Int 2005; 25 Suppl 3:S120-S122.
22. Mitsnefes MM. Hypertension in children and adolescents. Pediatr Clin North Am 2006; 53(3):493-512, viii.

171
23. Guerin AP, Adda H, London GM, Marchais SJ. Cardiovascular disease in renal failure. Minerva Urol Nefrol 2004; 56:279-288.
24. Kari JA, Donald AE, Vallance DT et al. Physiology and biochemistry of endothelial function in children with chronic renal failure. Kidney Int 1997; 52(2):468-472.
25. Atalay S, Ekim M, Tutar HE, Kocak G, Bakkaloglu S, Tumer N. Systolic and diastolic function in children with chronic renal failure. Pediatr Int 2002; 44(1):18-23.
26. Johnstone LM, Jones CL, Grigg LE, Wilkinson JL, Walker RG, Powell HR. Left ventricular abnormalities in children, adolescents and young adults with renal disease. Kidney Int 1996; 50(3):998-1006.
27. Mitsnefes MM, Kimball TR, Border WL et al. Impaired left ventricular diastolic function in children with chronic renal failure. Kidney Int 2004; 65(4):1461-1466.
28. Mitsnefes MM, Kimball TR, Border WL et al. Abnormal cardiac function in children after renal transplantation. Am J Kidney Dis 2004; 43(4):721-726.
29. nett-Richards K, Kattenhorn M, Donald A et al. Does oral folic acid lower total homocysteine levels and improve endothelial function in children with chronic renal failure? Circulation 2002; 105(15):1810-1815.
30. nett-Richards KJ, Kattenhorn M, Donald AE et al. Oral L-arginine does not improve endothelial dysfunction in children with chronic renal failure. Kidney Int 2002; 62(4):1372-1378.
31. Shroff RC, Shanahan CM. The vascular biology of calcification. Semin Dial 2007; 20(2):103-109.
32. Shroff RC, McNair R, Figg N et al. Dialysis accelerates medial vascular calcification in part by triggering smooth muscle cell apoptosis. Circulation 2008; 118(17):1748-1757.
33. Shroff RC, Shah V, Hiorns MP et al. The circulating calcification inhibitors, fetuin-A and osteoprotegerin, but not Matrix Gla protein, are associated with vascular stiffness and calcification in children on dialysis. Nephrol Dial Transplant 2008; 23(10):3263-3271.

172
34. Amabile N, Guerin AP, Leroyer A et al. Circulating endothelial microparticles are associated with vascular dysfunction in patients with end-stage renal failure. J Am Soc Nephrol 2005; 16(11):3381-3388.
35. Ramirez R, Carracedo J, Merino A et al. Microinflammation induces endothelial damage in hemodialysis patients: the role of convective transport. Kidney Int 2007; 72(1):108-113.
36. Chan CT. Cardiovascular effects of frequent intensive hemodialysis. Semin Dial 2004; 17(2):99-103.
37. Yuen D, Richardson RM, Fenton SS, Grath-Chong ME, Chan CT. Quotidian nocturnal hemodialysis improves cytokine profile and enhances erythropoietin responsiveness. ASAIO J 2005; 51(3):236-241.
38. Docci D, Bilancioni R, Buscaroli A et al. Elevated serum levels of C-reactive protein in hemodialysis patients. Nephron 1990; 56(4):364-367.
39. Calabro P, Willerson JT, Yeh ET. Inflammatory cytokines stimulated C-reactive protein production by human coronary artery smooth muscle cells. Circulation 2003; 108(16):1930-1932.
40. Daugirdas JT. Second generation logarithmic estimates of single-pool variable volume Kt/V: an analysis of error. J Am Soc Nephrol 1993; 4(5):1205-1213.
41. Schneditz D, Roob JM, Vaclavik M, Holzer H, Kenner T. Noninvasive measurement of blood volume in hemodialysis patients. J Am Soc Nephrol 1996; 7(8):1241-1244.
42. Steuer RR, Leypoldt JK, Cheung AK, Harris DH, Conis JM. Hematocrit as an indicator of blood volume and a predictor of intradialytic morbid events. ASAIO J 1994; 40(3):M691-M696.
43. Jain SR, Smith L, Brewer ED, Goldstein SL. Non-invasive intravascular monitoring in the pediatric hemodialysis population. Pediatr Nephrol 2001; 16(1):15-18.
44. Michael M, Brewer ED, Goldstein SL. Blood volume monitoring to achieve target weight in pediatric hemodialysis patients. Pediatr Nephrol 2004; 19(4):432-437.

173
45. Patel HP, Goldstein SL, Mahan JD et al. A standard, noninvasive monitoring of hematocrit algorithm improves blood pressure control in pediatric hemodialysis patients. Clin J Am Soc Nephrol 2007; 2(2):252-257.
46. Kim KE, Neff M, Cohen B et al. Blood volume changes and hypotension during hemodialysis. Trans Am Soc Artif Intern Organs 1970; 16:508-514.
47. Andrulli S, Colzani S, Mascia F et al. The role of blood volume reduction in the genesis of intradialytic hypotension. Am J Kidney Dis 2002; 40(6):1244-1254.
48. Mitra S, Chamney P, Greenwood R, Farrington K. Linear decay of relative blood volume during ultrafiltration predicts hemodynamic instability. Am J Kidney Dis 2002; 40(3):556-565.
49. LEV M, SIMKINS CS. Architecture of the human ventricular myocardium; technic for study using a modification of the Mall-MacCallum method. Lab Invest 1956; 5(5):396-409.
50. Streeter DD, Jr., Spotnitz HM, Patel DP, Ross J, Jr., Sonnenblick EH. Fiber orientation in the canine left ventricle during diastole and systole. Circ Res 1969; 24(3):339-347.
51. Bogaert J, Rademakers FE. Regional nonuniformity of normal adult human left ventricle. Am J Physiol Heart Circ Physiol 2001; 280(2):H610-H620.
52. Carreras F, Ballester M, Pujadas S, Leta R, Pons-Llado G. Morphological and functional evidences of the helical heart from non-invasive cardiac imaging. Eur J Cardiothorac Surg 2006; 29 Suppl 1:S50-S55.
53. Rademakers FE, Rogers WJ, Guier WH et al. Relation of regional cross-fiber shortening to wall thickening in the intact heart. Three-dimensional strain analysis by NMR tagging. Circulation 1994; 89(3):1174-1182.
54. Cerqueira MD, Weissman NJ, Dilsizian V et al. Standardized myocardial segmentation and nomenclature for tomographic imaging of the heart: a statement for healthcare professionals from the Cardiac Imaging Committee of the Council on Clinical Cardiology of the American Heart Association. Circulation 2002; 105(4):539-542.
55. Braunwald E, Kloner RA. The stunned myocardium: prolonged, postischemic ventricular dysfunction. Circulation 1982; 66(6):1146-1149.

174
56. Boon D, van Montfrans GA, Koopman MG, Krediet RT, Bos WJ. Blood pressure response to uncomplicated hemodialysis: the importance of changes in stroke volume. Nephron Clin Pract 2004; 96(3):c82-c87.
57. Bos WJ, Bruin S, van Olden RW et al. Cardiac and hemodynamic effects of hemodialysis and ultrafiltration. Am J Kidney Dis 2000; 35(5):819-826.
58. Tarakcioglu M, Erbagci A, Cekmen M et al. Acute effect of haemodialysis on serum markers of myocardial damage. Int J Clin Pract 2002; 56(5):328-332.
59. Wayand D, Baum H, Schatzle G, Scharf J, Neumeier D. Cardiac troponin T and I in end-stage renal failure. Clin Chem 2000; 46(9):1345-1350.
60. Conlon PJ, Krucoff MW, Minda S, Schumm D, Schwab SJ. Incidence and long-term significance of transient ST segment deviation in hemodialysis patients. Clin Nephrol 1998; 49(4):236-239.
61. Jernberg T, James S, Lindahl B, Stridsberg M, Venge P, Wallentin L. NT-proBNP in unstable coronary artery disease--experiences from the FAST, GUSTO IV and FRISC II trials. Eur J Heart Fail 2004; 6(3):319-325.
62. Zoccali C, Mallamaci F, Benedetto FA et al. Cardiac natriuretic peptides are related to left ventricular mass and function and predict mortality in dialysis patients. J Am Soc Nephrol 2001; 12(7):1508-1515.
63. Lipshultz SE, Somers MJ, Lipsitz SR, Colan SD, Jabs K, Rifai N. Serum cardiac troponin and subclinical cardiac status in pediatric chronic renal failure. Pediatrics 2003; 112(1 Pt 1):79-86.
64. Singh N, Langer A, Freeman MR, Goldstein MB. Myocardial alterations during hemodialysis: insights from new noninvasive technology. Am J Nephrol 1994; 14(3):173-181.
65. McIntyre CW, Burton JO, Selby NM et al. Hemodialysis-induced cardiac dysfunction is associated with an acute reduction in global and segmental myocardial blood flow. Clin J Am Soc Nephrol 2008; 3(1):19-26.
66. Kasper DL, Fauci AS, Longo DL, Braunwald E, Hauser SL, Jameson JL. Harrison's Principles of Internal Medicine. 16th edn ed. New York: McGraw-Hill; 2005.

175
67. Burton JO, Jefferies H, Selby NM, McIntyre CW. Haemodialysis induced repetitive myocardial stunning results in global and segmental reduction in systolic cardiac function. 2009. Ref Type: Unpublished Work
68. Dasselaar JJ, Slart RH, Knip M et al. Haemodialysis is associated with a pronounced fall in myocardial perfusion. Nephrol Dial Transplant 2009; 24(2):604-610.
69. Stoves J, Goode NP, Visvanathan R et al. The bradykinin response and early hypotension at the introduction of continuous renal replacement therapy in the intensive care unit. Artif Organs 2001; 25(12):1009-1013.
70. Barnes E, Dutka DP, Khan M, Camici PG, Hall RJ. Effect of repeated episodes of reversible myocardial ischemia on myocardial blood flow and function in humans. Am J Physiol Heart Circ Physiol 2002; 282(5):H1603-H1608.
71. Wijns W, Vatner SF, Camici PG. Hibernating myocardium. N Engl J Med 1998; 339(3):173-181.
72. Ausma J, Cleutjens J, Thone F, Flameng W, Ramaekers F, Borgers M. Chronic hibernating myocardium: interstitial changes. Mol Cell Biochem 1995; 147(1-2):35-42.
73. Camici PG, Wijns W, Borgers M et al. Pathophysiological mechanisms of chronic reversible left ventricular dysfunction due to coronary artery disease (hibernating myocardium). Circulation 1997; 96(9):3205-3214.
74. Heusch G. Hibernating myocardium. Physiol Rev 1998; 78(4):1055-1085.
75. Vanoverschelde JL, Wijns W, Depre C et al. Mechanisms of chronic regional postischemic dysfunction in humans. New insights from the study of noninfarcted collateral-dependent myocardium. Circulation 1993; 87(5):1513-1523.
76. Kloner RA, Bolli R, Marban E, Reinlib L, Braunwald E. Medical and cellular implications of stunning, hibernation, and preconditioning: an NHLBI workshop. Circulation 1998; 97(18):1848-1867.
77. Bethesda. US RDS. Annual data report: Atlas of chronic kidney disease and end-stage renal disease in the U.S. 2007.

176
78. Sadowski RH, Allred EN, Jabs K. Sodium modeling ameliorates intradialytic and interdialytic symptoms in young hemodialysis patients. J Am Soc Nephrol 1993; 4(5):1192-1198.
79. Song JH, Lee SW, Suh CK, Kim MJ. Time-averaged concentration of dialysate sodium relates with sodium load and interdialytic weight gain during sodium-profiling hemodialysis. Am J Kidney Dis 2002; 40(2):291-301.
80. de Paula FM, Peixoto AJ, Pinto LV, Dorigo D, Patricio PJ, Santos SF. Clinical consequences of an individualized dialysate sodium prescription in hemodialysis patients. Kidney Int 2004; 66(3):1232-1238.
81. Donauer J, Kolblin D, Bek M, Krause A, Bohler J. Ultrafiltration profiling and measurement of relative blood volume as strategies to reduce hemodialysis-related side effects. Am J Kidney Dis 2000; 36(1):115-123.
82. Ronco C, Feriani M, Chiaramonte S et al. Impact of high blood flows on vascular stability in haemodialysis. Nephrol Dial Transplant 1990; 5 Suppl 1:109-114.
83. Ebel H, Laage C, Keuchel M et al. Impact of profile haemodialysis on intra-/extracellular fluid shifts and the release of vasoactive hormones in elderly patients on regular dialysis treatment. Nephron 1997; 75(3):264-271.
84. Santoro A, Mancini E, Basile C et al. Blood volume controlled hemodialysis in hypotension-prone patients: a randomized, multicenter controlled trial. Kidney Int 2002; 62(3):1034-1045.
85. Santoro A, Mancini E, Paolini F, Spongano M, Zucchelli P. Automatic control of blood volume trends during hemodialysis. ASAIO J 1994; 40(3):M419-M422.
86. Santoro A, Mancini E, Paolini F, Cavicchioli G, Bosetto A, Zucchelli P. Blood volume regulation during hemodialysis. Am J Kidney Dis 1998; 32(5):739-748.
87. Dasselaar JJ, Huisman RM, de Jong PE, Franssen CF. Measurement of relative blood volume changes during haemodialysis: merits and limitations. Nephrol Dial Transplant 2005; 20(10):2043-2049.
88. Locatelli F, Buoncristiani U, Canaud B, Kohler H, Petitclerc T, Zucchelli P. Haemodialysis with on-line monitoring equipment: tools or toys? Nephrol Dial Transplant 2005; 20(1):22-33.

177
89. Patel HP, Goldstein SL, Mahan JD et al. A standard, noninvasive monitoring of hematocrit algorithm improves blood pressure control in pediatric hemodialysis patients. Clin J Am Soc Nephrol 2007; 2(2):252-257.
90. van der Sande FM, Mulder AW, Hoorntje SJ et al. The hemodynamic effect of different ultrafiltration rates in patients with cardiac failure and patients without cardiac failure: comparison between isolated ultrafiltration and ultrafiltration with dialysis. Clin Nephrol 1998; 50(5):301-308.
91. van der Sande FM, Gladziwa U, Kooman JP, Bocker G, Leunissen KM. Energy transfer is the single most important factor for the difference in vascular response between isolated ultrafiltration and hemodialysis. J Am Soc Nephrol 2000; 11(8):1512-1517.
92. Van Someren EJ, Raymann RJ, Scherder EJ, Daanen HA, Swaab DF. Circadian and age-related modulation of thermoreception and temperature regulation: mechanisms and functional implications. Ageing Res Rev 2002; 1(4):721-778.
93. Bennett LA, Johnson JM, Stephens DP, Saad AR, Kellogg DL, Jr. Evidence for a role for vasoactive intestinal peptide in active vasodilatation in the cutaneous vasculature of humans. J Physiol 2003; 552(Pt 1):223-232.
94. Johnson JM, Proppe DW. Section 4: Environmental Physiology. In: Fregly MJ, Blatteis CM, editors. Handbook of physiology. New York: Oxford University Press; 1996 p. 215-243.
95. Fine A, Penner B. The protective effect of cool dialysate is dependent on patients' predialysis temperature. Am J Kidney Dis 1996; 28(2):262-265.
96. Ikizler TA, Wingard RL, Sun M, Harvell J, Parker RA, Hakim RM. Increased energy expenditure in hemodialysis patients. J Am Soc Nephrol 1996; 7(12):2646-2653.
97. Rosales LM, Schneditz D, Chmielnicki H, Shaw K, Levin NW. Exercise and extracorporeal blood cooling during hemodialysis. ASAIO J 1998; 44(5):M574-M578.
98. Maggiore Q, Dattolo P, Piacenti M et al. Thermal balance and dialysis hypotension. Int J Artif Organs 1995; 18(9):518-525.
99. Gotch FA, Keen ML, Yarian SR. An analysis of thermal regulation in hemodialysis with one and three compartment models. ASAIO Trans 1989; 35(3):622-624.

178
100. Selby NM, Burton JO, Chesterton LJ, McIntyre CW. Dialysis-induced regional left ventricular dysfunction is ameliorated by cooling the dialysate. Clin J Am Soc Nephrol 2006; 1(6):1216-1225.
101. Nesrallah G, Suri R, Moist L, Kortas C, Lindsay RM. Volume control and blood pressure management in patients undergoing quotidian hemodialysis. Am J Kidney Dis 2003; 42(1 Suppl):13-17.
102. Ly J, Chan CT. Impact of augmenting dialysis frequency and duration on cardiovascular function. ASAIO J 2006; 52(6):e11-e14.
103. Chan CT, Shen XS, Picton P, Floras J. Nocturnal home hemodialysis improves baroreflex effectiveness index of end-stage renal disease patients. J Hypertens 2008; 26(9):1795-1800.
104. Geary DF, Piva E, Tyrrell J et al. Home nocturnal hemodialysis in children. J Pediatr 2005; 147(3):383-387.
105. London GM, Safar ME, Levenson JA, Simon AC, Temmar MA. Renal filtration fraction, effective vascular compliance, and partition of fluid volumes in sustained essential hypertension. Kidney Int 1981; 20(1):97-103.
106. Maggiore Q, Dattolo P, Piacenti M et al. A pathophysiological overview of dialysis hypotension. Contrib Nephrol 1996; 119:182-188.
107. Dorlas JC, Nijboer JA, Butijn WT, van der Hoeven GM, Settels JJ, Wesseling KH. Effects of peripheral vasoconstriction on the blood pressure in the finger, measured continuously by a new noninvasive method (the Finapres). Anesthesiology 1985; 62(3):342-345.
108. Wesseling KH, Jansen JR, Settels JJ, Schreuder JJ. Computation of aortic flow from pressure in humans using a nonlinear, three-element model. J Appl Physiol 1993; 74(5):2566-2573.
109. Guelen I, Westerhof BE, Van Der Sar GL et al. Finometer, finger pressure measurements with the possibility to reconstruct brachial pressure. Blood Press Monit 2003; 8(1):27-30.
110. Harms MP, Wesseling KH, Pott F et al. Continuous stroke volume monitoring by modelling flow from non-invasive measurement of arterial pressure in humans under orthostatic stress. Clin Sci (Lond) 1999; 97(3):291-301.

179
111. Jansen JR, Schreuder JJ, Mulier JP, Smith NT, Settels JJ, Wesseling KH. A comparison of cardiac output derived from the arterial pressure wave against thermodilution in cardiac surgery patients. Br J Anaesth 2001; 87(2):212-222.
112. Jellema WT, Wesseling KH, Groeneveld AB, Stoutenbeek CP, Thijs LG, Van Lieshout JJ. Continuous cardiac output in septic shock by simulating a model of the aortic input impedance: a comparison with bolus injection thermodilution. Anesthesiology 1999; 90(5):1317-1328.
113. Schutte AE, Huisman HW, van Rooyen JM, de Ridder JH, Malan NT. Associations between arterial compliance and anthropometry of children from four ethnic groups in south africa: the THUSA BANA Study. Blood Press 2003; 12(2):97-103.
114. Triedman JK, Saul JP. Comparison of intraarterial with continuous noninvasive blood pressure measurement in postoperative pediatric patients. J Clin Monit 1994; 10(1):11-20.
115. Daugirdas JT. Second generation logarithmic estimates of single-pool variable volume Kt/V: an analysis of error. J Am Soc Nephrol 1993; 4(5):1205-1213.
116. Leypoldt JK, Cheung AK, Delmez JA et al. Relationship between volume status and blood pressure during chronic hemodialysis. Kidney Int 2002; 61(1):266-275.
117. Selby NM, Lambie SH, Camici PG, Baker CS, McIntyre CW. Occurrence of regional left ventricular dysfunction in patients undergoing standard and biofeedback dialysis. Am J Kidney Dis 2006; 47(5):830-841.
118. Hausberg M, Kosch M, Harmelink P et al. Sympathetic nerve activity in end-stage renal disease. Circulation 2002; 106(15):1974-1979.
119. Shroff RC, Donald AE, Hiorns MP et al. Mineral metabolism and vascular damage in children on dialysis. J Am Soc Nephrol 2007; 18(11):2996-3003.
120. Koc M, Bihorac A, Segal MS. Circulating endothelial cells as potential markers of the state of the endothelium in hemodialysis patients. Am J Kidney Dis 2003; 42(4):704-712.
121. Herbrig K, Pistrosch F, Oelschlaegel U et al. Increased total number but impaired migratory activity and adhesion of endothelial progenitor cells in patients on long-term hemodialysis. Am J Kidney Dis 2004; 44(5):840-849.

180
122. Westerweel PE, Hoefer IE, Blankestijn PJ et al. End-stage renal disease causes an imbalance between endothelial and smooth muscle progenitor cells. Am J Physiol Renal Physiol 2007; 292(4):F1132-F1140.
123. Dasselaar JJ, Huisman RM, de Jong PE, Franssen CF. Relative blood volume measurements during hemodialysis: comparisons between three noninvasive devices. Hemodial Int 2007; 11(4):448-455.
124. Lee JS. Microvascular volume changes induced by exercise, heat exposure, or endotoxin injection. Am J Physiol 1994; 267(3 Pt 2):H1142-H1150.
125. Mitra S, Chamney P, Greenwood R, Farrington K. The relationship between systemic and whole-body hematocrit is not constant during ultrafiltration on hemodialysis. J Am Soc Nephrol 2004; 15(2):463-469.
126. Agarwal R, Kelley K, Light RP. Diagnostic utility of blood volume monitoring in hemodialysis patients. Am J Kidney Dis 2008; 51(2):242-254.
127. Song JH, Park GH, Lee SY, Lee SW, Lee SW, Kim MJ. Effect of sodium balance and the combination of ultrafiltration profile during sodium profiling hemodialysis on the maintenance of the quality of dialysis and sodium and fluid balances. J Am Soc Nephrol 2005; 16(1):237-246.
128. Foley RN, Parfrey PS, Kent GM, Harnett JD, Murray DC, Barre PE. Serial change in echocardiographic parameters and cardiac failure in end-stage renal disease. J Am Soc Nephrol 2000; 11(5):912-916.
129. Burton JO, Korsheed S, John SG, McIntyre CW. Haemodialysis Induced Cardiac Injury Is Associated with Asymptomatic Relative Hypotension. [SU-FC001]. 2007. ASN Renal Week 2007. Free Communication: Cardiovascular Disease Risk on Dialysis. Ref Type: Report
130. Burton JO, Korsheed S, Grundy BJ, McIntyre CW. Hemodialysis-induced left ventricular dysfunction is associated with an increase in ventricular arrhythmias. Ren Fail 2008; 30(7):701-709.
131. Perk G, Tunick PA, Kronzon I. Non-Doppler two-dimensional strain imaging by echocardiography--from technical considerations to clinical applications. J Am Soc Echocardiogr 2007; 20(3):234-243.

181
132. Bosch JG, Savalle LH, van BG, Reiber JH. Evaluation of a semiautomatic contour detection approach in sequences of short-axis two-dimensional echocardiographic images. J Am Soc Echocardiogr 1995; 8(6):810-821.
133. Jin SM, Noh CI, Bae EJ, Choi JY, Yun YS. Decreased left ventricular torsion and untwisting in children with dilated cardiomyopathy. J Korean Med Sci 2007; 22(4):633-640.
134. Delgado V, Ypenburg C, van Bommel RJ et al. Assessment of left ventricular dyssynchrony by speckle tracking strain imaging comparison between longitudinal, circumferential, and radial strain in cardiac resynchronization therapy. J Am Coll Cardiol 2008; 51(20):1944-1952.
135. Amundsen BH, Helle-Valle T, Edvardsen T et al. Noninvasive myocardial strain measurement by speckle tracking echocardiography: validation against sonomicrometry and tagged magnetic resonance imaging. J Am Coll Cardiol 2006; 47(4):789-793.
136. Henein MY, Gibson DG. Suppression of left ventricular early diastolic filling by long axis asynchrony. Br Heart J 1995; 73(2):151-157.
137. Henein MY. Ventricular long axis function in coronary artery disease. Imperial College, National Heart & Lung Institute, London University; 1996.
138. Henein MY, Anagnostopoulos C, Das SK, O'Sullivan C, Underwood SR, Gibson DG. Left ventricular long axis disturbances as predictors for thallium perfusion defects in patients with known peripheral vascular disease. Heart 1998; 79:295-300.
139. Mitsnefes MM, Barletta GM, Dresner IG et al. Severe cardiac hypertrophy and long-term dialysis: the Midwest Pediatric Nephrology Consortium study. Pediatr Nephrol 2006; 21(8):1167-1170.
140. Chade AR, Brosh D, Higano ST, Lennon RJ, Lerman LO, Lerman A. Mild renal insufficiency is associated with reduced coronary flow in patients with non-obstructive coronary artery disease. Kidney Int 2006; 69(2):266-271.
141. Weber KT, Brilla CG. Pathological hypertrophy and cardiac interstitium. Fibrosis and renin-angiotensin-aldosterone system. Circulation 1991; 83(6):1849-1865.

182
142. Chinali M, de SG, Matteucci MC et al. Reduced systolic myocardial function in children with chronic renal insufficiency. J Am Soc Nephrol 2007; 18(2):593-598.
143. London GM, Guerin AP, Marchais SJ, Metivier F, Pannier B, Adda H. Arterial media calcification in end-stage renal disease: impact on all-cause and cardiovascular mortality. Nephrol Dial Transplant 2003; 18(9):1731-1740.
144. Wittstein IS. Acute stress cardiomyopathy. Curr Heart Fail Rep 2008; 5(2):61-68.
145. Freedman BI. Genetic factors in common complex renal and cardiovascular diseases. Adv Chronic Kidney Dis 2006; 13(2):105-109.
146. Stewart GA, Mark PB, Johnston N et al. Determinants of hypertension and left ventricular function in end stage renal failure: a pilot study using cardiovascular magnetic resonance imaging. Clin Physiol Funct Imaging 2004; 24(6):387-393.
147. Shoji T, Tsubakihara Y, Fujii M, Imai E. Hemodialysis-associated hypotension as an independent risk factor for two-year mortality in hemodialysis patients. Kidney Int 2004; 66(3):1212-1220.
148. O'Sullivan CA, Henein MY, Sutton R, Coats AJ, Sutton GC, Gibson DG. Abnormal ventricular activation and repolarisation during dobutamine stress echocardiography in coronary artery disease. Heart 1998; 79(5):468-473.
149. Douglas PS, Khandheria B, Stainback RF et al. ACCF/ASE/ACEP/AHA/ASNC/SCAI/SCCT/SCMR 2008 appropriateness criteria for stress echocardiography: a report of the American College of Cardiology Foundation Appropriateness Criteria Task Force, American Society of Echocardiography, American College of Emergency Physicians, American Heart Association, American Society of Nuclear Cardiology, Society for Cardiovascular Angiography and Interventions, Society of Cardiovascular Computed Tomography, and Society for Cardiovascular Magnetic Resonance: endorsed by the Heart Rhythm Society and the Society of Critical Care Medicine. Circulation 2008; 117(11):1478-1497.
150. Stegmayr BG. Ultrafiltration and dry weight-what are the cardiovascular effects? Artif Organs 2003; 27(3):227-229.
151. Andrulli S, Colzani S, Mascia F et al. The role of blood volume reduction in the genesis of intradialytic hypotension. Am J Kidney Dis 2002; 40(6):1244-1254.

183
152. Fischbach M, Edefonti A, Schroder C, Watson A. Hemodialysis in children: general practical guidelines. Pediatr Nephrol 2005; 20(8):1054-1066.
153. Ligtenberg G, Barnas MG, Koomans HA. Intradialytic hypotension: new insights into the mechanism of vasovagal syncope. Nephrol Dial Transplant 1998; 13(11):2745-2747.
154. Selby NM, McIntyre CW. The acute cardiac effects of dialysis. Semin Dial 2007; 20(3):220-228.
155. Maggiore Q, Pizzarelli F, Zoccali C, Sisca S, Nicolo F, Parlongo S. Effect of extracorporeal blood cooling on dialytic arterial hypotension. Proc Eur Dial Transplant Assoc 1981; 18:597-602.
156. Prakash S, Garg AX, Heidenheim AP, House AA. Midodrine appears to be safe and effective for dialysis-induced hypotension: a systematic review. Nephrol Dial Transplant 2004; 19(10):2553-2558.
157. Blowey DL, Balfe JW, Gupta I, Gajaria MM, Koren G. Midodrine efficacy and pharmacokinetics in a patient with recurrent intradialytic hypotension. Am J Kidney Dis 1996; 28(1):132-136.