an investigation into the potential for rainwater
TRANSCRIPT

Rainwater harvesting
An investigation into the potential for rainwater harvesting in Bradford
Simon Doncaster, John Blanksby and Will Shepherd, Pennine Water Group, University of Sheffield
August 2012


Summary
This report provides a brief review of rainwater harvesting and rainwater harvesting tools, which are then used in case study examples for domestic, office block and warehouse rain water harvesting scenarios.
Rainwater harvesting is placed in an historical context as a source of water supply and in a modern context as being complementary to centralised water distribution networks with benefits for wider water
management including flood risk treatment as well as providing environmental and economic benefits.
A range of readily available rainwater harvesting tools are presented and compared using data supplied by the City of Bradford Metropolitan District Council (CBMDC). Rainwater harvesting is discussed in the context of applicable British Standards, from which formula for assessing rainwater harvesting potential and requirements, such as maximum storage tank sizes, are given.
Using data from 2008 to 2010 and provided by CBMDC, case study examples are given for rainwater harvesting potential and reductions in rainfall run-off volumes. These include city centre office blocks,
domestic properties and estates, and large commercial warehouses:
Offices in Bradford are assessed for water demand and rainwater harvesting potential using the ‘RainCycle’ rainwater harvesting tool. The report identifies that whilst reducing demand at source the most effective way of reducing water use, rainwater harvesting can also contribute to reductions in water demand and rainfall run-off even from office buildings with low roof area to occupancy ratios.
The report considers rainwater harvesting from individual domestic properties and from a small urban
estate using rainfall data, roof area data and alternative methods of determining dwelling occupancy
numbers (occupants verses roof area and statistical occupant numbers). Using roof yield coefficients identified in literature and acknowledging the difficulties in determining occupancy numbers (and therefore water demand), the report notes that individual domestic properties can contribute to surface water management though reducing rainfall run-off via rainwater harvesting. This potential is increased as greater numbers of domestic dwellings use rainwater harvesting.
Using the same simplistic method of determining rainwater harvesting potential, the report considers
rainwater harvesting from large, warehouse-type buildings, firstly by only considering available rainfall collected from a large warehouse, and secondly in considering a large warehouse with comparatively low occupancy rates but high water demand (through vehicle maintenance). Both example detail volumes of rainfall that could be captured, thus reducing run-off, whilst the second example also details potential reductions in mains supplied water through comparing mains water supply volumes with potential volumes of harvested rainwater.
As an illustrative example, the report considers the potential for reducing rainfall run-off from a city
centre area, and therefore contributing to flood management, should all roof areas be connected to a rainwater harvesting system and disconnected from urban drainage systems. This illustration details the potential volumes of rainfall that could be collected from roofs within a two kilometre square city centre area, detailing an approximate reduction in run-off of 23%. This compensates for the anticipated increase in runoff that will be generated by climate change by the end of the 21st Century.
The report briefly discusses and gives examples of the potential benefits associated with rainwater harvesting (reduced energy costs associated with unnecessary cleaning and transporting of potable water
supplies, increased capacity in drainage networks, less water abstraction, and potentially reduced demand for reservoir capacity) and uses for harvested rainwater (vehicle and road gully cleaning, urban irrigation schemes, toilet flushing and industrial cleaning operations). Additional benefits include urban flood management and less tangible benefits to the wider environment such as groundwater recharge and reduced water abstraction from rivers.
Constraints on rainwater harvesting such as cost factors and uncertainty of economic gains are noted
along with uptake by businesses and the public. The report concludes that rainwater harvesting has potential for non-potable water use and wider water management through reductions in run-off, particularly so if implemented within urban areas and on a larger, city wide scale, but that this is unlikely to happen unless an appropriate degree of leadership and coordination is provided.

Acknowledgement
The authors would like to thank the staff of City of Bradford Metropolitan District Council for their support in the production of this report. Special thanks go to Tony Poole, Syd Simpson and Kirsty Breaks.

Contents
1 INTRODUCTION ..................................................................................................................................................... 1
1.1 Project Aim; ................................................................................................................... 1
1.2 Project Objectives ........................................................................................................... 1
2 BACKGROUND AND REVIEW ............................................................................................................................. 2
2.1 Rainwater harvesting tools ............................................................................................... 3
2.2 Rainfall harvesting & British Standards .............................................................................. 4
3 CASE STUDIES AND EXAMPLES ........................................................................................................................ 6
3.1 Case study 1: the city centre office block ........................................................................... 6
3.1.1 Methodology ............................................................................................................... 6
3.1.2 Results; Jacobs Well RWH ............................................................................................. 6
3.2 Case Study 2: Rainwater harvesting from domestic buildings - individual dwellings ................. 7
3.2.1 Methodology and results ............................................................................................... 8
3.3 Case study 3: Example of RWH from a housing estate ....................................................... 11
3.3.1 Methodology ............................................................................................................. 11
3.3.2 Results ..................................................................................................................... 12
3.4 Case Study 4: Rainwater harvesting and large, warehouse-type buildings ............................ 14
3.4.1 Example 1; RWH from a large warehouse of unknown water demand ............................... 14
3.4.2 Example 2; RWH and water consumption from a low occupancy, large commercial warehouse
14
3.5 Case Study 5: City centre-scale rainwater harvesting and disconnection .............................. 17
3.5.1 Rainfall run-off management using RWH in Bradford city centre; an example .................... 17
4 DISCUSSION; RAINWATER HARVESTING - USES AND BENEFITS ........................................................ 20
5 CONCLUSIONS ...................................................................................................................................................... 22
6 REFERENCES ........................................................................................................................................................ 23
APPENDICES ................................................................................................................................................................. 25
Rainwater storage tanks sizes ................................................................................................. 28
Appendix 2: Case Study 1: the city centre office block .................................................................. 30
Section A: Jacobs Well data ....................................................................................................... 30
Jacobs Well; potable and non-potable water demand ................................................................. 32
RainCycle default data for Jacobs Well ..................................................................................... 32
Water demand profile for Jacobs Well ...................................................................................... 33
Case Study 1; Rainfall data; the use of average data ................................................................. 33
Case Study 1; Supply and demand spreadsheets ...................................................................... 34
Section B; Jacobs Well - Results and Findings .............................................................................. 35

Optimum storage tank size and demand met ............................................................................ 35
RainCycle tank optimisation and demand met output ................................................................. 36
Volume-balance sheet demand met output ............................................................................... 36
Differences in accounting for rainfall capture and demand met calculations .................................. 37
Case Study 1; Costs .............................................................................................................. 39
Case Study 1; Cost calculations .............................................................................................. 43
Appendix 3: Case Study 2: Rainwater harvesting from domestic buildings - data ............................. 45
Appendix 4: Case Study 3: Rainwater harvesting and large, warehouse-type buildings - calculations . 49
Appendix 5: Bradford city centre; reductions in rainfall run-off through RWH ................................... 50
Appendix 6: Roof yield coefficients, rainfall events and wetting losses ............................................ 52

1
1 Introduction
In light of increasing energy and water treatment costs, the supply and use of potable water to flush toilets, wash cars and undertake laundry is becoming less tenable as an effective use of resources and finances. Increasing water use is also placing demands and constraints on the natural environment as water resources become depleted (Anand and Apul, 2011; Li et al., 2010). In parallel with this, the need
to better manage rainfall and surface flows with respect to flood risk have taken on a new impetus
following recent, severe flood incidents within the UK and worldwide. In these contexts, rainwater harvesting (RWH) offers potential as a means to reduce the demand for potable water in non-consumptive use. Potential benefits associated with this include reduced energy consumption and emissions associated with unnecessarily purifying and pumping water and reduced requirements to abstract water from rivers and aquifers, thereby compensating for anticipated demographic changes and benefiting the wider environment. Additionally, RWH has the potential to assist in attenuating and
reducing rainfall flows to drains and water courses, thereby reducing flood risk associated with surface runoff. Although not without costs and requiring careful consideration with regards installation, maintenance and potential contamination issues, RWH is one of a suite of tools that together could provide improved water management in the context of increasing urbanisation and predicted, climate change related variations in rainfall patterns.
Using case study examples for domestic, office block and warehouse rain water harvesting scenarios, this report considers the potential of RWH as a means to reduce potable water consumption whilst potentially
contributing to flood risk management within Bradford.
1.1 Project Aim;
To investigate the potential benefits of rainwater harvesting from roof surfaces for property owners, flood risk managers, local authorities and water supply organisations.
1.2 Project Objectives
1. To investigate and identify the individual and joint benefits of rainwater harvesting from an office block roof to;
a. the building owner
b. local flood risk managers
2. To upscale and assess the findings with respect to a city centre area.
3. To investigate and identify the individual and joint benefits of rainwater harvesting from a domestic building to:
a. the building owner
b. local flood risk managers
4. To upscale and assess the findings to city scale.
5. To investigate the benefits of rainwater harvesting from a large warehouse for ground
maintenance and street, gulley and sewer cleaning etc.
6. To upscale the findings to city scale
7. To assess the potential benefits in meeting future water demand at city scale

2
2 Background and review
The comparative ‘newness’ in a UK context of RWH as a parallel and alternative to centralised water supplies gives rise to uncertainty as to its application, benefits and constraints; there is little historical information with which to inform decision making. Given the fine balance that often exists in deciding on economic grounds alone whether a project is viable or not, the uncertainty of costs and savings
associated with RWH compared to more predictable costs of mains supplied water make it difficult to
justify RWH installation. This is compounded by demand and rainfall variations; modern society has come to rely on ‘on-demand’ water supplies, and is unlikely to tolerate breaks in supply. Given this context of ‘limitless’ water supply, a review of rainwater harvesting and its potential within current water management issues was undertaken, including reviewing British Standards for rainwater harvesting. Internet-based rainwater harvesting tools were investigated and used for comparative purposes to give an indication of rainwater harvesting potential.
Rainwater harvesting is not a new idea. Practised by ancient civilisations before the development of centralised water distribution network in more recent periods, RWH is still widely used in more remote and arid areas of the world such as Australia and Africa. In its simplest form consisting of a surface to catch rainfall on and a container to store rainwater in, RWH is increasingly presented as an alternative, decentralised water supply in more water-stressed regions of the world. In this respect ‘water-stressed regions’ include more temperate locations where water stress is caused by demand exceeding supply rather than an absence of water, be it rainfall, ground water, riverine or otherwise. In such locations,
water security is an increasing concern. Additionally, RWH has gained increased public awareness
worldwide in line with increased environmental awareness and rising water costs for the consumer (Farreny et al., 2011; Domènech and Saurí, 2011).
The increased interest in environmental concerns within the public has been mirrored within national and international legislation. With respect to water and water management, the preeminent legislation aimed at protecting water resources and governing water management within the European Union are the
Water Framework Directive (2000/60/EC) and the Floods Directive (2007/60/EC). These Directives place greater responsibilities on European Union countries to manage their water resources in a responsible, sustainable manner.
Following the transposition of the Water Framework Directive (2000/60/EC) and the Floods Directive (2007/60/EC) into UK legislation, increased responsibility for water management has been placed on local authorities and the Environment Agency. In addition to aspects such as pollution and water quality control, the management of water to prevent, reduce and manage flood risk forms a central component
of local authority and Environment Agency work. With respect to local authorities and their responsibility
for ordinary and smaller water courses, historical legacies associated with culverted water courses and uncharted drainage networks complicate an already complicated system of water management. This is particularly so in urban areas where many miles of often unidentified drains interconnect and ultimately flow into watercourses that may be unable to accommodate increases in water flow.
Combined with surface flow over impermeable urban surfaces, increased urbanisation and more rapid drainage into urban watercourses have resulted in flooding with often severe impacts for those flooded.
Given that rainfall and urbanisation are expected to increase following climate change and population increases respectively, it is likely that flood risk will also increase (Lhomme et al., 2010). Considering these factors, drainage systems that attenuate and or allow water to drain and disperse more naturally have taken on a greater impetus as a method of managing rainfall and surface water flows. Frequently grouped under the collective banners of SUDS (Sustainable Urban Drainage Systems) or LID (Low Impact Development), such drainage systems are being increasingly used worldwide as a means of attenuating
rainfall and surface water flows (Heal et al., 2009). This has the potential to not only reduce flood risk, but also allow the infiltration of water into the ground in a more natural manner with benefits for the
wider environment. Given its rainfall attenuation potential, RWH could contribute to water and flood management through reducing peak flows following rainfall (ARUP, 2011).
In addition to flood risk reduction, increasing costs in treating and supplying potable water have encouraged the consideration of rainwater as a source of non-potable water supply. Such water can be

3
used for watering gardens, washing cars, toilet flushing and laundry (Environment Agency, 2010). In doing so, potable water treatment and supply costs are reduced, along with associated carbon emissions.
Additionally and important for water-stressed regions, the use of rainwater for non-potable use may lead to less extraction from dwindling ground water supplies and rivers already at risk from low water levels. Concurrently, the capture of rainwater may also counter the demand for new reservoir supply capacity associated with changes in annual rainfall patterns and predicted climate change, and increased demand associated with growing populations. Although there are issues associated with contamination and pollutants within harvested rainfall (Ahmed et al., 2010; Lye, 2009), there is limited evidence from the
UK on pathogen levels within harvested rainwater (ARUP, 2011).
Rainwater harvesting therefore has the potential to reduce the energy demand associated with treating and distributing potable water, to reduce consumer costs and also contribute to flood risk management. Countering these benefits are factors such as installation and maintenance costs, size and placement of storage tanks, filtering and treating rainwater, energy used to pump stored water to outlets in non-gravity fed systems, and the risks of illness caused by contamination of potable water supplies through incorrectly installed and poorly maintained RWH systems.
2.1 Rainwater harvesting tools
Depending on requirements and intent (e.g. water supply and/or flood mitigation), available rainfall and storage space, the potential gains of rainwater harvesting should be compared with cost factors, short and long-term, and expected demand. It may be that demand sufficiently outstrips rain water supply that installing a RWH system is not worthwhile on economic grounds relative to water supply costs. Installing
a RWH system for water attenuation and flood control may, however, offer benefits in addition to supply cost savings.
Determining the benefits or otherwise of rainwater harvesting is difficult. The variables in equipment, installation and maintenance costs are more easily quantified, where as future demand, rainfall volumes and long-term maintenance costs are much more difficult to determine. Numerous internet-based tools are available that provide information on potential water use from RWH systems. These range from tools that are aimed at capturing rainwater for growing crops to meet growing demand for food, to tools
designed to illustrate the cost savings of RWH systems in domestic situations.
Using algorithms to calculate water use and water saved, such tools use inputs such as building occupancy numbers, annual rainfall, roof area and roof type to calculate rainfall collected, water demand and potential savings. As these tools are often used by companies in the business of selling RWH equipment, optimum storage tanks sizes are often given. Using data applicable to a typical, multi-story office block located in Bradford, UK, and associated rainfall data sourced from local authority operated
rainfall gauges, Table 1 details examples of simple, internet-sourced RWH tools and their outputs with
respect to rainfall collected.

4
Table 1; Examples of simple rainwater harvesting tool output
RWH tool Roof
area m2
Rainfall
mm
Roof yield
coefficient/roof type
Water collected/yield
(m3)
Save-the-
rain.comi 1321.8 900* Not required 1189.6
Waterscanii 1353 Not
required** Flat roof 690.9
AJ Design
Softwareiii 1353 775+ 60% 629.1
harvestyourrain
.comiv 1353 775+ 60% 629.1
Bradford average annual rainfall 1911 - 2010; 868mmv
Source (accessed 20/1/2012);
iwww.save-the-rain.com/world-bank
iihttp://www.waterscan.com/rainwater-calculator.asp?page=1
iiihttp://www.ajdesigner.com/phprainwaterharvest/rain_fall_harvest.php
ivhttp://www.harvestyourrain.com/calc.htm
*determined by Save-the-rain.com RWH tool
**Believed to be around 850mm/yr through comparisons with AJ Design & harvestyourain.com output @ 850mm/yr
+Rainfall data supplied by City of Bradford Metropolitan District
Council. Mean average 2008 - 2010 rainfall data
vRain gauge location; Lister Park, Bradford. Source; Met Office. http://www.metoffice.gov.uk/climate/uk/stationdata/bradforddata.txt Accessed 3/11/2011
2.2 Rainfall harvesting & British Standards
RWH systems must comply with British Standard 8515 2009. This includes storage tank sizes, which
must not be oversize due to the risk of bacterial infection (e.g. Legionnaires Disease). To ensure sufficient use of stored water to reduce the likelihood of bacterial infection, the size of rainwater harvesting tanks is limited to the lower capacity of either 5% of annual rainwater yield, or 5% of annual rainwater demand, i.e. whichever is the least.
BS 8515 2009 (BSI, 2009) provides three approaches for determining rainwater yield and storage tank sizes. It is also noted that calculations for residential properties will differ from those for larger,
commercial properties. The latter will require more detailed calculations to ensure cost effectiveness and regular use of stored water to account for potential greater variations in use than within domestic systems.
For smaller and simpler RWH systems, calculations for annual rainfall yield can be calculated by;
YR = A × e × h × ɳ × 0.05
YR = annual rainwater yield (l)
A = collecting or roof area (m2)
e = yield coefficient (%)
h = annual rainfall (mm)

5
ɳ = hydraulic filter efficiency (if filter used)
Similarly, annual demand for non-potable water can be calculated by;
DN = PD × n × 365 × 0.05
DN = annual non-potable water demand
PD = daily requirement per person
n = number of persons
(BSI, 2009)
For the office block example detailed in Table 1, and excluding any hydraulic filter efficiency, a simplistic
annual rainfall yield equates to;
@ 775mm/yr 1353 x 0.6 x 775 = 629.1m3
@ 850mm/yr 1353 x 0.6 x 850 = 690.0m3
(Note, the roof collection coefficient, or yield coefficient, will vary depending on roof material and roof slope. 0.6 equates to the roof collection coefficient for a smooth, flat roof (SUDS Solutions, 2005) frequently found on multi-story office blocks and as used in this example).
The figures of 629.1m3 and 690.0m3compare with those detailed in Table 1 as determined via internet-sourced RWH tools. However, the simplistic nature of the calculations and RWW tools detailed in Table
1,along with Codes of Practice within BS 8515 2009, necessitate a more detailed approach to RWH for commercial buildings. This is to account fully for the size of the building, its commercial use and occupancy numbers. Such an approach is given by the RainCycle RWH tool (SUDS Solutions, 2005). This tool allows a wide range of data to be input, and thus outputs can be tailored to suit large, commercial buildings.

6
3 Case studies and examples
3.1 Case study 1: the city centre office block
3.1.1 Methodology
Case Study 1 considers the potential benefits of rainwater harvesting for an office block in the centre of
the City of Bradford (Jacobs Well; See Figure 3). To achieve this, the following data was required and has been supplied by the City of Bradford MDC;
Rainfall data (2008 - 2010).
Building occupancy numbers (2008 - 2011)
Water demand and costs (2008 - 2009)
This data was refined to account for incomplete annual datasets and data discrepancies.
The RainCycle RWH tool was used to assess rainwater harvesting potential of the case study office block. Using data supplied by CBMDC, the operation of this tool and its outputs (costs, water demand met, optimum storage tank sizes etc.) are discussed in the Appendices and compared to the output of a simple, Excel based volume-balance spreadsheet. The Appendices also detail issues associated with the use of average rainfall data, along with roof yield coefficients and their effect on potential run-off
collected.
3.1.2 Results; Jacobs Well RWH
Table 2,
Table 3 and Table 4 detail the output results for RWH from Jacobs Well using the RainCycle RWH tool. Full results are detailed in the Appendices.
It should be noted that the toilet cisterns within Jacobs Well have recently been reduced from 13.5 litre capacity to 6 litre capacity. This clearly has an impact on water demand. Comparative tables illustrating the difference this has made to water demand and RWH potential are provided in the Appendices.
Table 2; RWH system performance
Annual performance of
Jacobs Well RWH system
Using 6 litre cisterns
Rainfall to storage tank 567m3/yr
Storage tank overflow 8m3/yr
Number of overflows 7 per year
Water demand (urinals & toilets only) 1,8753m/yr
Water supplied by RWH 557m3/yr
Demand met by RWH 29.7%
Mains top-up required 1,319m3/yr

7
Table 3; Water costs
6 litre
cisterns
Average cost of mains water per m3 £1.21
Average cost of harvested water per m3 £0.93
Table 4; RWH savings and pay-back periods
RainCycle Optimise Savings output
Storage tank size; 10,000 litres. Capital costs; £7,337(All prices are 2010 prices)
Analysis runtime; 50 years. Does not include any maintenance schedule
Gravity fed supply - no pump costs.
6 litre cisterns; Mains water cost @ £1.21m3. Demand 1875m3/year
Cistern
capacity
Savings over 50
years
Pay-back period
(years) Demand
met
(%) 0%
Discount
Rate
3%
Discount
rate1
0%
Discount
Rate
3%
Discount
rate4
6 litre £26,250 £10,465 11 13 29.7
Discussed further in the Appendices, the results detailed illustrate that around 30% of water demand
could be met through rainwater harvesting for the Jacobs Well office block. Although installation and maintenance costs require considering, savings on water bills have been identified. Additionally, RWH would provide a modest reduction in run-off from the office block, with benefits for surface water and
flood risk management.
3.2 Case Study 2: Rainwater harvesting from domestic buildings - individual dwellings
Domestic buildings provide opportunity for individual householders to install RWH systems, although the uptake of this will greatly depend on financial demands, occupancy type (owner occupied, private or public sector rented) and house type (detached/semi-detached, terrace, flat), some house types being more suited to RWH than others. Whilst it is possible to fit RWH harvesting systems to older houses, it is perhaps new-build houses that will RWH will become predominate, particularly if planning conditions stipulate run-off limitations from development sites; RWH could be used to meet such planning conditions.
1 The Green Book. (TSO, 2011).
8
In considering new-build properties, additional factors come into play which negate previously used assumptions with respect to domestic water demand and building roof areas. Firstly, modern domestic
appliances, candidates for using non-potable water from RWH, use less water than previous generation of appliances. Secondly, building regulations limit the capacity of newly installed toilet cisterns to 6 litres maximum (TSO, 1999). Thirdly, trends towards greater housing density, including flats and three story houses, potentially give a greater occupancy to roof area ratio thereby affecting the mains water/RWH supply ratio (although there is no direct link between roof area and occupancy numbers). Consequently, whilst modern appliances reduce water demand, new-build properties are likely to have reduced roof
areas and therefore reduced catchment areas (Wallingford, 2011; Roebuck, 2007).
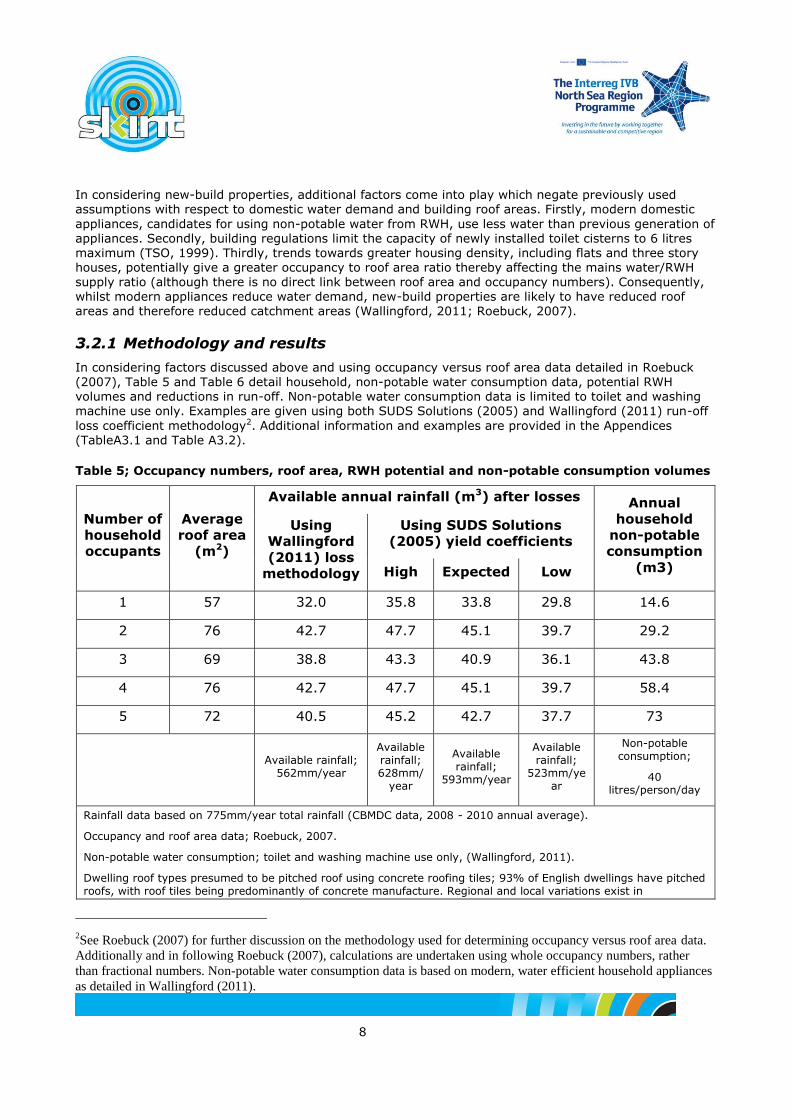
3.2.1 Methodology and results
In considering factors discussed above and using occupancy versus roof area data detailed in Roebuck (2007), Table 5 and Table 6 detail household, non-potable water consumption data, potential RWH volumes and reductions in run-off. Non-potable water consumption data is limited to toilet and washing machine use only. Examples are given using both SUDS Solutions (2005) and Wallingford (2011) run-off
loss coefficient methodology2. Additional information and examples are provided in the Appendices (TableA3.1 and Table A3.2).
Table 5; Occupancy numbers, roof area, RWH potential and non-potable consumption volumes
Number of
household
occupants
Average
roof area
(m2)
Available annual rainfall (m3) after losses Annual
household
non-potable
consumption
(m3)
Using
Wallingford
(2011) loss
methodology
Using SUDS Solutions
(2005) yield coefficients
High Expected Low
1 57 32.0 35.8 33.8 29.8 14.6
2 76 42.7 47.7 45.1 39.7 29.2
3 69 38.8 43.3 40.9 36.1 43.8
4 76 42.7 47.7 45.1 39.7 58.4
5 72 40.5 45.2 42.7 37.7 73
Available rainfall;
562mm/year
Available rainfall; 628mm/
year
Available rainfall;
593mm/year
Available rainfall;
523mm/year
Non-potable consumption;
40 litres/person/day
Rainfall data based on 775mm/year total rainfall (CBMDC data, 2008 - 2010 annual average).
Occupancy and roof area data; Roebuck, 2007.
Non-potable water consumption; toilet and washing machine use only, (Wallingford, 2011).
Dwelling roof types presumed to be pitched roof using concrete roofing tiles; 93% of English dwellings have pitched roofs, with roof tiles being predominantly of concrete manufacture. Regional and local variations exist in
2See Roebuck (2007) for further discussion on the methodology used for determining occupancy versus roof area data.
Additionally and in following Roebuck (2007), calculations are undertaken using whole occupancy numbers, rather
than fractional numbers. Non-potable water consumption data is based on modern, water efficient household appliances
as detailed in Wallingford (2011).

9
construction types and materials (DCLG. (2010). English Housing Survey).
See Table for details of loss and yield coefficients.
DOES NOT ACCOUNT FOR SPILLAGE FROM FULL RWH STORAGE TANKS.

10
Table 6; RWH and reductions in run-off compared to occupancy numbers and roof areas
Number of
household
occupants
Average
roof area
(m2)
Percentage reduction in run-off using RWH
for non potable, domestic use
Annual
household
non-potable
consumption
(m3)
Using
Wallingford
(2011) loss
methodology
Using SUDS Solutions
(2005) yield coefficients
High Expected Low
1 57 46% 41% 43% 49% 14.6
2 76 68% 61% 65% 73% 29.2
3 69
Demand
exceeds
supply
(113%)
101%
Demand
exceeds
supply
(107%)
Demand
exceeds
supply
(121%)
43.8
4 76
Demand
exceeds
supply
(137%)
Demand
exceeds
supply
(122%)
Demand
exceeds
supply
(130%)
Demand
exceeds
supply
(147%)
58.4
5 72
Demand
exceeds
supply
(180%)
Demand
exceeds
supply
(161%)
Demand
exceeds
supply
(171%)
Demand
exceeds
supply
(194%)
73
Occupancy and roof area data; Roebuck, 2007.
Non-potable water consumption; toilet and washing machine use only, (Wallingford, 2011).
See Table for details of loss and yield coefficients.
DOES NOT ACCOUNT FOR SPILLAGE FROM FULL RWH STORAGE TANKS.
The values detailed in Table 5 and Table 6 are indications only of RWH and potential reductions in run-off. Whether using whole or fractional occupancy numbers (Roebuck, 2007 and Wallingford, 2011,
respectively) in calculations, there is little correlation between roof area and occupancy numbers. Wallingford notes that the majority of UK dwellings, 90%, comprise of two to four bedroom houses, with approximately half of houses in a given estate being three bedrooms. Few one bedroom houses are built. However, bedroom numbers do not necessarily relate to occupancy numbers, thus assumptions and categorisations are necessary. Additionally, the timing and duration of rainfall in conjunction with the timing of occupancy and demand will also affect the volume of rainwater that can be stored. Whilst these caveats introduce uncertainty into calculations of RWH and run-off reductions, nonetheless the potential
of RWH from domestic properties is demonstrated, and thus the contributions of domestic dwellings to surface water and flood management are also demonstrated.

11
3.3 Case study 3: Example of RWH from a housing estate
Whereas Roebuck (2007) used whole occupancy numbers linked to average roof areas in calculations, Wallingford (2011) use dwelling bedroom numbers and statistical occupancy rates, i.e. fractional occupancy numbers. Both methodologies contain generalisations as actual occupancy rates are difficult to obtain. As an alternative to Roebucks approach, the following example uses statistical, fractional occupancy numbers as identified in Wallingford (2011).
3.3.1 Methodology
A discrete housing estate within the CBMDC area was chosen using ArcMap GIS. The estate in question contains 35 dwellings, has one entry and exit road and is ‘contained’ within its own development boundaries (Figure 1).
Figure 1; Example housing estate for RWH; Google image (left), OS MasterMap (right)
Using ArcMap, roof areas of the dwellings was established (stand-alone garages, sheds and greenhouses were excluded from the analysis). It was assumed that the dwellings were two to four bedroom houses, with the greater proportion (approximately 50%) being three bedroom (Wallingford, 2011). The remainder were split between two and four bedroom dwellings. Occupancy numbers were set at
statistical rates identified by Wallingford (2011).
Occupancy rates;
Two bedroom (8 dwellings); 1.74 occupants (13.92 occupants)
Three bedroom (18 dwellings); 2.41 occupants (43.38 occupants)
Four bedroom (9 dwellings); 3.02 occupants (27.18 occupants)
Total number of occupants for all 35 dwellings; 84.48
Non-potable water consumption (toilets and washing machines) was deemed 40 litres/person/day, as identified in Wallingford (2011). Non-potable water demand for all 35 dwellings totalled 3,379 litres per day, equating to 1,233m3/year.
Total roof area for all dwellings; 2,844m2, which represents 21% of the total area within the development
Following the 2008 English housing stock report, roof type was presumed pitched with concrete tiles
(DCLG, 2010).

12
Rainfall before losses was set at 775mm/year, using CBMDC data.
3.3.2 Results
Using rainfall, roof area and non-potable water demand data, potential reductions in run-off were calculated. This was done using both Wallingford (2011) and SUDS Solutions (2005) roof yield coefficients. Table 7 details volumes of available rainfall after accounting for losses.

13
Table 8 details reductions in run-off following RWH. As the roof area form 21% of the total area of the estate, the expected yield reduces the total possible runoff by some 15%, assuming total saturation of
gardens, and the reduction of rapid runoff is even greater
Table 7; Example housing estate - available rainfall volumes after accounting for losses
Total housing
estate roof
area (m2)
Annual rainfall
falling on roof
areas before
losses (m3)
Available annual rainfall (m3) after losses
Using
Wallingford
(2011) loss
methodology
Using SUDS Solutions (2005)
yield coefficients
High Expected Low
2,844 2,204.1
1,598 1,786 1,686 1,487
Available rainfall; 562mm/year
Available rainfall;
628mm/year
Available rainfall;
593mm/year
Available rainfall;
523mm/year
Rainfall data based on 775mm/year total rainfall (CBMDC data, 2008 - 2010 annual average).
Dwelling roof types presumed pitched roof using concrete roofing tiles; 93% of English dwellings have pitched roofs. Roof tiles predominantly of concrete manufacture (DCLG, 2010. English Housing Survey. Housing Stock Report 2008).
See Table for details of loss and yield coefficients.
DOES NOT ACCOUNT FOR SPILLAGE FROM FULL RWH STORAGE TANKS.

14
Table 8; Example housing estate - run-off reductions through RWH non-potable consumption
Total, annual non-potable consumption
(m3)
Available rainfall after losses, plus percentage run-off reductions via RWH consumption
Wallingford (2011) loss methodology
SUDS Solutions (2005) yield coefficients
High Expected Low
Available annual rainfall (m3)
% run-off reduction via
RWH consumption
Available RWH (m3)
% run-off reduction via
RWH consumption
Available RWH (m3)
% run-off reduction via
RWH consumption
Available RWH (m3)
% run-off reduction via
RWH consumption
1,233 1,598 77% 1,786 69% 1,686 73% 1,487 83%
Original rainfall data based on 775mm/year total rainfall (CBMDC data, 2008 - 2010 annual average).
Non-potable consumption data; Toilet & washing machine use only. Does not consider outside water use, e.g. garden watering. Non-potable water consumption based on 40 litre/person/day (Wallingford, 2011).
Non-potable consumption demand based on 84.48 occupants in 35 dwellings.
See Table for details of loss and yield coefficients.
SPILLAGE FROM FULL RWH STORAGE TANKS NOT ACCOUNTED FOR

15
3.4 Case Study 4: Rainwater harvesting and large, warehouse-type buildings
Case study 1 illustrates that the installation of a RWH system for an office block (CBMDCs Jacobs Well offices) with a low roof area to occupancy ratio, could reduce toilet and urinal water demand by approximately 30% with additional benefits for reductions in rainfall run-off. For larger buildings with proportionally lower occupant numbers, RWH offers greater potential for reducing mains supplied water and rainfall run-off. Case study 4 gives two examples;
1. example of potential rainwater capture and reductions in run-off from a large warehouse of
unknown water demand
2. example of rainwater capture and potential reductions in run-off and mains supplied water from a large warehouse structure of known water demand
3.4.1 Example 1; RWH from a large warehouse of unknown water demand
As an example of the potential for RWH from large buildings, a distribution warehouse in Bradford was
selected to illustrate the quantities of rainfall that could be collected. The building in question is located 1.6km to the northwest of CBMDCs Jacobs Well offices.
3.4.1.1 Methodology
Due to lack of occupancy and demand data, the following example simply details potential harvested
rainfall volumes, and is based on annual average rainfall volumes multiplied by roof area and factored for run-off yield coefficients as identified by the RainCycle RWH tool (SUDS Solutions, 2005). Table A4.1
(Appendices), details calculations used in this example.
Approximate roof area of the warehouse; 70,000m2
Roof type; multiple pitched roofs, coated, steel sheeting
Rainfall; 775mm/year
Total rainfall falling on warehouse; 54250m3/year
RainCycle yield coefficients;
0.9 (‘High’ coefficient for a pitched roof)
0.85 (‘Expected’ coefficient for a pitched roof)
0.75 (‘Low’ coefficient for a pitched roof)
3.4.1.2 Results; large warehouse RWH
Potential collected rainfall (without any filtering or first flush devices);
Using 0.9 yield coefficient; 48825m3/year
Using 0.85 yield coefficient; 46113m3/year
Using 0.75 yield coefficient; 40688m3/year
As with any RWH system, the volume of rainfall collected will depend on rainfall, roof type and structure. Additional factors such as filtering and first flush devises will also affect volumes of useable rainfall collected. Nonetheless, the example above illustrates that the quantity of rainfall collected from large warehouses and similar buildings could be considerable.
3.4.2 Example 2; RWH and water consumption from a low occupancy, large
commercial warehouse

16
The above example gives a generic indication of potential water savings from RWH using large, warehouse-type buildings with unknown consumption. Relative to an office building, occupancy numbers
for such buildings are likely to be low. However, this does not mean that such buildings have a low water demand; data supplied by CBMDC show that such buildings used for vehicle maintenance and washing, or as waste transfer stations, have high water use. The following example details RWH potential and associated mains-supplied water savings for CBMDCs fleet maintenance depot in Bradford (Figure 2).
Figure 2; CBMDCs fleet depot - Google image (left), OS MasterMap (right)
3.4.2.1 Methodology
Rainfall and water consumption data was supplied by CBMDC. The roof area of the maintenance depot was determined using ArcMap GIS. Whilst a predominantly corrugated pitched roof, the office section of the building complex consisted of flat or gently sloping asphalt roof. Roof yield/run-off and filter coefficients were determined using methodologies in Wallingford (2011) and SUDS Solutions (2005). Occupancy numbers are unknown; therefore this example simply considers total water use.
Annual rainfall; 775mm/year (2008 - 2010 average annual)
Roof area;
pitched corrugated roof; 3,721m2
flat, asphalt roof (presumed smooth surface); 880m2
(Total roof area; 4,601m2)
Average annual water demand (CBMDC data, 2008 - 2010);
4226m3/year
Average annual water supply costs (CBMDC data, £1.21/m3);
£5113.year

17
3.4.2.2 Results
Using roof yield coefficients identified by both Wallingford (2011) and SUDS Solutions (2005) in conjunction with total rainfall and annual water demand values, available annual rainfall volumes and potential reductions in run-off through RWH were calculated (Table 9 and Table 10).
Table 9; CBMDCs fleet depot - Annual available run-off
Roof type
& area (m2)
Annual
rainfall
falling on
roof areas
before
losses (m3)
Available annual rainfall (m3) after losses
Using
Wallingford
(2011) loss
methodology
Using SUDS Solutions
(2005) yield coefficients
High Expected Low
Pitched,
corrugated 3,721 2884 2,091 2,336 2,206 1,947
Flat,
asphalt 880 682 494 368 338 307
Total roof 4,601 3566 2585 2704 2544 2254
Rainfall data based on 775mm/year total rainfall (CBMDC data, 2008 - 2010 annual average).
See Table A2.7 for details of Wallingford (2011) & SUDS Solutions (2005) roof loss and yield coefficients, except SUDS Solutions (2005) flat roof yield coefficients including 10% filter loss; High - 0.54; Expected - 0.495; Low - 0.45.
DOES NOT ACCOUNT FOR SPILLAGE FROM FULL RWH STORAGE TANKS.
Table 10; CBMDCs fleet depot - reductions in run -off
Total,
average
annual
water
use
(m3)
(includes un-
quantified drinking
and similar water use. 2008-2010 average)
Available rainfall after losses (m3), plus percentage run-off reductions via RWH
consumption
Wallingford (2011)
loss methodology
SUDS Solutions (2005) yield coefficients
High Expected Low
Available annual rainfall (m3)
% run-off reduction via RWH
consumption
Available RWH (m3)
% run-off reduction via RWH
consumption
Available RWH (m3)
% run-off reduction via RWH
consumption
Available annual rainfall (m3)
% run-off reduction via RWH
consumption
4226 2585
Demand
exceeds
supply (163%)
2704
Demand
exceeds
supply (156%)
2544
Demand
exceeds
supply (166%)
2254
Demand
exceeds
supply (187%)
Original rainfall data based on 775mm/year total rainfall (CBMDC data, 2008 - 2010 annual average).

18
See Table A2.7A2.7 for details of Wallingford (2011) & SUDS Solutions (2005) roof loss and yield coefficients, except SUDS
Solutions (2005) flat roof yield coefficients including 10% filter loss; High - 0.54; Expected - 0.495; Low - 0.45.
SPILLAGE FROM FULL RWH STORAGE TANKS NOT ACCOUNTED FOR
Figures in Table 10 show water demand within CBMDCs fleet depot exceeds available rainfall run-off irrespective of roof yield coefficients used. Although this example does include un-quantified demand for
potable water (meaning that not all water demand can be met by RWH), nonetheless the example illustrates that RWH from large, low occupancy, high water demand buildings can be an important contributor in reducing both run-off volumes and in supplying water for non-potable use such as vehicle cleaning. Installation and maintenance costs notwithstanding, RWH could also provide significant savings in water supply costs for these same buildings; these being approximated to £5,113 per year3 for CBMDCs fleet depot.
3.5 Case Study 5: City centre-scale rainwater harvesting and disconnection
The potential for RWH to contribute to wider surface water management and reductions in flood risk is illustrated by considering reductions in run-off volumes should all roofs in a given area be disconnected from drainage systems. Theoretically, this could be achieved by installing rainwater harvesting systems for non-consumable use including toilet flushing, garden use and vehicle cleaning. Such an approach is discussed by Wallingford (2011) in considering RWH from a residential development as a means to
manage stormwater run-off.
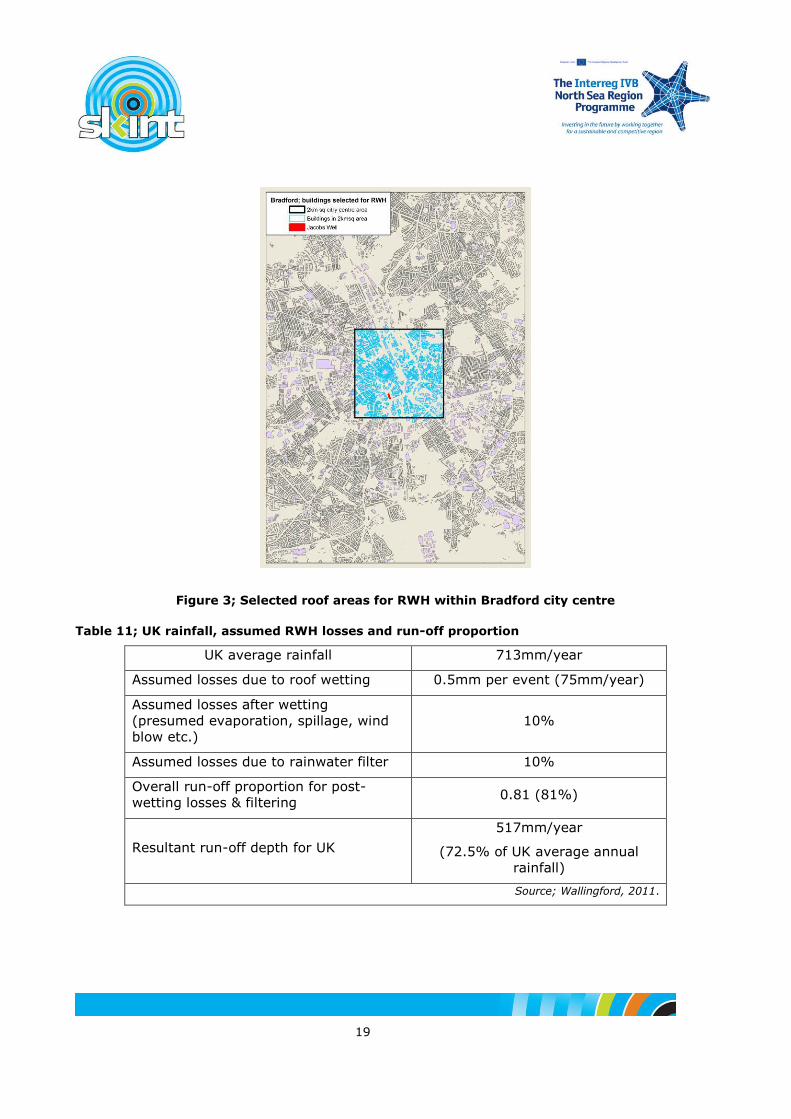
3.5.1 Rainfall run-off management using RWH in Bradford city centre; an example
Simply using annual average rainfall data and total roof area within a 2km x 2km square area of Bradford city centre, the following example illustrates the potential for RWH to contribute to rainfall run-off management and an associated reduction in flood risk.
Figure 3 details the centre of Bradford encompassed by a 2 kilometre square. For the purposes of this example, all roofs within or intersecting the 2km square have been ‘disconnected’ from the surface water drainage system by a RWH device. No account has been taken of roof pitch or construction type and materials.
Table 11 details run-off, i.e. rainfall available for harvesting, based on UK average rainfall and assumed
losses expected using procedures outlined in Wallingford (2011).
Table 12 places these losses in the context of annual rainfall for Bradford, detailing total rainfall and potential rainfall available for harvesting (run-off reduced) through the use of RWH being based on roof area within the city centre 2km square.
Table 13 details potential reductions (as a percentage) in rainfall run-off from Bradford city centre
through the implementation of RWH and disconnection of run-off from surface drainage.
(See Table A5.1 and
Table A5.2 for calculations).
3 Based on 2010 prices of £1.21/m
3, and using 2008 - 2010 average, annual water demand of 4226m
3/year.
19
Figure 3; Selected roof areas for RWH within Bradford city centre
Table 11; UK rainfall, assumed RWH losses and run-off proportion
UK average rainfall 713mm/year
Assumed losses due to roof wetting 0.5mm per event (75mm/year)
Assumed losses after wetting
(presumed evaporation, spillage, wind
blow etc.)
10%
Assumed losses due to rainwater filter 10%
Overall run-off proportion for post-
wetting losses & filtering 0.81 (81%)
Resultant run-off depth for UK
517mm/year
(72.5% of UK average annual
rainfall)
Source; Wallingford, 2011.

20
Table 12; Rainfall harvesting potential based on annual, average Bradford rainfall
Bradford average annual rainfall (2008 - 2012) 775mm/year
Bradford average annual rainfall factored for losses 562mm/year
Total rainfall volume falling within city centre 2kmsq 3,100,000m3
Total rainfall volume falling within city centre 2kmsq &
factored for losses 2,248,000m3
Roof area within city centre 2kmsq (derived using ArcMap) 1,039,739m2
Total volume of rain falling on 2kmsq selected roof area 805,798m3
Potential volume of rain available for harvesting from 2kmsq
selected roof area 584,333m3
Source; after Wallingford, 2011. Rainfall data from CBMDC.
Table 13; Potential reductions in run-off following RWH in Bradford city centre
Bradford rainfall factored for losses except rainwater
filter loss (10%) 624mm/year
Volume of rainfall falling within 2kmsq city centre area
factored for losses except filter loss 2,496,000m3
% rainfall run-off reduction following RWH from
buildings and disconnection from surface drainage 23%
Source; after Wallingford, 2011. Rainfall data from CBMDC
DOES NOT ACCOUNT FOR SPILLAGE FROM FULL RWH STORAGE TANKS..
The above example shows that a reduction in rainfall run-off volumes of approximately 23% could be achieved through RWH and roof disconnection within Bradford city centre. This in turn provides potential
for improved surface water management and a reduction in flood risk through greater spare capacity in
drainage networks and water courses. However, there are caveats to this; the example assumes that all RWH devices work as designed and that there is storage capacity available. In reality, some RWH devices will not work to their full potential, whilst some rainfall will by-pass RWH devices. Additionally, available storage capacity will depend on antecedent demand and rainfall volumes.
The volume of run-off available from roofs in a given area will depend on the density of buildings; less dense development affords less opportunity for RWH, more dense development afford greater
opportunity for RWH and reductions in rainfall run-off from roofs. Therefore the benefits to be gained from using RWH harvesting for stormwater management will greatly depend on the available roof area and density of buildings in conjunction with flood risk and flood damage costs to local residents, businesses and therefore local economies.

21
4 Discussion; Rainwater harvesting - uses and benefits
Many uncertainties exist with respect to RWH (Wallingford, 2011). Factors of yield, demand, optimum storage tank size and variations in rainfall patterns all conspire to make definitive quantifications of RWH potential difficult to determine, both in terms of water supply and economic justification. Nonetheless, that RWH has been and is part of past and current societies indicates that there is a use for such
systems, even in modern, western societies. The difficulty for more widespread installation of RWH
systems lies not in the benefits demonstrated through individual, small scale harvesting systems, but in justifying on economic grounds wider installation of RWH systems in a society that is used to relatively cheap, readily available water from a centralised mains supply system.
Water supply savings related to RWH encompass more than simply water supply costs. Reduced demand for mains supplied, i.e. potable water, would also reduce demand for;
water treatment and associated energy costs
pumping costs associated with mains supply
disposal costs through less rainwater entering sewers and being unnecessarily treated in sewerage treatment works
Reduction in frequency and volume of discharges from Combined sewer overflows
water extraction from rivers and groundwater and their subsequent recharge
costs associated with supply and sewer network infrastructure through reduced capacity requirements
Although issues of contamination exist with RWH, first flush diversion and simple filters can remove larger particles and reduce contamination risk. Additionally, given the non-potable uses that rainwater can be put to contamination becomes less of an issue. Examples of uses for untreated rainfall from large, low occupancy warehouses include;
plant and garden irrigation
gully and drain cleaning
vehicle and building exterior cleaning
road washing
toilet and urinal flushing
industrial cleansing operations
The benefits of the capture of rainwater by RWH will be to provide spare capacity in sewers, drainage systems and watercourses during storm events, although once full, rainwater storage tanks provide no contribution to the management of subsequent flows. However, RWH reduces the need to manage
surface water at ground level and is capable of compensating for a significant portion of the anticipated increase in rainfall that will come with climate change. Studies suggest that this is possible, with RWH storage tanks providing capacity to store rainfall (ARUP, 2011). RWH could therefore be used as a component of flood risk management.
Ultimately and if implemented on a large scale, RWH could reduce the requirement for additional reservoir capacity4. If rainfall can be captured where it falls and used for non-potable purposes, then the volume of water required to be impounded in reservoirs to supply all uses is less; reservoir impounded
water could then become predominantly for potable use. Given expected increases in populations and
4 Currently, there are 2,126 ‘large raised reservoirs’ (over 25,000m3 capacity above natural ground level) within
England and Wales (Defra, 2012). In 2007, plans existed to build five new reservoirs (and extend three existing
reservoirs) (GWI, 2007). These plans have reportedly been cancelled or rejected by the UK Government (Booker, 2012)

22
uncertainties in future rainfall associated with climate change, minimising unnecessary water treatment but maximising untreated water use would likely provide economic and environmental benefits, with
associated gains for Society.
All the factors highlighted add an incremental benefit to RWH. Importantly, an economic aspect can be applied to many of the benefits through reduced mains water supply, infrastructure and energy costs; these having benefits for both public sector organisations such as local authorities and private businesses looking to reduce water supply costs. Additional benefits, such as environmental benefits associated with
less river extraction and falling water tables, are harder to quantify but nonetheless are a benefit. Reduced flood risk, difficult to quantify, would enable more targeted application of flood defence schemes
with benefits for property values and business confidence in areas deemed at less of a flood risk. Although becoming further removed from the simple task of RWH, the costs of flooding to society, property values and businesses are better understood (Pitt, 2008). If these costs can be reduced through RWH, this then gives more economic weight to RWH schemes.
Clearly, to achieve such aims, RWH would need to be implemented on a wide scale. Whilst this might prove problematic for existing dwellings and commercial buildings with limited space for storage tanks and multiple occupancy, for new and redevelopments, installing RWH systems could be a condition of
planning permission without which development restrictions could apply. Equally so, incentives to install RWH systems could include a reduction in domestic and business rates, savings being made in reduced requirements for drainage networks and flood defences, although if adopted as a flood management strategy there would be a requirement for capacity in RWH storage tanks at all times.
The implementation of a city-wide RWH policy would require careful thought and the engagement of a wide range of stakeholders; ensuring that stakeholders understand the reasons for and benefits of RWH
would be critical to long-term operation. Given the relatively low cost of mains water supply and immediate, up-front costs of installing RWH systems, financial or legislative incentives may be necessary to encourage uptake of RWH systems, from which the wider Society would benefit.

23
5 Conclusions
The examples detailed illustrate that RWH, whilst containing inherent uncertainties with regards to supply and demand, nonetheless is able to offer benefits to wider water management. In terms of water demand, the example of CBMDCs Jacobs Well offices reducing water demand through replacing large capacity toilet cisterns with smaller, more efficient cisterns demonstrates that reducing demand at source
is the most effective method of reducing water use. Nonetheless, following this and within a building with
a low roof area to occupancy ratio, RWH has been shown to have benefits for water demand and cost savings. This is also true of domestic dwellings where, depending on occupancy numbers, RWH can contribute to high proportions of domestic water demand.
Perhaps the most beneficial gains from rainwater harvesting can be seen when applied to large, warehouse type buildings or when encompassing multi-property RWH systems in more dense urban areas. Irrespective of water demand from within buildings, the volume of rainfall potentially harvested for
non-potable use elsewhere is considerable. The potential for potable water use to be replaced by untreated water where appropriate, the gains for water and flood risk management, particularly in urban areas with large impermeable areas, and associated savings in pumping, network infrastructure and reductions in drain and sewer surcharging, suggest RWH at a larger scale has many positives. Used in conjunction with other SuDS infrastructure, RWH has potential to contribute wider water management with the added benefit of annual water cost savings for those who install such systems.
The need to seek multiple benefits to maximise the rate of return, means that there is a need for positive
action to achieve the necessary degree of leadership and coordination. Unless this happens, it is likely that the potential benefits will be lost

24
6 References
Ahmed, W; Vieritz, A; Goonetilleke, A, and Gardner, T. (2010). Health Risk from Potable and Non-Potable Uses of Roof-Harvested Rainwater Using Quantitative Microbial Risk Assessment in Australia. Applied and Environmental Microbiology. Vol. 76, pp 7382-7391.
Anand, C. and Apul, D. S. (2011). Economic and environmental analysis of standard, high efficiency,
rainwater flushed and composting toilets. Journal of Environmental Management. Vol. 92, pp 419-428.
ARUP. (2011). Rainwater Harvesting and SuDS - Carbon Implications for Wales. Report No. 216200-00. April, 2011. Ove Arup & Partners Ltd for Environment Agency Wales.
Booker, C. (2012). Keeping the country short of water is now Government - and EU - policy. The Telegraph, 12th May, 2012. Telegraph Media Group Limited. http://www.telegraph.co.uk/comment/9261122/Keeping-the-country-short-of-water-is-now-government-and-EU-policy.html#
BSI. 2009. Rainwater Harvesting Systems - Code of Practice. British Standards Institution. London.
DCLG. (2010). English Housing Survey. Housing Stock Report 2008. Department for Communities and Local Government, London. October, 2010.
Defra. (2012). Reservoir Safety in England and Wales. Consultation on the Implementation of Amendments to the Reservoirs Act 1975. Department for Environment, Food and Rural Affairs, London.
http://www.defra.gov.uk/consult/files/120221reservoir-safety-condoc.pdf
Domènech, L. & Saurí, D. (2011). A comparative appraisal of the use of rainwater harvesting in single
and multi-family buildings of the Metropolitan Area of Barcelona (Spain): social experience, drinking water savings and economic costs. Journal of Cleaner Production. Vol. 19, pp 598-608.
Downey, N. (2009). Roof-Reliant Landscaping. Rainwater Harvesting with Cistern Systems in New Mexico. New Mexico Office of the State Engineer, USA. http://www.ose.state.nm.us/water-info/conservation/pdf-manuals/Roof-Reliant-Landscaping/Roof-Reliant-Landscaping.pdf
Environment Agency. (2010). Harvesting rainwater for domestic uses: an information guide. Environment
Agency, Bristol, UK.
Environment Agency. (2009). Rainwater as a Resource. Rainwater harvesting: an on-farm guide. Environment Agency, Bristol.
Farreny, R; Gabarrell, X. & Rieradevall, J. (2011). Cost-efficiencies of rainwater harvesting strategies in
dense Mediterranean neighbourhoods. Resources, Conservation and Recycling. Vol. 55, pp 686-694.
Farreny, R; Morales-Pinzón, T; Guisasola, A; Tayà, C; Rieradevall, J. & Gabarrell, X. (2011). Roof Selection for Rainwater Harvesting: Quantity and Quality Assessments in Spain. Water Research. Vol.
45, pp 3245-3254.
GWI. (2007). 666 and rising – UK reservoir plans in the spotlight. Global Water Intelligence. Vol 8, Issue 7 (July 2007). http://www.globalwaterintel.com/archive/8/7/general/666-and-rising-uk-reservoir-plans-in-the-spotlight.html
Heal, K, V; Bray, R; Willingale, S, A, J; Briers, M; Napier, F, Jefferies, C. & Fogg, P. (2009). Medium-term performance and maintenance of SUDS: a case-study of Hopwood Park Motorway Service Area, UK. Water Science & Technology. Vol. 59, Issue 12, pp 2485-2494.
Honigstock, E. (undated). Greening Your Home. Living sustainably in Brooklyn. Seminar. Brooklyn, New York, USA. http://ehapc.files.wordpress.com/2008/02/greenhomeseminar.pdf
Lhomme, S; Serre, D; Diab, Y. & Laganier, R. (2010). GIS development for urban flood resilience. WIT Transactions on Ecology and the Environment. Vol. 129. The Sustainable City IV, pp 661-671.

25
Li, Z; Boyle, F. and Reynolds, A. (2010). Rainwater harvesting and greywater treatment systems for domestic application in Ireland. Desalination. Vol. 260, pp 1-8.
Lye, D. J. (2009). Rooftop runoff as a source of contamination: A review. Science of the Total Environment. Vol. 407, pp 5429-5434.
Pitt, M. (2008). Learning the Lessons from the 2007 Floods. Cabinet Office, HM Government. London. 25 June, 2008.
Roebuck, R.M. (2007). A Whole Life Costing Approach for Rainwater Harvesting Systems. Thesis submitted in Partial Fulfilment of the requirements for the Degree of Doctor of Philosophy. School of Engineering & Design, University of Bradford. 2007.
Roebuck, R.M. & Ashley, R.M. (2006). Predicting the hydraulic and life-cycle cost performance of rainwater harvesting systems using a computer based modelling tool. 7th International Conference on Urban Drainage Modelling. 4th - 6th April, 2006. Melbourne, Australia.
TSO. (2011). The Green Book. Appraisal and Evaluation in Central Government. 2003 edition, revised July, 2011. The Stationary Office Ltd, HM Government, London.
TSO. (1999). Statutory Instrument 1999 No 1148. Water Industry England & Wales. The Water Supply (Water Fitting) Regulations 1999. The Stationary Office Ltd, HM Government, London.
SUDS Solutions. (2005). RainCycle Standard - Rainwater Harvesting Hydraulic Simulation and Whole Life Costing Tool v2. User Manual. www.SUDSSolutions.com. November, 2005.
Waggett, R & Arotsky, C. (2006). Key Performance Indicators for water use in offices. CIRIA Report WII. February, 2006. Construction Industry Research and Information Association. London.
Wallingford. (2011). Stormwater Management Using Rainwater Harvesting; Testing the Kellagher/Gerolin methodology on a pilot study. Report SR736, Release 1.0. July 2011. HR Wallingford.
Worm, J. & van Hattum, T. (2006). Rainwater harvesting for domestic use. Agrodok 43. Agromisa Foundation & CTA, Wageningen, The Netherlands.

26
Appendices
Appendix 1: RainCycle RWH tool
Appendix 2: Case Study 1: the city centre office block
Appendix 3: Case Study 2: Rainwater harvesting from domestic buildings - data
Appendix 4: Case Study 3: Rainwater harvesting and large, warehouse-type buildings - calculations
Appendix 5: Bradford city centre; reductions in rainfall run-off through RWH
Appendix 6: Roof yield coefficients, rainfall events and wetting losses

27
Appendix 1: RainCycle RWH tool
Whilst internet-sourced RWH tools are easy to use, their simplistic data requirements limit the detail of information obtained. This is particularly so in respect of variations in water demand and total costs, i.e. whole life costs of installing RWH systems. These issues are magnified when considering large commercial and industrial buildings and RWH potential.
In contrast, the RainCycle RWH tool enables a wide range of data to be input, which enables a greater
range of scenarios to be investigated, and thus more detailed data to be produced. In enabling a wide range of variables to be considered, the RainCvcle RWH tool aims to remove much of the uncertainty
associated with the whole life costs of RWH systems and variations in demand. As such, the RainCycle RWH tool can be used as an aid to decision making (SUDS Solutions, 2005).
Examples of the type of data that can be input to the RainCycle RWH tool include;
roof catchment area and type
water demand, e.g. week days verses weekend demand in commercial buildings
numbers of male and females within a building
building type; domestic, commercial and school buildings
capacity and power demand of pumps
Ultra Violet water purification power demand and flow rates
Examples of output tables include;
whole life costs of RWH systems
long-term financial and hydraulic analysis outputs including graphs
optimisation outputs for costs and storage tank sizes
Figure 4, Figure 5 and Figure 6 detail examples the system map, data input and data output tables within the RainCycle RWH tool. It is not necessary, however, to input data for all fields within the RainCycle tool. Rainfall yield can be determined without filter, pump and UV Unit information, for example. The tool also contains default data that can be used if actual data is lacking, although use of default data will produce
less specific output.

28
Figure 4; RainCycle front page
Figure 5; RainCycle Water Demand Calculator

29
Figure 6; RainCycle Long-Term Analysis page
Rainwater storage tanks sizes
As well as being able to input an actual or desired size of storage tank, the RainCycle RWH tool enables the optimum size of storage tank to be determined. However, there are caveats to this. RainCycle gives alternative methods of determining the optimum storage tank size;
as a % of annual demand/supply
or
as ’X’ days supply.
Due to the different water demand requirements of domestic and commercial buildings, the RainCycle tool suggests that for commercial use, the ‘X’ days supply option should be used. The ‘% of annual
demand’ option has been noted to over-estimate the required storage tank size for large, commercial buildings, and thus is considered suitable for domestic and small scale systems only (SUDS Solutions, 2005).
In addition to the above, it should also be noted that these options are available in RainCycle via the ‘Alternative Sizing Option’ tag within the ‘Optimise Tank Size’ analysis. Using mean average water demand and the number of days supply required, this option simply gives a recommended storage tank
volume. However, this ‘Alternative Sizing Option’ tool is not recommended for use with large, commercial
buildings as it has been shown to give inaccurate data with respect to calculated storage tank volumes (SUDS Solutions, 2005). As an example of this and using Jacobs Well water demand, the ‘Optimise Storage Tank’ tool suggests a 15m3 tank would suffice, where as the more simplistic ‘Alternative Sizing
30
Option’ (using a requirement of six days supply5 and a daily toilet and urinal flush demand of 5.137m3), recommends a 30.8m3 storage tank. This is calculated simply as;
8.30137.56
It should be noted that in calculating optimum storage tank sizes using the ‘Alternative Sizing Option’, the RainCycle tool assumes that any storage tank is full before the start of a dry period and that water demand is the same for all days of the year, i.e. weekends are considered the same as weekdays. For
determining optimum storage tank size, daily water demand is therefore calculated as;
365
demand water annual Totaldemand water annualDaily
This approach does not allow for differences in water demand between weekdays and weekends, important for commercial buildings, and does not allow for storage tanks to be partially full at the start of
a dry period, and thus giving less days supply.
In complying with British Standards, the rainwater storage tank for Jacobs Well should be no larger than 31.5m3. This equates to 5% of the rainwater yield of 629m3 (the lesser of yield and water demand) and adheres to maximum storage tank size requirements as detailed within British Standard 8515 2009 (BSI, 2009).
5 Recommended number of days supply according to current practice, (SUDS Solutions, 2005).

31
Appendix 2: Case Study 1: the city centre office block
Section A: Jacobs Well data
Data provided by the City of Bradford Metropolitan Council (CBMDC) and used in the RainCycle RWH tool included;
occupancy numbers (2008 - 2011)
rainfall data (from rain gauge situated on Jacobs Well, 2008 - 2010)
water demand and costs (2008 - 2009)
Daily rainfall data for the period 2008 - 2010 were averaged for mean values to account for annual variations in rainfall data. Occupancy numbers within Jacobs Well were also averaged for mean values for the period 2008 - 2011; staff reorganisation within CBMDC increased the number of staff within Jacobs Well temporarily. Using the mean average for staff data helped account for this. Water demand was
compared and averaged for the mean value on a monthly basis to account for incomplete annual data and to account for changes in occupancy numbers. A2.1, Table and Table A2.3 in Appendix 2 detail data for rainfall, occupancy and water demand.
The roof area of Jacobs Well was determined using ArcMap (version 9.3) GIS software; this was
estimated to be 1353m2.
The roof collection (or yield) coefficient was set at 60% (0.6), as within parameters detailed in the RainCycle RWH tool for a smooth, flat roof (SUDS Solutions, 2005).
A filter coefficient was set at 90% (0.9), as detailed in SUDS Solutions (2005).
The Jacobs Well toilet cisterns are currently being replaced. The capacity of the old cisterns was 13.5 litres, with the new cistern capacity being six litres as required by current legislation (TSO, 1999). Toilet flush volumes do not take into account differing flush volumes for urinals. Due to lack of data on urinal flush volumes, default values within the RainCycle software have been used.
Given the eight floors to Jacobs Well, the number of urinal ranges requiring flushing is set at one range
per floor, i.e. eight urinal ranges. RainCycle does require the actual number of urinals.
No account is taken of external maintenance teams, temporary staff, visitors to Jacobs Well, nor staff holidays (public holidays are taken account of).
The proportions of male and female occupants within Jacobs Well are unknown. RainCycle allows such data to be entered. For this example, male/female ratios are deemed 50-50.
A drain-down schedule for storage tank maintenance and cleaning has been set at once per year (December 31st).
RainCycle allows ‘Domestic’ and ‘School/Commercial’ settings to be used. These enable different parameters to be set within the tool that better represent water demand within the buildings being investigated. For this project, the ‘School/Commercial’ setting has been used.
Due to the ‘first flush’ of rainwater off a roof often being contaminated with debris, bird droppings and other pollutants, rainwater harvesting systems often contain devises that allow this first flush to be diverted to drainage systems. This can reduce contamination risk and improve the quality of harvested rainwater (Farreny et al, 2011; Lye, 2009). RainCycle contains an option to include a first flush device in
rainwater yield calculations. However, due to lack of data on first flush volumes from Jacobs Well, this
has been given a zero value.
Cost and power consumption data for pumps and UV filters can also be taken into account in RainCycle. Due to lack of data, these values have been set at ‘0’ or left blank. Other data not thought applicable to

32
Jacobs Well, e.g. clothes and vehicle washing demand, garden irrigation, have also been left blank or given a ’0’ value.
Table A2.1; Jacobs Well data for the RainCycle RWH tool
Roof area 1353m2
Roof collection (yield) coefficient 0.6 (60%)
Filter coefficient 0.9 (90%)
‘First flush’ diversion volume 0 litres
Flush toilet cistern capacity; old cisterns 13.5 litres
Flush toilet cistern capacity; new cisterns 6 litres
Number of urinal ranges 8
Ratio of men to women 50/50
Maintenance and cleaning drain-down
schedule Once per year
Table A2.2; Jacobs Well annual rainfall and occupancy data
Year
Annual
Rainfall
(mm)
Number of
Occupants
2008 984.2* 611
2009 733.8 621
2010 609.2 729
2011 no data 647
Mean
average 775.7mm/yr 652
*Less 29th February for rainfall data
Table A2.3: Jacobs Well water demand
Year Water
use (m3)
Total
months data
available
Mean average
water
use/month (m3)

33
2008 3868 12 months 322.3
2009 3810 12 months 317.5
2010 3591 9 months 399
Total demand, all
years 11269 33 months 341.5
The mean average total monthly water use of 341.5m3 per month equates to;
4098m3 per year
11.23m3 per day (@ 365 days/year)
16.2m3 per working day (@ 253 working days/year)
(These values encompass all water use and include the use of 13.5 litre capacity toilet
cisterns).
Jacobs Well; potable and non-potable water demand
Given that water demand figures detailed above comprise of all water use, it is important to separate water use that requires mains water supply, i.e. drinking water, and water uses that could be met by rainwater harvesting, such as toilet use. This can be done by using the RainCycle Water Demand calculator. This tool provides water demand values for uses that do not require mains water supply, such as toilet flushing, washing machines and garden irrigation. For Jacobs Well and based on CBMDC supplied occupancy numbers, water use that could be met by rainwater harvesting, i.e. urinal and toilet use, equates to;
old, 13.5 litre toilet cisterns;
15.483m3 per working day
3917m3 per year
new, six litre toilet cisterns;
7.415m3 per working day
1875m3 per year
These values are based on toilet and urinal water use alone, and it can be clearly seen that considerably less water, 48% less, is required using the new, six litre toilet cisterns.
It should also be noted that the urinal and toilet working day demand of 15.483m3 for the 13.5 litre cisterns is close to the total working day water use of 16.2m3. In conjunction with staff holidays not being accounted for (thereby increasing daily calculated demand) and the inclusion of default values, it is
thought that RainCycle may over-estimate water demand. Due to a lack of more detailed water use information and data, and the change to six litre cisterns, the default values used in these calculations have not been altered. Output using 13.5 litre cisterns is presented for comparative purposes alongside
output for six litre cisterns.
RainCycle default data for Jacobs Well

34
In the event of missing or incomplete data, RainCycle enables the use of default data. For this study, default values have been used for;
Proportion of men who use flush toilets per day; 30%
Number of visits for the above men; 1
Proportion of women who use flush toilets per day; 100%
Number of visits for the above women; 3
Urinals - volume per flush; 7.5 litres
Urinal flushing - hours of operation per day; 8
Urinal flushing - flushes per hour; 2
Water demand profile for Jacobs Well
For establishing water demand patterns in relation to building use, RainCycle uses a Daily Water Demand Profile and Demand Wizard, with options for Schools and Commercial buildings. For commercial buildings, RainCycle uses the following demand profile;
Working days per year; 253 (Monday to Friday)
Saturdays; 52
Sundays; 52
Bank holidays; 8
For the purposes of this study, a nil water demand is presumed for weekends and bank holidays.
Case Study 1; Rainfall data; the use of average data
Use of monthly or annual rainfall volumes can have the effect of giving ambiguous information. Although the use of such rainfall data comprised of many years of data and then averaged may provide more accurate information, this may not reflect actual daily rainfall volumes, nor rainfall variation season to season. How rainfall falls on a day to day basis is critical to how much rainfall can be harvested when considered with water demand profiles and storage tank sizes. To obtain more viable outcomes from the RainCycle RWH tool, daily and seasonal rainfall variations require accounting for. Therefore the use of the
most accurate rainfall data is necessary to produce viable results. To this end, the use of daily rainfall
data is recommended. The least accurate data, and therefore not recommended for use, is annual rainfall data (SUDS Solutions, 2005).
The smoothing effect of average data is also apparent within rainfall data used to determine volumes of harvested rainwater and proportionate water demand for Jacobs Well. Graph A2.1A2.1 details water supply data derived from actual rainfall data for 2008 - 2010, and mean averaged rainfall for the same period. It can be seen that the peaks and troughs within the actual data have been reduced following
averaging. Whilst using a greater time period of data to create average data may produce more representative average figures, nonetheless, the use of average data creates a margin for error that requires considering when interpreting results and deciding on action to take.

35
Water supply derived from rainfall data; average vs actual rainfall data2008 - 2010 daily rainfall data vs mean average 2008 - 2010 daily rainfall data (using 6 litre cisterns)
0%
10%
20%
30%
40%
50%
60%
70%
80%
90%
100%
Janu
ary
Febru
ary
Mar
chApr
ilM
ay
June Ju
ly
Aug
ust
Sep
tem
ber
Octob
er
Nov
embe
r
Dec
embe
r
Wate
r d
em
an
d m
et
(%)
2008 RWH supply
2008 mains supply
2009 RWH supply
2009 mains supply
2010 RWH supply
2010 mains supply
Mean average dataRWH supply
Mean average datamains supply
Graph A2.1; Use of actual rainfall data verses averaged rainfall data
Case Study 1; Supply and demand spreadsheets
In addition to RainCycle output, a volume-balance spreadsheet was constructed in Excel as a means of comparing RainCycle output information for potential water demand met by RWH. This was done using mean average daily rainfall data for the years 2008, 2009 and 2010. Findings using this process are
presented alongside findings from RainCycle simulation output. Figure A2.1A2.1 shows an example of the volume-balance spreadsheet.
Figure A2.1; Example of the volume-balance spreadsheet

36
Section B; Jacobs Well - Results and Findings
Optimum storage tank size and demand met
Having placed the relevant data into the RainCycle tool, simulations were then run to optimum size of storage tank. Additionally, the same data and parameters were placed within volume-balance spreadsheet. The volume-balance spreadsheet used storage tank volumes as
from RainCycle tank optimisation output and enabled a check with RainCycle demand met was done for both six and 13.5 litre capacity toilet cisterns.
TableA2.4 details the findings for both these approaches, comparing storage tank sizes and water demand met, whilst Graph 1.2 details monthly water demand met for six and 13.5 litre cisterns from the volume-balance spreadsheet output.
NOTE; the values of water demand met relate to toilet and urinal water demand only.
TableA2.4; Storage tank volumes and demand met; RainCycle & Volume-balance sheet outputs
Rainfall 2008 - 2010 mean average daily data.
Total rainfall 775mm/year
New, 6 litre cisterns; Water demand 1875m3/year, mean averaged at 7.415m3/working day
Old, 13.5 litre cisterns; Water demand 3917m3/year, mean averaged at 15.483m3/working day
RainCycle determined storage tank size (m3)
RainCycle demand met (%) Volume-balance sheet demand
met (%)
6 litre toilet cisterns
13.5 litre toilet cisterns
6 litre toilet cisterns
13.5 litre toilet cisterns
1 9.5 4.6 23.8 11.4
2 15.6 7.5 26.0 12.5
3 20.1 9.6 27.5 13.2
4 23.1 11.1 28.5 13.6
5 25.3 12.1 29.2 14.0
6 27.1 13.0 29.6 14.2
7 28.2 13.5 29.8 14.3
8 28.9 13.8 29.9 14.3
9 29.3 14.0 30.0 14.4
10 29.7 14.2 30.1 14.4
11 29.9 14.3 30.2 14.5
12 30.0 14.4 30.2 14.5
13 30.1 14.4 30.2 14.5
14 30.1 14.4 30.2 14.5
RainCycle maximum 30.1 14.4 30.2 14.5

37
simulated tank size; 15m3
Monthly water demand; rainwater harvesting vs mains supply2008 - 2010 mean average daily rainfall data
0%
10%
20%
30%
40%
50%
60%
70%
80%
90%
100%
Janu
ary
Febru
ary
Mar
chApr
ilM
ay
June Ju
ly
Augus
t
Septe
mbe
r
Octob
er
Nov
embe
r
Dec
embe
r
Dem
an
d (
%)
% demand metfrom RWH - 6 litrecisterns
% demand metfrom mains supply -6 litre cisterns
% demand metfrom RWH - 13.5litre cisterns
% demand metfrom mains supply -13.5 litre cisterns
Graph 1: Monthly water demand met; RWH verses mains supply
RainCycle tank optimisation and demand met output
From
TableA2.4, it can be seen that the maximum storage tank size required as determined by RainCycle for six litre cisterns is 13m3, which would meet 30.1% of water demand, and for 13.5 litre cisterns 12m3 at
14.4% demand met.
Viewing the RainCycle output data graphically (Graph A2.2), it can be seen that there is little to gain from installing a storage tank greater than 7m3 using six litre cisterns. This would enable 28.2% of water demand to be met, the maximum available being 30.1%. Using the old, 13.5 litre cisterns, a smaller storage tank could be used; a 4m3 storage tank would allow 11.1% of water demand to be met out of a possible 14.5%. Beyond these tank sizes, the rate of demand met using harvested rainfall levels off, and the likely higher costs of installing a larger tank would reduce savings gained through reductions in mains
water supply.
Volume-balance sheet demand met output
Given the unknown calculation process within RainCyle, it is difficult to make a detailed
However, the volume-balance spreadsheet suggests that greater demand can be met using storage tanks (
Table and Graph A2.2). For six litre cisterns, a 5m3 storage tank would meet 29.2% of demand out of a maximum of 30.2%. For the older, 13.5 litre cisterns, there is much less variation in potential demand

38
met volumes; from 11.4% to 14.5%. From the data obtained, there would be little to be gained from installing a tank larger than 2m3, equating to 12.5% of demand met, if using 13.5 litre cisterns.
In considering demand met output using both methods of calculation and either six or 13.5 litre cisterns, the limited rainwater harvesting potential of Jacobs Well can be attributed to the relatively small roof area in relation to the number of occupants. If the occupant numbers were less, this would give a much more favourable rainwater verses mains water supply demand ratio. However, what is apparent from the data is that replacing 13.5 litre cisterns with six litre cisterns reduces toilet water demand considerably,
thereby reducing mains water supply costs. The six litre cisterns also enable a greater proportion of toilet water demand to be met by rainwater harvesting, with associated benefits for reduced mains water
supply.
Water demand met & storage tank volumes; RainCycle vs Volume-balance
spreadsheet
0%
5%
10%
15%
20%
25%
30%
35%
0 1 2 3 4 5 6 7 8 9 10 11 12 13 14 15 16
Storage tank volume (m3)
De
ma
nd
met
(%)
RainCycle output; 6 litre cistern
Volume-balance spreadsheet output; 6 litre cistern
RainCycle output; 13.5 litre cistern
Volume-balance spreadsheet output; 13.5 litre cistern
Graph A2.2; Comparison of water demand met and storage tank volume -
RainCycle and Volume-balance spreadsheet outputs, using 6 and 13.5 litre cisterns
Differences in accounting for rainfall capture and demand met calculations
The two approaches used to determine RWH potential vary in the way rainfall is accounted for relative to
the working day and the storage or not of harvested rainwater. The volume-balance spreadsheet operates on the premise that rainfall that falls on any given day can be used that day, i.e. there is always space available within the storage tank for rainwater to be collected. This gives an optimistic approach to the findings, and hence a greater proportion of demand met when using smaller storage tank volumes.
It is believed that within RainCycle calculations, rainfall that falls on a given day is stored until day, but that the volume stored is based on the available storage capacity at the end of the day; i.e. if at the end of the previous day the storage tank is full, no further rainfall can be
it is 25% full, then there is 75% capacity available. Thus RainCycle uses a very conservative the re-filling of storage tanks. This results in the lower demand met quantities within the

39
output compared to the volume-balance spreadsheet output, particularly when using smaller storage tanks, as detailed in
Table. As such, the RainCycle output could be considered more a pessimistic approach. Figure details a stylised illustration of the different approaches within calculations used by RainCycle and the volume-balance method.
It is important to remember that whilst neither approach used in determining rainfall yield is wrong, both contain assumptions that may or may not be accurate. The assumptions made highlight the inaccuracies
due to carrying out calculations on a daily basis. If calculations were carried out at an hourly or better resolution, then assumptions based on inflow to and outflow from the storage tank would be less
significant. Using RainCycle and the described volume-balance approach effectively gives an envelope of the likely performance of the RWH system.
Volume-
balance
spreadsheet
RainCycle
Figure A2.2: Comparison of rainfall capture, storage and use processes;
Volume-balance spreadsheet verses RainCycle

40
Case Study 1; Costs
The installation of rainwater harvestings systems will depend greatly on requirements and site specific factors. The more equipment required, such as pipes, pumps and water treatment devises, the higher the cost. Additionally and aside from storage tanks costs, installation costs for storage tanks increases rapidly as the size of storage tanks increase (SUDS Solutions, 2005). Thus careful consideration of all cost factors is necessary to determine the viability of RWH systems, particularly if costs savings alone are the reason for installing a RWH system.
An alternative to excavating and placing storage tanks in the ground is to mount them on walls, as detailed for small buildings in ARUP (2011) or on building roofs. Assuming building structures are able to withstand the weight of water storage tanks, such placement may enable gravity fed systems to be installed for water use. This would reduce the requirements for pumps and associated running costs.
If the aim of harvesting rainwater is primarily for attenuation and flood management, then different factors become applicable which may allow the use of larger storage tanks. Additionally, if the aim is not to supply buildings with water for toilet flushing, but to supply untreated water for use in town centre
plant irrigation, road and gully cleaning and similar operations i.e. to reduce potable mains water use in non-potable requirements and so reduce potable water supply costs, installation of above ground storage tanks at ground level with water tanker access is an option. Clearly, the intended aim of harvesting rainwater is critical when considering cost factors, and thus should be established at the outset of a RWH project.
Jacobs Well water costs and savings
For the purposes of this project, it is assumed storage tanks are placed on the roof of Jacobs Well, with gravity fed delivery systems. The RainCycle Optimise Savings tool has been used to calculate costs using default values and calculation methods with one exception; default capital costs have been adjusted for inflation to 2010 values.
The actual components of RainCycle default capital costs are unknown, excepting that a range of storage tank sizes can be input. Due to the limited potential of rainwater capture, only one storage tank size is
considered; 10,000 litre. Capital costs and potential savings are provided for this size of storage tank only.
For the 10,000 litre tank, capital costs are given as £6,300. As these are 2005 values, capital costs have been adjusted for inflation up to 2010, this being the most recent date of available Jacobs Well water cost charges. As adjusted for inflation, £6,300 at 2005 prices equates to £7,336 at 2010 prices6.
Table and Table detail RainCycle output for both six and 13.5 litre cisterns. It can be seen from these that whilst the different cistern capacities affect proportions of water demand met, savings over 50 years
and pay-back periods, at 11 years, are similar for both cistern capacities. The savings of £26,250 and £10,465 over 50 years (at 0% and 3% discount7 rates respectively), add to the benefits of RWH, although in this example they give a small return on investment; the annual savings averaging at £525 and £209 per year over 50 years for each discount rate respectively. (Note, due to limited data, annual maintenance and running costs are unaccounted for).
Table A2.7 illustrates potential savings in 2010 water prices from installing a RWH system for Jacobs Well. It can be seen that greater savings are made, i.e. the cost of harvested water is less, when using
six litre capacity cisterns. This is due to the reduced water demand of these cisterns and the greater ability of rainfall to meet this demand.
6 Average inflation at 3% per annum. Bank of England.
http://www.bankofengland.co.uk/education/inflation/calculator/flash/index.htm 7 Discount rates as detailed in TSO (2011); The Green Book, HM Treasury.

41
(Due to assumptions made in water use, calculations, adjustments for inflation, limited
operational cost data and discount rate applications, values shown are indicative only, and
should be viewed with some caution. No operational or maintenance costs are included in cost
and savings values).
Table A2.5; RWH savings & pay-back periods (Comparative table; 6 & 13.5 litre cisterns)
RainCycle Optimise Savings output
Storage tank size; 10,000 litres. Capital costs; £7,337(All prices are 2010 prices)
Analysis runtime; 50 years. Does not include any maintenance schedule
Gravity fed supply - no pump costs.
6 litre cisterns; Mains water cost @ £1.21m3. Demand 1875m3/year
13.5 litre cisterns; Mains water cost @ £1.21m3. Demand 3917m3/year
Cistern
capacity
Savings over 50 years Pay-back period (years) Demand
met
(%) 0% Discount
Rate
3% Discount
rate8
0% Discount
Rate
3% Discount
rate4
6 litre £26,250 £10,465 11 13 29.7
13.5 litre £26,251 £10,466 11 13 14.2
Table A2.6; RWH system performance (Comparative table; 6 & 13.5 litre cisterns)
Annual performance of RWH system
6 litre
cisterns
13.5 litre
cisterns
Water to tank 567m3/yr 567m3/yr
Tank overflow 8m3/yr 8m3/yr
Number of overflows 7 per year 7 per year
Water demand (urinals & toilets only) 1,8753m/yr 3,917m3/yr
Water supplied 557m3/yr 557m3/yr
Demand met 29.7% 14.2%
Mains top-up required 1,319m3/yr 3,360m3/yr
8 The Green Book. (TSO, 2011).

42
Table A2.7; Water costs (Comparative table; 6 & 13.5 litre cisterns)
6 litre
cisterns
13.5 litre
cisterns
Average cost of mains water per m3 £1.21 £1.21
Average cost of harvested water per m3 £0.93 £1.07
If cost values within Table A2.7 are considered in terms of annual, mean average water demand for Jacobs Well detailed in Table A2.3, then the savings potential of RWH become more apparent. Following Waggett and Arotsky (2006), water use for urinals and toilets within offices is estimated at 63% of total
water demand; 43% toilet flushing and 20% urinal flushing. Given a mean average, 2008 - 2010 total annual water use of 4098m3 in Jacobs Well, 63% of this equates to 2582m3 for urinal and toilet use. Using 2010 prices for water of £1.21/m3, mains supplied water use for urinals and toilets cost £3124 per annum using 13.5 litre capacity cisterns (2010 prices).
Using the same ratios as Waggett and Arotsky (2006), supplied water costs of £1.21/m3 and installing six litre cisterns, the annual cost of mains supplied urinal and toilet water would reduce to £1938 per annum, a cost reduction of 62%. By adding a RWH system and reducing mains water supply by 29.7% (Table
A2.6), mains water supply costs could be further reduced to £1362 per annum. Given allowances for assumptions and uncertainties in both methods of calculation, this figure compares with that determined by RainCycle output at £1596 for mains supplied top-up water for urinal and toilet flushing (values in Table and Table A2.7). This data is summarised in Table which illustrates potential savings associated with RWH for non-potable water use within Jacobs Well.
Table A2.8; Jacobs Well water demand & costs summary (Comparative table; 6 & 13.5 litre cisterns)
Jacobs Well water demand (2010) Water
demand (m3)
Annual mains
supply water
cost
(@ £1.21/m3 . 2010 prices)
All water use Total water demand using 13.5lt cisterns
4098 £4959
Toilet & urinal use at
63% of all water use
(Waggett and Arotsky, 2006)
Toilet & urinal demand; 13.5lt cisterns
2583 £3124
Toilet & urinal water demand;
6lt cisterns 1601 £1938
Toilet & urinal water demand; 6lt cisterns less 29.7% RWH
1126 £1362

43
supply
RainCycle output
using calculated
water demand
Toilet and urinal water demand; 6lt cisterns
1875 £2269
Toilet and urinal water demand; 6lt cisterns less 29.7% RWH
supply
1319 £1596

44
Run-off from Jacobs Well
In addition to cost and water supply savings, it is also important to note that of the potential available rainfall falling on Jacobs Well roof per year, 629 m3/year using a 0.6 yield coefficient (reduced from 1049m3), 577m3 of this is supplied to toilets and urinals for flushing (see Table 1 and Table ). This equates to a calculated 89% reduction in runoff. Factored up for larger buildings or multiple smaller buildings, this ‘distributed attenuation system’ (ARUP, 2011) theoretically provides a considerable reduction in building run-off and thus rainfall entering drainage and sewer systems.
Case Study 1; Cost calculations
Using old, 13.5 litre cisterns;
Average 2008 - 2010 water use; 4098m
Predominant cost water/m3 in 2010 for Jacobs Well; £1.206 (to £1.21)
Waggett and Arotsky (2006); toilet & urinal flushing = 63% of office water use (43% toilets, 20% urinals)
63% of all water use (4098m3) = 2582m3
Cost of 2582m3 of water for toilet & urinal flushing @£1.21/m3 = £3124/year (based on old, 13.5 litre toilet cisterns)
Urinal use @ 20% of all use (4098m3) = 820m3
Toilet use @ 43% of all use (4098m3) = 1762m3 using 13.5 litre cisterns
Using new, 6 litre cisterns;
6/13.5 = 44.4%
44.4% of 1762m3 = 782m3 used to flush toilets
Urinal & toilet use = 820m3 + 782m3 = 1602m3 using 6 litre toilet cisterns
@ £1.21/m3, 1602m3/year = £1938/year toilet & urinal flushing water costs
£1938/£3124x100 = 62%. £1938 = a 62% cost reduction in toilet & urinal water charges from converting to 6 litre cisterns from 13.5 litre cisterns
Including RWH contributions in Waggett and Arotsky (2006) 63% estimates;
RainCycle demand met proportion; 29.7%
29.7% of £1938 = £576
£1938-£576 = £1362 water supply cost/year for urinal & toilet flushing
RainCycle output water supply costs;
Total annual demand for toilet & urinal flushing; 1875m3
RWH supply/year; 557m3 @ 29.7% demand met
RWH water costs per m3; £0.93.
557m3 RWH supply equates to £518 per annum saved through RWH supplied water
Mains supplied top-up required/year; 1319m3

45
Mains supply water costs m3; £1.21.
1319m3 mains supply equates to £1596 per annum cost to top-up supplies to flush toilets & urinals per
year.
Calculations contain assumptions, rounding of values and uncertainties. Approximate values
only.
£ values at 2010 prices.

46
Appendix 3: Case Study 2: Rainwater harvesting from domestic buildings -
data
TableA3.1; RWH and run-off reductions from domestic properties (a)
Domestic dwellings; available annual rainfall after accounting for losses
Number of
household
occupants
Average
roof area
(m2)
Available annual rainfall (m3) after losses
Using
Wallingford
(2011) loss
methodology
Using SUDS Solutions (2005) yield
coefficients
High Expected Low
1 57 32.0 35.8 33.8 29.8
2 76 42.7 47.7 45.1 39.7
3 69 38.8 43.3 40.9 36.1
4 76 42.7 47.7 45.1 39.7
5 72 40.5 45.2 42.7 37.7
Domestic dwellings; occupancy numbers, roof area and annual, non-
potable water consumption
Occupants
Average
roof area
(m2)
Daily
household
non-potable
consumption
(lt)
Annual
household non-
potable
consumption
(lt)
Annual household
non-potable
consumption (m3)
1 57 40 14600 14.6
2 76 80 29200 29.2
3 69 120 43800 43.8
4 76 160 58400 58.4
5 72 200 73000 73
Domestic dwellings; reductions in run-off following RWH - Wallingford loss
methodology
Occupants
Average
roof area
(m2)
Annual
household
non-potable
Available
annual rainfall
Wallingford
% run-off reduction
via RWH consumption

47
consumption
(m3)
(m3)
1 57 14.6 32.0 46
2 76 29.2 42.7 68
3 69 43.8 38.8 113
4 76 58.4 42.7 137
5 72 73 40.5 180
Source data;
Rainfall; 775mm/year. CBMDC data, 2008 - 2010 average annual rainfall data.
Loss methodology/yield coefficient data; Wallingford (2011); 0.5mm wetting loss for all rainfall events, plus additional coefficient losses (ponding, filter etc.) of 0.81. Available rainfall after losses; 562mm (annual). Equates to a 0.725 (72.5%) yield coefficient.
Loss methodology/yield coefficients; SUDS Solutions (2005); available rainfall after roof & 10% filter losses (annual) - High; 0.81 yield coefficient; 628mm; Expected; 0.765 yield coefficient; 593mm; Low; 0.675 yield coefficient; 523mm.
Occupancy & roof area data; Roebuck, 2007.
Non-potable consumption data; Wallingford (2011); Non-potable consumption litres/person/day; 40 (14.6m3/person/year). Non-potable consumption data; Toilet & washing machine use only. Does not consider outside water use, e.g. garden watering.
Dwelling roof types; presumed pitched roof using concrete roofing tiles; 93% of English dwellings have pitched roofs, roof tiles predominantly of concrete manufacture (DCLG, 2010. English Housing Survey. Housing Stock Report 2008).
DOES NOT ACCOUNT FOR SPILLAGE FROM FULL RWH STORAGE TANKS.

48
Table A3.2; RWH and run-off reductions from domestic properties (b)
Domestic dwellings; reductions in run-off following RWH - SUDS Solutions
‘High’ yield coefficient
Occupants
Average
roof area
(m2)
Annual
household non-
potable
consumption
(m3)
Available
RWH ‘High’;
m3/year
% run-off reduction
via RWH
consumption; ‘High’
1 57 14.6 35.8 41
2 76 29.2 47.7 61
3 69 43.8 43.3 101
4 76 58.4 47.7 122
5 72 73 45.2 161
Domestic dwellings; reductions in run-off following RWH - SUDS Solutions
‘Expected’ yield coefficient
Occupants
Average
roof area
(m2)
Annual
household non-
potable
consumption
(m3)
Available
RWH
‘Expected’;
m3/year
% run-off reduction
via RWH
consumption;
‘Expected’
1 57 14.6 33.8 43
2 76 29.2 45.1 65
3 69 43.8 40.9 107
4 76 58.4 45.1 130
5 72 73 42.7 171
Domestic dwellings; reductions in run-off following RWH - SUDS Solutions
‘Low’ yield coefficient
Occupants
Average
roof area
(m2)
Annual
household non-
potable
consumption
(m3)
Available
RWH ‘Low’;
m3/year
% run-off reduction
via RWH
consumption; ‘Low’

49
1 57 14.6 29.8 49
2 76 29.2 39.7 73
3 69 43.8 36.1 121
4 76 58.4 39.7 147
5 72 73 37.7 194
Source data;
Rainfall; 775mm/year. CBMDC data, 2008 - 2010 average annual rainfall data.
Loss methodology/yield coefficient data; Wallingford (2011); 0.5mm wetting loss for all rainfall events, plus additional coefficient losses (ponding, filter etc.) of 0.81. Available rainfall after losses; 562mm (annual). Equates to a 0.725 (72.5%) yield coefficient.
Loss methodology/yield coefficients; SUDS Solutions (2005); available rainfall after roof & 10% filter losses (annual) - High; 0.81 yield coefficient; 628mm; Expected; 0.765 yield coefficient; 593mm; Low; 0.675 yield coefficient; 523mm.
Occupancy & roof area data; Roebuck, 2007.
Non-potable consumption data; Wallingford (2011); Non-potable consumption litres/person/day; 40 (14.6m3/person/year). Non-potable consumption data; Toilet & washing machine use only. Does not consider outside water use, e.g. garden watering.
Dwelling roof types; presumed pitched roof using concrete roofing tiles; 93% of English dwellings have pitched roofs, roof tiles predominantly of concrete manufacture (DCLG, 2010. English Housing Survey. Housing Stock Report 2008).
DOES NOT ACCOUNT FOR SPILLAGE FROM FULL RWH STORAGE TANKS.

50
Appendix 4: Case Study 3: Rainwater harvesting and large, warehouse-type
buildings - calculations
Table A4.1; RWH from large, warehouse-type buildings - calculations
Annual
rainfall
Warehouse
roof area
Total annual rainfall
falling on warehouse
Roof run-off
coefficients
(High; 0.9.
Expected; 0.85.
Low; 0.75)
Potential
collected
rainfall per
annum
(without accounting for any
first flush or filtering losses)
775mm/year 70,000m2 .775×70000=5,4250m3
0.9×5,4250 48825m3/year
0.85×5,4250 46113m3/year
0.75×5,4250 40688m3/year
Rainfall data supplied by CBMDC. Mean average data for 2008 - 2010
Roof run-off coefficients; SUDS Solutions, 2005.
Roof area determined using ArcMap GIS
DOES NOT ACCOUNT FOR SPILLAGE FROM FULL RWH STORAGE TANKS.

51
Appendix 5: Bradford city centre; reductions in rainfall run-off through RWH
Table A5.1; UK rainfall, losses and run-off depths
Rainfall based on 100 year
rainfall series Average UK rainfall 713mm/year
Assumed losses due to wetting
for every event
0.5mm
(75mm per annum. 10.5% of UK average
annual rainfall)
Assumed subsequent run-off
losses after wetting
10%
(presumed to be evaporation, wind blow, rain missing collection devices, ponding etc. Not
specified in Wallingford (2011))
Assumed losses due to rainwater
filter 10%
Overall run-off proportion for
post-wetting losses & filtering 0.81 (81%)
Resultant run-off depth for the
UK
517mm/pa
(72.5% of UK annual average rainfall)
Source; Wallingford. (2011). Stormwater Management Using Rainwater Harvesting; Testing the Kellagher/Gerolin methodology on a pilot study. Report SR736, Release 1.0. July 2011. HR
Wallingford.
Table A5.2; Rainfall, losses and potential reductions in run-off volumes for Bradford city centre
Average annual rainfall; Jacobs Well, Bradford
Jacobs Well, Bradford, average rainfall
(2008 - 2010) 775mm/year
Data supplied by
CBMDC
Jacobs Well, Bradford, average annual
rainfall factored for losses (net run-off =
'harvesting potential')
562mm/year 775/100x72.5
Volume of rain falling within 2kmsq city centre area, per year
Volume of rain falling within 2kmsq city
centre area per year 3,100,000m3 2000x2000x0.775
Volume of rain falling within 2kmsq city
centre area per year & factored for 2,248,000m3 2000x2000x0.562

52
losses
Building roof area and rainfall available for RWH, per year
Area of buildings within 2kmsq 1,039,739m2 Determined using
ArcMap
Total volume of rain falling on buildings
within 2kmsq area, per year 805,798m3 1039739x0.775
Volume of rain falling on buildings within
2kmsq area & factored for losses (i.e.
available for harvesting from buildings),
per year
584,333m3 1039739x0.562
% reduction in run-off through RWH from buildings, per year
Jacobs Well annual rainfall factored for
losses except filter loss (10%) 624mm 562/0.9
Volume of rain falling in 2kmsq city
centre area factored for losses except
filter loss
2,496,000m3 2000x2000x0.624
% run-off reduction following RWH from
buildings in 2kmsq city centre area 23% 584333/2496000x100
SPILLAGE FROM FULL RWH STORAGE TANKS NOT ACCOUNTED FOR.

53
Appendix 6: Roof yield coefficients, rainfall events and wetting losses
Rainfall event duration and intensity will have a marked effect on run-off volumes, as will variations in roof type and material Short, less intense rainfall events will produce little run-off and so little rainfall to collect due to the initial wetting of roof surfaces and ponding within the roof surface structure. Conversely, as rainfall event duration and intensity increase, proportionally less rainfall will be ‘lost’ to roof wetting and ponding, and more will be available as run-off. Additionally, if roof surfaces are already wet following earlier rainfall, than run-off will occur quicker from subsequent rainfall events.
Such factors will therefore create an element of uncertainty with respect to roof yield coefficients and calculated volumes of harvested rainwater; whilst a dry, flat roof may well have a yield coefficient of 0.6 at the start of a rainfall event, this coefficient is likely to become less applicable as the roof becomes saturated and rainfall volumes increase; the more rain that falls, the greater the proportion of run-off. As noted by Wallingford (2011), for higher volume rainfall events, the wetting loss of roof surfaces becomes ‘trivial’. It should be noted that in addition to wetting losses, losses also occur due to evaporation, more in higher temperatures, and wind.
In considering roof yield coefficients further and based on an assumption that the most frequent UK rainfall events per year have an average rainfall depth of 2mm (comprising 125 events of 170 events per annum), Wallingford (2011) observe that these shallow depth events equate to 35% of total annual rainfall9. The shallowness of these predominant events highlights the importance of wetting and evaporative losses relative to rainfall volumes, with Wallingford (2011) noting that initial losses potentially comprise a ‘significant component’ in run-off assessment.
Neither within the RainCycle tool nor within SUDS Solutions (2005) or an associated paper detailing the use of the RainCycle tool (Roebuck and Ashley, 200610), is an explanation given for the determination of yield coefficients for flat roofs. Whilst some authors provide details of why yield coefficients vary, e.g. roof material entrapping more or less water, many do not.
Table A6.1 examples a range of flat roof yield coefficients identified in literature and via the internet. It can be seen that the range of yield coefficients varies widely, even within the same organisations.
9This value is based on an annual UK rainfall depth of 713mm/year using 100 year time series rainfall data. See
Wallingford (2011) for further information. 10
In this paper, a roof yield coefficient of 0.85 is given, although neither roof type nor pitch is given.

54
Source Roof description Yield
coefficient
Honigstock (undated) Conventional flat roof 0.95
Downey (2009) Flat, gravel and tar 0.8 - 0.85
Environment Agency
(2010)
Flat roof with gravel layer 0.8
Farreny et al. (2011) Flat, rough roof 0.62
Worm & van Hattum
(2006)
Flat cement roof 0.6 - 0.7
Environment Agency
(2009)
Flat roof; smooth surface 0.55
SUDS Solutions (2005) Flat roof with smooth surface 0.5 - 0.6
Environment Agency
(2009)
Flat roof with gravel layer or thin turf
(<150mm)
0.45
SUDS Solutions (2005) Flat roof with gravel layer or thin turf
(<150mm)
0.4 - 0.5
Table A6.1; Examples of yield coefficients for flat roofs
The reduced effect of initial wetting losses and therefore the less relevance of roof yield coefficient values as increased volumes of rain falls, and the variety of yield coefficients identified, illustrates the difficulty
in producing definitive values for rainwater harvesting and related reductions in run-off volumes to drainage systems; each rainfall event and its antecedent conditions is unique, thus necessitating the use
of assumptions and margins of error in calculations.

55