an investigation of bipolar and multi-terminal hvdc ... shoubra/electrical... · an investigation...
TRANSCRIPT
AN INVESTIGATION OF BIPOLAR AND MULTI-TERMINAL
HVDC SYSTEMS PERFORMANCE
ABDELSALAM .H.HAMZ, SAMY.M.GHANI AND TAMER ELYAN HAMAMA
Electrical Engineering Department, Faculty of Engineering at Shoubra, Benha University, Egypt.
Corresponding author Samy M. Ghania [email protected]
ABSTRACT
It is well recognized that direct current and direct voltage offer special advantages for both land and sea cable systems, both with regard to power transmission capability, losses, as well as possible transmission length due to no capacitive currents. As cable systems were used very early in large cities, one of the first applications considered for HVDC was to use it for city infeed and some schemes were also built. However, it turned out that the cost for the stations was too high and that the savings on the cable part were not high enough to justify the high costs of the converter stations, even considering other possible benefits of the HVDC techniques such as fast control of active power and almost no contribution to fault currents. Therefore, in this paper investigation of the performance of bipolar and multi-Terminal HVDC systems under different operating conditions are conducted. Models representing some actual HVDC systems, and giving voltage profiles are produced under different working conditions, and are simulated using Matlab/Smiulink. Corresponding computed results are obtained.
Keywords: - HVDC (High Voltage Direct Current Transmission), converter components, bipolar/Multi-terminal HVDC profiles
دراسة أداء ثنائى ومتعدد القطبية لنظم نقل التيار المستمر ذات الجھد العالى :ملخص عربى
النقل باستخدام التيار والجھد المستمر له بعض المميزات فى حاالت إستخدام الكابالت االرضية والبحرية كوسائل لنقل القدرة
ظم النقل عن طريق التيار المستمر تكون تقريبا منعدمة لعدم وجود الكھربية وذلك الن الفقد فى القدر الكھربية المنقولة عبر نھو تغذية وتطبيقات لنظم االنقل عن طريق التيار المستمر الوأحد أول . التيارات السعوية التى تسبب فقد كبير فى القدرة المنقولة
فة نالحظ ان التكلفة التى تم خصمھا من عملية المدن والربط بين الشبكات المختلفة فى التردد والجھد ولكن إذا عدنا الى التكلالنقل باستخدام نظم نقل التيار المستمر تم إضافتھا الى محطات التحويل من التيار المتغير الى التيار المستمر ولكن يوجد بعض
الخطأ فى الشبكة المميزات االخرى لنظم النقل عن طريق التيار المستمر كسرعة التحكم فى القدرة الفعالة وأيضا فى حاالتلذلك تم فى ھذا البحث . كةأ وبذلك نحافظ على اسقرار الشبستخدام التيار المستمر فى تغذية الخطإالكھربية ال تساھم نظم النقل ب
دراسة أداء نظم الدوائر الثنائية والمتعددة تحت ظروف مختلفة للتشغيل والنماذج المستخدمة فى ھذا البحث بعضھا حقيقى .ستخدام برنامج الماتالب فى تصميم النماذج المستخدمةإظروف مختلفة من التشغيل وتم الجھد لھذه النظم تحت وتعطى شكل

1. INTRODUCTION
High-voltage direct current (HVDC) transmission systems are basic and major user of power
electronics technology [1–3]. HVDC technology first made its mark in the early undersea cable
interconnections while, the significant milestone development occurred in 1972 with the first
back-to-back (BB) asynchronous interconnection at Eel River between Quebec and New
Brunswick; this installation also marked the introduction of thyristor valves to the technology
and replaced the earlier mercury-arc valves[4,5]. The losses levels are designed and regulated
into a DC transmission system by the size of conductor selected and AC as well. Either overhead
transmission lines or submarine cables can have lower losses but with higher expense. The
merits of DC systems and configurations over AC systems are still open issues to be eventually
investigated [6-8]. The major components of an HVDC transmission system are the
converter/inverter stations at the ends of the transmission system. In a typical two-terminal
transmission system, both a rectifier and an inverter are required. The role of the two stations can
be reversed, as controls are usually available for both functions at the terminals. The
converter/inverter unit can use 6 or 12-pulse system as per the required output voltage level. The
converter unit is designed basically of valves (thyristor – IGBT) constructed on a module where
each module contains a limited number of series-connected thyristor/IGBT levels. The valves
can be packaged as a single-valve, double-valve, or quadruple-valve arrangement. Converter
transformers connected in (Y-Y) and (Y-∆) arrangements to form a 12-pulse pair feed the
converter [9-11]. The other components are, AC filters, DC smoothing reactors and power
transformers as shown in Figure 1. The HVDC transmission systems can be classified as per the
method of substations connection and the way of loads interconnections to Monopolar Link,
Bipolar Link, Homopolar Link and Multi-terminal systems [12].
2. CONVERTER AND INVERTER ANALYSIS
Figure 2 presents the main circuit parameters and components in the converter bridge to consider
the theoretical analysis of a conventional six-pulse bridge [13].

Fig.1: Typical HVDC converter station equipments.
Fig.2: Six-pulse converter bridge circuit.
For more convenience and simulation purposes the dc current Id is considered constant, Valves
are ideal switches and the ac system is strong (infinite). Because of the leakage impedance of the
converter transformer, an overlap period is necessary and, depending on the leakage in the
general case, with a typical value of converter transformer leakage impedance of about 13–18%,
either two or three valves conduct at any one time. The analysis of the bridge gives the following
dc output voltages:
dcrdod IRVV .cos. −= α (1)
LLdo VV .2).3(π
= (2)
ccr LR ωπ
).3(= (3)
Where:
Vd: is the converter DC output voltage
α : is the converter firing angle
Lc : is the source inductance
VLL : is the AC voltage supply line-line on the rectifier side
ω : is the frequency (rad/sec)
Rcr: is the equivalent commutation resistance at the rectifier
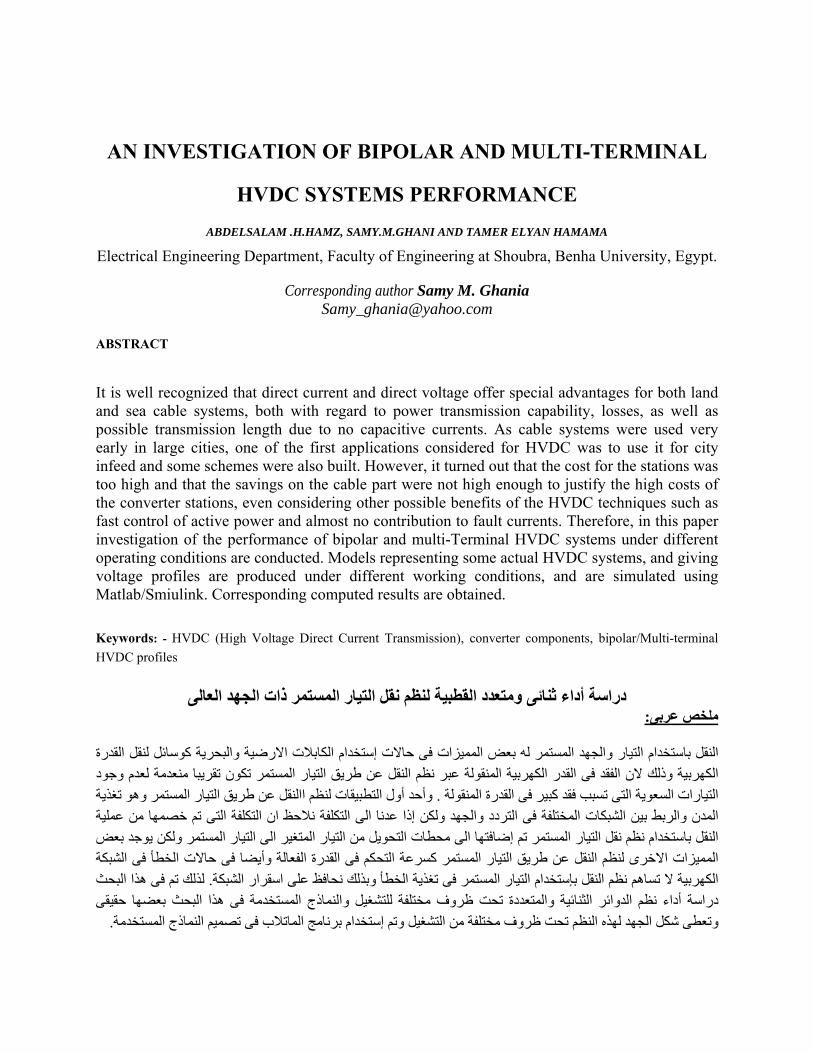
Figure 3 presents the topology of the Voltage Source Inverter (VSI). For an inverter, there are
two options possible, depending on the choice of either the advance angle β or extinction angle γ
as the control variable. The controlling voltage equations of the VSI are as below.
Fig.3: Voltage source inverter (VSI) topology
dcidoidi IRVV .cos. −=− β (4)

dcidoidi IRVV .cos. −=− γ (5)
LLidoi VV .2).3(π
= (6)
cici LR ωπ
).3(= (7)
Where:
VLLi: is the AC voltage supply line-line on the inverter side
Vdi : is the DC voltage at the inverter input.
Vdoi : is the open-circuit DC voltage at the inverter.
Id: is dc current
α: is delay angle
β: is advance angle at the inverter (β= л- α)
γ: is extinction angle at the inverter (γ= л- α- µ)
µ: is overlap angle at the inverter
Rci: is the equivalent commutation resistance at the rectifier
3. DEVELOPED MODELS AND THEIR CONTROL
The first developed model in the present study is the bipolar model to connect between two
different AC substations. Figure 4 shows a 500 kV, 2 kA DC interconnection used to transmit
power from a 500 kV, 3000 MVA and 60 Hz network to a 220 kV, 6000 MVA and 50 Hz
network. In this model using two lines of bipolar model to transmit this power. In case of normal
operation each of the two lines carries 50% of the load current while in case of the fault on one
line the other line carries the total load current. Figure 5 shows the simple presentation of the
control and protection box of the rectifier. For the rectifier control box’s inputs are DC voltage,
current and DC reference current measuring on the output terminal of the rectifier. Meanwhile,
the output of the rectifier control box in the input of the 12-pulse firing control comparing with
input AC voltage of the rectifier and gives the firing angle signals to the bridge. To make stop for
the rectifier the stop order given to the rectifier and the firing angle given to the rectifier bridge is
forced firing angle to make rectifier off. For any abnormal condition say DC fault on the

transmission line the protection system entered after a certain time of the fault happens and
giving value of forced alpha firing angle to make stop for rectifier bridge. After clearing the fault
the control system given order firing angle to the rectifier bridge to making starting for the
rectifier. For the inverter control and protection box’s inputs are almost the same as rectifier but
the index is referred to the inverter side. Besides that the other inputs are not grounded and
considered with specific values to grantee the best control and protection performance of the
system. Figure 6 shows the developed master control of the rectifier and inverter used to control
the starting and stop ramping of the reference current output from the rectifier and input to the
inverter and used to making a step on the reference current by changing the switch from lower to
higher (Id_ref step) and used also to make stop for rectifier and inverter at any time of the
simulation period.
phi = 80 deg . 3rd harm .
500kV, 60 Hz 3000 MVA equivalent
220kV, 50 Hz, 6000 MVA equivalent
phi = 80 deg . 3rd harm .
Rectifier1
A
B
C
+
-
RectifierControl and Protection
Rectifier
A
B
C
+
-
Master Control
Master Control
Inverter 1
A
B
C
+
-
InverterControl and Protection
Inverter
A
B
C
+
-
A B C
AC filters 50 Hz
600 Mvar
A B C
AC filters 60 Hz
600 Mvar
DC line 250 km1
DC line 250 km
DC Fault 1
DC Fault
Brect1 Aa b c
Brect
A
B
C
a
b
c
Binv 1 A B C
a b c
Binv
A
B
C
a
b
c
A-G Fault
A
B
C
A
B
C
A
B
C
A
B
C
0.5 H1 0.5 H 1
0.5 H 0.5 H
A
B
C
A
B
C
Fig. 4: Developed bipolar HVDC Model.

(a) Rectifier control and protection model (b) Inverter control and protection model Fig. 5: Rectifier and inverter control with protection models
b) Inverter control
a) Rectifier control

Fig. 6: master control
The second developed model in the present study is the Multi-terminal model to connect between
three different AC substations. Figure 7 presents the multi terminal high voltage direct current
transmission system (MTDC) used to transmit power to and from three AC networks. The first
AC network is 315 kV, 3000 MVA, and 60 HZ. The second AC network is 315 kV, 3000 MVA,
and 50 HZ. The third AC network is 315 kV, 3000 MVA, and 60 HZ.
Fig. 7: The developed MTDC transmission system
Master Control
Balanced reference currents
Start /Stop
Id_ref _ramp
Stop
Start /Stop & Ramping
Id_ref step
Id _ref_R
Stop_I
Stop_R
Id _ ref_I
Enable Ref. Current Step
0

The control system of this model as the same as before for both rectifier and inverter with using
the master control to determine the slag bus which is considered the biggest one in the system.
4. STUDIES CASES AND SIMULATION RESULTS
The voltage and current waveforms for each developed model will be depicted in different cases
of working conditions such as steady state operation or normal operation and in Fault condition.
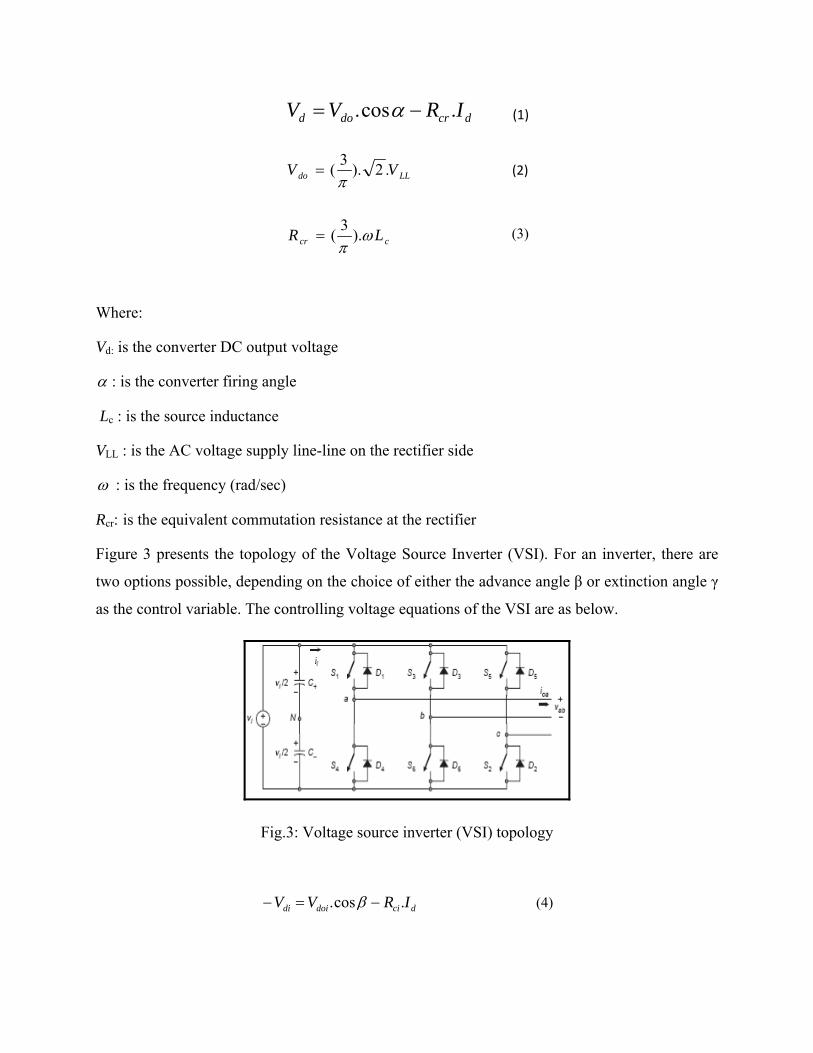
Figure 8a shows the waveforms of the AC voltage input to the rectifier at normal condition with
open circuit. The value of the voltage over the simulated time is constant at the rated value of 1
pu. Figure 8b shows the DC voltage of the rectifier. the DC voltage reached to steady state in
0.08 s and the output is almost not pure DC voltage even if using reactor of (R=5 ohm, L=5 H).
Figure 8c shows the total harmonic distortion (THD) of the AC Voltage wave form input to the
rectifier and it can be noted that THD is about 0.19 %. Figure 8d shows the output DC voltage
with a shunt capacitor filter of 100 μF without series smoothing reactor connected on the output
terminal of the rectifier, this reduces the voltage waveforms ripples.
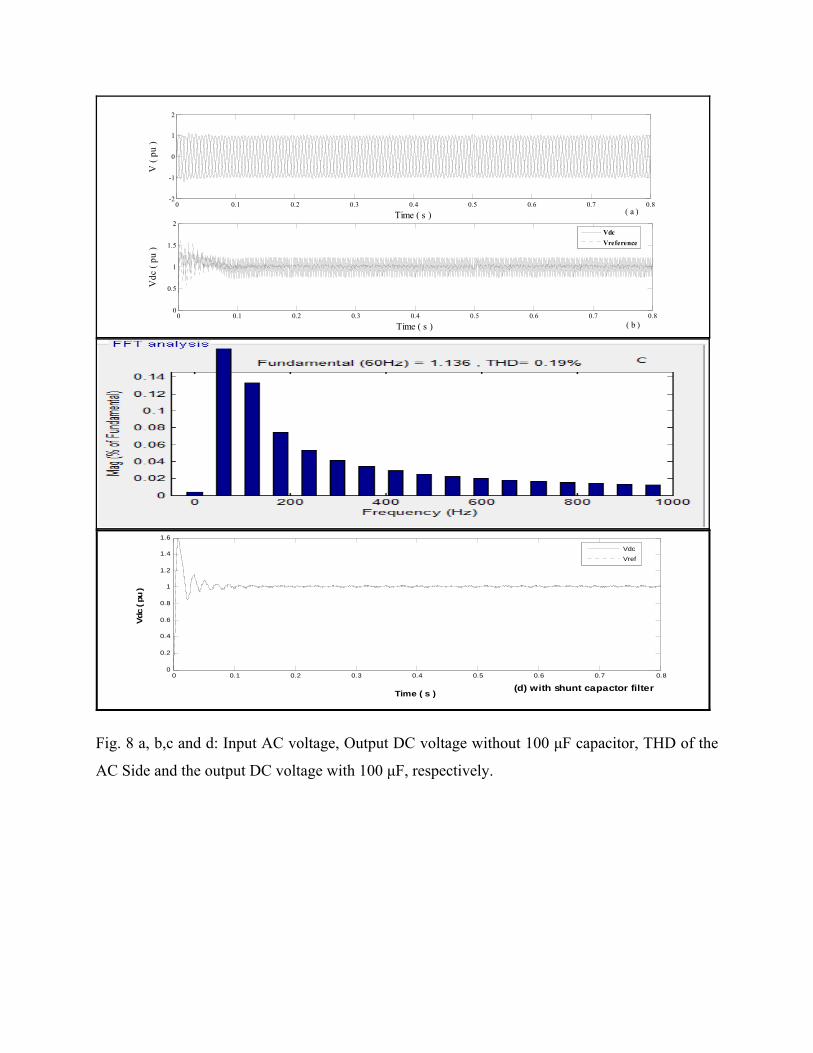
Figure 9 shows the waveforms of the DC voltage and current output (double lines) of the
rectifiers at normal condition with the whole system connected. The DC output voltage of the
rectifier and input DC voltage of the inverter is almost pure DC. The DC load currents are
equally shared between the two lines as each line is carrying 0.5 pu load current.
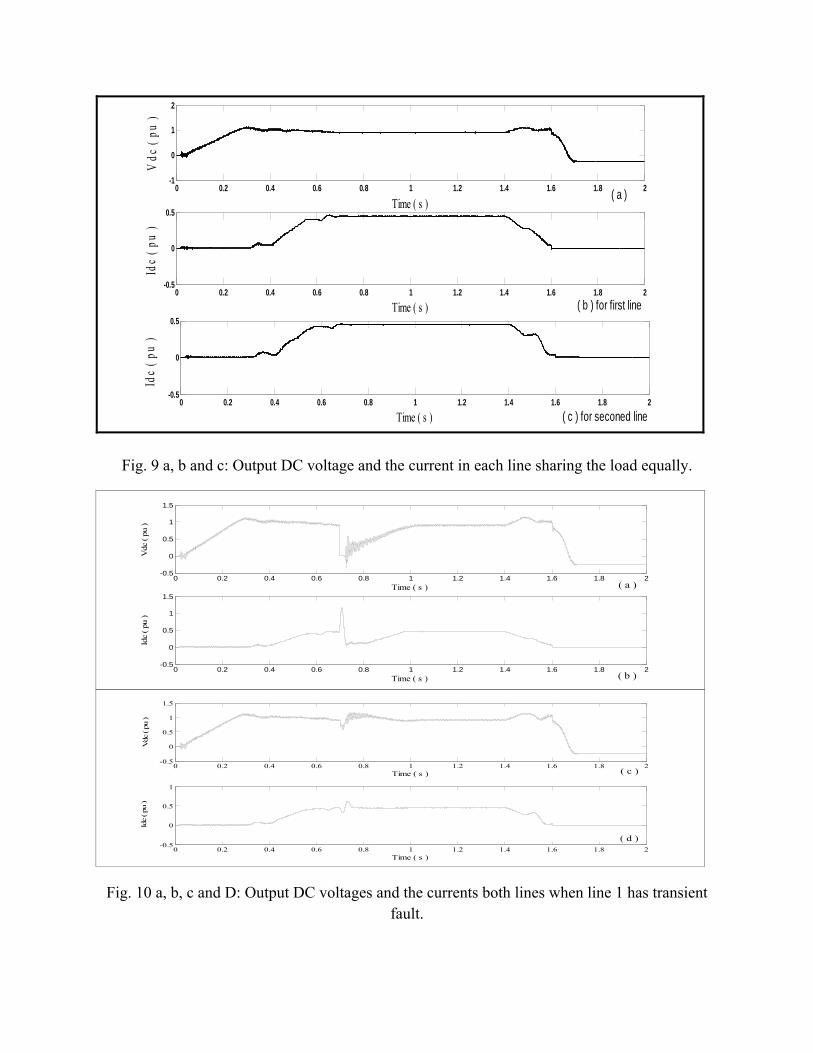
Figure 10 shows the output voltages and current waveforms of the bipolar system when line 1
has transient fault. It can be noticed that the faulted line voltage reaches zero volts at fault time
while the second line does not except it has minor wave distortions.
Figure 11 presents the output DC voltages of three rectifiers of MTDC system and the input DC
load current of three AC loads connected to three AC inverter (1,2 and 3). For simulation
purpose and demonstration 100 kw load is assumed. It can be noted the DC voltage of the three
rectifiers (1,2 and 3) connected to the three phase, three AC networks started from zero to reach
to steady state of 315 kV after 0.1 s of the considered simulation time of 0.8 s.
Figure11(b) shows input DC load current for each connected load to the output terminals of the
three inverter (1,2 and 3) the load current almost equal to 95.5 ampere. The DC load current
started from zero to reach the steady state in 0.12 s.
0 0.1 0.2 0.3 0.4 0.5 0.6 0.7 0.8-2
-1
0
1
2
Time ( s )
V (
pu )
( a )
0 0.1 0.2 0.3 0.4 0.5 0.6 0.7 0.80
0.5
1
1.5
2
Time ( s )
Vdc
( pu
)
( b )
VdcVreference
0 0.1 0.2 0.3 0.4 0.5 0.6 0.7 0.80
0.2
0.4
0.6
0.8
1
1.2
1.4
1.6
Time ( s )
Vdc
( pu
)
(d) with shunt capactor filter
Vdc
Vref
Fig. 8 a, b,c and d: Input AC voltage, Output DC voltage without 100 μF capacitor, THD of the
AC Side and the output DC voltage with 100 μF, respectively.
0 0.2 0.4 0.6 0.8 1 1.2 1.4 1.6 1.8 2-1
0
1
2
Time ( s )
Vdc
( pu
)
( a )
0 0.2 0.4 0.6 0.8 1 1.2 1.4 1.6 1.8 2-0.5
0
0.5
Time ( s )
Idc
( pu
)
( b ) for first line
0 0.2 0.4 0.6 0.8 1 1.2 1.4 1.6 1.8 2-0.5
0
0.5
Time ( s )
Idc
( pu
)
( c ) for seconed line
Fig. 9 a, b and c: Output DC voltage and the current in each line sharing the load equally.
0 0.2 0.4 0.6 0.8 1 1.2 1.4 1.6 1.8 2-0.5
0
0.5
1
1.5
Time ( s )
Vdc
( pu
)
( a )
0 0.2 0.4 0.6 0.8 1 1.2 1.4 1.6 1.8 2-0.5
0
0.5
1
1.5
Time ( s )
Idc
( pu
)
( b )
0 0.2 0.4 0.6 0.8 1 1.2 1.4 1.6 1.8 2-0.5
0
0.5
1
1.5
Time ( s )
Vdc
( pu
)
( c )
0 0.2 0.4 0.6 0.8 1 1.2 1.4 1.6 1.8 2-0.5
0
0.5
1
Time ( s )
Idc
( pu
)
( d )
Fig. 10 a, b, c and D: Output DC voltages and the currents both lines when line 1 has transient fault.

0 0.1 0.2 0.3 0.4 0.5 0.6 0.7 0.8-20
0
20
40
60
80
100
120
Time ( s )
Idc ( a
mpe
r )
(b)
Fig. 11 (a): presents the output DC voltages on the DC grid, (b): presents the input DC load current of three AC load connected to three AC inverter (1, 2 and 3).
Figure 12 shows the output DC currents of the three rectifiers. It is noted that, the DC current
reaches to the steady state value and when the third AC network is disconnected after 0.5 s of the
considered simulation time, the other two substations increase their generation to compensate the
DC grid power to maintain feeding the total connected loads.

Figure 12 (a, b, c): represented the output DC currents of the three rectifiers respectively

Figure 13 shows the output DC voltages of three rectifiers (1, 2 and 3) and the input DC load
currents of three AC loads connected to three AC inverter (1,2 and 3) in case of applying DC
fault on the output terminal of the rectifier (1). The load current almost equal to 95.5 ampere
from zero to 0.5 s of the considered simulation period. At 0.5 s the DC current increases to
negative 2000 ampere as a result of a DC fault applying on the output terminals of the rectifier
one. The protection systems blocks the rectifier, after clearing the fault, the DC load current
returns to its normal value of 95.5 ampere at 0.58 s, and analyzed to be used as a helpful tool in
the design phase of the HVDC systems. If the fault happens on the DC side it affects on the input
AC voltage to the rectifier with THD of about 10 % for 3 cycles. With using capacitor filter of
100 µF on the output terminal of the rectifier, the output DC voltage profiles are almost pure DC
Fig.13: The output DC voltages of three rectifiers (1, 2 and 3) and the DC load current at the
faulted terminal of rectifier no. 1.
5. CONCLUSIONS
Bipolar and Multi-terminal models of HVDC transmission systems are simulated and investigated under a variety of loading operation and fault conditions. The simulation models and control system are built and developed based on Matlab/Smiulink package. Through this study the different obtained HVDC systems voltage profiles are investigated and analyzed to be used as a helpful tool in the design phase of the HVDC systems. If the fault happens on the DC side it affects on the input AC voltage to the rectifier with THD of about 10 % for 3 cycles. With using capacitor filter of 100 µF on the output terminal of the rectifier, the output DC voltage profiles are almost pure DC. For bipolar model each line should be designed to carry the full load current in case of DC fault or any problems on the other line. In normal operation each line carries around 50 % of the total transmitted power. In MTDC transmission system the voltage output from each rectifier connected to the DC grid should be constant and controlled by the reference station. For the developed model of MTDC in case of DC fault on one of the rectifiers connected to the DC grid, the voltage of the DC grid reached to zero and fault current reached to 15 kA.
6. REFERENCES
[1] Mesut E. Baran, Nikhil R. Mahajan,”DC Distribution for Industrial Systems: Opportunities and Challenges”, IEEE Transactions on Industry Applications, vol. 39, No. 6, November/December, 2003.
[2] D. M. Larruskain, et al,” Transmission and Distribution Networks: AC versus DC”, Department of Electrical Engineering, University of the Basque Country – Bilboao (Spain). www.ehu.es
[3] J. Arrillaga, "High Voltage Direct Current Transmission", 2nd edition, the Institution of Electrical Engineers, 1998.
[4] Paulo Fischer de Toledo, ”Feasibility of HVDC for City Infeed”, Licentiate Thesis, Royal Institute of Technology ,Department of Electrical Engineering, Electric Power Systems, Stockholm 2003.
[5] Black and Veatch, ”High Voltage Direct Current Transmission System Study”, The United Illuminating Company, The Connecticut Light and Power Company Middletown-Norwalk Transmission Line project, B&V Project 133193.43.1200, Dec, 2003.

[6] Madrigal, M. Acha, ”Harmonic Modeling of Voltage Source Converters for HVDC Stations”, IEE Conference Publication, 7th International Conference on AC-DC Power Transmission, London, United Kingdom, Nov 28-30,2001.
[7] Sastry Kumganty,” HVDC Transmission System Models for Power System Reliability Evaluation”, IEEE wescanex '95 proceedings, 1995.
[8] Tanaka,Toshihiko,Nakazato and et al, ” A New Approach to the Capacitor-Commutated Converter for HVDC - A Combined Commutation-Capacitor of Active and Passive Capacitors”, Proceedings of the IEEE Power Engineering Society Transmission and Distribution Conference, v 2, n winter meeting, 2001, p 968-973,IEEE Power Engineering Society Winter Meeting, Jan 28- 1,2001.
[9] Arifoglu and Ugur, ” The Power Flow Algorithm for Balanced and Unbalanced Bipolar Multiterminal AC-DC Systems”, Electric Power Systems Research, v 64, no 3, March, 2003, p 239-246, March, 2003.
[10] Osauskas, C. Wood,” Small-signal Dynamic Modelling of HVDC Systems”, Power Delivery, IEEE Transactions, v 18, p 220-225, Jan 2003.
[11] Tortelli, O.L, Acha and et all, “Inclusion of a High voltage DC –Voltage Source Converter Model in a Newton-Raphason Power Flow Algorithm”, IEEE proceedings: Generation, Transmission and Distribution 150,n 6,p 691-696,NOV.2003.
[12] Nagat M.K.Abdel-Gawad,”HVDC Systems Voltage Profiles Under Different Conditions for Interconnected Power Systems”, paper EE155, proceedings of the 7th, ICEENG International conference on Electrical Engineering, cario,Egypt,25-27 may, 2010.
[13] Muhammad H. Rashid,” Power Eectronices Handbook”, International Standard Book Number: 0-12-581650-2, ACADMIC PREES, A Harcourt Science and Technology Company, New York / Canada, 2001.