an investigation of the corporate tqm practices and
TRANSCRIPT
Bulletin of Education and Research
December 2020, Vol. 42, No. 3 pp. 51-77
An Investigation of the Corporate TQM Practices and Corresponding Results in Pakistani Perspective: Implications for
Business Education
Shaukat Ali Raza* Abir Hassan Naqvi** Sajjad Ali Gill***
__________________________________________________________________
Abstract The purpose of the study was to investigate the corporate total quality management practices and corresponding results achieved by corporate sector firms of Lahore, Pakistan with implications for the business schools offering TQM courses. The variables studied include leadership, resource management, performance measurement and feedback, continuous improvement, supplier quality management, education and training, work environment and culture, and customer satisfaction as sub-scales and corresponding results achieved by these firms as a consequence of such practices. The data were collected from corporate managers through an adapted instrument and descriptive and inferential statistics were employed. The findings reflected a high to very high level of TQM practices carried out by the companies participating in the study and their corresponding TQM results whereas the sub-scales are rated by corporate managers as customer satisfaction, continuous improvement, leadership, resources management, supplier quality management, education and training, work environment and culture, performance measurement and feedback, in their order of preference. The results indicated that the corporate sector needs to work on incorporating the highest level of TQM practices for maximum corporate success and the business schools offering TQM courses also need to respond the consequences of these findings.
Keywords: Corporate sector, Total quality management (TQM), TQM practices, TQM results
*Associate Professor/Chairperson, Department of Business Education, Institute of Education and Research, University of the Punjab, Lahore. E-mail: [email protected] **PhD Scholar, University of Lahore. ***Assistant Professor, Department of Sports Sciences & Physical Education, University of the Punjab, Lahore

An Investigation of the Corporate TQM Practices 52
Introduction & Background
Corporate managers have always been struggling for continuous improvement of their operating activities for operational efficiency and effectiveness. For this purpose, they have been trying various managerial approaches that could lead to achieve operational goals and TQM, obviously, is one of such initiatives. Total Quality Management (TQM) has emerged as a management approach based upon guiding principles or core concepts that demonstrate the way organizations are supposed to plan and execute operations for achieving high performance (Eriksson & Garvare, 2005; Bou-Llusar, Escring-Tena, Roca-Punig, & Beltran-Martin, 2009) in terms of their goals.
Corporations are implementing TQM principles and guidelines and the world is witnessing its consequences especially in the form of high achievements of Japanese companies through strong cultural development and the recent global market capture by the Chinese and Malaysian firms as a reflection of better product quality and cost effectiveness.
Pakistan is a developing economy under constant operational and market threats. Whether Pakistani firms could benefit from worldly set TQM precedents, is a matter of investigation. This study was, therefore, designed to investigate this issue and pursue the following objectives
1. Explore the total quality management practices of the corporate sector firms in Lahore, Pakistan, in terms of leadership, resource management, performance measurement and feedback, continuous improvement, supplier quality management, education and training, work environment and culture, and customer satisfaction as sub-scales.
2. Explore the corresponding results of total quality management practices of Pakistani corporate sector.
3. Investigate the relationship of total quality management practices of Pakistani corporate sector and the corresponding results of such initiatives with implications for the business schools offering TQM courses.
Review of Literature
The evolutionary path, the factors/principles, practices, and the consequences of total quality management, need to be understood. Hence, the following paragraphs will provide an elaborated account of these aspects of TQM to establish their understanding.

Raza, Naqvi & Gill 53
The concept
Total quality management consists of factors or principles, the application of which can lead to achieve high performance (Eriksson & Garvare, 2005). It is an approach to management embracing both social and technical dimensions aimed at achieving excellent results, which needs to be put into practice through a specific framework (Bou-Llusar, Escring-Tena, Roca-Punig, et al., 2009:1).
Total Quality Management (TQM), as a comprehensive management philosophy, is based on the competitive position of Japanese and Western industries during the 1970s to mid-1990s (Dahlgaard, Reyes, Chen, & Dahlgaard-Park, 2019). Kaynak (2003), Fissher and Nijhof (2005), Lewis, Pun, and Lalla (2006) and Bou-Llusar et al. (2009) have summarized TQM concept in three main points.
1. The TQM dimensionality: there are two broad TQM dimensions namely the social or soft TQM that emphasizes leadership, teamwork, training, and employee involvement as human resource management and technical or hard TQM that deals in establishing the well-defined processes and procedures leading to constant improvement in the quality of goods and services for customers (Lewis, Pun, & Lalla, 2006; Bou-Llusar et al., 2009).
2. The holistic TQM character: the social and technical TQM dimensions and the concepts these are based upon, must be viewed in totality to get an overall view of the organization (Fissher & Nijhof, 2005; Bou-Llusar et al., 2009).
3. The optimal TQM management: the core concepts of TQM, if managed optimally, lead to better organizational performance through identification of customers’ needs, responding to changing markets, and efficient production and service processes (Kaynak, 2003; Bou-Llusar et al., 2009).
The evolutionary path
Taking start in early 1900s, the quality enhancement initiatives taken by businesses all around the globe have gone through different phases to reach the modern TQM philosophy. Yang (2012) has summarized some of these initiatives as given below.
Inspection quality control (IQC), since 1910: influenced by Frederick W. Taylor, Ford Company created the assembly line in 1913.
Statistical process control (SPC), since 1930: Walter Shewhart suggested using a sampling inspection against 100% inspection to reduce the inspection cost at Bell Labs.

An Investigation of the Corporate TQM Practices 54
Total quality control (TQC), since 1950: in line with Deming, Juran, and Crosby, Armand Feigenbaum, presented total quality control concept in 1956 that includes product design, incoming quality approval, production control, product reliability, inventory, delivery, and customer service.
Company-wide quality control (CWQC), since 1970: formed in 1946, Union of Japanese Scientists and Engineers (JUSE) invited Deming to Japan in 1950, to share the quality concepts and statistical quality methods with the top management slots at industries of Japan. They also invited Juran in 1954, who talked about quality control, quality cost and management role in quality activities. These initiatives lead to the introduction of Total Quality Control (TQC) in Japan in 1960.
Total Quality Management (TQM), since 1985: hard hit by Japanese TQM results, and following Deming, Juran, Crosby, and Armand Feigenbaum, Western and especially American companies started implementing TQM practices and ISO system and Six-Sigma programs were launched by 1987.
Balanced Scorecard by Kaplan and Norton (1992): financial, customer, internal process, and learning& growth
Business Excellence Model, since 2000: the focus on speed, innovation, quality, and value to develop core competencies.
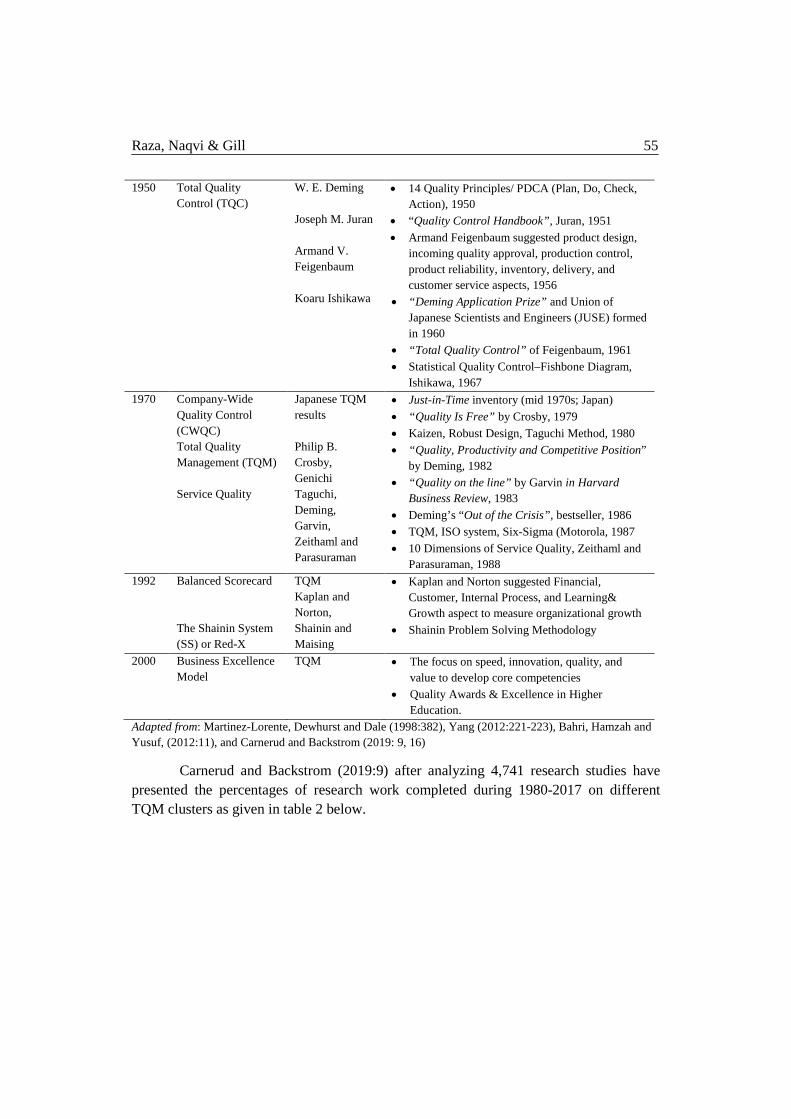
Drawing upon the work of Martinez-Lorente, Dewhurst and Dale (1998), Yang (2012), and Bahri, Hamzah and Yusuf, (2012), and Carnerud and Backstrom (2019) the researchers have developed a comprehensive view of the evolutionary changes in the quality enhancement initiatives as outlined in the table 1 below.
Table 1 The Evolution of Quality Control Initiatives Since Model Pioneers Features 1900 Inspection Quality
Control (IQC), Ellias Whitney F. W. Taylor Walter Shewhart
• Traditional product inspection, 1900 • Ford Company: assembly line, 1913 • Control chart product inspection
1930 Statistical Process Control (SPC)
Walter Shewhart • Bell Labs started sampling against 100% inspection
• US Army used sampling in WW-II
Raza, Naqvi & Gill 55
1950 Total Quality Control (TQC)
W. E. Deming Joseph M. Juran Armand V. Feigenbaum Koaru Ishikawa
• 14 Quality Principles/ PDCA (Plan, Do, Check, Action), 1950
• “Quality Control Handbook”, Juran, 1951 • Armand Feigenbaum suggested product design,
incoming quality approval, production control, product reliability, inventory, delivery, and customer service aspects, 1956
• “Deming Application Prize” and Union of Japanese Scientists and Engineers (JUSE) formed in 1960
• “Total Quality Control” of Feigenbaum, 1961 • Statistical Quality Control–Fishbone Diagram,
Ishikawa, 1967 1970
Company-Wide Quality Control (CWQC) Total Quality Management (TQM) Service Quality
Japanese TQM results Philip B. Crosby, Genichi Taguchi, Deming, Garvin, Zeithaml and Parasuraman
• Just-in-Time inventory (mid 1970s; Japan) • “Quality Is Free” by Crosby, 1979 • Kaizen, Robust Design, Taguchi Method, 1980 • “Quality, Productivity and Competitive Position”
by Deming, 1982 • “Quality on the line” by Garvin in Harvard
Business Review, 1983 • Deming’s “Out of the Crisis”, bestseller, 1986 • TQM, ISO system, Six-Sigma (Motorola, 1987 • 10 Dimensions of Service Quality, Zeithaml and
Parasuraman, 1988 1992 Balanced Scorecard
The Shainin System (SS) or Red-X
TQM Kaplan and Norton, Shainin and Maising
• Kaplan and Norton suggested Financial, Customer, Internal Process, and Learning& Growth aspect to measure organizational growth
• Shainin Problem Solving Methodology
2000 Business Excellence Model
TQM • The focus on speed, innovation, quality, and value to develop core competencies
• Quality Awards & Excellence in Higher Education.
Adapted from: Martinez-Lorente, Dewhurst and Dale (1998:382), Yang (2012:221-223), Bahri, Hamzah and Yusuf, (2012:11), and Carnerud and Backstrom (2019: 9, 16)
Carnerud and Backstrom (2019:9) after analyzing 4,741 research studies have presented the percentages of research work completed during 1980-2017 on different TQM clusters as given in table 2 below.

An Investigation of the Corporate TQM Practices 56
Table 2 %age of Research Conducted on TQM during 1980-2017
S# Clusters % age of Research 1 Reliability, costs, failure & problems 14 2 TQM implementation, performance & culture 12 3 Service quality & customer satisfaction 11 4 QM practice & performance 10 5 Misc. global, cultural differences, social, human, environmental
perspectives 9
6 Misc. quality in higher education, knowledge management, process improvement projects
8
7 Process design & control sampling 7 8 ISO certification & standards 6 9 Misc. Japan, JIT (just-in-time), barriers, financial
performance…food 6
10 BEMs (business excellence models), quality awards & excellence in higher education
5
11 Quality programs on employees, teams & customers 3 12 QFD (quality function development) 2 13 Six sigma/lean six sigma 1 14 Quality circles 1 15 Software & information system quality development 1 16 Quality in health care 1 17 Supply systems 1 18 Construction quality & quality construction/building projects 1 19 Operations management 1
Total 100 Adapted from: Carnerud and Backstrom (2019: 9)
Out of this mega analysis, the authors also have identified overall seven central topics around which research on quality has been centered during the last 37 years: Service Quality & Customer Satisfaction; Process design & Control; ISO Certification & Standards; TQM - Implementation, Performance & Culture; QM - Practices & Performance; and Reliability, Costs, Failure & Problems and Excellence-Business Excellence Models, Quality Awards & Excellence in Higher Education. According to the authors, this research has been rising constantly since 1980; however, it decreased during 2000-2012 (p. 16).
Raza, Naqvi & Gill 57
The Factors/Principles
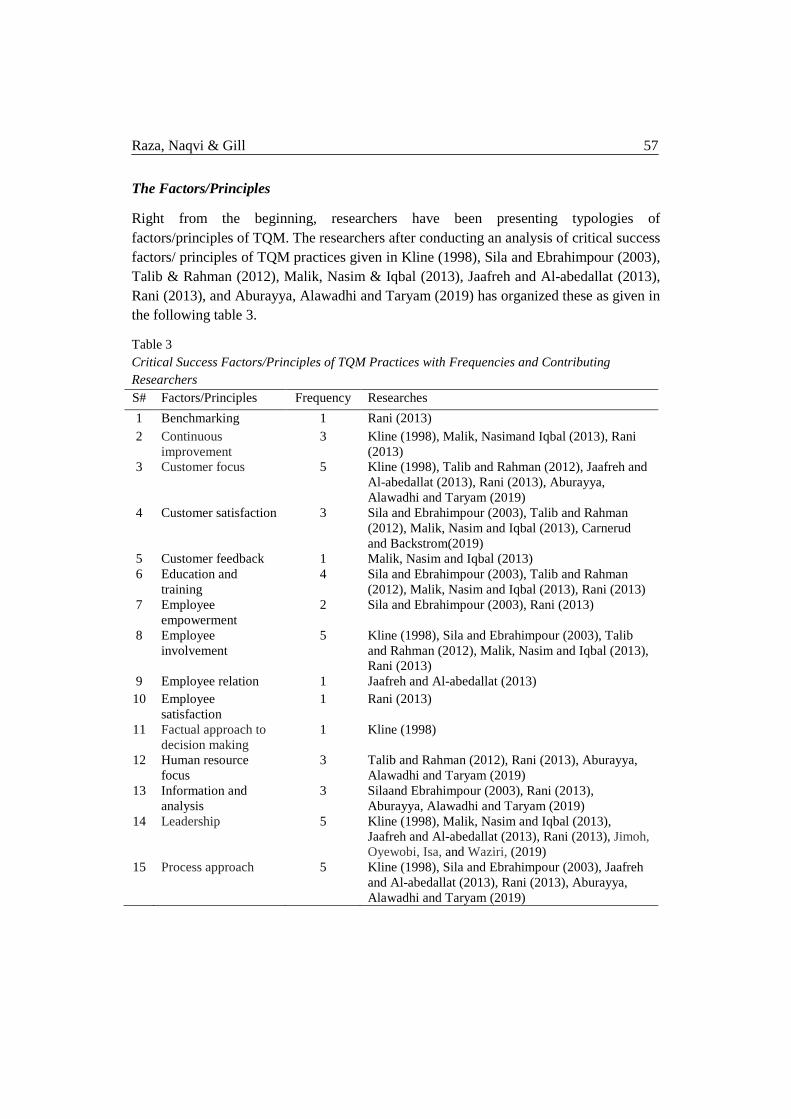
Right from the beginning, researchers have been presenting typologies of factors/principles of TQM. The researchers after conducting an analysis of critical success factors/ principles of TQM practices given in Kline (1998), Sila and Ebrahimpour (2003), Talib & Rahman (2012), Malik, Nasim & Iqbal (2013), Jaafreh and Al-abedallat (2013), Rani (2013), and Aburayya, Alawadhi and Taryam (2019) has organized these as given in the following table 3.
Table 3 Critical Success Factors/Principles of TQM Practices with Frequencies and Contributing Researchers S# Factors/Principles Frequency Researches 1 Benchmarking 1 Rani (2013) 2 Continuous
improvement 3 Kline (1998), Malik, Nasimand Iqbal (2013), Rani
(2013) 3 Customer focus
5 Kline (1998), Talib and Rahman (2012), Jaafreh and
Al-abedallat (2013), Rani (2013), Aburayya, Alawadhi and Taryam (2019)
4 Customer satisfaction 3 Sila and Ebrahimpour (2003), Talib and Rahman (2012), Malik, Nasim and Iqbal (2013), Carnerud and Backstrom(2019)
5 Customer feedback 1 Malik, Nasim and Iqbal (2013) 6 Education and
training 4 Sila and Ebrahimpour (2003), Talib and Rahman
(2012), Malik, Nasim and Iqbal (2013), Rani (2013) 7 Employee
empowerment 2 Sila and Ebrahimpour (2003), Rani (2013)
8 Employee involvement
5 Kline (1998), Sila and Ebrahimpour (2003), Talib and Rahman (2012), Malik, Nasim and Iqbal (2013), Rani (2013)
9 Employee relation 1 Jaafreh and Al-abedallat (2013) 10 Employee
satisfaction 1 Rani (2013)
11 Factual approach to decision making
1 Kline (1998)
12 Human resource focus
3 Talib and Rahman (2012), Rani (2013), Aburayya, Alawadhi and Taryam (2019)
13 Information and analysis
3 Silaand Ebrahimpour (2003), Rani (2013), Aburayya, Alawadhi and Taryam (2019)
14 Leadership 5 Kline (1998), Malik, Nasim and Iqbal (2013), Jaafreh and Al-abedallat (2013), Rani (2013), Jimoh, Oyewobi, Isa, and Waziri, (2019)
15 Process approach
5 Kline (1998), Sila and Ebrahimpour (2003), Jaafreh and Al-abedallat (2013), Rani (2013), Aburayya, Alawadhi and Taryam (2019)
An Investigation of the Corporate TQM Practices 58
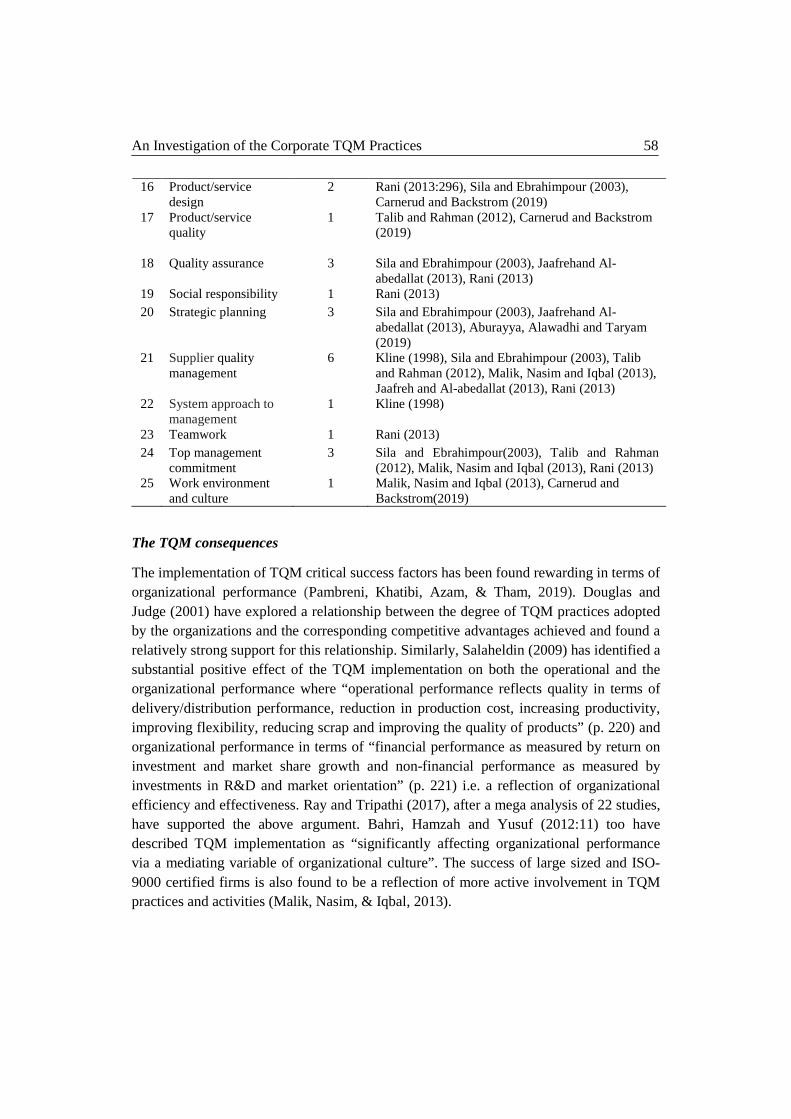
16 Product/service design
2 Rani (2013:296), Sila and Ebrahimpour (2003), Carnerud and Backstrom (2019)
17 Product/service quality
1 Talib and Rahman (2012), Carnerud and Backstrom (2019)
18 Quality assurance 3 Sila and Ebrahimpour (2003), Jaafrehand Al-abedallat (2013), Rani (2013)
19 Social responsibility 1 Rani (2013) 20 Strategic planning
3 Sila and Ebrahimpour (2003), Jaafrehand Al-
abedallat (2013), Aburayya, Alawadhi and Taryam (2019)
21 Supplier quality management
6 Kline (1998), Sila and Ebrahimpour (2003), Talib and Rahman (2012), Malik, Nasim and Iqbal (2013), Jaafreh and Al-abedallat (2013), Rani (2013)
22 System approach to management
1 Kline (1998)
23 Teamwork 1 Rani (2013) 24 Top management
commitment 3 Sila and Ebrahimpour(2003), Talib and Rahman
(2012), Malik, Nasim and Iqbal (2013), Rani (2013) 25 Work environment
and culture 1 Malik, Nasim and Iqbal (2013), Carnerud and
Backstrom(2019)
The TQM consequences
The implementation of TQM critical success factors has been found rewarding in terms of organizational performance (Pambreni, Khatibi, Azam, & Tham, 2019). Douglas and Judge (2001) have explored a relationship between the degree of TQM practices adopted by the organizations and the corresponding competitive advantages achieved and found a relatively strong support for this relationship. Similarly, Salaheldin (2009) has identified a substantial positive effect of the TQM implementation on both the operational and the organizational performance where “operational performance reflects quality in terms of delivery/distribution performance, reduction in production cost, increasing productivity, improving flexibility, reducing scrap and improving the quality of products” (p. 220) and organizational performance in terms of “financial performance as measured by return on investment and market share growth and non-financial performance as measured by investments in R&D and market orientation” (p. 221) i.e. a reflection of organizational efficiency and effectiveness. Ray and Tripathi (2017), after a mega analysis of 22 studies, have supported the above argument. Bahri, Hamzah and Yusuf (2012:11) too have described TQM implementation as “significantly affecting organizational performance via a mediating variable of organizational culture”. The success of large sized and ISO-9000 certified firms is also found to be a reflection of more active involvement in TQM practices and activities (Malik, Nasim, & Iqbal, 2013).
Raza, Naqvi & Gill 59
This significant and positive effect of TQM implementation on the performance has been witnessed everywhere: manufacturing sector (Talib & Rahman, 2012; Malik, Nasim & Iqbal, 2013), service sector (Talib & Rahman, 2012), banking sector (Jaafreh & Al-abedallat, 2013), health sector (Aburayya, Alawadhi & Taryam, 2019), construction industry (Al-Damen, 2017), hotel industry (Jusoh, & Ishak, 2018), oil and petroleum (Jimoh, Oyewobi, Isa, & Waziri, 2019) as well in India, Pakistan, Jordon, UAE, Nigeria, and Malaysia as a few precedents to quote.
After this analysis, a brief description of factors/principles selected for the purpose of this study is being given.
Leadership
Jaafreh and Al-abedallat (2013) have linked successful TQM operations with the quality of leadership available in the organization. The aspects and attributes that could be attached to leadership is a serious concern reflected in TQM literature. After a careful analysis, the following attributes of corporate leadership are included for the purpose of current study.
Supportive environment (Malik, Nasim, & Iqbal, 2013) of the organization is the first and foremost attribute of a visionary leadership. If the organization is ready to provide support to employees who dare to take initiatives for improvement upon the current state of affairs, they obviously would plan activities for this purpose. How the status quo could be broken, is a matter of serious concern and a direct information flow from customers (Malik, Nasim, & Iqbal, 2013; Rani, 2013) has no other substitute in knowing the flaws persisting in the current framework of operating activities. In order to know the direction to be followed for planning growth activities to avoid wastage of scarce resources, the leadership is supposed to make every employee know the mission (Aburayya, Alawadhi & Taryam, 2019) of the organization as the legitimate cause of organizational survival as it would help every employee know the objectives (Sila & Ebrahimpour, 2003) of the organization and design activities to realize these objectives in real sense of the term.
This productive environment in the organization would serve as a basis to improve quality ensuring the involvement of staff in TQM affairs (Kline, 1998; Talib & Rahman, 2012; Malik, Nasim, & Iqbal, 2013) for participative decision-making that leads to the employee motivation. For the purpose of further enhancing this motivation, the leaders are supposed to delegate powers to pave the way for distributive leadership and employees’ empowerment (Rani, 2013; Sila & Ebrahimpour, 2003) in the organization when and where needed. This situation certainly demands strong and open internal communication links (Jimoh, Oyewobi, Isa, & Waziri, 2019; Sila & Ebrahimpour, 2003)

An Investigation of the Corporate TQM Practices 60
for the free and smooth flow of information. At the end, the leadership needs to have a good sense of social responsibilities (Rani, 2013) for contributing towards the society; the source and ultimate market of business endeavors.
Resource management
Resources management includes both human and material resources. In any organization, the human capital plays a pivotal role as the organization cannot grow beyond the potential of its people who are running it. The very first arrangement in this regard is to functionalize an effective hiring system (Jimoh, Oyewobi, Isa, & Waziri, 2019) to provide the right person for the right job ensuring a person-organization-fit avoiding which would cause a heavy cost to the organization and sometimes a complete disaster. After hiring the desirable people, organizations must organize hands-on employees’ training (Talib & Rahman, 2012; Malik, Nasim & Iqbal, 2013) to help them adjust in the indigenous environment and struggle for achieving the operative goals. As stated above, facilities for employees (Rani, 2013) would help boost their motivation and morale for functional proficiencies. Obviously, funds are needed for improvement of organizational resources (Sila & Ebrahimpour, 2003) for operational efficiency and to achieve all such things, an effective resource management (Jaafreh & Al-abedallat, 2013) is required.
Performance measurement and feedback
Performance measurement and feedback is an important TQM critical success factor. The organizations have to make arrangements for measuring customer satisfaction (Sila & Ebrahimpour, 2003; Talib & Rahman, 2012; Malik, Nasim & Iqbal, 2013) through objective measurement techniques as customers are the direct users of their products and services and their opinion about the quality has always been matchless. Another important step to be taken internally is to measure employees’ satisfaction (Rani, 2013) for letting the organization run smoothly. Similarly, analysis of TQM information (Sila & Ebrahimpour, 2003; Rani, 2013; Jimoh, Oyewobi, Isa, & Waziri, 2019) obtained from different stake holders needs to be conducted for sharing quality measurement findings (Malik, Nasim & Iqbal, 2013) with the concerned quarters to take remedial measures to improve quality (Kline, 1998; Sila & Ebrahimpour, 2003; Talib & Rahman, 2012; Jaafreh & Al-abedallat, 2013; Carnerud and Backstram, 2019) quite well on time.
Continuous improvement
Operational efficiency in any organization is always dependent on continuous improvement of all constituent activities and updating quality standards (Sila & Ebrahimpour, 2003; Jaafreh & Al-abedallat, 2013; Rani, 2013) is the first step to be taken through a central quality improvement coordination (Jaafreh & Al-abedallat, 2013) set up in the organization for activating quality improvement teams (Rani, 2013) to improve the
Raza, Naqvi & Gill 61
organizational products and services (Talib & Rahman, 2012). These targets could be achieved by improving organizational processes (Kline, 1998; Jaafreh & Al-abedallat, 2013; Rani, 2013) through adapting organizational structure (Jaafreh & Al-abedallat, 2013; Jimoh, Oyewobi, Isa, & Waziri, 2019) matching the environment turbulent conditions and by achieving operational efficiency (Kline, 1998; Sila & Ebrahimpour, 2003) to reduce the operational costs.
Supplier quality management
Supply of raw materials is taken as a key factor in all organizations regardless the nature of operations. Even in Pakistan, some of the largest companies have established their own supply chains e.g. Mitchell’s Fruit Farms. Organizations should select only those suppliers objectively who meet quality specifications conducting suppliers’ quality audits to ensure uninterrupted supplies and manage early payments system for availing discounts (Kline, 1998; Sila & Ebrahimpour, 2003; Talib & Rahman, 2012; Malik, Nasim & Iqbal, 2013; Jaafreh & Al-abedallat, 2013; Rani, 2013).
Education and training
Education and training is directly linked with continuous development for quality assurance. This factor includes learning environment (Sila & Ebrahimpour, 2003) for the growth of employees to ensure their continuous professional development (Talib & Rahman, 2012; Malik, Nasim & Iqbal, 2013). Proper training and development center(s) (Jaafreh & Al-abedallat, 2013) may be established in the organizations and financial and non-financial benefits could be offered for professional development (Jimoh, Oyewobi, Isa, & Waziri, 2019) could be offered to those employees who participate in professional development activities for promotion (Rani (2013).
Work environment and culture
As discussed above, all efforts for quality enhancement may become unsuccessful without a conducive and pleasant work environment (Malik, Nasim & Iqbal, 2013)and a strong supportive culture with positive values (Rani, 2013; Carnerud & Backstrom, 2019) to help encourage teamwork (Rani, 2013) where employees share their problems (Sila & Ebrahimpour, 2003). In order to support the above ideas, employees’ welfare schemes (Talib & Rahman, 2012; Rani, 2013; Jimoh, Oyewobi, Isa, & Waziri, 2019) may be launched as it would reflect organizational intention to own the employees (Jaafreh & Al-abedallat, 2013) and it may include timely promotions of employees (Talib & Rahman, 2012) building employees’ trust on their performance evaluation (Jaafreh & Al-abedallat, 2013), and providing opportunities for participative decision-making (Kline (1998; Sila & Ebrahimpour, 2003; Talib & Rahman, 2012; Malik, Nasim & Iqbal, 2013; Rani, 2013).

An Investigation of the Corporate TQM Practices 62
Customer satisfaction
The root cause of all initiatives for TQM is the customer satisfaction. The indicators of this most important factor includes establishing customer care center(s) for assessing customers’ needs through collecting complaints of customers (Malik, Nasim & Iqbal, 2013) and keeping track of complaints of customers for ensuring minimum possible response time, and stopping recurring customer complaints (Kline, 1998; Sila & Ebrahimpour, 2003; Talib & Rahman, 2012; Jaafreh & Al-abedallat, 2013; Malik, Nasim & Iqbal, 2013; Rani, 2013; Jimoh, Oyewobi, Isa, & Waziri, 2019; Carnerud & Backstrom, 2019).
The corresponding TQM results
At the end, the corresponding TQM results (i.e. as the final component of the questionnaire) are described to complete the theoretical framework of the study. These results are to be measured in terms of increased customer satisfaction that leads to improvement (Kline, 1998; Malik, Nasim & Iqbal, 2013; Rani, 2013). This satisfaction could be raised only through decreased customer complaints (Malik, Nasim & Iqbal (2013) as a result of improvement in the company performance---financial and nonfinancial (Salaheldin, 2009; Bahri, Hamzah & Yusuf, 2012; Jimoh, Oyewobi, Isa, & Waziri, 2019) and increased employee satisfaction (Rani (2013) that leads to decreased employee turnover (Sila & Ebrahimpour (2003) and ultimately result in the growth of company (Pambreni, Khatibi, Azam, & Tham, 2019).
To summarize all of the above view points, the following framework emerges for this study establishing a relationship between proven TQM practices and desired corresponding TQM results.
TQM Practices (Independent Variable)
Corresponding TQM Results (Dependent Variable)
Leadership Resource management Improvement in
Customer satisfaction Company performance Employee satisfaction
Company growth
Continuous improvement Supplier quality management
Education and training Work environment and culture
Customer satisfaction Performance measurement and feedback
Figure 1. Framework of the study
Raza, Naqvi & Gill 63
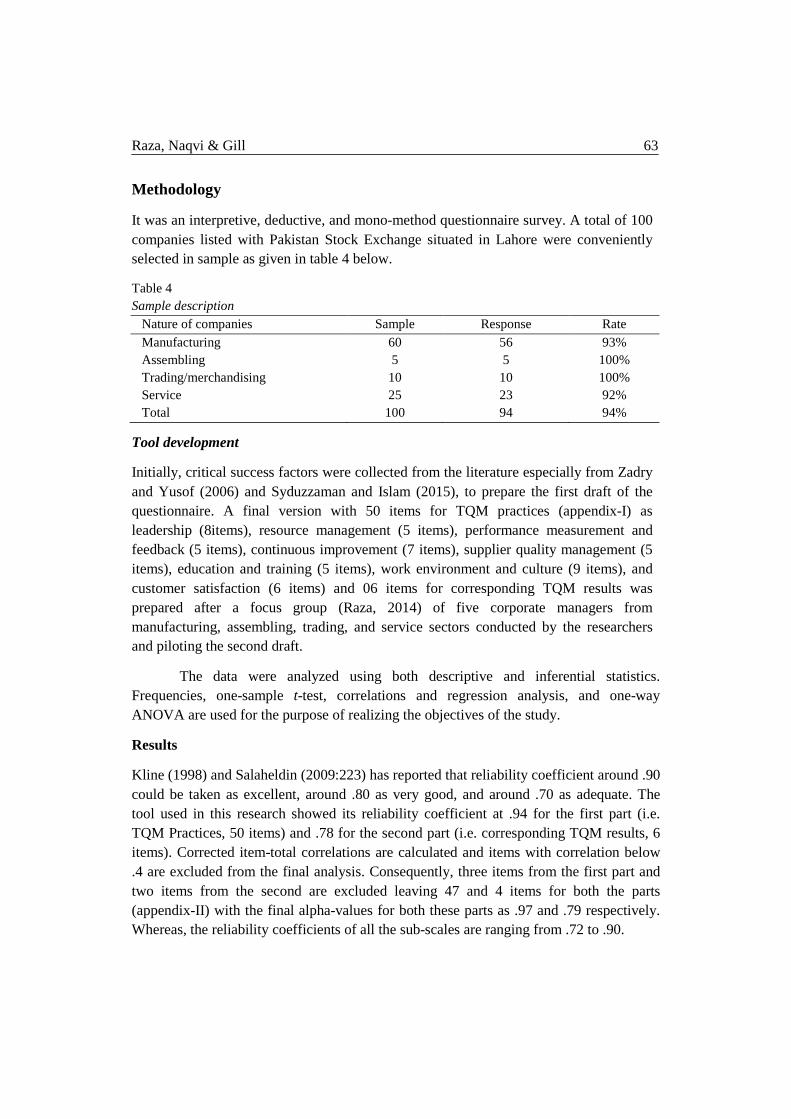
Methodology
It was an interpretive, deductive, and mono-method questionnaire survey. A total of 100 companies listed with Pakistan Stock Exchange situated in Lahore were conveniently selected in sample as given in table 4 below.
Table 4 Sample description
Nature of companies Sample Response Rate Manufacturing 60 56 93% Assembling 5 5 100% Trading/merchandising 10 10 100% Service 25 23 92% Total 100 94 94%
Tool development
Initially, critical success factors were collected from the literature especially from Zadry and Yusof (2006) and Syduzzaman and Islam (2015), to prepare the first draft of the questionnaire. A final version with 50 items for TQM practices (appendix-I) as leadership (8items), resource management (5 items), performance measurement and feedback (5 items), continuous improvement (7 items), supplier quality management (5 items), education and training (5 items), work environment and culture (9 items), and customer satisfaction (6 items) and 06 items for corresponding TQM results was prepared after a focus group (Raza, 2014) of five corporate managers from manufacturing, assembling, trading, and service sectors conducted by the researchers and piloting the second draft.
The data were analyzed using both descriptive and inferential statistics. Frequencies, one-sample t-test, correlations and regression analysis, and one-way ANOVA are used for the purpose of realizing the objectives of the study.
Results
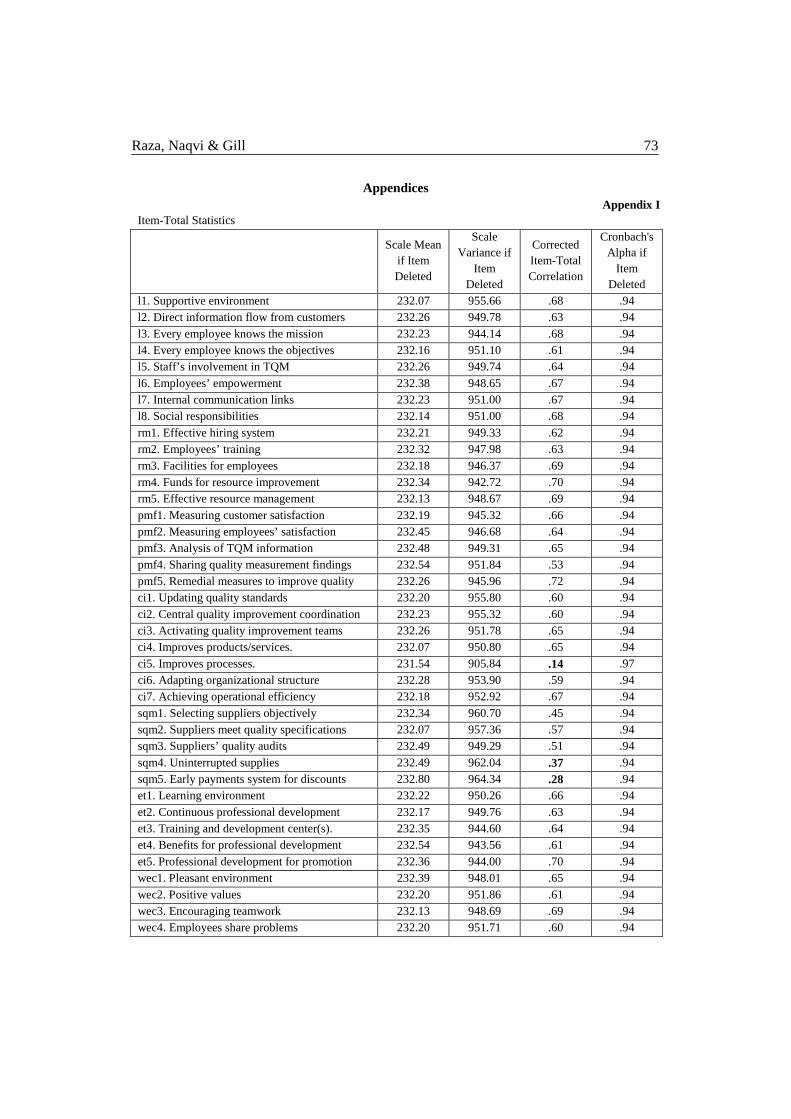
Kline (1998) and Salaheldin (2009:223) has reported that reliability coefficient around .90 could be taken as excellent, around .80 as very good, and around .70 as adequate. The tool used in this research showed its reliability coefficient at .94 for the first part (i.e. TQM Practices, 50 items) and .78 for the second part (i.e. corresponding TQM results, 6 items). Corrected item-total correlations are calculated and items with correlation below .4 are excluded from the final analysis. Consequently, three items from the first part and two items from the second are excluded leaving 47 and 4 items for both the parts (appendix-II) with the final alpha-values for both these parts as .97 and .79 respectively. Whereas, the reliability coefficients of all the sub-scales are ranging from .72 to .90.
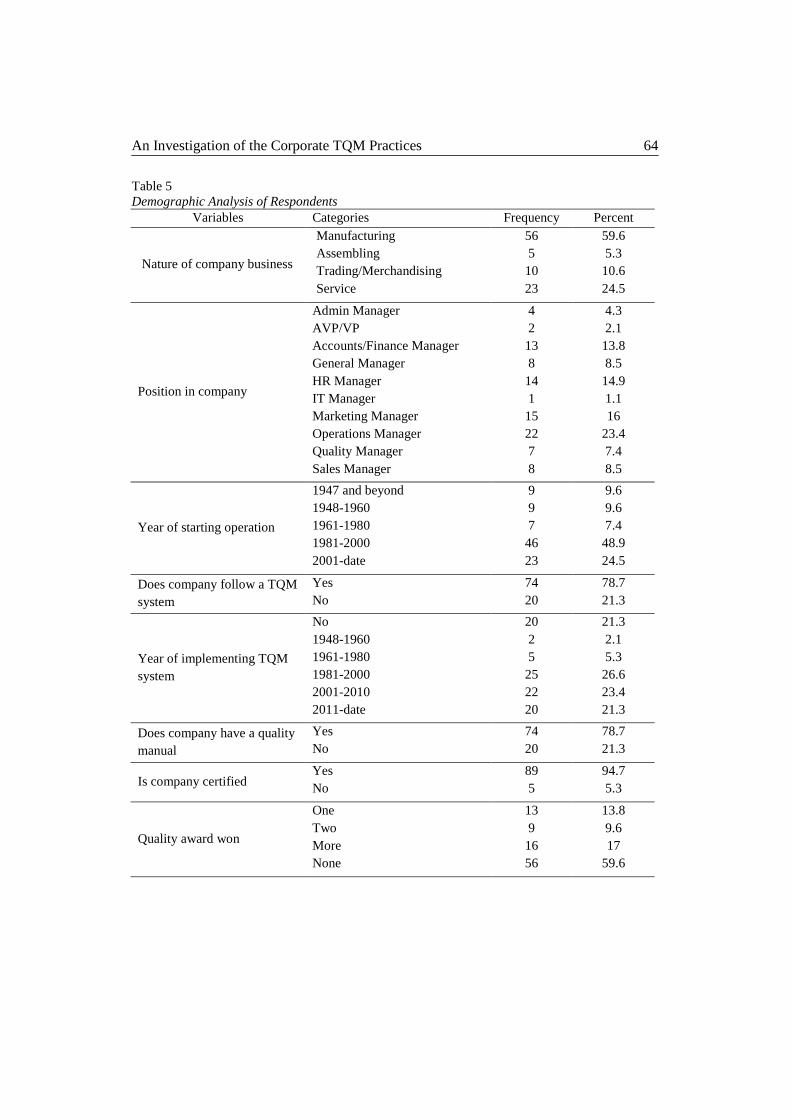
An Investigation of the Corporate TQM Practices 64
Table 5 Demographic Analysis of Respondents
Variables Categories Frequency Percent
Nature of company business
Manufacturing 56 59.6 Assembling 5 5.3 Trading/Merchandising 10 10.6 Service 23 24.5
Position in company
Admin Manager 4 4.3 AVP/VP 2 2.1 Accounts/Finance Manager 13 13.8 General Manager 8 8.5 HR Manager 14 14.9 IT Manager 1 1.1 Marketing Manager 15 16 Operations Manager 22 23.4 Quality Manager 7 7.4 Sales Manager 8 8.5
Year of starting operation
1947 and beyond 9 9.6 1948-1960 9 9.6 1961-1980 7 7.4 1981-2000 46 48.9 2001-date 23 24.5 Does company follow a TQM
system Yes 74 78.7 No 20 21.3
Year of implementing TQM system
No 20 21.3 1948-1960 2 2.1 1961-1980 5 5.3 1981-2000 25 26.6 2001-2010 22 23.4 2011-date 20 21.3 Does company have a quality
manual Yes 74 78.7 No 20 21.3
Is company certified Yes 89 94.7 No 5 5.3
Quality award won
One 13 13.8 Two 9 9.6 More 16 17 None 56 59.6

Raza, Naqvi & Gill 65
Table 5 shows that majority of respondents (60%) are from manufacturing sector, most of them (23%) are operations managers, majority of the responding companies (49%) were established during 1981-2000 and most of them (27%) started TQM practices during the same period, majority of companies (79%) are implementing TQM with quality manual, a great majority (95%) are certified companies, and 17% have won more than two quality awards.
Table 6 One-Sample Statistics Factors Items Alpha M SD df t-value Customer satisfaction 6 .87 4.30 0.74 93 17.04* Continuous improvement 6 .84 4.29 0.59 93 21.16* Leadership 8 .89 4.27 0.62 93 19.87* Resources management 5 .86 4.25 0.72 93 16.98* Supplier quality management 3 .78 4.19 0.69 93 16.81* Education and training 5 .90 4.16 0.79 93 14.32* Work environment and culture 9 .89 4.16 0.64 93 17.51* Performance measurement and feedback 5 .88 4.11 0.76 93 14.21* TQM practices (total scale) 47 .97 4.23 0.56 93 21.43* TQM results 4 .79 4.35 0.57 93 22.92*
*<0.005
Table 6 indicates that all components of the scale have acceptable level of alpha-values (0.72-0.97). The mean scores analysis places ‘customer satisfaction’ (4.30) at the highest and ‘performance measurement and feedback’ (4.11) at the lowest. The overall mean for TQM practices is 4.23 and that of corresponding TQM result is 4.35.
Table 7 Correlations between TQM Practices, Sub-Scales and TQM Results
Factors 2 3 4 5 6 7 8 TQM Practices
Leadership .81** .78** .57** .78** .74** .74** .73** .91** Resource management
.74** .59** .67** .69** .61** .70** .87**
Continuous improvement
.69** .59** .71** .61** .66** .86** Supplier quality management
.56** .61** .39** .42** .71**
Education and training
.69** .61** .53** .81** Work environment and culture
.72** .67** .87**
Customer satisfaction
.67** .81** Performance measurement and feedback
.81**
TQM results (corresponding) .76** **. Correlation is significant at the 0.01 level (2-tailed).

An Investigation of the Corporate TQM Practices 66
Table 7 shows weak relationships within sub-scales against their relationship with the total TQM scale and a 0.76 correlation between TQM practices and the corresponding TQM results.
Table 8 Regression analysis
Model Summary
Model R R Square Adjusted R Square Std. Error of the Estimate
1 .757a 0.573 0.568 0.37402
a. Predictors: (Constant), TQM practices ANOVA(b)
Model
Sum of Squares Df Mean Square F Sig.
1 Regression 17.269 1 17.269 123.446 .000a
Residual 12.87 92 0.14
Total 30.138 93 a. Predictors: (Constant), TQM practices
b. Dependent Variable: TQM results Coefficients (a)
Un-standardized Coefficients Standardized Coefficients
Model B Std. Error Beta T Sig. 1 (Constant) 1.072 0.297 3.608 0.001
TQM results 0.774 0.07 0.757 11.111 0 a. Dependent Variable: TQM results
Table 8 also shows a 76% prediction of TQM practices as independent variable to correspond TQM results as dependent variable.
The variance analysis finds no significant difference of opinion over the TQM practices and corresponding TQM results in terms of back ground variables of the corporate managers.
Discussion
The study was designed to pursue three basic objectives i.e. explore TQM practices of Pakistani corporate sector, explore their corresponding TQM results, and investigate the relationship of these TQM practices and corresponding TQM results with implications for the business schools offering TQM courses, on the bases of results of the study to be viewed in the perspective of respondents’ profile.

Raza, Naqvi & Gill 67
The responding companies cover a broader range of corporate sector representing manufacturing, assembling, trading, and service businesses with the manufacturing segment in the majority (60%) and most of them (23%) are represented by operations managers. The analysis of the correspondents’ profile reflects an encouraging situation as 73% (69) of the total 94 responding companies are established during the last 40 years i.e. 1981-2020. Interestingly, the same period has been noted as the boom period in respect of establishing the practice of implementing TQM initiatives at the one hand and conducting researches on such practices of corporate world (Carnerud & Backstrom, 2019) at the other. Similarly, there is another encouraging trend that 71% (67) of the Pakistani companies have started implementation of TQM practices during the same period in one way or the other. Another very favorable trend is also evident from the profile analysis as 79% (74) of the Pakistani companies are following TQM practices with TQM manuals to make their quality initiatives standardized leading towards better performance both in financial and non-financial terms. The most important aspect of this analysis is that 95% (89) of the responding companies are certified in terms of TQM practices and that is why the 17% (16) of these companies have won more than two quality awards. These tendencies may be the result of seriousness of Pakistani companies towards adoption of proven TQM practices without which better corporate performance is not possible. These findings are in line with the work of Talib and Rahman (2012), Malik, Nasim and Iqbal (2013), Carnerud and Backstrom (2019).
The reliability and mean score analysis also reflects a favorable situation as alpha values of sub-scales and total scale determine the worth of the questionnaire that serves as the basis of all conclusions to be made through these data (Raza, 2014). The mean scores of sub-scales, overall TQM practices and corresponding TQM results all are ranging between 4.11-4.35 indicating a high to very high level of TQM practices and corresponding TQM results (Talib & Rahman, 2012; Aburayya, Jaafreh & Al-abedallat, 2013; Malik, Nasim & Iqbal, 2013; Carnerud & Backstrom, 2019; Aburayya, Alawadhi & Taryam, 2019). Though the situation is quite encouraging, but these mean scores are below 05, the highest level of implementation of TQM practices and TQM results establishing the need for further improvement through investing more and more for continuous development (Kline, 1998; Rani, 2013).
In sub-scales, ‘customer satisfaction’ being the top priority of corporations, reflects its importance in the success of businesses through increased sales of goods and services which is usually not possible without satisfying the customers (Aburayya, Alawadhi & Taryam, 2019; Carnerud and Backstrom, 2019). The lowest ranking of ‘performance measurement and feedback’, though with a mean score 4.11, reflects a situation where Pakistani corporate businesses need enhanced focus to measure their performance in the light of feedback of stakeholders especially the customers (Malik,

An Investigation of the Corporate TQM Practices 68
Nasim & Iqbal, 2013). In this way, they would be in a position to move from the current 80% performance level to the desired 100% (Rani, 2013) for raising the level of goal achievement.
The correlation analysis also reflects a favorable situation as it establishes the convergent and discriminant validity of the questionnaire (Raza, 2014) that strengthens the worth of results. It also establishes a strong relationship (0.76) between TQM practices and their corresponding TQM results (Malik, Nasim & Iqbal, 2013; Carnerud and Backstrom, 2019; Aburayya, Alawadhi & Taryam, 2019).
The regression analysis too supports the predicting TQM practices as independent variable to correspond TQM results as dependent variable at 76% level.
The variance analysis finds no significant difference of opinion over the TQM practices and corresponding TQM results in terms of back ground variables of the corporate managers.
At the end, an impact of these findings on the education and training of corporate managers is noteworthy as the current achievement level of results revolves around 80%. How these managers may improve their TQM practices needs to be established to achieve 100% corresponding results. Apparently, both the corporate sector, as well as the business schools offering TQM courses, need to respond the consequences of these findings.
Hence, all the tree objectives of this study i.e. explore TQM practices of Pakistani corporate sector, explore their corresponding TQM results, and investigate the relationship of these TQM practices and corresponding TQM results with implications of such practices on business education, are achieved in the light of above discussion.
Conclusions
On the bases of the results and discussion, it is concluded that the responding companies represent manufacturing, assembling, trading, and service businesses with the manufacturing segment showing majority in the sample. Out of the total 94 responding companies, 73% (69) are established during the last 40 years i.e. from 1981 to 2020, the boom period for the establishing companies and conducting TQM research. Similarly, 71% (67) of the responding companies started implementation of TQM practices during the same period, 79% (74) of these companies are following TQM practices with manuals, 95% (89) of these companies are TQM certified, and 17% (16) of these companies have won more than two quality awards.

Raza, Naqvi & Gill 69
The overall TQM practices and TQM results are found to be ranging between a high to very high level. In sub-scales, ‘customer satisfaction’ is taken as the top and ‘performance measurement and feedback’ as the lowest priority of sampling corporations.
There is a strong relationship between TQM practices and their corresponding TQM results and no significant difference of opinion is found among the respondents over the TQM practices and corresponding TQM results.
The study reflects a remedial impact on the current TQM initiatives being taken by the corporate sector and business schools.
Recommendations
In the light of findings and conclusions, the corporate sector of Pakistan is recommended to raise the level of their interest and investment towards implementing the TQM practices as only 79% sample companies are taking such standardize initiatives with quality manuals whereas 21% of these companies are not following TQM practices at all. This measure is further recommended to be taken seriously as 60% of the companies following TQM practices have not won any quality award owing to under application TQM standards. This recommendation is still further strengthened with the fact that the sample companies operating at 80% level of application of TQM practices and achieved corresponding TQM results. Both the corporate sector and business schools are recommended to develop a nexus for capacity building of the corporate managers at the one hand and enrich the TQM courses being offered at business schools at the other.
References
Aburayya, A., Alawadhi, D & Taryam, M. (March 2019). A conceptual framework for implementing TQM in the primary healthcare centers and examining its impact on patient satisfaction. International Journal of Advanced Research, 7(3), 1047-1065.
Al-Damen, R. A. (2017). The impact of total quality management on organizational performance: Case of Jordon Oil Petroleum Company. International Journal of Business and Social Science, 8(1), 192-202.
Bahri, S., Hamzah, D. & Yusuf, R. M. (Sep-Oct. 2012). Implementation of total quality management and its effect on organizational performance of manufacturing industries through organizational culture in South Sulawesi, Indonesia. IOSR Journal of Business and Management (IOSR-JBM), 5(1), 10-24.

An Investigation of the Corporate TQM Practices 70
Bou-Llusar, J. C., Escring-Tena, A. B., Roca-Punig, V., & Beltran-Martin, I. (2009). An empirical assessment of the EFQM Excellence Model: Evaluation as a TQM framework relative to the MBNQA Model. Journal of Operations Management, 27(1), 1-22. doi:10.1016/j.jom.2008.04.001
Carnerud, D & Backstrom, I. (2019). Four decades of research on quality: summarising, trendspotting and looking ahead. Total Quality Management & Business, Excellence, 1-23. doi:10.1080/14783363.2019.1655397.
Dahlgaard, J. J., Reyes, L., Chen, C-K. & Dahlgaard-Park, S. M. (2019). Evolution and future of total quality management: management control and organisational learning. Total Quality Management & Business Excellence, 30(sup1), S1-S16., doi:10.1080/14783363.2019.1665776
Douglas, T. J. & Judge, W. Q. (2001). Total quality management implementation and competitive advantage: The role of structural control and exploration. Academy of Management Journal, 44(1), 158-169.
Eriksson, H. & Garvare, R. (2005). Organisational performance improvement through quality award process participation. International Journal of Quality & Reliability Management, 22(9), 894–912.
Fissher, O. & Nijhof, A. (2005). Implications of business ethics for quality management. The TQM Magazine 17(2), 150–160.
Jaafreh, A. B. & Al-abedallat, A. Z. (2013). The effect of quality management practices on organizational performance in Jordan: An Empirical Study. International Journal of Financial Research, 4(1), 93-109.
Jimoh, R., Oyewobi, L., Isa, R., & Waziri, I. (2019). Total quality management practices and organizational performance: the mediating roles of strategies for continuous improvement. International Journal of Construction Management, 19(2), 162-177, doi:10.1080/15623599.2017.1411456
Jusoh, M.S. & Ishak, N. A. (2018). The impact of total quality management (TQM) on competitive advantage: A conceptual mixed method study in the Malaysia Luxury Hotel Industries. Academy of Strategic Management Journal, 17(2), 1-9.
Kaynak, H. (2003). The relationship between total quality management practices and their effects on firm performance. Journal of Operations Management, 21, 405-435.
Kline, R. (1998). Principles and practice of structural equation modeling, Guilford Press, NewYork, NY.

Raza, Naqvi & Gill 71
Lewis, W. G., Pun, K. F., & Lalla, T. R. M. (2006). Empirical investigation of the hard and soft criteria of TQM in ISO 9001 certified small and medium sized enterprises. International Journal of Quality & Reliability Management, 23(8), 964-985.
Malik, S. A., Nasim, K., & Iqbal, M. Z. (2013). TQM practices in electric fan manufacturing industry of Pakistan. Int. J. Productivity and Quality Management, 12(4), 361-378.
Martinez-Lorente, A. R., Dewhurst, F. & Dale, B. G. (1998). Total quality management: origins and evolution of the term. The TQM Magazine, 10(5), 378-386.
Pambreni, Y., Khatibi, A., Azam, S. M. F., & Tham, J. (2019). The influence of total quality management toward organization performance, Management science letters, 9, 1397-1406. doi:10.5267/j.msl.2019.5.011
Rani, P. R. (2013). Critical Success Factors of TQM: A Study. International Journal of Management, 4(1), 266-275.
Ray, S. S. & Tripathi, S. (Aug 2017). A review on the classification of total quality management. International Journal of Business Management & Research, 7(4), 9-28.
Raza, S. A. (2014). Measuring the attributes of university teachers as perceived by students: scale development and validation. TIJ’s Research Journal of Social Science & Management-RJSSM, 4(4), 74-82.
Salaheldin, S. I. (2009). Critical success factors for TQM implementation and their impact on performance of SMEs. International Journal of Productivity and Performance Management, 58(3), 215-237.
Sila, I., & Ebrahimpour, M. (2003). Examination and comparison of the critical factors of total quality management (TQM) across countries, International Journal of Production Research, 41(2), 235-268.
Syduzzaman, M., & Islam, M. M. (2015). Questionnaire on TQM implementation, https://www.academia.edu/33789466/Questionnaire_on_TQM_ Implementation_ Please _highlight_your_opinion_below
Talib, F., & Rahman, Z. (2012). Total quality management practices in manufacturing and service industries: a comparative study. Int. J. Advanced Operations Management, 4(3), 155-175.

An Investigation of the Corporate TQM Practices 72
Yang, C. C. (2012). The Integration of TQM and Six-Sigma. Total Quality Management and Six Sigma. Intech Open. 219-246. doi:10.5772/48731. Retrieved from: https://www.intechopen.com/books/total-quality-management-and-six-sigma/the-integration-of-tqm-and-six-sigma
Zadry, H. R., & Yusof, S. M. (2006). Total quality management and theory of constraints implementation in Malaysian automotive suppliers: A Survey Result, Total Quality Management & Business Excellence, 17(8), 999-1020. doi:10.1080/ 14783360600747911
Raza, Naqvi & Gill 73
Appendices Appendix I
Item-Total Statistics
Scale Mean if Item Deleted
Scale Variance if
Item Deleted
Corrected Item-Total Correlation
Cronbach's Alpha if
Item Deleted
l1. Supportive environment 232.07 955.66 .68 .94 l2. Direct information flow from customers 232.26 949.78 .63 .94 l3. Every employee knows the mission 232.23 944.14 .68 .94 l4. Every employee knows the objectives 232.16 951.10 .61 .94 l5. Staff’s involvement in TQM 232.26 949.74 .64 .94 l6. Employees’ empowerment 232.38 948.65 .67 .94 l7. Internal communication links 232.23 951.00 .67 .94 l8. Social responsibilities 232.14 951.00 .68 .94 rm1. Effective hiring system 232.21 949.33 .62 .94 rm2. Employees’ training 232.32 947.98 .63 .94 rm3. Facilities for employees 232.18 946.37 .69 .94 rm4. Funds for resource improvement 232.34 942.72 .70 .94 rm5. Effective resource management 232.13 948.67 .69 .94 pmf1. Measuring customer satisfaction 232.19 945.32 .66 .94 pmf2. Measuring employees’ satisfaction 232.45 946.68 .64 .94 pmf3. Analysis of TQM information 232.48 949.31 .65 .94 pmf4. Sharing quality measurement findings 232.54 951.84 .53 .94 pmf5. Remedial measures to improve quality 232.26 945.96 .72 .94 ci1. Updating quality standards 232.20 955.80 .60 .94 ci2. Central quality improvement coordination 232.23 955.32 .60 .94 ci3. Activating quality improvement teams 232.26 951.78 .65 .94 ci4. Improves products/services. 232.07 950.80 .65 .94 ci5. Improves processes. 231.54 905.84 .14 .97 ci6. Adapting organizational structure 232.28 953.90 .59 .94 ci7. Achieving operational efficiency 232.18 952.92 .67 .94 sqm1. Selecting suppliers objectively 232.34 960.70 .45 .94 sqm2. Suppliers meet quality specifications 232.07 957.36 .57 .94 sqm3. Suppliers’ quality audits 232.49 949.29 .51 .94 sqm4. Uninterrupted supplies 232.49 962.04 .37 .94 sqm5. Early payments system for discounts 232.80 964.34 .28 .94 et1. Learning environment 232.22 950.26 .66 .94 et2. Continuous professional development 232.17 949.76 .63 .94 et3. Training and development center(s). 232.35 944.60 .64 .94 et4. Benefits for professional development 232.54 943.56 .61 .94 et5. Professional development for promotion 232.36 944.00 .70 .94 wec1. Pleasant environment 232.39 948.01 .65 .94 wec2. Positive values 232.20 951.86 .61 .94 wec3. Encouraging teamwork 232.13 948.69 .69 .94 wec4. Employees share problems 232.20 951.71 .60 .94

An Investigation of the Corporate TQM Practices 74
wec5. Employees’ welfare schemes 232.56 942.01 .63 .94 wec6. Owning the employees 232.24 957.35 .54 .94 wec7. Timely promotions of employees 232.52 950.49 .56 .94 wec8. Employees trust performance evaluation 232.32 945.04 .69 .94 wec9. Participative decision-making 232.35 953.20 .58 .94 cs1. Customer care center(s) 232.50 941.84 .51 .94 cs2. Assessing customers’ needs 232.13 948.26 .70 .94 cs3. Collecting complaints of customers 232.03 958.40 .51 .94 cs4. Keeping track of complaints of customers 232.26 950.84 .58 .94 cs5. Minimum possible response time 232.11 948.23 .72 .94 cs6. Stopping recurring customer complaints 232.12 946.41 .67 .94 r1. Customer satisfaction leads to improvement 232.14 961.95 .55 .94 r2. Decreased customer complaints 232.35 965.09 .36 .94 r3. Improvement in company performance 232.10 957.68 .61 .94 r4. Increased employee satisfaction 232.24 955.41 .59 .94 r5. Decreased employee turnover 232.49 963.11 .34 .94 r6. Growth of company 232.10 959.68 .50 .94

Raza, Naqvi & Gill 75
Appendix II Item-Total Statistics Scale
Mean if Item
Deleted
Scale Variance if Item Deleted
Corrected Item-Total Correlation
Cronbach's Alpha if
Item Deleted
Subscale Alpha
No of Items
Leadership
l1. Supportive environment
232.07 955.66 .68 .94 .885 8
l2. Direct information flow from customers
232.26 949.78 .63 .94
l3. Every employee the mission
232.23 944.14 .68 .94
l4. Every employee the objectives
232.16 951.10 .61 .94
l5. Staff’s involvement in TQM
232.26 949.74 .64 .94
l6. Employees’ empowerment
232.38 948.65 .67 .94
l7. Internal communication links
232.23 951.00 .67 .94
l8. Social responsibilities
232.14 951.00 .68 .94
Resource m
anagement
rm1. Effective hiring system
232.21 949.33 .62 .94 .860 5
rm2. Employees’ training
232.32 947.98 .63 .94
rm3. Facilities for employees
232.18 946.37 .69 .94
rm4. Funds for resource improvement
232.34 942.72 .70 .94
rm5. Effective resource management
232.13 948.67 .69 .94
performance m
easurement and
feedback
pmf1. Measuring customer satisfaction
232.19 945.32 .66 .94 .884 5
pmf2. Measuring employees’ satisfaction
232.45 946.68 .64 .94
pmf3. Analysis of TQM information
232.48 949.31 .65 .94
pmf4. Sharing quality measurement findings
232.54 951.84 .53 .94
pmf5. Remedial measures to improve quality
232.26 945.96 .72 .94

An Investigation of the Corporate TQM Practices 76
Continuous im
provement
ci1. Updating quality standards
232.20 955.80 .60 .94 .844 6
ci2. Central quality improvement coordination
232.23 955.32 .60 .94
ci3. Activating quality improvement teams
232.26 951.78 .65 .94
ci4. Improving products/services.
232.07 950.80 .65 .94
ci6. Adapting organizational structure
231.54 905.84 .14 .97
ci7. Achieving operational efficiency
232.28 953.90 .59 .94
Supplier quality m
anagement
sqm1. Selects suppliers objectively.
232.34 960.70 .45 .94 .717 3
sqm2. Ensures that suppliers meet company quality specifications.
232.07 957.36 .57 .94
sqm3. Conducts suppliers’ quality audits.
232.49 949.29 .51 .94
Education and training
et1. Learning environment
232.22 950.26 .66 .94 .90 5
et2. Continuous professional development
232.17 949.76 .63 .94
et3. Training and development center(s).
232.35 944.60 .64 .94
et4. Benefits for professional development
232.54 943.56 .61 .94
et5. Professional development for promotion
232.36 944.00 .70 .94

Raza, Naqvi & Gill 77
Work environm
ent and culture
wec1. Pleasant environment
232.39 948.01 .65 .94 .885 9
wec2. Positive values 232.20 951.86 .61 .94 wec3. Encouraging teamwork
232.13 948.69 .69 .94
wec4. Employees share problems
232.20 951.71 .60 .94
wec5. Employees’ welfare schemes
232.56 942.01 .63 .94
wec6. Owning the employees
232.24 957.35 .54 .94
wec7. Timely promotions of employees
232.52 950.49 .56 .94
wec8. Employees trust performance evaluation
232.32 945.04 .69 .94
wec9. Participative decision-making
232.35 953.20 .58 .94
Custom
er satisfaction
cs1. Customer care center(s)
232.50 941.84 .51 .94 .874 6
cs2. Assessing customers’ needs
232.13 948.26 .70 .94
cs3. Collecting complaints of customers
232.03 958.40 .51 .94
cs4. Keeping track of complaints of customers
232.26 950.84 .58 .94
cs5. Minimum possible response time
232.11 948.23 .72 .94
cs6. Stopping recurring customer complaints
232.12 946.41 .67 .94
TQM
results
r1. Customer satisfaction has shown improvements.
232.14 961.95 .55 .94 .787 4
r2. Company performance is improving.
232.10 957.68 .61 .94
r3. Employee satisfaction is increased.
232.24 955.41 .59 .94
r4. Company is growing.
232.10 959.68 .50 .94