an investigation of the effects of new bypass roads …
TRANSCRIPT

1
Journal of South Asian Logistics and Transport Volume 1 Issue 1 March 2021
JSALT 1.1.1: pp. 1-31
AN INVESTIGATION OF THE EFFECTS OF NEW BYPASS
ROADS ON BUILD FORM IN SMALL TOWNS IN SRI LANKA
S Sewwandi a and A Jayasinghe b*
a Research Assistant, Urban Simulation Lab, Department of Town & Country
Planning, University of Moratuwa, Moratuwa, Sri Lanka.
b Senior Lecturer, Department of Town & Country Planning, University of
Moratuwa, Moratuwa, Sri Lanka.
* Corresponding author E-mail address: [email protected]
ABSTRACT
This study explores the effects of bypass roads on the build form of small towns in Sri
Lanka. The small towns analysed are Avissawella, Mawanella, Balangoda and
Piliyandala.
The results of the study indicate three impact scenarios: i) the bypass road has more
accessibility than the existing main road and new land uses, and high-density areas
emerge along the by-pass road, making this the town centre; ii) both bypass road and
the existing main road show similar levels of accessibility and attractiveness. iii)
accessibility of the existing main road remains higher than the bypass road and very
new developments are attracted towards the bypass road - thus the existing main road
remains the main centre of the town. The results confirm that spatial and economic
forces are closely interrelated as indicated in the theory of the natural movement
economic process. However, the study found that the above forces are constrained by
natural barriers.
These findings are useful for transport engineers when making new strategies to
implement bypass roads and to urban planners to develop local development plans
after constructing bypass roads.
Keywords: Bypass road, Accessibility, Network centrality, Land use changes,
Transport planning

JSALT Volume 1 Issue 1, March 2021
2
1. INTRODUCTION
Economic and urban developments that grow along major arterial roads are the most
common spatial characteristics of small and medium sized towns in Sri Lanka [1].
These create a number of problems such as traffic congestion, safety, noise and air
pollution etc [2]. Bypass roads have been introduced to overcome these problems. A
bypass road is one that avoids an existing high-density built-up area in a city or town,
allowing traffic to flow without interference from local traffic in that area: typically,
a city- or town centre. A bypass road also replaces the main transport route outside
the town or city. The main objectives of bypass roads are to reduce the traffic
congestion of the town centre while improving mobility. The bypass construction
usually focuses on redirecting vehicles that travel through the existing high-density
built-up areas in cities and towns with no intention of engaging in activities such as
shopping. This improves overall travel time and mobility, reducing the adverse
impacts of traffic congestion. A bypass road can dramatically change land use and
growth patterns in small and medium sized towns. It also has the potential to
positively or adversely affect the physical and socio-economic setting of those towns
[3]. Therefore, transport and urban planning agencies have the responsibility to
identify and demonstrate the potential physical and socio-economic impacts before
constructing a new bypass road development project. However, a limited number of
studies have been carried out in Sri Lanka to study the impact of bypass roads in
towns when the main transport route is replaced by another thoroughfare outside the
town. In this context, the present study explores the effects of a bypass road on build
form of a town and investigates the changes in land use and building density that
accompany changes in accessibility. This study also analyses the before and after
situations for bypass roads in four small towns in Sri Lanka: namely, Avissawella,
Mawanella, Balangoda and Piliyandala.
There are few research studies which have investigated the impact of a newly
introduced bypass road on land use and build densities in cities. For example, in 1995
Falleth et. al [4] conducted a research on how new bypass roads affect the land use of
towns in Norway. The authors observed that new economic activities shifted towards
the junctions where bypass roads touch existing settlements. Van Nes et. al [5]
investigated how inner and outer ring roads affect the location pattern of shops. The
results of that study show “shops located themselves along the highest integrated
[highest accessible] street”. Van Ness and Stolk [6] analysed two road proposals for
the Dutch city Leiden. Both cases show that new roads integration [accessibility]
values surpass the existing city centres integration [accessibility] values after
constructing bypass roads and new investments begin to emerge in these areas.
Sander, et. al [2] and Jayasinghe et. al [7] claim that integration [accessibility] is the
major factor affecting new attractions, investments and urbanization. Results of those
studies indicate that a new bypass road changes the integration value [accessibility]

An Investigation of the Effects of New Bypass Roads on Build Form
in Small Towns in Sri Lanka
3
of the road network and will affect the location pattern of shops [land use and built
density]. The results of these studies are consistent with the theory of the movement
economy. The theory, “built on the notion of natural movement, proposes that
evolving space organization in settlements first generates the distribution pattern of
busier and quieter movement pattern flows, which then influence land use choices,
and these in turn generate multiplier effects on movement with further feedback on
land use choices and the local grid as it adapts itself to more intensive development”
[8]. Munasinghe [1] has demonstrated that most of the urban areas in Sri Lanka have
grown spontaneously as the result of a self-organizing process: this relates to the
theory of the natural movement process. He notes that when a new road is
constructed, it creates land-use changes and activities due to new levels of
accessibility. However, he argues that the process of self-organising is disturbed due
to growing social, economic and environmental issues. Perera [9] has demonstrated
that powerful companies, institutions, and individuals also create a physical and
political space based on income and social and political power. These theories and
ideologies argue that the movement economy can be disturbed due to the above
factors. Against this background, this study explores the effects of bypass roads on
build form of the town and the factors that influence such changes.
2. METHOD OF STUDY
2.1. Case Study Areas
The selected case study areas are
Avissawella, Mawanella, Balangoda
and Piliyandala. Of these, Avissawella
and Piliyandala are located in the
Western Province and the Mawanella
and Balangoda bypass roads are located
in the Sabaragamuwa Province of Sri
Lanka.
Table 1 below provides a brief
description of these areas. secondary
data and the year that the bypass road
has been implemented are key factors
considered in selecting these case study
areas. The data collected is related to
road network, land use and buildings,
considering different time periods ie,
before and after the bypass road
implementation.
Figure 1: Location of case study areas
Source: Compiled by Author

JSALT Volume 1 Issue 1, March 2021
4
Table 1: Selected four case study area and its characteristics.
Source: Compiled by author
2.2. Data
Table -A1 and Table-A2 appended provide brief description about the data used in
this analysis. (Refer Appendices).
2.3. Data Preparation and Analysis
The primary and secondary data were entered and stored in a Geographic Information
System (GIS). Then, the study analysed the temporal changes utilising spatial
analysis tools in the GIS environment; and utilised three parameters of land use
intensity, building density and accessibility to capture temporal changes in selected
case town areas. The following section explains three parameters in detail.
2.3.1. Land-use intensity
The study utilised the category level land-use intensity analysis to capture
temporal changes. Category level land-use intensity analysis captures the “intensity
change of each land category within a particular time interval” [10]. The study utilised
the following equations (Eq 1 & Eq 2) to compute land use grain intensity (Gtj) and
annual loss intensity (Lti). Figure -A1 under appendices illustrates the steps that
follow to compute temporal changes in land use intensity. (Refer appendices)
Gtj =[(∑ 𝐂𝐭𝐢𝐣
𝐣𝐢=𝟏 )− 𝐂𝐭𝐣𝐣]/(𝐘𝐭+𝟏− 𝐘𝐭)
∑ 𝐂𝐭𝐢𝐣𝐣𝐢=𝟏
∗ 100% ………………...(1)
𝐿𝑡𝑖 =[(∑ Ctij
jj=1 ) − Ctii] /(Yt+1 − Yt)
∑ Ctijjj=1
∗ 100% … … … (2)
Where,
i = index for a category at the interval’s initial time point
j = index for a category at the interval’s final time point
t = index for a time point,
Case study
area
Extent
Km2
Population
(2012)
Year of bypass road
implemented
Use before bypass
road implemented
Avissawella 19.7 30,308 1991 Railway line
Mawanella 5.43 8,993 2000 Vegetation cover
Balangoda 26.5 16,510 2006 Vegetation cover
Piliyandala 35.28 185,22 2014 Paddy land
An Investigation of the Effects of New Bypass Roads on Build Form
in Small Towns in Sri Lanka
5
Ctij= numbers that transit from category i at time Yt to category j at time Yt +1
Gtj = annual intensity of gross gain of category j for time interval
Lti = annual intensity of gross loss of category i for time interval
2.3.2 Building density
There are several methods to measure building density such as the Floor Area
Ratio (FAR), Plot coverage and Building block coverage [11]. Of these, Floor Area
Ratio (FAR) and plot coverage methods were used to compute building density. The
study utilised space matrix to capture temporal changes in building density. Space
metrics explains density as a multi-variable phenomenon and relates density to build
mass (urban form). The Space Matrix method helped to clarify the confusion in terms
used by urban planners who work with urban density. The most important
contribution of the space matrix method, apart from a clear definition of density, is
that it relates density to urban shape and other events [12]. Figure-A2 under
appendices illustrates the steps followed to compute temporal changes in building
density. (Refer appendices)
𝐹𝐴𝑅 =𝐹𝑙𝑜𝑜𝑟 𝑎𝑟𝑒𝑎 (𝑏𝑢𝑖𝑙𝑑𝑖𝑛𝑔 𝑓𝑜𝑜𝑡𝑎𝑔𝑒)
𝐿𝑜𝑡 𝑎𝑟𝑒𝑎(𝑙𝑎𝑛𝑑 𝑎𝑟𝑒𝑎)*100 ………. (3)
𝑃𝑙𝑜𝑡 𝑐𝑜𝑣𝑒𝑟𝑎𝑔𝑒 =𝐵𝑢𝑖𝑙𝑑𝑖𝑛𝑔 𝑎𝑟𝑒𝑎
𝑆𝑖𝑡𝑒 𝑎𝑟𝑒𝑎∗ 100 …………..(4)
2.3.3 Accessibility
In this step, accessibility was analysed using the network centrality assessment
(NCA) [13] approach. The study computes the level of accessibility based on
closeness and betweenness centrality parameters. Closeness centrality (CC) explains,
“the notion of accessibility of a road segment measures how close the road segment
is to all others road segments in the network along the shortest path” [14], [15], [16].
Betweenness captures (BC) “a special property in a particular road segment that does
not act as either origin or destination but as a pass-by location… which is the number
of shortest paths between two nodes that contain the given node” [14], [15]. CC
captures the volume of trip attraction to a given road segment due to accessibility and
BC captures the volume of pass-by trips which bypass the given road segment due to
the intermediacy [13]. “BC performs a key role in explaining traffic volumes in
locations where there are more pass-by trips such as regional roads that connect
residential townships to a major city. CC is the key to explain the variations in traffic
volumes at trip-generation locations such as shopping districts [13].The study utilized
the Spatial Design Network Analysis (SDNA) tool [17] in Geography Information
System (GIS) environment to compute BC and CC. The tool requires a ‘network
graph’ file as the input and ‘analysis option’ to compute BC and CC [18]. This study
utilizes the ‘road-segments’ graph method [19], [20] and the ‘angular analysis’ option

JSALT Volume 1 Issue 1, March 2021
6
to compute the shortest-path. Furthermore, the study considered two radiuses of a
node to the network influence area as 500m and 10km to capture the attraction of
pedestrian movement and the attraction of vehicle movement respectively. Figure-A3
under appendices illustrates the steps that follow to compute temporal changes in BC
and CC. (Refer appendices)
𝐶𝐶𝑟(i) = 1
∑ d𝑖𝑗 j≠i ……………….(5)
𝐵𝐶𝑟(i) = ∑p𝑗𝑘(𝑖)
p𝑗𝑘 j≠i≠k
… … … … . (6)
Where:
𝐶𝐶𝑟(i)= Closeness centrality of road segment ‘i’ within the search radius r,
𝐵𝐶𝑟(i)= Betweenness centrality of road segment ‘i’ within the search radius r,
N = Total number of road segments [i.e. nodes in dual graph] in the network,
d𝑖𝑗 = Distance between road segments ‘i’ and ‘j’ along the shortest path,
p𝑗𝑘(𝑖) = Number of geodesics [shortest paths] between road segments ‘j’ and
‘k ’that passing through road segment ‘i’,
𝑝𝑗𝑘= Number of geodesics [shortest paths] between segments ‘j’ and ‘k’
3. ANALYSIS AND FINDINGS
The study analysed the temporal changes in selected case study areas utilizing three
parameters as land use intensity, building density and accessibility to capture the
impact of bypass roads. Accordingly, the following sections explain the key findings
of each case study area.
3.1.1 Avissawella
Avissawella is a small town (population =30,308) situated on the A4 route
from Colombo to Rathnapura. The bypass road in Avissawella was constructed in the
year 1991. Figures 2,3 and 4 illustrate the variations of accessibility in the road
network of Avissawella town over four different time periods ie., 1989, 1992, 2007,
2019. The level of accessibility is computed based on closeness (CC) and
betweenness (BC) centrality parameters. BC-n values of the road network has been
dramatically changing over the last two decades after the construction of the bypass
road. As depicted in Figure 2, the prominence of the main road has been reduced
while the bypass road has attracted higher BC values. It indicates that the bypass road
has more potential to capture pass by trips than the existing road. As depicted in
Figure 3, CC-500m values have gradually increased in both roads over the last two
decades.

An Investigation of the Effects of New Bypass Roads on Build Form
in Small Towns in Sri Lanka
7
Figure: 2: Variation of betweenness values in road network of Avissawella
town before and after bypass road construction.
Figure 3: Variation of Closeness-500m values in road network of Avissawella
town before and after bypass road construction.
[Grab your reader’s attention
with a great quote from the
document or use this space to
emphasize a key point. To
place this text box anywhere on
the page, just drag it.]

JSALT Volume 1 Issue 1, March 2021
8
However, the existing road records a higher CC-500m value compared to the
bypass road. Furthermore, there are very few connections between the bypass road
and the existing road. It indicates that the bypass road has less potential to attract
pedestrian movement, compared to the existing road.
As depicted in Figure 4, CC-n values have been very much similar in both
roads over last two decades. It indicates that both roads have a similar level of
potential to attract vehicle movements. (In the reference map series, changes in value
of BC and CC are visible through the six colour ranges in the maps. The highest BC
and CC values are shown in red and the lowest values are shown in blue. Accordingly,
the use of colour range (Red to Blue) or values mention in legend help to identify BC
and CC changes along the bypass and the existing road.)
Figure 4: Variation of Closeness-n values in road network of Avissawella town
before and after bypass road construction.
Figure 5 depicts the changes in building density in Avissawella from 1989 to
2019 with floor area ratio maps. With the construction of the new bypass road, new
buildings have gradually appeared along new bypass road. However, building density
along the existing main road (FAR = 2) remain higher than the building density along
the bypass road (FAR = 1).

An Investigation of the Effects of New Bypass Roads on Build Form
in Small Towns in Sri Lanka
9
Figure 5: Variation of FAR values in building density of Avissawella town
before and after bypass road construction
A B
C D
A B
C D
A B
C D
Bypass
Road
Existing
Main
Road
Existin
g Main
Road
Bypass
Road
Bypass
Road
Existin
g Main
Road
A B
C D
Existing
Main
Road

JSALT Volume 1 Issue 1, March 2021
10
Figure 6: Variation of land use intensity values in land use of
Avissawella town before and after bypass road construction.
2007
2007
Existing
Main
Road Bypass
Road
Existing
Main
Road
Bypass
Road
Existing
Main
Road
Bypass
Road
Existing
Main
Road

An Investigation of the Effects of New Bypass Roads on Build Form
in Small Towns in Sri Lanka
11
Figure 6 above depicts the results of the land use intensity analysis. As per
the results, there was significant growth in commercial land uses along the existing
road during the period of 1989 to 1992 (after bypass roads). Further, many residential
land uses have been converted into commercial sectors along the existing road. In the
early stages (1992-2007) the bypass road was able to attract residential land uses and
gradually the bypass road was also able to attract commercial land use during the
period of 2007 – 2019.
Table 2 : Summary of changes in Avissawella town area.
Parameters Existing/
Bypass
Years
1989 1992 2007 2019
Building density Existing 1.2 1.2 1.2 2
Bypass - 0.42 1 1
Betweenness Existing 1699 20187 3246 3495
Bypass - 244 7296.5 7935
Closeness_500m Existing 0.0182 0.0507 0.025 0.091
Bypass - 0.005 0.0195 0.0485
Closeness Existing 0.107 0.194 0.314 0.35
Bypass - 0.1295 0.359 0.3686
Land use type Existing 2 1 1 1
Bypass - 3 3 2
Land use mix Existing - 1= (+0.5)
2= (+0.4)
3= (0.15)
4= (+0.4)
5=(+0.05)
1= (+3)
2= (+1), (-0.9)
3= (-0.85)
1= (+6.5)
2= (+6), (-2)
3= (-6.2)
5= (+1)
Bypass - - 1= (+0.5)
2= (+0.7),(-1.3)
3= (-1.8)
1= (+3)
2= (+3.5), (-2)
3= (-4)
*1= Commercial, 2= Residential, 3= Vegetation, 4=Institution, 5= Transportation
*+ = Grain intensity, - = Loss intensity
The changes in the Avissawella case study area due to the bypass road can
be summarised as follows: With higher BC values, the bypass road was able to attract
more pass-by trips than the existing road. The analysis of result of the previous

JSALT Volume 1 Issue 1, March 2021
12
section indicates that the accessibility (CC values) had increased in both roads.
Accordingly, land use along both roads have gradually changed. However, the bypass
road was unable to attract commercial land uses and high density, when compared to
the existing road. Furthermore, the existing main road remains as the centre of the
town. Avissawella town centre is located below 35 m elevation MSL, but the bypass
road elevation is more than 50 m. Besides, there is a mountain along the bypass road
(refer Figure 7), that restricts the space to grow and acts as a barrier to attract new
activities along the bypass road. The case study results indicate that the natural
movement of economic process is disturbed due to lack of space. Table 3 show
existing traffic flow data on both existing and bypass roads and it confirms that the
bypass road has a high level of service relative to the existing road.
3.1.2 Mawanella
Mawanella is a small town (population = 111,727) situated on the A1 route
from Colombo to Kandy. The bypass road in Mawanella was constructed in year
2000. Figures 8,9 and 10 illustrate the variations of accessibility in the road network
of Mawanella town over three different time periods (1999, 2010, 2019). BC-n values
of the road network has been dramatically changing over the last two decades after
the construction of the bypass road. As depicted in Figure 8, the prominence of the
main road has been reduced while the bypass road has attracted higher BC values.
This indicates that the bypass road has more potential to capture pass by trips than
the existing road. As depicted in Figure 9, CC-500m values have gradually increased
in both roads over the last two decades. However, the bypass road records a higher
CC-500m value when compared with the existing road. Furthermore, there are good
connections between the bypass road and the existing road. This indicates that the
bypass road has a high potential of attracting pedestrian movement.
Figure 7: Elevation of the Avissawella
case study area
Table 3: Existing Level of
service in bypass road and
existing road in Avissawella case
study area
Level of Service-Avissawella :
2019
Bypass Road Existing Road
A (0.30) B (0.47)
Source: Compiled by author

An Investigation of the Effects of New Bypass Roads on Build Form
in Small Towns in Sri Lanka
13
Figure 8: Variation of betweenness values in road network of Mawanella town
before and after bypass road construction
Figure 9: Variation of Closeness 500m values in road network of Mawanella
town before and after bypass road construction

JSALT Volume 1 Issue 1, March 2021
14
Figure 10 below presents the variation of Closeness-n values in road
network of Mawanella town before and after the construction of the bypass road.
Figure: 10 Variation of Closeness-n values in road network of Mawanella town
before and after bypass road construction.
As depicted in Figure 10, the CC-n values for both roads have increased
gradually over the last two decades. However, the bypass road records a higher CC-
n value when compared to the existing road. It indicates that the existing road has less
potential to attract O-D trips, compared to the bypass road.
In the reference map series, changes of BC and CC are visible through the
six colour ranges in the maps. The highest BC and CC values are shown in red and
the lowest values are shown in blue. Accordingly, the use of colour range (red to blue)
or values mentioned in legend help to identify BC and CC changes along the bypass
and the existing road.
Figure 11 depicts the changes in building density in Mawanella from 1999 to
2019 with floor area ratio maps. New buildings have gradually appeared along with
the construction of the new bypass road. However, building density along the bypass
road (FAR = 0.8) remains higher than the building density along the existing road
(FAR = 0.72).

An Investigation of the Effects of New Bypass Roads on Build Form
in Small Towns in Sri Lanka
15
Figure 11: Variation of FAR values in building density of Mawanella town
before and after bypass road construction
Figure 12: Variation of land use intensity values in land use of Mawanella town
before and after bypass road construction

JSALT Volume 1 Issue 1, March 2021
16
Figure 12 depicts the results of the land use intensity analysis. As per the
results, there was slow growth in commercial land use along the existing road during
the period of 1999 to 2010 (after bypass roads). In early stages (1999-2010), the
bypass road was able to attract residential land uses and gradually the bypass road
was also able to attract a fast growth of commercial enterprises during the period of
2010 – 2019.
Table 4: Summary of changes in Mawanella town area
Parameters Existing/
Bypass
Years
1999 2010 2019
Building density Existing 0.583 0.52 0.72
Bypass - 0.63 0.8
Betweenness n Existing 69183 11305 10505
Bypass - 10517 13491
Closeness 500m Existing 0.1228 0.0267 0.0746
Bypass - 0.0345 0.0913
closeness n Existing 0.24 0.314 0.365
Bypass - 0.314 0.4135
Land use type Existing 1 1 1
Bypass
2 1
Land use mix Existing
- 1= (+2.4), (-0.3)
2= (+1.8)
3= (-1.7)
5= (+0.4)
1= (+1.8)
2= (+1.5), (-1)
3= (-1.8)
Bypass - 1= (+0.6)
2= (+1.5)
3= (-1.7)
1= (+2.5)
2= (+0.8), (-0.9)
3= (-2.5)
*1= Commercial,2= Residential, 3= Vegetation, 4=Institution, 5= Transportation
*+ = Grain intensity, - = Loss intensity
The changes in the Mawanella case study area due to the bypass road can be
summarised as follows: with higher BC values, the bypass road was able to attract
more pass-by trips than the existing road. The analysis of the previous section
indicates that the accessibility (CC values) has increased in both roads. Accordingly,
land use along both roads has gradually changed. However, the bypass road was able
to attract commercial land use and high density, compared to the existing road.
Furthermore, the bypass road was converted into the main centre of the town. The
Mawanella town centre is located below 215 m elevation and the bypass road
elevation does not exceed 215 m. There is vegetation along the bypass road (refer
Figure 13).

An Investigation of the Effects of New Bypass Roads on Build Form
in Small Towns in Sri Lanka
17
Due to this, there is enough space to grow along the bypass road a factor that
attracts new activities. Moreover, the location of the Old brick bridge and Maha Oya
create a barrier to expand activities along the existing road and it helps to attract new
investment to the bypass road. The case study results indicate that natural movement
economic process has taken place owing to the available space for growth along the
bypass road. Table 5 show existing traffic flow data on both of existing and bypass
roads and it obviously confirmations both of bypass road and existing road have low
level of service and not achieved the aim of the bypass road construction.
3.1.3 Balangoda
Balangoda is a small town (population = 81,563) situated on the A4 route
from Colombo to Batticaloa. The bypass road in Balangoda was constructed in 2006.
Figures 14,15 and 16 illustrate the variations of accessibility in road network of
Avissawella town over three different time periods: 2004, 2010, 2019. The level of
accessibility is computed based on closeness (CC) and betweenness (BC) centrality
parameters. BC-n values of the road network has been dramatically changing over
the last decade after the construction of the bypass road. As depicted in Figure 14, the
main road has been attracting higher BC values than the bypass road. It indicates that
the existing road has more potential to capture pass by trips than the bypass road. As
depicted in Figure 15, CC-500m values have gradually increased and the CC-500m
values have been quite similar in both roads over the last decade. It indicates that,
both roads have a similar level of potential to attract vehicle movements.
Furthermore, there are very few connections between the bypass road and the existing
road. It indicates that the bypass road has less potential to attract pedestrian movement
compared to the existing road.
Figure 13: Elevation of the Mawanella
case study area
Table 5: Existing Level of
service in both bypass road
and existing road in
Mawanella case study area
Level of Service-
Mawanella : 2019
Bypass
Road
Existing
Road
E (1.03) C (0.75)
Source: Compiled by author

JSALT Volume 1 Issue 1, March 2021
18
Figure 14: Variation of betweenness values in road network of Balangoda town
before and after bypass road construction
Figure 15: Variation of closeness-500m values in road network of Balangoda
town before and after bypass road construction.

An Investigation of the Effects of New Bypass Roads on Build Form
in Small Towns in Sri Lanka
19
Figure 16: Variation of closeness-n values in road network of Balangoda town
before and after bypass road construction.
As depicted in Figure 16, CC-n values have gradually increased in both roads
over the last decade. However, the bypass road records a higher CC-n value
compared to the existing road, it indicating that the existing road has less potential to
attract O-D trips movements comparatively. (In the reference map series, changes in
value of BC and CC are visible through the six colour ranges in the maps. The highest
BC and CC values are shown in red and the lowest values are shown in blue.
Accordingly, the use of colour range (red to blue) or values mentioned in legend help
to identify BC and CC changes along the bypass and the existing road.)
Figure 17 depicts the changes in building density in Balangoda from 2005 to
2019 with floor area ratio maps. New buildings have gradually appeared, with the
construction of the new bypass road. However, building density along the existing
main road (FAR = 1) remain higher than the building density along the bypass road
(FAR = 0.83). Figure 18 depicts the results of land use intensity analysis. As per the
results, there was significant growth in commercial land use along the existing road
during the period of 2005 to 2011 (after bypass roads). Moreover, many residential
land uses have been converted into commercial operations along the existing road.
Gradually, the bypass road was also able to attract residential land use during the
period 2011 – 2019.

JSALT Volume 1 Issue 1, March 2021
20
Figure 17: Variation of FAR values in building density of Balangoda town before
and after bypass road construction
Figure 18: Variation of land use intensity values in land use of Balangoda town
before and after bypass road construction.

An Investigation of the Effects of New Bypass Roads on Build Form
in Small Towns in Sri Lanka
21
Table 6: Summary of changes in Balangoda town area.
Parameters Existing/
Bypass
Years
2005 2011 2019
Building density Existing 1.3 1.36 1
Bypass - 0.73 0.83
Betweenness n Existing 10.56 894 1428
Bypass - 658 1157
Closeness 500m Existing 0.0182 0.0571 0.064
Bypass - 0.0905 0.064
closeness n Existing 0.123 0.159 0.132
Bypass - 0.154 0.184
Land use type Existing 1 1 1
Bypass - 3 2
Land use mix
Existing -
1= (+0.7), (-0.2)
3= (-1.2)
4= (+0.5)
1= (+0.4)
2= (+0.7), (-0.5)
3= (-0.8)
Bypass - 1= (+0.2)
3= (-0.4)
1= (+0.1)
2= (+0.1)
3= (-0.4)
4= (+0.05)
*1= Commercial,2= Residential, 3= Vegetation, 4=Institution, 5= Transportation
*+ = Grain intensity, - = Loss intensity
The changes of the Balangoda case study area due to the bypass road can be
summarised as follows: With higher BC values, the existing road has been able to
attract more pass by trips than the bypass road. The analysis result of the previous
section indicates that the CC-500m values have increased in both roads, but the
bypass road records a higher CC-n value when compared to the existing road.
Accordingly, land use along both roads have changed gradually. However, the bypass
road has been unable to attract commercial land uses and high density compared to
the existing road. Furthermore, the existing main road remains as the main centre of
the town. The Balangoda town centre is located below 350 m elevation, and close to
the bypass road, the elevation goes up to more than 560 m. There is a mountain along
the bypass road (refer Figure. 19). Dorawale Oya flows near the bypass road and there
is a playground and a Pola area to the left side of this road. These factors obstruct the
space to grow and act as a barrier to attract new activities along the bypass road. The
case study results indicate that natural movement economic process is disturbed due
to lack of space for growth along the bypass road. Table 7 show existing traffic flow
data on both of existing and bypass roads and it confirms that the bypass road has a
high level of service relative to the existing road.

JSALT Volume 1 Issue 1, March 2021
22
3.1.4 Piliyandala
Piliyandala is a small town (population = 185,22) situated on the B84 route
from Colombo to Horana. The bypass road in Piliyandala was constructed in the year
2014. Figures 20, 21 and 22 illustrate the variations of accessibility in the road
network of Piliyandala town in 2011 and 2019. The level of accessibility is computed
based on the closeness (CC) and betweenness (BC) centrality parameters. BC-n
values of the road network has been dramatically changing over the last five years
after the construction of the bypass road. As depicted in Figure 20, the prominence
of the main road has reduced while the bypass road attracts higher BC values. It
indicates that the bypass road has more potential to capture pass-by trips than the
existing road.
Figure 20: Variation of betweenness values in road network of Piliyandala
town before and after bypass road construction
Figure 19: Elevation of the
Balangoda case study area.
Table 7: Existing Level of
service in both bypass road
and existing road in
Balangoda case study area
Level of Service - Balangoda:
2019
Bypass
Road
Existing Road
E (0.11) C (0.46)
Source: Compiled by author

An Investigation of the Effects of New Bypass Roads on Build Form
in Small Towns in Sri Lanka
23
Figure 21: Variation of closeness-500m values in road network of Piliyandala
town before and after bypass road construction.
As depicted in Figure 21, CC-500m values have increased in existing roads
and the CC-n values have been quite similar in both roads over the last seven years.
It indicates that both roads have a similar level of potential to attract vehicle
movements. (in the reference map series, changes in value of BC and CC are visible
through the six colour ranges in the maps. The highest BC and CC values are shown
in red and the lowest values are shown in blue. Accordingly, the use of colour range
(red to blue) or values mentioned in legend help to identify BC and CC changes along
the bypass and the existing road.)
Figure 22: Variation of closeness-n values in road network of Piliyandala town
before and after bypass road construction
Figure 23 depicts the changes in building density in Piliyandala from 2011 to
2019 with floor area ratio maps. New buildings have gradually appeared on the
bypass road with the construction of the new bypass road. However, building density
along the existing main road (FAR = 2) remains higher than the building density along
the bypass road (FAR = 0.6).

JSALT Volume 1 Issue 1, March 2021
24
Figure 23: Variation of FAR values in building density of Piliyandala town
before and after bypass road construction.
Figure 24 depicts the results of the land use intensity analysis. As per the
results, there has been significant growth in commercial land uses along the existing
road after the bypass road implementation (2019). Furthermore, many residential land
uses have been converted into commercial activities along the existing road.
However, there has not been a significant growth of varying types of land uses along
the bypass road after the bypass implementation.
Figure 24: Variation of land use intensity values in land use of Piliyandala
town before and after bypass road construction.

An Investigation of the Effects of New Bypass Roads on Build Form
in Small Towns in Sri Lanka
25
Table 8 summarised the above mentioned changes in Piliyandala town area.
Parameters Years
2005 2019
Building density Existing 2 2
Bypass - 0.6
Betweenness n Existing 81117 66775
Bypass - 83644
Closeness 500m Existing 0.0598 0.0656
Bypass - 0.0543
closeness n Existing 0.68 1.2
Bypass - 1.2
Land use type Existing 2 1
Bypass - 3
Land use mix
Existing -
1= (+1.5)
2= (+0.01), (-2)
3= (-0.2)
Bypass -
1= (+0.01)
2= (+0.25), (-0.0)
3= (-0.012)
*1= Commercial, 2= Residential, 3= Vegetation, 4=Institution, 5= Transportation
*+ = Grain intensity, - = Loss intensity
The changes of the Piliyandala case study area due to the bypass road can be
summarised as follows: With higher BC values the bypass road has been able to
attract more pass-by trips than the existing road. The analysis of the previous section
indicates that the CC-n values have increased in both roads, but higher CC-500m
values have increased in the existing road than the bypass road. Accordingly, land
use along both roads has altered gradually. However, the bypass road has been unable
to attract significant land uses and high density, when compared with the existing
road. Furthermore, the existing main road remains the main centre of the town.
According to rules and regulation introduced, no building can be constructed within
15 m along the Piliyandala bypass road or get direct access from the bypass road to
buildings or street vendors’ activities etc. The abandoned paddy land along the bypass
road has been identified as a wetland protection zone, resulting in lack of space to
grow along the bypass road. This acts as a barrier to attract new activities. The case
study results indicate that natural movement economic process is disturbed owing to
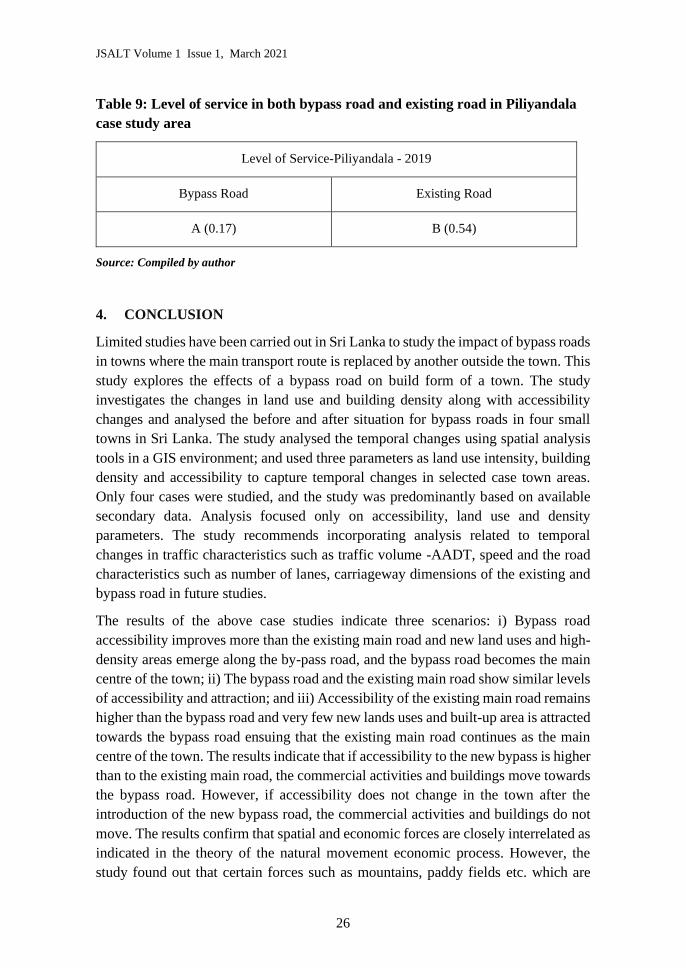
the lack of space for growth along the bypass road. Table 9 shows existing traffic
flow data on both of existing and bypass roads. It confirms that the bypass road has a
high and good level of service relative to the existing road.
JSALT Volume 1 Issue 1, March 2021
26
Table 9: Level of service in both bypass road and existing road in Piliyandala
case study area
Level of Service-Piliyandala - 2019
Bypass Road Existing Road
A (0.17) B (0.54)
Source: Compiled by author
4. CONCLUSION
Limited studies have been carried out in Sri Lanka to study the impact of bypass roads
in towns where the main transport route is replaced by another outside the town. This
study explores the effects of a bypass road on build form of a town. The study
investigates the changes in land use and building density along with accessibility
changes and analysed the before and after situation for bypass roads in four small
towns in Sri Lanka. The study analysed the temporal changes using spatial analysis
tools in a GIS environment; and used three parameters as land use intensity, building
density and accessibility to capture temporal changes in selected case town areas.
Only four cases were studied, and the study was predominantly based on available
secondary data. Analysis focused only on accessibility, land use and density
parameters. The study recommends incorporating analysis related to temporal
changes in traffic characteristics such as traffic volume -AADT, speed and the road
characteristics such as number of lanes, carriageway dimensions of the existing and
bypass road in future studies.
The results of the above case studies indicate three scenarios: i) Bypass road
accessibility improves more than the existing main road and new land uses and high-
density areas emerge along the by-pass road, and the bypass road becomes the main
centre of the town; ii) The bypass road and the existing main road show similar levels
of accessibility and attraction; and iii) Accessibility of the existing main road remains
higher than the bypass road and very few new lands uses and built-up area is attracted
towards the bypass road ensuing that the existing main road continues as the main
centre of the town. The results indicate that if accessibility to the new bypass is higher
than to the existing main road, the commercial activities and buildings move towards
the bypass road. However, if accessibility does not change in the town after the
introduction of the new bypass road, the commercial activities and buildings do not
move. The results confirm that spatial and economic forces are closely interrelated as
indicated in the theory of the natural movement economic process. However, the
study found out that certain forces such as mountains, paddy fields etc. which are

An Investigation of the Effects of New Bypass Roads on Build Form
in Small Towns in Sri Lanka
27
natural barriers constrain the space to grow. Accordingly, the study suggests that the
findings of this study is useful for transport engineers in making new strategies to
implement bypass roads as well as for urban planners to develop local development
plans after constructing bypass roads.
REFERENCES
[1] Munasinghe, J. (2012). Self Organization & Planning: The Case of Small
Towns in Sri Lanka, International Congress on Emerging Urban Planning
Trends in Asia. In J. Munasinghe, Transforming Asian cities (pp. 1-15).
[2] Sander, L., Karine, l., & Akkelies, V. (2019). The effects of new bypass road
on small Norwegian towns. Research gate, 1-17.
[3] Florida Department of Transportation. (2010). Impacts of Bypass Highways
on Small and Medium Size Cities in Florida:. Florida: Center for Urban
Transportation Research, University of South Florida.
[4] Falleth, E. I., Kolbton, K., & Tombre, E. (1995). Arealutvikling langs
omkjøringsveier – En undersøkelse av arealbruksendringer og fysisk
planlegging.
[5] Van Nes, A. (2002). Road building and urban change.
[6] Van Nes, A., & Stolk, E. (2012). The socioeconomic impact of various road
alternatives in town centres - The application of space syntax in road
planning in Rijnland and Tønsberg. Paper presented at the AESOP
conference.
[7] Jayasinghe, A., & Munasinghe, J. (2013\). A study of the urbanizing pattern
in Kegalle district, Sri Lanka with connectivity analysis. International
Journal, 2(1), 2305-1493.
[8] Hillier, B. (1996). Cities as movement economics. Cambridge University
Press, 41-48.
[9] Perera, N. (2015). People's space: Coping, Familiarizing, Creating (1st
edition). New York, NY: Routledge.
[10] Xiao, S., Qiaozhen, G., Xiaoxu, W., Ying, F., Tongyao, X., Chengwei, H.,
& Jinlong, Z. (2019). Intensity and Stationarity Analysis of Land Use
Change Based on CART Algorithm. 9(1), 1-12. doi:10.1038/s41598-019-
48586-3
[11] Ann, F., & Brennan, C. (2016). Revitalizing Places: Improving Housing and
Neighborhoods from Block to Metropolis. Harvard, 233-237.

JSALT Volume 1 Issue 1, March 2021
28
[12] Van Nes, A., Mashoodi, B., & pont, M. B. (2012). combination of space
syntax with spacematrix and the mixed used index:The rotterdam South test
case. Research gate, 1-30.
[13] Jayasinghe, A., Sano, K., Abenayake, C. C., & & Mahanama, P. K. (2019).
A novel approach to model traffic on road segments of large-scale urban
road networks. MethodsX, 6, 1147-1163.
[14] Porta, S., Latora, V., Wang, F., Rueda, S., Strano, E., Scellato, S., . . . Latora,
L. (2012). Street Centrality and the Location of Economic Activities in
Barcelona. Urban Studies, 49(7), 1471-1488.
[15] Jayasinghe, A., Sathsarana, H., Rathnayake, R., & Bandara, N. (2020). A
Novel Method to Model Spatial Distribution of Population. International
Journal of Innovative Technology and Exploring Engineering, 9(3S), 34-40.
[16] Sanjaya, N., A., J., & P., J. (2014). Space Syntax And Mobile GIS
Application: Investigation Of Relationship Between Human Walking
Pattern And Spatial Configuration. International Journal of Emerging
Technology & Research, 1(6), 1-7.
[17] Chiaradia, A., Cooper, C., & Webster, C. (2013). sDNA a software for
spatial design network analysis. Cardiff: Cardiff University.
[18] Tenzin, N., Jayasinghe, A., & Abenayake, C. (2019). Road Network
Centrality based Model to Simulate Population Distribution. Journal of the
Eastern Asia Society for Transportation Studies, 13, 1194-1215.
[19] Turner, A. (2001). Angular analysis. Proceedings of the 3rd international
symposium on space syntax, (p. 30).
[20] Jayasinghe, A.; Madusanka, N.B.S.; Abenayake, C.; Mahanama, P.K.S. A
Modeling Framework: To Analyze the Relationship between Accessibility,
Land Use and Densities in Urban Areas. Sustainability 2021, 13, 467

An Investigation of the Effects of New Bypass Roads on Build Form
in Small Towns in Sri Lanka
29
APPENDICES
Table - A1: Description about secondary data
Data type Year Source
Land use 1989 Newspaper
The island newspaper under the heading of Rampala regime in
the local Railway History. Newspaper:
http://www.sundayobserver.lk/2017/08/29/spectrum/lost-
glory-kv-railway-line
Old maps
Avissawella land use maps (Collected from Seethawakapura
Urban Council)
1992 Reports
Report of transport plan for Avissawella town development
project done by UDA
Old maps
Avissawella land use map (Collected from Seethawakapura
Urban Council)
2007 Google earth
2019 Google earth
Building 1989 Newspaper
The island newspaper under the heading of Rampala regime in
the local Railway History
1992 Report
Report of transport plan for Avissawella town development
project done by UDA
2007 Google Earth,
2019 Google Earth,
Road
network
2006 Newspaper
The island newspaper under the heading of Rampala regime in
the local Railway History. Newspaper:
http://www.sundayobserver.lk/2017/08/29/spectrum/lost-
glory-kv-railway-line
Old maps
Avissawella land use map (Collected from Seethawakapura
Urban Council)
Reports
Report of transport plan for Avissawella town development
project done by UDA
2010 Google Earth
2019 Google Earth
Source: Compiled by author

JSALT Volume 1 Issue 1, March 2021
30
Table- A2: Description about primary data
Data type Method of data collection Sample
Land use Field observation= Observe the case study area and take
photographs, Observe the area and mark a map including
important data.
-
Informal discussion= Specially discuss with elderly people
and urban council officers and according to the collected data
maintain a map within the field.
50
Building Field observation= Observe the case study area and take
photographs, Observe the area and mark a map including
important data
-
Informal discussion= Specially discuss with elderly people
and urban council officers and according to the collected data
maintain a map within the field.
35
Road
network
Field observation= Observe the case study area and take
photographs, Observe the area and mark a map including
important data.
-
Informal discussion= Specially discuss with elderly people
and urban council officers and according to the collected data
maintain a map within the field.
20
Source: Compiled by author
Source: Compiled by author
Figure- A1 Steps of land use intensity temporal trend changes analysis

An Investigation of the Effects of New Bypass Roads on Build Form
in Small Towns in Sri Lanka
31
Source: Compiled by author
Figure -A2: Steps of building density temporal trend changes analysis
Source: Compiled by author
Figure -A3: Steps of accessibility temporal changes analysis